Multiheight Analysis of Asymmetric Stokes Profiles in a Solar Active Region Na Deng Post-Doctoral...
10
Multiheight Analysis of Multiheight Analysis of Asymmetric Stokes Profiles Asymmetric Stokes Profiles in a Solar Active Region in a Solar Active Region Na Deng Na Deng Post-Doctoral Researcher at California State University Northridge (CSUN)
-
date post
22-Dec-2015 -
Category
Documents
-
view
215 -
download
1
Transcript of Multiheight Analysis of Asymmetric Stokes Profiles in a Solar Active Region Na Deng Post-Doctoral...

Multiheight Analysis of Multiheight Analysis of Asymmetric Stokes Profiles Asymmetric Stokes Profiles
in a Solar Active Regionin a Solar Active Region
Na DengNa Deng
Post-Doctoral Researcher at California State University Northridge (CSUN)

ObservationObservation
NSO/HAO Advanced Stokes Polarimeter (ASP)
FeI 630.15 & 630.25 Line PairPhotosphere
MgI b2 517.27 LineLow Chromosphere

FeI Continuum Image Mimic Magnetogram
Active Region NOAA 9661Active Region NOAA 9661
96612001 Oct 17NOAA 9661
Near Disc Center
Intensity + Magnetic Polarity
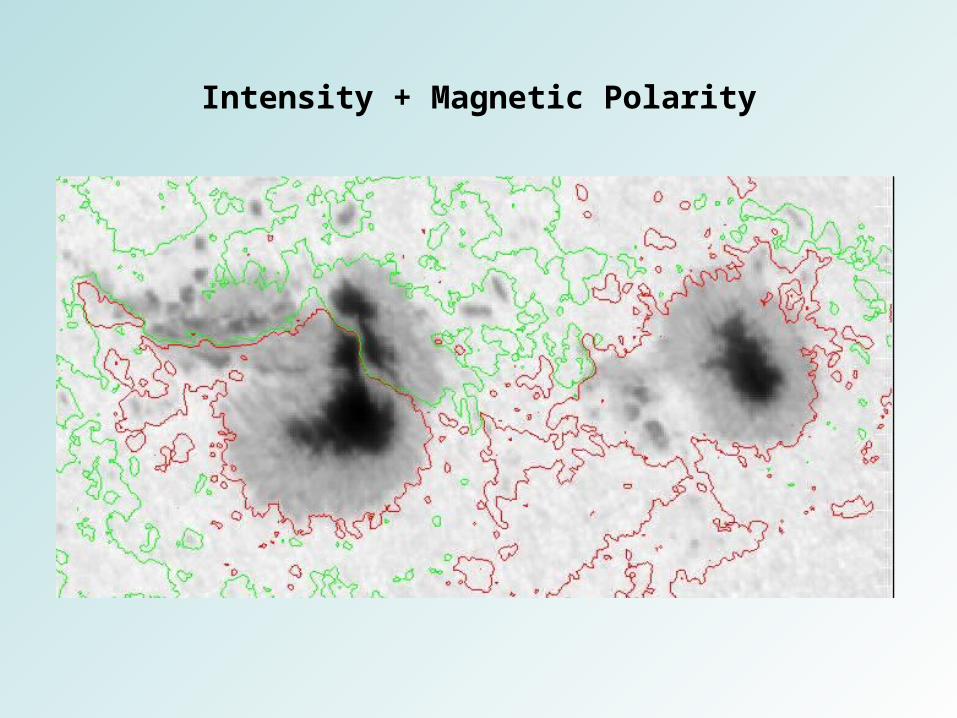
rb
rb
AA
AAAsymmetry
Stokes AsymmetriesStokes Asymmetries
Large gradient of magnetic field along LOS
Large gradient of velocity field along LOS
Inhomogeneous atmosphere that contains two or more magnetic components
Spatially unresolved flows, i.e., superposition of components with large Doppler velocity relative to
each other.
Spatially unresolved mixed polarities
Spreading of Stokes signals due to seeing and diffraction
Origin of Stokes AsymmetriesOrigin of Stokes Asymmetries

Stokes Asymmetry ImagesStokes Asymmetry Images
50 km 200 km 600 km
Photosphere Photosphere Low Chromosphere FeI 630.25 FeI 630.15 Mg b 517.27
630.25 630.15 517.27
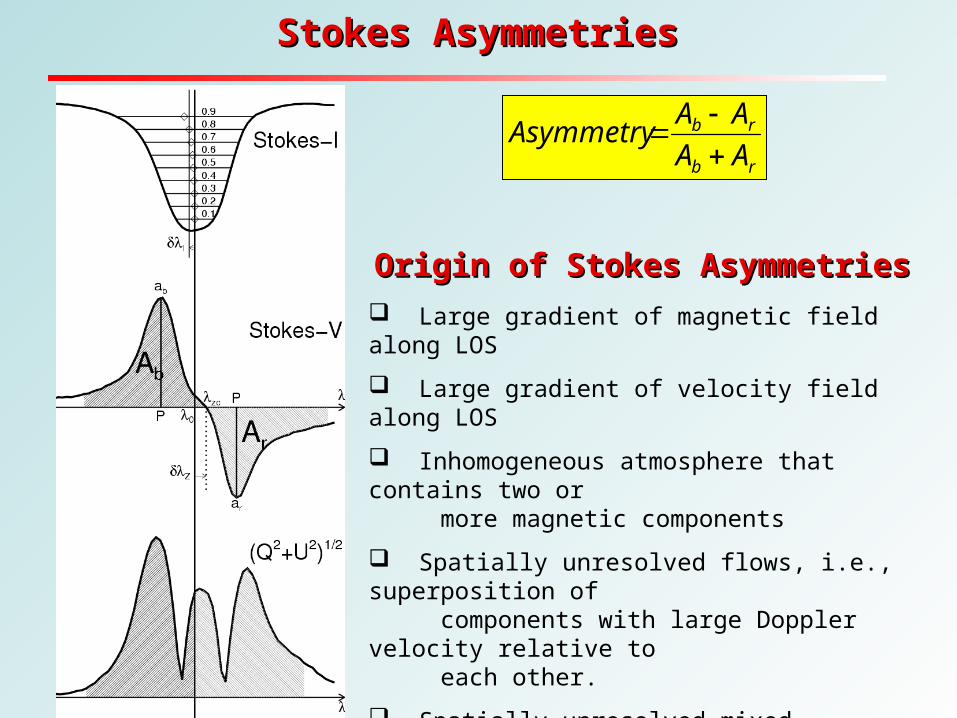
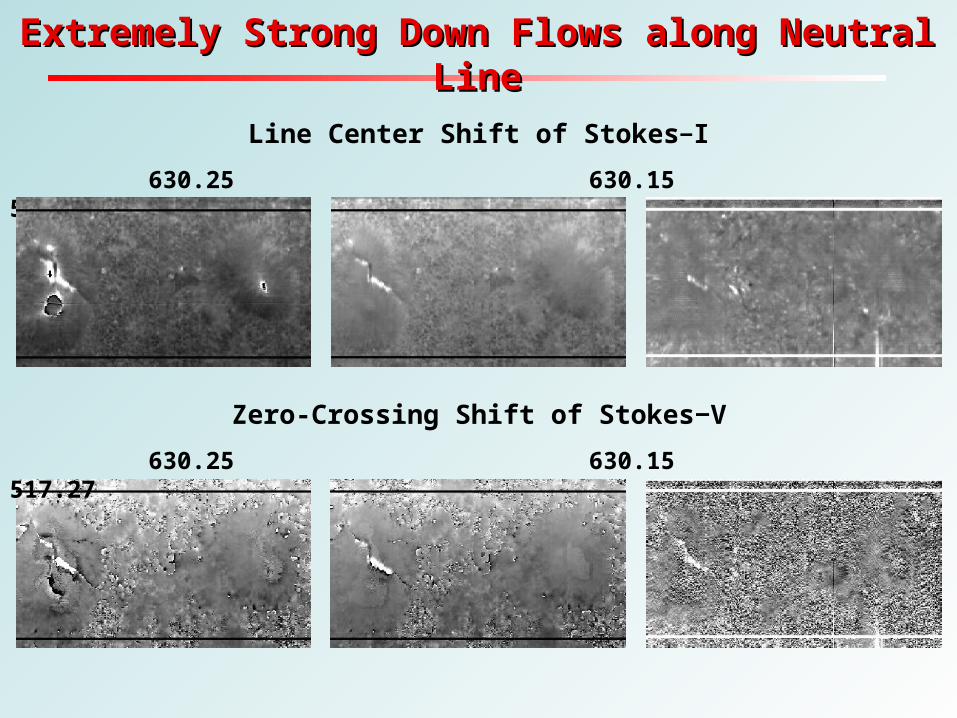
Extremely Strong Down Flows along Neutral LineExtremely Strong Down Flows along Neutral Line
Line Center Shift of Stokes‒I
630.25 630.15 517.27
Zero-Crossing Shift of Stokes‒V

Intensity Image Magnetogram
Dopplergram (Intensity) + (Dopplergram)
MDI high-resolution data reinforce ASP observations. They show at the same locations strong downflows with mean speed of 0.98 km/s and maximum speed of 1.28 km/s. While the limb side Evershed flow of the nearby alpha spot is only about 0.36 km/s.
MDI High-Resolution Data on 2001/10/17MDI High-Resolution Data on 2001/10/17

Horizontal penumbral Evershed flow channels get bended downward when they encounter strong vertical field of another umbra with opposite polarity. Therefore, horizontal Evershed flow becomes downflow at the boundary between outer penumbra of one polarity and umbra of the other polarity.
InterpretationInterpretation

Future WorkFuture Work
Collaborate with Dr. Thomas Wiegelmann to study 3D evolution of the active region associated with the flare occurred on Oct 19th. Compare the difference in the extrapolated result between different input boundary conditions: photospheric vector magnetogram and vector magnetogram in low chromosphere.
Available Data:
Vector magnetograms in both photosphere and low chromosphere
On Oct 16, 17, and 19.