Multifamily Housing in the Washington, DC...
31
Multifamily Housing in the Washington, DC Region: Demand and Supply Trends By: Kathryn Howell, PhD 2013 Kettler Scholar George Mason University School of Public Policy Center for Regional Analysis Arlington, Virginia 22201 February, 2014
Transcript of Multifamily Housing in the Washington, DC...

Multifamily Housing in the Washington, DC Region:
Demand and Supply Trends
By:
Kathryn Howell, PhD
2013 Kettler Scholar
George Mason University School of Public Policy
Center for Regional Analysis
Arlington, Virginia 22201
February, 2014
George Mason University Center for Regional Analysis Page 1
Executive Summary
The housing boom of the early 2000s led to growth in new home construction, urban core development,
and suburban single-family development that had not been experienced since the 1950s. Although,
nationally, the demand for housing and neighborhoods is changing to a more urban model of
development, more residents still continue to live in the suburbs than cities. However, cities are
increasingly a staple for the recent college graduates delaying marriage and child-bearing. These
households are living in increasingly dense, walkable communities for more extended periods.
Meanwhile, the baby-boomer generation has started to age into retirement and is remaining in the
suburban communities in which they have lived for decades. Nevertheless, there is a growing interest in
walkable communities with smaller yards and improved access to shopping, work, and public spaces,
while retaining the interest in homeownership that has been a hallmark of the past half century of
American success.
The Washington, DC region now attracts a growing number of young, childless professionals, even as the
number of retirees from government and other sectors grows. At the same time, core jurisdictions like the
District of Columbia and Arlington and Montgomery Counties have promoted schools, parks and other
amenities for children and families to encourage them to remain in the core rather than moving to the
suburbs for family formation. Moreover, unlike the larger east coast cities that have long focused on
multifamily housing as a means of providing access to jobs centers, the Washington region has had access
to land to provide single-family housing that has access to highways and transit. However, rising
population and housing demand, combined with zoning laws to preserve farm land and open space, have
also changed the cost of land for housing. Finally, the volatility of the government sector, including
changes in federal employment and federal contracting, have changed the consumption patterns of new
single-family housing.
This research examines the existing stock of multifamily housing in the Washington, DC region, the
projections for population, and the demand for multifamily housing units regionally as demographic,
market demand and housing finance options shift. Four main questions are investigated in this research:
1. What are the characteristics of the existing stock of multifamily housing by jurisdiction?
2. Who lives in multifamily housing and what are the characteristics of the communities in which
multifamily housing is concentrated?
3. How will the regional population change over the next five to ten years and where will they live?
4. What is in the pipeline for multifamily construction and how will this serve the residents who will
move in, form families, and age in place in the region?
Summary of Key Findings:
Between 2013 and 2020, the Washington, DC region is expected to add more than 700,000 new residents,
including almost 85,000 children and more than 400,000 residents over the age of 65. This includes both
those moving to region for jobs, as well as those who remain and age in place. As the structure of jobs
changes, and more residents age, the housing patterns will shift.
Key Findings
The existing supply of multifamily housing has been largely concentrated in the urban core
jurisdictions within the Beltway. However, there has been significant growth in traditional
multifamily (two-or-more units in the building) along transit corridors and new city center

George Mason University Center for Regional Analysis Page 2
development in places like Loudoun and Fairfax Counties. However, the higher-than-average
growth of attached single-family housing in less-dense communities suggests a change of
demand, as well as greater acceptance of different types of suburban density.
Although new rental housing construction increased over the past three years, it has been
increasingly high-end rental units located in particular submarkets. Further, due to fears of
overbuilding in those sub-regions, the pipeline for multifamily housing has slowed.
Rental housing is dominated by single-family homes in the suburban jurisdictions and small
multifamily units in the urban core. As a result, families looking for rental housing typically have
limited options beyond single-family homes. Owner-occupied multifamily housing grew fastest
in emerging markets in outlying counties and Washington, DC.
Rents and home values continue to increase, particularly in the core jurisdictions of the
Washington, DC region, where new demand has made the competition for new units high.
Owner-occupied multifamily, after a precipitous decline during the housing bust, is making a
slow recovery in both prices and development across the region.
The number of seniors will grow significantly across the region, while the number of children in
the District will increase rapidly. Both trends may present challenges for housing as families form
and seniors retire.
Introduction and Background
In spite of having missed the strongest effects of the recession, foreclosure, and subsequent home value
declines, the Washington, DC region has been impacted by overall decline in government jobs, decreased
federal contracting, and the unpredictability of government function. The rise of low-wage and lower-
middle-class jobs and increase in the cost of commuting have changed the potential of traditional
homeownership for many families. In addition, in spite of the economic slowdown, land prices continue
to increase, putting new single-family homes out of reach of many new families.
Meanwhile, as Millennials (also called Generation Y) delay family formation, Generation Xers begin to
have children, and Baby Boomers age into retirement, housing demand is shifting. Urban jurisdictions are
changing to attract young affluent individuals and to retain young families as they have children and
advance in their careers. More millennials are staying in the city, attracted by carfree lifestyles, walkable
amenities, and neighborhoods that have become safer over the past decade. Generation X households,
many of whom moved to Washington, DC, Arlington County, and Alexandria as they were beginning to
change in the late 1990s and early 2000s have bought homes and are tending to stay in jurisdictions once
deemed unacceptable to many families who had options to move. Meanwhile, Baby Boomers are retiring
and remaining in their largely suburban communities.
At the same time, local jurisdictions and developers are working to attract the demand for walkable
amenities, safety, sense of place, and schools. Policies such as free pre-Kindergarten, charter schools,
renovated public spaces, and recreation centers have been a way that jurisdictions continue to work to
attract upper-middle-class families. Developers are not only building high-end amenities within their
buildings but also focusing on submarkets such as Silver Spring, Clarendon, and NoMa to attract young

George Mason University Center for Regional Analysis Page 3
residents to new areas with a sense of place, walkable bars and restaurants, and access to jobs. Similarly,
Loudoun and Fairfax Counties have been building city centers with mixed-use, residential and
commercial development to support a new type of demand. Building owners are also adapting their
existing buildings to provide play rooms and senior centers to support the interest of families in all stages
to stay in place.
These efforts have been successful. Developers and local jurisdictions have reaped the rewards of this
changing demand. However, this trend is only just beginning. Over the next decade, the market for
middle-class jobs will shrink, meaning that new workers will have lower wages, and those remaining may
not advance into jobs that will allow many of them to purchase homes. Further, the babyboomers will
continue to retire and remain in the region after decades of suburban living, while millennials and
genXers will continue family formation and child-rearing after more than a decade of core residency. The
region also remains a highly desirable location for recent college graduates.
Supply of Multifamily in the Washington, DC Region
Multifamily housing in Washington, DC has largely been confined to the urban core of The District,
Alexandria, Montgomery County, Prince George’s County and Arlington County. However, as
transportation corridors have expanded across the region, including growth along I-270, the Dulles Toll
Road, Tysons Corner and I-95 South into Virginia, multifamily construction has followed. This is
particularly the case for multifamily owner-occupied units. While most housing units across the region
continue to be located in single-family communities and in tracts with less than 20 percent multifamily
units, the number of high-density tracts has increased significantly over the past decade, thereby
increasing the population living in multifamily housing across the region.
As illustrated in Figure 1, The District leads the region in multifamily housing units, supplying 27 percent
of the region’s multifamily housing. In fact, the core jurisdictions of The District, Alexandria,
Montgomery County, Arlington County, Prince George’s County, and Fairfax County account for 87.5
percent of the multifamily development, leaving just 12.5 percent of multifamily housing outside the
center of the region. For this report, multifamily housing was defined as being located within buildings of
two-or-more units. Townhouses or row houses are defined as single-family attached units. The maps in
Appendix one illustrate the change in multifamily development by tract. Multifamily housing has been
concentrated in The District, the City of Alexandria, Arlington County and Prince Georges County, as
well as along the I-270, I-66, and I-95 corridors in Montgomery, Fairfax, and Loudoun counties.

George Mason University Center for Regional Analysis Page 4
Figure 1
Regional Shares of Multifamily Housing, 2011
Source: American Community Survey GMU Center for Regional Analysis
To better understand the character of the communities in which multifamily housing is located, the census
tracts in the region were divided by the percentage of multifamily units located within the census tract.
Table 1 illustrates the change in the housing type by concentration of multifamily units in the census tract.
Between 2000 and 2011, the number of multifamily units increased by 2.8%, compared to an increase in
single-family units of 17.1%. Within multifamily housing development, multifamily rental declined by
4.4%, compared to a 39.4% increase in multifamily homeownership in condominium and cooperative
structures. This was particularly clear in the low-density tracts in which multifamily housing is often
viewed as undesirable due to its reputation for poverty and unstable rental tenures. Multifamily rental
housing particularly has declined or not grown at pace with the other types of housing across the region’s
jurisdictions.
Table 1
Change in Housing Unit Type by Multifamily Concentration, 2000-2011
Census Tracts
% Multifamily
All
Multifamily
%
All
Single-
Family %
Multifamily
owner-
occupied %
Multifamily
Rental %
0-20% 3.8 21.2 132.6 -26.1
20-40% 21.2 12.0 100.9 6.1
40-60% 6.4 23.4 18.1 3.9
60-80% -9.5 -17.1 -3.9 -10.4
80-100% 1.3 -14.0 26.6 -4.1
All Tracts 2.8 17.1 39.4 -4.4 Source: American Community Survey, GMU Center for Regional Analysis
The decline in the amount of multifamily rental housing may reflect the increase in demand for
homeownership during the middle part of the decade that depressed the rental housing market. However,
this decrease resulted in an unmet demand for multifamily housing that resulted in low vacancy rates in
Prince William,
3.32% Alexandria, 6.66%
Arlington, 9.17%
Loudoun, 2.6%
Prince George's,
14.51%
Frederick, 2.54%
Fairfax County,
15.75%
Washington, DC,
26.97%
Counties with <
1%, 4.02%
Montgomery,
14.41%

George Mason University Center for Regional Analysis Page 5
some markets and rising rents. Multifamily building permits have rebounded over the past three years
across the region.
In Figure 2, the rise in the number of permits in the three-state region is shown. Over the past three years,
the total number of permits annually increased from less than 4,000 in 2010 to almost 12,000 in 2012.
Developers have ramped up production of Class A apartments, particularly in submarkets in The District
and the core jurisdictions of the City of Alexandria, Arlington County and Montgomery County. Figures
3 and 4 illustrate the change in production of multifamily housing in the jurisdictions inside the beltway,
as well as Loudoun, Prince William and Fairfax Counties.
Although rental housing production has increased in all jurisdictions since the end of the recession,
condominium production has not yet rebounded from the height of production in 2006. As has been
widely researched, the condominium market declined precipitously over the past six years such that new
condominium development has fallen to pre-market boom levels. Like a corresponding slow-down in the
new construction single-family ownership market, the shift in demand may be partially attributable to the
changing access to credit, employment instability, the recent bust in the condominium market, and a
change in the perception of homeownership among multifamily residents. Figure 4 shows the flat
condominium production over the past three years in DC, Maryland and Virginia.
Figure 2
Multifamily Building Permits, 2000-2012
Source: US Census, GMU Center for Regional Analysis
-
2,000
4,000
6,000
8,000
10,000
12,000
DC
Maryland
Virginia
MSA

George Mason University Center for Regional Analysis Page 6
Figure 3
Multifamily Rental Housing Unit Pipeline, 1994-2013
Source: Delta Associates, GMU Center for Regional Analysis
Figure 4
Condominium Pipeline, 2003-2013
Source: Delta Associates, GMU Center for Regional Analysis
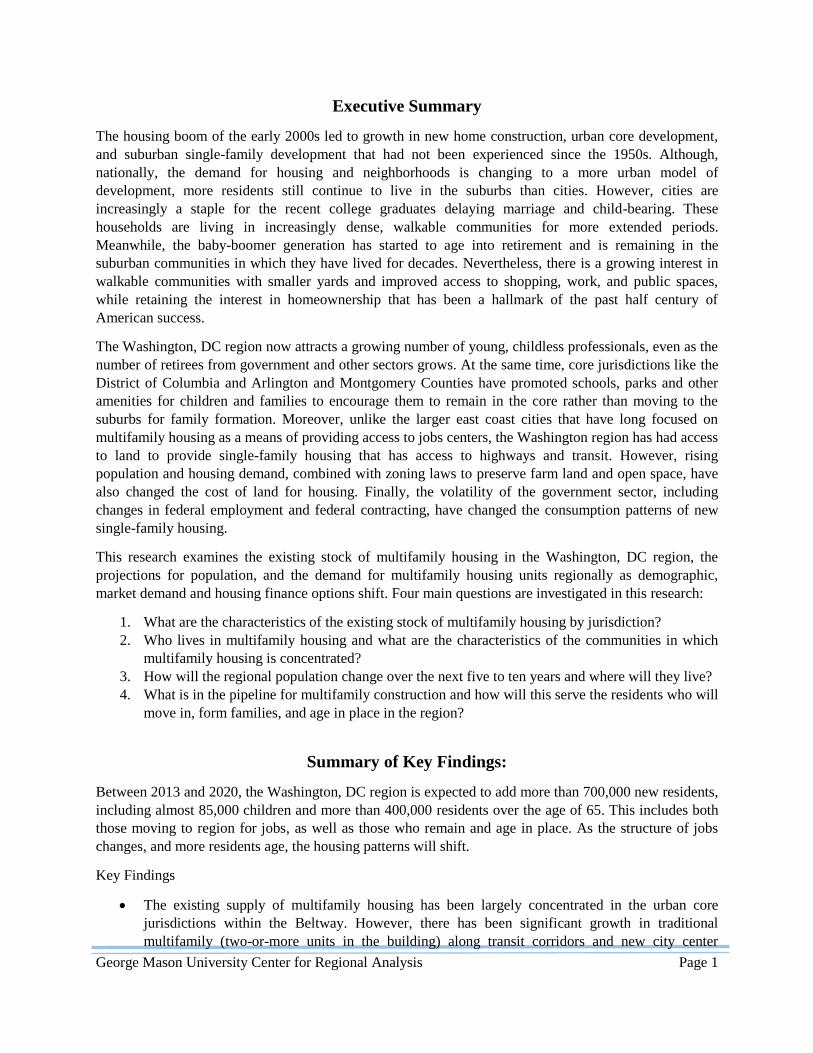
An interesting trend in the region is that jurisdictions with low shares of multifamily housing experienced
growth rates in the attached single-family stock that outpaced the single-family detached stock growth.
Figure 5 illustrates the distribution of single-family housing by type for the multifamily concentration of
the tracts in which they are located. Although the single-family stock declined in the higher multifamily
density tracts, single-family attached housing stock grew in tracts with between zero and 60% multifamily
housing units.
0
2,000
4,000
6,000
8,000
10,000
12,000
14,000
16,000
18,000
Washington, DC Maryland Virginia
0
2,000
4,000
6,000
8,000
10,000
12,000
14,000
Washington, DC Maryland Virginia
George Mason University Center for Regional Analysis Page 7
Figure 5
Single-family Housing Distribution, 2000-2011
Source: American Community Survey, GMU Center for Regional Analysis
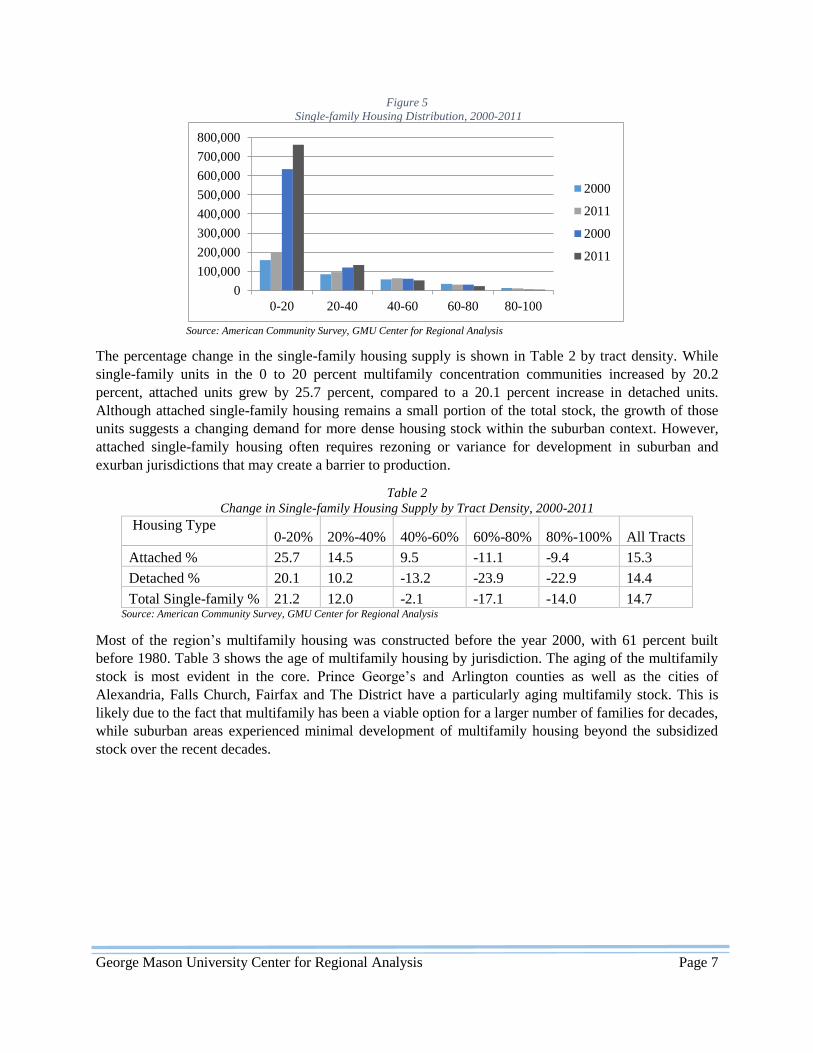
The percentage change in the single-family housing supply is shown in Table 2 by tract density. While
single-family units in the 0 to 20 percent multifamily concentration communities increased by 20.2
percent, attached units grew by 25.7 percent, compared to a 20.1 percent increase in detached units.
Although attached single-family housing remains a small portion of the total stock, the growth of those
units suggests a changing demand for more dense housing stock within the suburban context. However,
attached single-family housing often requires rezoning or variance for development in suburban and
exurban jurisdictions that may create a barrier to production.
Table 2
Change in Single-family Housing Supply by Tract Density, 2000-2011
Housing Type 0-20% 20%-40% 40%-60% 60%-80% 80%-100% All Tracts
Attached % 25.7 14.5 9.5 -11.1 -9.4 15.3
Detached % 20.1 10.2 -13.2 -23.9 -22.9 14.4
Total Single-family % 21.2 12.0 -2.1 -17.1 -14.0 14.7 Source: American Community Survey, GMU Center for Regional Analysis
Most of the region’s multifamily housing was constructed before the year 2000, with 61 percent built
before 1980. Table 3 shows the age of multifamily housing by jurisdiction. The aging of the multifamily
stock is most evident in the core. Prince George’s and Arlington counties as well as the cities of
Alexandria, Falls Church, Fairfax and The District have a particularly aging multifamily stock. This is
likely due to the fact that multifamily has been a viable option for a larger number of families for decades,
while suburban areas experienced minimal development of multifamily housing beyond the subsidized
stock over the recent decades.
0
100,000
200,000
300,000
400,000
500,000
600,000
700,000
800,000
0-20 20-40 40-60 60-80 80-100
2000
2011
2000
2011

George Mason University Center for Regional Analysis Page 8
Table 3
Percentage of multifamily stock by year built
Jurisdiction 2000
or later
1980 to
1999
1960 to
1979
1940 to
1959
Before
1939
District of Columbia 9.7 8.3 27.7 30.0 24.3
Calvert 16.9 62.1 13.2 0.6 7.2
Charles 25.8 44.5 23.5 3.6 2.7
Frederick 21.7 40.1 20.7 6.1 11.6
Montgomery 16.3% 32.1 38.7 10.8 2.1
Prince George's 8.5 19.4 51.4 17.8 3.0
Arlington 17.4 24.7 28.9 25.8 3.1
Clarke 0.0 37.4 29.8 9.6 23.2
Fairfax 16.0 37.9 37.9 7.4 0.8
Fauquier 10.8 44.5 23.7 4.5 16.5
Loudoun 40.3 47.5 9.6 1.5 1.1
Prince William 24.3 44.9 25.5 4.1 1.1
Spotsylvania 19.1 56.8 20.3 3.5 0.4
Stafford 39.8 45.3 11.9 2.7 0.3
Warren 1.2 35.9 22.2 15.3 25.5
Alexandria city 11.4 22.1 45.5 17.9 3.1
Fairfax city 8.6 18.0 65.4 7.0 1.1
Falls Church city 19.7 12.0 55.7 11.9 0.76
Manassas city 11.4 51.1 26.3 6.8 4.5
Manassas Park city 78.1 7.4 7.7 4.3 2.6
Total 14.4 25.2 35.4 17.1 8.0
Source: American Community Survey, GMU Center for Regional Analysis
Figure 6 presents the types of housing that are available in the Washington, DC Region. A total of 74.5
percent of all housing units have between 2 and 4 bedrooms per unit, suggesting units that support
families. Meanwhile only 15.5 percent of all units are studios or one bedrooms. Table four shows the
significant disparity in the size of housing units among the region’s jurisdictions. When homeownership
and rental units are reported separately, it is clear that rental units are more likely to be smaller with 37.5
studio and one bedroom units, and 60.1 percent 2 to 4 bedroom units, compared to 3.99 percent and 82.4
percent of owner-occupied units.

George Mason University Center for Regional Analysis Page 9
Figure 6
Number of Bedrooms in all Units
Source: American Community Survey, GMU Center for Regional Analysis
Further, in the core, smaller units remain dominant while suburban jurisdictions have a higher share of
their units with two or more bedrooms. This is largely due to the small number of multifamily buildings,
relative to the entire stock. Although the number of families that choose to remain in the core jurisdictions
may have increased, the low share of family-sized units suggests that these families may be living in
single-family homes, rather than multifamily rentals or ownership units.
Table 4 shows the percentage of single-family rentals by jurisdiction. The suburbs are more likely to
house their renters in single-family homes than core jurisdictions, consistent with the growth of younger,
more affluent single or two person households in central jurisdictions. Regionally, the rental housing
stock is similarly disparate, with the core jurisdictions dominated by studio and one bedroom rentals,
while the suburban rentals have more bedrooms due to the large single-family rental stock.
0%
5%
10%
15%
20%
25%
30%
35%
Studio 1 Bedroom 2 Bedrooms 3 Bedrooms 4 Bedrooms 5 Bedrooms
or More

George Mason University Center for Regional Analysis Page 10
Table 4
Number of Bedrooms in all Units by Jurisdiction, 2011
Jurisdiction
0/1 Bedroom 2-4 Bedrooms 5 + Bedrooms Percent
Single-
Family Rent Rent Own Rent Own Rent Own
District of Columbia 56.9 16.7 41.4 76.2 1.7 7.4 15.8
Calvert 21.4 0.9 77.6 84.9 1.0 14.3 52.5
Charles 18.9 0.6 79.1 87.9 2.0 11.5 55.9
Frederick 21.3 0.9 76.5 90.4 2.2 8.8 47.0
Montgomery 35.2 3.6 62.4 80.1 2.4 16.3 24.2
Prince George's 33.3 1.9 64.3 85.1 2.4 13.1 21.9
Arlington 53.0 13.1 45.7 78.3 1.3 8.7 14.4
Clarke 10.9 1.9 88.1 92.3 1.0 5.9 72.4
Fairfax 28.2 2.9 69.0 80.5 2.8 16.7 35.1
Fauquier 11.6 0.6 87.3 88.0 1.1 11.4 74.0
Loudoun 20.3 1.3 77.1 81.2 2.6 17.6 44.4
Prince William 18.5 0.8 75.5 85.0 6.0 14.2 50.2
Spotsylvania 12.6 0.4 84.9 89.3 2.5 10.3 68.9
Stafford 12.4 0.5 82.6 84.2 5.0 15.3 61.1
Warren 20.9 3.5 79.0 91.0 0.2 5.6 59.7
Alexandria City 49.1 14.3 50.2 81.6 0.7 4.2 16.5
Fairfax City 22.3 2.7 70.9 81.7 6.8 15.6 40.7
All Jurisdictions 37.5 4.0 60.1 82.4 2.3 13.6 30.1 Source: American Community Survey, GMU Center for Regional Analysis
Nearly three quarters (73.8%) of multifamily units in the Washington, DC region are occupied by one- or
two-adult households. Figure 7 presents the household types living in multifamily housing in all
jurisdictions in the region. Although suburban jurisdictions have larger units and larger households, the
number of units that exist for these families is not sufficient enough to make an impact in a region where
the multifamily housing is concentrated at the core of the region with one- and two-bedroom units. As
suggested in the tables above, many multifamily residents living in suburban jurisdictions live in single-
family units that are both more plentiful and have more bedrooms.

George Mason University Center for Regional Analysis Page 11
Figure 7
Multifamily Housing by Household Type, 2011
Source: American Community Survey, GMU Center for Regional Analysis
Rents and home values increased dramatically in all jurisdictions between 2000 and 2011. Table five
shows the highest median rents in the region are in Fairfax City and Arlington and Loudoun Counties
($1,653, $1,604, and $1,603, respectively) while home values were highest in Arlington County, Fairfax
County, and Alexandria ($575,600, $493,100, and $480,300, respectively). The District had the steepest
increase in rents (41 percent), growing from $807 per month in 2000 to a median rent of $1,135 in 2011,
followed by Arlington County (37 percent), Fairfax City (34 percent), and Loudoun County (29 percent).
Home values increased the greatest in the District (116 percent), and Clarke County (96 percent), all
jurisdictions which have experienced significant residential construction over the past decade.
0%
10%
20%
30%
40%
50%
60%

George Mason University Center for Regional Analysis Page 12
Table 5
Value and Rent Costs of housing units by Jurisdiction, 2000 to 2011
Jurisdiction
Median
value,
2000
Median
Rent,
2000
Median
Value
2011
Median
Rent
2011
Change
in Value
%
Change
in rent
%
District of Columbia $205,345 $807 $442,600 $1,135 115.5 40.6
Calvert $221,020 $1,093 $384,500 $1,321 74.0 20.9
Charles $199,858 $1,120 $341,200 $1,370 70.7 22.3
Frederick $209,263 $939 $335,600 $1,184 60.4 26.1
Montgomery $289,729 $1,193 $469,900 $1,473 62.2 23.5
Prince George's $190,192 $962 $312,800 $1,180 64.5 22.7
Arlington $342,764 $1,171 $575,600 $1,604 67.9 37.0
Clarke $182,224 $816 $356,700 $1,038 95.8 27.2
Fairfax $304,751 $1,303 $493,100 $1,572 61.8 20.6
Fauquier $212,529 $920 $376,100 $1,148 77.0 24.8
Loudoun $261,906 $1,246 $472,000 $1,603 80.2 28.7
Prince William $195,417 $1,126 $353,300 $1,402 80.8 24.5
Spotsylvania $167,855 $1,051 $286,800 $1,213 70.9 15.4
Stafford $204,300 $1,099 $334,800 $1,329 63.9 20.9
Warren $142,121 $693 $244,000 $884 71.7 27.6
Alexandria city $330,224 $1,124 $480,300 $1,395 45.5 24.1
Fairfax city $250,933 $1,234 $472,600 $1,653 88.3 34.0
Source: US Census, GMU Center for Regional Analysis. All 2000 data have been adjusted to 2011 dollars
After a post-recession decline in the price of multifamily homeownership units, sales prices are on the rise
in all jurisdictions, with the regional average sale price of condominiums rising to $316,000 by the end of
2013. There was regional variation in average sales prices with suburban Maryland averaging just
$217,000 while The District condominiums averaged almost $450,000 last year and the average Northern
Virginia condominium sales price was $303,000.

George Mason University Center for Regional Analysis Page 13
Figure 8
Average Condominium Sales Prices, 2008-2013
Source: Metropolitan Regional Information Systems (MRIS), GMU Center for Regional Analysis
Multifamily Housing Supply: Key Findings
The supply of multifamily housing increased by 2.8% between 2000 and 201l, led by a 36.4%
growth in multifamily home ownership.
Since 2011, the production of multifamily housing has increased, particularly in the rental
housing sector. Multifamily building permits increased from a low in 2009 of 3,375 to a high of
11,424 in 2012 permits, outpacing single-family housing permits.
Median rents and home values increased between 2000 and 2011. The District led the region in
terms of both rent and home value increases during this period. The highest rents in the region
were in the City of Fairfax ($1,653) and Arlington County ($1,604). Arlington County ($575,600)
and Alexandria ($480,300) had the highest median home values.
Rental housing markets in jurisdictions with low rates of single-family rental are dominated by
small units (studio and one-bedroom units). These jurisdictions also lead the region in the
percentage of one- and two-adult households living in multifamily housing. Meanwhile, renters in
suburban communities are likely to live in single-family housing, rather than multifamily
housing.
The amount of attached single family housing grew in suburban jurisdictions, outpacing the
growth in detached single family housing.
$0
$50,000
$100,000
$150,000
$200,000
$250,000
$300,000
$350,000
$400,000
$450,000
$500,000
2008 2009 2010 2011 2012 2013
District of
Columbia
Suburban
Maryland
Northern
Virginia
Washingto
n MSA

George Mason University Center for Regional Analysis Page 14
Demand for Multifamily Housing
The demand for multifamily housing in the Washington, DC region is changing. From demographic shifts
by age and family formation to income and job changes, more multifamily housing will be required to
meet a wider variety of needs.
Residents living in multifamily households are more likely to have incomes of less than half of the
regions area median income (AMI)1 as shown in Figured 9. Further, they are most likely to be one- or
two- adult households with non-Hispanic White householders. Low- and moderate-income households
currently heavily rely on multifamily units for housing. They are disproportionately represented among
the multifamily housing residents, occupying almost than half of the multifamily units across the region,
compared to just over twenty percent of the housing stock overall. Given the incomes of the residents,
compared to the cost of housing, it is likely that many of these households receive either a place-based
subsidy or a housing choice voucher. Meanwhile, those households earning greater than $100,000
annually are underrepresented in the multifamily housing stock, suggesting that single-family housing
options are greatest for those earning higher salaries.
Figure 9
Multifamily Households by Income, 2010
Source: American Housing Survey, GMU Center for Regional Analysis
The character of the region’s multifamily residents varies. Table 6 presents the income by county of
residents living in multifamily housing in the region’s jurisdictions for which these data are available.
Region wide, more than three quarters of multifamily residents earn less than $100,000 annually.
Although regionally, the majority of multifamily residents earn less than $100,000, jurisdictions in the
urban core, including The District, Alexandria, Arlington County and Montgomery County had
significantly more income diversity in multifamily households compared to the less developed suburban
jurisdictions where there are more single-family options for high-income households. In The District, for
example, 49.6 percent of multifamily residents earn less than $49,000 per year, compared to 33.5 percent
in Alexandria and 53.4 percent in Prince George’s County. By contrast, 5.8 percent of multifamily
residents in the District, 3.4 percent in Alexandria, and 0.6 in Prince George’s earned more than $200,000
annually. The income diversity in the core jurisdictions suggests that multifamily housing is viewed as
more than just an affordable option. Instead, for many households, the decision to live in a multifamily
1 The Area Median Income (AMI) for the Washington Metropolitan Statistical Area is $107, 500
0%
5%
10%
15%
20%
25%
30%
35%
40%
45%
50%
<$49k $50k to
$74k
$75k to
$99k
$100k to
$124k
$125k to
$149k
$150k to
$199k
$200k or
greater
Multifamily
Residents
All Residents

George Mason University Center for Regional Analysis Page 15
unit may represent a desire to live in denser communities, have fewer maintenance responsibilities, or
may offer greater flexibility.
Table 6
Income of Multifamily Residents, 2010
Jurisdiction <$49k $50k to
$74k
$75k to
$99k
$100k to
$124k
$125k to
$149k
$150k to
$199k
$200k or
greater
Washington, DC 49.6 16.1 10.8 8.0 4.8 4.9 5.8
Charles 61.8 13.3 12.5 5.8 0.6 1.6 4.4
Calvert 48.0 22.8 11.5 9.1 2.8 4.4 1.5
Frederick 53.0 20.8 11.0 5.2 6.1 1.9 2.1
Montgomery 43.8 22.9 12.7 7.7 4.3 5.2 3.5
Prince George's 53.4 24.7 11.3 6.1 2.3 1.6 0.6
Arlington 26.7 19.6 16.5 13.0 8.2 9.1 6.9
Fairfax 34.8 21.6 16.6 11.8 6.1 5.1 3.9
Prince William 51.9 19.8 14.8 6.2 3.5 2.6 0.8
Loudoun 43.2 24.6 11.4 5.8 7.4 5.1 2.4
Stafford 54.4 20.9 12.7 6.6 2.6 2.0 0.7
Alexandria City 33.5 25.8 14.4 10.6 6.7 5.7 3.4
All Multifamily 44.2 20.9 13.0 8.6 4.9 4.7 3.7
Source: American Housing Survey, GMU Center for Regional Analysis
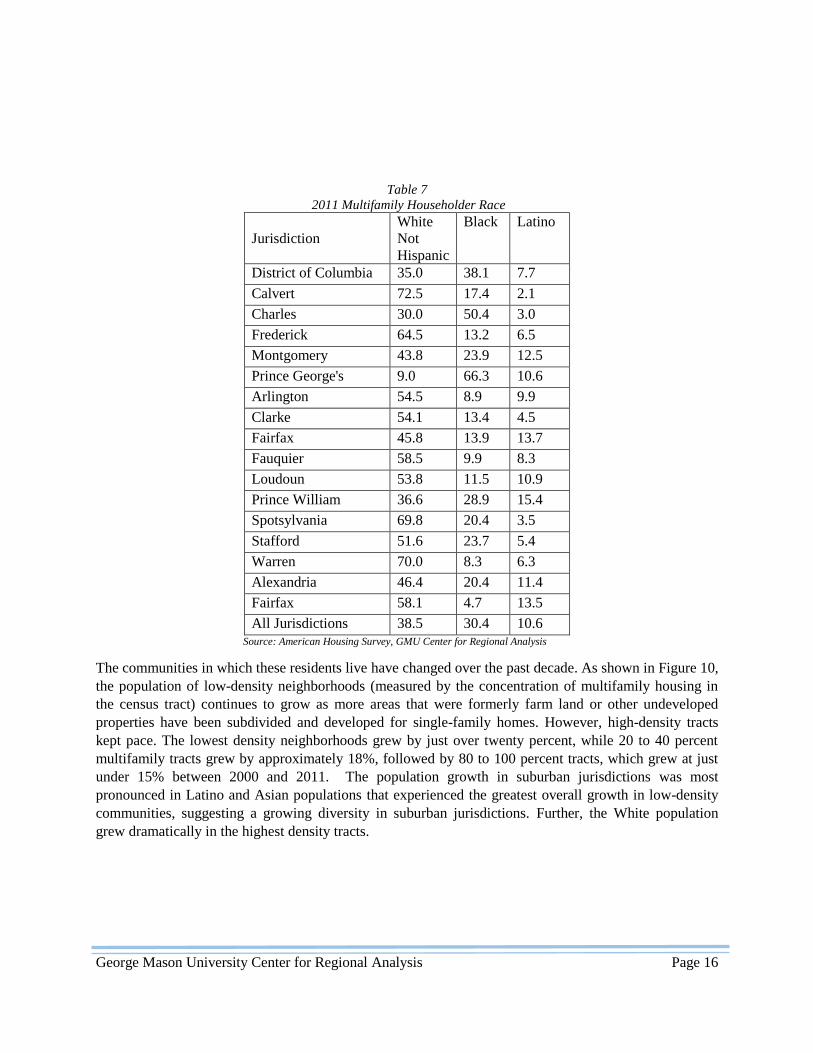
The racial and ethnic composition of multifamily residents is shown on Table 7. Residents of multifamily
housing are a diverse representation of the population. Non-Hispanic Whites represent 39 percent of
multifamily residents in the region, followed by African Americans (30.4 percent) and Latinos (10.6
percent). Within the jurisdictions, there is significant variation based on the concentration of minorities
and the size of the existing multifamily housing stock.
George Mason University Center for Regional Analysis Page 16
Table 7
2011 Multifamily Householder Race
Jurisdiction
White
Not
Hispanic
Black Latino
District of Columbia 35.0 38.1 7.7
Calvert 72.5 17.4 2.1
Charles 30.0 50.4 3.0
Frederick 64.5 13.2 6.5
Montgomery 43.8 23.9 12.5
Prince George's 9.0 66.3 10.6
Arlington 54.5 8.9 9.9
Clarke 54.1 13.4 4.5
Fairfax 45.8 13.9 13.7
Fauquier 58.5 9.9 8.3
Loudoun 53.8 11.5 10.9
Prince William 36.6 28.9 15.4
Spotsylvania 69.8 20.4 3.5
Stafford 51.6 23.7 5.4
Warren 70.0 8.3 6.3
Alexandria 46.4 20.4 11.4
Fairfax 58.1 4.7 13.5
All Jurisdictions 38.5 30.4 10.6
Source: American Housing Survey, GMU Center for Regional Analysis
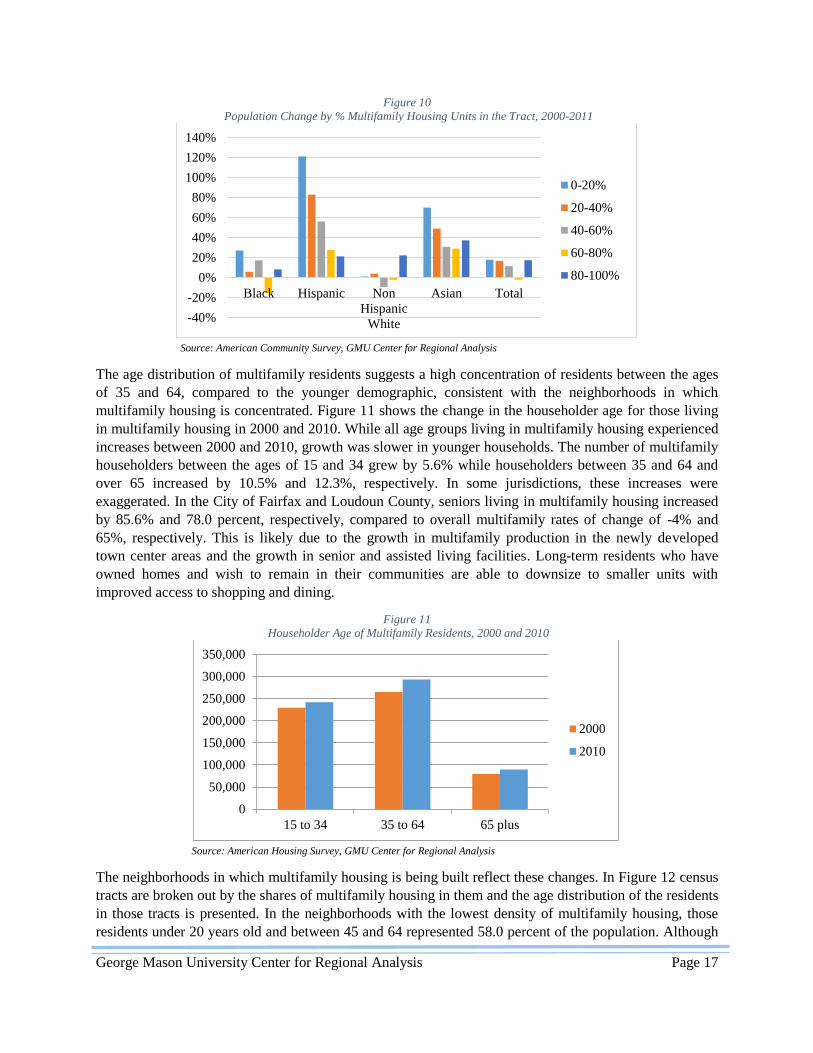
The communities in which these residents live have changed over the past decade. As shown in Figure 10,
the population of low-density neighborhoods (measured by the concentration of multifamily housing in
the census tract) continues to grow as more areas that were formerly farm land or other undeveloped
properties have been subdivided and developed for single-family homes. However, high-density tracts
kept pace. The lowest density neighborhoods grew by just over twenty percent, while 20 to 40 percent
multifamily tracts grew by approximately 18%, followed by 80 to 100 percent tracts, which grew at just
under 15% between 2000 and 2011. The population growth in suburban jurisdictions was most
pronounced in Latino and Asian populations that experienced the greatest overall growth in low-density
communities, suggesting a growing diversity in suburban jurisdictions. Further, the White population
grew dramatically in the highest density tracts.
George Mason University Center for Regional Analysis Page 17
Figure 10
Population Change by % Multifamily Housing Units in the Tract, 2000-2011
Source: American Community Survey, GMU Center for Regional Analysis
The age distribution of multifamily residents suggests a high concentration of residents between the ages
of 35 and 64, compared to the younger demographic, consistent with the neighborhoods in which
multifamily housing is concentrated. Figure 11 shows the change in the householder age for those living
in multifamily housing in 2000 and 2010. While all age groups living in multifamily housing experienced
increases between 2000 and 2010, growth was slower in younger households. The number of multifamily
householders between the ages of 15 and 34 grew by 5.6% while householders between 35 and 64 and
over 65 increased by 10.5% and 12.3%, respectively. In some jurisdictions, these increases were
exaggerated. In the City of Fairfax and Loudoun County, seniors living in multifamily housing increased
by 85.6% and 78.0 percent, respectively, compared to overall multifamily rates of change of -4% and
65%, respectively. This is likely due to the growth in multifamily production in the newly developed
town center areas and the growth in senior and assisted living facilities. Long-term residents who have
owned homes and wish to remain in their communities are able to downsize to smaller units with
improved access to shopping and dining.
Figure 11
Householder Age of Multifamily Residents, 2000 and 2010
Source: American Housing Survey, GMU Center for Regional Analysis
The neighborhoods in which multifamily housing is being built reflect these changes. In Figure 12 census
tracts are broken out by the shares of multifamily housing in them and the age distribution of the residents
in those tracts is presented. In the neighborhoods with the lowest density of multifamily housing, those
residents under 20 years old and between 45 and 64 represented 58.0 percent of the population. Although
-40%
-20%
0%
20%
40%
60%
80%
100%
120%
140%
Black Hispanic Non
Hispanic
White
Asian Total
0-20%
20-40%
40-60%
60-80%
80-100%
0
50,000
100,000
150,000
200,000
250,000
300,000
350,000
15 to 34 35 to 64 65 plus
2000
2010

George Mason University Center for Regional Analysis Page 18
the higher density communities were dominated by residents over the age of 20 as they increased in
density, the share of population by the age of the adults did not vary widely across the densities.
Figure 12
Age by Multifamily Housing Concentration
14.0%
15.1%
5.2%
13.4% 15.8%
29.0%
9.2% 1.2%
0-20%
13.8%
11.8%
7.5%
16.6% 14.3%
24.4%
8.3% 1.6%
20-40%
13.2%
11.2%
7.3%
18.0% 14.5%
23.9%
7.8% 1.2%
40-60%
13.0%
11.4%
9.6%
17.7%
13.5%
20.8%
6.7% 1.2%
60-80%
8.7%
8.2%
10.5%
22.8% 13.3%
19.8%
7.8% 1.4%
80-100%
Under 10 10 to 19 20 to 24 25 to 34
35 to 44 45 to 64 65 to 84 85 or older
George Mason University Center for Regional Analysis Page 19
Source: American Community Survey, GMU Center for Regional Analysis
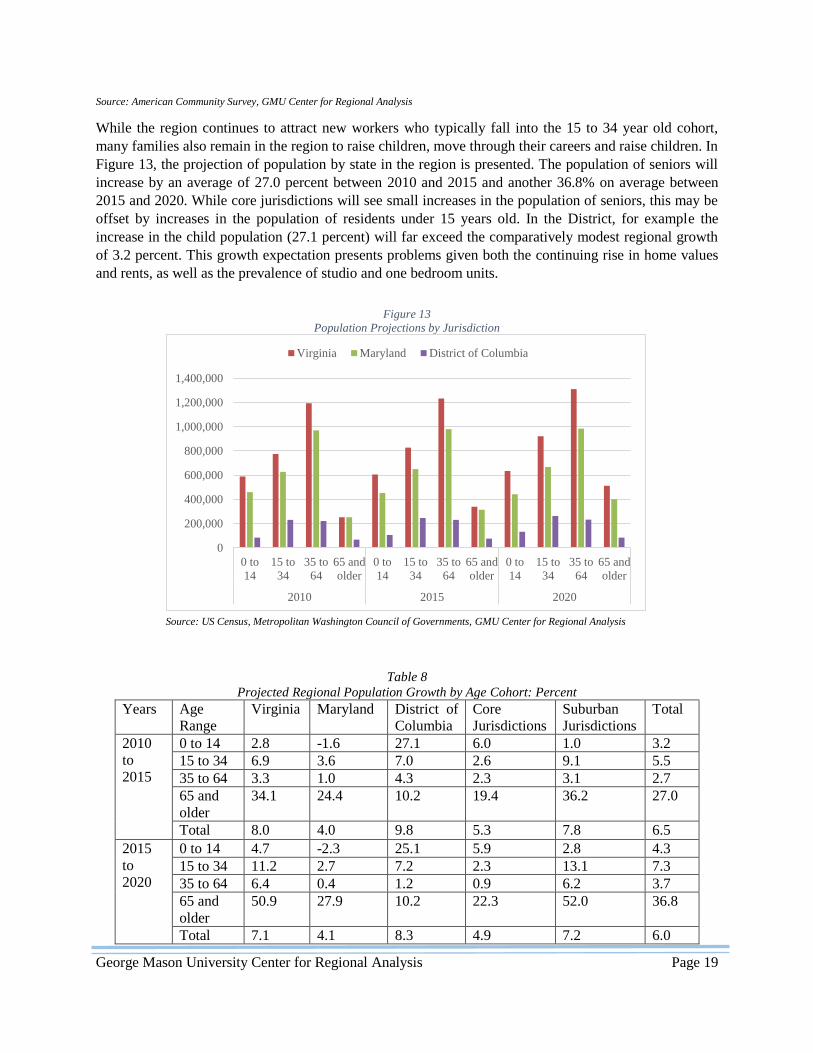
While the region continues to attract new workers who typically fall into the 15 to 34 year old cohort,
many families also remain in the region to raise children, move through their careers and raise children. In
Figure 13, the projection of population by state in the region is presented. The population of seniors will
increase by an average of 27.0 percent between 2010 and 2015 and another 36.8% on average between
2015 and 2020. While core jurisdictions will see small increases in the population of seniors, this may be
offset by increases in the population of residents under 15 years old. In the District, for example the
increase in the child population (27.1 percent) will far exceed the comparatively modest regional growth
of 3.2 percent. This growth expectation presents problems given both the continuing rise in home values
and rents, as well as the prevalence of studio and one bedroom units.
Figure 13
Population Projections by Jurisdiction
Source: US Census, Metropolitan Washington Council of Governments, GMU Center for Regional Analysis
Table 8
Projected Regional Population Growth by Age Cohort: Percent
Years Age
Range
Virginia Maryland District of
Columbia
Core
Jurisdictions
Suburban
Jurisdictions
Total
2010
to
2015
0 to 14 2.8 -1.6 27.1 6.0 1.0 3.2
15 to 34 6.9 3.6 7.0 2.6 9.1 5.5
35 to 64 3.3 1.0 4.3 2.3 3.1 2.7
65 and
older
34.1 24.4 10.2 19.4 36.2 27.0
Total 8.0 4.0 9.8 5.3 7.8 6.5
2015
to
2020
0 to 14 4.7 -2.3 25.1 5.9 2.8 4.3
15 to 34 11.2 2.7 7.2 2.3 13.1 7.3
35 to 64 6.4 0.4 1.2 0.9 6.2 3.7
65 and
older
50.9 27.9 10.2 22.3 52.0 36.8
Total 7.1 4.1 8.3 4.9 7.2 6.0
0
200,000
400,000
600,000
800,000
1,000,000
1,200,000
1,400,000
0 to
14
15 to
34
35 to
64
65 and
older
0 to
14
15 to
34
35 to
64
65 and
older
0 to
14
15 to
34
35 to
64
65 and
older
2010 2015 2020
Virginia Maryland District of Columbia

George Mason University Center for Regional Analysis Page 20
Source: US Census, Metropolitan Washington Council of Governments, GMU Center for Regional Analysis
Even though the region is anticipated to have almost 19,000 multifamily rental units come on line in 2014
(shown on Table 9), there will still not be sufficient units to accommodate the approximately 66,000
households that will need multifamily units by 2015. These households will likely live in roommate
situations, live in single-family rental housing, or stay with parents or other family members.
Table 9
Multifamily Rental Pipeline
Market
Rental
Units
For Sale
Units
District of Columbia 6,103 757
Upper Northwest 263 52
Central 956 590
Capitol Hill/ Riverfront / Hill
East 2,985 4
Northeast/MidEast 662 111
Maryland 10,067 194
Frederick County 160 0
Montgomery County 6,099 179
Prince George's County 3,808 15
Virginia 11,736 2,059
Arlington/Alexandria 3,334 638
Fairfax/Falls Church 6,778 1,014
Loudoun/Prince William 1,624 407
Total 18,906 3,010 Source: Delta Associates, GMU Center for Regional Analysis
Moreover, the rising costs of both rents and condominium purchase prices in many markets will make
these new units inaccessible to the growing low- and moderate-income members of the region’s
workforce. A Center for Regional Analysis report, Housing the Region’s Future Workforce, suggests that
almost half of new rental units will need to rent for less than $1,250 per month, while 16 percent of new
for-sale homes will need to be priced less than $200,000. Although smaller multifamily units could
address some of this demand, currently new condominiums on the market average more than $400,000 in
most markets, with some central markets, such as The District and Arlington and Alexandria averaging
more than $600,000. Figure 14 shows the asking price for new condominiums in the third quarter of
2013.

George Mason University Center for Regional Analysis Page 21
Figure 14
Average Contract Asking Price for New Condominiums, 3rd Quarter 2013
Source: Delta Associates, GMU Center for Regional Analysis
Rents for new units are similarly out of reach. Figure 15 presents the average rents for Class A and Class
B apartments. On average, Class A apartments in the region rented for $1,834 and Class B Apartments
rented for $1,535. The prices were highest in The District ($2,556 for Class A and $1,880 for Class B).
While this represented a slight drop in rents due to the unusually high production of multifamily housing,
the decline in building permits for 2013 should reduce vacancy rates by 2015, leading to an increase in
rents.
Figure 15
Effective Rents for Class A and B Apartments, 2013
Source: Delta Associates, GMU Center for Regional Analysis
$0
$200,000
$400,000
$600,000
$800,000
$1,000,000
$1,200,000
$1,400,000
$1,600,000
$1,800,000
$0
$500
$1,000
$1,500
$2,000
$2,500
$3,000
District of
Columbia
Maryland Virginia Metropolitan
Region
Class A
Class B

George Mason University Center for Regional Analysis Page 22
Multifamily Housing Demand: Key Findings
Residents of multifamily housing are concentrated in the low- to middle- income bracketss with
earning 44.2% earning less than $50,000 per year and 78.1% earning less than $100,000 per year.
Multifamily residents are less likely to be Non-Hispanic White than the population generally. A
notable exception to this is in The District where African Americans made up about half of the
population, but only 38.1% of the multifamily householders. Multifamily householders between
the ages of 45 and 64 made up the largest share of the multifamily population. However, the
number of multifamily householders over 65 grew the fastest with an increase of 12.3% between
2000 and 2010.
The communities in which multifamily housing is located have changed since 2000. Latino
population grew by 133.5% in communities with the smallest percentages of multifamily housing
compared to the 23.3% growth rate for all ethnicities, 11.3 for Non-Hispanic White and 34.6%
for African Americans.
The demand for multifamily housing will continue to rise, with approximately 66,000 households
in need of units. These households will be likely to earn less than $100,000 annually and be
younger than 35 years old.
New multifamily permits peaked in 2012, meaning that new multifamily development will slow
after the 19,000 units scheduled to deliver in 2014 are completed and absorbed by the market.
Conclusions and Implications
Although much of the recent multifamily housing development in the Washington region has focused on
one- and two-adult households under 35 years old that have dominated the submarkets in The District,
Arlington County, and Alexandria, multifamily housing will need to change in order to meet the demands
of an increasingly diverse market. Multifamily housing, whether rental or owner-occupied, is no longer
the housing of last resort. Increasingly, residents choose these options to be closer to jobs, shopping,
restaurants, and parks; to reduce maintenance responsibilities inherent in single-family homeownership;
or to allow for greater flexibility and mobility in employment. Further, for many households traditional
ownership may not be accessible due to wage levels, salary instability, or lack of affordable financing.
Seniors, Families and College Graduates will demand different types of housing
Multifamily housing will need to diversify in order to meet the growing demand from seniors, families
with young children, and residents outside the urban core jurisdictions. Not only will the housing need to
reflect these needs in terms of size, building amenities, and costs, but the neighborhoods will necessarily
be different to reflect the needs of these growing populations in the region. Attached single-family and
multifamily housing units in the suburban communities, where many aging families already live, will
provide attractive and pedestrian-friendly options for seniors to downsize without leaving their current
communities.

George Mason University Center for Regional Analysis Page 23
For example, at One Loudoun in Ashburn, VA, townhouse and dense single-family development is
providing access to shopping and urban-style amenities for a growing number of residents. Meanwhile,
developers in Crystal City have responded to a growing demand for play rooms and children’s amenities
in their buildings that meet the needs of a changing demographic. In the District, infill adaptive reuse
developments in neighborhoods like Capitol Hill and Columbia Heights have allowed small
condominium buildings to flourish. These developments provide access to quality schools and parks as
well as shopping, restaurants, and downtown jobs.
New Multifamily Housing will need to meet the needs of a range of incomes
While newly developed multifamily units have mainly met the needs of individuals and households with
above-average incomes, the rising rents and asking prices for these units put them out of reach of many
recent college graduates and younger families. As renter incomes decline, and rents and home values
increase, fewer housing options are available to middle-income and low-income households. Moreover,
the growing number of college graduates moving to and working in the region will need affordable
housing options such as smaller units and shared apartments. There will also be a growing need to
preserve the existing stock of low- and moderate-income housing, especially Class B apartments to
provide housing for the growing number of service and health industry workers in the region.
Arlington County has developed a plan to preserve affordable multifamily housing units as it redevelops
the Columbia Pike Corridor to include housing, transportation and other neighborhood amenities.
Meanwhile, the District and housing developers worked to preserve housing units in its 2008
redevelopment of Columbia Heights. As a result, more than 2,300 multifamily housing units were created
or preserved at various affordable rents in addition to the market-rate retail and housing development.
Local jurisdictions should remove barriers to construction
and support the changing demand for housing
Multifamily housing has traditionally been considered to be incompatible with detached single-family
neighborhood development due to its perceived effects on property values, demands on municipal
services, and potential for attracting poor residents. However, as this research suggests, the residents of
and demand for multifamily housing is diverse – from seniors hoping to remain in their communities as
they age to young families, wanting to have more walkable access to parks and amenities. As the Housing
the Region’s Future Workforce report argued in 2013, “A lack of sufficient housing within the
Washington DC area and located in proximity to the region’s employment centers and to transit will lead
to increased traffic and transit congestion, and will result in longer commutes, lower worker productivity,
and declining quality of life for all residents of the region.”

George Mason University Center for Regional Analysis Page 24
Appendix 1: Maps

George Mason University Center for Regional Analysis Page 25
Fig
ure
1 W
ash
ing
ton,
DC
Reg
iona
l M
ult
ifam
ily
Hou
sing S
tock
, 200
0
Sou
rce:
Am
eric
an
Co
mm
unit
ies
Su
rvey
, G
MU
Cen
ter
for
Reg
iona
l A
naly
sis

George Mason University Center for Regional Analysis Page 26
Fig
ure
2:
Wash
ingto
n,
DC
Reg
iona
l M
ult
ifa
mil
y H
ou
sing S
tock
, 20
11
Sou
rce:
Am
eric
an
Co
mm
unit
ies
Su
rvey
, G
MU
Cen
ter
for
Reg
iona
l A
naly
sis
George Mason University Center for Regional Analysis Page 27
Appendix 2: Tables and Charts

George Mason University Center for Regional Analysis Page 28
1: Residential Housing Units by Jurisdiction
Total
Units
All
Multifamily
Multifamily
Ownership
Multifamily
Rental
Arlington 92,436 54,538 12,287 42,251
Clark 5,564 366 9 357
Culpeper 15,750 1,753 13 1,740
Fairfax County 399,962 101,750 26,647 75,103
Fauquier 22,888 1,389 115 1,274
Loudon 99,761 15,432 3,874 11,558
Prince William 127,170 19,400 3,061 16,339
Spotsylvania 41,282 2,897 71 2,826
Stafford 188,568 18,359 2,059 16,300
Warren 14,203 1,531 61 1,470
Alexandria 64,217 38,888 9,379 29,509
Fairfax City 8,470 2,065 529 1,536
Falls Church 4,807 1,868 431 1,437
Manasses 11,872 2,900 398 2,502
Manasses Park 4,238 776 240 536
Calvert 93,907 10,139 1,062 10,139
Charles 50,305 4,430 368 4,430
Frederick 85,048 10,846 2,520 10,846
Montgomery 355,434 84,109 29,244 84,109
Prince George's 302,091 84,725 9,849 84,725
Washington, DC 260,136 157,434 32,391 125,283
Source: American Community Survey, GMU Center for Regional Analysis

George Mason University Center for Regional Analysis Page 29
2: Washington, DC Regional Building Permits, 2000-2013
Source: American Community Survey, GMU Center for Regional Analysis
-
5,000
10,000
15,000
20,000
25,000
30,000
35,000
40,000
45,000
2000 2001 2002 2003 2004 2005 2006 2007 2008 2009 2010 2011 2012 2013
total Single Family Multifamily

George Mason University Center for Regional Analysis Page 30
3: Change in Housing Type by Age, 2000-2011
Total 15 to 34 Years Old 35 to 64 Years Old 65 and older
Single-
Family
Multi-
family
Single-
Family
Multi-
family
Single-
Family
Multi-
family
Single-
Family
Multi-
family
Arlington 15.5 -0.5 -8.4 21.1 10.2 -2.9 -2.7 -6.1
Clarke 12.4 10.8 -11.5 96.8 19.2 2.4 4.5 -11.3
Culpeper 34.3 21.1 41.8 -24.1 38.6 21.8 18.7 41.4
Fairfax 10.3 5.4 -1.6 5.6 7.2 11.7 23.3 24.3
Fauquier 16.7 0.1 -18.1 -7.1 17.5 -4.4 28.6 16.5
Loudoun 61.9 48.7 20.3 52.7 71.6 74.1 48.9 78.0
Prince William 37.7 17.7 24.3 1.2 33.4 41.3 95.3 16.3
Spotsylvania 27.3 48.1 7.4 133.0 36.7 39.7 48.1 -2.2
Stafford 29.5 48.2 20.2 40.6 33.8 71.2 51.4 57.8
Warren 18.2 14.1 9.6 -2.9 20.6 25.7 14.4 71.5
Alexandria 17.7 -6.8 -7.1 -3.7 17.0 0.0 3.7 5.3
Fairfax City 10.8 -4.3 27.6 -1.6 8.7 -21.7 5.9 84.6
Falls Church City 11.2 -3.8 -28.3 -11.0 21.5 0.2 -13.7 22.1
Manassas -2.4 4.9 -21.9 -16.8 3.2 22.8 -2.3 33.2
Manassas Park 16.9 75.0 -5.4 199.0 17.2 848.6 13.7 120.0
Calvert 18.8 20.9 -16.7 19.7 25.7 71.1 26.3 51.8
Charles 24.2 3.8 -9.7 47.7 23.9 23.5 37.9 6.4
Frederick 20.7 14.3 -4.4 7.3 21.9 39.6 26.6 27.7
Montgomery 9.8 6.7 -15.1 11.3 8.9 12.3 13.6 23.1
Prince George's 9.5 -1.4 -0.7 -13.7 8.0 8.8 18.5 10.0
Washington, DC 10.5 -1.1 5.8 7.9 4.0 7.1 -9.1 -4.2
Total Region 16.3 4.3 0.1 5.6 15.6 10.5 18.3 12.3
Source: American Community Survey, GMU Center for Regional Analysis