MULTIDISCIPLINARY CASE STUDY EXAMINATION - … · Mahaweli complex, Samanalawewa and Kukule Ganga...
22
1 Copyright Reserved No. of Pages = 19 MULTIDISCIPLINARY CASE STUDY EXAMINATION NOVEMBER 2009 ADVANCE INFORMATION
Transcript of MULTIDISCIPLINARY CASE STUDY EXAMINATION - … · Mahaweli complex, Samanalawewa and Kukule Ganga...

1
Copyright Reserved
No. of Pages = 19
MULTIDISCIPLINARY CASE STUDY EXAMINATION
NOVEMBER 2009
ADVANCE INFORMATION
2
Leading a new beginning; Domestic dynamism
Power in Sri Lanka The Sri Lankan power sector has been functioning to achieve its goal: sustainable
development and reliable delivery of energy resources, over a history of more than hundred years. The government department for electrical undertakings was established in 1926 for electricity generation and transmission. Later, the Ceylon Electricity Board (CEB) was established, CEB was entrusted with the responsibility of generation, transmission and distribution of electric power. Subsequently, the government established the Lanka Electricity Company Limited (LECO) to co-operate in the electricity distribution function in the outer suburbs of Colombo and selected areas in the Western and Southern parts of the country. At present, the CEB and independent power producers participate in generation of electricity. The main system operator is CEB, power generated by the independent power producers is procured by CEB under purchase agreements. Power and energy sector in the Colombo Stock Exchange includes 03 public limited companies of which two are on the main board. The other company has listed their debt securities only. Key market drivers or barriers applicable for the power and energy sector can be divided into several categories including policy, regulatory, business, and infrastructure. The Government has enacted several policies to encourage foreign investment and infrastructure development. The foreign investors can obtain a reasonable level of revenue tax holidays. The Government goal for future electricity generation is to use the least cost source, CEB supports using renewable electricity as a part of the generation mix, as evidenced by their investment in wind resource assessment.
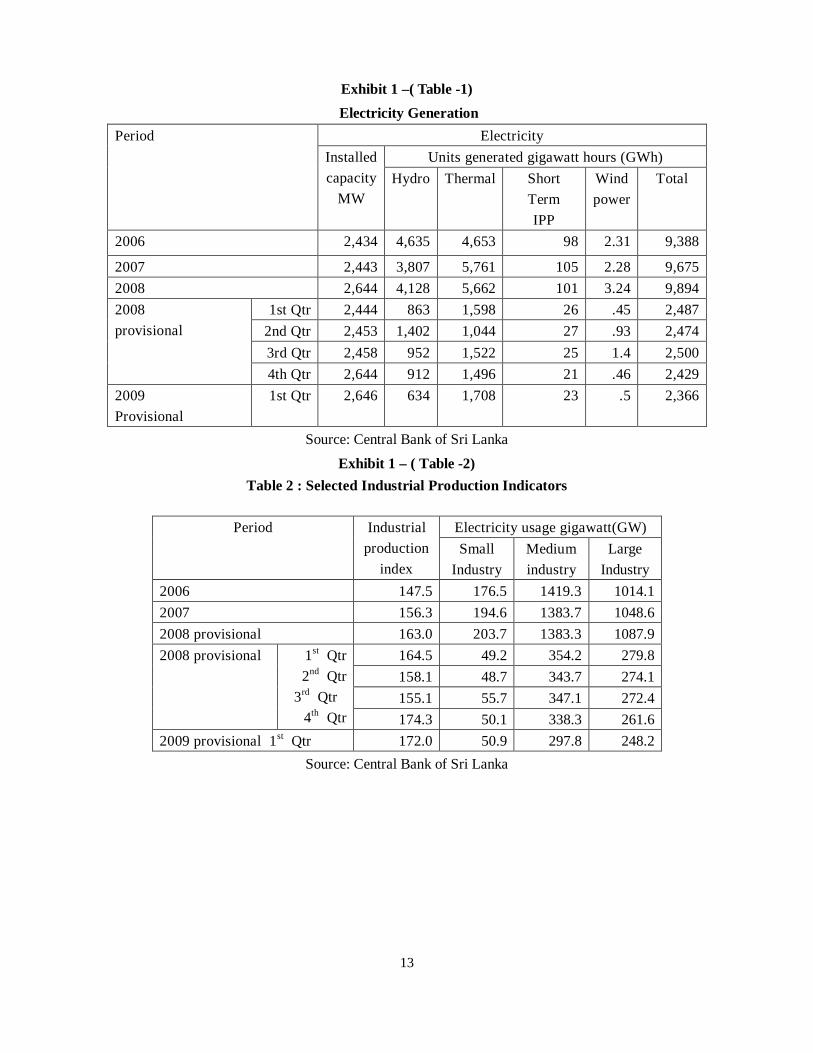
Sri Lanka has some of the highest electricity costs in Asia. The country did not own any fossil fuel resources for its history. All fossil fuel resources are imported which consume about 15% of the export earnings. The Exhibit – 1 ( Table 1) indicates that the thermal power contribution for the national supply has been higher than hydro power. Thermal electricity generation consumes the fuel imports considerably. Thus, recent increases in natural gas prices, the chief fuel used by electric utilities, had stimulated considerable interest in alternative energy investments. The hydro power generation is with its inherent limitations; availability of water reserves. The total exploitable hydropower potential of Sri Lanka is estimated to be about 2000

3
MW. The country receives satisfactory rainfall amounting to 5000 mm in the wet zone and 1000 mm in the dry zone averaging about 2000mm. A good portion of the central highlands, with an elevation ranging from 300m – 2000m, receives the highest rainfall and the rugged hilly terrain provides a suitable environment for harnessing hydro power at large, small and micro levels. The average solar insolation in most parts of the country exceeds 5120 watt hours m2 per day. Wind speeds of 12km hour (3.3 m/s) at 40 meters have been recorded in the southern coastal belt. A recent CEB research report confirms an average wind speeds around 6 – 6.5 m/s and notes that there is a mismatch between the wind speed variation and the daily as well as annual demand for additional generation. A recent consultant report has reported that commercially exploitable wind resources would amount to 250 MW of power. The countries that use wind power for number of years have experienced that wind power are still not competitive on price with fossil fuel power and may not be for years.
Power generation in Sri Lanka has been limited to hydro and thermal energy sources. The total power generated in 2008 stood at 9,894 GWh and the total installed capacity stood at 2,644 MW. (See Exhibit 1 – Tables 1, 2 & 3 for Electricity Generation, Selected Industrial Production Indicators and current Tariff Structure). Hydro power has been the main resource utilised for electrical energy generation in Sri Lanka; CEB’s existing power generating capacity is predominantly based on hydro power. Hydro power stations in the country generated 42% of the electricity consumption in the year 2008. CEB holds approximately two-thirds of the total capacity; the balance is of private producers. Even though private sector participation in generation of electricity was allowed, the transmission and distribution of electricity still remains a state-owned monopoly in Sri Lanka. According to records of CEB, there were 4,088,900 domestic, religious, general and industrial consumers in 2008. The Independent Power Producers’(IPP) contribution has been increasing over the years. Initially, private sector investments were limited to a few small-scale off-grid hydro power projects. Thermal power plants have made a higher contribution in comparison to hydro power plants and the contribution of wind power has been minimal (wind farms contributed about 3 GWh to the national grid in 2008). The national hydroelectric system consists of the Laxapana complex, Mahaweli complex, Samanalawewa and Kukule Ganga plants with a capacity of 1,185 MW of electricity. Several other CEB owned and privately owned small hydro power stations also contribute to the national grid totaling a capacity of approximately 170 MW. However, the generation of hydroelectricity depends not only on the effective installed capacity but also on the rainfall pattern in the catchment areas. Rainfall has shown a steady decline throughout 2009 and hydro storage by end February 2009 was 3.5 GWh, down from 7 GWh for the same period in 2008, being just 1.5 GWh away from reaching 2 GWh, considered the critical level in hydropower generation. A specialist said that 2008/09 also recorded the lowest inflow (rainfall)

4
to hydro reservoirs during the period from October to February for the last five years. Inflow was just over 1,000 GWh down from 1,600 GWh in 2007/08 and less than half of the inflow recorded in 2006/07, which was 2,250 GWh. Presently the daily electricity requirement of the country stands at 1.9 GWh out of which one third is contributed by hydropower projects and the rest by thermal power plants. Sri Lanka’s average consumption is 400 kilo Watt hours per person per annum and for the country to elevate itself to being a middle-income level country like Malaysia, power consumption should be around 2,000 kWh per capita per annum. The shortfall is said to be short-lived and with the government anticipating 100 percent electrification of the North in two or three years time, the demand is set to be on the rise soon. The Government has taken steps to strengthen the country’s power sector to meet future demand; the new Sri Lanka Electricity Act No. 20 of 2009 passed in April 2009 operates as a regulatory advancement to future restructuring of the industry. The demand for electricity continues to rise and is expected to grow rapidly following the end of the three decade long civil war. According to CEB the electricity demand and generation is expected to increase at a Compounded Annual Growth Rate (CAGR) of 8.6% and 8.4% respectively within the next decade. This growth in demand is projected based on forecast economic growth taking into account the increase in industrial sector electricity consumption (see Exhibit 1- Table - 2), rise in the number of electrified households and demand increases of each individual household with improving disposable incomes. Therefore, it is required to generate an additional output of 22,478 GWh by the year 2022. Based on the Plant Load Factor of 58.6% achieved in 2008, this additional generation requirement translates into approximately, 4,380 MW additional capacity.
Domestic Energy (Private) Limited The global energy crisis today is unprecedented; the growing demand and limited power sources pushes the price further. As the cost of fossil fuel boosts, the search for alternative cost effective and environment friendly energy sources has intensified. Domestic Energy (Private) Limited (DEL), based in Colombo, was initiated with a similar objective. DEL is a subsidiary of Matrix PLC and was incorporated in 1990. DEL sought to achieve long-term growth through the development of energy projects domestically. Its project portfolio consists of domestic projects with a gross capacity of 200 megawatts (MW) of electricity. Dr. Pitawala, the Chairman of Matrix PLC and DEL, is also the Chief Executive Officer of the Group. He has over 20 years of management experience. Two decades ago, the founders of DEL had a vision of utilising Sri Lanka’s multiple sources of renewable energy to deliver emission free power and contribute towards the nation’s development. This vision became a reality and DEL has been growing year by year. The vision and mission of the company have been stated as follows in the annual report
5
for the year 2008/09;
Vision ‘To be a significant producer of energy for the sustainable economic development of Sri Lanka’
Mission ‘To generate the maximum amount of electricity with minimal environmental pollution by optimizing operational efficiencies of our assets.’
Initially, DEL focused on the generation of electricity through small scale hydro-electricity plants. However, as the projects’ sustainability depends on rainfall in the catchment area, DEL has focused on alternative sources. Currently DEL operates three hydro power plants and four thermal plants. Two of these thermal plants and one hydro plant are joint ventures. The company’s typical equity ownership in each of these projects was 30-50 percent. The board of DEL consists of two independent directors - an engineer and a licensed surveyor, four non-executive directors and a managing director who is an Associate Member of the Institute of Chartered Accountants of Sri Lanka (ICASL). Ms. Dinesha Handagoda, the head of finance, is also a member of a professional management accounting body. She counts over four years post qualifying experience as an accountant with two years experience in the power sector. Matrix PLC, DEL’s parent, was established in 1960. Matrix PLC’s operations have reported marginal losses over the recent past. Matrix has been looking to reposition itself in new, higher growth markets. For the six months ending September 30, 2009, the company reported a significant loss. The CEO is of the opinion that some of the strong products of Matrix have become non-attractive and therefore should change now to meet the changing requirements of the market. CEO stated his view: “Strengthening the group by discovering new business opportunities, markets, products, restructuring or abandonment of existing operations to be brought immediately. Being in the post war developing era, Matrix should do better than ever. Therefore, the country’s markets have to be studied and the company should adapt quickly.” However, Irrespective of the group performance, DEL has done well during the past, except for the divested investment ‘Solar Operation’ as the reported profit was lower than expectations (see Exhibit 2 for extracts of financial information). The total output of DEL is sold to Ceylon Electricity Board (CEB) under purchase agreements. DEL also enjoyed a Tax exemption period up to year of assessment 2007/08. The

6
Company is liable for income tax from 2008/09 as per the Second Schedule of the Inland Revenue Act, No. 10 of 2006. The Beddegama (Kandy) Mini Hydro Power plant was established in 2002, operates a capacity of 2.4 MW. The investment was $ 998,000 for plant, civil works, utilities and vehicles. This small hydro power plant which is fed by the Gangamulla Oya has a tenure of twenty years from the date of commencing commercial operations. The fulltime staff is headed by an experienced Plant Supervisor. Rainfall and the resulting water flow are the most important variables of a hydro power project. A Hydrology study carried out, based on 25 years of rainfall data in the upper catchment areas, reported an average annual rainfall of 3,000 mm. Dr. Pitawala is more concerned about social responsibility and adequate measures have been taken within the vicinity of all the power plants to control impact to the environment. Conservation of water is done through rain water harvesting lakes built and maintained in the power plant premises. One of the thermal power plants owned by DEL is located 150km away from Colombo, in the outskirts of Puttalam. This project is a joint venture between DEL and Puttalam Limited and is operated and maintained by the latter. Dividend payments from this joint venture have been restricted for 6 years by Agreement. The 90 MW power plant was commissioned in September 2004 at a cost of USD 62 Million. This plant was setup on a Build-Own-Operate basis under a fifteen year power purchase agreement with the CEB and is obligated to generate and feed the national grid a minimum guaranteed energy supply of 400 GWh on an annual basis. Heavy furnace oil which is the main fuel source for the power plant is supplied by the Ceylon Petroleum Corporation under a twenty year fuel supply agreement. The managing director has classified the executives into teams giving independence and objectives for each team. This arrangement was introduced by him in 2001 and has been a successful strategy which created synergy. Dr. Pitawala has appreciated both this strategy and the active five ‘S’ system implemented in 2002. The power houses and construction sites have been managed effectively after implementation of the concept. The standardized work places of DEL have been given the appropriate recognition by the national chamber in 1998 and DEL won a trophy for effectiveness. The three management development teams of the managing director are comprised of:
A. The Development Team, which identified, created, and managed business opportunities.
B. The Finance and Accounting Team, which obtained all necessary funding for projects and supported the overall financial needs of the Company.
C. The Venture and Asset Management Team, which oversaw the construction and operation of projects. Ms. Handagoda, in group B above, had argued that past project ownership structure of

7
DEL has produced less opportunity for development. She had considered putting together an all-equity finance plan. Her suggestion is to apply a minimum of 75:25 ownership structure between DEL and venturers. This would also expedite government approvals and the building process. Equipment vendors, such as General Electric and Westinghouse, and Coal vendors such as Holmes Coal and Studland PLC. had been cited in the press for their eagerness to invest in and open up new markets. Dr. Pitawala and a team of executives visited Holmes Coal and Studland PLC., based in Greenfield, England recently. After meetings with the executives, Holmes Coal, have expressed their willingness for a business partnership, as coal power is establishing itself in Sri Lanka. Holmes Coal holds substantial coal reserves and mining operations in the United Kingdom. In recent years, they have had to contend with the oversupply and low price of Central Appalachian coal. The Chairman of Holmes Coal mentioned in his interim report for 2009 “Across the world, the coal market has continued to see great volatility in the first half of 2009 as business and consumers adapt to the changed economic environment. In Europe, falling market demand for electricity has left generators with fuel commitments in excess of current requirements. In the coal market in particular, with very low gas pricing encouraging gas burn, demand for thermal coal in the short-term has been particularly affected. Prices, especially for near-term deliveries, have therefore fallen, although the prices for deliveries in 2010 and beyond continue to remain relatively strong and reflect the positive long-term demand and price for coal.” (see Exhibit 3 for more details).These pressures resulted in a steady consolidation and downturn throughout the industry. Consequently, Holmes Coal was looking to reposition itself in new, higher growth markets. Additionally, six investment funds (public and private), with a focus solely on Asian infrastructure, had recently raised more than $ 100 billion. However, Handagoda believed in domestic ventures, she reminded herself of the principal reasons to rely on the project-financing structure that she had used so many times before. These reasons included:
1. Elimination of, or limitation on, the recourse nature of the financing of a project, 2. Off-balance sheet treatment of debt financing, 3. Leverage of debt to avoid dilution of existing equity, 4. Avoidance of restrictive covenants in other debt or equity arrangements that may
preclude project development, and 5. Arrangement of attractive debt financing and credit enhancement, available to the
project itself, but which would be unavailable to the project sponsor as a direct loan. Admittedly, the advantages and disadvantages would be determined by the unique circumstances underlying the project. She knew that there would be a constant tension among the various
8
parties involved with respect to risk allocation, risk assumption, and risk avoidance.
Alternative Energy Sources Today’s wind energy business is a child of OPEC and Western governments. Concerns
about American dependence on foreign oil and the environmental damage caused by the use of fossil fuels have encouraged creation of energy from renewable sources including wind power. A Research study carried out by a leading University in Sri Lanka has identified wind power as one of several prospective renewable sources for power generation in Sri Lanka. Sri Lanka has considerable available land with wind resource potential sufficient for development; however, the near-term potential wind power capacity expansion is limited by the electricity transmission infrastructure. Wind power economics have improved dramatically over the past two decades, due primarily to the use of ever-larger turbines. The energy produced by a turbine is proportional to the cube of the wind speed and the square of the turbine’s blade length. The gradual migration from turbines with blade diameters of 10 meters in the 1980s to diameters of 50 meters common in the 2000s have produced a 55-fold increase in power output, partly because the area swept by the blade is 25 times larger and partly because wind speed increases with blade altitude. Reflecting additional benefits of better turbine design, location, and computerized controls, the cost of wind-generated power has fallen some 90 percent in the past 20 years. Despite these improvements most wind power sources are still not competitive on price with fossil fuel power and may not be so for years. According to data from the International Energy Agency (IEA) in Paris, the cost of electricity from coal-fired plants is 2/3rd of the cost of natural-gas-fired plants per kilowatt-hour. Suzlon Energy Ltd., the world’s fifth leading and India’s largest wind turbine manufacturer has already entered the Sri Lankan market, for supply of units of Suzlon’s S64 – 1.25 MW wind turbines to Kosala Limited. Kosala Group is a diversified business conglomerate with businesses ranging from construction machinery, automotives, infrastructure development, tea, haulage to mining. (see Exhibit 4 for comparatives of competitive companies.) The group has an established presence in the clean energy space with investments in mini-hydro projects. In July 2009, Sustainable Environment Authority had issued two energy permits to prospective wind power plants.
A study on the potential of biogas from biomass sources (Human waste, Municipal solid waste, Landfills, Livestock waste, Agricultural waste, Plantation industries) in Sri Lanka carried out by Intermediate Technology Group (Sri Lanka) estimates a total power generation potential of 288 MW of which 86 MW is from livestock waste. A report on biogas potential in Sri Lanka, prepared by the Ministry of Non Conventional Energy, India, estimates 3600 million m3 annum with the possibility of 3 million family-sized bio gas plants.

9
In order to meet the increasing demand from industrial and agricultural development, the government started the Norochcholai Coal Power Plant in the North Western Province. A number of social and community issues went on for years delaying the project; however the project was started in the national interest. Phase I of the project is a 300 MW coal fired thermal power plant, with infrastructure planned for a 900 MW power plant in the future, at a total estimated cost of US$ 455 million to be completed by 2011. Phases II and III expansion would be 600 MW and Sri Lanka has entered into an agreement with the Chinese Government recently to commence the second and third phases of the Norochcholai Coal Power project. The Exim Bank of China has provided a loan of US$ 891 million for the second and third phases of the project. The Norochcholai Plant is the only coal power plant project in the country. According to a senior Chinese Site Engineer, nearly 900 Chinese nationals including engineers, helpers, welders and fitters are employed on the project, with a few Sri Lankan engineers providing consultancy services for the project. It was reported recently that consignments of coal to generate power will be imported from three countries under the supervision of Lanka Coal Company ( Private) Ltd. “September, 2009-Sri Lanka has invited bids to supply 2.4 million metric tons of coal for the country's first coal power plant built by state-run Ceylon Electricity Board, which is scheduled to be commissioned next year.” reported in the ‘Daily Mirror’. Lanka Coal Company (Private) Limited is the coal procurement entity formed especially for the purpose. Although the construction of the Norochcholai Coal Power Plant is not aligned with the global trend of opting for cleaner technologies, this plant is expected to provide a much needed low cost source of power generation and would enable a reduction in the country’s overall cost of energy.
It is expected to generate or purchase power at coal power projects at a unit cost of 7-8 Rupees to CEB which anticipates passing on the price reduction to the consumer. A massive 55 to 60 percent of the power supply was generated by diesel, while the share of hydroelectricity averaged between 40 and 45 percent. Five units can be generated by using a litre of diesel costing Rs. 70 a litre, which means that a unit would be nearly Rs 14. A unit generated from another new energy source promoted by CEB - Liquefied Natural Gas (LNG) would cost Rs 10, which is still 150% more when compared with coal power. Hydropower costs Rupees five to six a unit but after 20 years the cost is just Rs 1 a unit as the operating cost is very low. CEB identified coal as the most economical and feasible power supply next to hydro, as hydro dependability is further threatened by drought and silt while thermal is an expensive source when coal is cheaper and more widely available. However, the average Sri Lankan has had to bear brunt of power politics up to now, as on the one hand projects were delayed time and again under various governments to appease sectarian interests.
Phase I of the Sampur Coal Power Plant is expected to take between three and four years

10
to build. Dr. Pitawala has been negotiating with the government to undertake Phase II of the Sampur Plant and the government has responded positively to the proposal put forward by DEL for the construction of Phase II of the Sampur Coal Power Plant. Negotiations with the government had begun more than six months ago. A joint venture agreement had been signed in March 2009—but this was merely a statement of intent of the parties that they would seek to complete a formal contract. Ceylon Electricity Board and the President of DEL signed the agreement. The Company would undertake the construction and Dr. Pitawala has decided to complete the construction one year before that originally planned. The Sampur Coal Power Plant is a lead project of the Government to enhance economic growth, poverty reduction and ensure balanced regional development through cost effective power sector development. Ms. Handagoda and her colleagues recommended the Sampur project as the best opportunity available to DEL based primarily on the following considerations:
1. Extension Project—the project was an extension of the phase I plant, which is to
be constructed by Indian representatives, which meant that the site is available and some of the necessary infrastructure for the next phase would be planned, designed, or constructed as part of the earlier phase. Ideally, this would translate into a shorter development period and lower development costs.
2. Government Support—A high degree of government support would assist the project in gaining necessary approvals and funding.
3. Electricity Sales—all of the power generated by the project would be purchased by the Government.
4. Project Size and Type—although the exact size of the plant would be determined by the final selection of equipment (chosen to optimize plant economics), this was a well-established, conventional size plant, and it would use proven technology.
5. Project Schedule—the Government had indicated a desire for the project to be operational in 2013. This aggressive schedule would provide high visibility and an early foothold for DEL. Ms. Handagoda’s team has carefully analyzed power projects of a similar nature and
prepared a preliminary forecasting in order to get an idea on the Sampur project. The Exhibit 5 reflects the best estimates available on the project’s initial costs and operational results for the first 15 years of the project. Ms. Handagoda’s team expected a debt coverage ratio of 1.15 and 1.3 in the first and second operating years. The debt coverage would grow up to 1.7 when the project becomes free of debt. The project’s life is more than 15 years and the Company has used a hurdle rate of 15% for past project evaluations.

11
The Economic Outlook The country’s per capita at (current prices) shows a continuous growth and it is
expected to grow further in the post war era. (see Exhibit 6 for per capita consumptions and some of the other economic indicators) The interest rates declined considerably over the past six month period. Nominal interest rates in Sri Lanka have generally closely followed headline inflation as measured by the Colombo Consumer Price Index. During periods of high inflation, nominal interest rates have at times temporarily dipped below inflation, thus yielding a negative real return. Easing inflationary pressure on the economy during 2009 has resulted in policy and market interest rates showing a marked decline. The long-term trend in benchmark market interest rates will depend on government fiscal policy and consolidation and its associated impact on other key macroeconomic variables including inflation. An economist mentioned that with the price pressures abating faster than expected, average inflation is now estimated to be 5% in 2009 rather than the 8% projected. The forecast of 6% in 2010 is maintained. Reflecting weak investment, lower oil prices and reduced demand for inputs for plummeting export activity, imports have dropped rapidly and the trade deficit contracted sharply through the first half of 2009. Given the deterioration in economic conditions, the current account deficit is now estimated to be 3% of GDP in 2009; expanding to 5% in 2010 as economic growth revives.
The growth of Sri Lanka’s listed equity market broadly reflects and is influenced by the performance of the country’s economy and business prospects. The comparative performance of the Colombo Stock Exchange (CSE) against selected regional and international equity markets is depicted in the graph set out below. The performance of the CSE during the recent past has surpassed that of many developed equity markets, including markets in the United States as measured by the S&P 500 Index. The equity market in Sri Lanka has recorded significant growth in the first half of 2009. The ASPI has increased by 60% for the 6 month period ending 30 June 2009, reflecting a rise in total market capitalisation from LKR 489 billion as at end 2008, to LKR 790 billion as at end June 2009. The flow in the CSE indices was primarily fuelled by the ending of the three decade old terrorist insurgency and renewed investor confidence arising therefrom. The above factors have led to the CSE being cited as one of the best performing stock markets in the world.

12
Equity market performance
Figure: mid-year data of All Share Price Index of Colombo Stock Exchange,
BSE 30 of Bombay Stock Exchange and S&P 500 of United States
The end of the civil war has led to an improvement in the business and economic environment. The drop in inflation in the economy during the year 2009 has resulted in a decline in market interest rates significantly. Market liquidity has further improved following the finalisation of an IMF stand-by credit facility which has resulted in a stabilisation of the exchange rate and enhanced capital inflows to the government securities market, thereby exerting further downward pressure on market interest rates across the yield curve. The power and energy sector of the Colombo Stock Exchange has a turnover of more than Rs. 70 million with an average Price to Book Value of 1.4. The sector price earnings ratio is about 38, a higher ratio comparatively. The sector’s response to the market movements as a whole has been low due to the nature of the market and the monopolistic nature in pricing. CSE’s PER, PBV and DY were 13.6, 1.4 and 3.5 respectively by the end of September 2009. An analyst said that Sri Lankan capital market is safe for investors and therefore both domestic and foreign funds are coming to the market. The capitalization of the CSE has now reached one trillion Rupees and the debt market’s daily turnover exceeds Rs. 20 million. He mentioned further, that the investors trust in the capital market enhances business opportunities, leads to many positive developments in industry and the expectation of economic stability for future Sri Lanka.
13
Exhibit 1 –( Table -1) Electricity Generation
Period Electricity Installed capacity
MW
Units generated gigawatt hours (GWh) Hydro Thermal Short
Term IPP
Wind power
Total
2006 2,434 4,635 4,653 98 2.31 9,388
2007 2,443 3,807 5,761 105 2.28 9,675 2008 2,644 4,128 5,662 101 3.24 9,894 2008 provisional
1st Qtr 2,444 863 1,598 26 .45 2,487 2nd Qtr 2,453 1,402 1,044 27 .93 2,474 3rd Qtr 2,458 952 1,522 25 1.4 2,500
4th Qtr 2,644 912 1,496 21 .46 2,429 2009 Provisional
1st Qtr 2,646 634 1,708 23 .5 2,366
Source: Central Bank of Sri Lanka
Exhibit 1 – ( Table -2) Table 2 : Selected Industrial Production Indicators
Period Industrial production
index
Electricity usage gigawatt(GW) Small
Industry Medium industry
Large Industry
2006 147.5 176.5 1419.3 1014.1 2007 156.3 194.6 1383.7 1048.6 2008 provisional 163.0 203.7 1383.3 1087.9 2008 provisional
1st Qtr
2nd Qtr 3rd Qtr 4th Qtr
164.5 49.2 354.2 279.8 158.1 48.7 343.7 274.1 155.1 55.7 347.1 272.4 174.3 50.1 338.3 261.6
2009 provisional 1st Qtr 172.0 50.9 297.8 248.2 Source: Central Bank of Sri Lanka

14
Exhibit 1 – ( Table – 3) Table – 3: Tariff Structure
Tariff Block
Price Rs. Per unit
Fixed Charges
0-30 3 60
31-60 4.70 90
61-90 7.50 120
91-120 16.00 180
121-180 16.00 180
181-240 25.00 240
241-600 25.00 240
Over 600 30.00 240 Source: CEB
Exhibit 2 – (Table – 1)
DEL
Income Statement information for five years Rs. millions
08/09 07/08 06/07 05/06 04/05 Revenue Supply of Electricity 9,800 10,300 7,316 5,981 3,241 Delay charges 67 32 12 9 5 9,867 10,332 7,328 5,990 3,246 Cost of electricity generated 8,679 8,734 6,200 4,949 2,439 1,188 1,598 1,128 1,041 806 Other income 26 17 2 1 - Administrative expenses 268 304 194 197 129 Finance cost 616 630 620 550 391 Profit before tax 331 681 316 295 286 Income tax - - - - - Profit for the year 331 681 316 295 286

15
Exhibit 2 – ( Table – 2) DEL
Extracts from Statement of Changes in Equity The year ended 31.3.2009
Rs. millions
Ordinary Share
Capital
Preference Share Capital
exchange Reserve
Overhaul Reserve
Heat Rate & Lube Oil
reserve
Retained Earnings
Balance 1.4.2008 1,880 150 -86 180 234 1,008
Redemption of shares -30
Issue of new shares 80
Profit for the year 331
Dividends -86
Exchange differences -65
Transfers 140 89 -229
Balance 31.3.2009 1,880 200 -151 320 323 1,024
16
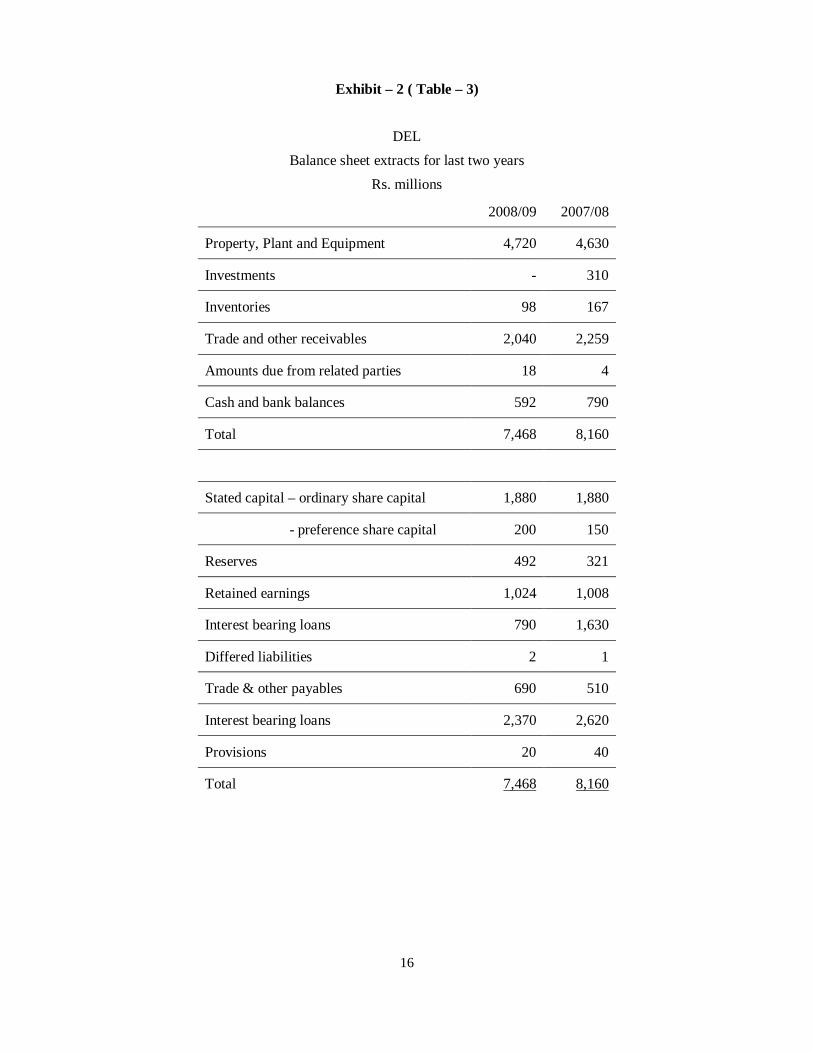
Exhibit – 2 ( Table – 3)
DEL Balance sheet extracts for last two years
Rs. millions
2008/09 2007/08
Property, Plant and Equipment 4,720 4,630
Investments - 310
Inventories 98 167
Trade and other receivables 2,040 2,259
Amounts due from related parties 18 4
Cash and bank balances 592 790
Total 7,468 8,160
Stated capital – ordinary share capital 1,880 1,880
- preference share capital 200 150
Reserves 492 321
Retained earnings 1,024 1,008
Interest bearing loans 790 1,630
Differed liabilities 2 1
Trade & other payables 690 510
Interest bearing loans 2,370 2,620
Provisions 20 40
Total 7,468 8,160
17
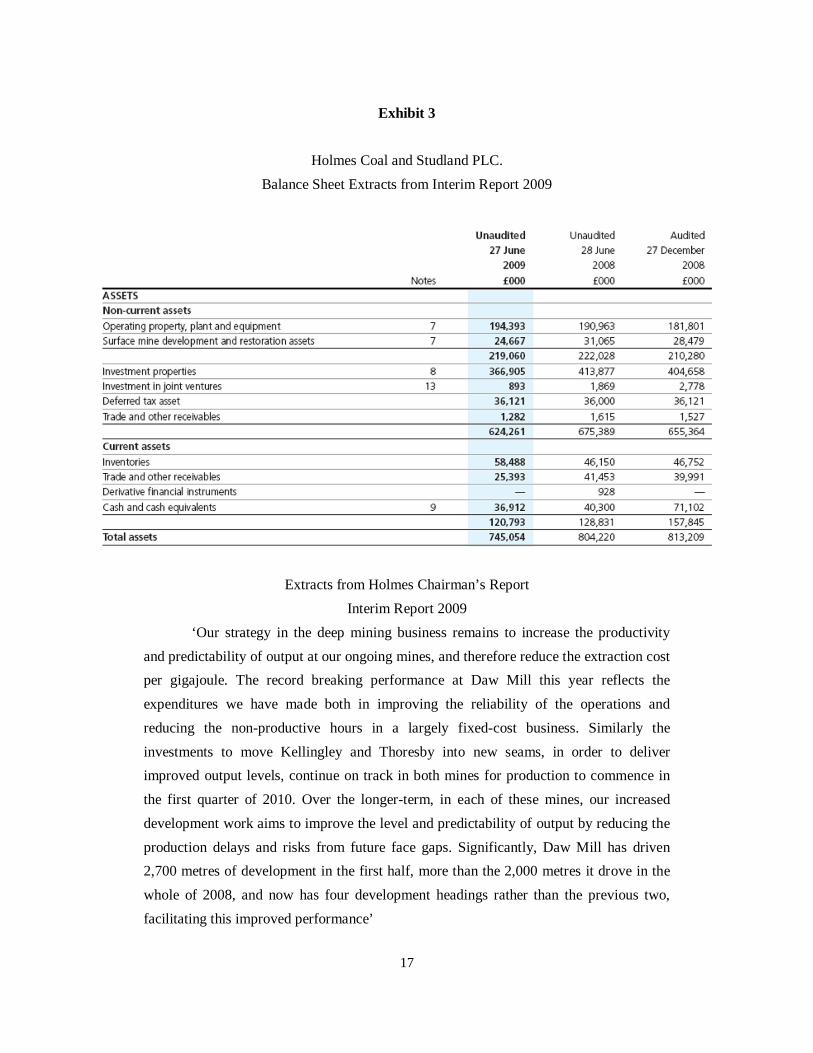
Exhibit 3
Holmes Coal and Studland PLC.
Balance Sheet Extracts from Interim Report 2009
Extracts from Holmes Chairman’s Report Interim Report 2009
‘Our strategy in the deep mining business remains to increase the productivity and predictability of output at our ongoing mines, and therefore reduce the extraction cost per gigajoule. The record breaking performance at Daw Mill this year reflects the expenditures we have made both in improving the reliability of the operations and reducing the non-productive hours in a largely fixed-cost business. Similarly the investments to move Kellingley and Thoresby into new seams, in order to deliver improved output levels, continue on track in both mines for production to commence in the first quarter of 2010. Over the longer-term, in each of these mines, our increased development work aims to improve the level and predictability of output by reducing the production delays and risks from future face gaps. Significantly, Daw Mill has driven 2,700 metres of development in the first half, more than the 2,000 metres it drove in the whole of 2008, and now has four development headings rather than the previous two, facilitating this improved performance’
18
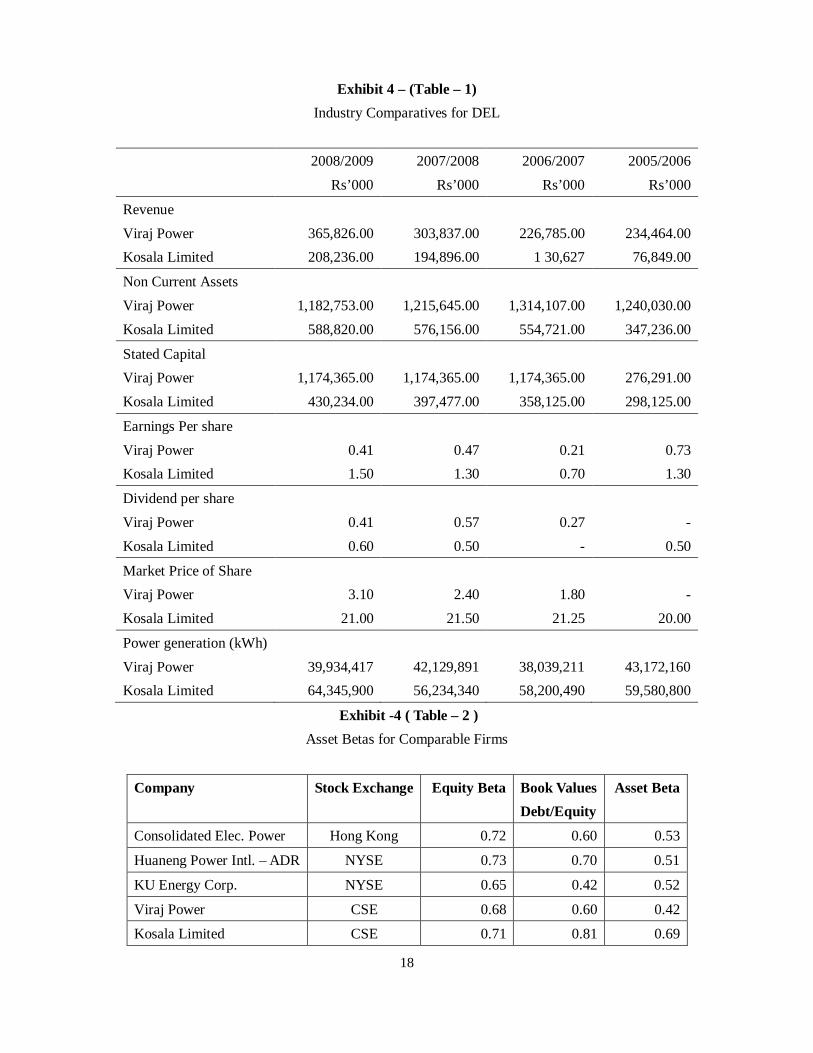
Exhibit 4 – (Table – 1) Industry Comparatives for DEL
2008/2009 Rs’000
2007/2008 Rs’000
2006/2007 Rs’000
2005/2006 Rs’000
Revenue Viraj Power 365,826.00 303,837.00 226,785.00 234,464.00 Kosala Limited 208,236.00 194,896.00 1 30,627 76,849.00
Non Current Assets Viraj Power 1,182,753.00 1,215,645.00 1,314,107.00 1,240,030.00 Kosala Limited 588,820.00 576,156.00 554,721.00 347,236.00
Stated Capital Viraj Power 1,174,365.00 1,174,365.00 1,174,365.00 276,291.00 Kosala Limited 430,234.00 397,477.00 358,125.00 298,125.00
Earnings Per share Viraj Power 0.41 0.47 0.21 0.73 Kosala Limited 1.50 1.30 0.70 1.30
Dividend per share Viraj Power 0.41 0.57 0.27 - Kosala Limited 0.60 0.50 - 0.50
Market Price of Share Viraj Power 3.10 2.40 1.80 - Kosala Limited 21.00 21.50 21.25 20.00
Power generation (kWh) Viraj Power 39,934,417 42,129,891 38,039,211 43,172,160 Kosala Limited 64,345,900 56,234,340 58,200,490 59,580,800
Exhibit -4 ( Table – 2 ) Asset Betas for Comparable Firms
Company Stock Exchange Equity Beta Book Values Debt/Equity
Asset Beta
Consolidated Elec. Power Hong Kong 0.72 0.60 0.53
Huaneng Power Intl. – ADR NYSE 0.73 0.70 0.51
KU Energy Corp. NYSE 0.65 0.42 0.52
Viraj Power CSE 0.68 0.60 0.42
Kosala Limited CSE 0.71 0.81 0.69

19
Exhibit 5 – ( Table 1)
Project cost and financing summary
Rs. Millions
Project cost summary
Construction cost 18,320
Cost escalation 3,233
Subtotal 21,553
Interest during construction 2,396
Total 23,949
Financing summary
Total debt 18,268
Equity 5,681
23,949
Operating Assumptions Installed Plant Capacity, MegaWatts 300 Major Overhaul, (% of total cost) 1% Start of Construction 2010 Construction Period, months 36 Year of Operation 2013 Number of Staff 200 Generation Efficiency 92.2% Coal Consumption, tons/hour 136.9 *Coal Cost, Rs./ton 5,000
* Subject to world thermal coal market price fluctuations

20
21
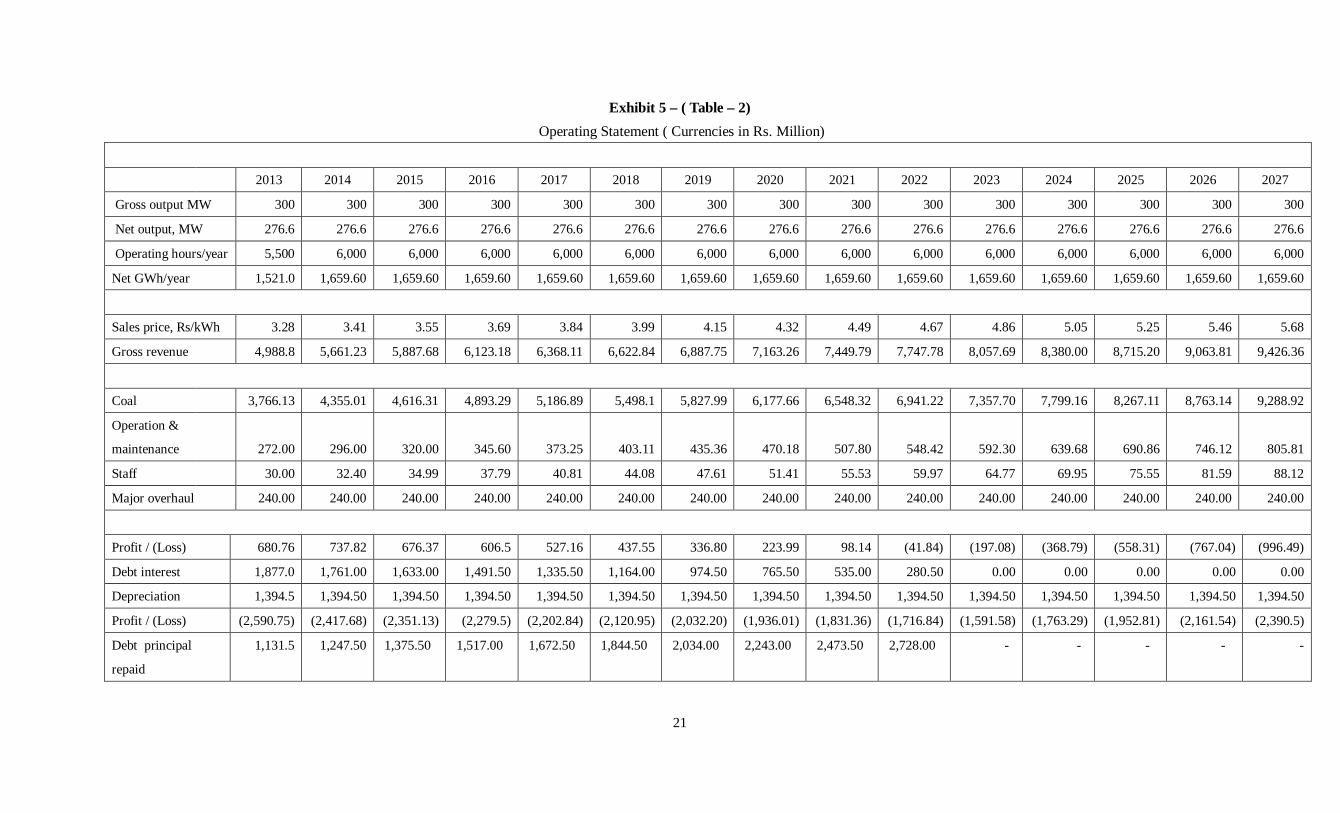
Exhibit 5 – ( Table – 2) Operating Statement ( Currencies in Rs. Million)
2013 2014 2015 2016 2017 2018 2019 2020 2021 2022 2023 2024 2025 2026 2027
Gross output MW 300 300 300 300 300 300 300 300 300 300 300 300 300 300 300
Net output, MW 276.6 276.6 276.6 276.6 276.6 276.6 276.6 276.6 276.6 276.6 276.6 276.6 276.6 276.6 276.6
Operating hours/year 5,500 6,000 6,000 6,000 6,000 6,000 6,000 6,000 6,000 6,000 6,000 6,000 6,000 6,000 6,000
Net GWh/year 1,521.0 1,659.60 1,659.60 1,659.60 1,659.60 1,659.60 1,659.60 1,659.60 1,659.60 1,659.60 1,659.60 1,659.60 1,659.60 1,659.60 1,659.60
Sales price, Rs/kWh 3.28 3.41 3.55 3.69 3.84 3.99 4.15 4.32 4.49 4.67 4.86 5.05 5.25 5.46 5.68
Gross revenue 4,988.8 5,661.23 5,887.68 6,123.18 6,368.11 6,622.84 6,887.75 7,163.26 7,449.79 7,747.78 8,057.69 8,380.00 8,715.20 9,063.81 9,426.36
Coal 3,766.13 4,355.01 4,616.31 4,893.29 5,186.89 5,498.1 5,827.99 6,177.66 6,548.32 6,941.22 7,357.70 7,799.16 8,267.11 8,763.14 9,288.92
Operation &
maintenance
272.00
296.00
320.00
345.60
373.25
403.11
435.36
470.18
507.80
548.42
592.30
639.68
690.86
746.12
805.81
Staff 30.00 32.40 34.99 37.79 40.81 44.08 47.61 51.41 55.53 59.97 64.77 69.95 75.55 81.59 88.12
Major overhaul 240.00 240.00 240.00 240.00 240.00 240.00 240.00 240.00 240.00 240.00 240.00 240.00 240.00 240.00 240.00
Profit / (Loss) 680.76 737.82 676.37 606.5 527.16 437.55 336.80 223.99 98.14 (41.84) (197.08) (368.79) (558.31) (767.04) (996.49)
Debt interest 1,877.0 1,761.00 1,633.00 1,491.50 1,335.50 1,164.00 974.50 765.50 535.00 280.50 0.00 0.00 0.00 0.00 0.00
Depreciation 1,394.5 1,394.50 1,394.50 1,394.50 1,394.50 1,394.50 1,394.50 1,394.50 1,394.50 1,394.50 1,394.50 1,394.50 1,394.50 1,394.50 1,394.50
Profit / (Loss) (2,590.75) (2,417.68) (2,351.13) (2,279.5) (2,202.84) (2,120.95) (2,032.20) (1,936.01) (1,831.36) (1,716.84) (1,591.58) (1,763.29) (1,952.81) (2,161.54) (2,390.5)
Debt principal
repaid
1,131.5 1,247.50 1,375.50 1,517.00 1,672.50 1,844.50 2,034.00 2,243.00 2,473.50 2,728.00 - - - - -

(22) |
Exhibit 6 – (Table – 1) Electricity Consumption Per Capita
Country kWh p.a.
UK 6,756
USA 14,240
Japan 8,459
India 618
China 1,684
Pakistan 564
Maldives 540
Singapore 3,612
Sri Lanka 420
Malaysia 2,381
Exhibit 6 – ( Table -2) Sri Lankan Economic Indicators
Unit
2005
2006
2007
2008
Gross domestic product (GDP), constant prices Rs. Billions 1,941.6 2,090.5 2,232.6 2,365.5
GDP, current prices $ Billions 24.4 28.2 32.3 39.6
GDP per capita, current prices $ 1,244.0 1,430.2 1,623.2 1,971.8
Market Price Earnings Ratio Times 12.4 13.9 11.6 12.1
Treasury Bill Yield 12 months % p.a. 10.37 12.96 19.96 19.12
Treasury bonds 1+ Years % p.a. 13.4 13.62 19.34 21.05
SLIBOR % p.a. 14.2 14.73 21.75 13.74
Commercial banks deposit rates AWDR % p.a. 6.25 7.6 10.31 11.63
Source: Central Bank of Sri Lanka