SAJO, AND MOHAMMED (2004). Nig. J. Biotechn. 15 (I) 72 -82 72
Upload
hoangkhuongCategory
view
214download
0
This article was downloaded by: [Jean-Michel Jaquet]On: 11 April 2012, At: 23:44Publisher: Taylor & FrancisInforma Ltd Registered in England and Wales Registered Number: 1072954 Registeredoffice: Mortimer House, 37-41 Mortimer Street, London W1T 3JH, UK
International Journal of RemoteSensingPublication details, including instructions for authors andsubscription information:http://www.tandfonline.com/loi/tres20
Multi-temporal and multi-sourcecartography of the glacial cover ofNevado Coropuna (Arequipa, Peru)between 1955 and 2003Walter Silverio a & Jean-Michel Jaquet ba Climatic Change and Climate Impacts Research Group, Institutefor Environmental Sciences, University of Geneva, CH-1227,Carouge, Geneva, Switzerlandb UNEP/DEWA-Europe/GRID-Geneva, CH-1219, Geneva,Switzerland
Available online: 05 Apr 2012
To cite this article: Walter Silverio & Jean-Michel Jaquet (2012): Multi-temporal and multi-sourcecartography of the glacial cover of Nevado Coropuna (Arequipa, Peru) between 1955 and 2003,International Journal of Remote Sensing, 33:18, 5876-5888
To link to this article: http://dx.doi.org/10.1080/01431161.2012.676742
PLEASE SCROLL DOWN FOR ARTICLE
Full terms and conditions of use: http://www.tandfonline.com/page/terms-and-conditions
This article may be used for research, teaching, and private study purposes. Anysubstantial or systematic reproduction, redistribution, reselling, loan, sub-licensing,systematic supply, or distribution in any form to anyone is expressly forbidden.
The publisher does not give any warranty express or implied or make any representationthat the contents will be complete or accurate or up to date. The accuracy of anyinstructions, formulae, and drug doses should be independently verified with primarysources. The publisher shall not be liable for any loss, actions, claims, proceedings,demand, or costs or damages whatsoever or howsoever caused arising directly orindirectly in connection with or arising out of the use of this material.

International Journal of Remote SensingVol. 33, No. 18, 20 September 2012, 5876–5888
Multi-temporal and multi-source cartography of the glacial cover ofNevado Coropuna (Arequipa, Peru) between 1955 and 2003
WALTER SILVERIO† and JEAN-MICHEL JAQUET*‡†Climatic Change and Climate Impacts Research Group, Institute for Environmental
Sciences, University of Geneva, CH-1227 Carouge, Geneva, Switzerland‡UNEP/DEWA-Europe/GRID-Geneva, CH-1219 Geneva, Switzerland
(Received 27 November 2009; in final form 6 February 2012)
This study reports on the glacial cover evolution of the Nevado Coropuna between1955 and 2003, based on Peruvian topographic maps and satellite images takenfrom the Landsat 2 and 5 multispectral scanner (MSS), Landsat 5 ThematicMapper (TM) and Landsat 7 (ETM+). The normalized difference snow index hasbeen applied to these images to estimate the glacierized area of Coropuna. Thesatellite-based results show that the glacier area was 105 ± 16 km2 in 1975 (Landsat2 MSS), which then reduced to 96 ± 15 km2 in 1985 (Landsat 5 MSS), 64 ± 8 km2 in1996 (Landsat 5 TM) and 56 ± 6 km2 in 2003 (Landsat 5 TM). Altogether, between1955 and 2003, Coropuna lost 66 km2 of its glacial cover, which represents a meanretreat of 1.4 km2 year−1, that is, a loss of 54% in 48 years (11% loss per decade).The maximum rate of retreat occurred during the 1980s and 1990s, a phenomenonprobably linked with the pluviometric deficit of El Niño events of 1983 and1992.
1. Introduction
According to the first glacier inventory of Peru, in 1970, the country had a glacialsurface area of 2041.85 km2, with Cordillera Ampato and Coropuna account-ing for 146.73 and 82.6 km2 (Hidrandina 1988) of the surface area, respectively,that is, 7.2% and 4.0% of the national glacial cover, respectively. Kaser andOsmaston (2002) reported that more than 70% of the tropical glacier areas (e.g.the Andes, East Africa and Irian Jaya, Indonesia) are concentrated in the Peruviancordilleras.
At all latitudes, disregarding their type, glaciers are sensitive to climatic conditions(Hastenrath 1992, Sigurdsson and Jónsson 1995) and serve as indicators of regionalclimate change (Hall 2002). Globally, and with the exception of a few glaciers, moun-tain glaciers have been retreating since the end of the ‘Little Ice Age’ (Hall et al.1995a). Following the more recent global climatic trend, tropical glaciers retreatedsubstantially during the 1980s and 1990s (Kaser et al. 2003). This tendency wasconfirmed in the Peruvian tropical glaciers of the Cordillera Blanca (Silverio andJaquet 2005).
*Corresponding author. Email: [email protected]
International Journal of Remote SensingISSN 0143-1161 print/ISSN 1366-5901 online © 2012 Taylor & Francis
http://www.tandfonline.comhttp://dx.doi.org/10.1080/01431161.2012.676742
Dow
nloa
ded
by [
Jean
-Mic
hel J
aque
t] a
t 23:
44 1
1 A
pril
2012

Glacier cover mapping 5877
(a) (b)
Figure 1. Location of the study site: (a) within the national territory of Peru; (b) part of theLandsat 5 TM image, band 2, 4 September 2003, with the climate stations around Coropuna(white frame) (georeferenced to the Universal Transverse Mercator, zone 18 south).
The glaciers of Nevado Coropuna represent the most important freshwater ‘reser-voirs’ for the Arequipa region (figure 1(a)). The melting of the glaciers mitigates thelack of water during the dry season or possible abnormal climatic events (Peduzzi et al.2010). Francou and Wagnon (1998) reported that the disappearance of Coropunawould result in the loss of a fundamental water resource, used for farming activitiesand water supply to the cities.
In Peru, the last decades of the twentieth century were marked by demographicgrowth, coinciding with a reduction in hydrological reserves. During the sameperiod, there was an increased demand for drinking water for the population andfor other activities (irrigation, hydroelectric power, etc.), causing conflicts betweenusers. To quote one example, between autumn 2003 and winter 2004, the regionsof Arequipa and Moquegua, located in southern Peru (figure 1(a)), experienced ten-sions for the control of the water reserves of the Tambo Grande dam. Fortunately, thisconflict was diffused by central government negotiation. This tense context thus jus-tifies the need for carrying out an inventory of the available hydrological resourcesand for planning of their long-term management in the perspective of sustainabledevelopment.
This study is part of the project, Impact assessment of climatic change on Coropunaglacier (Peru) and related threats to water supplies, carried out in collaborationwith the German Cooperation Programme (GTZ), the University of Geneva andUNEP/GRID-Europe. We present our results and discuss the approach used for themulti-temporal and multi-data mapping of the Coropuna glaciers, between 1955 and2003. In addition, analyses are made based on precipitation data obtained from theweather station in the Coropuna region as well as El Niño events of 1983 and 1992.
Dow
nloa
ded
by [
Jean
-Mic
hel J
aque
t] a
t 23:
44 1
1 A
pril
2012

5878 W. Silverio and J.-M. Jaquet
2. Study area
Nevado Coropuna is located between 15◦ 25′–15◦ 38′ S latitude and 72◦ 29′–72◦ 46′ Wlongitude in the Cordillera Ampato (Peruvian State of Arequipa; figure 1(a)). TheCoropuna massif is approximately 15 km long from east to west and 8 km wide fromnorth to south (figure 1(b)). It includes several summits that exceed 6000 m above sealevel, with its highest peak reaching 6425 m.
The topographic aspect of Nevado Coropuna is characterized by rather moder-ate slopes (figure 4). The glacier is located on the divide between the Rio Arma andRio Majes watersheds (Hidrandina 1988, part 2, p. 32) and drains entirely into thePacific Ocean (Morales Arnao 1998). Its meltwater is used mainly for agriculture anddrinking purposes.
The study conducted by Hidrandina (1988), based on aerial photographs taken inJune 1962, showed that Coropuna consisted of 17 glaciers covering an area of 82.6 km2
(figure 4). Peduzzi et al. (2010), however, reported that the area of the glaciers wasreduced to 48.1 km2 in 2008.
In the vicinity of tropical glaciers, the climate of the region is characterized byrelatively large daily temperature ranges but small seasonal variations (Kaser andOsmaston 2002). In the Andes, most of the rain falls between December and April,with maximum rainfall during March and February in the north and south, respec-tively (Rome-Gaspaldy and Ronchail 2005). In the Coropuna region, the dry seasonis between May and September, when it rarely rains (Herreros et al. 2009).
3. Data
Although several types of satellite data are available for snow cover mapping (e.g.the Moderate Resolution Imaging Spectroradiometer (MODIS), the Advanced VeryHigh Resolution Radiometer (AVHRR) and the Special Sensor Microwave Imager(SSM/I)), their resolution is too coarse for our purpose, which is why we have cho-sen to work on Landsat imagery (table 1). All images were carefully screened forthe presence of thick and thin clouds by visual interpretation and using the criteriagiven by Dozier (1989) and Riggs and Hall (2002). Three images were provided byUNEP/GRID/DEWA-Sioux Falls (USA). The first image was taken from Landsat2 multispectral scanner (MSS) on 30 July 1975 with a spatial resolution of 57 m.There are some linear artefacts in the data which, however, do not affect the Coropunamountain range. The second image was taken from Landsat 5 MSS on 1 August1985 with a resolution of 57 m. The third image was taken from Landsat 5 Thematic
Table 1. Satellite images.
Type DateResolution (m)
Path/row
Solarelevationangle (◦) Format Georeference
Fresh snowcover
Landsat 2 MSS 30 July 1975 57 03/071 36.7 NLAPS UTM NoLandsat 5 MSS 1 August 1985 57 04/071 39.3 NLAPS UTM NoLandsat 5 TM 31 August 1996 28.50 04/071 43.0 GeoTIFF UTM SomeLandsat
7 ETM+21 June 2002 30 04/071 39.4 GeoTIFF Geographic
then UTMYes
Landsat 5 TM 4 September 2003 30 04/071 49.2 GeoTIFF UTM No
Dow
nloa
ded
by [
Jean
-Mic
hel J
aque
t] a
t 23:
44 1
1 A
pril
2012

Glacier cover mapping 5879
Table 2. Location of the climate stations in the Coropuna region (see also figure 1(b)).
From Coropuna mainsummit
StationLatitude(South)
Longitude(West) Altitude (m)
Period ofobservation Distance (km) Direction
Andagua 15◦ 29′ 36′′ 72◦ 20′ 56′′ 3587 1968–2003 30 EArma 15◦ 24′ 30′′ 72◦ 46′ 00′′ 4270 1964–1986 20 NWAyo 15◦ 40′ 44′′ 72◦ 16′ 12′′ 1956 1968–2003 42 E-SEChichas 15◦ 32′ 40′′ 72◦ 54′ 59′′ 2120 1972–2003 30 WOrcopampa 15◦ 15′ 38′′ 72◦ 20′ 19′′ 3779 1965–2003 45 NESalamanca 15◦ 30′ 00′′ 72◦ 50′ 00′′ 3203 1972–2003 22 W-NWYanaquihua 15◦ 46′ 59′′ 72◦ 52′ 56′′ 3130 1973–1997 37 SW
Mapper (TM) on 31 August 1996 with a resolution of 28.5 m. The first two imageswere taken without clouds being visible, whereas in the third image (31 August1996) some snow spots in the zones surrounding the Coropuna glaciers were vis-ible, which were due to the passage of a storm. Similarly, GTZ-Peru provided animage of Landsat 7 Enhanced Thematic Mapper Plus (ETM+) taken on 21 June2002 with a resolution of 30 m. It was georeferenced (WGS84) and geometricallycorrected using a topographic map (1:100 000 scale) of the National GeographicalInstitute (IGN) of Peru. Clouds, which cover a part of the Nevado Coropuna glaciers,as well as fresh snow cover are visible in the image. The last Landsat 5 TM image(path/row 04/071; 30 m resolution), acquired on 4 September 2003, was provided bythe National Institute for Space Research (INPE, Brazil). Since the image was takenat the end of the dry season, its quality is optimal (containing neither clouds nor freshsnow).
The digital topographic map was provided by the IGN of Peru. It includestwo sheets of national cartography at a scale of 1:100 000 (Cotahuasi: 31-Q andChuquibamba: 32-Q). The map was compiled by stereo-photogrammetric methodsfrom aerial photos taken on 15 July 1955. The original layers were georeferenced intothe geographic coordinate system (latitude/longitude) and contained the topographiccontour lines (50 m level) that discriminate the glacier and nonglacier areas. No debris-covered glaciers were identified on these maps.
In the Coropuna region, there are 14 weather stations. However, for half of them,the records were not continuous and sometimes measurements were available only fora brief period. Leaving these out, we analysed the precipitation data for the remainingseven stations, with monthly data available for over 20 years or more (figure 1(b)):Andagua, located 30 km east from the main Coropuna summit; Arma, at 20 km NW;Ayo, at 42 km E-SE; Chichas, at 30 km W, Orcopampa, at 45 km NE; Salamanca, at22 km W-NW and Yanaquihua, at 37 km SW (see table 2). The evolution of meanannual precipitation between 1964 and 2000 is shown graphically in figure 2.
4. Methodology
4.1 Pretreatment
The topographic map was reprojected onto the universal transverse mercator (UTM)coordinate system (zone 18, south) prior to on-screen digitizing of the glaciers’ lim-its for 1955. Because of the suspected presence of fresh snow, the June 2002 image
Dow
nloa
ded
by [
Jean
-Mic
hel J
aque
t] a
t 23:
44 1
1 A
pril
2012

5880 W. Silverio and J.-M. Jaquet
1400
1200
1000
800
Pre
cip
ita
tion (
mm
)
600
400
200
0
1964
1969
1974
1979
1984
1989
1994
1999
1979
Year
Andagua Arma Ayo Chichas Orcopampa Salamanca Yanaquihua
EI
Niño
1992
EI
Niño
1983
Figure 2. Evolution of mean annual precipitation at the climate stations of Coropuna region.The deficit in precipitation during the 1983 and 1992 El Niño events is clearly shown (see alsotable 5).
Table 3. Image geometric correction and RMS errors.
Image (date) Image for resample Resolution (m) RMS error (pixels)
MSS 30 July 1975 1 August 1985 57 1.0MSS 1 August 1985 21 June 2002 57 1.4TM 31 August 1996 21 June 2002 30 3.0TM 4 September 2003 21 June 2002 30 3.4
was not considered for further analysis. Instead, it was reprojected onto the UTMcoordinate system (zone 18, south) and used as a template for the geometric cor-rection of the other images because the topographic maps were not all available forthat purpose. Geometric correction was performed on subimages covering Coropuna(30 km × 23 km), using seven control points, a first-degree polynomial transformationand nearest-neighbour resampling. Considering the relative inaccuracy of the 1:100000 scale map used for geo-correction of the June 2002 image, the root mean square(RMS) errors (table 3) were acceptable.
4.2 Mapping of the glacial extent
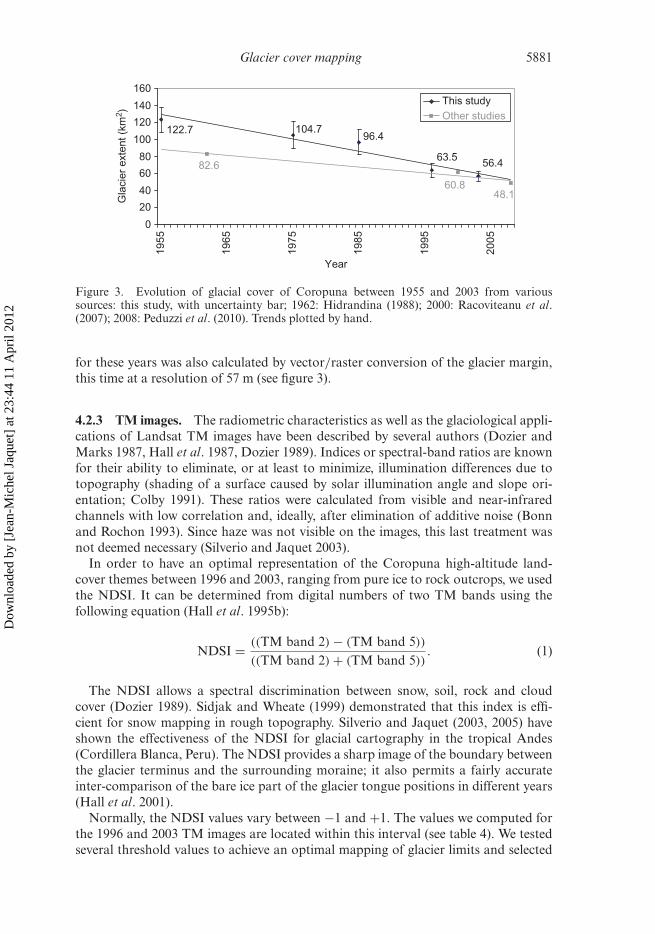
4.2.1 Topographic map. The glacier limits were manually delineated by on-screendigitizing, resulting in a polygon of surface area S. The uncertainty affecting theglacier area S was estimated by rasterizing the vector limit at a resolution of 100 m andcomputing the surface area s of this strip, yielding the expression S ± s (see figure 3).
4.2.2 MSS images. Since the MSS does not have the same radiometry as the TM,the normalized difference snow index (NDSI) could not be applied to map glacier lim-its for the 1975 and 1985 images. For these years, the glacial surface was obtained by amanual delineation on the MSS colour composite (bands 1, 2 and 4). The uncertainty
Dow
nloa
ded
by [
Jean
-Mic
hel J
aque
t] a
t 23:
44 1
1 A
pril
2012
Glacier cover mapping 5881
104.796.4
63.556.4
122.7
48.160.8
82.6
0
20
40
60
80
100
120
140
160
1955
1965
1975
1985
1995
2005
Year
Gla
cie
r exte
nt (k
m2)
This study
Other studies
Figure 3. Evolution of glacial cover of Coropuna between 1955 and 2003 from varioussources: this study, with uncertainty bar; 1962: Hidrandina (1988); 2000: Racoviteanu et al.(2007); 2008: Peduzzi et al. (2010). Trends plotted by hand.
for these years was also calculated by vector/raster conversion of the glacier margin,this time at a resolution of 57 m (see figure 3).
4.2.3 TM images. The radiometric characteristics as well as the glaciological appli-cations of Landsat TM images have been described by several authors (Dozier andMarks 1987, Hall et al. 1987, Dozier 1989). Indices or spectral-band ratios are knownfor their ability to eliminate, or at least to minimize, illumination differences due totopography (shading of a surface caused by solar illumination angle and slope ori-entation; Colby 1991). These ratios were calculated from visible and near-infraredchannels with low correlation and, ideally, after elimination of additive noise (Bonnand Rochon 1993). Since haze was not visible on the images, this last treatment wasnot deemed necessary (Silverio and Jaquet 2003).
In order to have an optimal representation of the Coropuna high-altitude land-cover themes between 1996 and 2003, ranging from pure ice to rock outcrops, we usedthe NDSI. It can be determined from digital numbers of two TM bands using thefollowing equation (Hall et al. 1995b):
NDSI = ((TM band 2) − (TM band 5))
((TM band 2) + (TM band 5)). (1)
The NDSI allows a spectral discrimination between snow, soil, rock and cloudcover (Dozier 1989). Sidjak and Wheate (1999) demonstrated that this index is effi-cient for snow mapping in rough topography. Silverio and Jaquet (2003, 2005) haveshown the effectiveness of the NDSI for glacial cartography in the tropical Andes(Cordillera Blanca, Peru). The NDSI provides a sharp image of the boundary betweenthe glacier terminus and the surrounding moraine; it also permits a fairly accurateinter-comparison of the bare ice part of the glacier tongue positions in different years(Hall et al. 2001).
Normally, the NDSI values vary between −1 and +1. The values we computed forthe 1996 and 2003 TM images are located within this interval (see table 4). We testedseveral threshold values to achieve an optimal mapping of glacier limits and selected
Dow
nloa
ded
by [
Jean
-Mic
hel J
aque
t] a
t 23:
44 1
1 A
pril
2012

5882 W. Silverio and J.-M. Jaquet
Table 4. Spatial differentiation of glacier entities for 1996 and2003 based on the NDSI.
Year NDSI value rangeNDSI criterion for
glacier limits
1996 −0.33 to +0.93 NDSI ≥ 0.472003 −0.70 to +1.00 NDSI ≥ 0.39
those reported in table 4 because they gave the best match with the glacier lim-its seen on the colour composite image. In 1996, the chosen threshold (0.47) washigher because there was some amount of fresh snow on the glaciers (Hall et al.1992).
Glacier (bare ice) delineation is based on a methodology detailed in Silverio andJaquet (2003, 2005): the NDSI images were segmented using the criteria given in table4 (last column). The margins of glaciers were obtained by raster/vector conversion(Silverio and Jaquet 2003).
Rock outcrops located inside the glaciers were also mapped by NDSI using the crite-rion given in table 4 (Silverio and Jaquet 2009). The rock outcrop area was subtractedfrom the total surface.
The cartographic uncertainty on glacier area S was estimated by computing thesurface area s of the rim of 30 m pixels bordering the glacier, yielding the expressionS ± s (see figure 3) (Silverio and Jaquet 2005).
5. Results
5.1 Glacial cover
The results of the study show that in 1955, the total glacial surface area obtainedfrom the topographic map of Nevado Coropuna was 123 ± 15 km2. According to thesatellite imagery, the total glacial areas of Nevado Coropuna in 1975, 1986, 1996 and2003 were 105 ± 16, 96 ± 15, 64 ± 8 and 56 ± 6 km2, respectively (see figure 3).Coropuna lost an area of 18 km2 (with a mean retreat of 0.9 km2 year−1) between1955 and 1975, of 8.3 km2 (0.8 km2 year−1) between 1975 and 1985, of 32.9 km2
(3 km2 year−1) between 1985 and 1996 and of 7 km2 (1 km2 year−1) between 1996 and2003.
Thus, the total loss of the glacial cover of Coropuna between 1955 and 2003 was66.3 km2 (54% of the original figure of 1955) with a mean retreat of 1.4 km2 year−1.Furthermore, the maximum reduction in the glacier area was observed during theperiod of 1985–1996.
5.2 Precipitation
Annual precipitation is variable and strongly depends on the location of the climatestations (table 5). During 1983 and 1992, corresponding to El Niño events, the volumeof precipitation shows a deficit at all the stations of the Coropuna region (see thearrows in figure 2). This was observed elsewhere in the Andes, together with high airtemperatures, low wind speed and reduced cloud cover, inducing a lower glacier albedoand a corresponding stronger ablation (Francou et al. 2004).
Dow
nloa
ded
by [
Jean
-Mic
hel J
aque
t] a
t 23:
44 1
1 A
pril
2012
Glacier cover mapping 5883
Table 5. Precipitation in the Coropuna region during the 1983–1998 El Niño events.
StationMean annual
precipitation (mm)
Precipitationduring El Niño
1983 event (mm)(and deficit)
Precipitationduring El Niño
1992 event(mm) (and
deficit)
Precipitationduring El Niño
1998 event (mm)(with difference
from mean)
Andagua 357.4 7 (−98%) 80 (−78%) 474 (+32.5%)Arma 318.0 121 (−62%) N/A N/AAyo 85.4 0 (−100%) 4 (−94%) 129 (+51%)Chichas 123.7 45 (−64%) 5 (−96%) 186 (+50%)Orcopampa 423.2 221 (−48%) 129 (−70%) 448 (+6%)Salamanca 349.2 137 (−61%) 13 (−96%) 365 (+5%)Yanaquihua 143.3 51 (−64%) 0.4 (−99.7%) N/A
6. Discussion
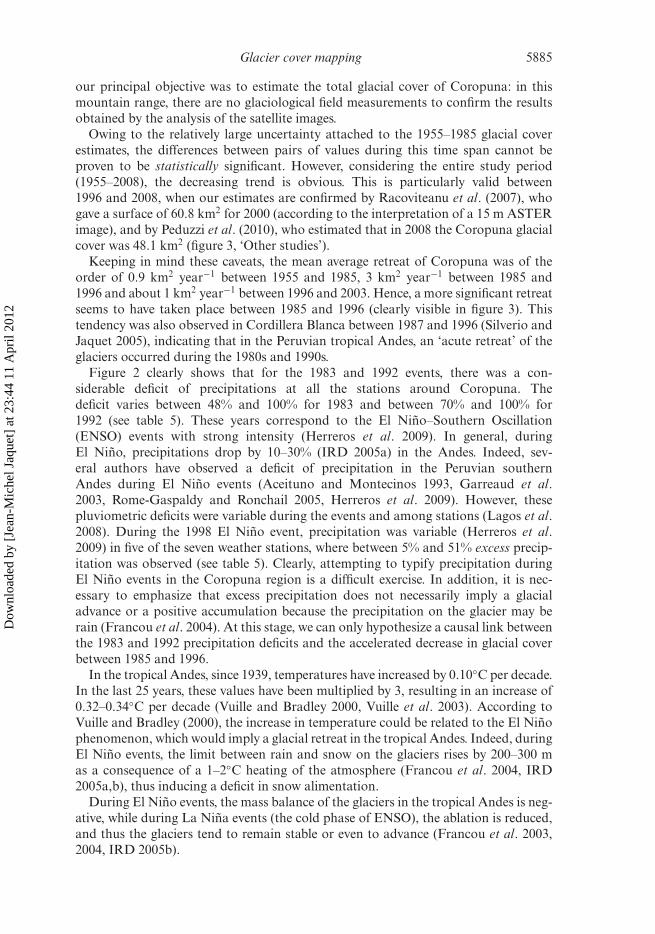
Figure 3 clearly illustrates the general retreat of the Coropuna glaciers. It is evidentthat they have been shrinking since the 1950s with a total decrease of approximately54% in the glaciated area over a period of 48 years (see figure 4).
Figure 4. Nevado Coropuna glacial cover between 1955 (black limit) and 2003 (yellow limit).Topographic contours (white and grey) are spaced 200 m apart. Black and white dots representthe location of the glaciers surveyed in 1962 by Hidrandina (1988).
Dow
nloa
ded
by [
Jean
-Mic
hel J
aque
t] a
t 23:
44 1
1 A
pril
2012

5884 W. Silverio and J.-M. Jaquet
Since satellite images were registered with topographic maps at a scale of 1:100 000(with an accuracy of about ±100 m), the study results must, therefore, be consideredat a similar scale, in spite of the higher pixel resolution of the images (30 and 57 m).
The monitoring accuracies of the position of the glacial tongue front, using tradi-tional cartographic methods (theodolite) and photogrammetry, are ±5 and ±10 m,respectively (Sturm et al. 1991). For satellite imagery, this accuracy is limited by thesensor resolution: approximately 57 m for Landsat MSS and 30 m for Landsat TM(Hall et al. 1992, 1995a, Williams et al. 1997).
Notwithstanding the limited accuracy of the glacial cover from the topographicalmap, we consider our results for 1955 to be acceptable. According to Ames (pers.comm., 27 August 2004), the IGN map was based on the analysis of aerial pho-tographs of 15 July 1955 taken after the passage of a storm, known in the Andesas ‘bad weather’. In the Andes, during ‘bad weather’, snow can fall even outside themargins of glaciers, but it will remain on the surface only for a few days. At high alti-tudes, snow will stay longer and will be able to feed the renewal of the glaciers andcan also cover the rock outcrops. It is undoubtedly as a result of the said phenomenonthat during the production of the topographic map, the IGN did not locate the rockoutcrops. Consequently, it is assumed that the glacial surface for 1955 may have beenoverestimated with an uncertainty of ±100 m around the external margins, resultingin a glaciated area of 123 ± 15 km2, or 123 km2 ±12%.
According to Ames (pers. comm., 27 August 2004), the cartographic representationof glaciers is somewhat inaccurate. (During the first glacier inventory of Peru, the areagiven was 82.6 km2 (see figure 3).) Not knowing the uncertainty for the year 1962, andalso since the method used was different from ours, we cannot compare their levels ofaccuracy.
Concerning the years 1975 and 1985, the satellite images were taken, respectively, atthe end of July and at the beginning of August, the ideal period for glacial cartogra-phy in the Andes. In spite of the relatively low resolution of the images, we considerthat our results are acceptable. The glacial margin with a reliability of ±1 pixelfor the image date gives an uncertainty band of 57 m around the external limit.For these years, the uncertainty represents ±16 km2 (±15%) and ±15 km2 (±16%),respectively.
In 1996, the rather high value of NDSI (≥0.47, see table 4) suggests that the imagerywas taken after the passage of ‘bad weather’. Normally, at the end of August, thereflectance should be lower since, for this date, the snow that had fallen during thepreceding winter had time to melt and left only the ‘bare ice’. Despite these disadvan-tages, we consider our results to be valid because the NDSI clearly discriminates iceand non-ice. As in previous cases, the estimated glacier limit is reliable at ±1 pixel.Taking into account the ±30 m approximation leads to an uncertainty of ±8 km2
(±13%).Since in 2003 the satellite images were acquired in September, the determination of
glacier margins can be expected to provide optimal results. Snow fallen the year beforehad had time to melt, leaving only bare ice in the ablation area of the glaciers. This icehas a much lower reflectance (Hall et al. 1992), which explains the low NDSI value(0.39, table 3). Ice and non-ice are then clearly delineated using the NDSI. As in pre-vious cases, the glacier limit estimate is reliable within ±1 pixel. Taking into accountthe ±30 m approximation, the uncertainty is ±6 km2 (±11%).
For 1996 and 2003, we did not discriminate subclasses such as ice and snow ofdifferent textures (see Hall et al. (1987, 1988) and Williams et al. (1991)) because
Dow
nloa
ded
by [
Jean
-Mic
hel J
aque
t] a
t 23:
44 1
1 A
pril
2012
Glacier cover mapping 5885
our principal objective was to estimate the total glacial cover of Coropuna: in thismountain range, there are no glaciological field measurements to confirm the resultsobtained by the analysis of the satellite images.
Owing to the relatively large uncertainty attached to the 1955–1985 glacial coverestimates, the differences between pairs of values during this time span cannot beproven to be statistically significant. However, considering the entire study period(1955–2008), the decreasing trend is obvious. This is particularly valid between1996 and 2008, when our estimates are confirmed by Racoviteanu et al. (2007), whogave a surface of 60.8 km2 for 2000 (according to the interpretation of a 15 m ASTERimage), and by Peduzzi et al. (2010), who estimated that in 2008 the Coropuna glacialcover was 48.1 km2 (figure 3, ‘Other studies’).
Keeping in mind these caveats, the mean average retreat of Coropuna was of theorder of 0.9 km2 year−1 between 1955 and 1985, 3 km2 year−1 between 1985 and1996 and about 1 km2 year−1 between 1996 and 2003. Hence, a more significant retreatseems to have taken place between 1985 and 1996 (clearly visible in figure 3). Thistendency was also observed in Cordillera Blanca between 1987 and 1996 (Silverio andJaquet 2005), indicating that in the Peruvian tropical Andes, an ‘acute retreat’ of theglaciers occurred during the 1980s and 1990s.
Figure 2 clearly shows that for the 1983 and 1992 events, there was a con-siderable deficit of precipitations at all the stations around Coropuna. Thedeficit varies between 48% and 100% for 1983 and between 70% and 100% for1992 (see table 5). These years correspond to the El Niño–Southern Oscillation(ENSO) events with strong intensity (Herreros et al. 2009). In general, duringEl Niño, precipitations drop by 10–30% (IRD 2005a) in the Andes. Indeed, sev-eral authors have observed a deficit of precipitation in the Peruvian southernAndes during El Niño events (Aceituno and Montecinos 1993, Garreaud et al.2003, Rome-Gaspaldy and Ronchail 2005, Herreros et al. 2009). However, thesepluviometric deficits were variable during the events and among stations (Lagos et al.2008). During the 1998 El Niño event, precipitation was variable (Herreros et al.2009) in five of the seven weather stations, where between 5% and 51% excess precip-itation was observed (see table 5). Clearly, attempting to typify precipitation duringEl Niño events in the Coropuna region is a difficult exercise. In addition, it is nec-essary to emphasize that excess precipitation does not necessarily imply a glacialadvance or a positive accumulation because the precipitation on the glacier may berain (Francou et al. 2004). At this stage, we can only hypothesize a causal link betweenthe 1983 and 1992 precipitation deficits and the accelerated decrease in glacial coverbetween 1985 and 1996.
In the tropical Andes, since 1939, temperatures have increased by 0.10◦C per decade.In the last 25 years, these values have been multiplied by 3, resulting in an increase of0.32–0.34◦C per decade (Vuille and Bradley 2000, Vuille et al. 2003). According toVuille and Bradley (2000), the increase in temperature could be related to the El Niñophenomenon, which would imply a glacial retreat in the tropical Andes. Indeed, duringEl Niño events, the limit between rain and snow on the glaciers rises by 200–300 mas a consequence of a 1–2◦C heating of the atmosphere (Francou et al. 2004, IRD2005a,b), thus inducing a deficit in snow alimentation.
During El Niño events, the mass balance of the glaciers in the tropical Andes is neg-ative, while during La Niña events (the cold phase of ENSO), the ablation is reduced,and thus the glaciers tend to remain stable or even to advance (Francou et al. 2003,2004, IRD 2005b).
Dow
nloa
ded
by [
Jean
-Mic
hel J
aque
t] a
t 23:
44 1
1 A
pril
2012

5886 W. Silverio and J.-M. Jaquet
7. Conclusions
In spite of the limited accuracy, the topographic maps at the 1:100 000 scale are able torepresent the state of the glaciers for a given date. Similarly, MSS images with a 57 mresolution can display the general state of the glaciers. As such, these low-resolutiondata provide a baseline of climate change effects for the period prior to the availabilityof high-resolution satellite images. In this study, TM images with a resolution of 30 myielded the best results and offer a great potential to map glacial retreat in the Andes(Silverio and Jaquet 2005).
It would be ideal that the results obtained by the satellite imagery analysis be con-firmed by field measurements, as done elsewhere (see Williams et al. (1997)). However,in a country like Peru, it is difficult to make direct field glaciological measurements inall parts of the cordilleras because the glaciers are located in remote regions, and thereis a chronic lack of financial and technical resources to carry out such tasks.
The results obtained by multi-source analysis reflect the state of a glacier, drivenby the general tendency of the climate. Multi-source cartography is a tool that makesit possible to have a general vision of the space–time distribution of the hydrologicalreserves in a region. To be useful, the results obtained should be integrated withina geographical information system (GIS) (Silverio 2001, Paul 2003). Associated withsocio-economic data within a GIS, the glacial cover map can thus contribute to landmanagement and decision-making.
Between 1955 and 2003, Coropuna lost 54% of its glacial cover. In the 1980s and1990s, there was a very marked retreat, possibly due to the deficit of precipitationduring the 1983 and 1992 El Niño events. This causal link with the El Niño phe-nomenon, combined with a rise in temperature, has been postulated elsewhere inthe Andes (Francou et al. 2003, IRD 2005b): the glaciers have a maximum ablation(negative mass balance) during an El Niño episode or immediately after the event.During La Niña events, the phenomenon is reversed: glaciers remain stable or evenadvance. These hypotheses should be tested on the basis of more frequent glacialcover maps during the 1980s and 1990s, as well as mass balance calculations whenfeasible.
AcknowledgementsThis study was supported by the GTZ. We thank Josef Haider and JuanCarlos Montero of Cooperación Peruana Alemana para la Seguridad Alimentaria(COPASA, Arequipa-Peru) and Monika Kiene of GTZ (Lima, Peru) for their help.We offer our gratitude to Mark A. Ernste, former collaborator of the UNEP/GRID-Sioux Falls (DEWA), USGS EROS Data Center, SD, USA, for providing the 1975,1985 and 1996 satellite images. We also extend our thanks to Pascal Peduzzi andChristian Herold, UNEP/GRID-Europe, for their help. Special thanks to MartinBeniston, University of Geneva, and to anonymous reviewers, whose commentshelped to improve earlier versions of this article.
ReferencesACEITUNO, P. and MONTECINOS, A., 1993, Análisis de la estabilidad de la relación entre la
oscilación del sur y la precipitación en América del Sur. Bulletin De L’institut FrançaisD’études Andines, 22, pp. 53–64.
BONN, F. and ROCHON, G., 1993, Précis de Télédétection, Volume 1: Principes et Méthodes(Sainte-Foy: Presses de l’Université de Québec et AUPELF).
Dow
nloa
ded
by [
Jean
-Mic
hel J
aque
t] a
t 23:
44 1
1 A
pril
2012

Glacier cover mapping 5887
COLBY, J.D., 1991, Topographic normalization in rugged terrain. Photogrammetric Engineeringand Remote Sensing, 57, pp. 531–537.
DOZIER, J., 1989, Spectral signature of Alpine snow cover from Landsat Thematic Mapper.Remote Sensing of Environment, 28, pp. 9–22.
DOZIER, J. and MARKS, D., 1987, Snow mapping and classification from Landsat ThematicMapper. Annals of Glaciology, 9, pp. 97–103.
FRANCOU, B., VUILLE, M., FAVIER, V. and CÁCERES, B., 2004, New evidence for an ENSOimpact on low-latitude glaciers: Antizana 15, Andes of Ecuador, 0◦20′ S. Journal ofGeophysical Research, 109, pp. 1–17.
FRANCOU, B., VUILLE, M., WAGNON, P., MENDOZA, J. and SICART, J.-E., 2003, Tropicalclimate change recorded by a glacier in the central Andes during the last decades ofthe twentieth century: Chacaltaya, Bolivia, 16◦S. Journal of Geophysical Research, 108,4154, doi:10.1029/2002JD002959.
FRANCOU, B. and WAGNON, P., 1998, Cordillères Andines, Sur Les Hauts Sommets De Bolivie,Du Pérou Et D’equateur (Grenoble: Glénat).
GARREAUD, R., VUILLE, M. and CLEMENT, A.C., 2003, The climatic of the Altiplano:observed current conditions and mechanisms of past changes. Palaeogeography,Palaeoclimatology, Palaeoeology, 194, pp. 5–22.
HALL, D., 2002, Monitoring glacier changes from space. Available online at: http://www.isset.org/site_of_the_month/glacier_bay/hall.science.txt.html (accessed 9 February 2011).
HALL, D.K., BAYR, K., BINDSCHADLER, R.A. and SCHÖNER, W., 2001, Changes in the PasterzeGlacier, Austria, as measured from the ground and space. In 58th Eastern SnowConference, 14–17 May 2001, Ottawa, ON. Available online at: http://www.easternsnow.org/proceedings/2001/Hall_1.pdf (accessed 9 February 2011).
HALL, D.K., BENSON, C.S. and FIELD, W.O., 1995a, Changes of Glacier Bay, Alaska, usingground and satellite measurements. Physical Geography, 16, pp. 27–41.
HALL, D.K., CHANG, A.T.C. and SIDDALINGAIAH, H., 1988, Reflectances of glaciers as cal-culated using Landsat-5 Thematic Mapper data. Remote Sensing of Environment, 25,pp. 311–321.
HALL, D.K., ORMSBY, J.P., BINDSCHADLER, R.A. and SIDDALINGAIAH, H., 1987,Characterization of snow and ice reflectance zones on glacier using Landsat ThematicMapper data. Annals of Glaciology, 9, pp. 104–108.
HALL, D.K., RIGGS, G.A. and SALOMONSON, V.V., 1995b, Development of methods formapping global snow cover using Moderate Resolution Imaging Spectroradiometer(MODIS) data. Remote Sensing of Environment, 54, pp. 127–140.
HALL, D.K., WILLIAMS JR., R.S. and BAYR, K., 1992, Glacier recession in Iceland and Austria.EOS (Transactions American Geophysical Union), 73, pp. 129–141.
HASTENRATH, S., 1992, Greenhouse indicators in Kenya. Nature, 355, pp. 503–504.HERREROS, J., MORENO, I., TAUPIN, J.-D., GINOT, P., PATRIS, N., DE ANGELIS, M.,
LEDRU, M.-P., DELACHAUX, F. and SCHOTTERER, U., 2009, Environmental recordsfrom temperate ice on Nevado Coropuna saddle, southern Peru. Advances inGeosciences, 22, pp. 27–34.
HIDRANDINA, S.A. and UNIT OF GLACIOLOGY AND HYDROLOGY HUARAZ, 1988, GlacierInventory of Peru (Lima: Consejo Nacional de Cience y Tecnología (CONCYTEC)).
IRD (INSTITUT DE RECHERCHE POUR LE DÉVELOPPEMENT), 2005a, El Niño et la fontedes glaciers dans les Andes tropicales. Available online at: http://www.ird.fr/la-mediatheque/fiches-d-actualite-scientifique/208-el-nino-et-la-fonte-des-glaciers-dans-les-andes-tropicales (accessed 9 February 2011).
IRD (INSTITUT DE RECHERCHE POUR LE DÉVELOPPEMENT), 2005b, Petits glaciers desAndes tropicales: une disparition annoncée. Available online at: http://www.ird.fr/la-mediatheque/fiches-d-actualite-scientifique/127-petits-glaciers-des-andes-tropicales-une-disparition-annoncee (accessed 9 February 2011).
KASER, G., JUEN, I., GEORGES, C., GOMEZ, J. and TAMAYO, W., 2003, The impact of glacierson the runoff and the reconstruction of mass balance history from hydrological data inthe Cordillera Blanca, Perú. Journal of Hydrology, 282, pp. 130–144.
Dow
nloa
ded
by [
Jean
-Mic
hel J
aque
t] a
t 23:
44 1
1 A
pril
2012

5888 W. Silverio and J.-M. Jaquet
KASER, G. and OSMASTON, H., 2002, Tropical Glaciers (Cambridge: Cambridge UniversityPress).
LAGOS, P., SILVA, A., NICKL, E. and MOSQUERA, K., 2008, El Niño – related precipitationvariability in Perú. Advances in Geosciences, 14, pp. 231–237.
MORALES ARNAO, B., 1998, Glaciers of Perú, with sections on the Cordillera Blanca on LandsatImagery and Quelcaya ice cap, by Hastenrath, S. In Satellite Image Atlas of Glaciersof the World, South America, U.S. Geological Survey Professional Paper 1386-I-4, R.S.Williams Jr. and J.G. Ferrigno (Eds.), pp. 151–179 (Washington, DC: United StatesGovernment Printing Office).
PAUL, F., 2003, The new Swiss glacier inventory 2000. Application of remote sensing and GIS.PhD thesis, University of Zurich, Switzerland.
PEDUZZI, P., HEROLD, C. and SILVERIO, W., 2010, Assessing high altitude thickness, volumeand area changes using field, GIS and remote sensing techniques: the case of NevadoCoropuna (Peru). The Cryosphere, 4, pp. 313–323. Available online at: http://www.the-cryosphere.net/4/313/2010/tc-4-313-2010.pdf (accessed 10 February 2011).
RACOVITEANU, A.E., MANLEY, W.F., ARNAUD, Y. and WILLIAMS, M.W., 2007, Evaluating dig-ital elevation models for glaciologic applications: an example from Nevado Coropuna,Peruvian Andes. Global Planetary Change, 59, pp. 110–125.
RIGGS, G. and HALL, D.K., 2002, Reduction of cloud obscuration in the MODIS snow dataproduct. In 59th Eastern Snow Conference, 5–7 June 2002, Stowe, VT, 8 p. Availableonline at: http://modis-snow-ice.gsfc.nasa.gov/uploads/pap_cloud_obs02.pdf (accessed28 March 2012).
ROME-GASPALDY, S. and RONCHAIL, J., 2005, La pluviométrie au Pérou pendant les phasesENSO et LNSO. Available online at: http://www.ifeanet.org/publicaciones/boletines/27%283%29/675.pdf (accessed 9 February 2011).
SIDJAK, R.W. and WHEATE, R.D., 1999, Glacier mapping of the Illecillewaet Icefield, BritishColumbia, Canada, using Landsat TM and digital elevation model data. InternationalJournal of Remote Sensing, 20, pp. 273–284.
SIGURDSSON, O. and JÓNSSON, T., 1995, Relation of glacier variations to climate changes inIceland. Annals of Glaciology, 21, pp. 263–270.
SILVERIO, W., 2001, Elaboration d’un SIG pour la gestion d’une zone protégée de hautemontagne: application au Parc national Huascarán, Pérou. Validation memoir, postgraduate certificate in geomatics, University of Geneva, Switzerland.
SILVERIO, W. and JAQUET, J.-M., 2003, Cartographie provisoire de la couverture du sol duParc national Huascarán (Pérou), à l’aide des images TM de Landasat. Télédétection, 3,pp. 69–83.
SILVERIO, W. and JAQUET, J.-M., 2005, Glacial cover mapping (1987–1996) of the CordilleraBlanca (Peru) using satellite imagery. Remote Sensing of Environment, 95, pp. 342–350.
SILVERIO, W. and JAQUET, J.-M., 2009, Prototype land-cover mapping of the HuascaránBiosphere Reserve (Peru) using a digital elevation model, and the NDSI and NDVIindices. Journal of Applied Remote Sensing, 3, 0335516, doi:10.1117/1.3106599.
STURM, M., HALL, D.K., BENSON, C.S. and FIELD, W.O., 1991, Non-climatic control of glacier-terminus fluctuations in the Wrangell and Chugach Mountains, Alaska, U.S.A. Journalof Glaciology, 37, pp. 348–356.
VUILLE, M. and BRADLEY, R., 2000, Mean annual temperature trends and their verticalstructure in the tropical Andes. Geophysical Research Letters, 27, pp. 3885–3888.
VUILLE, M., BRADLEY, R., WERNER, M. and KEIMIG, F., 2003, 20th century climate change inthe tropical Andes: observations and model results. Climatic Change, 59, pp. 75–99.
WILLIAMS JR., R.S., HALL, D.K. and BENSON, C.S., 1991, Analysis of glacier facies usingsatellite techniques. Journal of Glaciology, 37, pp. 120–128.
WILLIAMS JR., R.S., HALL, D.K., SIGURDSSON, O. and CHIEN, J.Y.L., 1997, Comparison ofsatellite-derived with ground-based measurements of the fluctuations of the margins ofVatnajökull, Iceland, 1973-92. Annals of Glaciology, 24, pp. 72–80.
Dow
nloa
ded
by [
Jean
-Mic
hel J
aque
t] a
t 23:
44 1
1 A
pril
2012