
Multi-spot Laser Scanning Thermography for Delamination...
8
6 th International Conference on Advances in Experimental Structural Engineering 11 th International Workshop on Advanced Smart Materials and Smart Structures Technology August 1-2, 2015, University of Illinois, Urbana-Champaign, United States Multi-spot Laser Scanning Thermography for Delamination Inspection in CFRP/GFRP Structure S. Hwang 1 , J. Choi 2 , J. Yang 3 , H. Sohn 4 1 MS Student, Dept. of Civil and Environmental Engineering, KAIST, Daejeon, South Korea. E-mail: [email protected] 2 MS Student, Dept. of Civil and Environmental Engineering, KAIST, Daejeon, South Korea. E-mail: [email protected] 3 Ph. D. Student, Dept. of Civil and Environmental Engineering, KAIST, Daejeon, South Korea. E-mail: [email protected] 4 Professor, Dept. of Civil and Environmental Engineering, KAIST, Daejeon, South Korea. E-mail: [email protected] ABSTRACT In this study, a multi-spot laser scanning thermography (MLST) system is developed for automated, rapid and long-range inspection of delamination in composite structures. First, thermal waves are generated by scanning a multi-spot laser beam over a target composite structure, and the corresponding thermal waves are measured by using an infrared (IR) camera. Then a thermal image processing algorithm is developed to detect a hidden delamination based on the premise that abnormal temperature variation will be observed near the hidden delamination due to the differences of diffusion rates between the intact and damage regions. The proposed system provides following advantages for composite structure inspection: (1) complete non-contact, non-destructive, and non-intrusive inspection, (2) long-range inspection, making it possible to inspect a large area, and (3) baseline- free delamination inspection using only current-state infrared data, minimizing false alarms caused by environmental and operational variations. The effectiveness of the proposed MLST system is successfully verified using both a CFRP composite plate and a GFRP wind turbine blade specimen. KEYWORDS: Delamination inspection; Long range inspection; Laser scanning thermography; Multi-spot laser; Baseline-free image processing. 1. INSTRODUCTION Composite materials are widely used in a variety of industries including aircraft and wind turbines due to their unique characteristics such as light weight, high strength, and corrosion resistance. However, temperature, humidity, impacts, and repeated cyclic environmental loadings can compromise the integrity of composite materials. As composite materials are fabricated by bonding multilayers of laminates with resins, these materials are vulnerable to damage in the form of delamination. As most delamination is invisible from exterior surfaces, it is challenging to detect such damage through a visual inspection. To address this problem, a number of delamination detection methods have been proposed. Sensor based ultrasonic techniques are among the most common delamination detection techniques for composite materials on the basis of their superior sensitivity to small damage and penetrability to the internal laminates. In spite of these strong advantages, false alarms can occur due to varying operational and environmental conditions [1-3], because most sensor based ultrasonic techniques usually determine structure integrity based on a comparison of the collected data with baseline data which is previously collected from the structure in pristine condition. In addition, the sensor based ultrasonic techniques are a contact type inspection method and are not applicable under harsh environments. Furthermore, there are practical issues associated with sensor installation. First, dense sensor installation is not only costly but also labor-intensive. Second, permanently installed sensors will deteriorate over time, and their maintenance and replacement might be challenging when they are installed in hidden locations. As an alternative, Park et al. proposed a laser based ultrasonic technique to visualize delamination regions with a non-contact approach [4]. However, a surface treatment using retro-reflective tape is required to reduce signal-to- noise ratio (SNR), and long data acquisition and processing time are remaining drawbacks for real field applications. Radiographic testing is another promising delamination detection method thanks to the superior penetration depth of X-ray, which has short wavelength of electromagnetic radiation, but real field application is
Transcript of Multi-spot Laser Scanning Thermography for Delamination...

6th International Conference on Advances in Experimental Structural Engineering
11th International Workshop on Advanced Smart Materials and Smart Structures Technology
August 1-2, 2015, University of Illinois, Urbana-Champaign, United States
Multi-spot Laser Scanning Thermography for Delamination Inspection
GFRP Structure
in CFRP/GFRP Structure
S. Hwang1, J. Choi2, J. Yang3, H. Sohn4
1 MS Student, Dept. of Civil and Environmental Engineering, KAIST, Daejeon, South Korea.
E-mail: [email protected]
2 MS Student, Dept. of Civil and Environmental Engineering, KAIST, Daejeon, South Korea.
E-mail: [email protected]
3 Ph. D. Student, Dept. of Civil and Environmental Engineering, KAIST, Daejeon, South Korea.
E-mail: [email protected]
4 Professor, Dept. of Civil and Environmental Engineering, KAIST, Daejeon, South Korea.
E-mail: [email protected]
ABSTRACT
In this study, a multi-spot laser scanning thermography (MLST) system is developed for automated, rapid and
long-range inspection of delamination in composite structures. First, thermal waves are generated by scanning a
multi-spot laser beam over a target composite structure, and the corresponding thermal waves are measured by
using an infrared (IR) camera. Then a thermal image processing algorithm is developed to detect a hidden
delamination based on the premise that abnormal temperature variation will be observed near the hidden
delamination due to the differences of diffusion rates between the intact and damage regions. The proposed system
provides following advantages for composite structure inspection: (1) complete non-contact, non-destructive, and
non-intrusive inspection, (2) long-range inspection, making it possible to inspect a large area, and (3) baseline-
free delamination inspection using only current-state infrared data, minimizing false alarms caused by
environmental and operational variations. The effectiveness of the proposed MLST system is successfully verified
using both a CFRP composite plate and a GFRP wind turbine blade specimen.
KEYWORDS: Delamination inspection; Long range inspection; Laser scanning thermography; Multi-spot
laser; Baseline-free image processing.
1. INSTRODUCTION
Composite materials are widely used in a variety of industries including aircraft and wind turbines due to their
unique characteristics such as light weight, high strength, and corrosion resistance. However, temperature,
humidity, impacts, and repeated cyclic environmental loadings can compromise the integrity of composite
materials. As composite materials are fabricated by bonding multilayers of laminates with resins, these materials
are vulnerable to damage in the form of delamination. As most delamination is invisible from exterior surfaces, it
is challenging to detect such damage through a visual inspection.
To address this problem, a number of delamination detection methods have been proposed. Sensor based ultrasonic
techniques are among the most common delamination detection techniques for composite materials on the basis
of their superior sensitivity to small damage and penetrability to the internal laminates. In spite of these strong
advantages, false alarms can occur due to varying operational and environmental conditions [1-3], because most
sensor based ultrasonic techniques usually determine structure integrity based on a comparison of the collected
data with baseline data which is previously collected from the structure in pristine condition. In addition, the sensor
based ultrasonic techniques are a contact type inspection method and are not applicable under harsh environments.
Furthermore, there are practical issues associated with sensor installation. First, dense sensor installation is not
only costly but also labor-intensive. Second, permanently installed sensors will deteriorate over time, and their
maintenance and replacement might be challenging when they are installed in hidden locations.
As an alternative, Park et al. proposed a laser based ultrasonic technique to visualize delamination regions with a
non-contact approach [4]. However, a surface treatment using retro-reflective tape is required to reduce signal-to-
noise ratio (SNR), and long data acquisition and processing time are remaining drawbacks for real field
applications. Radiographic testing is another promising delamination detection method thanks to the superior
penetration depth of X-ray, which has short wavelength of electromagnetic radiation, but real field application is

limited due to radiation hazardous issues [4].
Recently, thermography techniques, including lock-in, pulse-phase, pulsed thermography technique, have been
widely used for detecting subsurface damage in large areas in a fast manner, offering a noncontact, nondestructive,
and nonintrusive inspection strategy [5]. In particular, the delamination in structures can be measured efficiently
by pulsed thermography thanks to its short excitation with high energy density. The pulsed thermography generally
requires heat energy to be transferred to the object in the active mode and map surface temperature in the transient
heating and cooling. The presence of a delamination interferes with the propagation of the thermal kinetic energy,
resulting in a localized temperature difference due to the difference of the diffusion rate. Delamination can be
estimated by processing the thermal image. In this study, a multi-spot laser scanning thermography (MLST) system
is adopted for hidden delamination detection in a CFRP plate and a GFRP wind turbine blade specimen. The MLST
system has the following advantages: (1) precise damage inspection can be accomplished compared with other
heat source such as lamps; (2) high-speed inspection is carried out by modifying a single-spot laser beam into
multi-spot laser beams using specially designed optic components; (3) instantaneous inspection is achieved by a
newly proposed image processing algorithm. The proposed image processing requires only current state thermal
images without any prior thermal images, making it possible for baseline-free damage diagnosis. The proposed
multi-spot laser scanning thermography (MLST) system is composed of a continuous wave (CW) laser for non-
contact thermal wave generation, an IR camera for non-contact thermal wave measurement, and a personal
computer for image processing and control. Specially designed multi-spot laser beams generate thermal waves at
multiple spatial points of the target surface, and the corresponding 2D thermal wavefields are measured by the IR
camera in the time domain. The developed image processing algorithm is then used to visualize hidden
delamination instantaneously and automatically. The performance of the proposed system is experimentally
verified using a CFRP plate and a GFRP wind turbine blade specimen with simulated hidden delamination.
This paper is organized as follows. Section 2 describes the MLST system using multi-spot laser beams including
its working principles. In section 3, an image processing algorithm for hidden delamination detection is described.
In section 4, an experimental verification using both a CFRP composite plate and a GFRP wind turbine blade
specimen is presented and each test sample and corresponding test results are provided. Finally, this paper
concludes with a summary and discussion in Section 5.
2. MULTI-SPOT LASER SCANNING THERMOGRAPHY SYSTEM
This section describes the system configuration and the working principle of the proposed MLST system. First,
the working principle of the MLST system is described with brief explanations of each unit in the MLST system
and the key parameters of test instruments. The working principles of the MLST system are then explained.
2.1. System Configuration
Figure 2.1 Schematic diagram of multi-spot laser scanning thermography system
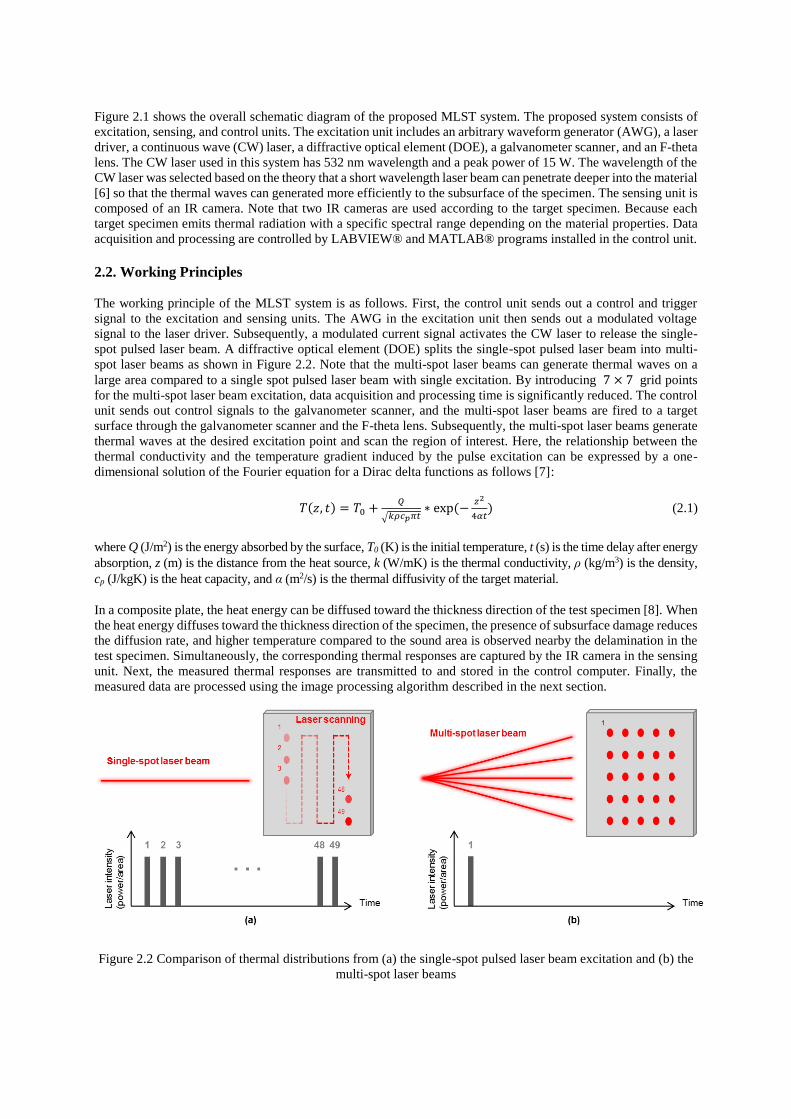
Figure 2.1 shows the overall schematic diagram of the proposed MLST system. The proposed system consists of
excitation, sensing, and control units. The excitation unit includes an arbitrary waveform generator (AWG), a laser
driver, a continuous wave (CW) laser, a diffractive optical element (DOE), a galvanometer scanner, and an F-theta
lens. The CW laser used in this system has 532 nm wavelength and a peak power of 15 W. The wavelength of the
CW laser was selected based on the theory that a short wavelength laser beam can penetrate deeper into the material
[6] so that the thermal waves can generated more efficiently to the subsurface of the specimen. The sensing unit is
composed of an IR camera. Note that two IR cameras are used according to the target specimen. Because each
target specimen emits thermal radiation with a specific spectral range depending on the material properties. Data
acquisition and processing are controlled by LABVIEW® and MATLAB® programs installed in the control unit.
2.2. Working Principles
The working principle of the MLST system is as follows. First, the control unit sends out a control and trigger
signal to the excitation and sensing units. The AWG in the excitation unit then sends out a modulated voltage
signal to the laser driver. Subsequently, a modulated current signal activates the CW laser to release the single-
spot pulsed laser beam. A diffractive optical element (DOE) splits the single-spot pulsed laser beam into multi-
spot laser beams as shown in Figure 2.2. Note that the multi-spot laser beams can generate thermal waves on a
large area compared to a single spot pulsed laser beam with single excitation. By introducing 7 × 7 grid points
for the multi-spot laser beam excitation, data acquisition and processing time is significantly reduced. The control
unit sends out control signals to the galvanometer scanner, and the multi-spot laser beams are fired to a target
surface through the galvanometer scanner and the F-theta lens. Subsequently, the multi-spot laser beams generate
thermal waves at the desired excitation point and scan the region of interest. Here, the relationship between the
thermal conductivity and the temperature gradient induced by the pulse excitation can be expressed by a one-
dimensional solution of the Fourier equation for a Dirac delta functions as follows [7]:
𝑇(𝑧, 𝑡) = 𝑇0 +𝑄
√𝑘𝜌𝑐𝑝𝜋𝑡∗ exp(−
𝑧2
4𝛼𝑡) (2.1)
where Q (J/m2) is the energy absorbed by the surface, T0 (K) is the initial temperature, t (s) is the time delay after energy
absorption, z (m) is the distance from the heat source, k (W/mK) is the thermal conductivity, ρ (kg/m3) is the density,
cp (J/kgK) is the heat capacity, and α (m2/s) is the thermal diffusivity of the target material.
In a composite plate, the heat energy can be diffused toward the thickness direction of the test specimen [8]. When
the heat energy diffuses toward the thickness direction of the specimen, the presence of subsurface damage reduces
the diffusion rate, and higher temperature compared to the sound area is observed nearby the delamination in the
test specimen. Simultaneously, the corresponding thermal responses are captured by the IR camera in the sensing
unit. Next, the measured thermal responses are transmitted to and stored in the control computer. Finally, the
measured data are processed using the image processing algorithm described in the next section.
Figure 2.2 Comparison of thermal distributions from (a) the single-spot pulsed laser beam excitation and (b) the
multi-spot laser beams
3. IMAGE PROCESSING ALGORITHM FOR HIDDEN DELAMINATION DETECTION
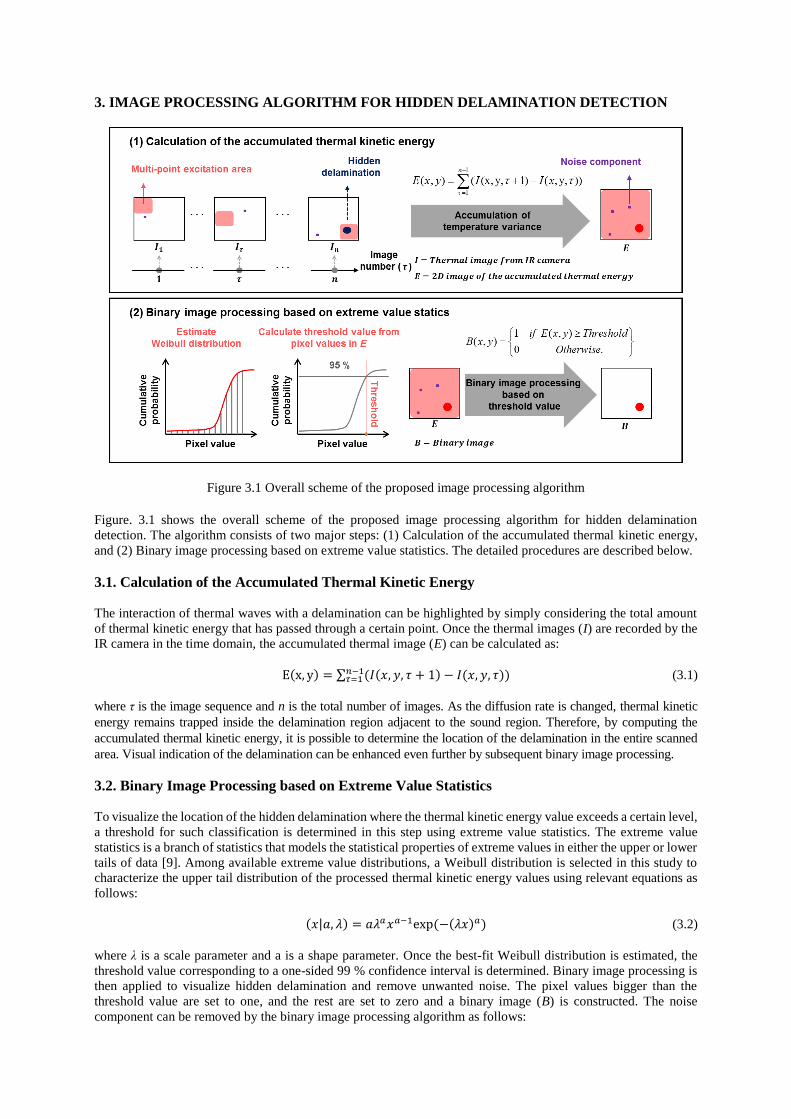
Figure 3.1 Overall scheme of the proposed image processing algorithm
Figure. 3.1 shows the overall scheme of the proposed image processing algorithm for hidden delamination
detection. The algorithm consists of two major steps: (1) Calculation of the accumulated thermal kinetic energy,
and (2) Binary image processing based on extreme value statistics. The detailed procedures are described below.
3.1. Calculation of the Accumulated Thermal Kinetic Energy
The interaction of thermal waves with a delamination can be highlighted by simply considering the total amount
of thermal kinetic energy that has passed through a certain point. Once the thermal images (I) are recorded by the
IR camera in the time domain, the accumulated thermal image (E) can be calculated as:
E(x, y) = ∑ (𝐼(𝑥, 𝑦, 𝜏 + 1) − 𝐼(𝑥, 𝑦,𝑛−1𝜏=1 𝜏)) (3.1)
where τ is the image sequence and n is the total number of images. As the diffusion rate is changed, thermal kinetic
energy remains trapped inside the delamination region adjacent to the sound region. Therefore, by computing the
accumulated thermal kinetic energy, it is possible to determine the location of the delamination in the entire scanned
area. Visual indication of the delamination can be enhanced even further by subsequent binary image processing.
3.2. Binary Image Processing based on Extreme Value Statistics
To visualize the location of the hidden delamination where the thermal kinetic energy value exceeds a certain level,
a threshold for such classification is determined in this step using extreme value statistics. The extreme value
statistics is a branch of statistics that models the statistical properties of extreme values in either the upper or lower
tails of data [9]. Among available extreme value distributions, a Weibull distribution is selected in this study to
characterize the upper tail distribution of the processed thermal kinetic energy values using relevant equations as
follows:
(𝑥|𝑎, 𝜆) = 𝑎𝜆𝑎𝑥𝑎−1exp(−(𝜆𝑥)𝑎) (3.2)
where λ is a scale parameter and a is a shape parameter. Once the best-fit Weibull distribution is estimated, the
threshold value corresponding to a one-sided 99 % confidence interval is determined. Binary image processing is
then applied to visualize hidden delamination and remove unwanted noise. The pixel values bigger than the
threshold value are set to one, and the rest are set to zero and a binary image (B) is constructed. The noise
component can be removed by the binary image processing algorithm as follows:
𝐼(𝑥, 𝑦) = {1 𝑖𝑓𝐸(𝑥, 𝑦) ≥ 𝑇ℎ𝑟𝑒𝑠ℎ𝑜𝑙𝑑0 𝑂𝑡ℎ𝑒𝑟𝑤𝑖𝑠𝑒.
(3.3)
4. EXPERIMENTAL VERIFICATION
The proposed MLST system and algorithms for hidden delamination detection in composite structures are verified
through a lab-scale experiment. First, a CFRP plate specimen with artificial induced delamination with 30 mm of
diameter was fabricated. The size of this specimen is 500mm × 500mm with 2 mm of thickness, and part of the
area, 75 mm× 125mm, is inspected using the proposed MLST system. The GFRP wind turbine blade specimen is
also fabricated with artificially constructed delamination with 10 mm of diameter. The size of this specimen is
3000mm × 500mm with 3 mm to 5 mm of thickness. The part of the GFRP wind turbine blade specimen,
70mm × 105mm, is inspected using the proposed MLST system. Hidden delaminations are artificially fabricated
by placing Teflon tape in the CFRP plate and a GFRP wind turbine blade specimen. A detailed explanation is provided
in Figure. 4.1 and Figure 4.2. The experimental set-up and results are described in the following.
4.1. Delamination Inspection for CFRP Plate
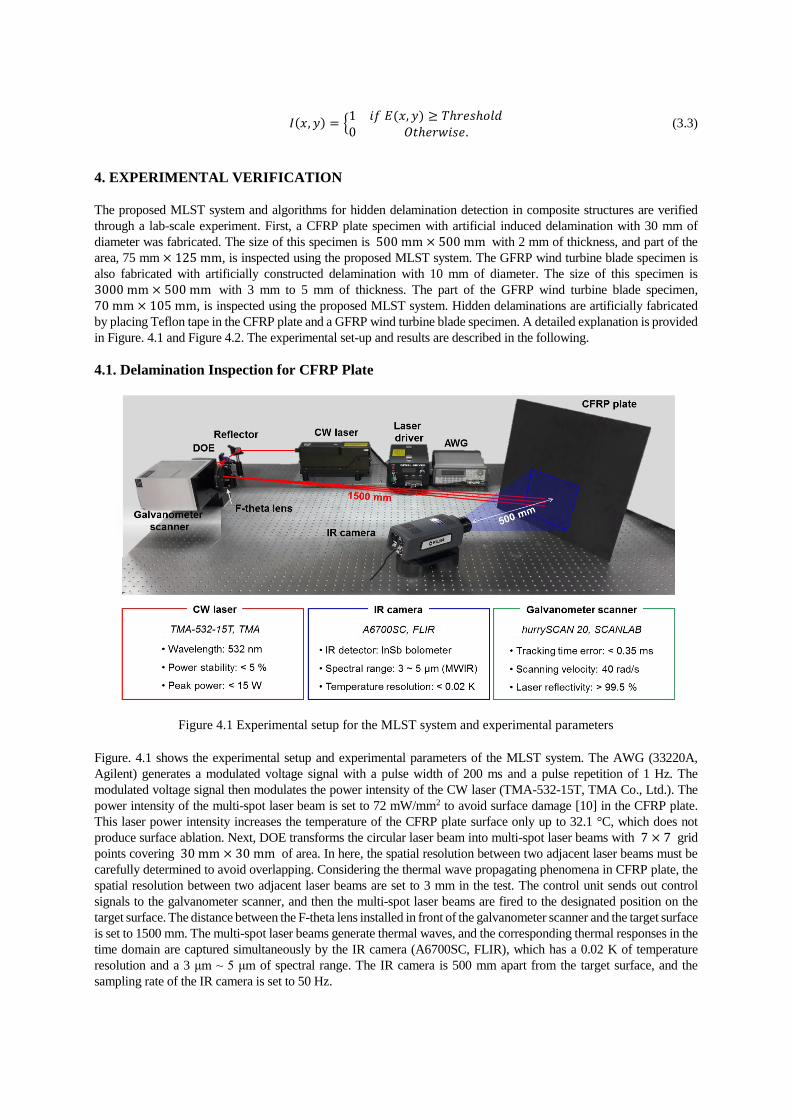
Figure 4.1 Experimental setup for the MLST system and experimental parameters
Figure. 4.1 shows the experimental setup and experimental parameters of the MLST system. The AWG (33220A,
Agilent) generates a modulated voltage signal with a pulse width of 200 ms and a pulse repetition of 1 Hz. The
modulated voltage signal then modulates the power intensity of the CW laser (TMA-532-15T, TMA Co., Ltd.). The
power intensity of the multi-spot laser beam is set to 72 mW/mm2 to avoid surface damage [10] in the CFRP plate.
This laser power intensity increases the temperature of the CFRP plate surface only up to 32.1 °C, which does not
produce surface ablation. Next, DOE transforms the circular laser beam into multi-spot laser beams with 7 × 7 grid
points covering 30mm × 30mm of area. In here, the spatial resolution between two adjacent laser beams must be
carefully determined to avoid overlapping. Considering the thermal wave propagating phenomena in CFRP plate, the
spatial resolution between two adjacent laser beams are set to 3 mm in the test. The control unit sends out control
signals to the galvanometer scanner, and then the multi-spot laser beams are fired to the designated position on the
target surface. The distance between the F-theta lens installed in front of the galvanometer scanner and the target surface
is set to 1500 mm. The multi-spot laser beams generate thermal waves, and the corresponding thermal responses in the
time domain are captured simultaneously by the IR camera (A6700SC, FLIR), which has a 0.02 K of temperature
resolution and a 3 μm ~ 5 μm of spectral range. The IR camera is 500 mm apart from the target surface, and the
sampling rate of the IR camera is set to 50 Hz.

Figure 4.2 Scanning methods and detailed view of CFRP plate inspection
The experimental parameters and detailed view of CFRP plate are schematically described in Fig. 4.2. The multi-
spot laser beams are fired 12 times to designated area with 1 Hz of pulse repetition. Here, 12 seconds are required
for multi-spot laser beam excitation, but simultaneously, IR camera measures the thermal responses for 20 seconds
to check the temperature variation after multi-spot laser beam excitation. Figure 4.3 (a), (b) and (c) show the
thermal images nearby hidden delamination. Laser-generated thermal waves are shown in the raw thermal images
and abnormal areas are visualized near the delamination. Once the thermal images are obtained from CFRP plate
sample, the accumulated thermal kinetic energy is calculated using Eq. 3.1 as shown in Figure. 4.4 (a). The
accumulated thermal kinetic energy shows that the hidden delamination is highlighted because more thermal
kinetic energy is accumulated nearby the delamination. Next, a binary image is subsequently constructed based on
the threshold value using Eq. 3.2 and 3.3. Figure. 4.4 (b) shows the binary image and the binary image clearly
shows 30 mm of delamination with successfully eliminating random noise components shown in Figure. 4.3 (a)
without false alarms.
Figure 4.3 Thermal images acquired from IR camera of CFRP plate sample at (a) 7 sec, (b) 8 sec, and (c) 9 sec
Figure 4.4 Image processing results of CFRP plate sample: (a) 2D image of the accumulated thermal kinetic
energy and (b) binary image
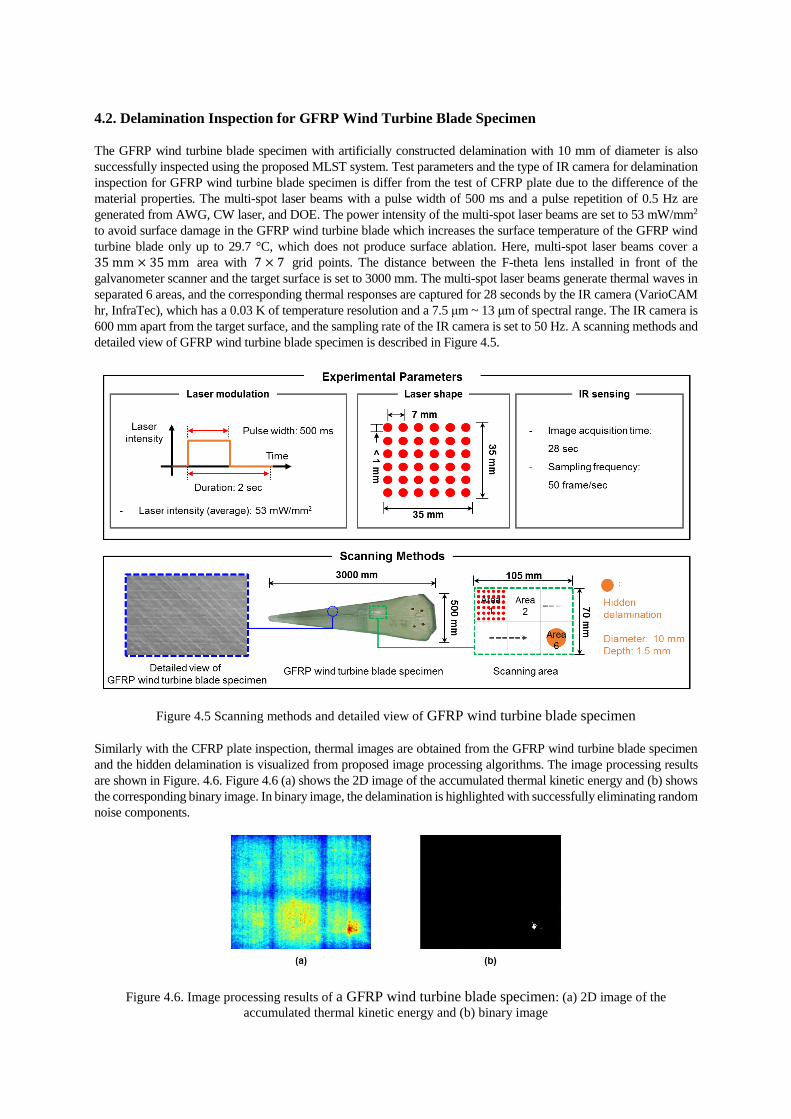
4.2. Delamination Inspection for GFRP Wind Turbine Blade Specimen
The GFRP wind turbine blade specimen with artificially constructed delamination with 10 mm of diameter is also
successfully inspected using the proposed MLST system. Test parameters and the type of IR camera for delamination
inspection for GFRP wind turbine blade specimen is differ from the test of CFRP plate due to the difference of the
material properties. The multi-spot laser beams with a pulse width of 500 ms and a pulse repetition of 0.5 Hz are
generated from AWG, CW laser, and DOE. The power intensity of the multi-spot laser beams are set to 53 mW/mm2
to avoid surface damage in the GFRP wind turbine blade which increases the surface temperature of the GFRP wind
turbine blade only up to 29.7 °C, which does not produce surface ablation. Here, multi-spot laser beams cover a
35mm × 35mm area with 7 × 7 grid points. The distance between the F-theta lens installed in front of the
galvanometer scanner and the target surface is set to 3000 mm. The multi-spot laser beams generate thermal waves in
separated 6 areas, and the corresponding thermal responses are captured for 28 seconds by the IR camera (VarioCAM
hr, InfraTec), which has a 0.03 K of temperature resolution and a 7.5 μm ~ 13 μm of spectral range. The IR camera is
600 mm apart from the target surface, and the sampling rate of the IR camera is set to 50 Hz. A scanning methods and
detailed view of GFRP wind turbine blade specimen is described in Figure 4.5.
Figure 4.5 Scanning methods and detailed view of GFRP wind turbine blade specimen
Similarly with the CFRP plate inspection, thermal images are obtained from the GFRP wind turbine blade specimen
and the hidden delamination is visualized from proposed image processing algorithms. The image processing results
are shown in Figure. 4.6. Figure 4.6 (a) shows the 2D image of the accumulated thermal kinetic energy and (b) shows
the corresponding binary image. In binary image, the delamination is highlighted with successfully eliminating random
noise components.
Figure 4.6. Image processing results of a GFRP wind turbine blade specimen: (a) 2D image of the
accumulated thermal kinetic energy and (b) binary image

5. CONCLUSION
In this study, a MLST system and corresponding image processing algorithms are developed and verified through an
experiment using a specially designed CFRP plate and structure a GFRP wind turbine blade specimen with artificial
hidden delamination. The experiment results show that (1) a hidden delamination with 10 mm diameter is successfully
detected with no false alarm indicated; (2) high-speed inspection can be carried out by modifying a single-spot laser
beam to multi-spot laser beams using specially designed optic components; and (3) data acquisition and processing are
done in a fully automated manner. Further studies are required to adopt the developed MLST system to an in-situ
structure, and corresponding algorithms and system modifications are to be investigated in future work.
AKCNOWLEDGEMENT
This work was conducted under a research program supported by the Climate Change Research Hub of Korea
Advanced Institute of Science and Technology (N01150138), Korea.
REFERENCES
1. Annamdas, V. G. M., Yang, Y. and Soh, C. K. (2007). Influence of loading on the electromechanical
admittance of piezoceramic transducers, Smart Materials and Structures. 16, 1888-1897.
2. Sohn, H. and Oh, C. K. (2009). Statistical pattern recognition in structural health monitoring: Encyclopedia
of structural health monitoring. Wiley, New York.
3. Sohn, H., Worden, K. and Farrar, C. R. (2002). Statistical damage classification under changing environmental
and operational conditions. Journal of Intelligent Material Systems and Structures. 13, 561-674.
4. Park, B., An, YK. and Sohn, H. (2014). Visualization of hidden delamination and debonding in composites
through noncontact laser ultrasonic scanning. Composites Science and Technology. 100, 10-18.
5. An, YK., Kim, JM. and Sohn, H. (2014). Laser lock-in thermography for detection of surface-breaking fatigue
cracks on uncoated steel structures. NDT&E International. 64, 54-63.
6. Balu, M., Baldacchini, T., Carter, J., Krasieva, T. B., Zadoyan, R. and Tromberg, B. J. (2004). Effect of
excitation wavelength on penetration depth in nonlinear optical microscopy of turbid media. Journal of
Biomedical Optics. 14, 010508.
7. John IV, H. L. and John V, H. L. (2008). A heat transfer textbook, Phlogiston Press, Massachusetts.
8. Traxler, G., Scheerer, M. and Steiger, C. (2005). Square pulse thermography system design considerations for
detection of voids inside of the material with different properties and finite differences, Proceedings of SPIE,
5679, 118-128.
9. Park, HW. and Sohn, H. (2006). Parameter estimation of the generalized extreme value distribution for
structural health monitoring. Probabilistic Engineering Mechanics, 21, 336-376.
10. Scruby C. B. and Drain L. E. (1990). Laser Ultrasonics: Techniques and applications. Taylor and Francis,
New York.


![Research on the Seismic Performance of an Externally ...sstl.cee.illinois.edu/papers/aeseancrisst15/128_Liu...Lu et al. [6] presented a new seismic resistance system, the Controlled](https://static.fdocuments.us/doc/165x107/5aea6d9d7f8b9a3b2e8caa68/research-on-the-seismic-performance-of-an-externally-sstlcee-et-al-6-presented.jpg)


