Attention-Guided Image Compression by Deep Reconstruction ...

1
Multi-scale self-guided attention for medical imagesegmentationAshish Sinha and Jose Dolz
Abstract—Even though convolutional neural networks (CNNs)are driving progress in medical image segmentation, standardmodels still have some drawbacks. First, the use of multi-scaleapproaches, i.e., encoder-decoder architectures, leads to a re-dundant use of information, where similar low-level features areextracted multiple times at multiple scales. Second, long-rangefeature dependencies are not efficiently modeled, resulting in non-optimal discriminative feature representations associated witheach semantic class. In this paper we attempt to overcome theselimitations with the proposed architecture, by capturing richercontextual dependencies based on the use of guided self-attentionmechanisms. This approach is able to integrate local featureswith their corresponding global dependencies, as well as highlightinterdependent channel maps in an adaptive manner. Further, theadditional loss between different modules guides the attentionmechanisms to neglect irrelevant information and focus on morediscriminant regions of the image by emphasizing relevant featureassociations. We evaluate the proposed model in the context ofsemantic segmentation on three different datasets: abdominalorgans, cardiovascular structures and brain tumors. A series ofablation experiments support the importance of these attentionmodules in the proposed architecture. In addition, compared toother state-of-the-art segmentation networks our model yieldsbetter segmentation performance, increasing the accuracy of thepredictions while reducing the standard deviation. This demon-strates the efficiency of our approach to generate precise andreliable automatic segmentations of medical images. Our code ismade publicly available at: https://github.com/sinAshish/Multi-Scale-Attention
Index Terms—Convolutional neural networks, Deep learning,Medical image segmentation, Deep attention, Self-attention
I. INTRODUCTION
Semantic segmentation of medical images is a crucial step indiagnosis, treatment and follow-up of many diseases. Despitethe automation of this task has been widely studied in thepast, manual annotations are still typically used in clinicalpractice, which is a time-consuming and prone to inter andintra-observer variability process. Thus, there is a high demandon accurate and reliable automatic segmentation methods thatallow to improve the work flow efficiency in clinical scenarios,alleviating the workload of radiologists and other medicalexperts.
Recently, convolutional neural networks (CNNs) haveachieved state-of-the-art performance in a breadth of visualrecognition tasks, becoming very popular due to their pow-erful, nonlinear feature extraction capabilities. These deepmodels dominate the literature in medical image segmentation
A. Sinha is with the Indian Institute of Technology Roorkee, India. e-mail:[email protected].
J. Dolz is with the Ecole de technologie Superieure, Montreal, Canada.email:[email protected].
Manuscript received XXX; revised XXX.
[1] and have achieved outstanding performance in a broad spanof applications, including brain [2] or cardiac [3] imaging, forexample, becoming the de facto solution for these problems.In this scenario, fully convolutional neural networks [4] orencoder-decoder architectures [5], [6] are typically the stan-dard choice. These architectures are commonly composed ofa contracting path, which collapses an input image into a setof high-level features, and an expanding path, where high-level features are used to reconstruct a pixel-wise segmentationmask at a single [4] or multiple upsampling steps [5], [6].Nevertheless, despite their strong representation power, thesemulti-scale approaches lead to a redundant use of informationflow, e.g., similar low-level features are extracted multipletimes at different levels within the network. Furthermore, thediscriminative power of the learned feature representations forpixel-wise recognition may be insufficient for some challeng-ing tasks, such as medical image segmentation.
Recent works to improve the discriminative ability of fea-ture representations include the use of multi-scale contextfusion [7], [8], [9], [10]. Zhao et al. [8] proposed a pyramidnetwork that exploited global information at different scalesby aggregating feature maps generated by multiple dilatedconvolutional blocks. Aggregation of contextual multi-scaleinformation can also be achieved through pooling operations[11]. Even though these strategies may help to capture objectsat different scales, contextual dependencies for all imageregions are homogeneous and non-adaptive, ignoring the dif-ference between local representation and contextual depen-dencies for different categories. Further, these multi-contextrepresentations are manually designed, lacking flexibility tomodel the multi-context representations. This makes that long-range object relationships in the whole image cannot be fullyleveraged in these approaches, which is of pivotal importancein many medical imaging segmentation problems.
Alternatively, attention mechanisms have been widely stud-ied in deep CNNs for many computer vision tasks in order toefficiently integrate local and global features, including humanpose estimation [12], emotion recognition [13], text detection[14], object detection [15] and classification [16]. Unlike stan-dard multi-scale features fusion approaches, which compressan entire image into a static representation, attention allowsthe network to focus on the most relevant features withoutadditional supervision, avoiding the use of multiple similarfeature maps and highlighting salient features that are usefulfor a given task. Semantic segmentation networks have alsobenefited from attention modules, which has resulted in en-hanced models for pixel-wise recognition tasks [17], [18], [19],[20], [21], [22]. For example, Chen et al. [17] proposed anattention mechanism to weight multi-scale features extracted
arX
iv:1
906.
0284
9v3
[cs
.CV
] 1
4 Fe
b 20
20

2
at different scales in the context of natural scene segmentation.This method improved the segmentation performance overclassical average and max-pooling techniques to merge multi-scale features predictions.
Despite the growing interest on integrating attention mecha-nisms in image segmentation networks for natural scenes, theiradoption in medical images remains scarce [23], [24], [25],[26], [27], being limited to simple attention models. Thus, inthis work, we explore more complex attention mechanisms thatcan boost the performance of standard deep networks for thetask of medical image segmentation. Specifically, we proposea multi-scale guided attention network for medical imagesegmentation. First, the multi-scale approach generates stacksat different resolutions containing different semantics. Whilelower-level stacks focus on local appearance, higher-levelstacks will encode global representations. This multi-scalestrategy encourages that attention maps generated at differentresolutions encode different semantic information. Then, ateach scale, a stack of attention modules will gradually removenoisy areas and emphasize those regions that are more relevantto the semantic descriptions of the targets. Each attentionmodule contains two independent self-attention mechanisms,which focus on modelling position and channel feature depen-dencies, respectively. This duple allows to model wider andricher contextual representations and improve dependenciesbetween channel maps, resulting in enhanced feature represen-tations. We validate our method in three different segmentationtasks: abdominal organ, cardiovascular structures and braintumor. Results show that the proposed architecture improvesthe segmentation performance by successfully modeling richcontextual dependencies over local features.
II. RELATED WORK
A. Medical image segmentationEven though segmentation of medical images has been
widely studied in the past [28], [29] it is undeniable that CNNsare driving progress in this field, leading to outstanding perfor-mances in many applications. Most available medical imagesegmentation architectures are inspired from the well-knownfully convolutional neural network (FCN) [4] or UNet [5].In FCN the fully connected layers of standard classificationCNNS are replaced by convolutional layers to achieve densepixel prediction at one forward step. To recover the originalresolution of the input image, the prediction is upsampled ina single step. Further, to improve the prediction capabilities,skip connections are included in the network by employing theintermediate feature maps. On the other hand, UNet containscontractive and expansive paths created using the combinationof convolutional layers with pooling and upsampling layers.Skip connections are used to concatenate the features fromcontractive and expansive path layers. Many extensions ofthese networks have been proposed to solve pixel-wise seg-mentation problems in a wide range of applications [30], [31],[32], [33], [34], [35], [36], [37], [38], [39].
B. Deep attentionAttention mechanisms aim at emphasizing important local
regions captured in local features and filtering irrelevant infor-
mation transferred by global features, improving the modelingof long-range dependencies. These modules have thereforebecome an essential part of models that need to capture globaldependencies. The integration of these attention modules hasbeen proved very successful in many vision problems, suchas image captioning [40], image question-answering [41] orclassification [42]. Self-attention [43], [44], [45] has recentlyattracted the attention of researchers, as it exhibits a goodability to model long-range dependencies while maintainingcomputational and statistical efficiency. In these modules, theresponse at each position is calculated by attending to allpositions and taking their weighted average in an embeddingspace. For image vision problems, [18], [19] integrated self-attention to model the relation of local features with their cor-responding global dependencies. For instance, the point-wisespatial attention network (PSANet) proposed in [18] allowsa flexible and dynamic aggregation of long-range contextualinformation by connecting each position in the feature mapwith all the others through self-adaptive attention maps.
Recent works have indicated that attention features gener-ated in a single step may still contain noise introduced fromregions that are irrelevant for a given class, leading to sub-optimal results [41], [46]. To overcome this issue, some workshave investigated the use of progressive multiple attentionlayers in the context of visual question answering [41] or zeroshot learning [46]. This strategy gradually filters undesirednoise and emphasizes the regions highly relevant for the classsemantic representations. To the best of our knowledge, theapplication of stacked attention modules remains unexploredin semantic segmentation.
C. Medical image segmentation with deep attention
Even though attention mechanisms are becoming popularon many vision problems, the literature on medical imagesegmentation with attention remains scarce, with simple at-tention modules [23], [24], [25], [26], [27]. Wang et al. [23]employed attention modules at multiple resolutions to combinelocal deep attention features (DAF) with global context forprostate segmentation on Ultrasound images. To model long-range dependencies local and global features were combinedin a simple attention module, which contains three convo-lutional layers followed by a softmax function to create theattention map. A similar attention module, composed of twoconvolutional layers followed by a softmax, was integrated ina hierarchical aggregation framework integrated in UNet forleft atrial segmentation [24]. More recently, additive attentiongate modules were integrated in the skip connections ofthe decoding path of UNet with the goal of better modelcomplimentary information from the encoder [25].
III. METHODS
A. Overview
Target structures on medical imaging typically present intraand inter-class diversity on size, shape and texture, particu-larly if images are processed in 2D. Traditional CNNs forsegmentation have a local receptive field, which results inthe generation of local feature representations. As long-range

3
Guided Attention
Guided Attention
Guided Attention
Guided Attention
Conv-1 Res-2 Res-3 Res-4
Attention features
Res-5
Conv
Input
Segmentation
Conv Conv Conv Conv
Bilinear interpolation
ResNet-101
Fig. 1: Overview of the proposed multi-scale guided attentionnetwork. We resort to ResNet-101 to extract dense localfeatures. Four feature maps with different sizes –acquired fromthe outputs of [Res-2, Res-3, Res-4, Res-5]– are employed.The guided attention modules will generate attentive featuresat multiple scales, removing noisy areas and helping thenetwork to emphasize the regions that are more relevant tothe semantic classes.
contextual information is not properly encoded, local featuresrepresentations may lead to potential differences between fea-tures corresponding to the pixels with the same label [19]. Thismay introduce intra-class inconsistency that can ultimatelyimpact on the recognition performance [47]. To tackle withthis problem, we investigate attention mechanisms to buildassociations between features. First, global context is capturedby employing a multi-scale strategy. Then, learned featuresat multiple scales are fed into the guided attention modules,which are composed by a stack of spatial and channel self-attention modules. While the spatial and channel self-attentionmodules will help to adaptively integrate local features withtheir global dependencies, the stack of attention modules willhelp to gradually filter noise out emphasizing on relevantinformation. The overview of the proposed framework isdepicted in Figure 1.
B. Multi-scale attention maps
Multi-scale features are known to be useful in computervision problems even before the deep learning era [48]. Inthe context of deep segmentation networks, the integration ofmulti-scale features has demonstrated astonishing performance[17], [49], [50]. Inspired by these works we make use oflearned features at multiple scales, which help to encode bothglobal and local context. Specifically we follow the multi-scalestrategy recently proposed in [23]. In this setting, features atmultiple scales are denoted as Fs, where s indicates the level inthe architecture (Fig. 1). Since features come at different reso-lutions for each level s, they are upsampled to a common reso-lution by employing bilinear interpolation, leading to enlargedfeature maps F ′s. Then, F ′s from all the scales are concatenated
forming a tensor that is convolved to create a common multi-scale feature map, FMS = conv([F ′0, F
′1, F
′2, F
′3]). Thus, FMS
encodes low-level detail information from shallow layers aswell as high-level semantics learned in deeper layers. Then,this new multi-scale feature map is combined with each ofthe feature maps at different scales s and fed into the guidedattention modules to generate the attention features As:
As = AttMods(conv([F′s, FMS ])) (1)
where AttMod represents each guided attention module(Section III-D). As the multi-scale feature maps FMS arecombined at each individual layer, complementary low-levelinformation and high-level semantics from FMS are encodedjointly, resulting in a more powerful representation. In thefollowing sections we detail how the attentive features As areobtained.
C. Spatial and Channel self-attention modules
As introduced earlier, receptive fields in traditional segmen-tation deep models are reduced to a local vicinity. This limitsthe capabilities of modeling wider and richer contextual repre-sentations. On the other hand, channel maps can be consideredas class-specific responses, where different semantic responsesare associated with each other. Thus, another strategy toenhance the feature representation of specific semantics isto improve the dependencies between channel maps [51]. Toaddress these limitations of standard CNNs we employ theposition and channel attention modules recently proposed in[19], which are depicted in Figure 2.
Position attention module (PAM): Let denote F ∈RC×W×H an input feature map to the attention module, whereC,W,H represent the channel, width and height dimensions,respectively. In the upper branch F is passed through a con-volutional block, resulting in a feature map F p
0 ∈ RC′×W×H ,where C ′ is equal to C/81. Then, F p
0 is reshaped to a featuremap of shape (W × H) × C ′. In the second branch, theinput feature map F follows the same operations and thenis transposed, resulting in F p
1 ∈ RC′×(W×H). Both maps aremultiplied and softmax is applied on the resulted matrix togenerate the spatial attention map Sp ∈ R(W×H)×(W×H):
spi,j =exp (F p
0,i · Fp1,j)∑W×H
i=1 exp (F p0,i · F
p1,j)
(2)
where spi,j evaluates the impact of the ith position on thejth position. The input F is fed into a different convolutionalblock in the third branch, resulting in F p
2 ∈ RC×(W×H), whichhas the same shape as F . As in the other branches, F p
2 isreshaped becoming F p
2 ∈ RC×(W×H). Then it is multipliedby a permuted version of the spatial attention map S, whoseoutput is reshaped to a RC×(W×H). The attention feature mapcorresponding to the position attention module, i.e., FPAM ,can be therefore formulated as follows:
1We use the superscript p to indicate that the feature map belongs to theposition attention module. Similarly, we will employ the superscript c for thechannel attention module features.

4
FPAM,j = λp
W×H∑i=1
spijFp2,j + Fj (3)
As in [19], the value of λp is initialized to 0 and itis gradually learned to give more importance to the spatialattention map. Thus, the position attention module selectivelyaggregates global context to the learned features, guided bythe spatial attention map.
(C/8)xWxH(WxH)xC/8
(C/8)x(WxH)
Softmax
(WxH) x (WxH)
Cx(WxH)CxWxH
Cx(WxH)
Cx(WxH)
(WxH)xC
Cx(WxH)
Softmax
CxC
Cx(WxH)CxWxH
CxWxH
Self-Attention features
Channel attention module
Position attention module
Reshape Permute
CxWxH
Convolution
CxWxH
CxWxH
Fig. 2: Details of the position and channel attention modulesinspired by [19].
Channel attention module (CAM): The pipeline of thechannel attention module is depicted at the bottom of Figure 2.The input F ∈ RC×W×H is reshaped in the first two branchesof the CAM, and permuted in the second branch, leading toF c0 ∈ R(W×H)×C and F c
1 ∈ RC×(W×H), respectively. Then,we perform a matrix multiplication between F c
0 and F c1 , and
obtain the channel attention map Sc ∈ RC×C as:
sci,j =exp (F c
0,i · F c1,j)∑C
i=1 exp (Fc0,i · F c
1,j)(4)
where the impact of the ith channel on the jth is given bysci,j . This is then multiplied by a transposed version of theinput F , i.e., F c
2 , whose result is reshaped to RC×(W×H).Then, the final channel attention map is obtained as:
FCAM,j = λc
C∑i=1
scijFc2,j + Fj (5)
where λc controls the importance of the channel attentionmap over the input feature map F . Similarly to λp, λc isinitially set to 0 and gradually learned. This formulationaggregates weighted versions of the features of all the channelsinto the original features, highlighting class-dependent feature
maps and increasing feature discriminability between classes.At the end of both attention modules, the new generatedfeatures are fed into a convolutional layer before performing anelement-wise sum operation to generate the position-channelattention features.
D. Guiding attention
Inspired by recent work to stack attention modules inthe context of image classification [46], we propose to addprogressive refinement of attentive features through sequentialrefinement modules. The intuition is that this sequential re-finement will progressively weight the importance of differentlocal regions, while masking out irrelevant noise. Particularly,given the feature map F at the input of the guided attentionmodule at scale s–generated by concatenating FMS and F ′s–,it generates attention features via a multi-step refinement (Fig.3). In the first step, F is used by the position and channel at-tention modules to generate self-attention features. In parallel,we integrate an encoder-decoder network that compresses theinput features F into a compacted representation in the latentspace [46]. The objective is that the class information canbe embedded into the subsequent guided attention modulesby forcing the latent representation of encoder-decoders to beclose, which is formulated as:
LG =
M−1∑i
‖Ei(Fi−1A )− Ei+1(F
iA)‖22 (6)
where Ei(·) is the encoded representation of the i-thencoder-decoder network, F i
A denotes the attention featuresgenerated after the i-th dual attention module and M the num-ber of iterations. Note that F i−1
A are the features at the inputof the semantic guided attention module, F . Specifically, thefeature maps reconstructed in the first encoder-decoder (n = 0)are combined with the self-attention features generated bythe first attention module through a matrix-multiplication togenerate FSA. In addition, to ensure that the reconstructedfeatures correspond to the features at the input of the position-channel attention modules, the output of the encoders areforced to be close to their input:
LRec =
M∑i
‖Fi − Fi‖22 (7)
where Fi are the reconstructed feature maps, i.e., Di(Ei(F ))of the i-th encoder-decoder networks.
As the guided attention module is applied at multiple scales,the combined guided loss for all the modules will be:
LGTotal=
S∑s=0
LsG (8)
Similarly, the total reconstruction loss becomes:
LRecTotal=
S∑s=0
LsRec (9)

5
Position attention module
Position attention module
Channel attention module
Channel attention module
Guided loss
Encoder-decoder 0 Encoder-decoder 1
Semantic guided attention module
1 Refinement step 2 Refinement steps
Fig. 3: An illustration of the semantic guided attention modulewith 2 refinement steps. For each scale s this module providesa set of attentive features, i.e., As.
where LRec1 and LRec2 are the reconstruction losses for theencoder-decoder architectures in the first and second block ofthe guided attention module.
E. Deep supervision
While the attention modules do not require auxiliary ob-jective functions, we found that the use of extra supervisionat each scale [52] improved the segmentation performance ofthe proposed model, which is in line with similar works in theliterature [17], [23], [25].
LSegTotal=
S∑s=0
LsSegF ′ +
S∑s=0
LsSegA (10)
where the first term refers to the segmentation results at theraw features F ′s and the second term evaluates the segmenta-tion result provided by the attention features. In all the cases,the multi-class cross-entropy between the network predictionand the ground truth labels is employed as segmentation loss.The final objective function to optimize becomes:
LTotal = αLSegTotal+ βLGTotal
+ γLRecTotal(11)
where α, β and γ control the importance of each term inthe main loss function.
IV. EXPERIMENTS
A. Experimental settingDatasets: We employ three public segmentation bench-
marks to evaluate our method. First, the abdominal MRIdataset from the Combined Healthy Abdominal Organ Seg-mentation (CHAOS) Challenge [53], [54], [55]. Particularly,we focus on the segmentation of abdominal organs (spleen,liver and kidneys) on MRI (T1-DUAL in phase), whichincludes scans from 20 subjects for training with their corre-sponding ground truth annotations, and 20 for testing withoutannotations. Scans have a resolution of 256×256 pixels perslice, and between 26 and 50 slices. Since testing labels arenot provided within the dataset, we employed the trainingdataset for our experiments, splitting it into subsets of 13,2 and 5 subjects that were used for training, validation and
testing. We repeated the process 3 times selecting differentsubjects and report the average results over the three folds.Then, we evaluated our approach on the task of whole-heartand great vessel segmentation from 3D Cardiovascular MRIin congenital heart disease, provided in the HVSMR 2016Challenge [56]. Particularly, the myocardium and the bloodpool are targeted in this scenario. The training set consistson 10 MRI Axial scans with their corresponding manual seg-mentations. Image dimensions varied across subjects, with anaverage of 390 × 390 × 165 voxel volumes. We report resultson the training data, by employing a 5-fold cross-validationstrategy, where each fold contains 6 scans for training, 2 forvalidation and 2 for testing. To increase the variability of thedata, we rotate, flipped and mirrored the images randomly,but without augmenting the dataset size. For the third task,we employed the brain segmentation dataset provided in theMedical Segmentation Decathlon Challenge2. Particularly, thisdataset contains multimodal multisite MRI data (FLAIR, T1w,T1gd,T2w) from the BRATS’16 and BRATS’17 Challenges[57], [58], [59]. The focus of this dataset is on the segmenta-tion of necrotic (TC) and active areas (ET), as well as oedema(ED) in brain gliomas. We employed 484 scans that were splitinto training (388 scans), validation (48 scans) and testing(48 scans). Similarly to previous tasks, we rotate, flipped andmirrored the images randomly, but without augmenting thedataset size.
Network architectures: The multi-scale strategy in theproposed network is based on the recently work in [23], and isconsidered as the lower baseline in our experiments. First, weperform an ablation study on the different proposed modulesto evaluate the impact of each choice in the segmentationperformance. The first two networks –i.e., Proposed (PAM)and Proposed (CAM)– extend the baseline by replacing theattention module by either the spatial or the channel self-attention module (Fig. 2), respectively. Then, both modulesare combined simultaneously, leading to the Proposed (DANet)model. In the next model –i.e., Proposed (MS-Dual)– theattention features generated by the dual attention module arerefined in a multi-step process, where a second dual attentionmodule is included. Last, the proposed architecture, referredto as Proposed (MS-Dual-Guided) extends the Proposed (MS-Dual) model by incorporating the semantic guidance (Fig. 3).We also evaluated the impact of different elements, other thanthe attention modules, on the proposed multi-scale architec-tures. First, we remove the deep supervision (first term in eq.10) on our model. Second, instead of using an encoder-decoderstructure to reconstruct the input features at each dual attentionmodule, we remove this and replace the eq. 7 by the mean errorsquare loss between the input and the output of each attentionmodule. This models is referred to as w/out encoder-decoder(dist). And last, we also investigated the effect of not havingan encoder-decoder, i.e., no guidance, in the refinements steps,which is referred to as w/out encoder-decoder). In addition,we evaluated the impact of having multiple refinements stepsn, with n = 1, 2, 3 and 5.
Furthermore we compared the performance of the pro-
2http://medicaldecathlon.com

6
posed network to other state-of-the-art architectures integratingattention: Attention UNet [25], DANet [19] and PyramidalAttention Network (PAN) [20].
Training and implementation details: We train all thenetworks using Adam optimizer with mini-batch of size 8,and with β1 and β2 set to 0.9 and 0.99, respectively. Whilemost of the networks converged during the first 250 epochs,we found that PAN [20] and DANet [19] needed around400 epochs to achieve the best results. The learning rate isinitially set to 0.001 and multiplied by 0.5 after 50 epochswithout improvement on the validation set. As a segmentationobjective function, we employ the cross-entropy error at eachpixel over all the categories for all the networks. Furthermore,as introduced in Section III, we use the objective functionin eq. (11) in the proposed architecture, with α, β and γset empirically to 1, 0.25 and 0.1, respectively. As input ofthe networks we employed 2D axial images of size 256 ×256. Experiments were performed in a server equipped witha Titan V. The code of our model is made publicly availableat https://github.com/sinAshish/Multi-Scale-Attention.
Evaluation: Similarity between ground truth and CNNsegmentations is assessed by employing several comparisonmetrics. First, we resort to the widely used Dice similaritycoefficient (DSC) to compare volumes based on their overlap.Further, we also assess the segmentation performance basedon the volume similarity (VS). Additionally, to measure thesensitivity to segmentation outline, we considered the use ofthe mean surface distance (MSD). The formulation of thesemetrics is detailed in the Supplemental materials. Since inter-slice distances and x-y spacing for each individual scan arenot provided, we report these results on voxels.
B. Results
Ablation study on the proposed attention modules: Tovalidate the individual contribution of different componentsto the segmentation performance, we perform an ablationexperiment under different settings. Table I reports the resultsof the different attention modules. Compared to the baseline,we observe that by integrating either a spatial (PAM) oran attention module (CAM) at each scale in the baselinearchitecture the performance improves between 2-3% in termsof overlapping and volume similarity, and between 12-18% interms of surface distances, as average. On the other hand, hav-ing both modules in parallel –i.e., Proposed (DANet)– bringsslightly better results in terms of DSC, but achieves lowerperformance when employing the surface distance metric.However, despite the lower average performance on the MSD,the proposed DANet model still achieves better results in 3 outof 4 structures compared to the channel attention model. Thistrend is repeated on the DSC metric, where DANet surpassesthe proposed CAM architecture in the same 3 structures: liverand both left and right kidneys. This suggests that, even thoughboth spatial and channel attention bring an improvement onthe performance, the channel attention module contributesmore than the spatial attention when they are combined. Iffeatures generated by the proposed DANet model are refinedin a second step –network referred to as Proposed(MS-Dual)–
the average results are further improved by nearly 0.7% and10% in volume and distance-based metrics, respectively. Last,the introduction of the semantic-guided loss –Proposed (MS-Dual-Guided)– results in an additional boost on performance,yielding to the best values in the three metrics: 86.75%(DSC),93.85%(VS) and 0.66 voxels (MSD). These results representan improvement of 4.5%, 4% and 26% in DSC, VS andMSD, respectively, compared to the baseline in [23], showingthe efficiency of the proposed attention network compared toindividual attention components.
Method DSC (%) VS (%) MSD (voxels)
Baseline (DAF [23]) 82.48 (±6.06) 89.68 (±4.48) 0.92 (±0.33)Proposed (PAM) 84.46 (±6.68) 91.84 (±4.77) 0.80 (±0.43)Proposed (CAM) 85.08 (±5.62) 92.18 (±5.07) 0.74 (±0.32)Proposed (DANet) 85.52 (±5.86) 92.07 (±5.23) 0.77 (±0.41)Proposed (MS-Dual) 86.17 (±5.78) 92.74 (±4.76) 0.67 (±0.30)Proposed (MS-Dual-Guided) 86.75 (±5.05) 93.85 (±3.50) 0.66 (±0.27)
TABLE I: Ablation study on different attention modules onthe Chaos dataset. The values show the average result of theexperiments averaged over the 3 folds. Best and second bestresults are represented in red and blue bold, respectively.
Proposed (MS-Dual and MS-Dual-Guided)
Model DSC (%) VS (%) MSD (voxels)
1 Refinement stepMS-Dual (No guidance) 85.75 (±5.08) 92.72 (±3.65) 0.71 (±0.28)MS-Dual-Guided 86.34 (±5.17) 93.47 (±3.78) 0.68 (±0.29)w/out deep supervision 84.71 (±4.86) 91.39 (±3.55) 0.75 (±0.17)w/out encoder-decoder (dist) 85.92 (±5.17) 92.94 (±4.04) 0.76 (±0.34)
2 Refinement stepsMS-Dual (No guidance) 86.17 (±5.78) 92.74 (±4.76) 0.67 (±0.30)MS-Dual-Guided 86.75 (±5.05) 93.85 (±3.50) 0.66 (±0.27)w/out deep supervision 83.51 (±5.52) 91.80 (±3.66) 0.75 (±0.16)w/out encoder-decoder (dist) 86.67 (±4.98) 93.67 (±3.38) 0.77 (±0.31)
3 Refinement stepsMS-Dual (No guidance) 86.26 (±5.71) 93.62 (±4.72) 0.71 (±0.34)MS-Dual-Guided 86.14 (±5.89) 93.50 (±3.98) 0.67 (±0.36)w/out deep supervision 83.22 (±5.72) 90.95 (±4.31) 0.80 (±0.17)w/out encoder-decoder (dist) 85.88 (±4.78) 93.23 (±3.71) 0.79 (±0.39)
5 Refinement stepsMS-Dual (No guidance) 86.33 (±4.98) 93.74 (±3.91) 0.71 (±0.31)MS-Dual-Guided 86.30 (±5.05) 93.16 (±4.11) 0.68 (±0.22)w/out deep supervision 83.88 (±5.78) 91.03 (±3.66) 0.87 (±0.34)w/out encoder-decoder (dist) 86.16 (±4.23) 92.98 (±2.93) 0.80 (±0.31)
TABLE II: Ablation study on different elements on the MS-Dual and MS-Dual-Guided architectures evaluated on theChaos dataset. The values show the average result of theexperiments on the 3 folds. Best results are represented inred bold, while blue is used to highlight the second bestperformance.
The impact of the refinement steps, as well as of the severalelements on both MS-Dual and MS-Dual-Guided models isreported in Table II. First, we can observe that increasingthe number of refinement steps does not typically improvethe performance of the methods. Indeed, best results areoften obtained with only two attention guided modules. Weargue that progressively refining feature maps may producean excessive focus to the attentive regions, leading to stronglymined attentive features. This has an adverse effect, as the

7
attentive features may concentrate in the most discriminativeareas, not covering the whole extent of the object. Further, weobserve that the proposed model including guided-attentionoutperforms all the variants, particularly in the distance-basedmetric. In addition, we provide a comparison in terms ofcomplexity, whose results are depicted in Table VIII, inSupplemental Materials.
Comparison to state-of-the-art: The experimental resultsobtained by several state-of-the-art segmentation networks arereported in Table III. In the first dataset (top), compared toother networks that were proposed in the context of medicalimage segmentation –i.e.,UNet [5], Attention UNet [25] andDAF [23]– our network achieves a mean improvement of5.6%, 4.3% and 2.0% (in terms of DSC), 4.9%, 4.2% and2.1% (on VS) and 25%, 26% and 6% (on MSD), respectively.This difference in performance could be explained by the factthat the attention modules integrated in [23] and [25] are muchsimpler than those proposed in our architecture. On the otherhand, attention modules on general computer vision tasks haveattracted more attention, resulting in more elaborated strategieswhich typically achieve better segmentation results. Amongthese architectures, the PAN model [20] with ResNet101 asbackbone –the same as ours– achieved the best results forsegmentation networks proposed for natural scenes. Despitethese competitive results, the proposed model still outperformsthe PAN architecture by 2.4%, 1.9% and 12% in DSC,VS and MSD. As PAN [20] also employed a multi-scalearchitecture, these differences suggest that the use of dualself-attention and a guided refinement module can actuallyimprove the performance of segmentation networks. Similarly,the proposed model outperforms other networks in the secondand third datasets (middle and bottom), indicating that it can bebroadly applied to segmentation of medical images in general.Individual per-class scores for both datasets are given in TablesV, VI and VII in Supplemental Material. In addition to thesevalues, we also depict the distribution of DSC, VS and MSDvalues on the 15 subjects used for evaluation in CHAOS forall the models (Fig. 7 in Supplemental Material).
Qualitative evaluation: To visualize the impact of thedifferent attention modules, Fig. 4 displays the segmentationresults on three CHAOS subjects. Despite the similar resultsreported on Table III for several architectures, the qualitativeresults depict interesting findings. First, we can observe thatUNet typically under-segments certain organs and gets con-fused easily. For example, in the second row it confused thesmall bowels with the spleen, while the spleen is not evenpresent in that slice. Integrating attention can overcome someof these limitations and improve the segmentation performanceby focusing the attention to relevant areas. This can beobserved in the results obtained by the other networks, which,up to some extent, reduce the amount of false positives.Nevertheless, it produces smoother segmentations, resultingin a loss of fine grained details. An interesting result is thesegmentation in the last row, where all the models except theproposed network get confused to segment the left kidney.While DANet and PAN models confuse the left kidney withthe right one, DAF is not able to detect any relevant regionrelated to the kidneys in that area. In addition, both UNet and
CHAOS
Model DSC VS MSD
UNet [5] 81.14 (±7.88) 89.01 (±4.82) 0.91 (±0.49)DANet [19] 83.89 (±9.54) 91.42 (±4.52) 0.78 (±0.23)PAN (ResNet34) [20] 82.70 (±6.51) 90.32 (±5.27) 0.86 (±0.29)PAN (ResNet101)[20] 84.34 (±6.17) 91.93 (±4.71) 0.78 (±0.31)DAF [23] 82.48 (±6.06) 89.68 (±4.48) 0.92 (±0.33)UNet Attention [25] 84.77 (±5.27) 91.79 (±3.53) 0.72 (±0.24)Proposed (MS-Dual-Guided) 86.75 (±5.05) 93.85 (±3.50) 0.66 (±0.27)
HSVM
DSC VS MSD
UNet [5] 79.80 (±6.72) 93.41 (±6.44) 1.68 (±1.28)DANet [19] 82.55 (±5.91) 94.65 (±4.45) 1.27 (±0.46)PAN (ResNet34) [20] 80.97 (±7.76) 93.76 (±5.85) 1.62 (±1.19)PAN (ResNet101)[20] 82.26 (±5.08) 94.33 (±3.69) 1.24 (±0.38)DAF [23] 81.78 (±5.71) 94.31 (±3.21) 1.48 (±0.50)UNet Attention [25] 81.58 (±6.84) 94.61 (±4.17) 1.25 (±0.42)Proposed (MS-Dual-Guided) 83.20 (±4.93) 94.45 (±2.39) 1.19 (±0.37)
BRATS’18
DSC VS MSD
UNet [5] 73.65 (±12.39) 87.72 (±8.70) 1.65 (±0.57)DANet [19] 79.09 (±10.89) 93.32 (±6.99) 0.95 (±0.33)PAN (ResNet34) [20] 74.12 (±12.76) 89.85 (±9.93) 1.42 (±0.52)PAN (ResNet101)[20] 76.89 (±11.53) 91.76 (±8.11) 1.17 (±0.47)DAF [23] 76.78 (±11.77) 90.58 (±9.03) 1.21 (±0.46)UNet Attention [25] 78.61 (±10.58) 92.66 (±6.86) 1.02 (±0.40)Proposed (MS-Dual-Guided) 80.37 (±10.74) 93.08 (±7.20) 0.90 (±0.36)
TABLE III: Comparison to other state-of-the-art architectureson the four analyzed datasets. Best and second best results arerepresented in red and blue bold, respectively.
UNet with attention models generate segmentations of the leftkidney that contain three organs, i.e., left and right kidneys andspleen, which is anatomically not plausible. Unlike all thesemodels, the proposed architecture does not get distracted byambiguous regions and some misclassified structures are nowcorrectly classified.
Similar results are observed on the segmentations obtainedin the BRATS’18 images (Fig. 5). Particularly, we can seethat the proposed network obtains finer details than the otherarchitectures. For example, small ramifications on the oedema(in green) are better captured by the proposed model (sec-ond row). Likewise, segmentation of necrotic areas (in red)achieved by our method is closer to the ground truth, speciallywhen the region has a complex shape (first row). These visualresults indicate that our approach can successfully recoverfiner segmentation details, while avoiding getting distractedin ambiguous regions. The selective integration of spatialinformation and among channel maps followed by a guidedattention module helps to capture context information. Thisdemonstrates that the proposed multi-scale guided attentionmodel can efficiently encode complimentary information toaccurately segment medical images.
Visual inspection of feature maps: Showing the per-formance difference through ablation studies and quantitativeevaluations alone may not be enough to fully understandthe benefits and behaviour of novel models. Although theproposed modules contribute to the performance improvement,as shown in the results, it is interesting to investigate whetherdifferent modules work as expected. To this end, we analyzesome attended feature maps from both the spatial and channel

8
Ground Truth UNet DANet
PAN(ResNet34)
PAN(ResNet101) DAF Attention
UNetProposed
Input Image
Fig. 4: Results on three subjects on the CHAOS Challenge dataset. The proposed multi-scale guided attention network achievesqualitatively better results than other state-of-the-art networks that also integrate attention modules.
Input MRI GT UNet DANet PAN (ResNet-34)
PAN (ResNet-101)
UNet Attention Proposed
Fig. 5: Results on three subjects on the BRATS Challenge dataset. In these figures, the following tumor structures are depicted:oedema (green), enhancing core (yellow) and necrotic or tumor core (red).
attention modules (Fig. 6). We find that the response of specificsemantic classes is more noticeable after the second guidedattention modules, i.e., PAM 2 and CAM 2 attentive features.While spatial and channel attention can highlight specific classsemantics in the first step of the guided module (second andthird column), some non-targeted regions are still highlightedon the semantic maps. Furthermore, highest values are alsomore spread over the entire image. Contrary, the proposedguided attention module generates features (fourth and fifthcolumns) that better focus on the specific regions of thestructures of interest. Particularly, it can be observed that thereexist feature maps whose highlighted areas concentrate on asingle organ, avoiding ambiguous regions that might result onmisclassification of some regions.
V. CONCLUSION
In this work, we introduced a novel attention architecturefor the task of medical image segmentation. This model incor-porates a multi-scale strategy to combine semantic informationat different levels and self-attention modules to progressivelyaggregate relevant contextual features. Last, a guided refine-ment module filters noisy regions and help the network tofocus on relevant class-specific regions in the image. Tovalidate our approach we conducted experiments on threedifferent segmentation tasks: abdominal organ, cardiovascularstructures and brain tumor. We provided extensive experimentsto evaluate the impact of the individual components of theproposed architecture. Besides, we compared our model toexisting approaches that integrate attention, which have been

9
Fig. 6: Visualization results of the channel maps. For eachrow, we show an input image, and the corresponding channelmaps from the outputs of spatial (PAM) and channel (CAM)attention module at guided module of the Fig. 3.
recently proposed for natural scene [19], [20] and medicalimage [5], [23], [25] segmentation. Experiment results showedthat the proposed model outperformed all previous approachesboth quantitative and qualitatively, which may be explained bythe enhanced ability to model rich contextual dependenciesover local features. This demonstrates the efficiency of ourapproach to provide precise and reliable automatic segmenta-tions of medical images.
ACKNOWLEDGMENTS
We wish to thank NVIDIA for its kind donation of the TitanV GPU used in this work.
REFERENCES
[1] G. Litjens et al., “A survey on deep learning in medical image analysis,”Medical image analysis, vol. 42, pp. 60–88, 2017.
[2] J. Dolz et al., “HyperDense-Net: A hyper-densely connected CNNfor multi-modal image segmentation,” IEEE transactions on medicalimaging, 2018.
[3] O. Bernard et al., “Deep learning techniques for automatic MRI cardiacmulti-structures segmentation and diagnosis: Is the problem solved?”IEEE transactions on medical imaging, vol. 37, no. 11, pp. 2514–2525,2018.
[4] J. Long, E. Shelhamer, and T. Darrell, “Fully convolutional networksfor semantic segmentation,” in Proceedings of the IEEE Conference onComputer Vision and Pattern Recognition, 2015, pp. 3431–3440.
[5] O. Ronneberger, P. Fischer, and T. Brox, “U-net: Convolutional networksfor biomedical image segmentation,” in International Conference onMedical image computing and computer-assisted intervention. Springer,2015, pp. 234–241.
[6] G. Lin et al., “Refinenet: Multi-path refinement networks for high-resolution semantic segmentation,” in Proceedings of the IEEE confer-ence on computer vision and pattern recognition, 2017, pp. 1925–1934.
[7] L.-C. Chen et al., “Deeplab: Semantic image segmentation with deepconvolutional nets, atrous convolution, and fully connected CRFs,” IEEEtransactions on pattern analysis and machine intelligence, vol. 40, no. 4,pp. 834–848, 2018.
[8] H. Zhao, J. Shi, X. Qi, X. Wang, and J. Jia, “Pyramid scene parsingnetwork,” in Proceedings of the IEEE conference on computer visionand pattern recognition, 2017, pp. 2881–2890.
[9] L.-C. Chen et al., “Encoder-decoder with atrous separable convolutionfor semantic image segmentation,” in Proceedings of the EuropeanConference on Computer Vision (ECCV), 2018, pp. 801–818.
[10] F. Yu and V. Koltun, “Multi-scale context aggregation by dilatedconvolutions,” in ICLR, 2016.
[11] W. Liu, A. Rabinovich, and A. C. Berg, “Parsenet: Looking wider tosee better,” arXiv preprint arXiv:1506.04579, 2015.
[12] X. Chu et al., “Multi-context attention for human pose estimation,” inProceedings of the IEEE Conference on Computer Vision and PatternRecognition, 2017, pp. 1831–1840.
[13] A. Gupta et al., “An attention model for group-level emotion recog-nition,” in Proceedings of the 2018 on International Conference onMultimodal Interaction. ACM, 2018, pp. 611–615.
[14] Z. Huang et al., “Mask R-CNN with pyramid attention network forscene text detection,” in 2019 IEEE Winter Conference on Applicationsof Computer Vision (WACV). IEEE, 2019, pp. 764–772.
[15] S. Chen, X. Tan, B. Wang, and X. Hu, “Reverse attention for salient ob-ject detection,” in Proceedings of the European Conference on ComputerVision (ECCV), 2018, pp. 234–250.
[16] K. Li et al., “Tell me where to look: Guided attention inference network,”in Proceedings of the IEEE Conference on Computer Vision and PatternRecognition, 2018, pp. 9215–9223.
[17] L.-C. Chen et al., “Attention to scale: Scale-aware semantic imagesegmentation,” in Proceedings of the IEEE conference on computervision and pattern recognition, 2016, pp. 3640–3649.
[18] H. Zhao et al., “PSANet: Point-wise spatial attention network for sceneparsing,” in Proceedings of the European Conference on ComputerVision (ECCV), 2018, pp. 267–283.
[19] J. Fu et al., “Dual attention network for scene segmentation,” in TheIEEE Conference on Computer Vision and Pattern Recognition (CVPR),2019.
[20] H. Li, P. Xiong, J. An, and L. Wang, “Pyramid attention network forsemantic segmentation,” in BMVC, 2018.
[21] C. Yu et al., “BiSeNet: Bilateral segmentation network for real-timesemantic segmentation,” in Proceedings of the European Conference onComputer Vision (ECCV), 2018, pp. 325–341.
[22] P. Zhang et al., “Deep gated attention networks for large-scale street-level scene segmentation,” Pattern Recognition, vol. 88, pp. 702–714,2019.
[23] Y. Wang et al., “Deep attentional features for prostate segmentation inultrasound,” in MICCAI, 2018.
[24] C. Li et al., “Attention based hierarchical aggregation network for 3Dleft atrial segmentation,” in International Workshop on Statistical Atlasesand Computational Models of the Heart. Springer, 2018, pp. 255–264.
[25] J. Schlemper et al., “Attention gated networks: Learning to leveragesalient regions in medical images,” Medical image analysis, vol. 53, pp.197–207, 2019.
[26] D. Nie, Y. Gao, L. Wang, and D. Shen, “ASDNet: Attention basedsemi-supervised deep networks for medical image segmentation,” inInternational Conference on Medical Image Computing and Computer-Assisted Intervention. Springer, 2018, pp. 370–378.
[27] A. G. Roy, N. Navab, and C. Wachinger, “Concurrent spatial and channelsqueeze & excitationin fully convolutional networks,” in InternationalConference on Medical Image Computing and Computer-Assisted Inter-vention. Springer, 2018, pp. 421–429.
[28] T. Heimann and H.-P. Meinzer, “Statistical shape models for 3D medicalimage segmentation: a review,” Medical image analysis, vol. 13, no. 4,pp. 543–563, 2009.
[29] J. Dolz, L. Massoptier, and M. Vermandel, “Segmentation algorithms ofsubcortical brain structures on MRI for radiotherapy and radiosurgery:a survey,” IRBM, vol. 36, no. 4, pp. 200–212, 2015.
[30] T. Fechter et al., “Esophagus segmentation in CT via 3D fully convo-lutional neural network and random walk,” Medical physics, vol. 44,no. 12, pp. 6341–6352, 2017.
[31] X. Li et al., “H-DenseUNet: hybrid densely connected UNet for liver andtumor segmentation from CT volumes,” IEEE transactions on medicalimaging, vol. 37, no. 12, pp. 2663–2674, 2018.
[32] Y. Man et al., “Deep Q learning driven CT pancreas segmentation withgeometry-aware U-Net,” IEEE transactions on medical imaging, 2019.
[33] J. Dolz, C. Desrosiers, and I. Ben Ayed, “3D fully convolutionalnetworks for subcortical segmentation in MRI: A large-scale study,”NeuroImage, vol. 170, pp. 456–470, 2018.
[34] A. Carass et al., “Comparing fully automated state-of-the-art cerebellumparcellation from magnetic resonance images,” NeuroImage, 2018.
[35] C. Zotti, Z. Luo, A. Lalande, and P.-M. Jodoin, “Convolutional neuralnetwork with shape prior applied to cardiac mri segmentation,” IEEEjournal of biomedical and health informatics, vol. 23, no. 3, pp. 1119–1128, 2018.
[36] J. Dolz et al., “Multiregion segmentation of bladder cancer structures inMRI with progressive dilated convolutional networks,” Medical physics,vol. 45, no. 12, pp. 5482–5493, 2018.

10
[37] D. Jin, D. Guo, T.-Y. Ho, A. P. Harrison, J. Xiao, C.-k. Tseng,and L. Lu, “Accurate esophageal gross tumor volume segmentationin PET/CT using two-stream chained 3D deep network fusion,” inInternational Conference on Medical Image Computing and Computer-Assisted Intervention. Springer, 2019, pp. 182–191.
[38] M. P. Heinrich, O. Oktay, and N. Bouteldja, “OBELISK-Net: Fewerlayers to solve 3D multi-organ segmentation with sparse deformableconvolutions,” Medical image analysis, vol. 54, pp. 1–9, 2019.
[39] Y. Wang, Y. Zhou, W. Shen, S. Park, E. K. Fishman, and A. L. Yuille,“Abdominal multi-organ segmentation with organ-attention networksand statistical fusion,” Medical image analysis, vol. 55, pp. 88–102,2019.
[40] M. Pedersoli, T. Lucas, C. Schmid, and J. Verbeek, “Areas of atten-tion for image captioning,” in Proceedings of the IEEE InternationalConference on Computer Vision, 2017, pp. 1242–1250.
[41] Z. Yang et al., “Stacked attention networks for image question answer-ing,” in Proceedings of the IEEE conference on computer vision andpattern recognition, 2016, pp. 21–29.
[42] F. Wang et al., “Residual attention network for image classification,” inProceedings of the IEEE Conference on Computer Vision and PatternRecognition, 2017, pp. 3156–3164.
[43] A. P. Parikh, O. Tackstrom, D. Das, and J. Uszkoreit, “A decomposableattention model for natural language inference,” in In EMNLP, 2016.
[44] A. Vaswani et al., “Attention is all you need,” in Advances in neuralinformation processing systems, 2017, pp. 5998–6008.
[45] X. Wang et al., “Non-local neural networks,” in Proceedings of theIEEE Conference on Computer Vision and Pattern Recognition, 2018,pp. 7794–7803.
[46] Z. Ji et al., “Stacked semantics-guided attention model for fine-grainedzero-shot learning,” in Advances in Neural Information ProcessingSystems, 2018, pp. 5995–6004.
[47] C. Peng et al., “Large kernel matters–improve semantic segmentation byglobal convolutional network,” in Proceedings of the IEEE conferenceon computer vision and pattern recognition, 2017, pp. 4353–4361.
[48] P. Arbelaez, M. Maire, C. Fowlkes, and J. Malik, “Contour detection andhierarchical image segmentation,” IEEE transactions on pattern analysisand machine intelligence, vol. 33, no. 5, pp. 898–916, 2010.
[49] B. Hariharan et al., “Hypercolumns for object segmentation and fine-grained localization,” in Proceedings of the IEEE conference on com-puter vision and pattern recognition, 2015, pp. 447–456.
[50] M. Mostajabi, P. Yadollahpour, and G. Shakhnarovich, “Feedforwardsemantic segmentation with zoom-out features,” in Proceedings of theIEEE conference on computer vision and pattern recognition, 2015, pp.3376–3385.
[51] L. Chen et al., “SCA-CNN: Spatial and channel-wise attention inconvolutional networks for image captioning,” in Proceedings of theIEEE conference on computer vision and pattern recognition, 2017, pp.5659–5667.
[52] C.-Y. Lee, S. Xie, P. Gallagher, Z. Zhang, and Z. Tu, “Deeply-supervisednets,” in Artificial Intelligence and Statistics, 2015, pp. 562–570.
[53] M. A. Selver, “Exploring brushlet based 3D textures in transfer functionspecification for direct volume rendering of abdominal organs,” IEEEtransactions on visualization and computer graphics, vol. 21, no. 2, pp.174–187, 2014.
[54] E. Selvi et al., “Segmentation of abdominal organs from MR imagesusing multi-level hierarchical classification,” Journal of the Faculty ofEngineering and Architecture of Gazi University, vol. 30, no. 3, pp.533–546, 2015.
[55] M. A. Selver, “Segmentation of abdominal organs from CT using amulti-level, hierarchical neural network strategy,” Computer methodsand programs in biomedicine, vol. 113, no. 3, pp. 830–852, 2014.
[56] D. F. Pace, A. V. Dalca, T. Geva, A. J. Powell, M. H. Moghari, andP. Golland, “Interactive whole-heart segmentation in congenital heartdisease,” in International Conference on Medical Image Computing andComputer-Assisted Intervention. Springer, 2015, pp. 80–88.
[57] B. H. Menze, A. Jakab, S. Bauer, J. Kalpathy-Cramer, K. Farahani,J. Kirby, Y. Burren, N. Porz, J. Slotboom, R. Wiest et al., “Themultimodal brain tumor image segmentation benchmark (brats),” IEEEtransactions on medical imaging, vol. 34, no. 10, pp. 1993–2024, 2014.
[58] S. Bakas, H. Akbari, A. Sotiras, M. Bilello, M. Rozycki, J. S. Kirby,J. B. Freymann, K. Farahani, and C. Davatzikos, “Advancing the cancergenome atlas glioma mri collections with expert segmentation labels andradiomic features,” Scientific data, vol. 4, p. 170117, 2017.
[59] S. Bakas, M. Reyes, A. Jakab, S. Bauer, M. Rempfler, A. Crimi, R. T.Shinohara, C. Berger, S. M. Ha, M. Rozycki et al., “Identifying the bestmachine learning algorithms for brain tumor segmentation, progression
assessment, and overall survival prediction in the brats challenge,” arXivpreprint arXiv:1811.02629, 2018.
1
Supplemental Materials
Evaluation metrics: formulationIn this section, we give the formal definition of the metrics
employed to evaluate the proposed architecture.a) Dice Similarity Coefficient (DSC): Given two vol-
umes A and B, their DSC can be defined as:
DSC =2 |A ∩B||A|+ |B|
(12)
In this metric, values close to 1 indicate high degree ofoverlapping, whereas near 0 represent not overlapping at all.
b) Volume Similarity (VS): Further, we also assess thesegmentation performance based on the volume similarity,which is formulated as:
VS = 1− abs(A−B)/(A+B) (13)
c) Mean Surface Distance (MSD): The MSD betweencontours A and B is defined as follows:
MSD =1
|A|+ |B|
(∑a∈A
minb∈B
d(a, b) +∑b∈B
mina∈A
d(b, a)
)(14)
MSD =1
|A|+ |B|
(∑a∈A
d(a, b) +∑b∈B
d(b, a)
)(15)
where d(a, b) is the distance between a point a on thesurface A and the surface B, which is given by the minimumof the Euclidean norm:
d(a,B) = minb∈B‖a− b‖22 (16)
Additional resultsTables IV, V and VI report the extended version of the
experimental results on the ablation study and comparisonto other state-of-the-art networks. In these tables, individualresults on single organs are also included to provide the readera wider view of the performance of the different methods.We can observe that the proposed architecture is consistentlyoutperforming other models, ranking either first or secondin almost all the organs for all the evaluation metrics. Theonly exception is the result obtained for liver segmentation interms of volume similarity, where all the models obtain almostidentical results.
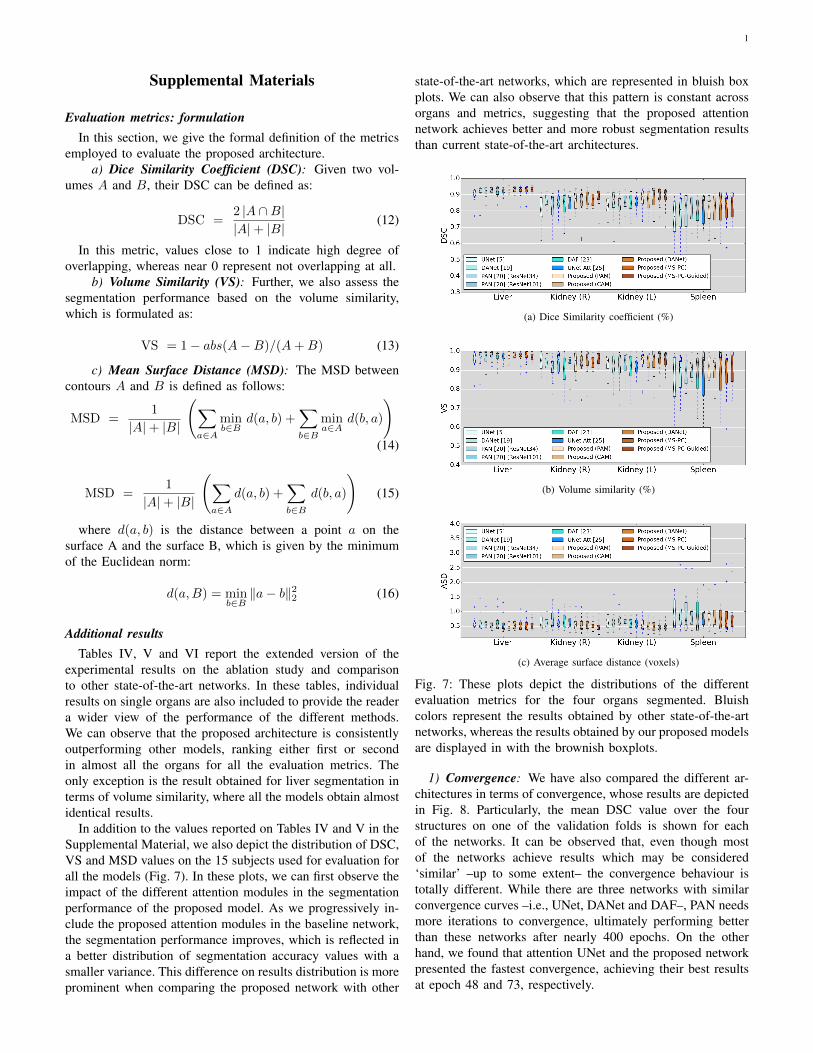
In addition to the values reported on Tables IV and V in theSupplemental Material, we also depict the distribution of DSC,VS and MSD values on the 15 subjects used for evaluation forall the models (Fig. 7). In these plots, we can first observe theimpact of the different attention modules in the segmentationperformance of the proposed model. As we progressively in-clude the proposed attention modules in the baseline network,the segmentation performance improves, which is reflected ina better distribution of segmentation accuracy values with asmaller variance. This difference on results distribution is moreprominent when comparing the proposed network with other
state-of-the-art networks, which are represented in bluish boxplots. We can also observe that this pattern is constant acrossorgans and metrics, suggesting that the proposed attentionnetwork achieves better and more robust segmentation resultsthan current state-of-the-art architectures.
(a) Dice Similarity coefficient (%)
(b) Volume similarity (%)
(c) Average surface distance (voxels)
Fig. 7: These plots depict the distributions of the differentevaluation metrics for the four organs segmented. Bluishcolors represent the results obtained by other state-of-the-artnetworks, whereas the results obtained by our proposed modelsare displayed in with the brownish boxplots.
1) Convergence: We have also compared the different ar-chitectures in terms of convergence, whose results are depictedin Fig. 8. Particularly, the mean DSC value over the fourstructures on one of the validation folds is shown for eachof the networks. It can be observed that, even though mostof the networks achieve results which may be considered‘similar’ –up to some extent– the convergence behaviour istotally different. While there are three networks with similarconvergence curves –i.e., UNet, DANet and DAF–, PAN needsmore iterations to convergence, ultimately performing betterthan these networks after nearly 400 epochs. On the otherhand, we found that attention UNet and the proposed networkpresented the fastest convergence, achieving their best resultsat epoch 48 and 73, respectively.
2
DSC (%)
Method Liver Kidney R Kidney L Spleen Mean
Baseline (DAF [23]) 91.66 (±2.99) 79.28 (±18.68) 83.63 (±7.56) 75.35 (±20.41) 82.48 (±6.06)Proposed (PAM) 91.89 (±4.29) 85.47 (±7.04) 86.84 (±6.53) 73.65 (±22.62) 84.46 (±6.68)Proposed (CAM) 92.58 (±2.65) 84.52 (±9.34) 86.38 (±6.27) 76.84 (±20.56) 85.08 (±5.62)Proposed (DANet) 92.60 (±3.20) 85.29 (±7.96) 87.74 (±6.37) 76.44 (±22.17) 85.52 (±5.86)Proposed (MS-Dual) 92.62 (±3.08) 86.29 (±5.98) 88.82 (±4.84) 76.96 (±19.87) 86.17 (±5.78)Proposed (MS-Dual-Guided) 92.46 (±2.82) 87.96 (±6.46) 88.01 (±6.16) 78.61 (±18.69) 86.75 (±5.05)
Volume similarity (VS) (%)
Liver Kidney R Kidney L Spleen Mean
Proposed( DAF [23]) 96.69 (±3.21) 86.75 (±16.41) 90.29 (±8.39) 84.98 (±14.42) 89.68 (±4.48)Proposed (PAM) 96.62 (±4.62) 92.83 (±7.43) 93.96 (±6.46) 83.93 (±20.54) 91.84 (±4.77)Proposed (CAM) 97.25 (±2.95) 93.78 (±6.04) 93.98 (±5.48) 83.72 (±20.97) 92.18 (±5.07)Proposed (DANet) 97.04 (±3.03) 94.50 (±5.96) 93.43 (±7.03) 83.30 (±22.53) 92.07 (±5.23)Proposed (MS-Dual) 97.47 (±3.07) 93.30 (±4.11) 95.27 (±4.89) 84.90 (±16.86) 92.74 (±4.76)Proposed (MS-Dual-Guided) 96.44 (±3.15) 96.14 (±3.15) 94.95 (±4.48) 87.87 (±15.23) 93.85 (±3.50)
Average Surface Distance (MSD) (voxels)
Liver Kidney R Kidney L Spleen Mean
Baseline( DAF [23]) 0.64 (±0.29) 0.97 (±1.08) 0.63 (±0.25) 1.45 (±2.04) 0.92 (±0.33)Proposed (PAM) 0.55 (±0.19) 0.56 (±0.23) 0.55 (±0.21) 1.54 (±2.40) 0.80 (±0.43)Proposed (CAM) 0.58 (±0.22) 0.57 (±0.24) 0.52 (±0.20) 1.29 (±1.64) 0.74 (±0.32)Proposed (DANet) 0.54 (±0.19) 0.56 (±0.19) 0.50 (±0.18) 1.49 (±2.29) 0.77 (±0.41)Proposed (MS-Dual) 0.53 (±0.18) 0.51 (±0.14) 0.46 (±0.14) 1.19 (±1.42) 0.67 (±0.30)Proposed (MS-Dual-Guided) 0.54 (±0.16) 0.48 (±0.18) 0.48 (±0.14) 1.13 (±1.24) 0.66 (±0.27)
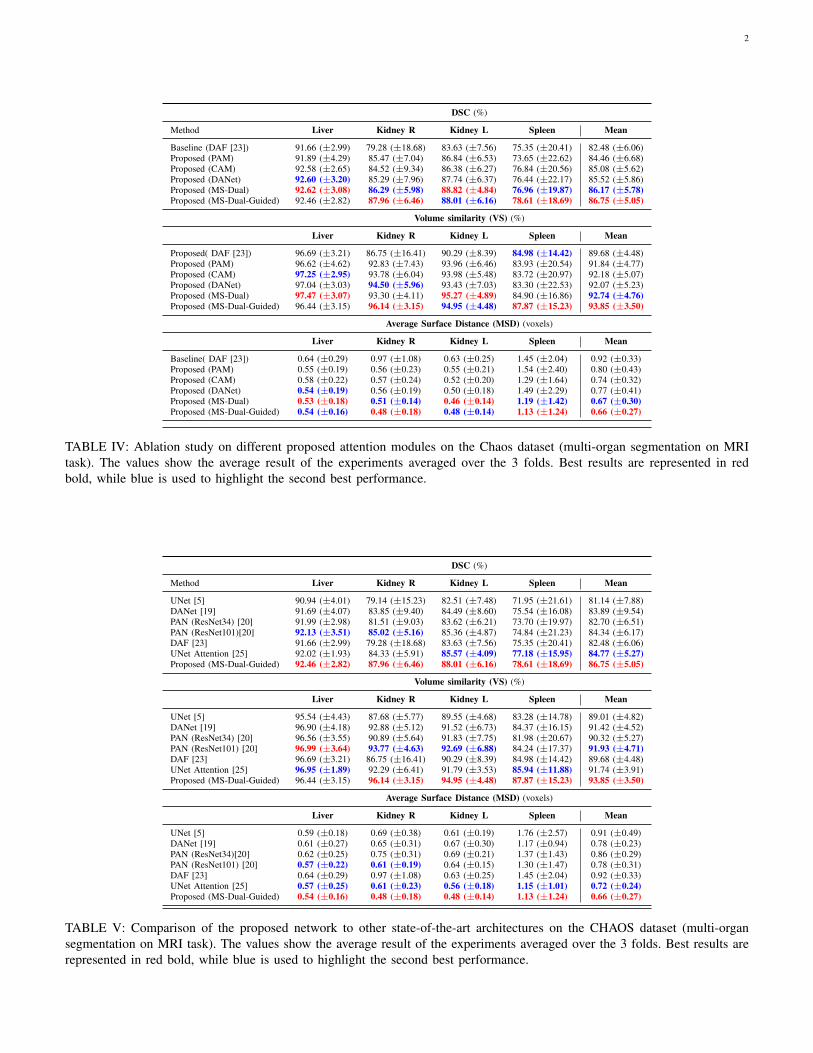
TABLE IV: Ablation study on different proposed attention modules on the Chaos dataset (multi-organ segmentation on MRItask). The values show the average result of the experiments averaged over the 3 folds. Best results are represented in redbold, while blue is used to highlight the second best performance.
DSC (%)
Method Liver Kidney R Kidney L Spleen Mean
UNet [5] 90.94 (±4.01) 79.14 (±15.23) 82.51 (±7.48) 71.95 (±21.61) 81.14 (±7.88)DANet [19] 91.69 (±4.07) 83.85 (±9.40) 84.49 (±8.60) 75.54 (±16.08) 83.89 (±9.54)PAN (ResNet34) [20] 91.99 (±2.98) 81.51 (±9.03) 83.62 (±6.21) 73.70 (±19.97) 82.70 (±6.51)PAN (ResNet101)[20] 92.13 (±3.51) 85.02 (±5.16) 85.36 (±4.87) 74.84 (±21.23) 84.34 (±6.17)DAF [23] 91.66 (±2.99) 79.28 (±18.68) 83.63 (±7.56) 75.35 (±20.41) 82.48 (±6.06)UNet Attention [25] 92.02 (±1.93) 84.33 (±5.91) 85.57 (±4.09) 77.18 (±15.95) 84.77 (±5.27)Proposed (MS-Dual-Guided) 92.46 (±2.82) 87.96 (±6.46) 88.01 (±6.16) 78.61 (±18.69) 86.75 (±5.05)
Volume similarity (VS) (%)
Liver Kidney R Kidney L Spleen Mean
UNet [5] 95.54 (±4.43) 87.68 (±5.77) 89.55 (±4.68) 83.28 (±14.78) 89.01 (±4.82)DANet [19] 96.90 (±4.18) 92.88 (±5.12) 91.52 (±6.73) 84.37 (±16.15) 91.42 (±4.52)PAN (ResNet34) [20] 96.56 (±3.55) 90.89 (±5.64) 91.83 (±7.75) 81.98 (±20.67) 90.32 (±5.27)PAN (ResNet101) [20] 96.99 (±3.64) 93.77 (±4.63) 92.69 (±6.88) 84.24 (±17.37) 91.93 (±4.71)DAF [23] 96.69 (±3.21) 86.75 (±16.41) 90.29 (±8.39) 84.98 (±14.42) 89.68 (±4.48)UNet Attention [25] 96.95 (±1.89) 92.29 (±6.41) 91.79 (±3.53) 85.94 (±11.88) 91.74 (±3.91)Proposed (MS-Dual-Guided) 96.44 (±3.15) 96.14 (±3.15) 94.95 (±4.48) 87.87 (±15.23) 93.85 (±3.50)
Average Surface Distance (MSD) (voxels)
Liver Kidney R Kidney L Spleen Mean
UNet [5] 0.59 (±0.18) 0.69 (±0.38) 0.61 (±0.19) 1.76 (±2.57) 0.91 (±0.49)DANet [19] 0.61 (±0.27) 0.65 (±0.31) 0.67 (±0.30) 1.17 (±0.94) 0.78 (±0.23)PAN (ResNet34)[20] 0.62 (±0.25) 0.75 (±0.31) 0.69 (±0.21) 1.37 (±1.43) 0.86 (±0.29)PAN (ResNet101) [20] 0.57 (±0.22) 0.61 (±0.19) 0.64 (±0.15) 1.30 (±1.47) 0.78 (±0.31)DAF [23] 0.64 (±0.29) 0.97 (±1.08) 0.63 (±0.25) 1.45 (±2.04) 0.92 (±0.33)UNet Attention [25] 0.57 (±0.25) 0.61 (±0.23) 0.56 (±0.18) 1.15 (±1.01) 0.72 (±0.24)Proposed (MS-Dual-Guided) 0.54 (±0.16) 0.48 (±0.18) 0.48 (±0.14) 1.13 (±1.24) 0.66 (±0.27)
TABLE V: Comparison of the proposed network to other state-of-the-art architectures on the CHAOS dataset (multi-organsegmentation on MRI task). The values show the average result of the experiments averaged over the 3 folds. Best results arerepresented in red bold, while blue is used to highlight the second best performance.

3
DSC
Method Myocardium Blood Pool Mean
UNet [5] 71.77 (±9.36) 87.84 (±4.35) 79.80 (±6.72)DANet [19] 75.85 (±9.10) 89.24 (±3.56) 82.55 (±5.91)PAN (ResNet34) [20] 72.90 (±11.93) 89.04 (±3.69) 80.97 (±7.76)PAN (ResNet101)[20] 74.98 (±7.68) 89.53 (±2.97) 82.26 (±5.08)DAF [23] 74.08 (±8.55) 89.48 (±3.39) 81.78 (±5.71)UNet Attention [25] 74.50 (±10.13) 88.66 (±4.25) 81.58 (±6.84)Proposed 77.10 (±6.94) 89.30 (±3.50) 83.20 (±4.93)
Volume similarity (VS)
Myocardium Blood Pool Mean
UNet [5] 91.05 (±9.75) 95.78 (±4.04) 93.41 (±6.44)DANet [19] 91.80 (±8.95) 97.50 (±3.01) 94.65 (±4.45)PAN (ResNet34) [20] 90.58 (±10.89) 96.93 (±3.66) 93.76 (±5.85)PAN (ResNet101) [20] 91.42 (±7.59) 97.23 (±2.36) 94.33 (±3.69)DAF [23] 91.73 (±6.30) 96.89 (±2.33) 94.31 (±3.21)UNet Attention [25] 92.52 (±7.66) 96.69 (±2.20) 94.61 (±4.17)Proposed 92.08 (±4.39) 96.82 (±2.76) 94.45 (±2.39)
Average Surface Distance (MSD)
Myocardium Blood pool Mean
UNet [5] 1.82 (±1.48) 1.55 (±1.08) 1.68 (±1.28)DANet [19] 1.23 (±0.51) 1.32 (±0.46) 1.27 (±0.46)PAN (ResNet34)[20] 1.97 (±1.84) 1.26 (±0.48) 1.62 (±1.19)PAN (ResNet101) [20] 1.33 (±0.53) 1.15 (±0.30) 1.24 (±0.38)DAF [23] 1.41 (±0.45) 1.44 (±0.46) 1.48 (±0.50)UNet Attention [25] 1.24 (±0.42) 1.25 (±0.39) 1.25 (±0.42)Proposed 1.15 (±0.33) 1.24 (±0.43) 1.19 (±0.37)
TABLE VI: Comparison of the proposed network to otherstate-of-the-art architectures on the HVSMR 2016 dataset. Thevalues show the average result of the experiments on the 5folds.
Fig. 8: Evolution of the mean validation DSC over time.

4
DSC (%)
Method ED ET TC – Mean
UNet [5] 84.87 (±6.82) 56.38 (±27.55) 79.71 (±11.70) – 73.65 (±12.39)DANet [19] 88.24 (±5.39) 63.69 (±22.25) 85.33 (±6.92) – 79.09 (±10.89)PAN (ResNet34) [20] 85.25 (±6.64) 55.89 (±27.76) 81.23 (±8.22) – 74.12 (±12.76)PAN (ResNet101)[20] 87.07 (±6.67) 60.77 (±24.74) 82.82 (±8.76) – 76.89 (±11.53)DAF [23] 86.87 (±5.94) 60.28 (±24.74) 83.18 (±8.39) – 76.78 (±11.77)UNet Attention [25] 87.50 (±5.66) 63.74 (±22.65) 84.59 (±7.43) – 78.61 (±10.58)Proposed (MS-Dual-Guided) 89.11 (±4.94) 65.25 (±.2285) 86.76 (±6.49) – 80.37 (±10.74)
Volume similarity (VS) (%)
ED ET TC – Mean
UNet [5] 96.36 (±4.08) 75.81 (±27.23) 90.99 (±11.63) – 87.72 (±8.70)DANet [19] 99.04 (±1.21) 83.47 (±20.11) 97.45 (±2.95) – 93.32 (±6.99)PAN (ResNet34) [20] 98.05 (±1.98) 75.87 (±28.17) 95.63 (±4.41) – 89.85 (±9.93)PAN (ResNet101) [20] 98.68 (±2.21) 80.38 (±24.83) 96.22 (±5.89) – 91.76 (±8.11)DAF [23] 97.99 (±2.10) 77.86 (±24.92) 95.88 (±5.26) – 90.58 (±9.03)UNet Attention [25] 98.14 (±1.88) 82.99 (±21.09) 96.84 (±2.87) – 92.66 (±6.86)Proposed (MS-Dual-Guided) 98.54 (±1.76) 82.91 (±20.17) 97.78 (±2.56) – 93.08 (±7.20)
Average Surface Distance (MSD) (voxels)
ED ET TC - Mean
UNet [5] 0.99 (±0.33) 2.37 (±1.74) 1.56 (±1.34) – 1.65 (±0.57)DANet [19] 0.67 (±0.16) 1.43 (±0.95) 0.78 (±0.25) – 0.95 (±0.33)PAN (ResNet34)[20] 0.86 (±0.20) 2.29 (±1.87) 1.10 (±0.47) – 1.42 (±0.52)PAN (ResNet101) [20] 0.74 (±0.19) 1.79 (±1.35) 0.96 (±0.48) – 1.17 (±0.47)DAF [23] 0.76 (±0.17) 1.84 (±1.33) 1.02 (±0.66) – 1.21 (±0.46)UNet Attention [25] 0.69 (±0.18) 1.58 (±1.12) 0.79 (±0.29) – 1.02 (±0.40)Proposed (MS-Dual-Guided) 0.58 (±0.14) 1.40 (±1.02) 0.71 (±0.31) – 0.90 (±0.36)
TABLE VII: Comparison of the proposed network to other state-of-the-art architectures on the BRATS 2018 dataset (multi-organ segmentation on MRI task). The values show the average result of the experiments averaged over the 3 folds. Best resultsare represented in red bold, while blue is used to highlight the second best performance.
Model complexity
Model # Params1 Iter 2 Iter 3 Iter 5 Iter
UNet 31,030,853 - - - -PAN (ResNet34) 21,323,991 - - - -PAN (ResNet101) 42,675,415 - - - -UNet Attention 34,877,681 - - - -DANet (ResNet101) 68,475,961 - - - -Proposed(DAF) 43,482,179 - - - -Proposed(PAM) 43,486,343 - - - -Proposed(CAM) 43,485,543 - - - -Proposed(DANet) 43,980,179 - - - -MS-Dual (No guidance) - 43,485,831 44,411,103 45,337,675 47,190,819MS-Dual-Guided - 50,531,399 58,499,679 66,470,539 82,412,259MS-Dual-Guided (No Deep Sup) - 50,530,099 58,498,379 66,467,939 82,407,059MS-Dual-Guided (Dist) - 43,485,831 44,411,103 45,337,675 47,190,819
TABLE VIII: Model complexity, measured in number ofparameters, for the evaluated models.