Multi-projection fluorescence optical tomography using a handheld-probe-based optical imager:...
12
Multi-projection fluorescence optical tomography using a handheld-probe-based optical imager: phantom studies Jiajia Ge, 1,2 Sarah J. Erickson, 1,3 and Anuradha Godavarty 1, * 1 Department of Biomedical Engineering, Optical Imaging Laboratory, EC 2675, Florida International University, 10555 West Flagler Street, Miami, Florida 33174, USA 2 e‑mail: [email protected] 3 e‑mail: [email protected] *Corresponding author: [email protected] Received 18 February 2010; revised 7 July 2010; accepted 7 July 2010; posted 8 July 2010 (Doc. ID 124281); published 4 August 2010 A handheld-probe-based optical imager has recently been developed toward three-dimensional tomogra- phy. In this study, the improvement of target depth recovery was demonstrated using a multi-projection technique on large slab phantoms using 0:45 cc fluorescing target(s) (with 1∶0 contrast ratio) of 1.5 to 2:5 cm deep. Tomographic results using single- and multi- (here dual) projection measurements (with and without a priori information of target location) were compared. In all experimental cases, the use of mul- ti-projection measurements along with a priori information recovered target depth and location closer to their true values, demonstrating its applicability for clinical translation. © 2010 Optical Society of America OCIS codes: 170.4580, 110.6955, 170.6960. 1. Introduction Ongoing efforts in optical imaging and tomography are focused on the clinical translation of the technol- ogy toward early-stage breast cancer diagnostics and other varied functional imaging applications. In the process, handheld optical imagers are rapidly emer- ging as an alternate to the bulky optical imagers due to their portability and flexibility to image any tissue volume and geometry with a cost-effective instru- mentation setup [1–13]. However, the currently available handheld-based optical imagers have not been developed to perform three-dimensional (3-D) tomographic imaging without guidance from other imaging modalities. Recently, a novel handheld- probe-based optical imager has been developed in our Optical Imaging Laboratory (OIL) toward 3-D to- mographic imaging on large tissue volumes [14,15]. Preliminary 3-D tomographic imaging was success- fully demonstrated using frequency-domain fluores- cence measurements obtained from large slab phantoms (∼650 ml volume) employing the hand- held-probe-based imager. These fluorescence reflec- tance measurements were acquired from a single location on a phantom face that was closer to the target (i.e., using a single projected image of the phantom). Although 3-D target location and volume were tomographically reconstructed, the recovered target depth was always closer to the imaging plane in comparison to the true depth. Similar observa- tions of limited target depth recovery were made by other researchers using optical imaging systems that provided only reflectance measurements (simi- lar to our handheld optical imager). Improvement in target depth recovery is possible by acquiring tran- sillumination measurements apart from reflectance measurements. However, a handheld-probe-based imager is typically limited to obtaining reflectance 0003-6935/10/234343-12$15.00/0 © 2010 Optical Society of America 10 August 2010 / Vol. 49, No. 23 / APPLIED OPTICS 4343
Transcript of Multi-projection fluorescence optical tomography using a handheld-probe-based optical imager:...
Multi-projection fluorescence optical tomographyusing a handheld-probe-based optical imager:
phantom studies
Jiajia Ge,1,2 Sarah J. Erickson,1,3 and Anuradha Godavarty1,*1Department of Biomedical Engineering, Optical Imaging Laboratory, EC 2675,
Florida International University, 10555 West Flagler Street, Miami, Florida 33174, USA2e‑mail: [email protected]
3e‑mail: [email protected]
*Corresponding author: [email protected]
Received 18 February 2010; revised 7 July 2010; accepted 7 July 2010;posted 8 July 2010 (Doc. ID 124281); published 4 August 2010
A handheld-probe-based optical imager has recently been developed toward three-dimensional tomogra-phy. In this study, the improvement of target depth recovery was demonstrated using a multi-projectiontechnique on large slab phantoms using 0:45 cc fluorescing target(s) (with 1∶0 contrast ratio) of 1.5 to2:5 cm deep. Tomographic results using single- andmulti- (here dual) projectionmeasurements (with andwithout a priori information of target location) were compared. In all experimental cases, the use of mul-ti-projection measurements along with a priori information recovered target depth and location closer totheir true values, demonstrating its applicability for clinical translation. © 2010 Optical Society ofAmericaOCIS codes: 170.4580, 110.6955, 170.6960.
1. Introduction
Ongoing efforts in optical imaging and tomographyare focused on the clinical translation of the technol-ogy toward early-stage breast cancer diagnostics andother varied functional imaging applications. In theprocess, handheld optical imagers are rapidly emer-ging as an alternate to the bulky optical imagers dueto their portability and flexibility to image any tissuevolume and geometry with a cost-effective instru-mentation setup [1–13]. However, the currentlyavailable handheld-based optical imagers have notbeen developed to perform three-dimensional (3-D)tomographic imaging without guidance from otherimaging modalities. Recently, a novel handheld-probe-based optical imager has been developed inour Optical Imaging Laboratory (OIL) toward 3-D to-mographic imaging on large tissue volumes [14,15].
Preliminary 3-D tomographic imaging was success-fully demonstrated using frequency-domain fluores-cence measurements obtained from large slabphantoms (∼650ml volume) employing the hand-held-probe-based imager. These fluorescence reflec-tance measurements were acquired from a singlelocation on a phantom face that was closer to thetarget (i.e., using a single projected image of thephantom). Although 3-D target location and volumewere tomographically reconstructed, the recoveredtarget depth was always closer to the imaging planein comparison to the true depth. Similar observa-tions of limited target depth recovery were madeby other researchers using optical imaging systemsthat provided only reflectance measurements (simi-lar to our handheld optical imager). Improvement intarget depth recovery is possible by acquiring tran-sillumination measurements apart from reflectancemeasurements. However, a handheld-probe-basedimager is typically limited to obtaining reflectance
0003-6935/10/234343-12$15.00/0© 2010 Optical Society of America
10 August 2010 / Vol. 49, No. 23 / APPLIED OPTICS 4343

measurements; although reflectance measurementscan be obtained at multiple locations or angles onthe tissue geometry toward improved tomographicresolution.
A multi-projection and dual-projection techniquefor diffusive optical tomography has been performedon slab geometry by Markel and Schotland [16,17].Their simulated slab phantom studies demonstratedthat multiple projections can significantly improvethe spatial resolution during tomography. Similar ob-servations were made by Lasser and Ntziachristos[18] and Deliolanis et al. [19] during their small ani-mal fluorescence tomography studies. In their study,when the number of projections around a 360° cylin-der enclosing a rat increased up to 18 projectionswith respect to a single or fewer number of projec-tions, the spatial resolution of the tomographicallyreconstructed target (or tumor) was significantly en-hanced. However, both the above studies focused onspatial resolution instead of target depth recovery,which has not been an issue for their imagingsystems since it acquired transillumination (ortransmittance) measurements.
In the current work, a multi-projection-basedimaging technique will be employed towardfluorescence-enhanced optical tomography studieson largephantoms (∼650ml)using ahandheld-probe-based optical imager that acquires only reflectancemeasurements using simultaneous-illumination-based measurement geometry (over the widely usedsequential-illumination-based geometry). This workis different from our pastwork using the handheld op-tical imager, wherein only single-project-based ima-ging was performed toward 3-D tomography studies(thus limiting the target depth recovery).
Additionally, unlike past work by other researchers[16,17], where a multi-projection technique acquiredreflectance and transillumination measurements(with multi-source projections onto fixed detectorrings), themulti-projection technique in this case willinvolve the rotation of the handheld probe (containingboth sources and detectors) onto multiple faces of thetissue phantom. Although the current approach al-lows the acquisition of only reflectance measure-ments, the flexibility to image using a handheldprobe onto any tissue volume and curvaturemake theimager advantageous in a clinical setting. The effectof using only reflectancemeasurements frommultipleprojections (or scans) toward improvement in the re-
constructed target depthwill be assessedwith respectto tomographic imaging employing reflectance mea-surements from a single projection (or scan). The de-tails of the handheld-probe-based optical imagerand the frequency-domain-fluorescence-based ex-perimental studies performed on large volumephantoms (∼650ml) are described in the followingsections. Further, 3-D reconstruction results fromsingle- and multi-projection measurements are com-pared. In addition, a priori information of the possibletarget location obtained from multiple projections oftwo-dimensional (2-D) surface images are used to de-termine their impact on the reconstruction quality.
2. Material and Methods
A. Instrumentation
A handheld-probe-based optical imager is used forperforming fluorescence-enhanced optical imagingstudies on slab phantoms. The imaging system in-cludes a handheld probe, a laser-diode light source,and a gain modulated intensified charge-coupleddevice (ICCD) detection system (see Fig. 1) [15].The handheld probe consists of a probe head of5 cm × 10 cm, a custom-built collection fiber bundle,and a source fiber bundle [14]. Six simultaneous illu-mination fibers and 165 collection fibers are ar-ranged on the probe head as shown in Fig. 1(b).The intensity of six simultaneous point sources onthe probe head are measured using an optical power-meter (PM 100, Thorlabs Inc., Newton, New Jersey)and are accounted into tomography studies. Theprinciple behind this frequency-domain ICCD-basedoptical imager is as described below. Initially, themodulated laser light from the laser diode (530mW,HPD1005-9MM, Intense Ltd., North Brunswick,New Jersey) illuminates the tissue phantom surfacevia simultaneous illuminating fiber(s) of the hand-held probe. The NIR signal emitted from the tissuephantom surface is acquired by collection fibers ofthe handheld probe and imaged using a 16 bit, 1024 ×1024 pixel CCD camera (PI-SCX 7495-0002, RoperScientific, Trenton, New Jersey) that is opticallycoupled with an image intensifier (FS9910, ITTNight Vision, Virginia). A focusing lens (50mm,f =1:8 D AF model, Nikon Inc., Melville, New York)for image focus, and interference filters (HRF-830.0, blocking OD 6 & F-830.0, blocking OD 4,CVI Laser, Albuquerque, New Mexico) for excitation
Fig. 1. (Color online) Instrumentation of the handheld-probe-based ICCD optical imager: (a) the entire imaging system, (b) the handheldprobe in its flat position, and (c) the cubical phantom used for imaging, with the container filled with 1% Liposyn during experiments.
4344 APPLIED OPTICS / Vol. 49, No. 23 / 10 August 2010

light rejection are coupled to the ICCD camera via alens assembly. The imaging system is operated in thehomodyne mode, meaning that both the source andthe detector ends are modulated at the same fre-quency (here 100MHz). The two frequency synthesi-zers generating the radio frequency (RF) signal atthe source end (HP 8656B, Hayward, California)and detector end (PTS 310, Programmed TestSources Inc., Littleton, Massachusetts) are phaselocked. By introducing phase delays varying from0 to 2π (here 32 delays) between the two frequencysynthesizers, steady-state phase-sensitive intensityimages are acquired [15,20]. Fast Fourier transformis used to extract the amplitude and phase-shift in-formation from the acquired steady-state images.The extracted amplitude and phase-shift data arethen used toward tomography studies. For all experi-mental cases, a subtraction-based postprocessingtechnique was employed for eliminating excitationleakage. By subtracting the background noise (i.e.,measurements obtained from homogeneous non-fluorescing phantoms) from fluorescence opticalmeasurements obtained from a given experimentalcase, the excitation leakage can be partially removed.More details of the instrumentation and the dataacquisition procedure can be found elsewhere [15].
B. Phantom Studies
A transparent acrylic container filled with 1% Lipo-syn solution (volume of 10 cm × 6:5 cm × 10 cm) wasused as a tissue phantom [see Fig. 1(c)]. A hollowclear plastic sphere (volume of 0:45 cm3) filled with1 μM Indocyanine Green (ICG) in 1% Liposyn solu-tion was used to mimic a single target (or tumor). So-dium polyaspartate (MW 3000–8000, Sigma-AldrichChemical Co., St. Louis, Missouri) was used as a sta-bilizer for ICG. The optical properties of 1% Liposynsolution at both 785 and 830nm were measuredusing a single-pixel frequency-domain homodynesystem (custom-built in the OIL). The optical proper-ties of the fluorescence target were calculated fromthe contrast agent’s concentration and extinctioncoefficient (listed in Table 1) [20].
Phantom studies were performed at different tar-get locations and depths (1.5, 2, and 2:5 cm) as shownin Table 2. Frequency-domain reflectance measure-
ments of the fluorescence signal were acquired onall sides of the slab phantom (Sides A, B, C, and D),as shown in Fig. 1(c). Because the phantom size islarge (10 cm × 6:5 cm × 10 cm), detection of the targetis not feasible from all sides of the phantom, as lighttends to exponentially decay when it propagatesthrough the tissue-mimicking medium. Hence, inall our experimental cases, the target positioningwas chosen such that it can be detected from at leasttwo sides of the phantom, in order to assess the im-pact of multi-projection imaging on 3-D tomography.The tomographic target depth recovery using only re-flectance-based optical measurements (from singleprojection) tends to degrade beyond 1:5 cm, as ob-served by other researchers, as well [15,21–25].Hence, our studies were not focused on depths smal-ler than 1:5 cm, but begin from 1:5 cm and go deeper.The target location (centroid) during various experi-mental cases is listed in Table 2 and its depth withrespect to different sides of the phantom (i.e., SidesA, B, C, and D) is also provided. During surface ima-ging, the target was not detectable when imagedfrom Sides C and D due to the greater target depthswith respect to those sides (see Table 2). Hence, onlymeasurements taken from Sides A and B of the phan-tom were employed in the 2-D studies because thepostsubtraction signal intensity detected from SidesC and D is only at noise level.
C. Multi-Projection-Based Fluorescence Surface Imaging
Frequency-domain fluorescence measurements (i.e.,amplitude and phase shift) were obtained for the dif-ferent experimental cases. The detected amplitude ateach imaging plane (i.e., Sides A and B) is shown as a2-D surface contour plot using Tecplot 10 (Tecplot,Inc., Bellevue, Washington). The 2-D location of thedata point that has maximum amplitude on the sur-face contour plot was estimated as the center of thetarget. By projecting the target information obtainedfrom each 2-D imaging plane onto a simulated 3-Dphantom, a rough estimate of the 3-D target locationwas obtained.
D. Three-Dimensional Image Reconstructions
Three-dimensional image reconstructions wereperformed using a computationally efficient approxi-mate extended Kalman filter (AEKF) algorithm
Table 1. Optical Properties of Phantom and Fluorescent Target for All Experimental Cases
Optical Properties
μax ðcm−1Þ μam ðcm−1Þμsxe ðcm−1Þ μsmf ðcm−1Þ Φg τh (ns)μaxf a μaxib μamf
c μamid
Target 0.3 0.04 0.506 0.046 10.87 9.82 0.0108 0.56Background 0.00 0.051 0.00 0.054 9.34 7.42 8
aAbsorption coefficient of the fluorophores at excitation wavelengths.bAbsorption coefficient of the chromophores at excitation wavelengths.cAbsorption coefficient of the fluorophores at emission wavelengths.dAbsorption coefficient of the chromophores at emission wavelengths.eScattering coefficient of the chromophores at excitation wavelengths.fScattering coefficient of the chromophores at emission wavelengths.gQuantum efficiency of ICG.hLifetime of ICG.
10 August 2010 / Vol. 49, No. 23 / APPLIED OPTICS 4345
[15,20,26], in order to obtain the 3-Dmap of the fluor-escence absorption coefficient at excitation wave-length (μaxf ) over the entire phantom volume bysolving the coupled diffusion equations using aGaler-kin-based finite-element approach. The AEKF algo-rithm recursively updated the unknown parameter(μaxf ) and parameter error covariance (i.e., the spa-tially variant error betweenmeasurements from eachiteration) until the latter was less than the conver-gence criteria (described below). The inverse processwas damped and regularized by measurement errorcovariance (i.e., the spatially variant error betweeneach repeated experimental measurements), andthe model error covariance (i.e., the spatially varianterror between experimental and simulated measure-ments), which was empirically assigned as 1=4 ofmeasurement error covariance [15,26]. As an initialguess, the unknown parameter (μaxf ) was assumedto be homogeneous with an arbitrary small value of0:003 cm−1 for the entire phantom, and the parametererror covariancewasarbitrarily set to 0.01.The recon-structions were considered converged when the rootmean square output error was<0:005 or the iterationnumber was equal to 50 (whichever criteria was firstmet). In all these studies, the reconstructed fluores-cence absorption (μaxf ) distribution is presented as3-D isosurface plots, which applied a cutoff value thatwas chosen based on the first break point of the μaxfhistogram plot to differentiate the target region fromthe background. The same cutoff value was also ap-plied to quantitative comparison between recoveredand true target details in terms of the 3-D target loca-tion (i.e., the centroid of the 3-D target) [15].
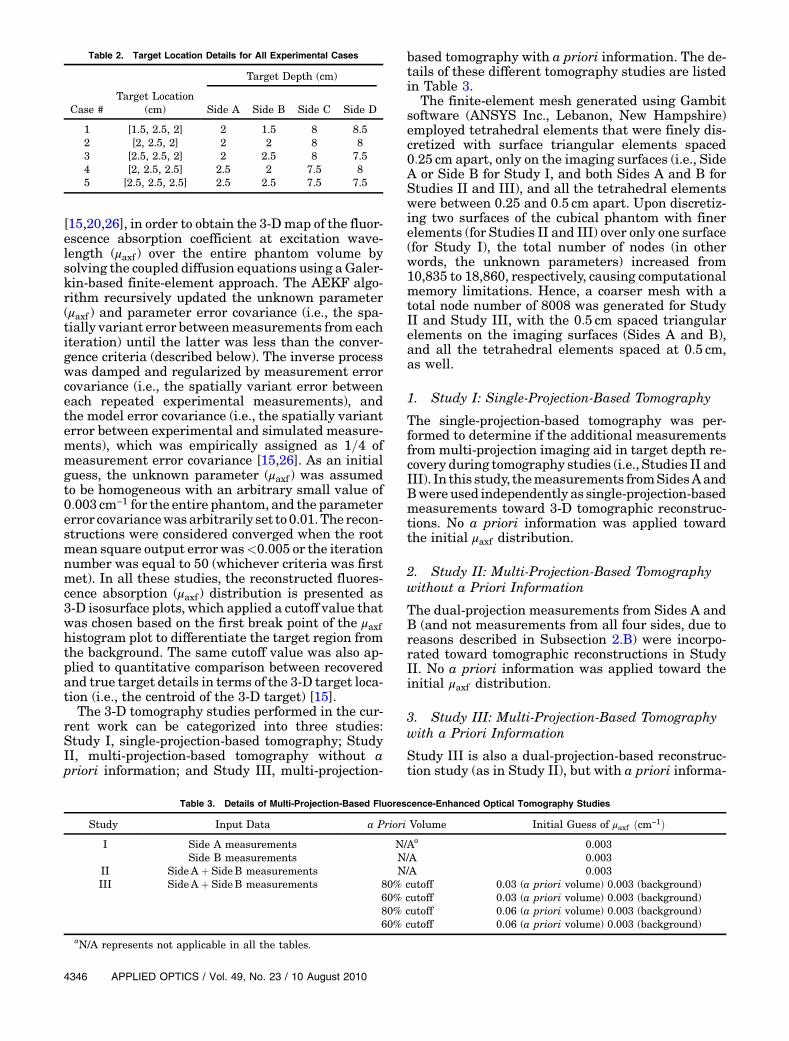
The 3-D tomography studies performed in the cur-rent work can be categorized into three studies:Study I, single-projection-based tomography; StudyII, multi-projection-based tomography without apriori information; and Study III, multi-projection-
based tomography with a priori information. The de-tails of these different tomography studies are listedin Table 3.
The finite-element mesh generated using Gambitsoftware (ANSYS Inc., Lebanon, New Hampshire)employed tetrahedral elements that were finely dis-cretized with surface triangular elements spaced0:25 cm apart, only on the imaging surfaces (i.e., SideA or Side B for Study I, and both Sides A and B forStudies II and III), and all the tetrahedral elementswere between 0.25 and 0:5 cm apart. Upon discretiz-ing two surfaces of the cubical phantom with finerelements (for Studies II and III) over only one surface(for Study I), the total number of nodes (in otherwords, the unknown parameters) increased from10,835 to 18,860, respectively, causing computationalmemory limitations. Hence, a coarser mesh with atotal node number of 8008 was generated for StudyII and Study III, with the 0:5 cm spaced triangularelements on the imaging surfaces (Sides A and B),and all the tetrahedral elements spaced at 0:5 cm,as well.
1. Study I: Single-Projection-Based Tomography
The single-projection-based tomography was per-formed to determine if the additional measurementsfrom multi-projection imaging aid in target depth re-covery during tomography studies (i.e., Studies II andIII). In this study, themeasurements fromSidesAandBwereused independently as single-projection-basedmeasurements toward 3-D tomographic reconstruc-tions. No a priori information was applied towardthe initial μaxf distribution.
2. Study II: Multi-Projection-Based Tomographywithout a Priori Information
The dual-projection measurements from Sides A andB (and not measurements from all four sides, due toreasons described in Subsection 2.B) were incorpo-rated toward tomographic reconstructions in StudyII. No a priori information was applied toward theinitial μaxf distribution.
3. Study III: Multi-Projection-Based Tomographywith a Priori Information
Study III is also a dual-projection-based reconstruc-tion study (as in Study II), but with a priori informa-
Table 2. Target Location Details for All Experimental Cases
Case #Target Location
(cm)
Target Depth (cm)
Side A Side B Side C Side D
1 [1.5, 2.5, 2] 2 1.5 8 8.52 [2, 2.5, 2] 2 2 8 83 [2.5, 2.5, 2] 2 2.5 8 7.54 [2, 2.5, 2.5] 2.5 2 7.5 85 [2.5, 2.5, 2.5] 2.5 2.5 7.5 7.5
Table 3. Details of Multi-Projection-Based Fluorescence-Enhanced Optical Tomography Studies
Study Input Data a Priori Volume Initial Guess of μaxf ðcm−1ÞI Side A measurements N/Aa 0.003
Side B measurements N/A 0.003II SideA þ SideB measurements N/A 0.003III SideA þ SideB measurements 80% cutoff 0.03 (a priori volume) 0.003 (background)
60% cutoff 0.03 (a priori volume) 0.003 (background)80% cutoff 0.06 (a priori volume) 0.003 (background)60% cutoff 0.06 (a priori volume) 0.003 (background)
aN/A represents not applicable in all the tables.
4346 APPLIED OPTICS / Vol. 49, No. 23 / 10 August 2010

tion applied toward the initial μaxf distribution. The apriori information is the possible target location es-timated from 2-D surface fluorescence images of thephantom (Sides A and B). By performing simplebackprojection based on two perpendicular 2-D sur-face images, a rough estimate of the possible targetlocation is obtained and incorporated into tomogra-phy as a volumetric region with an elevated initialμaxf value. This a priori volumetric region is esti-mated using different cutoff values, such as 90%,80%, and 60% of maximum amplitude on the surfaceimages. The 90% cutoff value tends to generate verysmall, even zero a priori volume, hence its resultswere not included in Study III. The elevated μaxf va-lue was arbitrarily chosen as 20 and 10 times higherthan the initially assumed background μaxf value(0:003 cm−1), i.e., 20∶1 and 10∶1, respectively. Differ-ent cases of elevated μaxf contrast ratios and volu-metric regions were chosen to determine theireffect on the quality of 3-D image reconstructions(as listed in Table 3).
3. Results and Discussion
A. Multi-Projection-Based Fluorescence Surface Imaging
Frequency-domain optical measurements were ob-tained from all four sides of the phantom in each ex-perimental case, but only measurements from SidesA and B contained fluorescence signals above thenoise floor in all the cases (see Subsection 2.B).The combined surface images obtained from SidesA and B are shown in Fig. 2 for all the experimental
cases, and the 3-D target locations estimated fromthese surface images are listed in Table 4.
For example, the 2-D surface plot of case 3 [Side Aof Fig. 2(c)] shows that the target location was esti-mated at ½x; y� ¼ ½2:4; 3:1� cm (always taken at thepoint of maximum fluorescence amplitude on thecontour plot) at the X–Y plane. From the surface plotat the Z–Y plane [Side B of Fig. 2(c)], which showedthe detected amplitude distribution on Side B of thephantom, the target location was estimated at½z; y� ¼ ½1:7; 2:6� cm. By combining the estimated 2-Dtarget locations obtained from both sides, the targetcan be localized at ½x; y� ¼ ½2:4; 2:6–3:1; 1:7� cm, whichis close to the true target location of ½x; y; z� ¼½2:5; 2:5; 2� cm. The comparison between the esti-mated 3-D target location with respect to the truetarget location for all the experimental cases is listedin Table 4. From Fig. 2 and Table 4, it is evident thatthe target 3-D location can be tentatively estimatedusing surface measurements obtained from at leasttwo sides (i.e., dual projection) of the phantom.
It can also be observed that the estimated 3-D tar-get locations are slightly distance-off from the truetarget locations (listed in Table 4) for all experimen-tal cases. This distance-off is possibly due to the un-certainty in placing the phantom/target in the darkroom, or the limited number of detection points onthe probe (0:5 cm apart). The latter can be overcomeby moving the probe along the tissue surface with asmall step size (i.e., 0.1 to 0:2 cm) in future studies.
Surface contour plots represent a diffuse area offluorescence signal distribution and are not capable
Fig. 2. (Color online) Two-sided surface contour plots of fluorescence amplitude obtained from frequency-domain multi-projection ima-ging studies for all experimental cases [(a) to (e) corresponding to cases 1 to 5]. The projected 2-D target location is shown as black opencircles on Sides A and B of the phantom. The solid red sphere in the phantom represents the true 3-D target location. Each surface contourplot was normalized with respect to the maximum amplitude in that particular scan at a given probe location.
10 August 2010 / Vol. 49, No. 23 / APPLIED OPTICS 4347

of estimating (or quantifying) the target sizeand/or itsoptical properties. To perform quantitative breastimaging in terms of 3-D target localization and char-acterization (i.e., optical properties), 3-D tomographystudies are essential and, hence, are performed in thecurrent work using multi-projection measurements.
B. Multi-Projection Fluorescence Optical Tomography
Three-dimensional tomography studies wereperformed on a 10 cm × 6:5 cm × 10 cm slab phantomemploying the multi-projection measurements. Onlymeasurements from two projections (Sides A and B)
were incorporated into 3-D reconstructions (seeSubsection 2.D.2), and the results are described foreach experimental case using single- or multi-projection measurements (with or without a prioriinformation) as described in Table 3.
1. Study I: Single-Projection-Based FluorescenceTomography
The reconstruction results based on single projection(i.e., using measurements from only one side of thephantom, here Side A or Side B) are listed inTables 5–9 for experimental cases 1 to 5, respectively,and also shown as 3-D isosurface contour plots inFig. 3. FromFigs. 3(a)–3(e) (tomography results usingSide A measurements) and Figs. 3(f) and 3(j) (tomo-graphy results using Side B measurements), it canbe observed that the reconstructed target locationagreed with its true location in the transverse direc-tion (parallel to the imaging plane). However, the tar-get depth, which was perpendicular to the imagingplane (i.e., z axis for Side A measurements, x axisfor Side B measurements), reconstructed closer tothe phantom surface in all the experimental cases.
Table 4. Estimated 3-D Target Location from Multi-Projection-Based Fluorescence Surface Imaging Studies for All
Experimental Cases
Case#True TargetLocation (cm)
Estimated TargetLocation (cm)
1 [1.5, 2.5, 2] [1.5, 2.7–3.0, 2.5]2 [2, 2.5, 2] [1.7, 2.7–2.9, 2.3]3 [2.5, 2.5, 2] [2.4, 2.6–3.1, 1.7]4 [2, 2.5, 2.5] [2, 2.2–2.5, 2.3]5 [2.5, 2.5, 2.5] [2.5, 2.1, 2.1]
Fig. 3. (Color online) Isosurface contour plots of the 3-D image reconstructions based on single-projectionmeasurements presented in theX–Y and X–Z planes for Side A measurement-based reconstructions, and the Z –Y and Z–X planes for Side B measurement-based re-constructions, using 1% Liposyn phantom under perfect uptake conditions for Study I. Tomography studies performed using single-projection-based measurements at Side A of phantom (X–Y plane) is shown in (a) to (e) for experimental cases 1 to 5, respectively.Tomography studies performed using single-projection-based measurements at Side B of phantom (Z–Y plane) is shown in (f) to (j)for experimental cases 1 to 5, respectively. A single 0:45 cc target was located at ½1:5;2:5;2� cm in (a) and (f), at [2, 2.5, 2.5] in (b) and(g), at [2.5, 2.5, 2] in (c) and (h), at [2, 2.5, 2.5] in (d) and (i), and at [2.5, 2.5, 2.5] in (e) and (j). The solid sphere in each plot representsthe true target location and the irregular solid region represents the reconstructed target location. A cutoff value (selected based on thefirst break point of histogram plot of μaxf ) was applied to isosurface contour plots in order to differentiate the target from the background.Only 4 cm along the depth is presented in the plot, although the total depth for Side A is Z ¼ 10 cm and for Side B is X ¼ 10 cm.
4348 APPLIED OPTICS / Vol. 49, No. 23 / 10 August 2010
The limitation in depth recovery using single-projection measurements could possibly be due tothe physics of using only reflectance measurementstoward tomographic reconstructions, as also observedby other researchers [15,21–25]. The underestimatedtarget depth with respect to one imaging plane canpossibly be recovered using measurements obtainedfrom a different imaging plane (i.e., another projec-tion). For example, in experimental case 1, the targetdepth of 2 cm toward Side A (z axis) is recovered at0:5 cm when using Side A measurements toward to-mography. However, this target depth recovery im-proves to 1:9 cm when using Side B measurementsduring tomography, since the z axis in this case isthe transverse direction with respect to the imagingplane and not the depth. This suggested a possibilityin target depth recovery improvement, by incorporat-ing multi-projection (here at least dual) measure-ments toward 3-D tomographic reconstructions.
2. Study II: Multi-Projection Tomography withouta Priori Information
The reconstruction results based on multi-projectionmeasurements (i.e., using measurements from bothsides of the phantom, here Sides A and B) withouta priori information were listed in Tables 5–9 for ex-perimental cases 1 to 5, respectively, and also shownas 3-D isosurface contour plots in Fig. 4. It was ob-served from Fig. 4 (tomography results using bothSides A andBmeasurements) that the reconstructionresults did not effectively improve the target depth re-covery in comparison to using single-projection-based
measurements. Instead the target tends to be recon-structed as single or two targets that are closer totheir reconstructed locations using the two indepen-dent single-projection measurements (from Side A orSide B or both sides), along with artifacts in somecases. Similar tomography results were obtainedupon using simulated measurements instead of ex-perimental data, further emphasizing that the inabil-ity to reconstruct a single target closer to the truelocation may possibly be from the physics of how si-multaneously illuminating (here six) light propagatesand interacts with a target, or from the inverse algo-rithm employed.
Although multi-projection-based tomography stu-dies (simulated or on small animals) have been per-formed in the past by other researchers [16–19], noissues of multiple target recovery of a single true tar-get were observed from employing multi-projectionmeasurements. This is possibly because the experi-mental system in the current study is different interms of using simultaneously illuminating sources(over the commonly used sequential sources), reflec-tance-based measurements (over transilluminationmeasurements employed in the past multi-projec-tion-based measurements). Alternatively, differencesin the computational tools (or inverse algorithms)employed may also be the reason for the quality ofimage reconstructions. Future experimental studiesusing our handheld optical imager will involve theuse of sequential source illumination and alternatereconstruction algorithm(s), in order to determinethe possible cause of reconstructing two targets
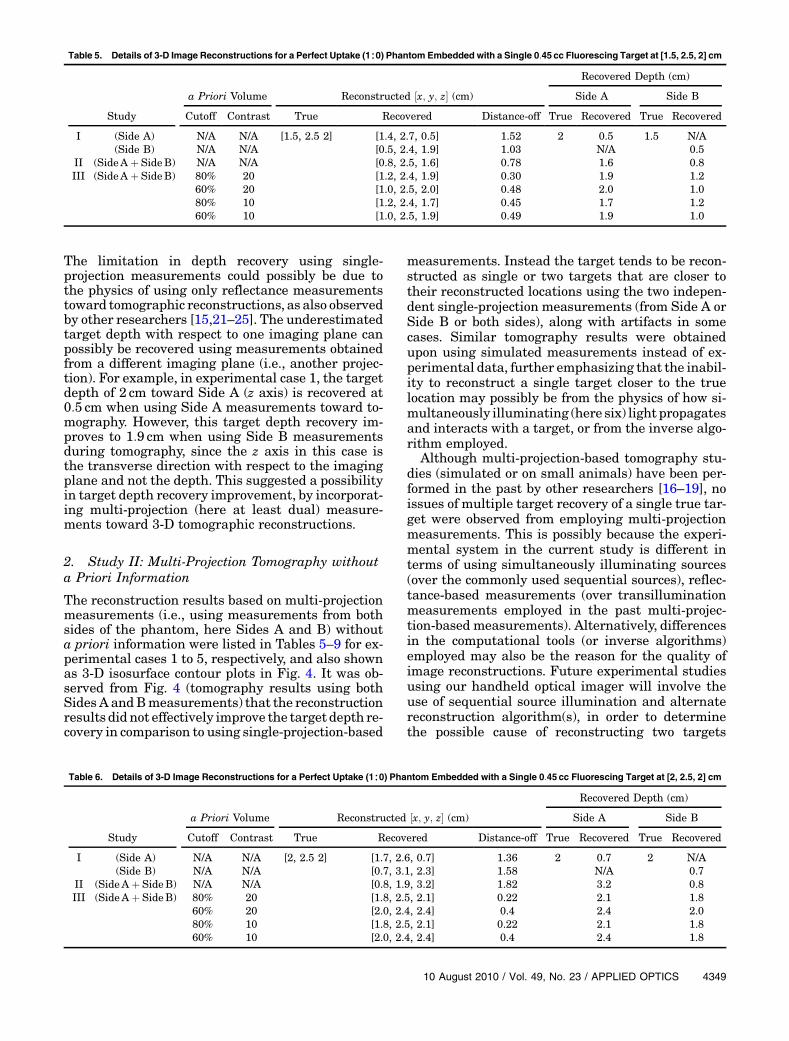
Table 5. Details of 3-D Image Reconstructions for a Perfect Uptake (1∶0) Phantom Embedded with a Single 0:45 cc Fluorescing Target at [1.5, 2.5, 2] cm
a Priori Volume Reconstructed ½x; y; z� (cm)
Recovered Depth (cm)
Side A Side B
Study Cutoff Contrast True Recovered Distance-off True Recovered True Recovered
I (Side A) N/A N/A [1.5, 2.5 2] [1.4, 2.7, 0.5] 1.52 2 0.5 1.5 N/A(Side B) N/A N/A [0.5, 2.4, 1.9] 1.03 N/A 0.5
II (SideA þ SideB) N/A N/A [0.8, 2.5, 1.6] 0.78 1.6 0.8III (SideA þ SideB) 80% 20 [1.2, 2.4, 1.9] 0.30 1.9 1.2
60% 20 [1.0, 2.5, 2.0] 0.48 2.0 1.080% 10 [1.2, 2.4, 1.7] 0.45 1.7 1.260% 10 [1.0, 2.5, 1.9] 0.49 1.9 1.0
Table 6. Details of 3-D Image Reconstructions for a Perfect Uptake (1∶0) Phantom Embedded with a Single 0:45 cc Fluorescing Target at [2, 2.5, 2] cm
a Priori Volume Reconstructed ½x; y; z� (cm)
Recovered Depth (cm)
Side A Side B
Study Cutoff Contrast True Recovered Distance-off True Recovered True Recovered
I (Side A) N/A N/A [2, 2.5 2] [1.7, 2.6, 0.7] 1.36 2 0.7 2 N/A(Side B) N/A N/A [0.7, 3.1, 2.3] 1.58 N/A 0.7
II (SideA þ SideB) N/A N/A [0.8, 1.9, 3.2] 1.82 3.2 0.8III (SideA þ SideB) 80% 20 [1.8, 2.5, 2.1] 0.22 2.1 1.8
60% 20 [2.0, 2.4, 2.4] 0.4 2.4 2.080% 10 [1.8, 2.5, 2.1] 0.22 2.1 1.860% 10 [2.0, 2.4, 2.4] 0.4 2.4 1.8
10 August 2010 / Vol. 49, No. 23 / APPLIED OPTICS 4349
instead of one as observed from most of thecurrent cases.
In short, the current experimental and simulatedresults indicated that simple incorporation of multi-projection measurements into tomographic recon-structions is not sufficient for improvement in targetdepth recovery, using our handheld-probe-based op-tical imager. Hence, in our following tomographystudy, we implemented a priori information of the es-timated target’s 3-D location (and volume) in order toassess its effectiveness in reconstructing a single tar-get with improved depth recovery. The reconstruc-tion results were compared to those obtained fromStudies I and II.
3. Study III: Multi-Projection Tomography with aPriori Information
The reconstruction results based on multi-projectionmeasurements (i.e., both Sides A and B of the phan-tom) incorporated with different a priori target volu-metric regions and initial μaxf guesses (as describedin Table 3) were listed in Tables 5–9 for experimentalcases 1 to 5, respectively. Three-dimensional isosur-face contour plots were generated using the recon-struction results for all the experimental cases, butonly a portion of the results (using a priori informa-tion obtained using 80% cutoff values and 10∶1 opti-cal contrast for experimental cases 1 to 5) are shownin Fig. 5, for brevity. For each experimental case, thereconstruction results were first compared withinStudy III, which was performed using different apriori conditions. The average distances off between
the true and the recovered target 3-D locations(based on all experimental cases) are 0.48 and0:53 cm for an initial optical contrast of 20∶1 and10∶1, respectively, of the a priori target regions.Since the difference between the recovered andthe true target locations using either of the twoinitial optical contrast ratios was not significant(∼0:5mm), a smaller contrast for the a priori regionwas chosen in order to control the impact of a prioriinformation on reconstructions. When the cutoff va-lue of 80% was applied to obtain the a priori region,the recovered target was consistently but slightly clo-ser to the true target location in all the experimentalcases, than when the cutoff value of 60% was applied.The average distance-off between the true and therecovered target 3-D locations (based on all experi-mental cases) differed by <1:5mm between the re-construction results employing the 80% cutoff andthe 60% cutoff values as a priori information (aver-age distance-off for 80% and 60% cutoff was 0.44and 0:58 cm, respectively). Hence, the reconstructionresults of two-sided measurement with a priori infor-mation that was based on 80% cutoff values and 10∶1target-to-background contrast values were chosenfor comparing the single- (Study I) and multi-projection-based (Study III) tomography, and itsreconstruction results are shown as 3-D isosurfacecontour plots (Fig. 5).
Comparing the reconstruction results from Study Iand Study III (guided by the a priori information ob-tained using an 80% cutoff value and a target/background ratio of 10), it was observed that thetarget localization was significantly improved using
Table 7. Details of 3-D Image Reconstructions for a Perfect Uptake (1∶0) Phantom Embedded with a Single 0:45 cc Fluorescing Target at [2.5, 2.5, 2] cm
a Priori Volume Reconstructed ½x; y; z� (cm)
Recovered Depth (cm)
Side A Side B
Study Cutoff Contrast True Recovered Distance-off True Recovered True Recovered
I (Side A) N/A N/A [2.5, 2.5, 2] [2.1, 2.6, 0.6] 1.42 2 0.6 2.5 N/A(Side B) N/A N/A [0.9, 2.9, 2.0] 1.63 N/A 0.9
II (SideA þ SideB) N/A N/A [0.7, 2.7, 1.4] 1.89 1.4 0.7III (SideA þ SideB) 80% 20 [1.8, 2.2, 2.1] 0.70 2.1 1.8
60% 20 [1.5, 2.6, 2.1] 1.02 2.1 1.580% 10 [1.5, 2.4, 1.9] 0.98 1.9 1.560% 10 [1.5, 2.6, 2.1] 1.02 2.1 1.5
Table 8. Details of 3-D Image Reconstructions for a Perfect Uptake (1∶0) Phantom Embedded with a Single 0:45 cc Fluorescing Target at [2, 2.5, 2.5] cm
a Priori Volume Reconstructed ½x; y; z� (cm)
Recovered Depth (cm)
Side A Side B
Study Cutoff Contrast True Recovered Distance-off True Recovered True Recovered
I (Side A) N/A N/A [2, 2.5, 2.5] [1.9, 2.5, 0.7] 1.83 2.5 0.7 2 N/A(Side B) N/A N/A [1.1, 2.5, 2.5] 0.94 N/A 1.1
II (SideA þ SideB) N/A N/A [0.4, 3.8, 7.7] 5.57 7.7 0.4III (SideA þ SideB) 80% 20 [2.1, 2.3, 2.4] 0.22 2.4 2.1
60% 20 [2.1, 2.3, 2.4] 0.23 2.4 2.180% 10 [2.1, 2.3, 2.4] 0.22 2.4 2.160% 10 [2.1, 2.3, 2.4] 0.23 2.4 2.1
4350 APPLIED OPTICS / Vol. 49, No. 23 / 10 August 2010

Table 9. Details of 3-D Image Reconstructions for a Perfect Uptake (1∶0) Phantom Embedded with a Single 0:45 cc Fluorescing Targetat [2.5, 2.5, 2.5] cm
a Priori VolumeReconstructed½x; y; z� (cm)
Recovered Depth (cm)
Side A Side B
Study Cutoff Contrast True Recovered Distance-off True Recovered True Recovered
I (Side A) N/A N/A [2.5, 2.5, 2.5] [2.4, 2.4, 0.7] 1.84 2.5 0.7 2.5 N/A(Side B) N/A N/A [0.4, 1.9, 2.2] 2.21 N/A 0.4
II (SideA þ SideB) N/A N/A [3.7, 1.7, 0.9] 2.18 0.9 3.7III (SideA þ SideB) 80% 20 [2.7, 2.2, 2.1] 0.56 2.1 2.7
60% 20 [2.5, 2.1, 1.9] 0.76 1.9 2.580% 10 [2.7, 2.0, 2.1] 0.56 2.1 2.760% 10 [2.5, 2.1, 1.9] 0.74 1.9 2.5
Fig. 4. (Color online) Isosurface contour plots of the 3-D image reconstructions based on measurements from both Side A and Side B ofphantom (i.e., X–Y plane and Z–Y plane of phantom) were presented in theX–Y andX–Z planes, using 1% Liposyn phantom under perfectuptake conditions for Study II. A single 0:45 cc target was located at (a) [1.5, 2.5, 2], (b) [2, 2.5, 2], (c) [2.5, 2.5, 2], (d) [2, 2.5, 2.5], and (e)½2:5; 2:5; 2:5� cm. The solid sphere in each plot represents the true target location and the irregular solid region represents the recon-structed target location. A cutoff value (selected based on the first break point of histogram plot of μaxf ) was applied to isosurface contourplots to differentiate the target from the background. Only 8 cm along the depth is presented in the plot, although the total depth for Side Ais Z ¼ 10 cm and for Side B is X ¼ 10 cm.
Fig. 5. (Color online) Isosurface contour plots of the 3-D image reconstructions based on measurements from both Side A and Side B ofphantom (i.e., X–Y plane and Z–Y plane of phantom) and guided using a priori information obtained from 2D surface imaging werepresented in the X–Y and X–Z planes, using 1% Liposyn phantom under perfect uptake conditions for Study III. The a priori informationfor each experimental case was obtained using cutoff value of 80% and 10∶1 target to background contrast values. A single 0:45 cc targetwas located at (a) [1.5, 2.5, 2], (b) [2, 2.5, 2], (c) [2.5, 2.5, 2], (d) [2, 2.5, 2.5], and (e) ½2:5; 2:5; 2:5� cm. The solid sphere in each plot representsthe true target location and the irregular solid region represents the reconstructed target location. A cutoff value (selected based on thefirst break point of the histogram plot of μaxf ) was applied to isosurface contour plots to differentiate the target from the background. Only4 cm along the depth is presented in the plot, although the total depth, Z ¼ 10 cm for Side A and X ¼ 10 cm for Side B of the phantom.
10 August 2010 / Vol. 49, No. 23 / APPLIED OPTICS 4351
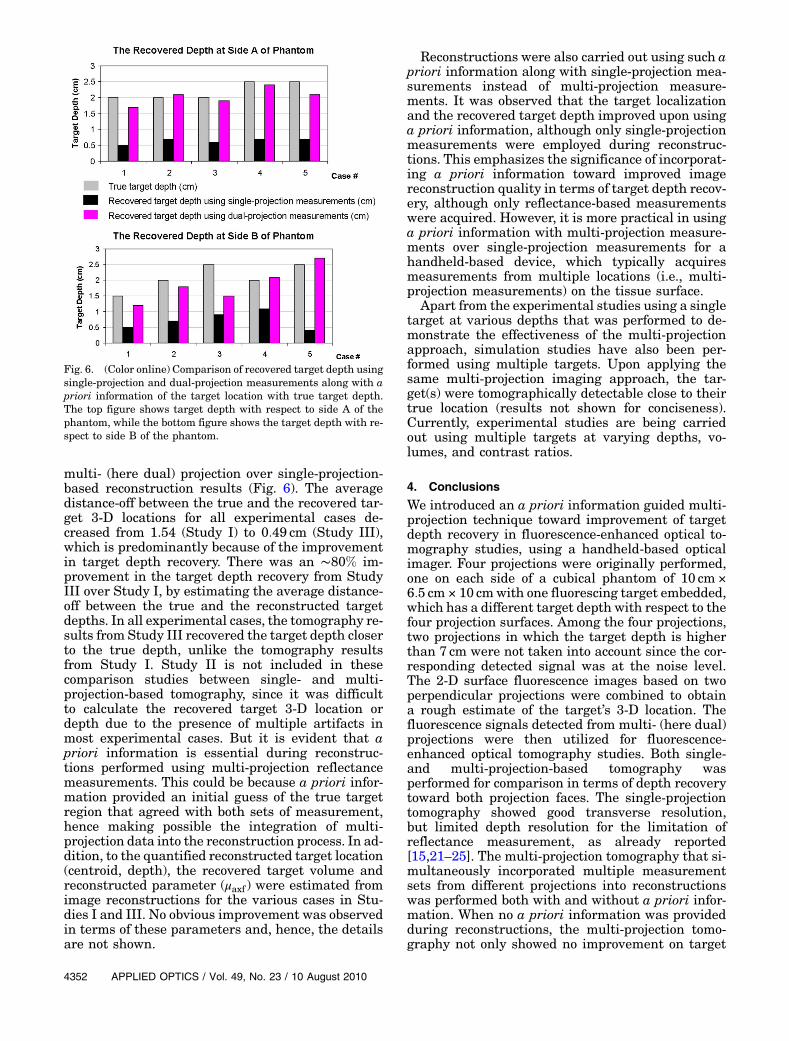
multi- (here dual) projection over single-projection-based reconstruction results (Fig. 6). The averagedistance-off between the true and the recovered tar-get 3-D locations for all experimental cases de-creased from 1.54 (Study I) to 0:49 cm (Study III),which is predominantly because of the improvementin target depth recovery. There was an ∼80% im-provement in the target depth recovery from StudyIII over Study I, by estimating the average distance-off between the true and the reconstructed targetdepths. In all experimental cases, the tomography re-sults from Study III recovered the target depth closerto the true depth, unlike the tomography resultsfrom Study I. Study II is not included in thesecomparison studies between single- and multi-projection-based tomography, since it was difficultto calculate the recovered target 3-D location ordepth due to the presence of multiple artifacts inmost experimental cases. But it is evident that apriori information is essential during reconstruc-tions performed using multi-projection reflectancemeasurements. This could be because a priori infor-mation provided an initial guess of the true targetregion that agreed with both sets of measurement,hence making possible the integration of multi-projection data into the reconstruction process. In ad-dition, to the quantified reconstructed target location(centroid, depth), the recovered target volume andreconstructed parameter (μaxf ) were estimated fromimage reconstructions for the various cases in Stu-dies I and III. No obvious improvement was observedin terms of these parameters and, hence, the detailsare not shown.
Reconstructions were also carried out using such apriori information along with single-projection mea-surements instead of multi-projection measure-ments. It was observed that the target localizationand the recovered target depth improved upon usinga priori information, although only single-projectionmeasurements were employed during reconstruc-tions. This emphasizes the significance of incorporat-ing a priori information toward improved imagereconstruction quality in terms of target depth recov-ery, although only reflectance-based measurementswere acquired. However, it is more practical in usinga priori information with multi-projection measure-ments over single-projection measurements for ahandheld-based device, which typically acquiresmeasurements from multiple locations (i.e., multi-projection measurements) on the tissue surface.
Apart from the experimental studies using a singletarget at various depths that was performed to de-monstrate the effectiveness of the multi-projectionapproach, simulation studies have also been per-formed using multiple targets. Upon applying thesame multi-projection imaging approach, the tar-get(s) were tomographically detectable close to theirtrue location (results not shown for conciseness).Currently, experimental studies are being carriedout using multiple targets at varying depths, vo-lumes, and contrast ratios.
4. Conclusions
We introduced an a priori information guided multi-projection technique toward improvement of targetdepth recovery in fluorescence-enhanced optical to-mography studies, using a handheld-based opticalimager. Four projections were originally performed,one on each side of a cubical phantom of 10 cm ×6:5 cm × 10 cmwith one fluorescing target embedded,which has a different target depth with respect to thefour projection surfaces. Among the four projections,two projections in which the target depth is higherthan 7 cm were not taken into account since the cor-responding detected signal was at the noise level.The 2-D surface fluorescence images based on twoperpendicular projections were combined to obtaina rough estimate of the target’s 3-D location. Thefluorescence signals detected from multi- (here dual)projections were then utilized for fluorescence-enhanced optical tomography studies. Both single-and multi-projection-based tomography wasperformed for comparison in terms of depth recoverytoward both projection faces. The single-projectiontomography showed good transverse resolution,but limited depth resolution for the limitation ofreflectance measurement, as already reported[15,21–25]. The multi-projection tomography that si-multaneously incorporated multiple measurementsets from different projections into reconstructionswas performed both with and without a priori infor-mation. When no a priori information was providedduring reconstructions, the multi-projection tomo-graphy not only showed no improvement on target
Fig. 6. (Color online) Comparison of recovered target depth usingsingle-projection and dual-projection measurements along with apriori information of the target location with true target depth.The top figure shows target depth with respect to side A of thephantom, while the bottom figure shows the target depth with re-spect to side B of the phantom.
4352 APPLIED OPTICS / Vol. 49, No. 23 / 10 August 2010

depth recovery, but also degraded reconstructionquality by introducing artifacts for most experimen-tal cases. Upon providing a priori information of the3-D target volumetric region during reconstructions,the tomography was effectively guided and targetdepth recovery for all experimental cases was im-proved. This is the first time, to our knowledge, thatthe multi-projection technique has been implemen-ted to a handheld-probe-based optical imager thatemploys simultaneous multiple point illumination/collection geometry and reflectance based measure-ments toward 3-D tomography This study alsosuccessfully demonstrated (i) the feasibility of mul-ti-projection-based 2-D surface fluorescence imagingto provide a rough estimation of a target’s 3-D loca-tion, which can be used both as a priori informationfor tomography studies or complementary informa-tion toward cancer diagnosis; (ii) the feasibility ofmulti-projection tomography using a handheld-probe-based optical imager, which is designed tohave the flexibility to perform multi-projection ormulti-scan imaging; and (iii) the possibility of im-provement in target depth recovery using only reflec-tance measurements during tomography.
One big challenge for the clinical translation of ana priori information guided multi-projection techni-que is its dependence on 2-D surface fluorescenceimaging, which is limited by the contrast ratio be-tween the tumor and the background. The currentstudy is based on the best case scenario (i.e., homo-geneous background and target/background contrastratio of 1∶0). However, in an actual human tissue, thebackground is highly heterogeneous and has variedoptical properties throughout the tissue volume.Hence, a chicken breast phantom study, which is acloser simulation of heterogeneous human breast tis-sue, has been performed in our laboratory and theimprovement of target depth recovery using the apriori information guided multi-projection techniquewas also observed from our initial tomography stu-dies (extensive studies are currently being carriedout). In addition, the fluorescence distribution in tu-mor and normal tissue also plays an important rolein imaging quality. Hence, more extensive experi-mental studies using both homogeneous and hetero-geneous phantom with imperfect uptake opticalcontrast ratios will be performed to enhance the pos-sibilities toward clinical translation. Parallelly, theeffectiveness of using (i) an excitation signal towarda priori information (especially in imperfect uptakecontrast ratio cases) and (ii) sequential multiplepoint illumination over simultaneous illuminationwill be assessed toward high-quality image recon-structions with greater accuracies.
In the future, this a priori information guided mul-ti-projection technique can be extended to otherreflectance-measurement-based optical imaging sys-tems, such as an area illumination and collection sys-tem [22,23], in order to improve the target depthrecovery. But unlike the handheld-probe-basedimager, the reflectance-measurement-based optical
imaging systems developed by other researchersmay require the subject, the device, or both, to movein order to obtain measurements from the entire tis-sue volume toward tomographic imaging. This, inturn, requires a method to track the motion of thesubject/device and coregister the measurements ontothe tissue volume appropriately. Currently, the OILis developing automated real-time coregistrationtechniques such that the optical measurements ob-tained frommultiple locations on the tissue are auto-matically coregistered on the tissue volume in orderto facilitate 3-D tomographic imaging [27].
Until now, optical tomography studies have onlyemployed a priori information of the possible tar-get(s) location with the aid of other imaging modal-ities, such as ultrasound, x-ray, andMRI [13,28,29] toimprove the target localization. The current study is,to our knowledge, the first of its kind, where 2-D sur-face fluorescence images will be used as a priori in-formation in order to self-guide the tomographicimaging and possibly improve the reconstructionquality.
In conclusion, our initial cubical phantom studiesdemonstrated the feasibility of a multi-projection-based surface imaging and tomography study usinga handheld-probe-based optical imager. This techni-que can provide rough target 3-D location usingsurface images and improve target depth recoveryin tomography studies. With more validation usinglaboratory phantom studies, such as experimentsusing different phantom shapes, target sizes andnumbers, and target-to-background contrast ratios,it is expected that, in the future, this handheld-probe-based optical imager can be translated intoclinical breast imaging.
The current work has been funded by NationalInstitutes of Health (NIH) grant R15CA119253.
References1. B. J. Tromberg, O. Coquoz, J. B. Fishkin, T. Pham, E. R.
Anderson, J. Butler, M. Cahn, J. D. Cross, V. Venugopalan,and D. Pham, “Non-invasive measurements of breast tissueoptical properties using frequency-domain photon migration,”Philos. Trans. R. Soc. London Ser. B 352, 661–668 (1997).
2. B. J. Tromberg, “Optical scanning and breast cancer,” Acad.Radiol. 12, 923–924 (2005).
3. T. H. Pham, O. Coquoz, J. B. Fishkin, E. Anderson, and B. J.Tromberg, “Broad bandwidth frequency domain instrumentfor quantitative tissue optical spectroscopy,”Rev. Sci. Instrum.71, 2500–2513 (2000).
4. N. Shah, A. Cerussi, C. Eker, J. Espinoza, J. Butler, J. Fishkin,R. Hornung, and B. J. Tromberg, “Noninvasive functional op-tical spectroscopy of human breast tissue,” Proc. Natl. Acad.Sci. USA 98, 4420–4425 (2001).
5. N. Shah, A. E. Cerussi, D. Jakubowski, D. Hsiang, J. Butler,and B. J. Tromberg, “Spatial variations in optical and physio-logical properties of healthy breast tissue,” J. Biomed. Opt. 9,534–540 (2004).
6. D. B. Jakubowski, A. E. Cerussi, F. Bevilacqua, N. Shah, D.Hsiang, J. Butler, and B. J. Tromberg, “Monitoring neoadju-vant chemotherapy in breast cancer using quantitative diffuseoptical spectroscopy: a case study,” J. Biomed. Opt. 9, 230–238 (2004).
10 August 2010 / Vol. 49, No. 23 / APPLIED OPTICS 4353
7. N. Chen, M. Huang, H. Xia, and D. Piao, “Portable near-infrared diffusive light imager for breast cancer detection,”J. Biomed. Opt. 9, 504–510 (2004).
8. B. Chance, S. Nioka, J. Zhang, E. F. Conant, E. Hwang, S.Briest, S. G. Orel, M. D. Schnall, and B. J. Czerniecki, “Breastcancer detection based on incremental biochemical and phy-siological properties of breast cancers: a six-year, two-sitestudy,” Acad. Radiol. 12, 925–933 (2005).
9. B. Chance, Z. Zhao, S. Wen, and Y. Chen, “Simple ac circuit forbreast cancer detection and object detection,” Rev. Sci.Instrum. 77, 064301 (2006).
10. K. S. No and P. H. Chou, “Mini-FDPM and heterodyne mini-FDPM: handheld non-invasive breast cancer detectors basedon frequency domain photon migration,” IEEE Trans. CircuitsSyst. 52, 2672–2685 (2005).
11. K. S. No, Q. Xie, R. Kwong, A. Cerussi, B. J. Tromberg, and P.Chou, “HBS: a handheld breast cancer detector based on fre-quency domain photon migration with full heterodyne,” inProceedings of the IEEE Biomedical Circuits and SystemsConference (IEEE, 2006), pp. 114–117.
12. T. Durduran, R. Choe, G. Yu, C. Zhou, J. C. Tchou, B. J.Czemiecki, and A. G. Yodh, “Diffuse optical measurement ofblood flow in breast tumors,” Opt. Lett. 30, 2915–2917 (2005).
13. Q. Zhu, S. H. Kurtzman, P. Hedge, S. Tannenbaum, M. Kane,M. Huang, N. G. Chen, B. Jagjivan, and K. Zarfos, “Utilizingoptical tomography with ultrasound localization to image het-erogeneous hemoglobin distribution in large breast cancers,”Neoplasia 7, 263–270 (2005).
14. B. Jayachandran, J. Ge, S. Regalado, and A. Godavarty,“Design and development of a hand-held optical probe towardsfluorescence diagnostic imaging,” J. Biomed. Opt. 12, 054014(2007).
15. J. Ge, B. Zhu, S. Regalado, and A. Godavarty, “Three-dimensional fluorescence-enhanced optical tomography usinga hand-held probe based imaging system,” Med. Phys. 35,3354–3363 (2008).
16. V. A. Markel and J. C. Schotland, “Dual-projection opticaldiffusion tomography,” Opt. Lett. 29, 2019–2021 (2004).
17. V. A. Markel and J. C. Schotland, “Multiple projection opticaldiffusion tomography with plane wave illumination,” Phys.Med. Biol. 50, 2351–2364 (2005).
18. T. Lasser and V. Ntziachristos, “Optimization of 360 degreesprojection fluorescence molecular tomography,” Med. ImageAnal. 11, 389–399 (2007).
19. N. Deliolanis, T. Lasser, D. Hyde, A. Soubret, J. Ripoll, and V.Ntziachristos, “Free-space fluorescence molecular tomogra-
phy utilizing 360 degrees geometry projections,” Opt. Lett.32, 382–384 (2007).
20. A. Godavarty, M. J. Eppstein, C. Zhang, S. Theru, A. B.Thompson, M. Gurfinkel, and E. M. Sevick-Muraca, “Fluores-cence-enhanced optical imaging in large tissue volumes usinga gain modulated ICCD camera,” Phys. Med. Biol. 48, 1701–1720 (2003).
21. A. Godavarty, A. B. Thompson, R. Roy, M. J. Eppstein, C.Zhang, M. Gurfinkel, and E. M. Sevick-Muraca, “Diagnosticimaging of breast cancer using fluorescence-enhanced opticaltomography: phantom studies,” J. Biomed. Opt. 9(3), 488–496(2004).
22. A. Joshi, W. Bangerth, K. Hwang, J. C. Rasmussen, and E. M.Sevick-Muraca, “Fully adaptive FEM based fluorescence opti-cal tomography from time-dependent measurements witharea illumination and detection,” Med. Phys. 33, 1299–1310 (2006).
23. A. Joshi, W. Bangerth, K. Hwang, J. C. Rasmussen, andE. M. Sevick-Muraca, “Plane-wave fluorescence tomographywith adaptive finite elements,” Opt. Lett. 31, 193–195(2006).
24. D. S. Kepshire, S. C. Davis, H. Dehghani, K. D. Paulsen, andB. W. Pogue, “Subsurface diffuse optical tomography canlocalize absorber and fluorescent objects but recovered imagesensitivity is nonlinear with depth,” Appl. Opt. 46, 1669–1678 (2007).
25. D. S. Kepshire, S. C. Davis, H. Dehghani, K. D. Paulsen, andB. W. Pogue, “Challenges in sub-surface fluorescence diffuseoptical imaging,” Proc. SPIE 6434, 64340R (2007).
26. M. J. Eppstein, D. E. Dougherty, D. J. Hawrysz, and E. M.Sevick-Muraca, “Three dimensional bayesian optical imagereconstruction with domain decomposition,” IEEE Trans.Med. Imaging 20, 147–163 (2001).
27. S. Regalado, S. J. Erickson, B. Zhu, J. Ge, and A. Godavarty,“Automated real-time coregistered imaging using a hand-heldprobe-based optical imager,” Rev. Sci. Instrum. 81, 023702(2010).
28. Q. Zhang, T. J. Brukilacchio, A. Li, J. J. Stott, T. Chaves, E.Hillman, T. Wu, M. Chorlton, E. Rafferty, R. H. Moore, D.B. Kopans, and D. A. Boas, “Coregistered tomographic x-rayand optical breast imaging: initial results,” J. Biomed. Opt.10, 024033 (2005).
29. Y. Lin, H. Gao, O. Nalcioglu, and G. Gulsen, “Fluorescence dif-fuse optical tomography with functional and anatomical apriori information: feasibility study,” Phys. Med. Biol. 52,5569–5585 (2007).
4354 APPLIED OPTICS / Vol. 49, No. 23 / 10 August 2010


![933 dji phantom-4 spec-sheet-rev[1] - PLASTICASE · 2019. 10. 23. · 933 DJI™ PHANTOM 4 For all DJI™ Phantom 4 models Phantom 4 Phantom 4 Pro Phantom 4 Pro + 2.0 Phantom 4 RTK](https://static.fdocuments.us/doc/165x107/60c827405a7e465133218fc4/933-dji-phantom-4-spec-sheet-rev1-plasticase-2019-10-23-933-djia-phantom.jpg)