
Multi-Plot Graphics System
52
Multi-Plot Graphics System S. Shipkowski NAS1-18304 1990 i i |
Transcript of Multi-Plot Graphics System

Multi-Plot Graphics System
S. Shipkowski
NAS1-18304
1990
ii
|


NASA Contractor Report 4304
Realtime Multi-Plot Graphics System
Michael S. Shipkowski
Wyle Laboratories
Hampton, Virginia
Prepared for
Langley Research Centerunder Contract NASI-18304
NA.SANational Aeronautics and
Space Administration
Office of ManagementScientific and TechnicalInformation Division
1990

REALTIME MULTI-PLOT GRAPHICS SYSTEM
by Michael S. Shipkowski
Summary
An investigation was conducted at the National Transonic Facility
(NTF) to determine if the existing realtime graphics system could be
enhanced to provide the high speed, high resolution, and flexibility
necessary to meet current and future needs. The end result was a cost
effective system, based upon hardware already in place, that is
capable of providing the high quality and quantity of data required by
increasing test program demands.

Introduction
The National Transonic Facility (NTF) is a fan-driven, closed circuit,
continuous-flow, pressurized wind tunnel capable of operating at MACH
numbers ranging from .2 to 1.2. The wind tunnel supports testing
using air or gaseous nitrogen. The use of nitrogen as a test medium
and operating the tunnel in the transonic speed range imposes high
operational costs on a per-point basis. To reduce these costs the NTF
data acquisition systems are designed for high speed acquisition,
reduction, and display of realtime data collected during tunnel
operations. This data is displayed on alphanumeric and graphic
cathode ray tubes (CRTs), tabular printouts, and hardcopy data plots.
The NTF also supports testing in a Model Preparation Area (MPA) for
pre-test analysis.
In realtime test environments the acquisition and display of data are
tightly bound together. If acquired data must to be displayed in
realtime, the acquisition rate is then a function of the display rate.
If acquisition goes on without adequate data display, critical aspects
of the test may not be displayed or may be displayed improperly. The
design and implementation of the display system has a large effect on
overall system performance.

This type of environment requires several things from the plot system;
that the resolution of the plotted data is of a high enough quality to
allow realtime decisions to be made, that the system is flexible
enough to handle changing test criteria, and that operation of the
plot system does not degrade the data acquisition system.
Post test analysis of plotted data requires a hard copy system with
the same high resolution as the plot system.
Investigation and Findings
The investigation of the NTF realtime plotting system concentrated on
two broad areas: the interfaces to the acquisition system and
graphics terminals, and the unused capabilities of available graphics
terminals. Analysis of these areas directed the design and functional
requirements of the Enhanced Graphics System (EGS) now operating at
NTF.
Initial Plot System
The NTF realtime plotting system, prior to this investigation,
consisted of three graphics terminals, two monochrome storage monitors
and one color monitor (used in the monochrome mode), distributed
across two computer systems. The two storage tube terminals shared a
monochrome hardcopy unit and the color terminal had a dedicated
monochrome hardcopy unit. Each terminal was driven by a unique plot
task, using a general purpose FORTRAN interface, to plot data.
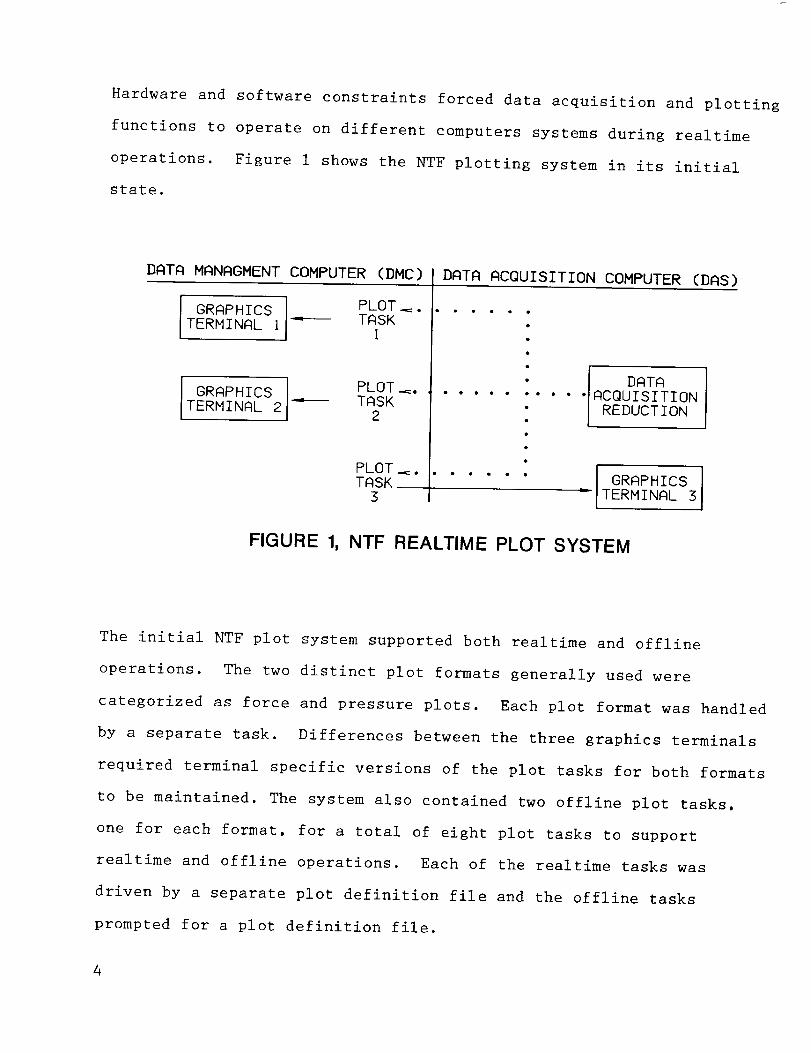
Hardware and software constraints forced data acquisition and plotting
functions to operate on different computers systems during realtime
operations. Figure 1 shows the NTF plotting system in its initial
state.
DATA MANAGMENTCOMPUTER(DMC)
I GRAPHICS I PLOT_.TERMINAL I ---- TASKI
I GRAPHICSTERMINAL 2
PLOT _.TASK
2
PLOT _.TASK
3
DATA ACQUISITION COMPUTER (DAS)
I DATA
"IACQUISITION
I REDUCTION
I GRAPHICS I= TERMINAL 3
FIGURE 1, NTF REALTIME PLOT SYSTEM
The initial NTF plot system supported both realtime and offline
operations. The two distinct plot formats generally used were
categorized as force and pressure plots. Each plot format was handled
by a separate task. Differences between the three graphics terminals
required terminal specific versions of the plot tasks for both formats
to be maintained. The system also contained two offline plot tasks,
one for each format, for a total of eight plot tasks to support
realtime and offline operations. Each of the realtime tasks was
driven by a separate plot definition file and the offline tasks
prompted for a plot definition file.
4

The maintenance of eight tasks and multiple definition files
complicated operations, especially as plot requirements changed over
the course of a test.
The plot software was tightly designed around the existing Data
Acquisition System (DAS) data structures and graphic interface
package. There were no provisions for alternate data formats or
graphics terminals. This approach restricted access to the graphic
terminals to DAS specific requirements. Alternate plot requirements
required the generation of new plot software, complicating system
maintenance even further. The graphics interface supported a single
plot on a single terminal and required a separate task to drive each
terminal. This limitation restricted realtime operations to a maximum
of three plots. Wind tunnel testing normally requires more than three
plot definitions to fully examine model data. The extra plots
required were generated offline when the tunnel was not operating.
There are two problems with this method; (I) the researcher involved
with the test must decide which three plots out of the set of possible
plots will provide the most realtime information, and (2) tunnel
operations may not free up a graphics terminal for an extended period
of time.
The requirement for a unique plot task per terminal and plot format,
generated a group of stand alone plot tasks. The design of these
tasks placed data point input, data processing, and graphics output
all in the same realtime task. This approach linked graphics terminal
processing speed to the data acquisition rate on a different computer
system. Plot tasks were notified of new data points by a "resume"
command sent from the acquisition system. The computer system queued
a single "resume" for each plot task. If data points were acquired
faster than they were plotted, the plot tasks and acquisition system
would get out of syncronization. There were no software provisions
for identifying and rectifying this condition. The plot tasks could
be manually resynchronized but this approach was susceptible to error
and inappropriate for realtime operations. This linkage therefore
required the data acquisition rate to be reduced to a level the plot
tasks could handle.
During realtime operations, three of a possible six plot tasks
competed for CPU time, computer link use, terminal I/O, and hardcopy
use, to plot their respective data. Two of these resources, link and
hardcopy use, contributed to computer system overhead and reduced plot
throughput due to the distributed nature of the plot system.
The NTF computer complex contains four computers which communicate
over high priority serial links. With the realtime plot system
executing on a different computer than the data acquisition software,
acquired data had to be passed over the link for each plot task.
Although the necessary data for all plot tasks was on the same data
point, each task required its own copy. In a worst case scenario with
three plots active, realtime plotting required three network transfers
to notify the plot tasks of a new data point and three data point
transfers to be processed. Each data point required multiple reads
across the computer link to access all of the data. This approach

placed a double burden on two computers for each data point plotted.
Link transfers are handled by a high priority task on each computer
which reduces available CPU time for other tasks, and, the link only
allows one task at a time to communicate. Therefore, the three
control commands and three data points occurred serially, not in
parallel. Figure 2 shows the associated host computer overhead
associated with link traffic.
DMC COMPUTER LINK TRAFFIC DAS COMPUTER
----- RESUME PLOT 1 PLOT TASKCONTROL
------- RESUME PLOT 2
RESUME PLOT SDATA POINT
READ
REID 1
DATA READ -- RE D n/2PLOT 1
READ n
DATA READPLOT 2
lDATA READPLOT S
PLOT 1
PLOT 2
PLOT S
RE_D 1--, READ n/2
READ n
REiD 1
--I RE D n/2
READ n
DATAPLOTTING
DATA PLOTTINGACROSS LINK
FIGURE 2, HOST SYSTEM LINK TRAFFIC OVERHEAD
7
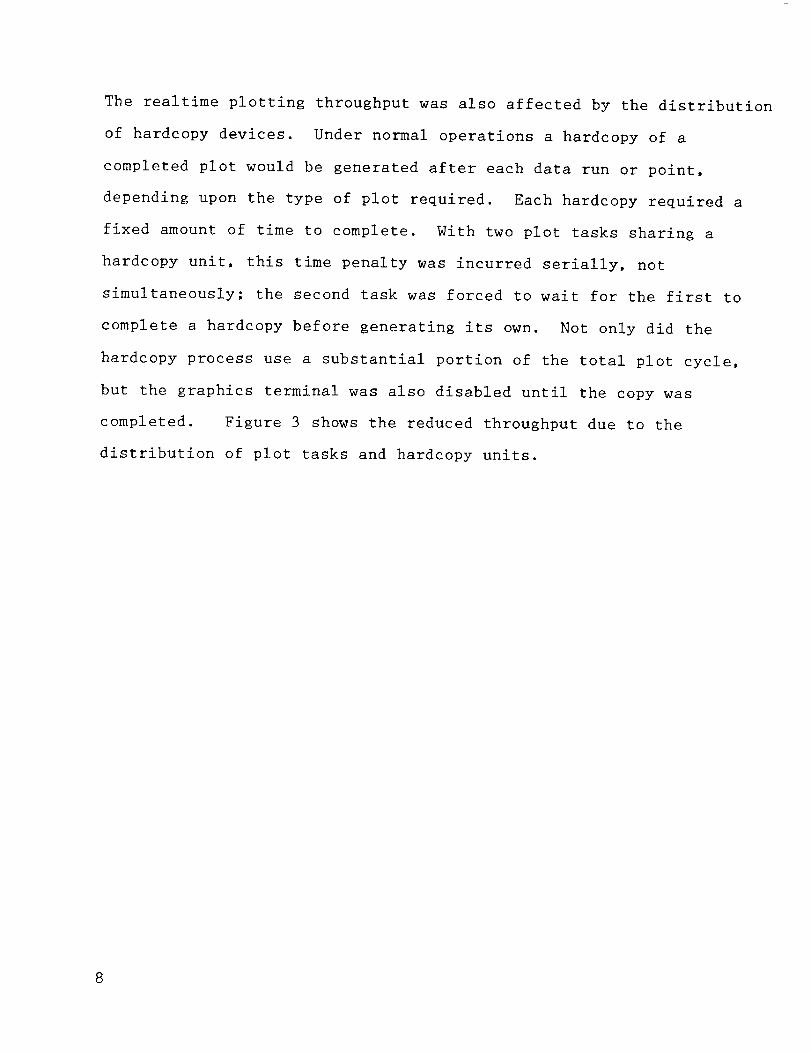
The realtime plotting throughput was also affected by the distribution
of hardcopy devices. Under normal operations a hardcopy of a
completed plot would be generated after each data run or point,
depending upon the type of plot required. Each hardcopy required a
fixed amount of time to complete. With two plot tasks sharing a
hardcopy unit, this time penalty was incurred serially, not
simultaneously; the second task was forced to wait for the first to
complete a hardcopy before generating its own. Not only did the
hardcopy process use a substantial portion of the total plot cycle,
but the graphics terminal was also disabled until the copy was
completed. Figure 3 shows the reduced throughput due to the
distribution of plot tasks and hardcopy units.
8

PLOT !
PLOT 2
PLOT 3
•STATIC DATA. ./. .DATA PLOTTING. •/. •HARDCOPY. •/tl t2 t3
..ISTATIC DATA../..DATA PLOTTING../ .... t4 .... /..HARDCOPY../
•.STATIC DATA.. /. •DATA PLOTTING.. /. •HARDCOPY. •/
;Icl
t5
cl = Overhead for multiple tasks/terminals/link traffic
tl = Static data generation (Grids/Titles/Axis Labels)
t2 = Dynamic data plotting (Symbols/Lines)
t3 = Black/White hardcopy time
t4 = Waiting for hardcopy unit
t5 = Total Time for Plot Cycle
1 + cl + 4 = Total overhead to distributed plot system
FIGURE 3, REDUCED THROUGHPUT
DUE TO DISTRIBUTED PLOT SYSTEM
9

The distributed nature of the plot system was directly related to the
use of a general purpose interface package to communicate with the
graphics terminal. The package provided a FORTRAN callable interface
between the host computer and the graphics terminals. This provided a
simple method of generating graphics but applied general purpose
methods to the specific needs of the realtime plot system. The
interface package contributed significantly to the low plot throughput
rate by placing all of the burden for graphics generation on the host
computer. The destination graphics terminal was treated as a dumb
device doing no processing on its own, even if such capability
existed. All aspects of a plot, including grid generation, labels and
plot symbols were recalculated and redrawn each time they were used.
To remove the design and throughput penalties associated with this
interface, a new interface, based on a detailed examination of the
graphics terminal command set, was developed. The investigation of
the existing graphics terminals concentrated on the color unit since
it was a raster scan device. This terminal also supported a superior
command set, peripherals, and multiple plots simultaneously. The use
of color for realtime plots was also considered in this decision. The
design effort was based on four general goals listed below:
* Increased Plot System Efficiency
* Improved Host / Terminal Communications
* Increased Plot Resolution/Readability
* Multiple Plot Generation/Display Support
I0
Plot System Efficiency
Optimizing plot data throughput is accomplished by making the graphics
generation process as efficient as possible and by offloading graphics
processing from the host system to the graphics terminal. To do this
a thorough analysis of the data plotting cycle and the graphics
terminal capabilities was necessary to show where the efficiency of
the plot system could be improved.
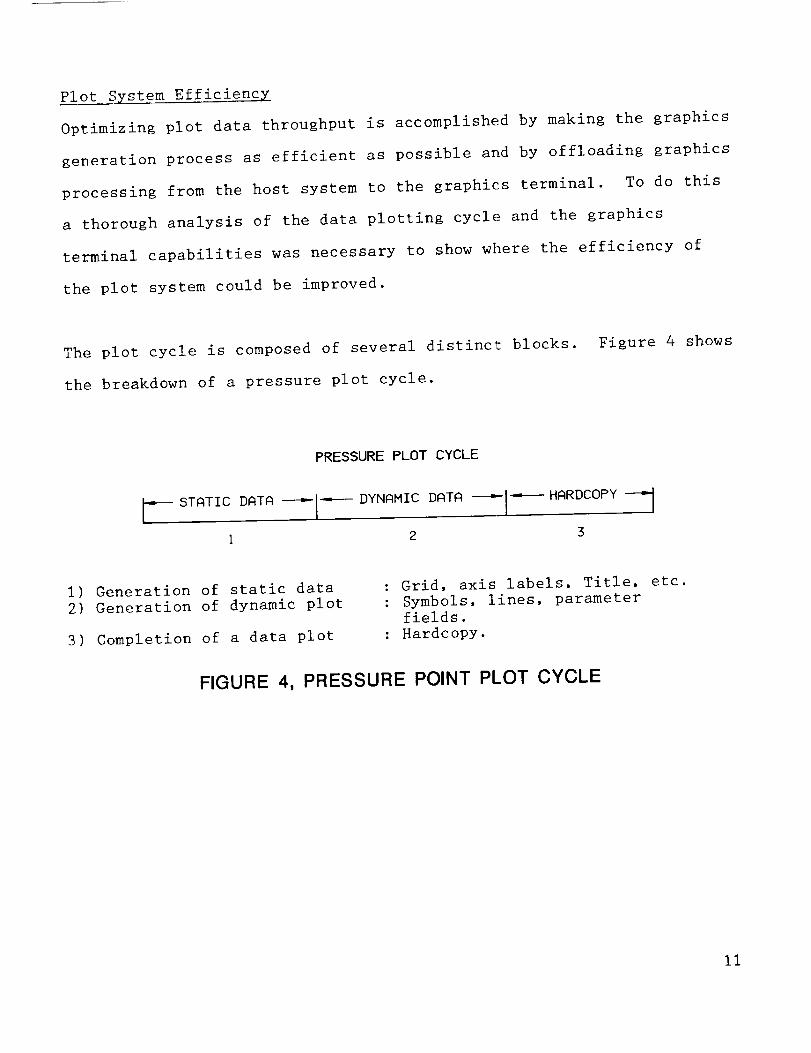
The plot cycle is composed of several distinct blocks.
the breakdown of a pressure plot cycle.
Figure 4 shows
PRESSURE PLOT CYCLE
r_ STATIC DATA-------["----DYNAMIC DATA---'-I"----HARDCOPY -_
I 2 3
I) Generation of static data
2) Generation of dynamic plot
3) Completion of a data plot
: Grid, axis labels, Title, etc.
: Symbols, lines, parameterfields.
: Hardcopy.
FIGURE 4, PRESSURE POINT PLOT CYCLE
11

Improvements to plot system efficiency cover the reduction of task
overhead and simplification of the position-draw symbol process.
Overhead within the plot task is identified as any activity not
directly associated with displaying plot symbols.
The first block in figure 4 is static data generation. The original
graphics interface package did not differentiate between static data
and dynamic data. Each was redrawn multiple times over the course of
a test even though the static data did not change.
The generation of static data could not be completly eliminated but it
could be removed from the plot cycle and generated prior to realtime
operations. This was possible using the terminal's ability to retain
a series of graphics commands in a construct called a segment. A
segment is a list of graphics primitives that can be identified and
manipulated as a unique entity. These constructs can be opened for
additional commands or closed from further update via software
control. The terminal selected for the EGS supports numerous segment
definitions that can be added together or displayed separately. This
provided an excellent solution to the static data generation problem.
All static data could be generated and stored as separate segments
prior to realtime testing. Since the data was retained by the
terminal it only needed to be redisplayed, not redrawn for each data
point or run.
12

Table 1 compares the throughput of the original system to the EGS, as
a function of task overhead. This table shows that the generation of
static data originally accounted for 25% of the plot cycle.
Elimination of this part of the plot provides a substantial
improvement in throughput and reduces the graphics burden on the host
system.
TABLE 1, REDUCED THROUGHPUT DUE TO TASK OVERHEAD
PLOT $YS_H _ _TR PT PLOT _ $TRTIC _ _ DI_ _ T_ _OT _ _ X _ PlOT Z _ PLOT_"_LJE DUE _ CYa.E DIJE m
_Oi i_ PIER _TR _ TI_ (_C) TI_ ($F.C:) TZ_ (-_"-) TI_ (SEC) PlOT SYt43(3t. _ATIC _TR TASK
ORIGINAL l 87 10. l ? - 40.6 .47 2S 47
EGS 1 85 1.0 - 4 16.5 .19 6 30
I
This approach also provides a side benefit in improving plot
resolution and readability. As shown above, grid generation required
a large portion of the plot cycle. Because of this, plot grids tended
to be relatively simple, using a few major lines and tick marks.
This forced the researcher to interpret plotted data by visually
aligning data symbols and axis position or consulting tabular data to
determine X and Y values. Figure 5 shows a standard plot format for
the initial system.
13

Interpolation of plotted data is cumbersome and prone to error. In
some cases plots show only general trends when specific values are of
interest. With the grid generation process removed from the plot
cycle, more dense grid segments can be generated prior to tunnel
testing to provide a more precise background. The complexity of the
grid has a negligible affect on the redisplay time of the segment.
Figure 6 shows a 160 x 120 grid with plotted data produced by the EGS.
This grid provides a resolution of .001 on the X axis, .005 on the Y
axis and takes less time to display than the more simple grid on
Figure 5. Plot readability can be improved even further by separating
major and minor lines with color. In the case of figure 6 the minor
lines are normally magenta and the major lines black. The effect is
similar to graph paper which uses lighter and darker lines to improve
readability.
14

"1"1
61c::i3m
Ol
(/)
zEl
;33O
r"O-I
CL
NATIONAL TRANSONIC FACILITY
tITF028 NASP
I 200
m
I 000
SO0
6O0
4O0m
200 u'- d3
- #
000 -0
-- 200 I I I
0000
MACH TTEMP0 282 109 9
...Oj
.O/
./O /
I I I I I I
O8OO
O400
I I I I I I I I I I I I I I I
1600 2400
1200 2000 2800
CD
REYH27 73
2/ 4/88
RUN SYI
32
3200
tn

O0
"tlQo_
,'C_-u
r 111
"11!
0c:
I'1"1
O)m
I'1'1Z"1->Z0rn0
:z]>
"-t-OGO
O0-<Or)--IIll
r-0"-I
!ErIOM5TRATIOll TITLE
I.111i
'F'LL II I|ll_iR
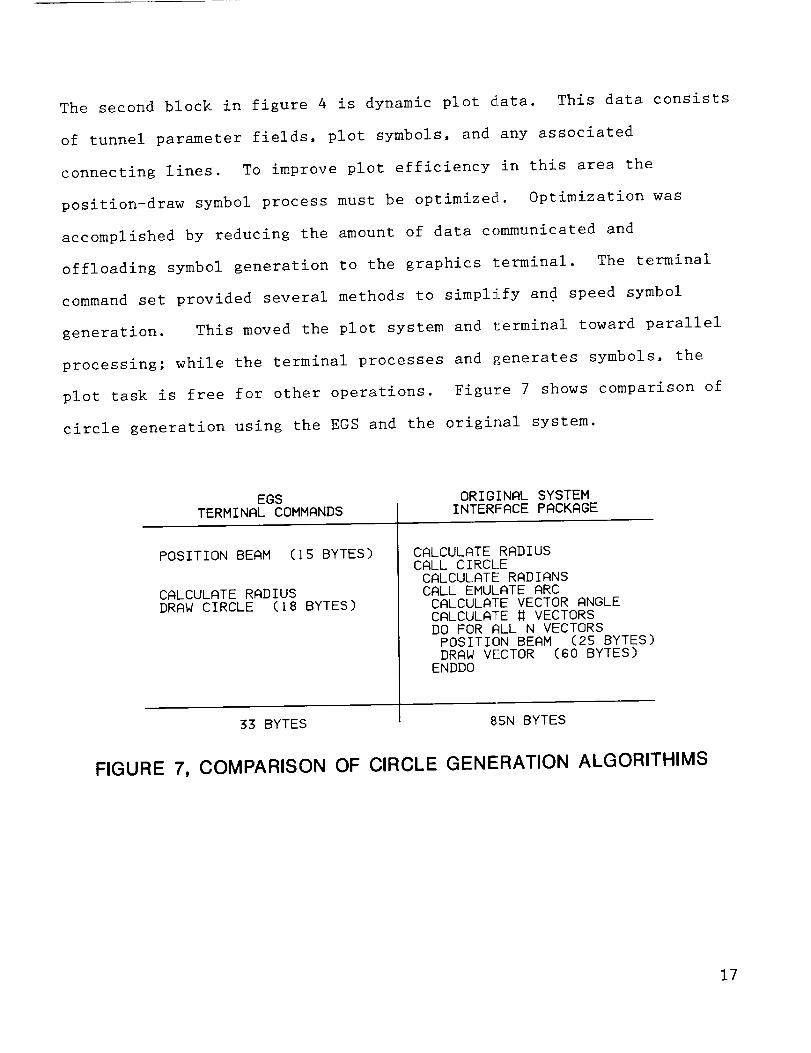
The second block in figure 4 is dynamic plot data. This data consists
of tunnel parameter fields, plot symbols, and any associated
connecting lines. To improve plot efficiency in this area the
position-draw symbol process must be optimized. Optimization was
accomplished by reducing the amount of data communicated and
offloading symbol generation to the graphics terminal. The terminal
command set provided several methods to simplify and speed symbol
generation. This moved the plot system and terminal toward parallel
processing; while the terminal processes and generates symbols, the
plot task is free for other operations. Figure 7 shows comparison of
circle generation using the EGS and the original system.
EGSTERMINAL COMMANDS
POSITION BEAM (15 BYTES)
CALCULATE RADIUSDRAW CIRCLE (18 BYTES)
53 BYTES
ORIGINAL SYSTEMINTERFACE PACKAGE
CALCULATE RADIUSCALL CIRCLECALCULATE RADIANSCALL EMULATE ARCCALCULATE VECTOR ANGLECALCULATE _ VECTORSDO FOR ALL N VECTORSPOSITION BEAM (2S BYTES)DRAW VECTOR (60 BYTES)
ENDDO
8SN BYTES
FIGURE 7, COMPARISON OF CIRCLE GENERATION ALGORITHIMS
17

The final block in figure 4 is the hardcopy process. The penalty
associated with generating a hardcopy is a function of test
operations. In some cases where very high acquisition rates are
required, the hardcopies cannot be examined in detail and do not need
to be hardcopied immediately, These realtime plots need to be saved
for future hardcopying. Under slower acquisition rates, hardcopies
can be examined as they are produced to verify that test objectives
are being met. To meet both requirements, the plot system must be
able to generate realtime plots during realtime operations, and after
the testing is completed. This is possible by using the previously
described segment construct and by adding a hard disk drive added to
the graphics terminal. During high speed acquisition, completed plots
are stored on the disk to be recalled and hardcopied later. Table 1
shows that disk storage of a plot takes less than half the time
required to generate a hardcopy.
Improved Host to Terminal Communications
The speed at which data is communicated from host to terminal is
critical to realtime plot operations. In most cases the host system
is capable of operating much faster than the associated graphics
terminal(s). Improvements to the plot software will therefore have a
limited effect if the plot system must wait on terminal processing.
18
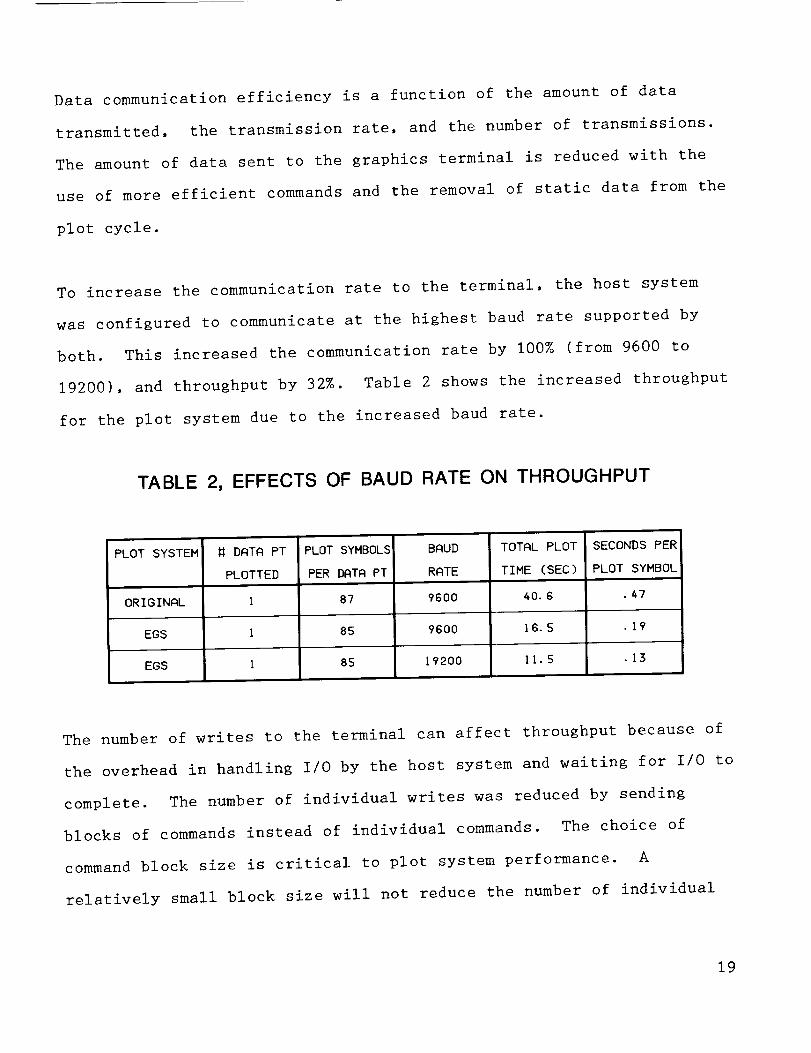
Data communication efficiency is a function of the amount of data
transmitted, the transmission rate, and the number of transmissions.
The amount of data sent to the graphics terminal is reduced with the
use of more efficient commands and the removal of static data from the
plot cycle.
To increase the communication rate to the terminal, the host system
was configured to communicate at the highest baud rate supported by
both. This increased the communication rate by 100% (from 9600 to
19200), and throughput by 32%. Table 2 shows the increased throughput
for the plot system due to the increased baud rate.
TABLE 2, EFFECTS OF BAUD RATE ON THROUGHPUT
PLOT SYSTEM
ORIGINAL
EGS
EGS
DATA PT
PLOTTED
I
PLOT SYMBOLS
PER DATA PT
87
85
85
BAUD
RATE
9600
9600
19200
TOTAL PLOT
TIME (SEC)
40.6
16.5
11.5
SECONDS PER
PLOT SYMBOL
.47
.19
.13
The number of writes to the terminal can affect throughput because of
the overhead in handling I/O by the host system and waiting for I/O to
complete. The number of individual writes was reduced by sending
blocks of commands instead of individual commands. The choice of
command block size is critical to plot system performance. A
relatively small block size will not reduce the number of individual
19

I/O operations sufficiently. A overly large command block will reduce
asynchronous processing. The graphics terminal selected for the EGS
supports the queueing of received commands to be processed as soon as
possible. The goal is to reduce the number of terminal writes but
insure that the terminal always has queued commands to be processed.
Figure 8 shows the asynchronous processing of graphics data when
using queued commands.
PLOTTASK
WRITE----" BLOCK
n+l
COMMAND QUEUE
GRAPHICSBLOCK
n-1
GRAPHICSBLOCK
n
GRAPHICSBLOCKn+l
TERMINALPROCESSES
BLOCKn-I
FIGURE 8, ASYNCRONOUS GRAPHICS PROCESSING
20

The communication improvements could not be implemented without
protecting the graphics terminal from being overloaded. This is
accomplished by taking advantage of two terminal features: command
queue sizing and terminal reports.
The EGS graphics terminal allows manual or software control of the
size of a queue for incoming commands. Increasing the size of the
queue allows more data to be transferred to the terminal unprocessed
but reduces the memory available for terminal graphics. Testing at
various acquisition rates and plotting requirements was used to
determine a median queue size.
The use of a command queue does not provide protection against
overloading the graphics terminal, it merely allows a longer time
before overloading occurs. The plot system must synchronize
transmissons with terminal processing. Terminal reports provide this
capability. The plot system sends multiple blocks of graphics data
and requests periodic reports on terminal status. Reception of the
terminal report tells the plot task the command queue is empty and
available for new command blocks.
Since the report received indicates that the command queue is empty,
report requests should only be made when the impact of an empty queue
will not degrade throughput. The timing of this is dependent upon how
testing is conducted. At NTF a set of points taken under certain
21

tunnel conditions is called a data run. At the end of a run the
tunnel conditions are modified for the next run. This is an opportune
time to request a report. An alternate approach is to request reports
whenever a certain percentage of the command queue could be filled
based on a known total number of bytes sent.
Improved Plot Resolution and Readability
The redesign of the NTF graphics system provided an opportunity not
only to improve plot throughput but also a chance to improve plot
resolution and readability. Plot resolution is the accuracy in
positioning and display of plotted symbols and the ability to
accurately determine the data values of the plotted symbol. Plot
readability is the ability of the plot to convey information to the
researcher with as little need for interpretation as possible.
One improvement to plot resolution has already been described; the use
of dense grids. Resolution was also increased by taking advantage of
how the terminal displays graphics. The terminal screen is a grid of
1280 x 1024 pixels, where a pixel is the smallest piece of the screen
that can be manipulated. This limits resolution when plotting in
screen coordinates. To display graphics, the terminal maps a 4096 x
3276 memory area to the screen pixel area. By manipulating the size
of the memory window the plot system can provide greater resolution.
The EGS terminal firmware does all of the memory to screen scaling,
adding no processing burden to the software when using this approach.
22

Table 3 compares the resolution of screen and memory coordinates for X
and Y axis scales of 0 to I00.
TABLE 3, COMPARISON OF PLOT SYMBOL RESOLUTION
COORDINATE
SYSTEM
SCREEN
REG. MEMORY
EXTRR MEMORY
Y
SCALE
0-100
0-100
0-i00
Y
AXIS
1024
3276
8OOO
Y
RESOLUTION
.I
.03
.0125
X
SCALE
0-100
0-i00
0-100
X
AXIS
1280
4096
SO00
X
_ESOLUTION
.08
.02
.0125
To take full advantage of this method, the generated plot should use
as much of the terminal screen as is feasible. An examination of
figure 5 shows that the original system used only 51% of the screen
area for plotted data. Figure 6 shows one of the new plot formats
supported by the EGS system that uses 90% of the screen for increased
plot symbol resolution.
The goal of a data plot is to provide information through visual
inspection. The EGS system manipulates symbol shape, color, size, and
line type to convey information. With many plots, the data symbols,
when viewed as a whole, show a trend for the information plotted. In
some cases though, individual or sets of symbols need to be
differentiated within the plot. An example of this occurred during
NTF tunnel calibration. Part of the performance evaluation of the
23

tunnel involves using a long pipe, called the Centerline Pipe, that
extends in front of, and through the model test section. Although all
of the data plotted is from the pipe, the data within the test section
is of particular interest. To separate this information, all of the
pipe data is plotted with circles for consistancy, and qualified with
color; red for the test area and green for either end of the pipe.
Figure 9 shows a data plot for the Centerline Pipe. Without
separating data with color, it would be necessary to reference the X
axis and to have knowledge of centerline pipe port numbers relative to
test section station numbers, to determine which symbols are within
the test section. This requires previous knowledge of Centerline Pipe
testing to understand the plot and restricts general use of the data.
The use of color along with symbol shape also allows different types
of data in the same plot to be identified easily. Colored symbols are
very helpful when data symbols are plotted near or on top of each
other. A red triangle can be distinguished from a green circle as
long as a part of the each symbol shows. With symbols composed of
lines only, multiple symbols become a tangle of lines and cannot be
easily read.
24

C_C,
I
I i
MACH
FIGURE 9, CENTERLINE PIPE PLOT
25

Supper t: ef Multiple Plot Generation/Display
Consolidation of the NTF plotting requirements to a single task and
terminal required the capability to simultaneously maintain and
display more than one plot on the terminal. Since different plots may
be updated based on differing criteria, change in point or run number
for example, the plots must be manipulated individually under software
control.
The retained command list construct, the segment, meets these
requirements. The ability to modify, display, or add these lists as
unique items allows the plot system to handle each plot independently.
As new plot data is acquired, the affected segment is opened, new data
added, and then closed for redisplay. Since the segments are treated
individually, their content and format_are independent of other plots.
This provides great flexibility in plot definition and content.
With multiple plots being manipulated simultaneously, the plot system
needs the capability to display all plots or a subset of these plots
on the CRT. Displaying multiple plots from the host computer would
place a heavy burden on the plot system for scaling, positioning, and
retaining data.
An alternate approach makes use of the window and viewport
manipulation commands handled by the EGS terminal. Windows are
rectangular areas of terminal memory. Viewports are rectangular areas
of the display memory mapped to pixels on the CRT. The association of
26
a single viewport with a single window is called a view. The terminal
maintains multiple view definitions. Positioning each plot/segment in
a unique memory window and associating a viewport to it provides a
unique view to each plot. This allows any plot to be displayed by
selecting the correct view definition. Since a viewport does not need
to to be sized for the entire screen, multiple views can be displayed
on a single CRT. Likewise, changing the viewport definition from a
portion of the screen to full screen expands a specific plot image to
full size. Modification of the memory window allows zooming-in on
subsections of the plot image. This provides near-instantaneous
expansion of complex graphics. The mapping and scaling of the
graphics display is performed via the EGS terminal hardware and places
no extra processing burden on the host system. The use of windows and
viewports provides a simple and efficient method of handling the
display of multiple plots maintained on the terminal. The flexibility
of view definitions allows screen images to be configured to support
different plot formats.
Figure I0 and 10A show two different view setups for multiple plot
display, one for plots that have a longer X axis than Y axis and one
for square plots.
The capability to display multiple plots on the same screen is a
powerful feature in a graphics system. Not only does it allow the
operator to view the results of many plots, it allows the organization
27

of related plots into meaningful groups. For example, multiple
dependent variable can be plotted against a common independent
variable, on separate plots, and displayed simultaneously.
28

T
FIGURE 10, LONG VIEW DEFINITIONS
ORIGINAL PA_E IS
OF PuO,,_ Qu,-_:.ITY 29

m
o
i i ,_
i; _!il I_;
Iii ir_i
i!,l,i ii_
. i i11_ iii _ i Iiii i_
rl
r I iiri_ !ll
r_
iii _ii
!]! E;!!' : '
m
" ' 'i ,i _I
',T , I
; Ii , i _ ! i ! I ; ' _ J
II _!1 I!: '_, i_ ii_i 11 i i, ! ; i
_ _i i ,r •
_' : ! _,I !il ill'll _'i _,Ill !i !;
ii; ¸ i_; i!; _il iii II
' 1_ !ll ;J! i
: :_ ;! LI ! !!! ' ,,Ji! i'_ I_! il
I ¸ _ _ iJ _"_ _
_I! i_! _ lil Ill ii
i ,
I;
T i
]il i_li!l
r_,l !I!!!
_i !Ii
I :!iI
!' ii,!li,
illi!_l ii_llJllt
_I1!I,i ,i.... ii IJfll !f
!!lfI!l I !tliii;i i _il i!'I_ ,
,I!qt ,i.
ilii_ 'I
ilii'i_
i J
FIGURE 10A, SQUARE VIEW DEFINITIONS
3O

Enhanced Graphics System
The investigations into the original plot system implementation and
the utilization of the raster scan terminal produced a series of
design goals and functional requirements for the enhanced system.
These design goals can be generally categorized as:
* Consolidation of the realtime plot system
* Elimination of the acquisition system-to-graphics terminal
timing linkage
* Asynchronous processing of acquired data
* Data format independence
* Graphics terminal independence
* Support for improved realtime plot capabilities
Consolidation of Realtime Plotting
The distributed nature of the initial system was identified as a
source of host system overhead and reduced plot throughput. To remove
these penalties the EGS system consolidated all of the plot
requirements into a single plot task driving a single graphics
terminal to support realtime and offline plotting. This approach
removed redundant control and data transfers and shared hardcopier use
to reduce host system overhead and improve throughput. Eliminating
31

multiple terminals and plot tasks, plus the consolidation of multiple
plot definition files into a single file, simplified operation and
maintenance of the plot system.
task .
DASI
Figure II shows the consolidated plot
I PLOTTASK= _RAPHICS I
ITERMINAL 1
FIGURE 11, CONSOLIDATED PLOT TASK
Elimination of Acquisition to Graphics Terminal Timing Linkage
It was determined that the data acquisition rate was linked to the
proccessing speed of the graphics terminal. This is unacceptable in
realtime systems. The linkage was due to the combination of several
distinct functions; data point retrieval, data point processing, and
graphics generation into a single task. To minimize the timing
linkage, the data point retrieval function was separated into a unique
task. Figure 12 shows the separation of the data retrieval function.
DASACQUIRE
DATA
FIGURE 12, SEPARATION OF THE
J PLOT ITASK_ IGRAPHICSI
--ITERMINAL I
DATA RETRIEVAL FUNCTION
32

Asyncronous Processing of Acquired Data
Separating the data retrieval and graphics functions does not
completely eliminate the timing linkage between acquisition and
graphics systems as long as the system can only handle a single data
point at a time. The retrieval of data and graphing of data should
run asynchronously. To do this, the data retrieval task must operate
independently of the graphics task. The retrieval task must be
designed to handle the acquisition rate of the data acquisition system
regardless of graphics processing. This can be done by queueing
retrieved data points which are then passed to the graphics task as
soon as possible. Table 4 show the affects of queueing on
throughput.
TABLE 4, EFFECTS OF QUEUEING ON THROUGHPUT
TOTAl- PLOT _ TI_ _ TI_ f'c_v3ENTPlOT $_TE_ PL_ TYPE # I_tTA PT %_ _ DRTR POINTS DATA REP_
PLoI"rF_D PER DRTR _ GUEt,IED TIHE (:SEI::) TZ_ (_C) _ _ (_C) _ _ (_C) DIFFEREHCE
ORIGINRI_PRESSURE lO 87 0 209 209 20.9 20.9 OX
EGS PRESSURE 10 85 3 87 122 8.7 12.5 30_
EGS FORCE 23 1 5 17 21.5 .74 .73 20Z
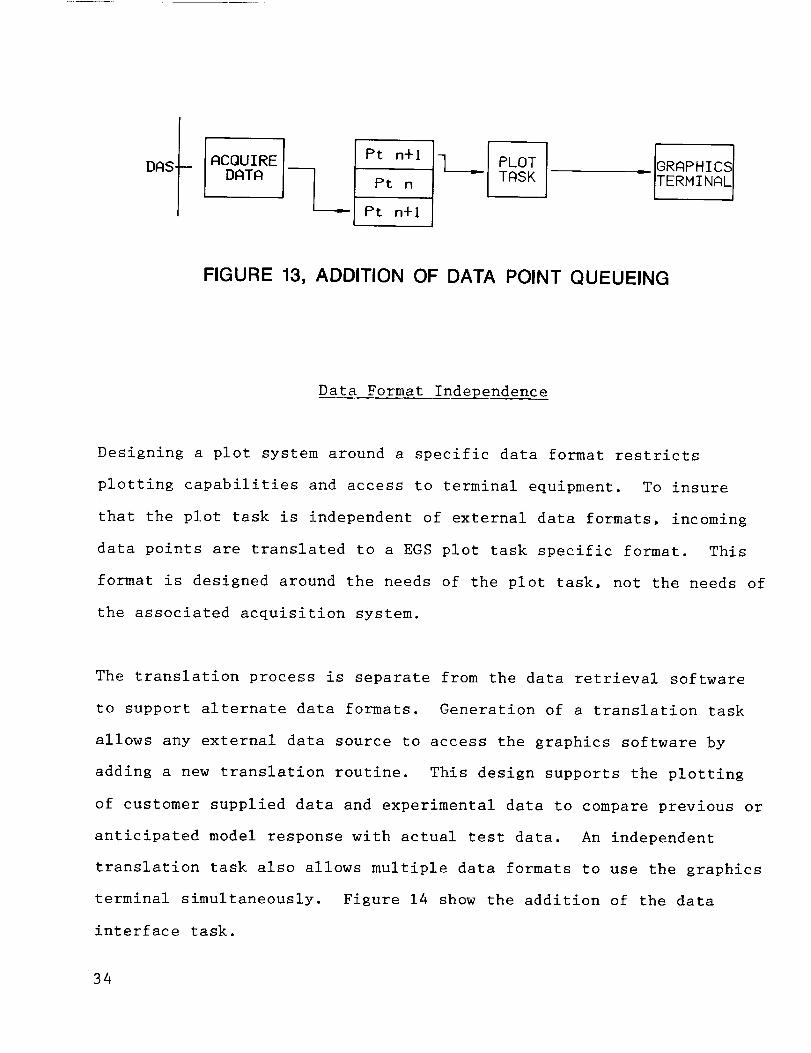
This approach does not completely eliminate the linkage but does
provide a failsafe for short term high acquisition rates. The size of
the data point queue can be configured based on system resources and
anticipated needs. Figure 13 shows the addition of data point
queuing.
33
DAS'DATA Ptn
Pt n+l
PLOTTASK
FIGURE 13, ADDITION OF DATA POINT QUEUEING
Data Format Independence
Designing a plot system around a specific data format restricts
plotting capabilities and access to terminal equipment. To insure
that the plot task is independent of external data formats, incoming
data points are translated to a EGS plot task specific format. This
format is designed around the needs of the plot task, not the needs of
the associated acquisition system.
The translation process is separate from the data retrieval software
to support alternate data formats. Generation of a translation task
allows any external data source to access the graphics software by
adding a new translation routine. This design supports the plotting
of customer supplied data and experimental data to compare previous or
anticipated model response with actual test data. An independent
translation task also allows multiple data formats to use the graphics
terminal simultaneously. Figure 14 show the addition of the data
interface task.
34

CUSTOMER FORMATAAA
DAS'
L[ Pt n-1
Pt n
Pt n+l
BBBEXPERIMENTAL FORMAT
TRANSLATE
AAA FORMAT
D--_ FORMAT
B-_ FORMAT
PLOTTASK
IGRAPHICSI
----_-ITERMINALI
FIGURE 14, ADDITION OF DATA INTERFACE TASK
Graphics Terminal Independence
Designing the plot system around a specific graphics terminal reduces
transportability and long term usability of the system. The linkage
between plotting software and the graphic command set supported by the
graphics terminal can be isolated to a degree with the correct task
design. This approach separates plot data manipulation, intertask
communications and other tasks from the command sequences used to
drive the graphics terminal. To do this, all terminal commands used
by the plotting system were implemented as single function
subroutines. This modular approach has a threefold purpose. It
allows the collection of these subroutines into a utility library
which can be accessed not only by the realtime software but also by
any task wishing to use the graphics terminal; any additional commands
required by the system can be easily implemented by the creation of a
new utility subroutine to support new requirements or terminal
upgrades; and, this method allows the plot task to be transported
35

between different graphics systems as long as there is a relatively
high correlation between the command sets. The main body of the plot
task will need only minor changes and the utility subroutines can be
simply modified to fit with different command formats having similar
functions. Figure 15 show the addition of the utility library to the
plot system.
CUSTOMERFORMATAAA
DAS-Pt n-1
Pt n
Pt n+l
8BBEXPERIMENTAL FORMAT
TRANSLATE
AAA FORMAT
DAS FORMAT
ITASK
UlTI
S
FIGURE 15, ADDITION OF UTILITIES LIBRARY
Enhanced Realtime Plotting
The EGS system is designed around the use of views, segments, and
color. To support these features, the capabilities of the raster scan
graphics terminal were augmented with the addition of several
peripherals.
36

The EGS graphics terminal supports a maximum of 64 view definitions.
Since there is a one to one correlation of view to plot, the EGS
system supports a maximum of 64 plot definitions. All, or a subset of
these plots, can be active at any time.
This number allows all of the plot requirements, pre-test, tunnel
operations, and post-test analysis, to be consolidated into a single
file. This approach simplifies operator maintenance without
restricting research requirements. Selection from a set of plots
allows the researcher to use only the subset that applies to the
current test environment.
The NTF is used by numerous organizations to test a wide variety of
models. Given the complexity of the multiple plot generation and
display, the EGS system must support a simple, controlled operator
interface that can be used by researchers unfamiliar with the system
without inadvertantly damaging operations. This is accomplished by
manipulating the 16 function keys supported by the terminal. The
function keys are programmable, allowing their definition to change
from test to test or during a test.
To demonstrate the interaction of multiple views and function keys,
consider operations during Model Preparation Area (MPA) testing.
Testing in the MPA sometimes involves the cryogenic cycling of a
balance to measure response over a range of temperatures. There are
six components measured from the balance and displaying the six
simultaneously provides an overall picture of the balance behavior.
37
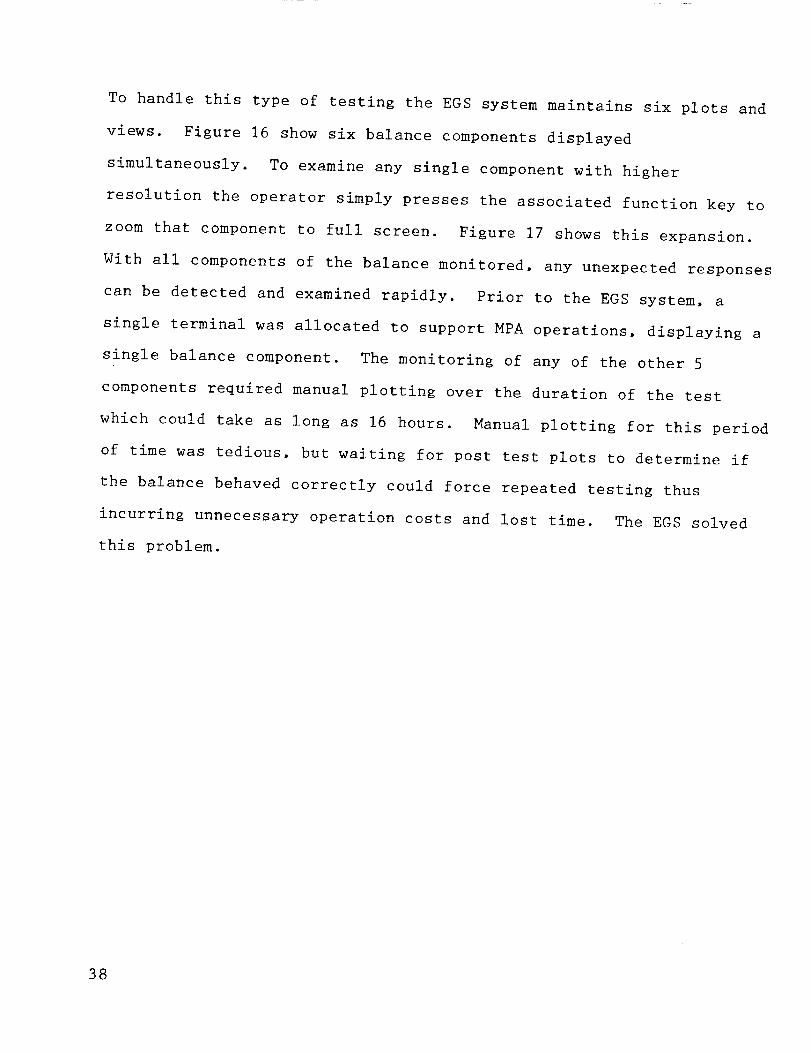
To handle this type of testing the EGS system maintains six plots and
views. Figure 16 show six balance components displayed
simultaneously. To examine any single component with higher
resolution the operator simply presses the associated function key to
zoom that component to full screen. Figure 17 shows this expansion.
With all components of the balance monitored, any unexpected responses
can be detected and examined rapidly. Prior to the EGS system, a
single terminal was allocated to support MPA operations, displaying a
single balance component. The monitoring of any of the other 5
components required manual plotting over the duration of the test
which could take as long as 16 hours. Manual plotting for this period
of time was tedious, but waiting for post test plots to determine if
the balance behaved correctly could force repeated testing thus
incurring unnecessary operation costs and lost time. The EGS solved
this problem.
38

m
FI'rl
i-"0-I
0
0
0.._0
rrl
llll_If
_t_HHtttt_tllf!1' t t_4tflHIIHtH:t_I ttfti_ I ttLHtttttfttltitfl I "tfil_ttltlHtftlI t tIHtLlltftttilIf1fttitttti-H_tH_tLtfI II _Ltl
llltlll r
•,m. 1Ill,

o
170
1 _5
I I I UI:IFB1 .US.TRIB1REDUCED l '--
IIIll114:43:3_ 4/20/90
"1"1i
C
m
mX
Z0m0
"0t-
O-4
1ESO
C
"11I:g
155
140
135
130-300, -250 . -200 . - 150 . - 1 O0 . -SO . E) . 5PJ . 11_.
TR1 B1 F

To support the EGS system's use of segments, a hard disk and a floppy
disk drive were added to the graphics terminal. The improved plot
performance using stored grids and deferred hardcopying has been
documented. The disk drives also provide the opportunity to add
additional capabilities to the system. During realtime operations,
completed plots are stored on the hard disk for future reference.
These stored plots can be retrieved and viewed using the EGS system,
or from the graphics terminal in a stand alone mode. This allows
plotted data to be examined without use of the host computer system.
Stored plots are also archieved to floppy disk for long term storage.
This allows the examination of historical data without the need for
replotting.
Under normal operations, the EGS system retrieves stored grids from
disk. An alternate approach uses a stored data plot as a background
for new plot data for direct comparison. Using a stored plot of data
taken under similar conditions allows instantaneous comparison during
tunnel operations. Combining this capability with the system ability
to plot non-NTF data allows the comparison of realtime NTF data and
data taken from other wind tunnels.
Figure 18 shows the use of comparison plotting within the EGS system.
41

The handling of data multiple formats also provides new capabilities
during offline data analysis. The results of MPA testing are curve
fitted to generate a third order fit of the hysteresis loop. A task
generating data points using the resultant coefficients can retrieve a
stored plot and plot the curve fitted data over it, showing how well
the coefficients fit the actual data.
The final peripheral addition was a high resolution color copier. The
EGS system allows operation of the color copier, a monochrome copier,
or both during realtime and offline plotting. The color copier
supports several expansion factors and paper size up to II X 17
inches. This ties in nicely with the use of very dense grids which
are even more readable in an expanded form.
42

DATA COMPARISON CAPABILITY
BACKGROUND GRID (STORED ON DISK)+COMPARISON PLOT (STORED ON DISK)+NEW PLOT DATA (FROM PLOT TASK)
=COMPLETED PLOT
DISK
COMPLETEDPLOT
COMPARISONPLOT
(ARCHIVED"-" DATA)
J
PREDEFINEDBACKGROUND
NEW PLOTDATA
FIGURE 18, DATA COMPARISON PLOTTING
43

The design of the EGS system and the addition of several peripheral
devices provide a highly flexible, high speed, high resolution plot
system. The multiple task modular approach insures long term
usability with reduced operational and maintenance costs.
Conclusions
The Enhanced Graphics System is a high speed, high resolution,
multiple plot grphics system supporting realtime and offline plotting
at the National Transonic Facility. The consolidation of plotting
requirements and graphics generation has simplified operations and
improved system usability. The system is the result of an in depth
analysis of the internal and external interactions of the initial plot
system, and graphics hardware already in place. The results of this
study and the addition of inexpensive support peripherals for the
graphics terminal has provided a cost effective, high performance
graphics system that meets the current and future needs of the NTF.
44

Report Documentation PageN,]ior_ _-_I(S at13
1. Report No.
NASA CR-4304
4. Title and Subtltle
Real time
7. Author(s)
Michael
2. Government Accession No.
Multi-Plot Graphics System
S. Shipkowski
9, Peddling Organization Name and Addre_
Wyle Laboratories
3200 Magruder Blvd.
Hampton, VA 23665-5225
12. S_n_ring Agency Name and Addre_
National Aeronautics and
Langley Research Center
Hampton, VA 23665-5225
Space Administration
15. Supplementary Notes
3. Recip_ent's Catalog No.
5. Report Date
September 1990
6. Performing Organization Code
8. Performing Organization Report No.
10. Work Unit No.
505-61-01-01
11. Contract or Grant No.
NASI-18304
13. Type of Report and Period Covered
Contractor Report
14. SpOnsOring _kgencv Code
Langley Technical Monitor: W. E. Bruce, Jr.
16. Abstract
The increased complexity of test operations and customer requirements at Langley
Research Center's National Transonic Facility (NTF) surpassed the capabilities
of the initial realtime graphics system. This report describes the analysis of
existing hardware and software and the enhancements made to develop a new
realtime graphics system° The result of this effort is a cost effective system,
based on hardware already in place, that supports high speed, high resolution,
generation and display of multiple realtime plots. The Enhanced Graphics System
(EGS) meets the current and foreseeable future realtime graphics requirements of
the NTF. While this system was developed to support wind tunnel operations, the
overall design and capability of the system is applicable to other realtime data
acquisition systems that have realtime plot requirements.
17. Key Words (Suggested by Author(sD
realtime plot
color graphics
high speed
high resolution
flexi bility"19. Security Classlf. (of this report)
Unclassified
18. Oistnbutmn Statement
Unclassified - Unlimited
Subject Category 60
20. Security Cla.csif. lof this gage)
Unclassi fled
21. No. of pages _. Price
45 A03
NASA FORM 1826 OCT
For sale by the Naliooal Technical Information Service, Springfield, Virginia 22161-2171
NASA-Langley, 1990


National Aeronautics
Space AdministrationCode NTT-4
Washington, D.C. - _---20546-0001
i


![Graphics and Data Visualization in R - OverviewGraphics and Data Visualization in R Graphics Environments Base Graphics Slide 16/121. Line Plot: Single Data Set > plot(y[,1], type="l",](https://static.fdocuments.us/doc/165x107/5f4a6acb48016c636763a1cb/graphics-and-data-visualization-in-r-overview-graphics-and-data-visualization.jpg)