MULTI OBJECTIVES FUZZY ANT COLONY OPTIMIZATION …
9
89 MULTI OBJECTIVES FUZZY ANT COLONY OPTIMIZATION DESIGN OF SUPPLY PATH SEARCHING Ditdit N. Utama 1 , Taufik Djatna 2 , Erliza Hambali 2 , Marimin 2 , and Dadan Kusdiana 3 1 Information Systems Department, Faculty of Science and Technology, State Islamic University, Jakarta, 15412, Indonesia 2 Postgraduate Program of Agro-Industrial Technology, Graduate School of Bogor Agricultural University, Bogor, West Java, 16680, Indonesia 3 Directorate of New Renewable Energy and Energy Conservation, Ministry of Energy and Mineral Resources, Jakarta, 10110, Indonesia E-mail: [email protected] Abstract One of problem faced in supply chain management is path searching. The best path depend not only on distance, but also other variables, such as: the quality of involved companies, quality of delivered product, and other value resulted by quality measurement. Commonly, the ant colony optimization could search the best path that has only one objective path. But it would be difficult to be adopted, because in the real case, the supply path has multi path and objectives (especially in palm oil based bioenergy supply). The objective of this paper is to improve the ant colony optimization for solving multi objectives based supply path problem by using fuzzy ant colony optimization. The developed multi objectives fuzzy ant colony optimization design was explained here, that it was used to search the best supply path. Keywords: multi objectives fuzzy ant colony optimization design, supply path searching, supply chain management Abstrak Salah satu masalah yang dihadapi dalam Supply Chain Management adalah pencarian jalur. Jalur terbaik tidak hanya tergantung pada jarak, tetapi juga variabel lain, seperti: kualitas perusahaan yang terlibat, kualitas produk yang dikirimkan, dan nilai lain yang dipengaruhi oleh pengukuran kualitas. Umumnya, Ant Colony Optimization bisa mencari jalur terbaik yang hanya memiliki satu jalur objektif. Tapi akan sulit untuk diadopsi, karena dalam kasus nyata, jalur supply memiliki banyak jalur dan tujuan (khususnya pasokan minyak kelapa sawit berbasis bioenergi). Tujuan dari penelitian ini adalah untuk meningkatkan Ant Colony Optimization dalam menyelesaikan masalah jalur supply dengan menggunakan Fuzzy Ant Colony Optimization. Tujuan pengembangan Fuzzy Ant Colony Optimization dijelaskan disini, yaitu digunakan untuk mencari jalur supply terbaik. Kata Kunci: desain fuzzy ant colony optimization, pencarian jalur supply, supply chain management 1. Introduction 1 In recent years, there are many researchers have been done in many fields. Rules design for diagnosis of diabetes disease [1-3], model design for detect Retina Vessel [4]; the application of soccer robot [5]; routing protocol model for mobile ad hoc network case [6]; the model for optimizing of network topology design [7]; are some examples of research in many fields that This paper is the extended version from paper titled "Multi Objectives Fuzzy Ant Colony Optimization of Palm Oil Based Bioenergy Supply Path Searching" that has been published in Proceeding of ICACSIS 2011. used Fuzzy Ant Colony Optimization (FACO) as their main method. Furthermore, many researches above used only a single objective as goal of artificial ant in searching the best solution, especially in fuzzy environment. It would be more fruitful if the artificial ant of the model could search the best solution of many solution alternatives that indicated multi objectives of the fuzzy model. On the other hand, the multi objectives of fuzzy ant colony optimization model would be easier implemented in the real supply chain problem, especially in palm oil based bioenergy supply chain case. In Ant Colony Optimization theory, the ants’ nest indicated the first level of
Transcript of MULTI OBJECTIVES FUZZY ANT COLONY OPTIMIZATION …
89
MULTI OBJECTIVES FUZZY ANT COLONY OPTIMIZATION DESIGN OF SUPPLY PATH
SEARCHING
Ditdit N. Utama1, Taufik Djatna
2, Erliza Hambali
2, Marimin
2, and Dadan Kusdiana
3
1Information Systems Department, Faculty of Science and Technology, State Islamic University, Jakarta,
15412, Indonesia 2Postgraduate Program of Agro-Industrial Technology, Graduate School of Bogor Agricultural
University, Bogor, West Java, 16680, Indonesia 3Directorate of New Renewable Energy and Energy Conservation, Ministry of Energy and Mineral
Resources, Jakarta, 10110, Indonesia
E-mail: [email protected]
Abstract
One of problem faced in supply chain management is path searching. The best path depend not only on distance, but also other variables, such as: the quality of involved companies, quality of delivered product, and other value resulted by quality measurement. Commonly, the ant colony optimization
could search the best path that has only one objective path. But it would be difficult to be adopted, because in the real case, the supply path has multi path and objectives (especially in palm oil based bioenergy supply). The objective of this paper is to improve the ant colony optimization for solving multi objectives based supply path problem by using fuzzy ant colony optimization. The developed multi objectives fuzzy ant colony optimization design was explained here, that it was used to search the best supply path.
Keywords: multi objectives fuzzy ant colony optimization design, supply path searching, supply chain management
Abstrak
Salah satu masalah yang dihadapi dalam Supply Chain Management adalah pencarian jalur. Jalur terbaik tidak hanya tergantung pada jarak, tetapi juga variabel lain, seperti: kualitas perusahaan yang
terlibat, kualitas produk yang dikirimkan, dan nilai lain yang dipengaruhi oleh pengukuran kualitas. Umumnya, Ant Colony Optimization bisa mencari jalur terbaik yang hanya memiliki satu jalur objektif. Tapi akan sulit untuk diadopsi, karena dalam kasus nyata, jalur supply memiliki banyak jalur dan tujuan (khususnya pasokan minyak kelapa sawit berbasis bioenergi). Tujuan dari penelitian ini adalah untuk meningkatkan Ant Colony Optimization dalam menyelesaikan masalah jalur supply dengan menggunakan Fuzzy Ant Colony Optimization. Tujuan pengembangan Fuzzy Ant Colony Optimization dijelaskan disini, yaitu digunakan untuk mencari jalur supply terbaik.
Kata Kunci: desain fuzzy ant colony optimization, pencarian jalur supply, supply chain management
1. Introduction1
In recent years, there are many researchers
have been done in many fields. Rules design for
diagnosis of diabetes disease [1-3], model design
for detect Retina Vessel [4]; the application of
soccer robot [5]; routing protocol model for
mobile ad hoc network case [6]; the model for
optimizing of network topology design [7]; are some examples of research in many fields that
This paper is the extended version from paper titled "Multi
Objectives Fuzzy Ant Colony Optimization of Palm Oil Based
Bioenergy Supply Path Searching" that has been published in
Proceeding of ICACSIS 2011.
used Fuzzy Ant Colony Optimization (FACO) as
their main method.
Furthermore, many researches above used
only a single objective as goal of artificial ant in
searching the best solution, especially in fuzzy
environment. It would be more fruitful if the
artificial ant of the model could search the best
solution of many solution alternatives that
indicated multi objectives of the fuzzy model. On the other hand, the multi objectives of
fuzzy ant colony optimization model would be
easier implemented in the real supply chain
problem, especially in palm oil based bioenergy
supply chain case. In Ant Colony Optimization
theory, the ants’ nest indicated the first level of
90 Journal of Computer Science and Information, Volume 5, Issue 2, June 2012
supply chain (the first supplier, in palm oil based
bioenergy supply chain case indicated farmers or
plants), and the food was searched by ants
indicated the end customer of supply chain. In the
real case of supply chain case, especially in palm
oil based bioenergy supply chain, the supplier and
the end customer must be indicated by more than
one item. Finally, this paper would explain the
model developed by using Multi Objectives Fuzzy
Ant Colony Optimization (MOFACO) method.
Here, FACO model have been modified to be Multi Objectives FACO model. It would be
implemented in palm oil based bioenergy supply
chain.
Supply chain concept is still a growing
concept in logistic problem view. In a
conventional concept, logistic problem has been
seen as internal company problem only. The
companies have to solve their problems internally
and solely, without collaborate to their company
partners. In this new one, logistic problem is seen
as a boarder problem. The logistic problem can be happen in every step of supply chain, from the
first level up to the last level of supply chain. That
is reason why supply chain management can be
defined as a set of approaches utilized to
efficiently integrate suppliers, manufactures,
warehouse, and stores, so that merchandise is
produced and distributed at the right quantities, to
the right locations, at the right time, in order to
minimize system wide costs while satisfying
service level requirement [8]. Figure 1 described
supply chain management concept. On the other hand, in a supply chain is the
alignment of firms that bring products or services
to market.” from Lambert, Stock, and Ellram [9].
The supply chain consists of all stages involved,
directly or indirectly, in fulfilling a customer
request. The supply chain not only includes the
manufacturer and suppliers, but also transporters,
warehouses, retailers, and customers themselves
[10]. The other definition said that the supply
chain is a network of facilities and distribution
options that performs the functions of
procurement of materials, transformation of these materials into intermediate and finished products,
and the distribution of these finished products to
customers [11].
Guthjar [12] said that ACO is an
optimization technique inspired by observations
on the behavior of biological ant colonies; it has
been introduced by [13], and [14]; and developed
later into a meta-heuristic for combinatorial
optimization problems [15-17]. Recently, ACO
algorithms have also turned out as competitive in
a discrete stochastic optimization context [18-22]. Furthermore, an ACO is essentially a system
based on agent, which simulates the natural
behavior of ants including mechanisms of co-
operation and adaptation. To use this kind of
system, a new meta-heuristics proposed in order
to solve combinatorial optimization problems.
This new meta-heuristic has been shown to be
both robust and versatile in the sense that it has
been successfully applied to arrange of different
combinatorial optimization problems. ACO
algorithms are based on following ideas [23]: (1)
Each path, is followed by an ant, is associated
with a candidate solution for a given problem. (2) When an ant follows a path, the amount of
pheromone deposited on that path. This path is
proportional to the quality of the corresponding
candidate solution for the target problem. (3)
When an ant has to choose between two and more
paths, the path with a larger amount of pheromone
has a greater probability of being chosen by the
ant.
Fuzzy Ant Colony Optimization combines
Ant Colony Optimization with Fuzzy
Performance Variable. In this case, there are three variables of performance variables that can be
identified by using Fuzzy logic, they are:
Performance of human resource, value added and
transportation cost. This fuzzy logic could
improve the previous variables value (ACO based
variables value) representation.
2. Methodology
Actually, the basic thinking of this research
is model development for the most optimum searching in one supply chain. There are seven
steps of research. The first step is the supply chain
partnership identification. In this step, we
identified all partners involved in bio-energy
supply chain business process. The first step’s
result could be used to develop supply network
(the second step). Principally, these two steps
mentioned to make us more understand about bio-
energy supply chain configuration, especially
palm oil based bio-energy.
Furthermore, in third step, we identified all
variable needed to measure performance, both supply chain element performance and supply
chain performance. Before we measured the
performance of supply chain element and supply
chain (step 5 and 6), we processed all variables by
using fuzzy logic method (step 4). Finally, we
developed model for searching the most optimum
path of supply chain.
Formally, data were collected by using
observation, survey, literature study, Supply
Chain Operations Reference method [24][25] to
develop supply chain network map. We did some observations and survey in Riau Province,
especially at Dumai and Kuala Enok Industrial
Utama, et al., Multi Objectives Fuzzy Ant Colony Optimization Design 91
Area, Plantation Department, farmers and
collectors. In fact, we did not get data fully
according to we needed, so we generated them by
using Monte Carlo Simulation method.
Start
Define Partners of
Supply Chain
Develop Supply
Network
Measure Supply
Chain Element
Performance
Measure Supply
Chain Performance
Search Intelligent
Supply Chain
Finish
SCOR Method
(Bolstorff and Rosenbaum,
2007; Fronia et al. 2008)
SCOR Method
(Bolstorff and Rosenbaum,
2007; Fronia et al. 2008)
Ant Colony Oprimization Method
(Dorigo and Stuzle, 2004)
Financial Measurement Method
Fuzzy Logic
Process
Fuzzy Logic Method
(Zadeh, 1974)
Identified the
Measurement
Variables
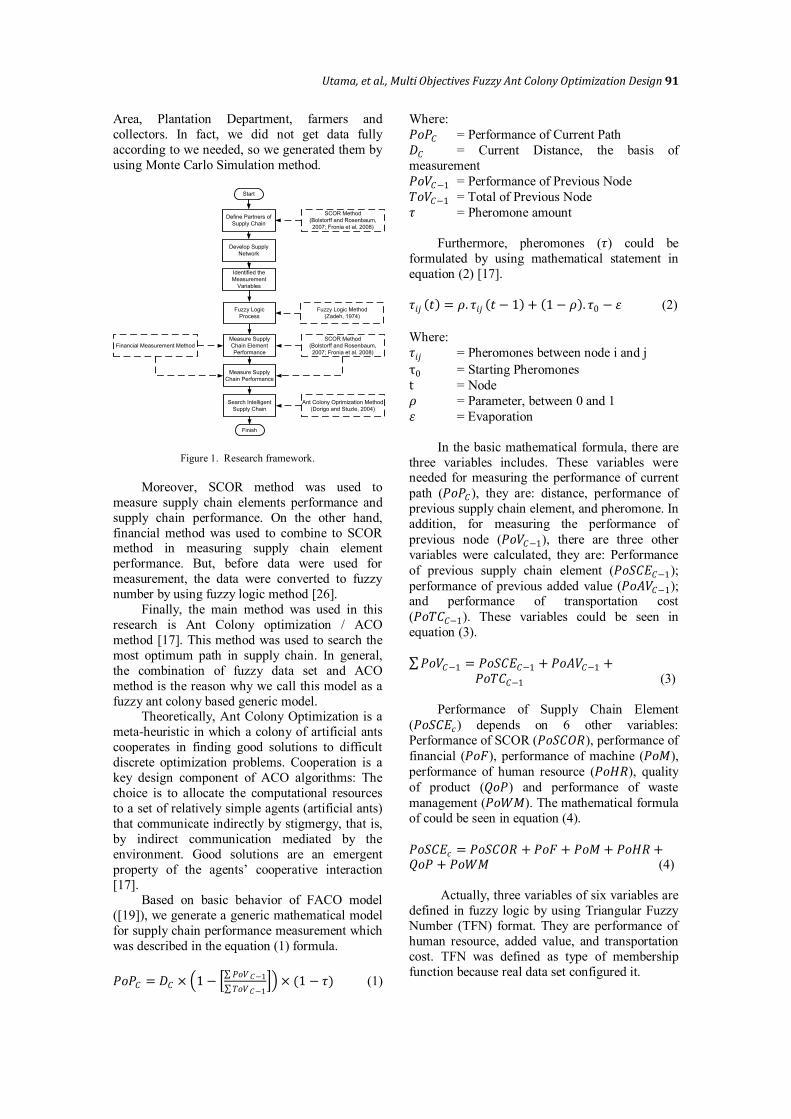
Figure 1. Research framework.
Moreover, SCOR method was used to
measure supply chain elements performance and
supply chain performance. On the other hand,
financial method was used to combine to SCOR method in measuring supply chain element
performance. But, before data were used for
measurement, the data were converted to fuzzy
number by using fuzzy logic method [26].
Finally, the main method was used in this
research is Ant Colony optimization / ACO
method [17]. This method was used to search the
most optimum path in supply chain. In general,
the combination of fuzzy data set and ACO
method is the reason why we call this model as a
fuzzy ant colony based generic model. Theoretically, Ant Colony Optimization is a
meta-heuristic in which a colony of artificial ants
cooperates in finding good solutions to difficult
discrete optimization problems. Cooperation is a
key design component of ACO algorithms: The
choice is to allocate the computational resources
to a set of relatively simple agents (artificial ants)
that communicate indirectly by stigmergy, that is,
by indirect communication mediated by the
environment. Good solutions are an emergent
property of the agents’ cooperative interaction
[17]. Based on basic behavior of FACO model
([19]), we generate a generic mathematical model
for supply chain performance measurement which
was described in the equation (1) formula.
𝑃𝑜𝑃𝐶 = 𝐷𝐶 × 1 − 𝑃𝑜𝑉𝐶−1
𝑇𝑜𝑉𝐶−1 × (1 − 𝜏) (1)
Where:
𝑃𝑜𝑃𝐶 = Performance of Current Path
𝐷𝐶 = Current Distance, the basis of
measurement
𝑃𝑜𝑉𝐶−1 = Performance of Previous Node
𝑇𝑜𝑉𝐶−1 = Total of Previous Node
𝜏 = Pheromone amount
Furthermore, pheromones (𝜏) could be
formulated by using mathematical statement in
equation (2) [17].
𝜏𝑖𝑗 𝑡 = 𝜌. 𝜏𝑖𝑗 𝑡 − 1 + 1 − 𝜌 . 𝜏0 − 𝜀 (2)
Where:
𝜏𝑖𝑗 = Pheromones between node i and j
τ0 = Starting Pheromones
t = Node
𝜌 = Parameter, between 0 and 1
𝜀 = Evaporation
In the basic mathematical formula, there are
three variables includes. These variables were needed for measuring the performance of current
path (𝑃𝑜𝑃𝐶), they are: distance, performance of
previous supply chain element, and pheromone. In
addition, for measuring the performance of
previous node (𝑃𝑜𝑉𝐶−1), there are three other
variables were calculated, they are: Performance
of previous supply chain element (𝑃𝑜𝑆𝐶𝐸𝐶−1);
performance of previous added value (𝑃𝑜𝐴𝑉𝐶−1); and performance of transportation cost
(𝑃𝑜𝑇𝐶𝐶−1). These variables could be seen in
equation (3).
𝑃𝑜𝑉𝐶−1 = 𝑃𝑜𝑆𝐶𝐸𝐶−1 + 𝑃𝑜𝐴𝑉𝐶−1 +
𝑃𝑜𝑇𝐶𝐶−1 (3)
Performance of Supply Chain Element
(𝑃𝑜𝑆𝐶𝐸𝑐) depends on 6 other variables:
Performance of SCOR (𝑃𝑜𝑆𝐶𝑂𝑅), performance of
financial (𝑃𝑜𝐹), performance of machine (𝑃𝑜𝑀),
performance of human resource (𝑃𝑜𝐻𝑅), quality
of product (𝑄𝑜𝑃) and performance of waste
management (𝑃𝑜𝑊𝑀). The mathematical formula
of could be seen in equation (4).
𝑃𝑜𝑆𝐶𝐸𝑐 = 𝑃𝑜𝑆𝐶𝑂𝑅 + 𝑃𝑜𝐹 + 𝑃𝑜𝑀 + 𝑃𝑜𝐻𝑅 +𝑄𝑜𝑃 + 𝑃𝑜𝑊𝑀 (4)
Actually, three variables of six variables are
defined in fuzzy logic by using Triangular Fuzzy
Number (TFN) format. They are performance of
human resource, added value, and transportation
cost. TFN was defined as type of membership
function because real data set configured it.
92 Journal of Computer Science and Information, Volume 5, Issue 2, June 2012
Basically, we wanted to categorize the real
data sets of added value variable to be three
natural language categories (low, medium and
high). Firstly, from real added value data sets and
normalized value added data sets, we got the
element value of membership functions between
0.10 (min) and 1.00 (max), it was called as confidence interval. It indicated the limitation of
ordinal value. After that, we set the range of three
natural language categories: 0.10 – 0.33 for low,
0.33 – 0.78 for medium, and 0.78 – 1.00 for high
category. All categories were set according to element value range of membership function and
point 0.55 (∝𝑚𝑖𝑛 +∝𝑚𝑎𝑥
2) as a median of the second
category (medium).
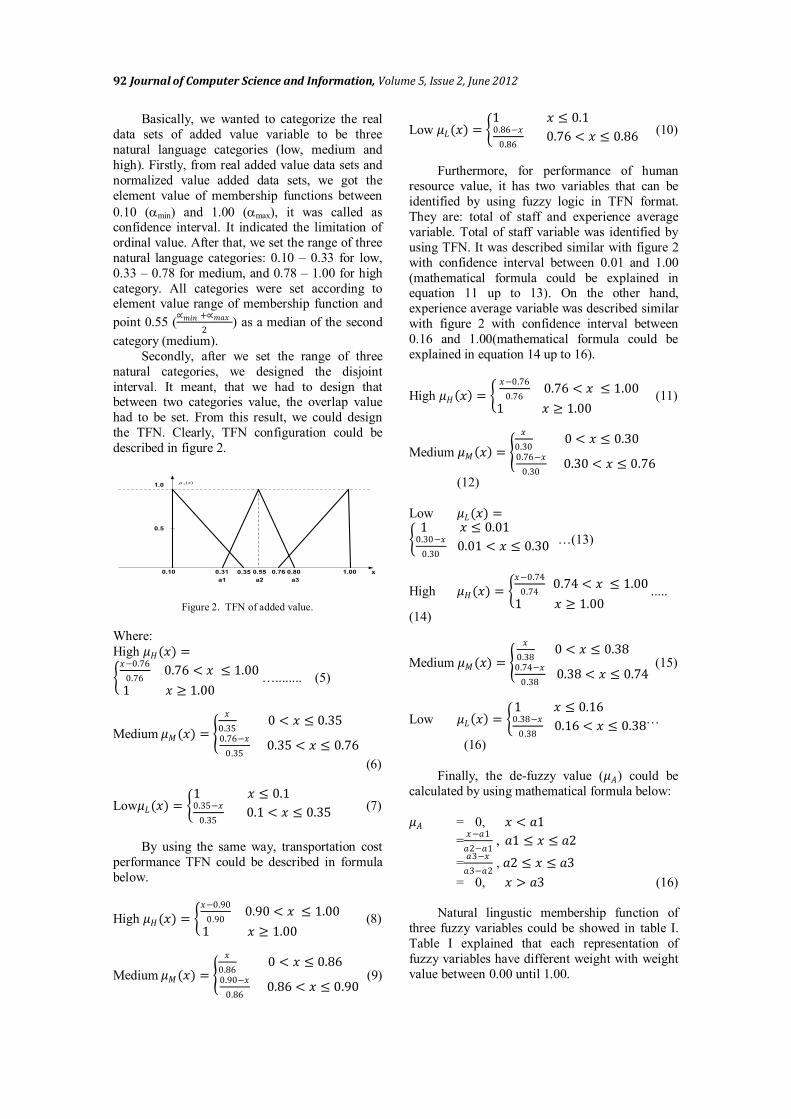
Secondly, after we set the range of three
natural categories, we designed the disjoint
interval. It meant, that we had to design that between two categories value, the overlap value
had to be set. From this result, we could design
the TFN. Clearly, TFN configuration could be
described in figure 2.
0.5
1.0
a1
0.10
a2
x
)(xA
0.35
a3
0.31 0.55 0.800.76 1.00
Figure 2. TFN of added value.
Where:
High 𝜇𝐻(𝑥) =
𝑥−0.76
0.76 0.76 < 𝑥 ≤ 1.00
1 𝑥 ≥ 1.00
…........ (5)
Medium 𝜇𝑀(𝑥) =
𝑥
0.35 0 < 𝑥 ≤ 0.35
0.76−𝑥
0.35 0.35 < 𝑥 ≤ 0.76
(6)
Low𝜇𝐿(𝑥) = 1 𝑥 ≤ 0.1 0.35−𝑥
0.35 0.1 < 𝑥 ≤ 0.35
(7)
By using the same way, transportation cost
performance TFN could be described in formula
below.
High 𝜇𝐻(𝑥) = 𝑥−0.90
0.90 0.90 < 𝑥 ≤ 1.00
1 𝑥 ≥ 1.00
(8)
Medium 𝜇𝑀(𝑥) =
𝑥
0.86 0 < 𝑥 ≤ 0.86
0.90−𝑥
0.86 0.86 < 𝑥 ≤ 0.90
(9)
Low 𝜇𝐿(𝑥) = 1 𝑥 ≤ 0.1 0.86−𝑥
0.86 0.76 < 𝑥 ≤ 0.86
(10)
Furthermore, for performance of human
resource value, it has two variables that can be
identified by using fuzzy logic in TFN format.
They are: total of staff and experience average
variable. Total of staff variable was identified by
using TFN. It was described similar with figure 2
with confidence interval between 0.01 and 1.00
(mathematical formula could be explained in equation 11 up to 13). On the other hand,
experience average variable was described similar
with figure 2 with confidence interval between
0.16 and 1.00(mathematical formula could be
explained in equation 14 up to 16).
High 𝜇𝐻 𝑥 = 𝑥−0.76
0.76 0.76 < 𝑥 ≤ 1.00
1 𝑥 ≥ 1.00
(11)
Medium 𝜇𝑀 𝑥 =
𝑥
0.30 0 < 𝑥 ≤ 0.30
0.76−𝑥
0.30 0.30 < 𝑥 ≤ 0.76
(12)
Low 𝜇𝐿(𝑥) =
1 𝑥 ≤ 0.01
0.30−𝑥
0.30 0.01 < 𝑥 ≤ 0.30
…(13)
High 𝜇𝐻(𝑥) = 𝑥−0.74
0.74 0.74 < 𝑥 ≤ 1.00
1 𝑥 ≥ 1.00
.....
(14)
Medium 𝜇𝑀(𝑥) =
𝑥
0.38 0 < 𝑥 ≤ 0.38
0.74−𝑥
0.38 0.38 < 𝑥 ≤ 0.74
(15)
Low 𝜇𝐿 𝑥 = 1 𝑥 ≤ 0.16 0.38−𝑥
0.38 0.16 < 𝑥 ≤ 0.38
…
(16)
Finally, the de-fuzzy value (𝜇𝐴) could be
calculated by using mathematical formula below:
𝜇𝐴 = 0, 𝑥 < 𝑎1
=𝑥−𝑎1
𝑎2−𝑎1 , 𝑎1 ≤ 𝑥 ≤ 𝑎2
=𝑎3−𝑥
𝑎3−𝑎2 , 𝑎2 ≤ 𝑥 ≤ 𝑎3
= 0, 𝑥 > 𝑎3 (16)
Natural lingustic membership function of
three fuzzy variables could be showed in table I.
Table I explained that each representation of
fuzzy variables have different weight with weight
value between 0.00 until 1.00.
Utama, et al., Multi Objectives Fuzzy Ant Colony Optimization Design 93
Based on formula (1) that combined with
multi objective formula [27] in formula (17) and
then changed to Fuzzy based multi objective
formula (18), so mathematical model of multi
objective based fuzzy ant colony optimization
could be stated in formula (19). The best
alternative of path decision consisted of m
searching sources, n objectives, and o searching
path (20).
TABLE I
LINGUISTIC SCALE VS WEIGHT
Variables Linguistic
Scale
Weight (ω)
Added Value
Performance
High 0.76 < 𝑥 ≤ 1.00
Medium 0.35 < 𝑥 ≤ 0.76
Low 0.10 < 𝑥 ≤ 0.35
Transportation Cost
Performance
High 0.90 < 𝑥 ≤ 1.00
Medium 0.86 < 𝑥 ≤ 0.90
Low 0.76 < 𝑥 ≤ 0.86
Staff Total High 0.76 < 𝑥 ≤ 1.00
Medium 0.30 < 𝑥 ≤ 0.76
Low 0.01 < 𝑥 ≤ 0.30
Working Experience
Performance
High 0.74 < 𝑥 ≤ 1.00
Medium 0.38 < 𝑥 ≤ 0.74
Low 0.16 < 𝑥 ≤ 0.38
(17)
(18)
(19)
(20)
Where:
Jmno = Starting point of searching (m) on
objective (n) on path (o).
X mno = Performance of supply chain element on starting point (m) on objective (n)
on path (o) (in fuzzy: high, medium,
low; weight ω).
Ymno = Amount of Supply chain element on
starting point (m) on objective (n) on path (o).
τ = Pheromones.
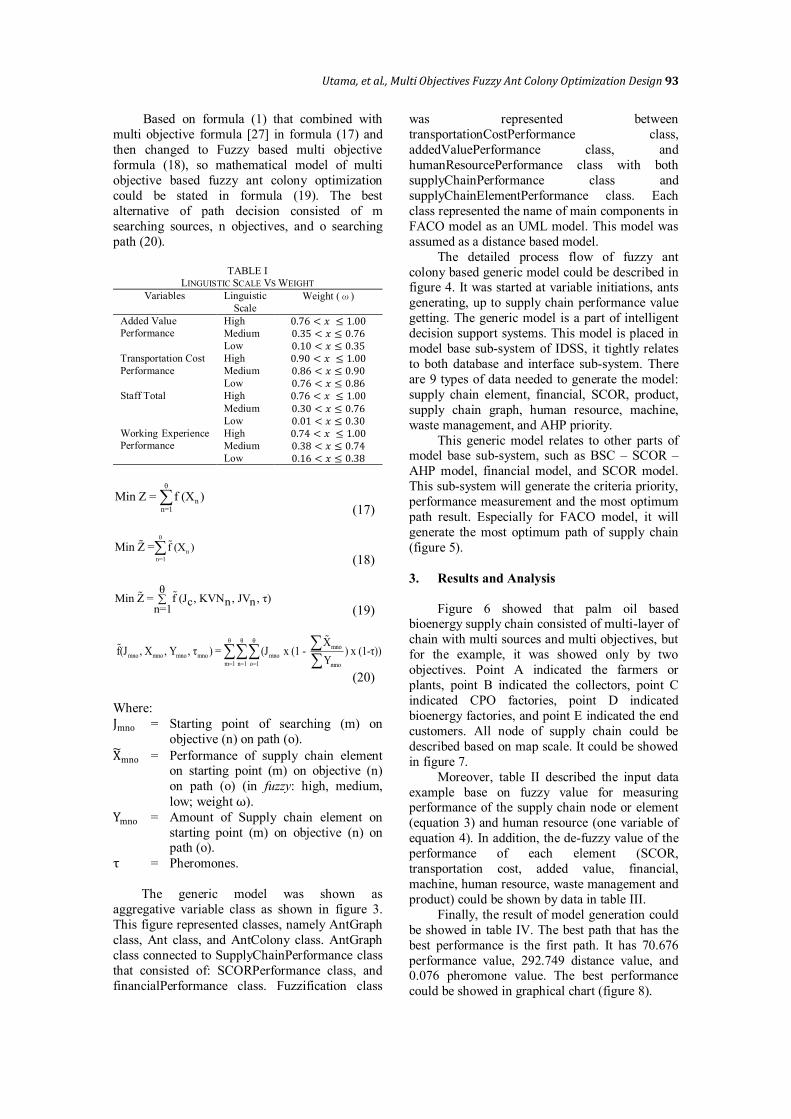
The generic model was shown as
aggregative variable class as shown in figure 3.
This figure represented classes, namely AntGraph
class, Ant class, and AntColony class. AntGraph
class connected to SupplyChainPerformance class
that consisted of: SCORPerformance class, and
financialPerformance class. Fuzzification class
was represented between
transportationCostPerformance class,
addedValuePerformance class, and
humanResourcePerformance class with both
supplyChainPerformance class and
supplyChainElementPerformance class. Each
class represented the name of main components in
FACO model as an UML model. This model was
assumed as a distance based model.
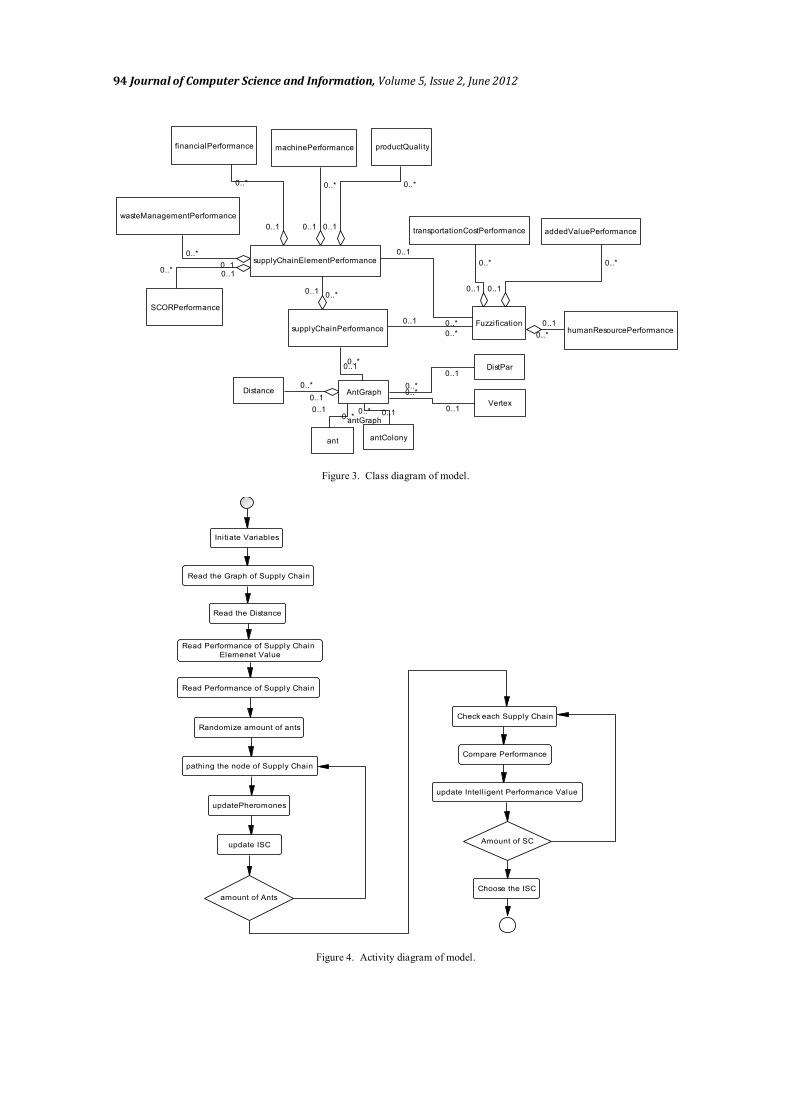
The detailed process flow of fuzzy ant
colony based generic model could be described in figure 4. It was started at variable initiations, ants
generating, up to supply chain performance value
getting. The generic model is a part of intelligent
decision support systems. This model is placed in
model base sub-system of IDSS, it tightly relates
to both database and interface sub-system. There
are 9 types of data needed to generate the model:
supply chain element, financial, SCOR, product,
supply chain graph, human resource, machine,
waste management, and AHP priority.
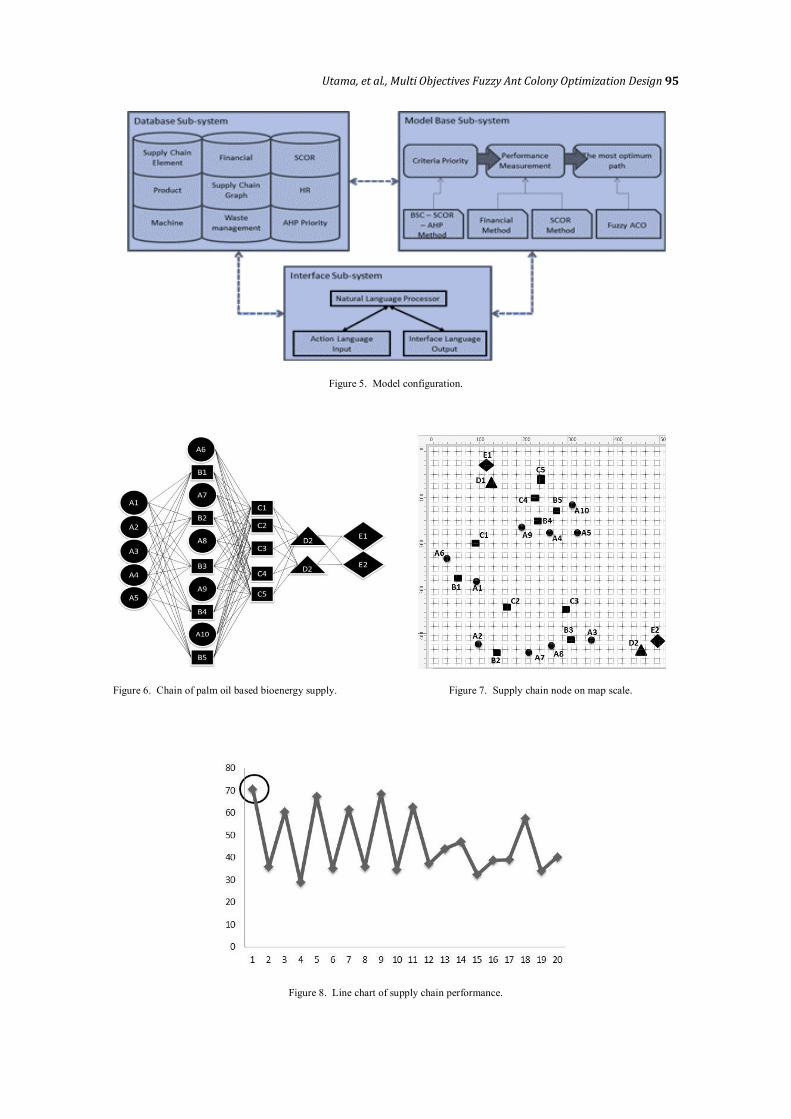
This generic model relates to other parts of model base sub-system, such as BSC – SCOR –
AHP model, financial model, and SCOR model.
This sub-system will generate the criteria priority,
performance measurement and the most optimum
path result. Especially for FACO model, it will
generate the most optimum path of supply chain
(figure 5).
3. Results and Analysis
Figure 6 showed that palm oil based bioenergy supply chain consisted of multi-layer of
chain with multi sources and multi objectives, but
for the example, it was showed only by two
objectives. Point A indicated the farmers or
plants, point B indicated the collectors, point C
indicated CPO factories, point D indicated
bioenergy factories, and point E indicated the end
customers. All node of supply chain could be
described based on map scale. It could be showed
in figure 7.
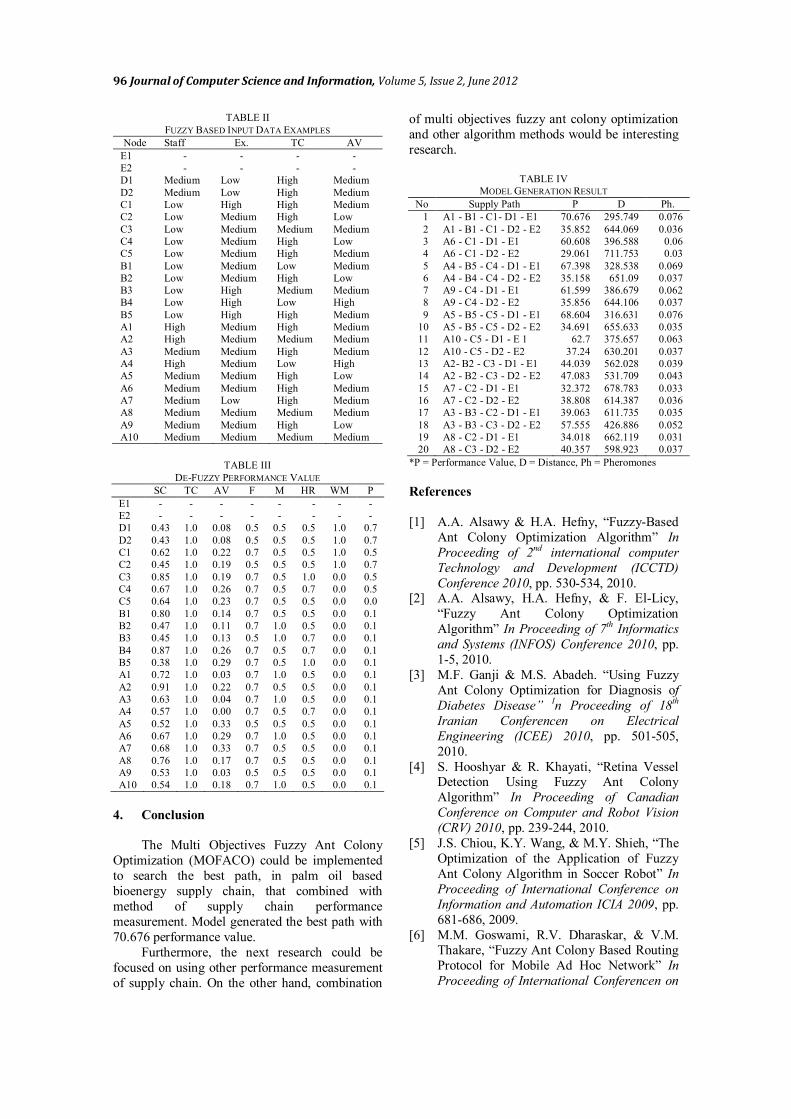
Moreover, table II described the input data
example base on fuzzy value for measuring performance of the supply chain node or element
(equation 3) and human resource (one variable of
equation 4). In addition, the de-fuzzy value of the
performance of each element (SCOR,
transportation cost, added value, financial,
machine, human resource, waste management and
product) could be shown by data in table III.
Finally, the result of model generation could
be showed in table IV. The best path that has the
best performance is the first path. It has 70.676
performance value, 292.749 distance value, and 0.076 pheromone value. The best performance
could be showed in graphical chart (figure 8).
θ
nn=1
Min Z = f (X )
θ
n
n=1
f (X )Min Z =
θMin Z = f (J , KVN , JV , τ)c n n
n=1
θ θmno
mno mno mno mno mno
m=1 n=1 o 1 mno
Xf(J , X , Y , τ ) = (J x (1 - ) x (1-τ))
Y
94 Journal of Computer Science and Information, Volume 5, Issue 2, June 2012
Figure 3. Class diagram of model.
Figure 4. Activity diagram of model.
0..10..*
0..10..*
antGraph
0..1
0..*
0..10..*
0..1
0..*
0..1
0..*
0..10..*
0..1
0..*
0..1
0..*
0..1
0..*
0..1
0..*
0..1
0..*
0..1
0..*
0..1
0..*
0..1
0..*
0..1
0..*
0..10..*
ant antColony
AntGraph
supplyChainPerformance
Distance
SCORPerformance
financialPerformance
transportationCostPerformance addedValuePerformance
DistPar
Vertex
FuzzificationhumanResourcePerformance
supplyChainElementPerformance
machinePerformance productQuality
wasteManagementPerformance
Initiate Variables
Read the Graph of Supply Chain
Read Performance of Supply Chain
Elemenet Value
Read Performance of Supply Chain
Randomize amount of ants
pathing the node of Supply Chain
amount of Ants
updatePheromones
update ISC
Read the Distance
Check each Supply Chain
Compare Performance
Amount of SC
update Intell igent Performance Value
Choose the ISC
Utama, et al., Multi Objectives Fuzzy Ant Colony Optimization Design 95
Figure 5. Model configuration.
Figure 6. Chain of palm oil based bioenergy supply.
Figure 7. Supply chain node on map scale.
Figure 8. Line chart of supply chain performance.
96 Journal of Computer Science and Information, Volume 5, Issue 2, June 2012
TABLE II
FUZZY BASED INPUT DATA EXAMPLES
Node Staff Ex. TC AV
E1 - - - -
E2 - - - -
D1 Medium Low High Medium
D2 Medium Low High Medium
C1 Low High High Medium
C2 Low Medium High Low
C3 Low Medium Medium Medium
C4 Low Medium High Low
C5 Low Medium High Medium
B1 Low Medium Low Medium
B2 Low Medium High Low
B3 Low High Medium Medium
B4 Low High Low High
B5 Low High High Medium
A1 High Medium High Medium
A2 High Medium Medium Medium
A3 Medium Medium High Medium
A4 High Medium Low High
A5 Medium Medium High Low
A6 Medium Medium High Medium
A7 Medium Low High Medium
A8 Medium Medium Medium Medium
A9 Medium Medium High Low
A10 Medium Medium Medium Medium
TABLE III
DE-FUZZY PERFORMANCE VALUE
SC TC AV F M HR WM P
E1 - - - - - - - -
E2 - - - - - - - -
D1 0.43 1.0 0.08 0.5 0.5 0.5 1.0 0.7
D2 0.43 1.0 0.08 0.5 0.5 0.5 1.0 0.7
C1 0.62 1.0 0.22 0.7 0.5 0.5 1.0 0.5
C2 0.45 1.0 0.19 0.5 0.5 0.5 1.0 0.7
C3 0.85 1.0 0.19 0.7 0.5 1.0 0.0 0.5
C4 0.67 1.0 0.26 0.7 0.5 0.7 0.0 0.5
C5 0.64 1.0 0.23 0.7 0.5 0.5 0.0 0.0
B1 0.80 1.0 0.14 0.7 0.5 0.5 0.0 0.1
B2 0.47 1.0 0.11 0.7 1.0 0.5 0.0 0.1
B3 0.45 1.0 0.13 0.5 1.0 0.7 0.0 0.1
B4 0.87 1.0 0.26 0.7 0.5 0.7 0.0 0.1
B5 0.38 1.0 0.29 0.7 0.5 1.0 0.0 0.1
A1 0.72 1.0 0.03 0.7 1.0 0.5 0.0 0.1
A2 0.91 1.0 0.22 0.7 0.5 0.5 0.0 0.1
A3 0.63 1.0 0.04 0.7 1.0 0.5 0.0 0.1
A4 0.57 1.0 0.00 0.7 0.5 0.7 0.0 0.1
A5 0.52 1.0 0.33 0.5 0.5 0.5 0.0 0.1
A6 0.67 1.0 0.29 0.7 1.0 0.5 0.0 0.1
A7 0.68 1.0 0.33 0.7 0.5 0.5 0.0 0.1
A8 0.76 1.0 0.17 0.7 0.5 0.5 0.0 0.1
A9 0.53 1.0 0.03 0.5 0.5 0.5 0.0 0.1
A10 0.54 1.0 0.18 0.7 1.0 0.5 0.0 0.1
4. Conclusion
The Multi Objectives Fuzzy Ant Colony
Optimization (MOFACO) could be implemented
to search the best path, in palm oil based
bioenergy supply chain, that combined with
method of supply chain performance
measurement. Model generated the best path with
70.676 performance value.
Furthermore, the next research could be
focused on using other performance measurement
of supply chain. On the other hand, combination
of multi objectives fuzzy ant colony optimization
and other algorithm methods would be interesting
research.
TABLE IV
MODEL GENERATION RESULT
No Supply Path P D Ph.
1 A1 - B1 - C1- D1 - E1 70.676 295.749 0.076
2 A1 - B1 - C1 - D2 - E2 35.852 644.069 0.036
3 A6 - C1 - D1 - E1 60.608 396.588 0.06
4 A6 - C1 - D2 - E2 29.061 711.753 0.03
5 A4 - B5 - C4 - D1 - E1 67.398 328.538 0.069
6 A4 - B4 - C4 - D2 - E2 35.158 651.09 0.037
7 A9 - C4 - D1 - E1 61.599 386.679 0.062
8 A9 - C4 - D2 - E2 35.856 644.106 0.037
9 A5 - B5 - C5 - D1 - E1 68.604 316.631 0.076
10 A5 - B5 - C5 - D2 - E2 34.691 655.633 0.035
11 A10 - C5 - D1 - E 1 62.7 375.657 0.063
12 A10 - C5 - D2 - E2 37.24 630.201 0.037
13 A2- B2 - C3 - D1 - E1 44.039 562.028 0.039
14 A2 - B2 - C3 - D2 - E2 47.083 531.709 0.043
15 A7 - C2 - D1 - E1 32.372 678.783 0.033
16 A7 - C2 - D2 - E2 38.808 614.387 0.036
17 A3 - B3 - C2 - D1 - E1 39.063 611.735 0.035
18 A3 - B3 - C3 - D2 - E2 57.555 426.886 0.052
19 A8 - C2 - D1 - E1 34.018 662.119 0.031
20 A8 - C3 - D2 - E2 40.357 598.923 0.037
*P = Performance Value, D = Distance, Ph = Pheromones
References
[1] A.A. Alsawy & H.A. Hefny, “Fuzzy-Based
Ant Colony Optimization Algorithm” In
Proceeding of 2nd international computer
Technology and Development (ICCTD)
Conference 2010, pp. 530-534, 2010. [2] A.A. Alsawy, H.A. Hefny, & F. El-Licy,
“Fuzzy Ant Colony Optimization
Algorithm” In Proceeding of 7th Informatics
and Systems (INFOS) Conference 2010, pp.
1-5, 2010.
[3] M.F. Ganji & M.S. Abadeh. “Using Fuzzy
Ant Colony Optimization for Diagnosis of
Diabetes Disease” In Proceeding of 18th
Iranian Conferencen on Electrical
Engineering (ICEE) 2010, pp. 501-505,
2010.
[4] S. Hooshyar & R. Khayati, “Retina Vessel Detection Using Fuzzy Ant Colony
Algorithm” In Proceeding of Canadian
Conference on Computer and Robot Vision
(CRV) 2010, pp. 239-244, 2010.
[5] J.S. Chiou, K.Y. Wang, & M.Y. Shieh, “The
Optimization of the Application of Fuzzy
Ant Colony Algorithm in Soccer Robot” In
Proceeding of International Conference on
Information and Automation ICIA 2009, pp.
681-686, 2009.
[6] M.M. Goswami, R.V. Dharaskar, & V.M. Thakare, “Fuzzy Ant Colony Based Routing
Protocol for Mobile Ad Hoc Network” In
Proceeding of International Conferencen on
Utama, et al., Multi Objectives Fuzzy Ant Colony Optimization Design 97
Computer Engineering and Technology
ICCET 2009, pp. 438-444, 2009.
[7] S.A. Khan & A.P. Engelbrecht, “A Fuzzy
Ant Colony Optimization Algorithm for
Topology Design of Distributed Local Area
Networks” In Proceeding of IEEE Swarm
Intelligence Symp. SIS 2008, pp. 1-7, 2008.
[8] D.S. Levi, P. Kaminsky, & E.S. Levi,
Designing and Managing the Supply Chain:
Concepts, Strategies and Case Studies, Irwin
McGraw-Hill, 2000. [9] D.M. Lambert, J.R. Stock, & L.M. Ellram,
Fundamentals of Logistics Management,
Boston, MA: Irwin/McGraw-Hill, 1998.
[10] S. Chopra & P. Meindl, Supply Chain
(Second Edition), Upper Saddle River, NJ:
Prentice-Hall, Inc, 2003.
[11] R. Ganeshan & T.P. Harrison, An
Introduction to Supply Chain Management,
Department of Management Sciences and
Information Systems, 303 Beam Business
Building, Penn State University, University Park, PA, 1995.
[12] W.J. Gutjahr “On the Finite-Time Dynamics
of Ant Colony Optimization” Methodology
for Computation Application Probabilistic
(2006) 8, pp. 105–133, 2006.
[13] B.J. Yun & L.S. Yong, “Improved Ant
Colony Algorithm with Emphasis on Data
Processing and Dynamic City Choice” In
Proceeding of International Conference on
Information Engineering and Computer
Science ICIECS 2009, pp. 1-4, 2009. [14] M. Dorigo, V. Maniezzo, & A. Colorni,
“Ant System: Optimization by a Colony of
Cooperating Agents” IEEE Transactions on
Systems, Man, and Cybernetics, Part B vol.
26(1), pp. 29–41, 1996.
[15] M. Dorigo & G. Di Caro, The Ant Colony
Optimization metaheuristic. In D. Corne M.
Dorigo, and Glover F, (eds.), New Ideas in
Optimization, McGraw Hill: London, UK,
1999.
[16] M. Dorigo, G. Di Caro, & L.M.
Gambardella, “Ant algorithms for discrete optimization” Artificial Life vol. 5 (2), pp.
137–172, 1999.
[17] M. Dorigo & T. Stutzle, Ant Colony
Optimization, MIT Press: Cambridge, MA,
2004.
[18] L. Bianchi, L.M. Gambardella, & M.
Dorigo, “Solving the homogeneous
probabilistic travelling salesman problem by
the ACO meta-heuristic” in Proceeding of
ANTS 2002, 3rd International Workshop on
Ant Algorithms, pp. 177–187, 2002.
[19] W.J. Gutjahr, “A converging ACO algorithm
for stochastic combinatorial optimization” in
Proceedings of SAGA 2003 (Stochastic
Algorithms: Foundations and Applications),
In A. Albrecht and K. Steinhoefl (eds.),
Lecture Notes in Computer Science 2827,
pp. 10–25, Springer: Berlin, Germany, 2003.
[20] W.J. Gutjahr, “S-ACO: an ant-based
approach to combinatorial optimization
under uncertainty” in Ant Colony
Optimization and Swarm Intelligence: Proceedings of ANTS 2004—Fourth
International Workshop, Lecture Notes in
Computer Science 3172, pp. 238–249,
Springer: Berlin, Germany, 2004.
[21] M. Rauner, S.C. Brailsford, W.J. Gutjahr, &
W. Zeppelzauer, “Optimal screening policies
for diabetic retinopathy using a combined
discrete-event simulation and ant colony
optimization approach” In J. G. Anderson
and M. Katzper (eds.), Proceeding
International Conference on Health Sciences Simulation, Western Multi Conference 2005,
pp. 147–152, 2005.
[22] M. Birattari, P. Balaprakash, & M. Dorigo,
“ACO / F-Race: Ant colony optimization
and racing techniques for combinatorial
optimization under uncertainty” in
Proceedings of MIC 2005 6th Metaheuristics
International Conference, pp. 107–112,
2005.
[23] A.N. Sinha, N. Das, & G. Sahoo, “Ant
Colony Based Hybrid Optimization for Data Clustering” Kybernetes Vol. 36 No. 2 2007,
pp. 175-191, 2007.
[24] P. Bolstorff & R. Rosenbaum, Supply Chain
Excellence - A Handbook for Dramatic
Improvement Using the SCOR Model,
Amacom, 2007.
[25] P. Fronia, F.S. Wriggers, & P. Nyhuis, “A
Framework for Supply Chain Design” in
Proceeding of International Conference on
Engineering Optimization Rio de Janeiro,
Brazil, 2008.
[26] L.A. Zadeh, A fuzzy-algorithmic approach to the definition of complex or imprecise
concepts, Electronics Research Laboratory
Report ERL-M474, University of California,
Berkeley, 1974.
[27] O. Jadidi, T.S. Hong, F. Firouzi, R.M.
Yusuff, & N. Zulkifli, “TOPSIS and Fuzzy
Multi-Objective Model Integration for
Supplier Selection Problem” Achievements
in Materials and Manufacturing Engineering
31 (2) 2008, pp. 762 – 769, 2008.