Joining of Cu to SS304 by microwave hybrid heating with Ni ...
Indian Journal of Engineering & Materials Sciences Vol. 26, June-August 2019, pp. 254-264
Multi-objective optimization of quality characteristics in single point incremental forming process by response surface methodology
Narinder Kumar1*, R M Belokara & Anupam Agrawalb aPunjab Engineering College, Chandigarh 160 012, India
bIndian Institute of Technology, Ropar 140 001, India
Received 12 July 2018; Accepted 9 July 2019
Single point incremental forming (SPIF) process has demonstrated its capability for sheet metal prototyping and low volume production applications. However, it is not widely used in industries due to poor surface quality and non-uniform thickness distribution of the parts formed by this process. In the present work, a systematic approach has been proposed for modeling and optimizing the surface roughness and minimum thinning to improve the surface finish and uniform thickness profile. With the use of response surface methodology along with Box–Behnken design, the quantitative effects of four parameters (step depth, spindle speed, tool diameter, and wall angle) have been analyzed on surface roughness and minimum thinning. On the basis of response surface methodology and analysis of variance, the optimal results have been predicted. A major interaction has been adequately and proficiently identified to produce minimum surface roughness and uniformly formed thickness profile.
Keywords: Single point incremental forming, Box-Behnken design, Surface roughness, Thickness
1 Introduction The conventional sheet metal forming process
requires large-scale manufacturing because these processes require a substantial high cost in equipment and tooling. These days numerous modern manufacturing industries use forming operations to make sheet metal parts with high profitability. These processes require expensive beginning speculations and long planning times, with particular passes for every part, especially when the parts with complex shapes require a little arrangement, as in the case of aerodynamic and car parts. Consequently, an adaptable innovation is necessary for small and medium-sized parts/products. The SPIF process can form small/medium sized part generally used for rapid prototyping applications. Incremental forming is one of the innovations that have risen as a contrasting option to traditional sheet metal forming forms which is typically suitable for mass customization. In this process, a sheet blank is tightly held in the fixture mounted on a CNC milling machine, and a hemispherical tool deforms it in incremental movement during successive downward steps. The tool moves according to the tool path generated. Consequently, the required three-dimensional shape can be obtained without using a die.
The texture formed on the surface of the formed parts is a major concern which affects the surface quality. The surface quality generally depends upon the input process parameters, forming strategy, lubrication, and material used. Several authors developed models and used different approaches and conditions to enhance the surface quality by minimizing the surface roughness. Hagan and Jesweit1 developed a relationship between peak to valley roughness and step depth by investigating the effect of rotational tool speed and step depth on surface roughness. Durante et al.2 developed a mathematical model to establish the relationship between the surface roughness and SPIF parameters like tool radius, step depth, and wall angle. Hamilton et al.3 studied the impact of forming at high feed rates and tool speed on surface hardness, thickness distribution, and sectional microstructure. A model has been developed to anticipate the orange peel impact in SPIF. They additionally proposed specific rules for forming at high feed rates and tool speed. Oleksik et al.4 conducted an experimental study to improve the surface quality of titanium alloy (Ti-6Al-4V) part by using SPIF process. The results obtained show that the quality of the part was affected by the tool roughness and friction between the interface surfaces of tool and sheet. Bhattacharya et al.5 and Echrif and Hrairi6 conducted an experimental study on surface roughness in SPIF process and revealed that the
————— *Corresponding author (E-mail: [email protected])

KUMAR et al.: QUALITY CHARACTERISTICS IN SINGLE POINT INCREMENTAL FORMING PROCESS
255
spindle speed, step depth, wall angle and tool diameter are the main factors and have a more significant influence on the quality characteristics of the formed part. Lu et al.7 compared and analyzed the surface finish of traditional rigid tool with oblique roller ball tool by using them simultaneously in SPIF process and found that the latter provides better surface quality. Azevedo et al.8 conducted experimental studies on surface qualities and forming forces of the incremental forming process. It was found that the surface quality of the part was further improved by using different types of lubrication. Gatea et al.9 comprehensively reviewed the effect of the SPIF process parameters on formability, surface roughness, and springback. Mulay et al.10 investigated the effect of forming parameters on surface roughness and formability in SPIF of AA5052 H34 aluminum alloy using response surface methodology. It was observed that the surface roughness decreased with a decrease in step depth and increase in tool diameter. On the other hand, the maximum forming angle increases with a decrease in step depth and tool diameter. Asghari et al.11 used grey relational analysis involving four factors to investigate their effect on minimum thickness, springback and surface roughness in two-point incremental forming process. Yao et al.12 have used response surface methodology for optimizing the deformation energy and forming quality by forming aluminum 1060 sheet blank using single point incremental forming process.
Thickness distribution along the profile is also one of the most crucial response parameters in incremental sheet metal forming process. Improper thickness distribution along the profile leads to a fracture in the product. Petek et al.13 conducted experiments to study the influence of process parameters on surface stretches and sheet metal thinning in incremental sheet metal forming process. It was identified that the medium wall angle and low forming speed had a significant effect on thickness distribution. Arfa et al.14 demonstrated that the nonuniform thickness distribution occurred due to increase in wall angle. Ambrogio et al.15 investigated the significance of tool trajectory keeping in mind the end goal to enhance the minimum thinning of the profile in the SPIF process. A comparative analysis of thickness distribution by using conventional tool trajectory and the optimized one was studied, and it was concluded that analysis of means provides the best process setting within the selected range which
simultaneously minimized the nonuniform thinning and geometrical errors. Some researchers adopt different strategies to improve the non-uniform thickness distribution. For a uniform thickness profile, Malhotra et al.16 suggested the accumulative double sided incremental forming technique and Mirnia et al.17 proposed a sequential limit analysis.
Surface finish and non-uniform thickness are considered to be the dominant limitations in the further advancements of the SPIF process. Moreover, different researchers have carried out individual studies on surface roughness and thickness distribution on the formed part. However, in most applications, the combination of surface quality and thickness distribution of the formed parts are required to be optimized. Therefore in the present work, a multi-response optimization is carried out for making SPIF an efficient forming process. The four parameters, i.e., tool diameter, step depth, spindle speed and wall angle are considered to study their effect on the response parameters, i.e., a surface roughness (Ra) and minimum thinning (Tmin.). Response Surface Methodology (RSM) using Box-Benken design is an excellent technique to predict responses in forming application with fewer experimental runs. This methodology is exceptionally reasonable for predicting surface roughness and minimum thinning during the incremental forming process. To describe the experimental results, we make use of Analysis of variance (ANOVA) which gives the best fit to the established model.
2 Experimental Setup The commercially pure aluminium alloy
(AA1200- H14) sheet was selected for conducting the experiments. The size of the samples was 145 mm X 145 mm X 1.2 mm. Table 1 and Table 2 depict the mechanical properties and chemical composition of the aluminium alloy. A 3-axis CNC vertical milling machine (Make: HURCO, Model: VM 10) was used
Table 2 — Chemical composition of AA-1200 H14
Elements Si Fe Mn Ti Al
Weight (%) 0.399 0.580 0.026 0.019 Rest Table 3 — Input process parameters and their levels.
Process Parameters Symbols Level 1 Level 2 Level 3
Tool diameter (mm) A 10 12 14 Spindle speed (rpm) B 1000 2000 3000 Step depth (mm) C 0.1 0.3 0.5 Wall angle (degree) D 30 45 60

INDIAN J ENG MATER SCI, JUNE-AUGUST 2019
256
for performing experiments as shown in Fig. 1(a). The forming tools made of SS304 steel with the hemispherical head of size 10, 12 and 14 mm were used as shown in Fig. 1 (b). The geometrical shape of the formed samples was a frustum of the cone with different wall angles as shown in Fig. 1(c). The spiral tool path has been used to generate the specimen of the required shape. During forming, the feed rate is set at 2000 mm/min and SAE40 was used as a lubricant. The four factors that are being studied and their three levels were given in Table 3. Surface roughness tester (Model: Mitutoyo`s SURFTEST SJ – 400) was used to acquire the average surface roughness Ra value of the formed part as shown in Fig. 2(a). The measurements are taken three times, and the average is reported. The thickness is calculated by measuring the thickness at 15 locations across the formed depth under an unclamped condition by using a non-contact 3D scanner (GOM® scanner) as shown in Fig. 2(b). 2.1 Design of experiment
Response surface methodology (RSM) is a statistical method that is employed to generate a mathematical model and establish the relationship between the input process variable and output response variable. In this study, the response variable (Y) is the function (f) of the input process variable as shown in Eq. (1):
Y (Ra, Tmin.) = f (A, B, C and D) … (1)
The behaviour of the response parameter can be studied on the surface plot by varying the input process parameter. The quadratic response model can be established by considering linear, and interaction terms as shown in Eq. (2):
푌 =푏 + ∑ 푏 푥 + ∑ 푏 푥 + ∑ 푏 푥 푥 ± 푒 … (2)
Where, y is the response parameter, bi, bii ,biii are the coefficient of regression, xi,xj are the independent process parameters, and 푒 is the error. Table 4 shows
Fig. 1 — (a) Setup used for incremental forming; (b) tools with different diameters; (c) formed parts with different wall angles.
Fig. 2 — (a) Surface roughness tester and (b) optical 3D scanner.
Table 3 — Input process parameters and their levels.
Process Parameters Symbols Level 1 Level 2 Level 3
Tool diameter (mm) A 10 12 14 Spindle speed (rpm) B 1000 2000 3000 Step depth (mm) C 0.1 0.3 0.5 Wall angle (degree) D 30 45 60
Table 4 — Box-Benken design matrix with experimental results
Exp. No
A (mm)
B (rpm)
C (mm)
D (˚)
Ra (µm)
Tmin (mm)
1 10 1000 0.3 45 2.11 0.64 2 14 1000 0.3 45 1.25 0.76 3 10 3000 0.3 45 1.92 0.62 4 14 3000 0.3 45 0.79 0.71 5 12 2000 0.1 30 1.39 0.76 6 12 2000 0.5 30 2.45 0.58 7 12 2000 0.1 60 0.35 0.51 8 12 2000 0.5 60 1.77 0.47 9 10 2000 0.3 30 2.25 0.69 10 14 2000 0.3 30 1.40 0.78 11 10 2000 0.3 60 1.37 0.48 12 14 2000 0.3 60 0.58 0.60 13 12 1000 0.1 45 1.05 0.73 14 12 3000 0.1 45 0.78 0.72 15 12 1000 0.5 45 2.36 0.62 16 12 3000 0.5 45 1.78 0.61 17 10 2000 0.1 45 1.64 0.67 18 14 2000 0.1 45 0.41 0.77 19 10 2000 0.5 45 2.65 0.61 20 14 2000 0.5 45 1.90 0.64 21 12 1000 0.3 30 1.87 0.76 22 12 3000 0.3 30 1.83 0.73 23 12 1000 0.3 60 1.27 0.53 24 12 3000 0.3 60 0.53 0.51 25 12 2000 0.3 45 1.22 0.65 26 12 2000 0.3 45 1.23 0.66 27 12 2000 0.3 45 1.15 0.69 28 12 2000 0.3 45 1.11 0.67 29 12 2000 0.3 45 1.13 0.63

KUMAR et al.: QUALITY CHARACTERISTICS IN SINGLE POINT INCREMENTAL FORMING PROCESS
257
a design matrix generated for a Box-Benken design of a four-factor, three-level design. 3 Results and Discussion
3.1 Statistical analysis for surface roughness In this work, Design Expert® 7.0 software has been
used to compute and evaluate the effect of input process parameters on the surface roughness. The empirical mathematical relation establishes a correlation between the surface roughness and the input process parameters obtained as follows in Eq. (3): Surface Roughness (Ra) = + 1.17 - 0.47A - 0.19B + 0.61C - 0.44D - 0.066AB + 0.12AC + 0.015AD - 0.076BC - 0.17BD + 0.090CD + 0.21A2 + 0.12B2 + 0.25C2 + 0.062D2 … (3)
Table 5 summarizes the analysis of variance (ANOVA) results for surface roughness. When the probability value (Prob.> F) is less than 0.05, this means that the factor is significant. For surface roughness, the main effect of A, B, C, D, the second order effect A2, B2, C2, D2 and the two-level interaction of AC, BC, BD, and CD are the significant model terms. At the desired significance level α= 0.05, the model F value is significant, and lack of fit is insignificant which shows that the model
adequately fits the data. The coefficient of multiple determination (R)2 is a measure of the amount of reduction in the variability of the response variable (y) obtained by using the process variable in the model. When the R2 value is close to 1, the model is adequate as the value of residuals is small. In this case, the predicted R2 is 0.968, which reasonably concurrences with the adjusted R2 of 0.987. 3.2 Effect of process parameters on surface roughness
Fig. 3 shows the linear effect of tool diameter (A), spindle speed (B), step depth (C) and wall angle (D) on surface roughness. Surface roughness decreased substantially from 1.85 µm to 0.91 µm as tool diameter is increased from 10 mm to 14 mm as shown in Fig. 3(a). It is ascertained that the surface roughness decreases with increase in the tool diameter. This is due to the fact that there is an increase in the overlap between successive tool path and also there is a decrease in the contact pressure between the tool-sheet interface which caused the surface peaks to be flattened and the surface roughness decreased. Hence, the surface roughness decreases with increase in the tool diameter.
In the case of spindle speed, a slight decrement of surface roughness occurred from 1.48 µm to 1.10 µm, when spindle speed is increased from 1000 rpm
Table 5 — Analysis of variance for surface roughness (Ra)
Source Sum of Squares Degree of Freedom Mean Square F-Value P-value
Model 10.70 14 0.7641 157.39 < 0.0001 A 2.62 1 2.6180 539.26 < 0.0001 B 0.44 1 0.4351 89.62 < 0.0001 C 4.43 1 4.4348 913.47 < 0.0001 D 2.36 1 2.3630 486.73 < 0.0001 AB 0.02 1 0.0176 3.62 0.0780 AC 0.06 1 0.0576 11.86 0.0039 AD 0.00 1 0.0009 0.19 0.6733 BC 0.02 1 0.0233 4.79 0.0461 BD 0.12 1 0.1208 24.87 0.0002 CD 0.03 1 0.0324 6.67 0.0217 A2 0.29 1 0.2936 60.47 < 0.0001 B2 0.09 1 0.0938 19.32 0.0006 C2 0.39 1 0.3901 80.36 < 0.0001 D2 0.02 1 0.0245 5.05 0.0412 Residual 0.07 14 0.0049 Lack of Fit 0.06 10 0.0057 2.05 0.2544 Pure Error 0.01 4 0.0028 Cor. Total 10.77 28 Std. Dev. 0.070 R-Squared 0.9937 Mean 1.43 Adj R-Squared 0.9874 C.V.% 4.87 Pred R-Squared 0.9680 PRESS 0.34 Adeq Precision 44.859

INDIAN J ENG MATER SCI, JUNE-AUGUST 2019
258
to 3000 rpm as shown in Fig. 3 (b). It could be due to rise in the temperature at the tool-sheet interface which decreases the friction adhesion. Hence, a smooth surface obtained at higher spindle speed. Also at higher spindle speed, the sliding friction decreases due to increase in temperature and the contact between the tool-sheet interface decrease upto certain extent. Based on this observation, it is identified that the surface roughness decreases with increase in the spindle speed.
Meanwhile, the surface roughness is observed to be increased from 0.80 µm to 2.02 µm as step depth is increased from 0.1 mm to 0.5 mm as shown in Fig. 3(c). It can be attributed to the fact that higher step size generates a large axial force on the surface of the sheet. This large axial force produces a deeper valley which leads to rough surface quality of the formed part. The same trend is observed by Echrif et al.13 that decrease in the step depth results in a substantial decrease in the value of surface roughness. Moreover, surface roughness decreased from 1.67 µm to 0.78 µm as wall angle increased from 30◦ to 60◦ as shown in Fig. 3(d). This increase in surface roughness can be attributed to the increase in the undeformed area that can be found at lower wall angle. While at higher wall angle, more overlap zone between the neighbouring trajectories that contributes to the
surface quality of the formed part. Scanning electron microscope (SEM) micrographs of the formed part are compared at 10 mm and 14 mm tool diameter as shown in Fig. 4 (a) and Fig. 4 (b), respectively. It is seen from the Fig. 4 (b) that the surface damage appears to be less, as the less material is scraped from the surface of the sheet in terms of pits and scratches under 14 mm tool diameter. Also, at high spindle speed, the size of pits and scratch appears to be small on the surface of the part as compared to lower spindle speed as shown in Fig. 4(c) and Fig. 4 (d), respectively. Moreover, the optical micrograph of the formed surface of the part shows that surface waviness is large, which produces rough surface when parts are formed at high step depth whereas, at low step depth, the surface waviness is less due to which a smooth surface is obtained as shown in Fig. 4(e) and 4(f) respectively.
Figure 5(a) also shows the interaction between tool diameter and step depth for the surface roughness. The surface roughness increased considerably from 0.41 µm to 1.9 µm as the step depth increases from 0.1 mm to 0.5 mm by setting tool diameter at 14 mm. When step depth is set at 0.1mm and tool diameter varied from 10 mm to 14 mm, the surface roughness increased from 0.41 µm to 1.64 µm. It can be observed from the surface plot that the minimum
Fig. 3 — Main effect plots for surface roughness between significant process parameters.

KUMAR et al.: QUALITY CHARACTERISTICS IN SINGLE POINT INCREMENTAL FORMING PROCESS
259
Fig. 4 — SEM micrograph for different tool diameter (a) 10 mm and (b) 14 mm. SEM micrograph for different spindle speed (c) 1000 rpm and (d) 3000 rpm. Optical micro images for different step depth (e) 0.5 mm and (f) 0.1 mm.
Fig. 5 — Interaction plots of surface roughness.

INDIAN J ENG MATER SCI, JUNE-AUGUST 2019
260
value of surface roughness can be obtained at 14 mm tool diameter and 0.1 mm step depth. Hence, the surface quality of the formed part can be enhanced at the possible combination of lower step depth and higher tool diameter. Figure 5 (b) represents the interaction effect of spindle speed and step depth on the surface roughness. When the spindle speed is varied from 1000 rpm to 3000 rpm with a constant step depth of 0.1mm, the surface roughness decreased from 1.05 µm to 0.78 µm. Moreover, the value of surface roughness increased from 0.78 µm to 1.78 µm as the step depth increased from 0.1mm to 0.5 mm at higher spindle speed, i.e., at 3000 rpm.
Figure 5(c) also shows the interaction between spindle speed and wall angle on the surface roughness. As spindle speed is decreased from 3000 rpm to 1000 rpm at a constant wall angle of 60°, the amount of surface roughness increased from 0.53 µm to 1.27 µm. At higher spindle speed, i.e. 3000 rpm, as the wall angle varies from 30º to 60º, the surface roughness decreased from 1.87 μm to 0.53 μm.. Hence, the minimum surface roughness is obtained at higher spindle speed and wall angle. Figure 5 (d) represents the interaction effect of step depth and wall angle on the surface roughness. The surface roughness decreased from 1.39 µm to 0.35 µm as the wall angle decreased from 30° to 60° at a constant step depth of 0.1mm. On the other hand, at higher wall angle, i.e., 60° by varying the step depth from 0.1mm to 0.5 mm the surface roughness increased from 0.35 µm to 1.39 µm. Hence, it is observed that the surface roughness increased due to an increase in both step depth and wall angle.
For surface roughness, step depth and tool diameter are significant process parameters as they have higher F value as compared to the spindle speed and wall angle. The points of residuals are lying approximately on the same line which satisfies the condition of normality on the normal probability plot as shown in Fig. 6. The desirability function has been used to find the optimal setting of the process parameters. The optimal parameter condition is determined as tool diameter (14 mm), spindle speed (3000 rpm), step depth (0.1 mm) and wall angle (60 degrees), obtaining a minimum surface roughness of 0.32 µm.
3.3 Statistical analysis for minimum thinning A similar procedure as done for the above analysis
has been applied to the analysis of minimum thinning, and the resulting ANOVA table is shown in Table 6. For minimum thinning, the main effect of A, C, D, the second order effect A2, D2 and the two-level interaction of CD is the significant model terms. The regression model that has been used to predict the minimum thinning is shown in Eq. (4).
Minimum thinning = +0.66 +0.046A -0.012B -0.054C - 0.10D - 0.0075AB -0.017AC + 0.0075AD + 0.0025BD +0.035CD +0.020A2 +0.015B2 -0.013C2 - 0.051D2
… (4)
Also for minimum thinning, the model F value is significant, and lack of fit is insignificant which shows that the model adequately fits the data. Moreover, the “Pred R-Squared” is 0.852, which is in consistant with the “Adj R-Squared” of 0.935.
Fig. 6 — Residual plots for surface roughness (a) normal probability plot and (b) plot of predicted and actual responses.

KUMAR et al.: QUALITY CHARACTERISTICS IN SINGLE POINT INCREMENTAL FORMING PROCESS
261
3.4 Effect of process parameters on minimum thinning The main effect plots for minimum thinning as shown
in Fig. 7, it is found that when the tool diameter is
increased from 10 mm to 14 mm, the value of minimum thinning also increased from 0.63 mm to 0.73 mm. The reason for this could be due to a decrease in the tensile
Table 6 — Analysis of variance for minimum thinning (Tmin.)
Source Sum of Squares Degree of Freedom Mean Square F-Value P-value
Model 0.21367 14 0.01526 29.92 < 0.0001 A 0.02521 1 0.02521 49.42 < 0.0001 B 0.00163 1 0.00163 3.20 0.0952 C 0.03308 1 0.03308 64.84 < 0.0001 D 0.12000 1 0.12000 235.24 < 0.0001 AB 0.00023 1 0.00023 0.44 0.5174 AC 0.00123 1 0.00123 2.40 0.1435 AD 0.00023 1 0.00023 0.44 0.5174 BC 0.00000 1 0.00000 0.00 1.0000 BD 0.00002 1 0.00002 0.05 0.8280 CD 0.00490 1 0.00490 9.61 0.0078 A2 0.00270 1 0.00270 5.30 0.0372 B2 0.00180 1 0.00180 3.53 0.0812 C2 0.00138 1 0.00138 2.70 0.1223 D2 0.01676 1 0.01676 32.86 < 0.0001 Residual 0.00714 14 0.00051 Lack of Fit 0.00514 10 0.00051 1.03 0.5357 Pure Error 0.00200 4 0.00050 Cor. Total 0.22081 28 Std. Dev. 0.023 R-Squared 0.9677 Mean 0.65 Adj R-Squared 0.9353 C.V.% 3.48 Pred R-Squared 0.8517 PRESS 0.033 Adeq Precision 18.828
Fig. 7 — Main effect plots for minimum thinning between significant process parameters.

INDIAN J ENG MATER SCI, JUNE-AUGUST 2019
262
stress, the material flow during bending increases which controls the stress concentration11. Hence, the minimum thinning can be improved by increasing the tool diameter. Meanwhile, a reverse trend is observed as the spindle speed increases from 1000 rpm to 3000 rpm, the minimum thinning decreases from 0.69 mm to 0.67 mm. As the temperature between the tool sheet interface increases, as a result of which there is softening in the formed material which leads to a decrease in minimum thinning. When step depth increases from 0.1 mm to 0.5 mm and wall angle from 30º to 60º, the minimum thinning decreases from 0.70 mm to 0.59 mm and 0.71 mm to 0.51 mm, respectively.
The step depth-wall angle (CD) interaction is plotted in Fig. 8 (a). When the step depth is decreased from 0.5 mm to 0.1 mm, and wall angle is kept constant at 60º, then minimum thinning increased from 0.47 mm to 0.51 mm. When the wall angle is decreased from 60º to 30º and the step depth was kept constant at 0.1 mm, then minimum thinning increased
from 0.51 mm to 0.78 mm. With the increase in step depth and wall angle, the resultant average forces cause more bending of sheet metal14. Due to such high bending, the formed material induces high tensional stress. As the result of high tensional stress, thinning ratio decreases. Hence, the minimum thinning decreases. Therefore, as the step depth and wall angle decreases, the minimum thinning improves as shown in Fig. 8 (b). Figure 9 (a) shows that the residual for minimum thinning are lying along the straight line on the normal probability plot which satisfies the condition of normality and the plot of predicted versus actual response falls on the straight line as shown in Fig. 9 (b). To maximize minimum thinning during SPIF of aluminum alloy, the optimum parameter combination obtained at tool diameter (14 mm), spindle speed (1000 rpm), step depth (0.1 mm) and wall angle (30 degrees).
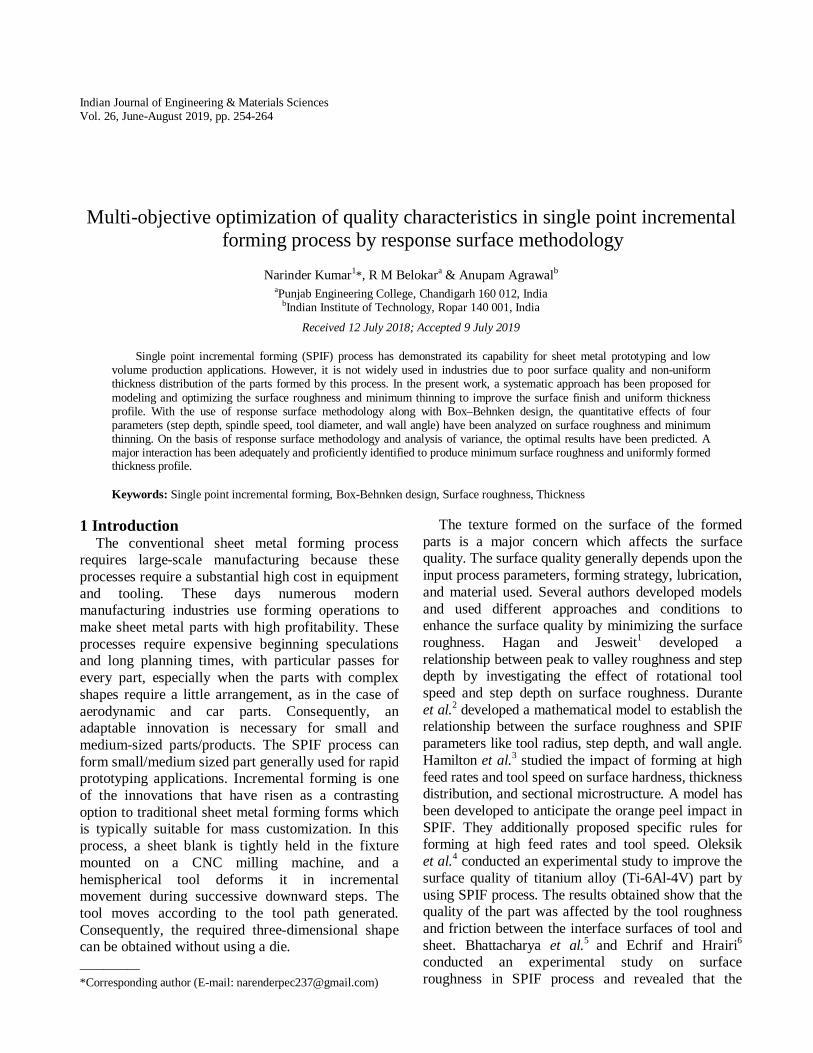
Figure 10 (a) shows the variation of thickness along the forming depth of the part formed by SPIF process. The minimum thickness appeared in the wall
Fig. 8 — (a) Interaction plots of minimum thinning and (b) thickness distribution of the parts with different wall angles.
Fig. 9 — Residual plots for minimum thinning (a) normal probability plot and (b) plot of predicted and actual responses.
KUMAR et al.: QUALITY CHARACTERISTICS IN SINGLE POINT INCREMENTAL FORMING PROCESS
263
angle region due to the occurrence of tensional stress produced simultaneously by stretching and bending of the sheet blank. Due to the support of the backing plate, the thickness of the flange zone is higher than the bottom zone. Also, the higher the wall angle, more thinning of the part appeared in the wall region. The SEM images of the parts are compared between non-optimal and optimal level. It has been observed from Fig. 10 (b) that large size dimples and voids are seen on the image of the part at non-optimal level due to induction of higher strain in the sheet. On the other hand, the minimum thickness at the optimal level is enhanced due to small size dimples and voids appeared in the wall region of the part as shown in Fig. 10 (c).
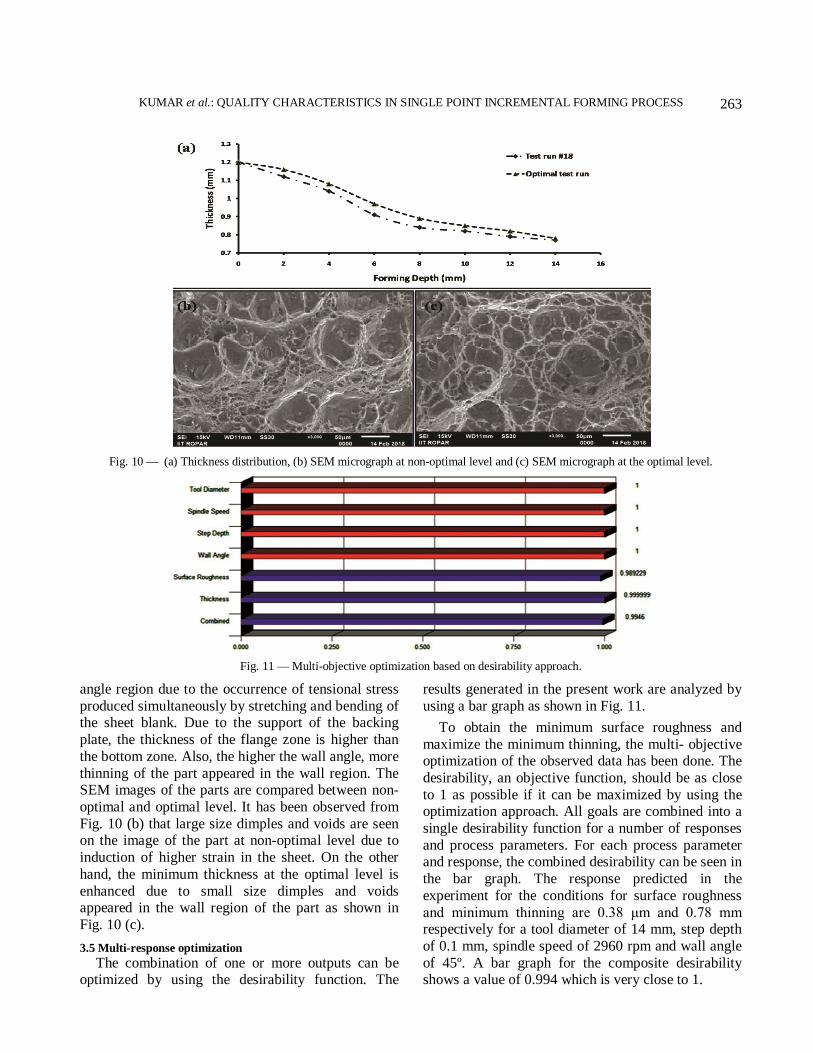
3.5 Multi-response optimization The combination of one or more outputs can be
optimized by using the desirability function. The
results generated in the present work are analyzed by using a bar graph as shown in Fig. 11.
To obtain the minimum surface roughness and maximize the minimum thinning, the multi- objective optimization of the observed data has been done. The desirability, an objective function, should be as close to 1 as possible if it can be maximized by using the optimization approach. All goals are combined into a single desirability function for a number of responses and process parameters. For each process parameter and response, the combined desirability can be seen in the bar graph. The response predicted in the experiment for the conditions for surface roughness and minimum thinning are 0.38 μm and 0.78 mm respectively for a tool diameter of 14 mm, step depth of 0.1 mm, spindle speed of 2960 rpm and wall angle of 45º. A bar graph for the composite desirability shows a value of 0.994 which is very close to 1.
Fig. 10 — (a) Thickness distribution, (b) SEM micrograph at non-optimal level and (c) SEM micrograph at the optimal level.
Fig. 11 — Multi-objective optimization based on desirability approach.

INDIAN J ENG MATER SCI, JUNE-AUGUST 2019
264
3.6 Confirmation experiment Table 7 shows the value of predicted and
experimental values for the surface roughness and minimum thinning obtained by the regression equation. The two data values are closely correlated to each other signifying the validation of regression equations developed. The value of percentage error for surface roughness and minimum thinning are 8.5 % and 4 % respectively. Hence, the result predicted from the developed model is moderately accurate. 4 Conclusions
The present work lays down the foundation in the direction of SPIF applications in more industry oriented products with better acceptability as compared to its conventional counterparts. In this study, Box-Behnken design based on RSM has been applied to investigate the effects of tool diameter, spindle speed, step depth and wall angle on surface roughness and a minimum thinning in SPIF process. The following conclusions have been obtained by analyzing the SPIF process according to the mathematical models developed:
(i) Step depth is the most significant process parameter affecting the surface roughness followed by tool diameter, wall angle and spindle speed. It has been observed that by decreasing step depth and increasing tool diameter, spindle speed and wall angle reduces the surface roughness and it may enhance the acceptability of such components in the sheet metal industries.
(ii) The wall angle is the most significant process parameter affecting the minimum thinning followed by step depth, tool diameter, and spindle speed. With the decrease in step depth, wall angle and spindle speed and increase in tool diameter, the minimum thinning increases as the stress concentration and failure rate reduce which improves the uniform thickness distribution.
(iii) It has been found that tool diameter (14 mm), step depth (0.1 mm), spindle speed (2995 rpm) and wall angle (45 degree) yield a maximum value of the desirability within the design space. Future investigation should consider the frictional effect to improve the surface finish and develop a compensation strategy to obtain a uniform thickness along the forming depth during the SPIF process. References 1 Hagan E & Jeswiet J, Proc Inst Mech Eng Part B J Eng
Manuf, 218 (2004) 1307. 2 Durante M, Formisano A & Langella A, J Mater Process
Technol, 210 (2010) 1934. 3 Hamilton K & Jeswiet J, CIRP Annals - Manuf Technol, 59
(2010) 311. 4 Oleksik V, Pascu A, Deac C, Fleaa, R, Bologa O & Racz G,
Int J Mater Form, 3 (2010) 935. 5 Bhattacharya A, Maneesh K, Reddy N V & Cao J, J Manuf
Sci Eng,133 (2011) 621. 6 Echrif S B M & Hrairi M, Mater Manuf Process, 29 (2014)
697. 7 Lu B, Fang Y, Xu D K, Chen J, Ou H, Moser N H & Cao J,
Int J Mach Tools Manuf, 85 (2014) 14. 8 Azevedo N G, Farias J S, Bastos R P, Teixeira P, Davim J P
& Sousa R J A, Int J Precis Eng Manuf ,16 (2015) 589. 9 Gatea S, Ou H & McCartney G, Int J Adv Manuf Technol, 87
(2016) 479. 10 Mulay A, Ben S, Ismail S & Kocanda A, J Brazilian Soc
Mech Sci Eng, 39 (2017) 3997. 11 Asghari S A A, Sarband A S, & Habibnia M, Proc IMechE
Part C J Mech Eng Sci, 4 (2017) 1. 12 Yao Z, Li Y, Yang M, Yuan Q, & Shi P, Adv Mech Eng, 9
(2017) 1. 13 Petek A & Kuzman K, J Technol Plast, 35 (2010) 51. 14 Arfa H, Bahloul R & Belhadjsalah H. Int J Mater Form, 6
(2013) 483. 15 Ambrogio G, Gagliardi F & Filice L, Procedia CIRP, 12
(2013) 270. 16 Malhotra R, Cao J, Beltran M, Xu D, Magargee J, Kiridena
V & Xia Z C, CIRP Annals - Manuf Technol, 61 (2012) 251.
17 Mirnia M J, Mollaei Dariani, B, Vanhove H & Duflou J R, Int J Mater Form, 7 (2013) 469.
Table 7 — Confirmation table for RSM regression equation
S. No.
Experiment Parameters Surface Roughness Minimum Thinning Tool diameter
(mm) Spindle
speed (rpm) Step depth
(mm) Wall angle
(degree) Average actual
Value (µm) Optimal
predicted Value (µm)
Error Average actual Value
(mm)
Optimal predicted Value
(mm)
Error
1 14 2995 0.1 45 0.35 0.38 8.5% 0.75 0.78 4%