Multi-Objective Optimization Model using Constraint …€¦ · ... (N.D. Lea., 1992): VOCi = A +...
16
Multi-Objective Optimization Model using Constraint-Based Genetic Algorithms for Thailand Pavement Management Pannapa HERABAT Assistant Professor School of Civil Engineering Asian Institute of Technology P.O. Box 4, Klong Luang Pathumthani 12120 THAILAND Fax: +662-524-6059 Email: [email protected] Akkarapol TANGPHAISANKUN Graduate Student School of Civil Engineering Asian Institute of Technology P.O. Box 4, Klong Luang Pathumthani 12120 THAILAND Fax: +662-524-6059 Email: [email protected] Abstract: Mature infrastructures require proper maintenance treatments. Highway agencies often face with limited maintenance budget which may result a large backlogs of maintenance works in each year. The main objective of this research work is to develop a multi-objective optimization model to support the multi-year decision making process of the highway maintenance management in Thailand. Preventive maintenance is focused in this research since it helps prolong the life of the infrastructures. This study selects the flexible pavements in the Pathumthani province to be the study area. Both single- and multi-objective optimization models are developed for a multi-year maintenance planning by incorporating the constraint-based genetic algorithms to deal with the combinated characteristics of the network-level maintenance planning. Two constraints of budget limitation and the network- system preservation are employed in the developed models. Maintenance scenario is selected to illustrate the utilization of the developed models. Key Words: Pavement maintenance, Multi-objective optimization, Genetic algorithm 1. INTRODUCTION There has been a rapid increase in the highway infrastructure development in Thailand for the past decade. However, mature highway infrastructures still require a large investment in order for the public agencies to maintain and manage these infrastructures effectively. Effective management would yield a safe environment for public users. Thailand Department of Highways is one of the largest public agencies that is responsible for highway infrastructure development and management. DOH responses to the needs of managing mature infrastructures by developing a systematic tool, Thailand Pavement Management System (TPMS). TPMS is developed to aid the highway maintenance operations of DOH. The main element of the TPMS is its Budgeting Module. It analyzes the collected data which include the highway inventory and condition. The Budgeting Module acts as a decision analysis module of the management system. It recommends maintenance treatments for different highway sections based on the attribute data of their traffic volume and road condition, estimates total maintenance costs, sets maintenance priority based on the economic analysis. The economic analysis used in the Budgeting Module is related to the estimation of user costs and vehicle operating costs. Both costs are related to the road condition and the traffic volume. Modeling the economic analysis in this manner gives the high traffic volume Journal of the Eastern Asia Society for Transportation Studies, Vol. 6, pp. 1137 - 1152, 2005 1137
-
Upload
nguyenhanh -
Category
Documents
-
view
213 -
download
0
Transcript of Multi-Objective Optimization Model using Constraint …€¦ · ... (N.D. Lea., 1992): VOCi = A +...

Multi-Objective Optimization Model using Constraint-Based Genetic Algorithms for Thailand Pavement Management
Pannapa HERABAT Assistant Professor School of Civil Engineering Asian Institute of Technology P.O. Box 4, Klong Luang Pathumthani 12120 THAILAND Fax: +662-524-6059 Email: [email protected]
Akkarapol TANGPHAISANKUN Graduate Student School of Civil Engineering Asian Institute of Technology P.O. Box 4, Klong Luang Pathumthani 12120 THAILAND Fax: +662-524-6059 Email: [email protected]
Abstract: Mature infrastructures require proper maintenance treatments. Highway agencies often face with limited maintenance budget which may result a large backlogs of maintenance works in each year. The main objective of this research work is to develop a multi-objective optimization model to support the multi-year decision making process of the highway maintenance management in Thailand. Preventive maintenance is focused in this research since it helps prolong the life of the infrastructures. This study selects the flexible pavements in the Pathumthani province to be the study area. Both single- and multi-objective optimization models are developed for a multi-year maintenance planning by incorporating the constraint-based genetic algorithms to deal with the combinated characteristics of the network-level maintenance planning. Two constraints of budget limitation and the network-system preservation are employed in the developed models. Maintenance scenario is selected to illustrate the utilization of the developed models. Key Words: Pavement maintenance, Multi-objective optimization, Genetic algorithm 1. INTRODUCTION There has been a rapid increase in the highway infrastructure development in Thailand for the past decade. However, mature highway infrastructures still require a large investment in order for the public agencies to maintain and manage these infrastructures effectively. Effective management would yield a safe environment for public users. Thailand Department of Highways is one of the largest public agencies that is responsible for highway infrastructure development and management. DOH responses to the needs of managing mature infrastructures by developing a systematic tool, Thailand Pavement Management System (TPMS). TPMS is developed to aid the highway maintenance operations of DOH. The main element of the TPMS is its Budgeting Module. It analyzes the collected data which include the highway inventory and condition. The Budgeting Module acts as a decision analysis module of the management system. It recommends maintenance treatments for different highway sections based on the attribute data of their traffic volume and road condition, estimates total maintenance costs, sets maintenance priority based on the economic analysis. The economic analysis used in the Budgeting Module is related to the estimation of user costs and vehicle operating costs. Both costs are related to the road condition and the traffic volume. Modeling the economic analysis in this manner gives the high traffic volume
Journal of the Eastern Asia Society for Transportation Studies, Vol. 6, pp. 1137 - 1152, 2005
1137

highways higher priority. In addition, inadequate maintenance budget results the deferral of maintenance for most highways in Thailand. The main objective of this research is to develop a multi-objective optimization model to support the decision-making process of the Thailand DOH and to provide the optimal maintenance programs. This research focuses on optimizing the application of preventive maintenance and special maintenance activities. Preventive maintenance can be applied to highway sections at the early stage to help prolong the service life of the highways. Various levels of preventive maintenance programs are set based on the best condition and the maximum acceptable level defined by the DOH experts in order to determine the most suitable preventive maintenance levels. The constrained-based genetic algorithm is selected to be the main tool of the multi-objective optimization model for Thailand pavement management. Highways in Pathumthani district are selected to illustrate the results of the multi-objective optimization. Both single- and multi-objective optimizations, over a multi-year planning period (30 years) are developed by incorporating the constraint-based genetic algorithms to deal with the combinated characteristics of the network-level maintenance planning. Vehicle operating cost minimization is taken into account in the single-objective optimization. The multi-objective optimization simultaneously considers the road network condition maximization and the vehicle operating cost minimization. Two constraints, budget and system preservation, are employed to make the solutions more realistic. Pareto optimality and non-dominated sorting are introduced to handle the multi-objective genetic algorithms model. The results of both single- and multi-objective models show that preventive maintenance should be implemented before the condition of the highway reaches its the maximum acceptable levels. 2. BACKGROUND 2.1 Pavement Management System in Thailand Several highway agencies in Thailand particularly Thailand Department of Highways (DOH) utilizes the concept of pavement management system (PMS) to manage their pavement maintenance activities which include planning, design, scheduling, planning, and budgeting. Thailand DOH is a government agency that maintains all the highways in Thailand. DOH currently maintains an approximation of 60,000-km highway network. Thailand Pavement Management System (TPMS) was first developed and implemented in 1984 by DOH. TPMS is developed based on the concept of a generic pavement management system. Continuous efforts have been made to improve the overall capability of the TPMS. In 1984, the system was developed to store collected pavement data and prioritize the maintenance activities. Pavement inventory of the TPMS consists of its basic inventory in terms of its engineering and traffic characteristics and the pavement condition. Different types of performance measures are incorporated in the TPMS to assess the pavement condition which includes international roughness index and the areas of major and minor deterioration (N.D. Lea, 1992). Simple prioritization techniques were applied such as ranking of maintenance work based on traffic and condition. In 1992, the highway agency has incorporated a more extensive data analysis module into the TPMS under the collaboration with the UK Transportation and Road Research Laboratory
Journal of the Eastern Asia Society for Transportation Studies, Vol. 6, pp. 1137 - 1152, 2005
1138

(TRRL). The data analysis module of the TPMS is called the TPMS Budgeting Module. The data analysis includes the classification of different maintenance activities, the development of the pre-determined treatment matrix, and the development of the life-cycle cost analysis (LCCA). DOH classifies different types of their maintenance activities as follows (N.D. Lea, 1992): 1) Routine maintenance: represents maintenance alternatives that are regularly performed in
order to maintain the acceptable levels such as slurry seal or surface treatment. 2) Periodic maintenance: represents maintenance activities that are periodically performed to
extend the road network service life such as 50mm asphaltic concrete overlay 3) Special maintenance: represents maintenance works that are required to be performed
when the road network encounters a very poor condition such as rehabilitation work. 2.2 Effects of Maintenance Treatments The pre-determined treatment matrix was developed to assist the highway agency to systematically recommend maintenance treatment throughout the county based on the collected pavement condition data and the traffic volume data. Details of the pre-determined treatment matrix could be found in (N.D. Lea, 1992). The life-cycle cost analysis (LCCA) in the TPMS Budgeting Module is developed based on the Highway Development Model (HDM)-III model of the World Bank. The HDM-III was calibrated in order to reflect the road condition in Thailand. DOH is currently updating their pavement LCCA in the TPMS Budgeting Module to be compatible with the new HDM-IV from the World Bank. LCCA in the maintenance planning consists of many components, e.g. road user costs, agency costs, analysis period, discount rate, and the effect of the maintenance treatment. Road user cost or vehicle operating cost (VOC) used in the TPMS was developed based on the HDM-III and the existing pavement data (N.D. Lea., 1992). VOC can be expressed in the unit of baht/vehicle/km for each vehicle type. Detailed derivation of equation (1) can be expressed as follows (N.D. Lea., 1992):
VOCi = A + B*IRI + C*IRI 2 (1)
Where VOCi = Vehicle Operating Cost of each vehicle type (i), baht/vehicle/km IRI = International Roughness Index, m/km A, B, C = Coefficients for each vehicle type The analysis period used in the model is 30 years in order for the results of the LCCA to be accurate and enable to cover several cycles of the maintenance activities. The discount rate used in the TPMS is 6% per year (N.D. Lea, 1992). The effect of the maintenance treatment is used to determine the changes of the road condition that will recover if the maintenance is implemented to a pavement section. The effect of each maintenance activity may vary depending on many factors such as the standard of materials, workmanship, and the environment. Effects of maintenance treatments can be categorized in terms of maintenance activities used in the actual practice of DOH. Based on the discussion with DOH experts and practitioners, five maintenance types are generally used in the actual practice which are (1) Slurry Seal or Surface Treatment (Seal); (2) 40 mm Asphaltic Concrete Overlay (OL-40); (3) 50 mm Asphaltic Concrete Overlay (OL-50); (4) Rehabilitation with Granular Base and 50 mm Asphaltic Concrete (REH-AC); and (5) Rehabilitation with Granular Base and Double Surface Treatment (REH-ST). Example of the effect of slurry seal application is shown in equation (2) (N.D. Lea., 1992).
Journal of the Eastern Asia Society for Transportation Studies, Vol. 6, pp. 1137 - 1152, 2005
1139
Equation (2) expects the IRI value after maintenance is applied to be higher than the IRI value before the maintenance is applied with the minimum increase of 2.5 m/km.
IRIa = Max (2.5, IRIb – 0.5) (2) Where IRIb = IRI before treatment (seal) implemented
IRIa = IRI after treatment (seal) implemented 2.3 Pavement Deterioration Models Pavement deterioration model is an important element used to estimate the maintenance requirements and to determine the road user costs and benefits of the maintenance implementation (Shahin, 1994). Deterioration models are generally developed in terms of pavement performance index and the exogenous factors contributing to pavement deterioration. This study utilizes the developed deterioration models of (Jenjiwattanakul, 2001). Linear regression deterioration models are presented by (Jenjiwattanakul, 2001) for different traffic groups and regions in Thailand based on the TPMS database. The generic deterioration model is expressed in terms of the pavement condition (IRI values) and the deterioration rates as illustrated in equation (3). Detailed derivation of the deterioration models can be found in (Jenjiwattanakul, 2001).
IRIafter = IRIbefore + Deterioration Rate*Service Years (3) Where IRIbefore = IRI value in the base year (yeart)
IRIafter = Predicted IRI value in the future (yeart+1) after maintenance is applied. 2.4 Genetic Algorithms Genetic Algorithms (GAs) are stochastic search methods that are based on the mechanics of natural selection and genetics (Goldberg, 1989). GAs combine survival of the fittest among string structures with structured yet randomized information exchange to form a search algorithm, Darwin’s theory of the survival (Goldberg, 1989). In each generation, new set of strings is created by the selecting process involving with their level of fitness, which uses the operators borrowed from natural genetics. GAs efficiently exploits historical information to consider on the new search points, which provide the better performance than the previous generation (Goldberg, 1989; Zalzala and Fleming, 1997). Constraint-Based Genetic Algorithm Optimization Most optimization problems involve various factors influencing the optimal results. In engineering problems, the factors that have an effect on the optimal solution are, for example, budgets, time, required quality, condition improvement, work production and available resources. The constraints of those factors are set to ensure that the final result of the optimal finding procedure is feasible and all constraints are satisfied. Constraints composition can be categorized into four main considerations as follows (Smith and Coit, 1995): 1) Number of constraints: there can be more than one constraint in the optimization
problems. Constraints used in this research are the budget limitation and the system preservation.
2) Metric: both discrete and continuous problems can be determined by the metric which assess the constraint violation in terms of the distance from satisfaction.
3) Criticality: is expressed in terms of the absolute satisfaction. Constraints are generally defined as hard (absolute), but some are often soft. In some cases, the final result selection should be considered with small violations, if the solution obviously conquers
Journal of the Eastern Asia Society for Transportation Studies, Vol. 6, pp. 1137 - 1152, 2005
1140

other feasible solution. Users are permitted to decide on a solution which violates a soft constraint rather than the best solution in the feasible region.
4) Difficulty of satisfaction: it can be characterized by the comparison of feasible solution size and sample space size which may not be previously known. Two techniques can be used to determine the difficulty of satisfaction, which are (a) how easy it is to change the violated solution to be a non-violated solution, and (b) the probability of constraint that is violated during the search.
3. METHODOLOGY Figure 1 presents the overall research framework. Data are collected from three main sources which are (1) TPMS database of DOH, (2) previous research studies of (Apivatanagul, 2002; Hoque, 1994; and Jenjiwattanakul, 2001) on the developed pavement deterioration model, traffic prediction, and the effect of maintenance activities to the pavement condition, and (3) expert’s opinions on different trigger levels that the agency would consider apply different maintenance activities. The collected data from DOH are pavement inventory, pavement condition, traffic characteristics, and maintenance costs and allocated budget. The traffic data consists of total traffic volume, traffic volume of each traffic composition in terms of Average Daily Traffic (ADT) in vehicles per day, and number of lanes and lane width. These data are used as an input of the developed GA model. Table 1 presents different traffic groups and their descriptions defined by TPMS, traffic growth in terms of percentage increase per year (Apivatanagul, 2002), and the maximum acceptable IRI values obtained from expert opinions (Tangphaisankun, 2004). Traffic volume and its growth are used in the LCCA as an element that interconnects with the maintenance selection, the determination of the vehicle operating costs. The percentage of the traffic growth presented in Table 1 was calibrated from the actual traffic data in TPMS from year 1993 to 1999.
Table 1. Maximum Acceptable IRI Values categorized by Traffic volume for Preventive Maintenance
Group
No.
Traffic Volume Group ADT (veh. per day) (N.D. Lea, 1992)
Traffic Growth (% per year)
(Apivatanagul, 2002)
Maximum Acceptable (IRI, m/km)
(Tangphaisankun, 2004) 1. < 2,000 9.2 4.67 2. 2,000 – 3,999 9.2 4.44 3. 4,000 – 5,999 9.2 4.11 4. 6,000 – 7,999 9.2 3.61 5. 8,000 – 9,999 1.0 3.44 6. > 10,000 1.0 3.17
This study focuses only on asphaltic concrete roads since DOH has been collecting the condition of the asphaltic concrete pavement for at the minimum of 8 years. The Pathumthani district is selected to be a case study of this research. Six asphaltic concrete routes in the Pathumthani district are route numbers 0305, 0347, 0352, 3111, 3186 and 3214. These six routes are also divided into the total of 153 sections (approximately length of 0.5 to 1 km).
Journal of the Eastern Asia Society for Transportation Studies, Vol. 6, pp. 1137 - 1152, 2005
1141

Figure 1. Research Framework
Data CollectionDOH
Database
Data Manipulation
Problem Description and Constraint Definition
Set Objective Functions
1. Vehicle Operating cost minimization
2. Overall road condition maximization
TPMS Budgeting Module
Select Proper Maintenance Program
Single-Objective Optimization Vehicle Operating cost
minimization
Multi-Objective Optimization Vehicle Operating cost
minimization The Overall road
condition maximization
Single- and Multi-objective Optimization Model using Constraint-
Based Genetic Algorithms
Define Constraints
1. Budget constraint 2. System preservation
Convergence reached? Or
Stopping Criteria Met?
Pareto-Set Filter
Niche Operation
Optimal Treatment Program of Single-Objective
Optimal Treatment Program of Multi-Objective
Model Validation
Yes
No
NPV
Determine Criteria and parameters
HDM-III Transportation
cost modelDeterioration Model
Development and Traffic Prediction
Expert opinions
Compare the Single-Objective results with the Multi-Objective results
Comparison with the maintenance program using TPMS Budgeting Module
Various Factors of Preventive Maintenance Level (0.30 – 0.70 of the difference between maximum acceptable level and the best condition of road, IRI = 2.0)
Journal of the Eastern Asia Society for Transportation Studies, Vol. 6, pp. 1137 - 1152, 2005
1142

This study further collects the annual maintenance budget allocated for the preventive maintenance from the Pathumthani district between 1999 and 2002 and the related maintenance costs. The budget information can be used in the budget constraint model development. Required data from experts’ opinions are treatment alternatives which are used in the actual maintenance work, and critical deterioration levels (trigger points) to implement the maintenance activities. The required data is collected by interviewing and consulting with the DOH experts. 4. MODEL DEVELOPMENT This study determines the appropriate level(s) of maintenance applications. Preventive maintenance and special maintenance should be applied to the road sections before their condition reaches the set of defined acceptable levels to prolong the life of the road network. Preventive levels can be defined by adding the IRI values of the assumed best pavement condition of 2.0 m/km with an increment of 0.1 until it reaches the maximum defined acceptable levels as shown in Figure 1. Six preventive levels from 0.3 to 0.7 with an increment of 0.1 are used to test which level is the appropriate level for the pavement condition in Thailand as expressed in a generic equation below:
Preventive level = 2.0 + PF*(Max. acceptable level – 2.0) (4) where PF = different levels of the preventive factors
Therefore, six levels of preventive maintenance can be determined based on equation (4) and the defined maximum acceptable IRI level as follows: 1) Non-preventive level using maximum acceptable level 2) The level of 0.3 preventive factor is the value of IRI at 2.351. 3) The level of 0.4 preventive factor is the value of IRI at 2.468. 4) The level of 0.5 preventive factor is the value of IRI at 2.585. 5) The level of 0.6 preventive factor is the value of IRI at 2.702. 6) The level of 0.7 preventive factor is the value of IRI at 2.819. As presented in Figure 1, two associated constraints taken into account in the study are: 1. System preservation constraint: The maximum acceptable levels in terms of IRI values
are used to determine the deficiency of the road. If the road subsection’s condition is above the maximum acceptable levels, the treatments must be assigned to them.
2. Budget constraint: All selected maintenance activities in the treatment program cannot exceed the allocated budget in each year.
4.1 Setting the Objective Functions Objective functions considered in this research are (1) the vehicle operating cost minimization, and (2) the road network condition maximization. The vehicle operating cost minimization is the main objective function that is currently used in the TPMS Budgeting Module. This research conducts a single-objective optimization analysis in order to validate the results of the developed optimization model with the result obtained from the TPMS. The second objective function is an additional consideration that assists TPMS treatment selection procedure to be more realistic. It considers maintaining the serviceability of the entire road network or preserving the network-level system. Multi-objective optimization simultaneously
Journal of the Eastern Asia Society for Transportation Studies, Vol. 6, pp. 1137 - 1152, 2005
1143

considers two aspects of the vehicle operating cost minimization and the road network condition maximization. 4.2 The Constraint-Based Genetic Algorithms Optimization Model This section discusses the main components of the constrained-based GA optimization model. Figure 2 presents the detailed framework of the constraint-based GA optimization model. Input and Parameters Determination Road geometry is assumed to be the same value as the base year throughout an analysis period. Maintenance alternatives and the treatment effects are derived based on the discussion in section 2.2. The traffic volume is assumed to increase with constant growth rates based on traffic groups as shown in Table 1. Traffic volume is forecasted for the entire study period with the assumption that traffic volume cannot exceed the designed capacity. If the predicted volume is more than the road capacity, the quantity of traffic is assumed to be equal to its capacity. Representative of decision variables The decision variables used in this research are (1) the treatment alternatives (2) the traffic volume (3) the road geometry (4) the unit cost of each maintenance activity (5) the pavement condition, and (6) the preventive levels and their maximum acceptable levels. In this study, integer encoding is used to help select different types of maintenance alternatives. This coding is applied to the selected 153 road sections each year. This method reduces the length of the string structure rather than the general binary encoding. Therefore, 153 genes are generated to be the representative of the selected road network in each chromosome. Six treatments activities are characterized by the integer form 0 to 5 which can be described below: 0 = Do-Nothing, 1 = Slurry seal, 2 = OL-40, 3 = OL-50, 4 = REH-ST, and 5 = REH-AC An example of the decision variables is shown in Figure 3. Preventive treatments, which are slurry seal, OL-40 and OL-50, including do-nothing alternative, are implemented when the IRI value of a particular section is in the range between the preventive level and maximum acceptable level. The integers of 0, 1, 2 and 3 then represent the road section(s) that fall in this range which may require some preventive maintenance as shown in Figure 3.
Journal of the Eastern Asia Society for Transportation Studies, Vol. 6, pp. 1137 - 1152, 2005
1144

Figure 2. Detailed Framework of the Constraint-Based Genetic Algorithm Procedures
Start
Define the variables and determine input parameters
1. Road network parameters 2. Planning horizon 3. Treatment parameters 4. Traffic characteristics
Integer coding
Determine the objective functions
Single-objective
Multi-objective
Generate initial population pool
Evaluate valid solution string
Constraint-Based Optimization
Budget constraint
System preservation
Check for Constraint Violation
Calculate Fitness value Based on 2 objectives
and related values
All strings evaluated?
Convergence reached? Or
Stopping Criteria Met?
Offspring evaluation via GA operations: 1. Reproduction 2. Crossover 3. Mutation
New parent pool: select the top ranks of parent and offspring pools until the No. of population is reach.
Select the optimal program of each year from 1 to 30Both single- and multi-objective function
No
Yes
No
Yes
No
Yes
Year = 1
Year = 30 ? Use the result to be the initial data of the next year
Yes
No
List the optimal program for all analysis period Both single- and multi-objective function
Journal of the Eastern Asia Society for Transportation Studies, Vol. 6, pp. 1137 - 1152, 2005
1145
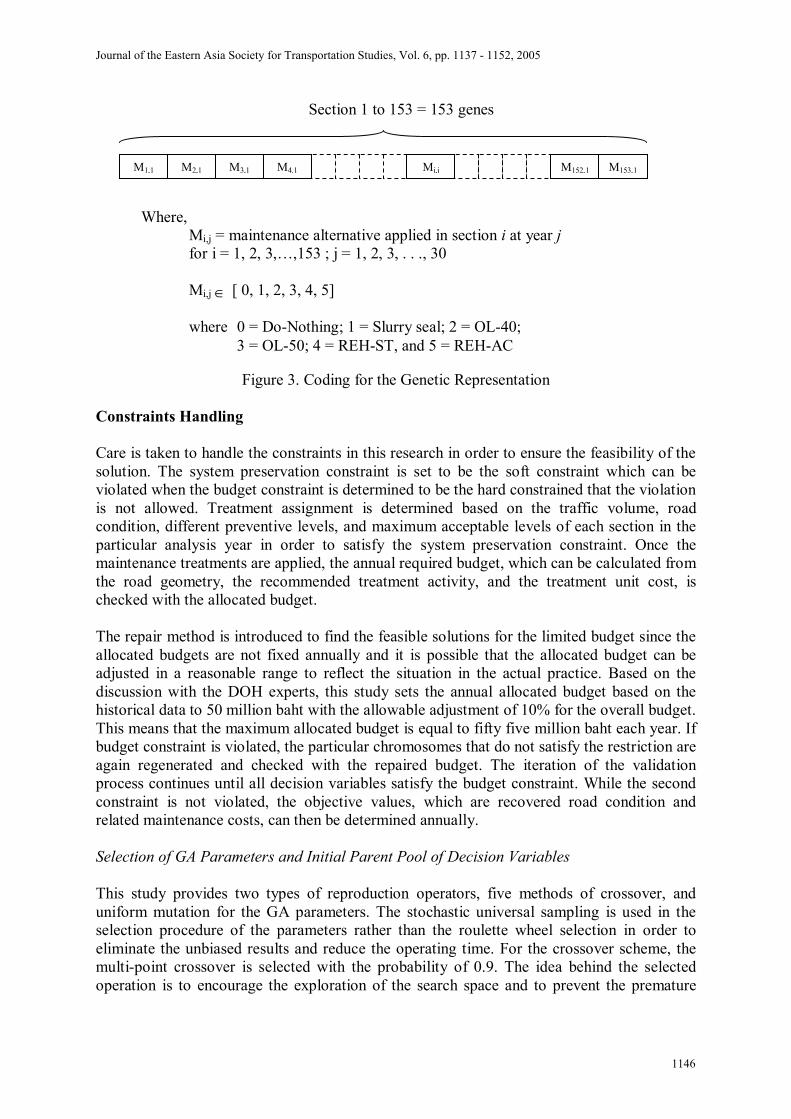
Figure 3. Coding for the Genetic Representation
Constraints Handling Care is taken to handle the constraints in this research in order to ensure the feasibility of the solution. The system preservation constraint is set to be the soft constraint which can be violated when the budget constraint is determined to be the hard constrained that the violation is not allowed. Treatment assignment is determined based on the traffic volume, road condition, different preventive levels, and maximum acceptable levels of each section in the particular analysis year in order to satisfy the system preservation constraint. Once the maintenance treatments are applied, the annual required budget, which can be calculated from the road geometry, the recommended treatment activity, and the treatment unit cost, is checked with the allocated budget. The repair method is introduced to find the feasible solutions for the limited budget since the allocated budgets are not fixed annually and it is possible that the allocated budget can be adjusted in a reasonable range to reflect the situation in the actual practice. Based on the discussion with the DOH experts, this study sets the annual allocated budget based on the historical data to 50 million baht with the allowable adjustment of 10% for the overall budget. This means that the maximum allocated budget is equal to fifty five million baht each year. If budget constraint is violated, the particular chromosomes that do not satisfy the restriction are again regenerated and checked with the repaired budget. The iteration of the validation process continues until all decision variables satisfy the budget constraint. While the second constraint is not violated, the objective values, which are recovered road condition and related maintenance costs, can then be determined annually. Selection of GA Parameters and Initial Parent Pool of Decision Variables This study provides two types of reproduction operators, five methods of crossover, and uniform mutation for the GA parameters. The stochastic universal sampling is used in the selection procedure of the parameters rather than the roulette wheel selection in order to eliminate the unbiased results and reduce the operating time. For the crossover scheme, the multi-point crossover is selected with the probability of 0.9. The idea behind the selected operation is to encourage the exploration of the search space and to prevent the premature
M1,1 M2,1 Mi,j M152,1 M4,1 M3,1
Section 1 to 153 = 153 genes
Where, Mi,j = maintenance alternative applied in section i at year j for i = 1, 2, 3,…,153 ; j = 1, 2, 3, . . ., 30 Mi,j ∈ [ 0, 1, 2, 3, 4, 5]
where 0 = Do-Nothing; 1 = Slurry seal; 2 = OL-40; 3 = OL-50; 4 = REH-ST, and 5 = REH-AC
M153,1
Journal of the Eastern Asia Society for Transportation Studies, Vol. 6, pp. 1137 - 1152, 2005
1146

convergence solutions. The uniform mutation is applied in this study with the probability of 0.7/Lind where Lind is the length of the chromosome. In order to keep the best solution of each generation, the reinsertion operator is used. It performs with the same idea as the niche method. The probability of reinsertion used in this constraint-based genetic algorithms model is 0.8. This probability represents that the best rank of the parent solutions will be selected to be the next generation for 20% of the parent population. The remaining 80%are replaced with the best rank of the offspring with the same number of solutions. Initial solutions are necessary to be generated once the coding of the problem parameters is formulated. Although using a large population size in GA is advantageous to obtain better solution, this might be unsuitable in this problem. However, the required calculation time of the objective values increases significantly as higher number of populations is created. This study performs the pilot tests of single-objective constraint-based genetic algorithms between 50 and 100 parent populations incorporating with 100 generations and the same GA parameters. The results of the objective values are not much different as shown in Figure 4. Only 0.04% difference in the net-present values of VOC and 0.7% for the average IRI value as illustrated in Figure 4. The processing time of 100 populations is two times greater than the 50 variables. Therefore, the 50 initial populations are used in the Constraint-Based Genetic Algorithms model. This research further tests the appropriate number of generation. The results of the pilot tests for the 50 and 100 populations with 100 generations show that more than 95% of the results are converged before the 90th iteration; therefore, the stopping criterion of the constraint-based GA model used in this study is 100 generations as shown in Figure 4.
Figure 4. Results of Two Objective Values (Pilot Tests)
Objective Evaluation Both objectives considered in this research are related to the road condition (IRI values) and the vehicle operating costs. The deterioration model is used to forecast the road condition when the do-nothing alternative is implemented. If maintenance treatment is recommended to be applied, the treatment effects need to be incorporated into the IRI values after the maintenance is applied as presented in section 2.2. The vehicle operating costs of the before- and after- maintenance application have to be determined. Other related values in the Constraint-Based Genetic Algorithms process are the annual required budget; the received benefits derived from VOC saving, and total
NPV of Vehicle Operating Cost Comparision
50sa
mp
100s
amp
60,000
60,500
61,000
61,500
62,000
62,500
63,000
63,500
64,000
64,500
Mill
ions
NPV
50samp 100samp
Average of IRI Comparision
50sa
mp
100s
amp
2.00
2.10
2.20
2.30
2.40
2.50
2.60
2.70
IRI
50samp 100samp
Journal of the Eastern Asia Society for Transportation Studies, Vol. 6, pp. 1137 - 1152, 2005
1147
transportation costs. These amounts are integrated into each generation of the developed model. Single-objective Optimal Finding Procedure Fitness values of each individual are calculated based on the VOC after the maintenance implementation. The lowest VOC will have the best fitness value. The fitness values are decreasing as the VOC is increasing. The best solution and its relative values are recorded for the initial generation. The GA operators are then applied to generate the offspring population with the same number of the parent pool. Offsprings are checked with the budget constraints and evaluated to determine the objective functions and their corresponding values. The insertion operation is also applied to select the best fifty solutions to be the parent pool of the next generation. The preceding process is repeated until the maximum number of iterations is satisfied. The best solution from the 100th generation is assumed to be the best solution. This solution is then listed out as the first-year optimal program. The procedures are then repeated throughout the analysis period. Multi-objective Optimal Finding Procedure The concept of Pareto optimality is used to find the optimal solutions. Non-dominated set of the decision variables can be obtained by using the non-dominated sorting genetic algorithm (NSGA) or the Pareto-set filter as discussed below. All vehicle operating costs are ranked in an ascending order and the initial chromosome that has the lowest VOC is automatically listed in the first Pareto front including its corresponding values. Other ranked variables are then compared with the selected chromosome one-by-one based on the average IRI value from the selected sections. The non-dominated variables that are chosen in the first front are the individuals that have the lower average IRI value than the selected ones. This selection is continued until all variables are compared. The next Pareto fronts are determined by the same process for the remaining chromosomes until all chromosomes are assigned their ranks based on the Pareto fronts. The best solution in the first front is generally more than the exact solution. In order to select one best variable in each generation, the shortest normalized distance is used in this study. Once the initial variables are ranked based on their fronts, the fitness values are then determined according to their ranks. The selected best solution is listed for the initial generation. New variables are subsequently created by using the predetermined GA operators and validated with both constraints. Once the constraint is validated, the objective values are calculated as new individuals. Both parent and offspring solutions are then mixed together and performed the selection procedure to be the initial variables of the next generation by using the NSGA. New parent populations are executed with the GA operators and Pareto optimality until the maximum iteration is reached. The optimal program of the first year is selected by the shortest normalized distance and used as an input of the second year. This optimal finding process is carried throughout the planning horizon. 4.3 Model Validation Validation process helps ensure that the developed model is accurate. The single-objective optimization is validated with the optimal planning from the TPMS Budgeting Module. Validation process further compares the results obtained from the single-objective
Journal of the Eastern Asia Society for Transportation Studies, Vol. 6, pp. 1137 - 1152, 2005
1148
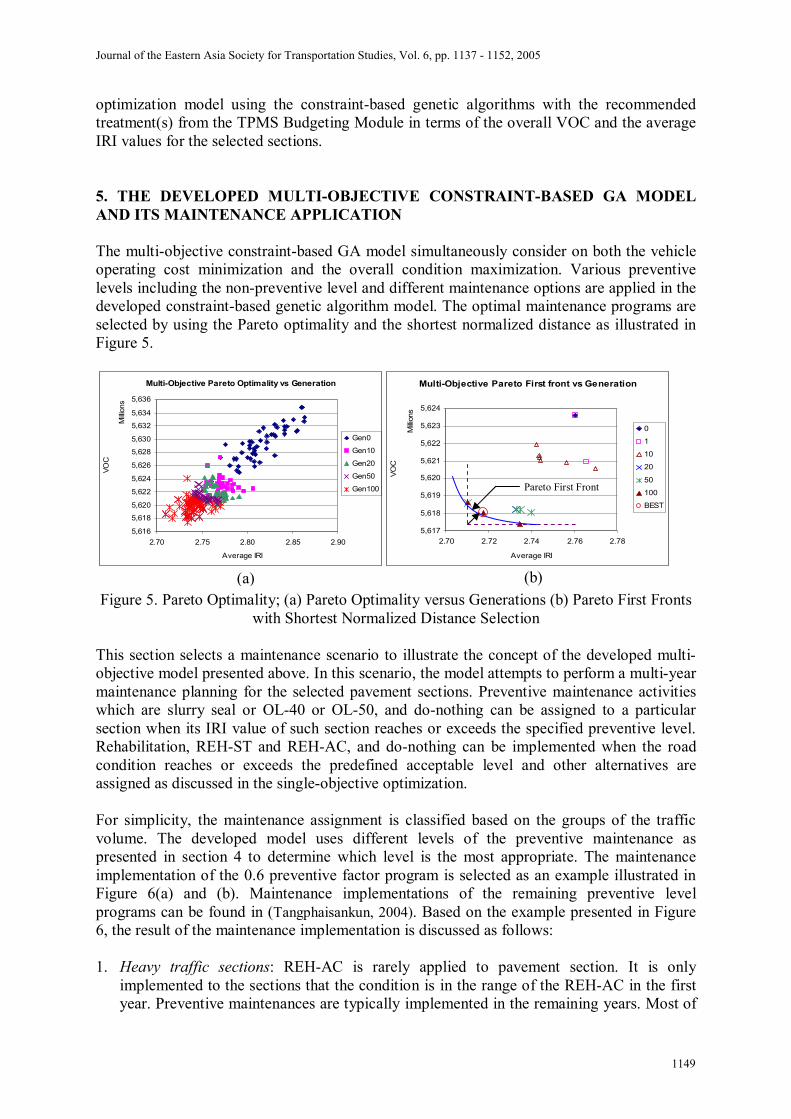
optimization model using the constraint-based genetic algorithms with the recommended treatment(s) from the TPMS Budgeting Module in terms of the overall VOC and the average IRI values for the selected sections. 5. THE DEVELOPED MULTI-OBJECTIVE CONSTRAINT-BASED GA MODEL AND ITS MAINTENANCE APPLICATION The multi-objective constraint-based GA model simultaneously consider on both the vehicle operating cost minimization and the overall condition maximization. Various preventive levels including the non-preventive level and different maintenance options are applied in the developed constraint-based genetic algorithm model. The optimal maintenance programs are selected by using the Pareto optimality and the shortest normalized distance as illustrated in Figure 5.
Figure 5. Pareto Optimality; (a) Pareto Optimality versus Generations (b) Pareto First Fronts
with Shortest Normalized Distance Selection This section selects a maintenance scenario to illustrate the concept of the developed multi-objective model presented above. In this scenario, the model attempts to perform a multi-year maintenance planning for the selected pavement sections. Preventive maintenance activities which are slurry seal or OL-40 or OL-50, and do-nothing can be assigned to a particular section when its IRI value of such section reaches or exceeds the specified preventive level. Rehabilitation, REH-ST and REH-AC, and do-nothing can be implemented when the road condition reaches or exceeds the predefined acceptable level and other alternatives are assigned as discussed in the single-objective optimization. For simplicity, the maintenance assignment is classified based on the groups of the traffic volume. The developed model uses different levels of the preventive maintenance as presented in section 4 to determine which level is the most appropriate. The maintenance implementation of the 0.6 preventive factor program is selected as an example illustrated in Figure 6(a) and (b). Maintenance implementations of the remaining preventive level programs can be found in (Tangphaisankun, 2004). Based on the example presented in Figure 6, the result of the maintenance implementation is discussed as follows: 1. Heavy traffic sections: REH-AC is rarely applied to pavement section. It is only
implemented to the sections that the condition is in the range of the REH-AC in the first year. Preventive maintenances are typically implemented in the remaining years. Most of
(a) (b)
Multi-Objective Pareto First front vs Generation
5,617
5,618
5,619
5,620
5,621
5,622
5,623
5,624
2.70 2.72 2.74 2.76 2.78
Milli
ons
Average IRI
VOC
0
1
10
20
50
100
BEST
Pareto First Front
Multi-Objective Pareto Optimality vs Generation
5,616
5,618
5,620
5,622
5,624
5,626
5,628
5,630
5,632
5,634
5,636
2.70 2.75 2.80 2.85 2.90
Milli
ons
Average IRI
VOC
Gen0
Gen10
Gen20
Gen50
Gen100
Journal of the Eastern Asia Society for Transportation Studies, Vol. 6, pp. 1137 - 1152, 2005
1149
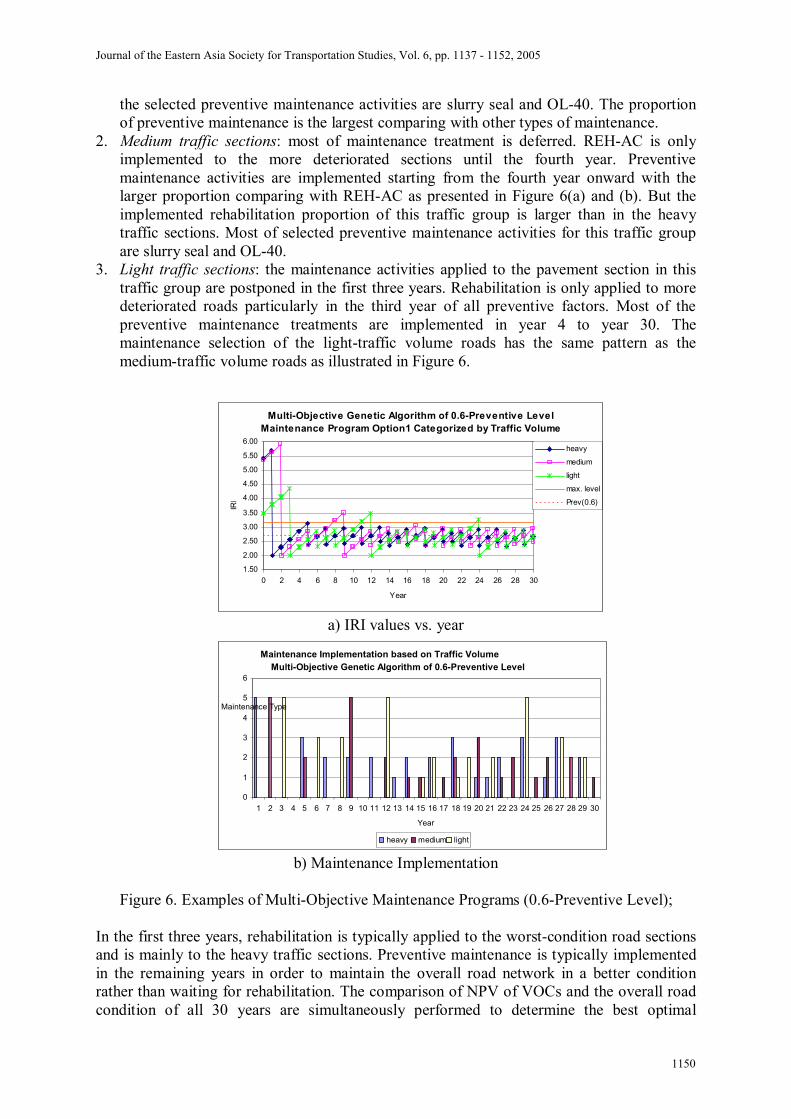
the selected preventive maintenance activities are slurry seal and OL-40. The proportion of preventive maintenance is the largest comparing with other types of maintenance.
2. Medium traffic sections: most of maintenance treatment is deferred. REH-AC is only implemented to the more deteriorated sections until the fourth year. Preventive maintenance activities are implemented starting from the fourth year onward with the larger proportion comparing with REH-AC as presented in Figure 6(a) and (b). But the implemented rehabilitation proportion of this traffic group is larger than in the heavy traffic sections. Most of selected preventive maintenance activities for this traffic group are slurry seal and OL-40.
3. Light traffic sections: the maintenance activities applied to the pavement section in this traffic group are postponed in the first three years. Rehabilitation is only applied to more deteriorated roads particularly in the third year of all preventive factors. Most of the preventive maintenance treatments are implemented in year 4 to year 30. The maintenance selection of the light-traffic volume roads has the same pattern as the medium-traffic volume roads as illustrated in Figure 6.
a) IRI values vs. year
b) Maintenance Implementation
Figure 6. Examples of Multi-Objective Maintenance Programs (0.6-Preventive Level); In the first three years, rehabilitation is typically applied to the worst-condition road sections and is mainly to the heavy traffic sections. Preventive maintenance is typically implemented in the remaining years in order to maintain the overall road network in a better condition rather than waiting for rehabilitation. The comparison of NPV of VOCs and the overall road condition of all 30 years are simultaneously performed to determine the best optimal
Multi-Objective Genetic Algorithm of 0.6-Preventive Level Maintenance Program Option1 Categorized by Traffic Volume
1.50
2.00
2.50
3.00
3.50
4.00
4.50
5.00
5.50
6.00
0 2 4 6 8 10 12 14 16 18 20 22 24 26 28 30
Year
IRI
heavy
medium
light
max. level
Prev(0.6)
Maintenance Implementation based on Traffic VolumeMulti-Objective Genetic Algorithm of 0.6-Preventive Level
0 1 2 3 4 5 6
1 2 3 4 5 6 7 8 9 10 11 12 13 14 15 16 17 18 19 20 21 22 23 24 25 26 27 28 29 30 Year
Maintenance Type
heavy medium light
Journal of the Eastern Asia Society for Transportation Studies, Vol. 6, pp. 1137 - 1152, 2005
1150

maintenance program. The comparison of both objective functions of all levels is illustrated in Figure 7. The most optimal maintenance implementation that minimizes both NPV of VOC and the overall IRI values is the program of 0.6-preventive level because it is the appropriate level which has the least effects of the early implementation of preventive levels when comparing with other program as shown in Figure 7.
Figure 7. Comparison of Multi-Objective Maintenance Programs 6. CONCLUSION This research develops the single- and multi-objective optimization models by incorporating the constraint-based genetic algorithm to determine the optimal maintenance programs. The developed optimization models are performed over a multi-year planning period. Two maintenance objectives of the vehicle operating cost minimization and the road network condition maximization are considered in this research. Both objectives are considered simultaneously in the multi-objective optimization model. Two constraints of the budget limitation and the system preservation are used to ensure the feasibility of the solutions. Various levels of preventive maintenance are set to determine the proper stage that the preventive maintenance should be implemented when minimizing the vehicle operating cost and maximizing the overall road condition. Maximum acceptable levels defined by experts, preventive maintenance levels, and selected maintenance alternatives are utilized to develop the decision variables. The developed models consider only one aspect of the pavement performance measures. It is recommended that other performance measures should be taken into account to make the optimization model more pragmatic. Additional maintenance objectives could be incorporated to make the developed models more practical; for example the maintenance work maximization and the maintenance time requirement minimization
ACKNOWLEDGEMENT The authors would like to express their sincere appreciation to the Royal Thai government for the financial support and to the Thailand Department of Highways for data support.
Multi-Objective Maintenance Option 1 Comparison
0.3Prev
0.4Prev
0.5Prev
0.6Prev0.7Prev
Non-Prev
64,20064,22064,240
64,260
64,28064,30064,320
64,34064,36064,380
2.56 2.58 2.60 2.62 2.64 2.66 2.68 2.70 2.72 2.74
Milli
ons
Average IRI
NPV
of V
OC
Different Preventive Levels Comparison
Journal of the Eastern Asia Society for Transportation Studies, Vol. 6, pp. 1137 - 1152, 2005
1151
REFERENCES
Apivatanagul, P. (2002). Risk-based deterioration models for flexible pavement life cycle cost analysis. Thesis No. TE 01-6, Asian Institute of Technology. Goldberg, D.E. (1989). Genetic Algorithms in Search, Optimization, and Machine Learning. Addison-Wesley Publishing Company, Inc., USA. Hoque, K. Z. (1994). Optimization of pavement maintenance schedules: a case study in Thailand. Thesis No. GT 93-40, Asian Institute of Technology. Jennjiwattana, C. (2001) Probabilistic pavement deterioration models and their applications. Thesis No. TE-00-5, Asian Institute of Technology. N. D. Lea International Ltd. (1992). Road Maintenance Project, Draft Final Report Volume II, Main Report. T.A. No. 1106-THA, Asian Development Bank, Thailand. Shahin, M.Y. (1994). Pavement Management for Airports, Roads, and Parking Lots. Chapman & Hall, New York, USA. Smith, A.E. and Coit, D.W. (1995). Penalty Function: Section C 5.2 of Handbook of evolutionary Computation. Department of Industrial Engineering, University of Pittsburgh, Oxford University Press and Institute of Physics Publishing. Tangphaisankun, A. (2004). Multi-objective optimization model using constraint-based genetic algorithms for Thailand pavement management. Thesis No. CM-04-21, Asian Institute of Technology. Zalzala, A.M.S. and Fleming, P.J. (1997). Genetic algorithms in engineering systems. The Institution of Electrical Engineers, London, United Kingdom.
Journal of the Eastern Asia Society for Transportation Studies, Vol. 6, pp. 1137 - 1152, 2005
1152