Multi-Modality Imaging of Atherosclerosis in...
54
Multi-Modality Imaging of Atherosclerosis in HIV Ahmed Tawakol, MD Director, Integrative Bio-Imaging Trials Program Co-Director Cardiac MR PET CT Program Massachusetts General Hospital Harvard Medical School
Transcript of Multi-Modality Imaging of Atherosclerosis in...
Multi-Modality Imaging of Atherosclerosis in HIV
Ahmed Tawakol, MDDirector, Integrative Bio-Imaging Trials Program
Co-Director Cardiac MR PET CT ProgramMassachusetts General Hospital
Harvard Medical School

Disclosures
• Research Grants:– Actelion, Genentech, Takeda
• Consulting– Actelion, Amgen, Takeda

CV risk persists in treated HIV and inflammation predicts this risk
• Treated suppressed HIV infected individuals have high burden of vascular disease – Greater atherosclerosis burden after controlling for risk factors– More MI and strokes– Major cause of morbidity and mortality in HIV
• Atherosclerosis in HIV is inflammatory– Associated with higher IL-6, CRP, D-dimer levels – HIV-infected individuals have greater arterial inflammation
Hsue PY AIDS 2009; Hsue PY JAHA 2012; Subramanian S JAMA 2012; Duprez D PlosOne 2012; Nordell A JAHA 2014

HIV: Increased Risk of MI
Triant et al J Clin Endocrinol Metab. 2007

Multiple factors cause persistent inflammation during ART
Deeks, Lewin, Havir; Lancet 2013

Inflammation: A Central Player
From: Libby P. Nature 2002
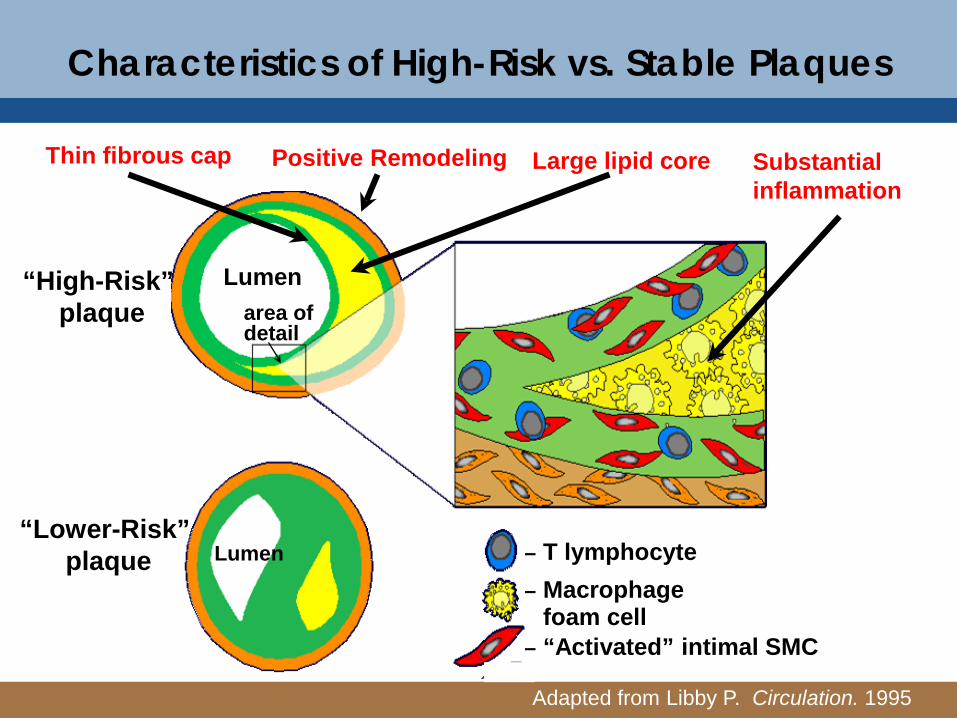
Adapted from Libby P. Circulation. 1995
Characteristics of High-Risk vs. Stable Plaques
– T lymphocyte– Macrophage
foam cell– “Activated” intimal SMC
“Lower-Risk”plaque
“High-Risk”plaque
Lumenarea ofdetail
Positive Remodeling
Lumen
Substantial inflammation
Thin fibrous cap Large lipid core
Outline
• IMT• CT• PET-CT & PET/MR
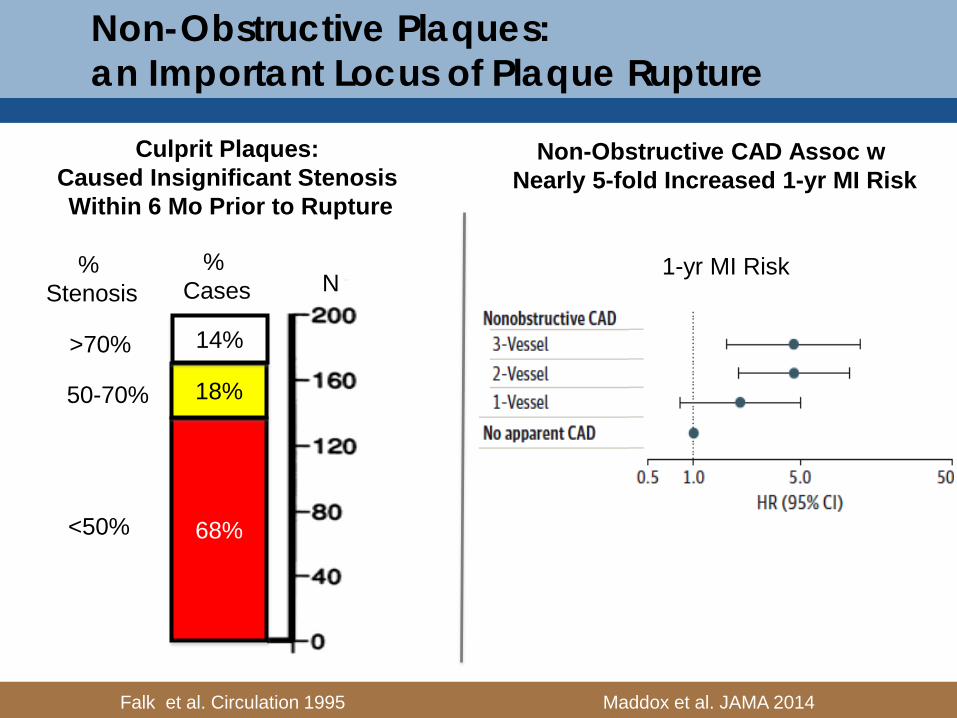
Maddox et al. JAMA 2014
Non-Obstructive Plaques:an Important Locus of Plaque Rupture
1-yr MI Risk
Falk et al. Circulation 1995
68%
18%
14%
<50%
50-70%
>70%
% Stenosis
% Cases N
Culprit Plaques: Caused Insignificant Stenosis Within 6 Mo Prior to Rupture
Non-Obstructive CAD Assoc w Nearly 5-fold Increased 1-yr MI Risk

Study Event Follow-Up, y Relative Risk
(95% CI)KIHD2 1.0 (MI) 2.2 (0.7–6.7)
ROT3 2.7 (MI) 1.4 (1.2–1.8)
CHS4 6.2 (MI) 3.2 (2.0–5.1)
MDCS5 7.0 (MI) 2.1 (1.2–3.4)
CAPS6 4.2 (MI) 2.2 (1.9–4.0)
ROT3 2.7 (stroke) 1.4 (1.3–1.8)
CHS4 6.2 (stroke) 2.8 (1.8–4.2)
CAPS6 4.2 (stroke) 2.3 (0.9–6.3)
MDCS7 7.0 (stroke) 3.0 (1.6–5.7)
Kitamura et al8
4.5 (stroke) 3.5 (1.3–9.5)
MESA9 5.3 (CVD) 2.3 (1.4–3.8)
CAPS6 4.2 (CVD) 2.3 (1.4–3.8)
Risk of MI, Stroke, and CVD
Simon et al ATVB 2010
Carotid Intima-Media Thickness
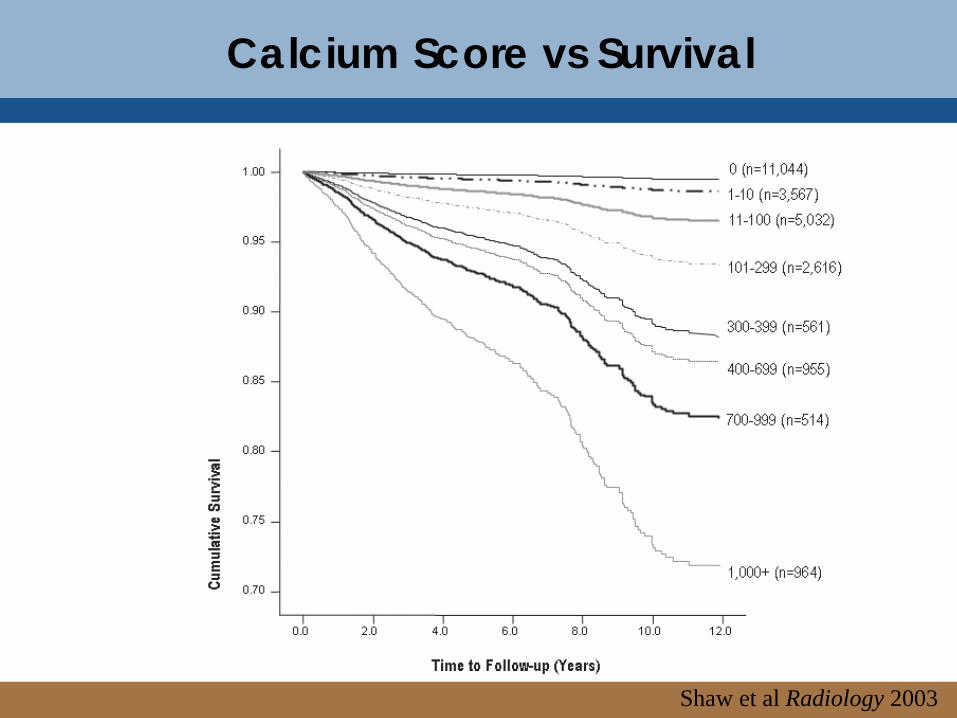
Calcium Score vs Survival
Shaw et al Radiology 2003

CT Attenuation: 46 HU -100
0
100
200
300
-0,8 -0,3 0,2 0,7 1,2 1,7
Houn
sfield
Unit
s (HU
)..
Lipid rich FibrousPohle et al, Atherosclerosis 2007
Plaque Composition – Lipid vs. FibrousLeber et al JA
CC 2004
Lipid Fibrous
Calcified
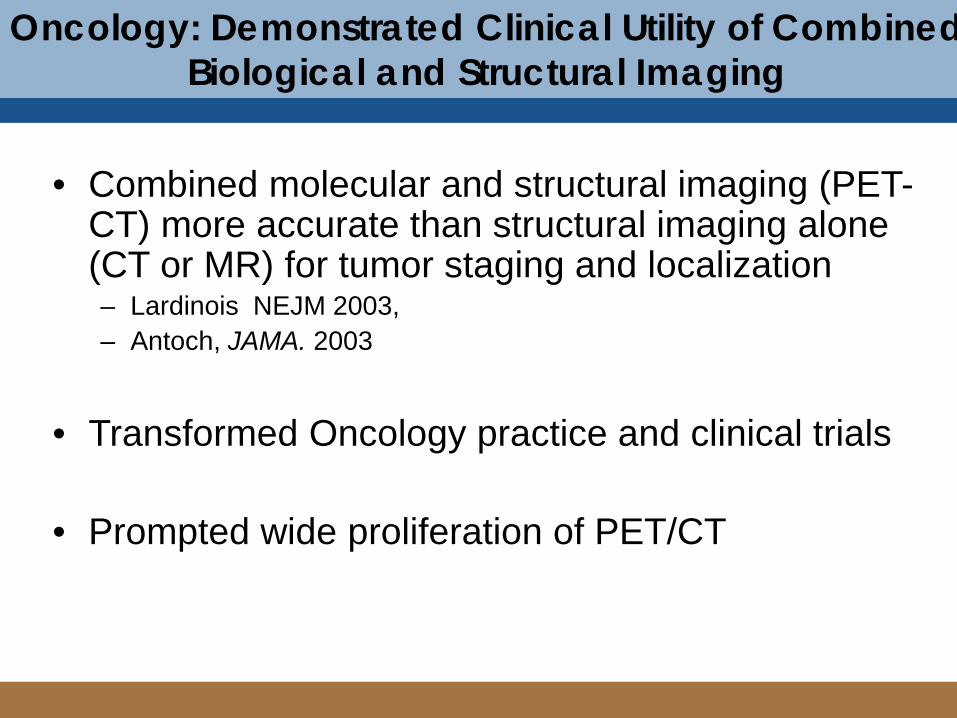
Oncology: Demonstrated Clinical Utility of Combined Biological and Structural Imaging
• Combined molecular and structural imaging (PET-CT) more accurate than structural imaging alone (CT or MR) for tumor staging and localization – Lardinois NEJM 2003, – Antoch, JAMA. 2003
• Transformed Oncology practice and clinical trials
• Prompted wide proliferation of PET/CT

PET Physics
β +
β −
511 keV
511 keVPositron Emission
β +
Annihilation

β −
β +
Annihilation
Detector Crystals and PMT
Arrives first
Arrives late
Scattered photons NOT registered
PET Physics

511 keV
511 keV
β −
β +
Annihilation
Detector Crystals and PMT
Coincidental photons registered as true events
PET Physics

511 keV
511 keV
β −
β +
Annihilation
Detector Crystals and PMT
Coincidental photons registered as true events
PET Physics
Exquisite (picomolar) sensitivityOutstanding quantitation
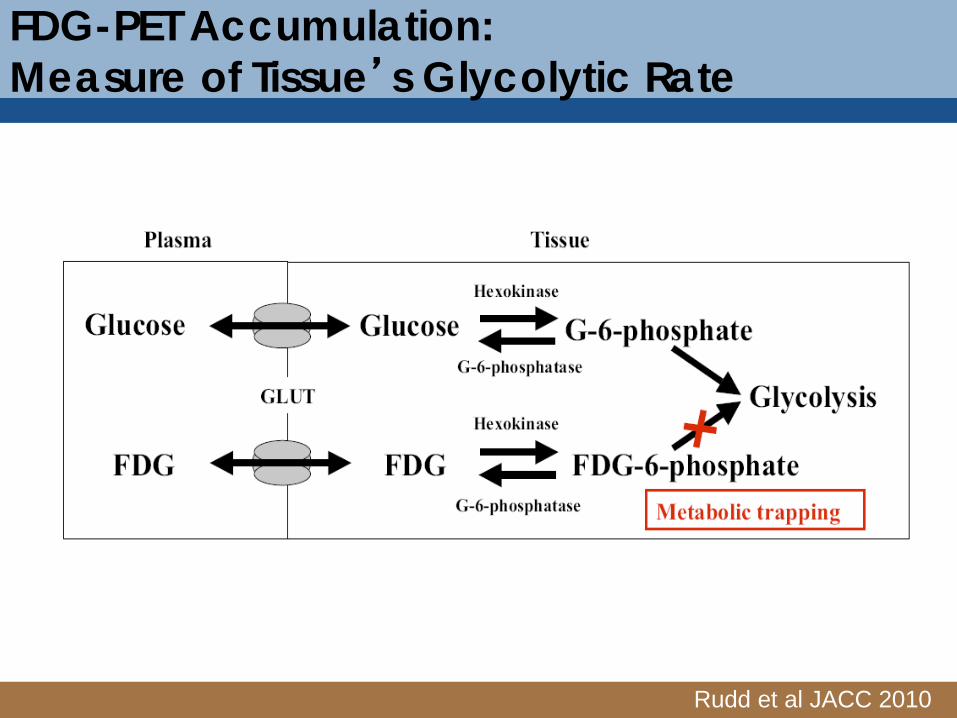
FDG-PET Accumulation:Measure of Tissue’s Glycolytic Rate
Rudd et al JACC 2010
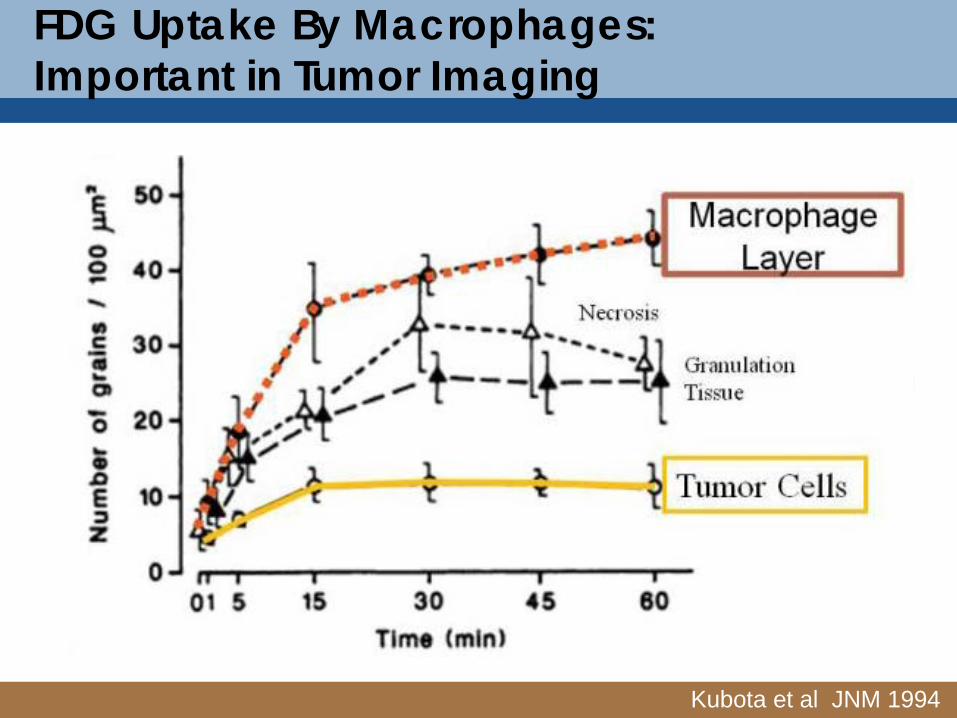
FDG Uptake By Macrophages: Important in Tumor Imaging
Kubota et al JNM 1994

FDG UptakeLinked to Pro-Inflammatory Activation
Satomi et al JNM 2013
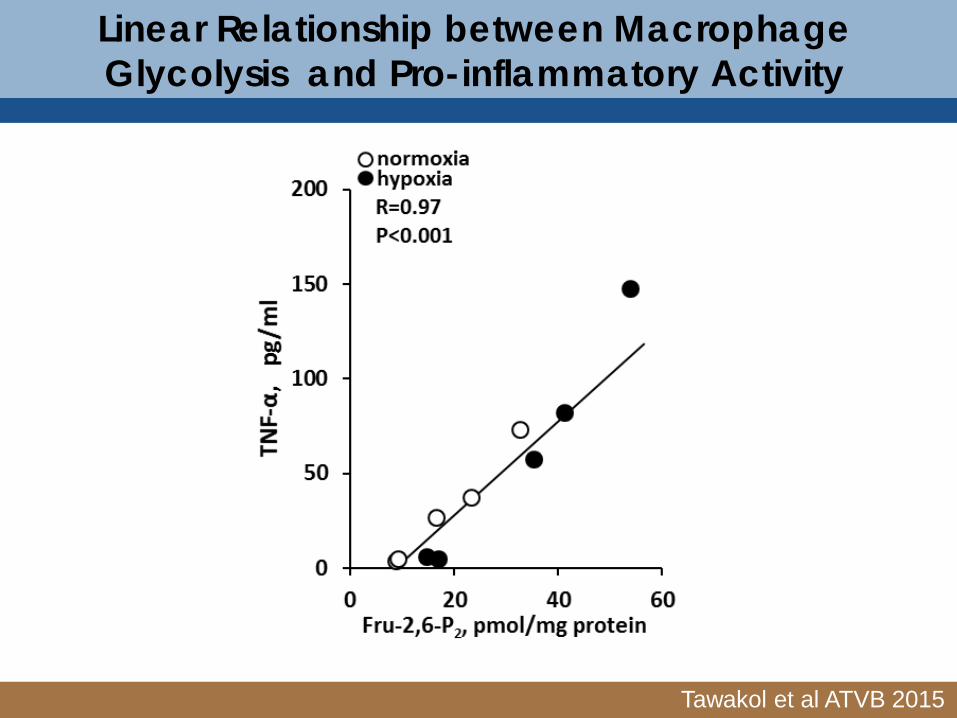
Linear Relationship between Macrophage Glycolysis and Pro-inflammatory Activity
Tawakol et al ATVB 2015
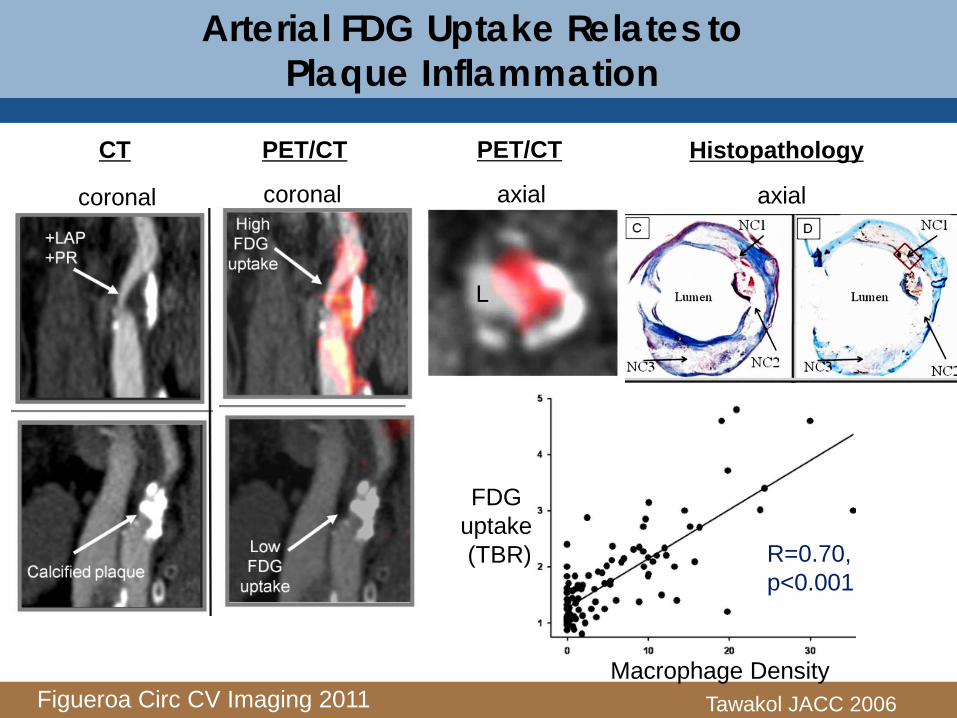
Arterial FDG Uptake Relates to Plaque Inflammation
Figueroa Circ CV Imaging 2011
CT PET/CT PET/CT
L
Histopathology
coronal coronal axial axial
R=0.70,p<0.001
FDG uptake (TBR)
Macrophage DensityTawakol JACC 2006
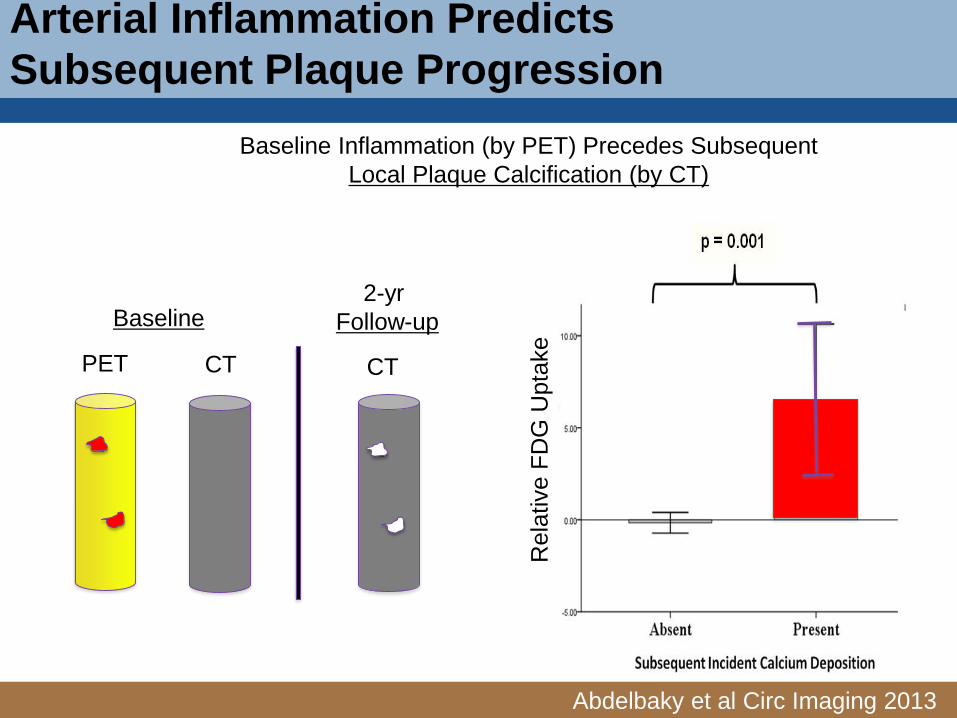
Arterial Inflammation Predicts Subsequent Plaque Progression
Abdelbaky et al Circ Imaging 2013
Baseline Inflammation (by PET) Precedes Subsequent Local Plaque Calcification (by CT)
Rel
ativ
e FD
G U
ptak
e
CTCTPET
Baseline2-yr
Follow-up

Figueroa et al JACC Imaging 2013
Arterial FDG Signal PredictsRisk of Subsequent CVD Events
Risk Categories NRI[95% bootstrap CI]
Events correctly reclassified
Non-events correctly
reclassified< 10% risk 10-20% risk> 20% risk
29.44%[13.45,48.42]
12.20% 17.24%
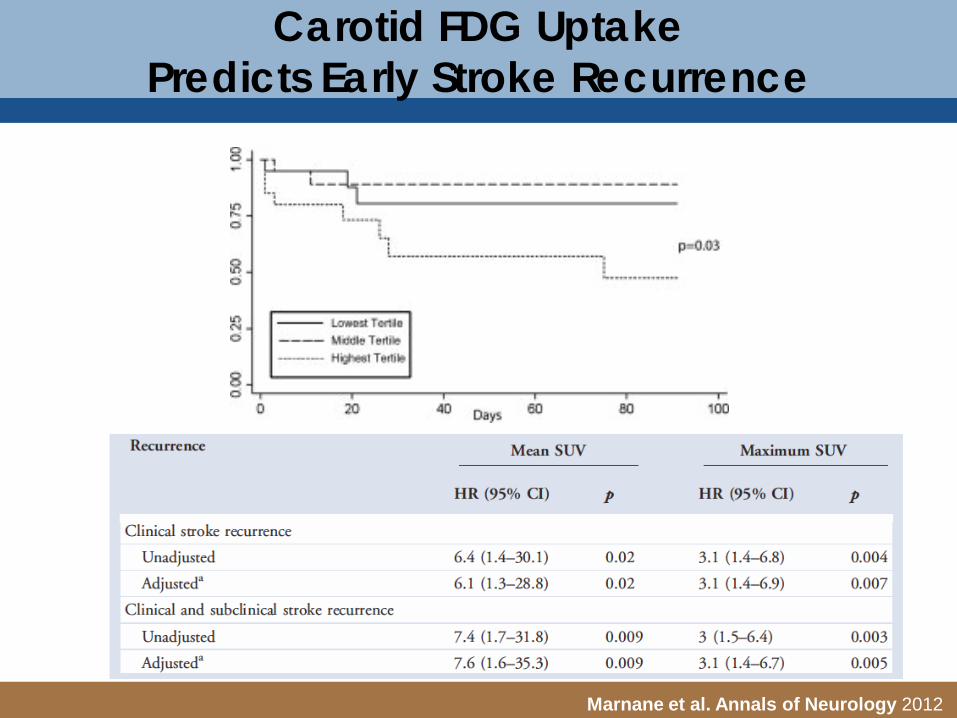
Carotid FDG Uptake Predicts Early Stroke Recurrence
Marnane et al. Annals of Neurology 2012

Effects of Therapy

Human Treatment Studies
• FDG PET/CT arterial imaging– Widely employed to test effects of therapy– Over a dozen MCTs
• 4 drug classes – Both PET/CT data and outcomes data.– How predictive are PET/CT imaging results?

LaRosa et a NEJM 2005
Hi vs Low-Dose Atorva
PET/CT Imaging Trial Clinical Endpoint Trial
Tawakol et al JACC 2013

van Wijk et al JACC 2014
Non-pharmacologic LDL Lowing Rapidly Reduces Arterial Inflammation
Impact of Apheresis in FH

Response To Therapy: Pioglitazone
Mizoguchi et al JACC CV Imaging 2011
Pio Glimepiride
PET/CT Imaging Trial Clinical Endpoint Trials
Nis
sen
et a
l JA
MA
200
7E
rdm
ann
et a
l JA
CC
200
7
Cha
nge
in P
ET
Sig
nal
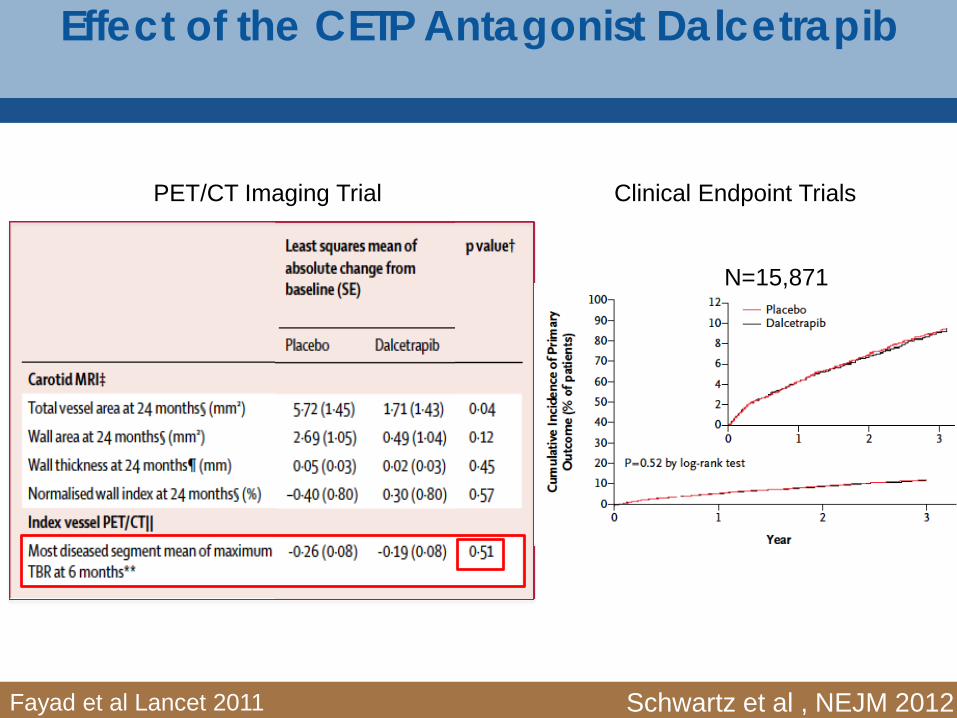
Effect of the CETP Antagonist Dalcetrapib
Fayad et al Lancet 2011
PET/CT Imaging Trial Clinical Endpoint Trials
Schwartz et al , NEJM 2012
N=15,871

Effect of LPPLA2 Inhibition on Arterial FDG Uptake
O’D
onog
hue
et a
l JAM
A. 2
014
The
STA
BILI
TY In
vest
igat
ors.
N E
ngl J
Med
201
4.
Tawakol et al JACC 2014
PET/CT Imaging Trial Clinical Endpoint Trials
N=13,026
N=15,828

HIV
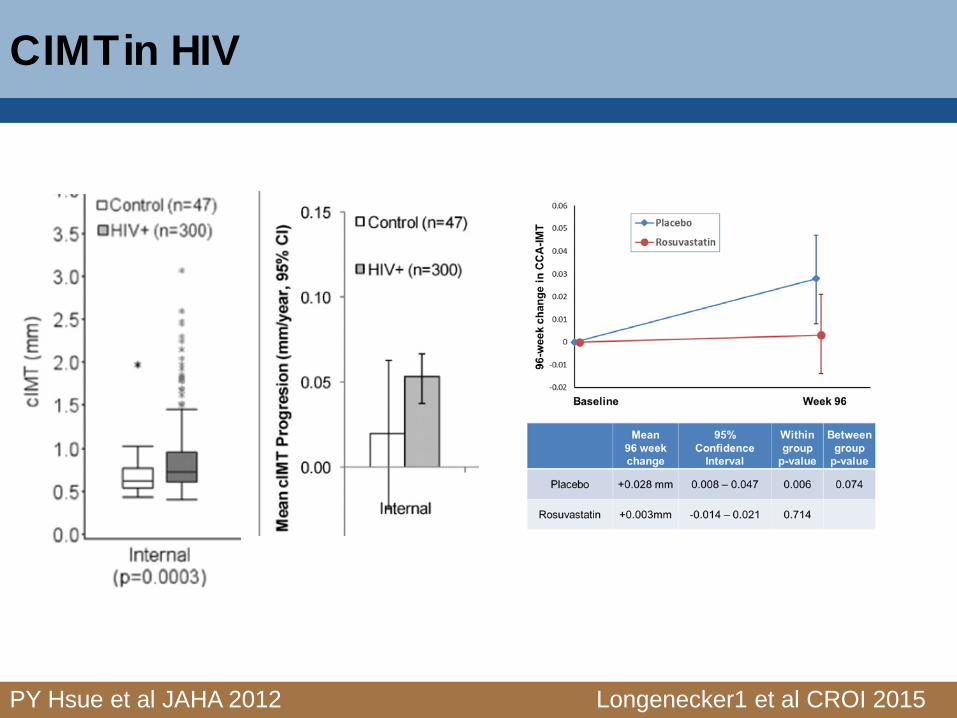
CIMT in HIV
Longenecker1 et al CROI 2015PY Hsue et al JAHA 2012
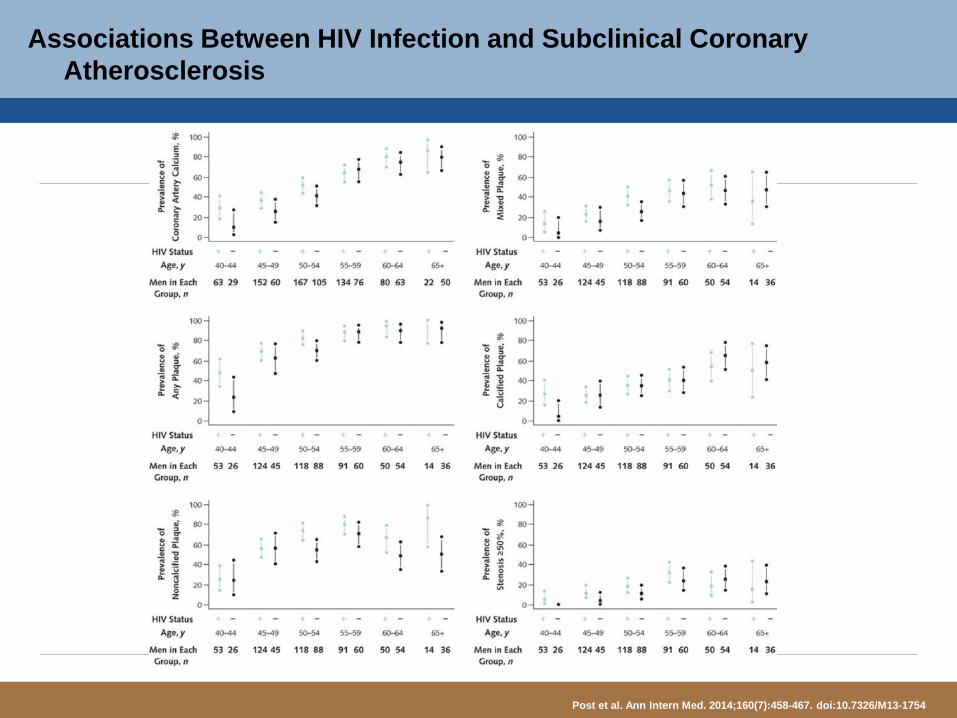
Associations Between HIV Infection and Subclinical Coronary Atherosclerosis
Post et al. Ann Intern Med. 2014;160(7):458-467. doi:10.7326/M13-1754

Atorvastatin Reduces Progression of Non-Calcified Plaque
Lo et al JAMA HIV 2015

Arterial Inflammation is Increased in HIV
Subramanian et al JAMA 2012

Aortic Inflammation is Associated with High Risk Coronary Plaques
Tawakol et al JAIDS 2014
Aortic TBR
< Median Value
> Median Value
High-RiskCoronary Plaque Morphology
Low Attenuation Low Attenuation and Positive Remodeling
% S
ubje
cts
with
Hig
h-R
isk
Cor
onar
y P
laqu
es

Ongoing Athero Imaging Trials in HIV
• Effect of Methotrexate on Atherosclerosis – FDG PET/CT Imaging – ACTG, NHLBI
• REPRIEVE– Statins in HIV– ACTG, NHLBI

PET/MR
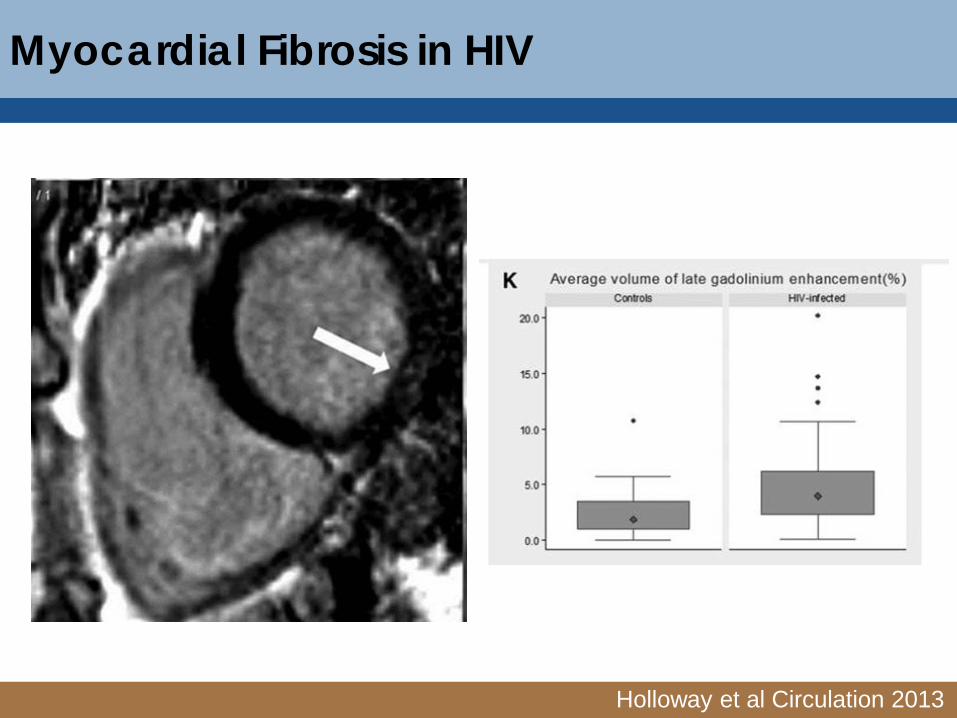
Myocardial Fibrosis in HIV
Holloway et al Circulation 2013

Development of New TracersTSPO Imaging
Pugliese et al JACC 2010
Elmaleh et al PNAS 2006
Ado Receptor Imaging
Tahara et al Nature Medicine 2014
Manose ReceptorImaging

Atherosclerotic mechanisms may have important
components that exist outside the vessel wall
Think outside of the vessel wall…

Multi-Tissue Assessment in Systemic Disease:Bone Marrow, Splenic, Arterial Axis in Mice
Dutta et al Nature 2012
…and subsequent aortic plaque inflammation
… increase in splenic granulocyte macrophage
progenitors (GMPs)
MI (LAD Ligation)Triggers β3AR-mediated
progenitor cell release frombone marrow
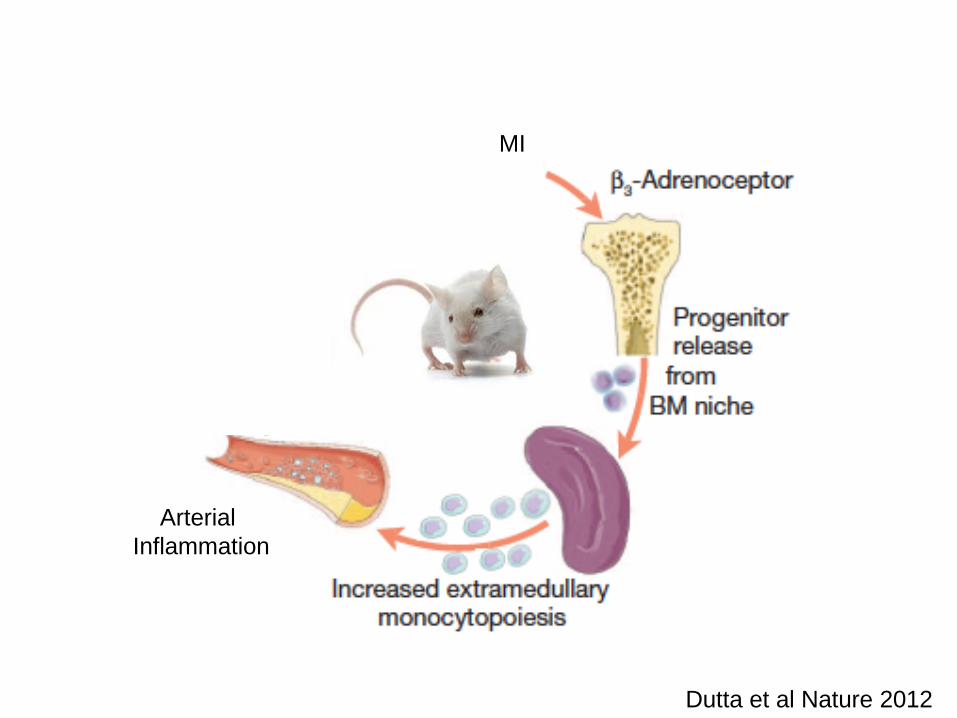
Dutta et al Nature 2012
MI
Arterial Inflammation

Dutta et al Nature 2012
MI
Arterial Inflammation
Does this axis exist in humans?
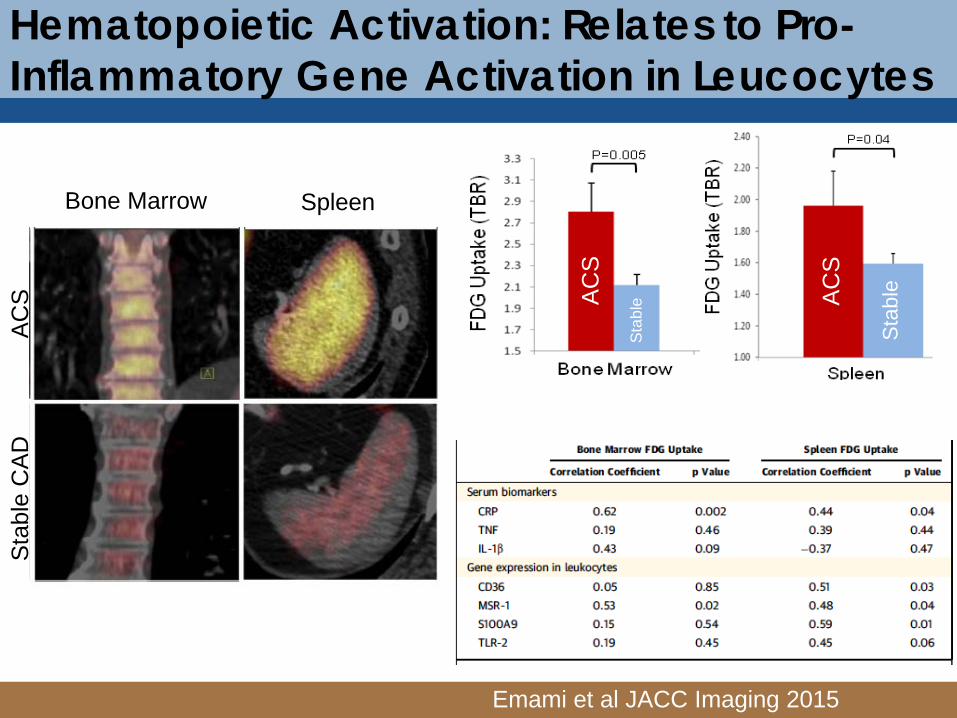
Hematopoietic Activation: Relates to Pro-Inflammatory Gene Activation in Leucocytes
Emami et al JACC Imaging 2015
AC
S
AC
S
AC
SS
tabl
e C
AD
Sta
ble
Sta
ble
Bone Marrow Spleen

Dutta et al Nature 2012
MI
Arterial Inflammation
Does Hematopoietic tissue activity predict CVD Risk?

Hematopoietic Tissue Activity Correlate w Arterial Activity in Individuals without known Athero
Emami et al JACC Imaging 2015

Splenic Activity Predicts Subsequent CVD
Emami et al JACC Imaging 2015
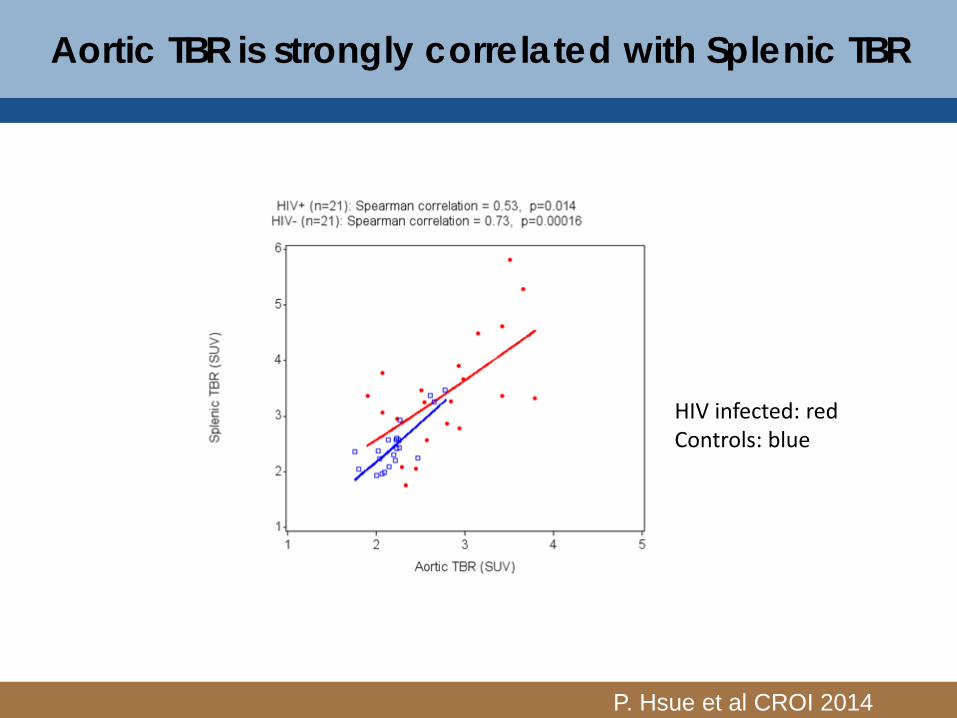
Aortic TBR is strongly correlated with Splenic TBR
HIV infected: redControls: blue
P. Hsue et al CROI 2014
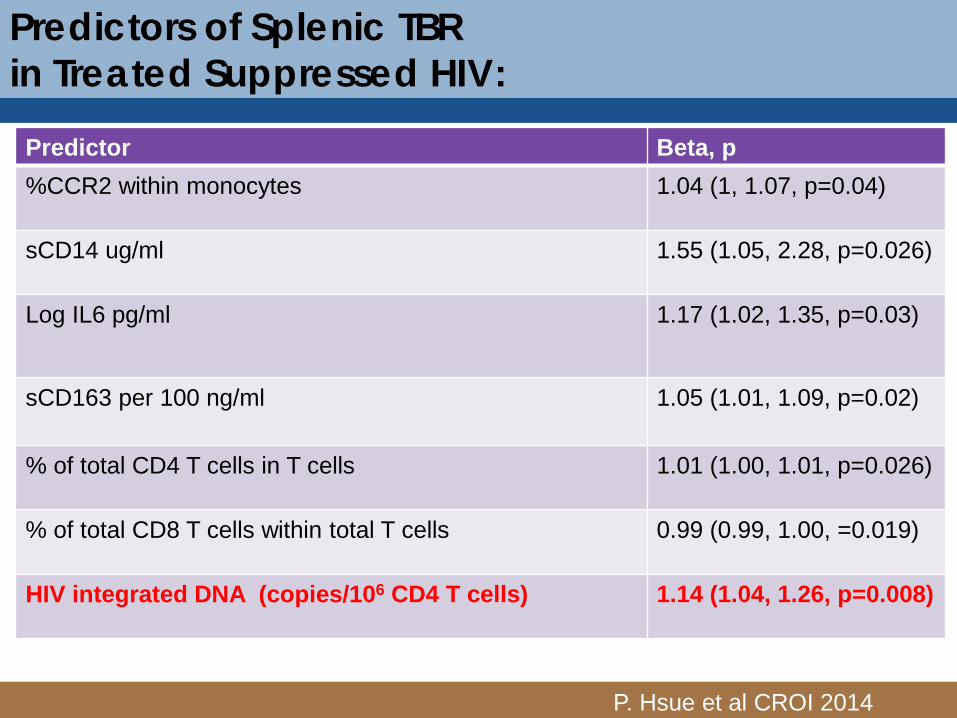
Predictors of Splenic TBR in Treated Suppressed HIV:
Predictor Beta, p%CCR2 within monocytes 1.04 (1, 1.07, p=0.04)
sCD14 ug/ml 1.55 (1.05, 2.28, p=0.026)
Log IL6 pg/ml 1.17 (1.02, 1.35, p=0.03)
sCD163 per 100 ng/ml 1.05 (1.01, 1.09, p=0.02)
% of total CD4 T cells in T cells 1.01 (1.00, 1.01, p=0.026)
% of total CD8 T cells within total T cells 0.99 (0.99, 1.00, =0.019)
HIV integrated DNA (copies/106 CD4 T cells) 1.14 (1.04, 1.26, p=0.008)
P. Hsue et al CROI 2014

Thank You!

Acknowledgements
MGH CV Imaging Team• Amr Abdelbaky, MD• Hamed Emami, MD• Amparo Figueroa, MD• Brian Ghoshhajra, MD• Amorina Ishai, MD• Philip Joseph, MD• Udo Hoffmann, MD• Hoey Chyi Lim, BA• Megan Macnabb , BA• Thomas Neilan, MD• Parmanand Singh, MD• Sharath Subramaninan, MD• Richard Takx, MD
Key Collaborators• Lisardo Bosca, MD• Ciprian Catana, MD• Marcelo DiCarli, MD• Michael E Farkouh MD• Zahi A Fayad PhD• Henry Gewirtz, MD• Michael Jaff, DO• Farouc Jaffer, MD, PhD• Peter Ganz, MD• Stephen Grinspoon, MD• Linda Hemphill, MD• Priscilla Hsue, MD• Janet Lo, MD• Matthias Nahrendorf, MD• Jagat Narula, MD• Miguel Pampaloni, MD• Roger Pitman, MD• James HF Rudd MD PhD• Bruce Rosen, MD, PhD• Marielle Scherer-Crosbie, MD• Lisa Shin, PhD• David Sosnovik, MD• Quinh Truong, MD