AustrianGrid, LCG & more Reinhard Bischof HPC-Seminar April 8 th 2005.
date post
20-Dec-2015Category
view
216download
0
Multi-Modal Interface for A Real-Time CFD Solver
Maryia Kazakevich, Pierre Boulanger, Walter Bischof and Manuel Garcia
Nov 4, 2006

Outline
• Sonification Background– Psychoacoustics
– Sonification methods
– Example sonification
• Project– Background
– Specifics
– Example
• Further work

Sonification Background
• Sonification is the use of non-speech audio to convey information [B.N. Walker]
– Data -> to sound
• As an alternative or to complement visual and possibly other displays (e.g.haptic)
– Increasing information bandwidth, reinforcement– Recognition of features not obvious from visual
displays– Possibility to concentrate on different complementary
information by two senses:• Global events through sound, local details through visual cues

Psychoacoustics
• Possibility to map field data to:– Loudness, Frequency, Envelope, Spatial location …
• Sound parameters require a certain percentage of change for the change to be noticed:– Minimum audible angle, intensity change, Tone duration
• Softer tone is usually masked by a louder tone if their frequencies are similar
• Relation between subjective sound traits and their physical representations– Loudness relation to intensity and frequency

Sonification Background
• What is being sonified:– General sonification toolboxes– Specific to data sets
• Time dependent or static data
• How:– Prerecorded sound– Modifying physical properties of sound, pressure,
density, particle velocity– Modifying pitch, envelope, duration, timber, etc…
• Sonification in real-time or not

Com
pari
son
of
soni
fica
tion
met
hods
# Name \ comparison criteria
a) General vs. data specific
b) Mapping Complexity
c) Mapping
d) Understanding produced sound
e) Similar to …
f) Real-time vs. not; other
I Sonification Sandbox [B.N. Walker]
General Very simple Each data set is mapped to time, pitch, timbre, volume, or pan.
Easy, but not always descriptive
a) 2 b) 3,[5,8,9] c) 3,4,8,9 d) 3,7,9
Real-time
II Data Sonification and Sound Visualization [H.G. Kaper]
General Simple idea not very simple mappings
Degrees of freedom in the data to the various parameters on the levels of partials and collected sound.
Not very obvious, not clear if helpful
a) 1 b) 5,6,7 c) 5,6 d) 6,8
Not real time; visualization of given sonification
III Sonification of time dependent data [M. Noirhomme-Fraiture]
Data specific
Very simple Value to frequency; has a pre-treatment like curve smoothing
Easy, not clear if helpful
a) 3 – 9 b) 1,[5,8,9] c) 1,4,8,[9] d) 1,7,9
Not real time; good as alternative to visual
IV Cell Music [K. Metze]
Data specific
Fairly simple Luminance to amplitude, distance to frequency and duration
Fairly helpful a) 3 - 9 b) 8,9,[1,3] c) 1,3,8,9 d) 9
Not real time
V Heart Rate Sonification [M. Ballora]
Data specific
Quite complicated
Various inter-beat interval characteristics to various sound characteristics
Very distinguishable but complicated sound
a) 3 – 9 b) 2,6,7 c) 2,6
Real-time
VI Local Heat Exploration Model For Interactive Sonification [T. Bovermann]
Data specific
Very complicated
Characteristics of many exited data points to various characteristics of sound grains
Neither clear nor obvious
a) 3 – 9 b) 2,5,7 c) 2,5 d) 2,8
Real-time
VII Vortex Sound Synthesis [Y. Shin]
Data specific
Quite complicated
Physically-based: data to acoustic parameters like density and particle velocity
Very clear and self-explanatory
a) 3 – 9 b) 2,5,6 c) – d) 1,3,4,9
Not real time
VIII Sonification of Numerical Fluid Flow Simulations [E. Childs]
Data specific
Fairly simple X and Y values to frequency, matrix coefficients to envelope
Not obvious; sound should converge with solution
a) 3 – 9 b) 4,9,[1,3] c) 1,3,4,9 d) 2,5,8
Real-time
IX Sonification of Vector Fields [E. Klein]
Data specific
Fairly simple Vector direction and magnitude to sound location and level and pitch
Helpful and easy?
a) 3 – 9 b) 4,8,1,3 c) 1,3,4,8 d) 1,3,4,7
Real-time

Sonification Example IX
Sonification of Vector Fields [E. Klein]
• Rectilinear grids of vectors• A sphere at the listener’s position. Random
samples within that sphere• Mapping vector direction and magnitude of
sampled particle:– Vector direction to
sound location– Vector magnitude to
sound level and pitch

Sonification Example IX
Sonification of 3D Vector Fields
Two consecutive vector samples taken at random locations within the listener’s head volume
Hermite curve to achieve C1 continuity between two sound positions

Sonification Example IX
Sonification of 3D Vector Fields
• Vorticity (turbulence) in the sampled area:– All of the samples in the area are
roughly the same magnitude and direction: constant and smooth sound – low vorticity
– Vectors vary widely: sound appears to shift more, giving the impression of higher turbulence
– Size of the sample volume in relation to the density of the vectors within the field plays an important role

Project Background
• Input: – Fluid field with velocity vector, pressure, plus
potentially density, temperature and other data– Changes with time
• Output: – Sound characterizing the given fluid field– Ambient: global to the whole field– Local: at the point or area of interaction

Project: sound options
• Global– Every particle in the field contributes to the sound– The further sound source is from the virtual pointer the less
contribution it makes, the quieter it is
• Local point– Only the field characteristics at the virtual pointer position
contribute to the sound
• Local region– Particles of the specific subset area around the pointer
contribute to the sound– Possibility to add zoom factor to expand or contract the space
of interaction
Structure
– Each rendering program is independent of any other
Solution Data Server
Max/MSP Program
Main Program asMax/MSP object
VisualizationProgram
Haptic Program
Haptic Device ImageSound

Haptic Program
• Read from the haptic device and sends pointer info to the sound and visual programs– Pointer position and orientation (converted to the data
field dimensions)
– Interaction sphere diameter - local region
• Gives a force feedback:– Virtual walls: provides a force disallowing movement
of the device outside of the data field boundary
– Other feedback possible: produce a force that is proportional to the flow density and its direction

Visualization program
– Displays vector field, virtual pointer (microphone) and interaction sphere
• SGI OpenGL Performer Library for graphical representation
Max/MSP
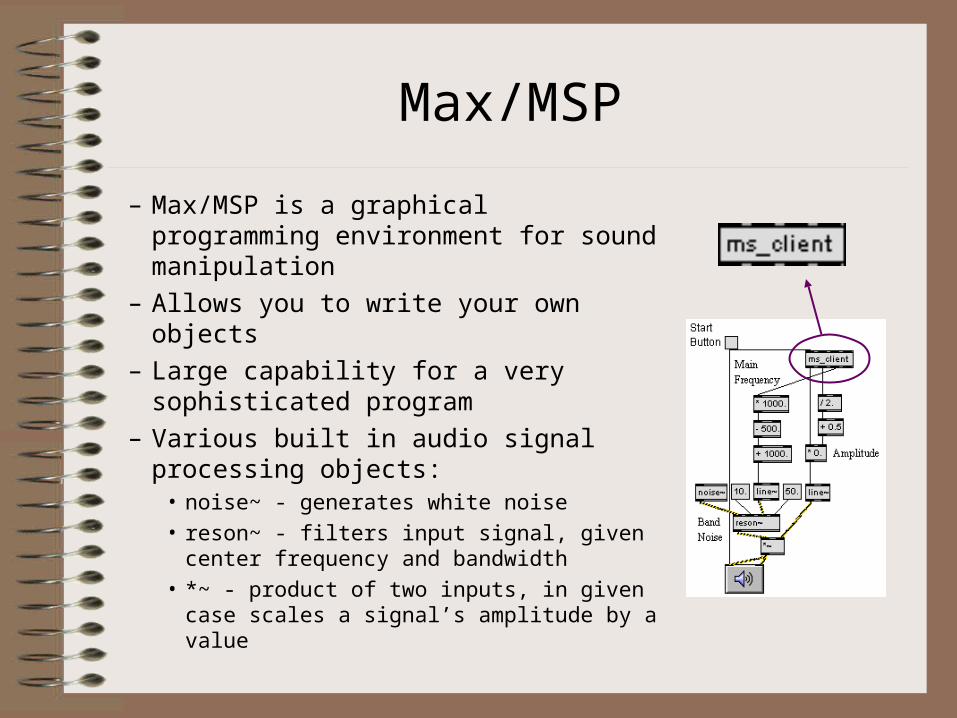
– Max/MSP is a graphical programming environment for sound manipulation
– Allows you to write your own objects
– Large capability for a very sophisticated program
– Various built in audio signal processing objects:
• noise~ - generates white noise
• reson~ - filters input signal, given center frequency and bandwidth
• *~ - product of two inputs, in given case scales a signal’s amplitude by a value

Max/MSP object
– Calculates velocity vector at the position of the virtual microphone depending on interaction sphere radius (using Schaeffer’s interpolation scheme):
• Small : from vertices of the grid cell
• Large: from all the vertices inside the influence sphere
• velocity value & angle at that position
sForallNodenm
sForallNodenmn
mrr
rrtt 2
2
/1
/)()(
p
p

Max/MSP object
– Two output values for both angle and velocity:• Output = value / max value
• Output = (value / max value) 5/3
– Relationship between loudness level and intensity:
S ~ a3/5 [B.Gold]
Thus, a function between values and amplitude should be:
a = const * data value5/3
to imply S ~ data value
)(tv

Max/MSP program
Frequency ~ ,were v -> [0,1] -> [500, 1500]
3/5v
)(tv
)(tv
Amplitude ~ * 5/3
,were v5/3 -> [0,1]
and a5/3 -> [0.5, 1]
white band noise is modified in amplitude and frequency to simulate a wind effect:

Exploration example
• Shows sound exploration of the wind flow over the Mount St Helens

Further work
• Refining the program– Possible other set-ups for Max/MSP sound program– Using headphones or speakers to convey spatial sound
• Experiments– To study user interaction with given environment– Short case-tests to determine user ability to navigate
within the flow using• Only visual clues• Only sound clues• Both visual and sound clues

References
[1] B.N. Walker, J.T. Cothran, July 2003, Sonification Sandbox: a Graphical Toolkit For Auditory Graphs, Proceedings of the 2003 International Conference on Auditory Display, Boston, MA
[2] H.G. Kaper, S. Tipei, E. Wiebel, 5July 2000, Data Sonification and Sound Visualization
[3] K. Metze, R.L. Adam, N.J. Leite, Cell Music: The Sonification of Digitalized Fast-Fourier Transformed Microscopic Images
[4] M. Ballora, B. Pennycook, P.C. Ivanov, L.Glass, A.L. Goldberger, 2004, Heart Rate Sonification: A New Approach to Medical Diagnosis, LEONARDO, Vol. 37, No. 1, pp. 41–46
[5] M. Noirhomme-Fraiture, O. Schöller, C. Demoulin, S. Simoff, Sonification of time dependent data

References
[6] Y. Shin, C. Bajaj, 2004, Auralization I: Vortex Sound Synthesis, Joint EUROGRAPHICS - IEEE TCVG Symposium on Visualization
[7] E. Childs, 2001, The Sonification of Numerical Fluid Flow Simulations, Proceedings of the 2001 International Conference on Auditory Display, Espoo, Finland, July 29-August 1
[8] E. Klein, O.G. Staadt, 2004, Sonification of Three-Dimensional Vector Fields, Proceedings of the SCS High Performance Computing Symposium, pp 8
[9] G. Kramer, B. Walker, T. Bonebright, P. Cook, J. Flowers, N. Miner, J. Neuhoff, R. Bargar, S. Barrass, J. Berger, G. Evreinov, W.T. Fitch, M. Gröhn, S. Handel, H. Kaper, H. Levkowitz, S. Lodha, B. Shinn-Cunningham, M. Simoni, S. Tipei, Sonification Report: Status of the Field and Research Agenda, http://www.icad.org/websiteV2.0/References/nsf.html

References
[10] C.Wassgren, C.M. Krousgrill, P. Carmody, Development of Java applets for interactive demonstration of fundamental concepts in mechanical engineering courses, http://widget.ecn.purdue.edu/~meapplet/java/flowvis/Index.html
[11] W.A. Yost, 2000, Fundamentals of Hearing: An Introduction, Forth Edition
[12] S.A. Gelfand, 2004, Hearing: An Introduction to Psychological and Physiological Acoustics, Forth Edition, Revised and Expanded
[13] T. Bovermann, T. Hermann, H. Ritter, July 2005, The Local Heat Exploration Model for Interactive Sonification, International Conference on Auditory Display, Limerick, Ireland
[14] B. Gold, N. Morgan, 2000, Speech and Audio Signal Processing: Processing and Perception of Speech and Music