Multi-line Aggregate Retention Stop-loss Program (MARS) · stop-loss program for $1 million...
14
willistowerswatson.com Multi-line Aggregate Retention Stop-loss Program (MARS) A presentation to Energy Insurance Services Members October 23, 2018 By: Ann Conway, FCAS, MAAA, CERA Jim Swanke, CPCU, ALCM, ARM © 2018 Willis Towers Watson. All rights reserved.
Transcript of Multi-line Aggregate Retention Stop-loss Program (MARS) · stop-loss program for $1 million...
willistowerswatson.com
Multi-line Aggregate Retention Stop-loss Program (MARS) A presentation to Energy Insurance Services Members
October 23, 2018
By: Ann Conway, FCAS, MAAA, CERAJim Swanke, CPCU, ALCM, ARM
© 2018 Willis Towers Watson. All rights reserved.

willistowerswatson.com
Captive 10-year expanding role
1© 2018 Willis Towers Watson. All rights reserved. Proprietary and Confidential. For Willis Towers Watson and Willis Towers Watson client use only.
Wild fire liability coverage provided by captive to a $100 million limit subject to a $1 million self-insured retention. Reinsurance purchased by captive for top $90 million of coverage
Year 9
Medical stop-loss and wage and hour coverages are separately added to captive with $1 million limits
Year 6
Self-insured retentions increased from $1 million to $2 million and captive’s stop-loss protection is expanded to cover increased exposure
Year 3
Captiveprovides multi-line retention stop-loss program for $1 million self-insured retentions under workers compensation, general liability, automobile liability, cyber liability and property insurance policies
Year 1

willistowerswatson.com
The volatility of retained losses is great, potentially impacting quarterly earnings
2© 2018 Willis Towers Watson. All rights reserved. Proprietary and Confidential. For Willis Towers Watson and Willis Towers Watson client use only.
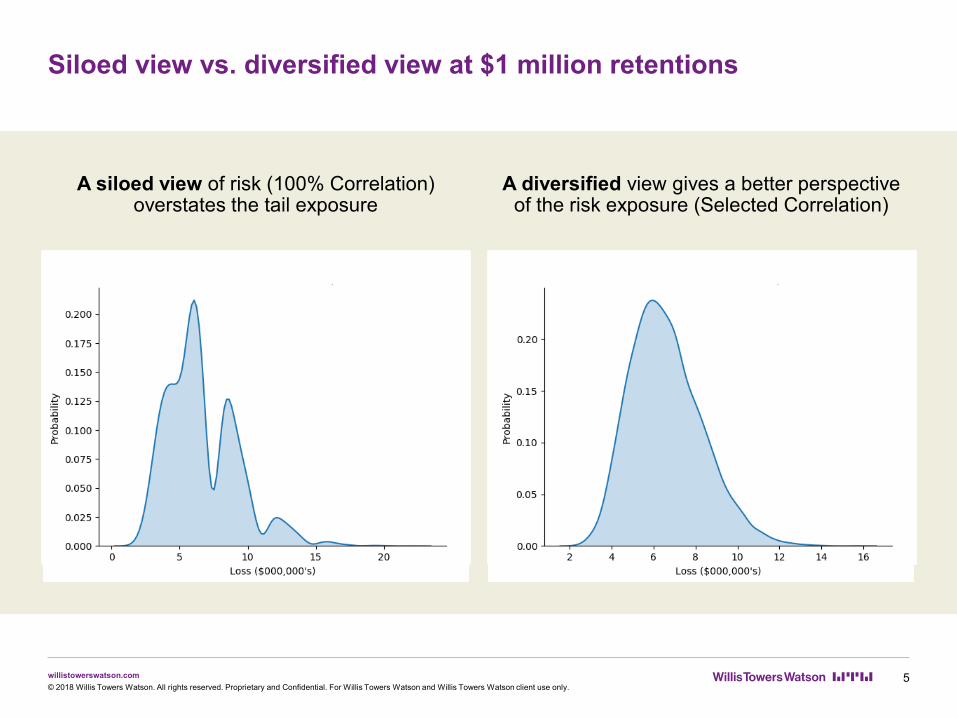
Comparison of Distribution of Total Losses ($000’s)Siloed
(100% Correlation)Diversified
(Selected Correlation) Difference
Mean $6,612 $6,612 $0
50th Percentile 6,119 6,423 -303
75th Percentile 8,390 7,682 708
80th Percentile 8,746 8,024 722
85th Percentile 9,188 8,416 772
90th Percentile 9,795 8,911 884
95th Percentile 11,846 9,723 2,123
99th Percentile 13,946 11,222 2,723

willistowerswatson.com
Difference between siloed and diversified view
3© 2018 Willis Towers Watson. All rights reserved. Proprietary and Confidential. For Willis Towers Watson and Willis Towers Watson client use only.
0
500
1,000
1,500
2,000
2,500
3,000
75th 80th 85th 90th 95th 99th
Diff
eren
ce ($
000'
s)
Percentile
$708 $722 $772$884
$2,123
$2,723

willistowerswatson.com
Dependencies are critical in the modeling process as we consider future captive opportunities
© 2018 Willis Towers Watson. All rights reserved. Proprietary and Confidential. For Willis Towers Watson and Willis Towers Watson client use only.
Workers Compensation
General Liability
Auto Liability
Cyber Liability Property Wage
and HourMedical
Stop LossForest
Fire
Workers Compensation
General Liability 0.25
Auto Liability 0.25 0.25
Cyber Liability 0.25 0.1 0.1
Property 0.25 0.25 0.25 0.25
Wage and Hour 0.25 0.1 0.1 0.1 0.25
Medical Stop Loss 0.25 0.25 0.25 0.1 0.1 0.1
Forest Fire 0.25 0.1 0.1 0.1 0.25 0.1 0.1
4
willistowerswatson.com
A diversified view gives a better perspective of the risk exposure (Selected Correlation)
Siloed view vs. diversified view at $1 million retentions
5© 2018 Willis Towers Watson. All rights reserved. Proprietary and Confidential. For Willis Towers Watson and Willis Towers Watson client use only.
A siloed view of risk (100% Correlation) overstates the tail exposure

willistowerswatson.com
Considering both risk correlation and the impact of captive stop-loss
insurance creates a very different risk profile
Volatility reduced by introducing captive stop-loss insurance
6© 2018 Willis Towers Watson. All rights reserved. Proprietary and Confidential. For Willis Towers Watson and Willis Towers Watson client use only.
Captive stop-loss insurance significantly reduces volatility

willistowerswatson.com
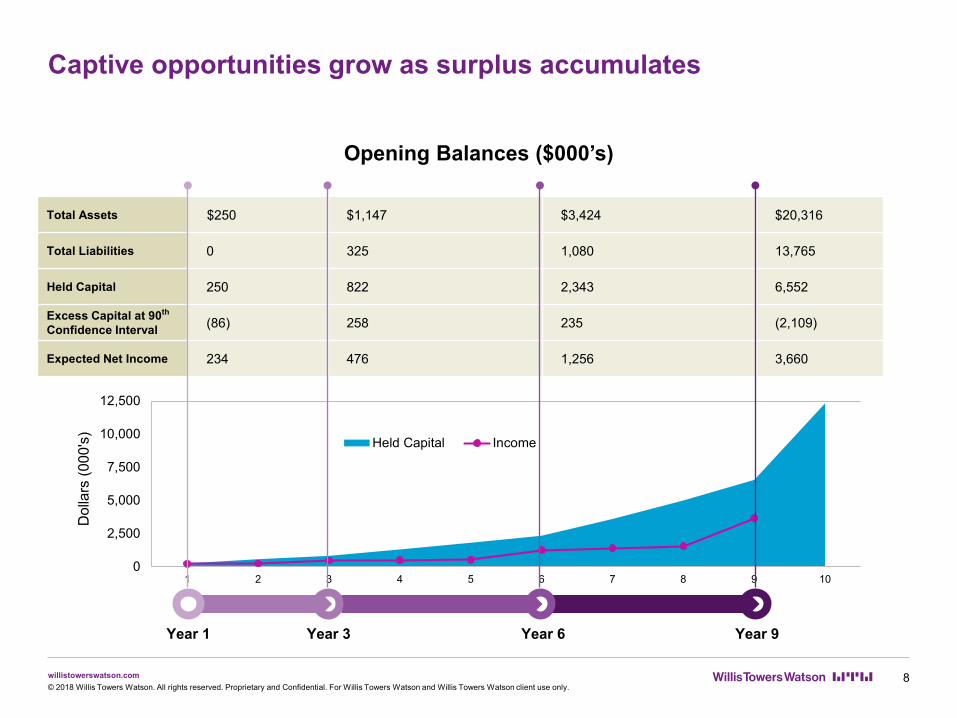
The modeling process starts with the opening financial statements
Opening Balances ($000’s)
7© 2018 Willis Towers Watson. All rights reserved. Proprietary and Confidential. For Willis Towers Watson and Willis Towers Watson client use only.
Total Assets $250 $1,147 $3,424 $20,316
Total Liabilities 0 325 1,080 13,765
Held Capital 250 822 2,343 6,552
Excess Capital at 90th
Confidence Interval (86) 258 235 (2,109)
Expected Net Income 234 476 1,256 3,660
Year 9Year 6Year 3Year 1
willistowerswatson.com
0
2,500
5,000
7,500
10,000
12,500
1 2 3 4 5 6 7 8 9 10
Dol
lars
(000
's)
Held Capital Income
Total Assets $250 $1,147 $3,424 $20,316
Total Liabilities 0 325 1,080 13,765
Held Capital 250 822 2,343 6,552
Excess Capital at 90th
Confidence Interval (86) 258 235 (2,109)
Expected Net Income 234 476 1,256 3,660
Captive opportunities grow as surplus accumulates
Opening Balances ($000’s)
8© 2018 Willis Towers Watson. All rights reserved. Proprietary and Confidential. For Willis Towers Watson and Willis Towers Watson client use only.
Year 9Year 6Year 3Year 1
willistowerswatson.com
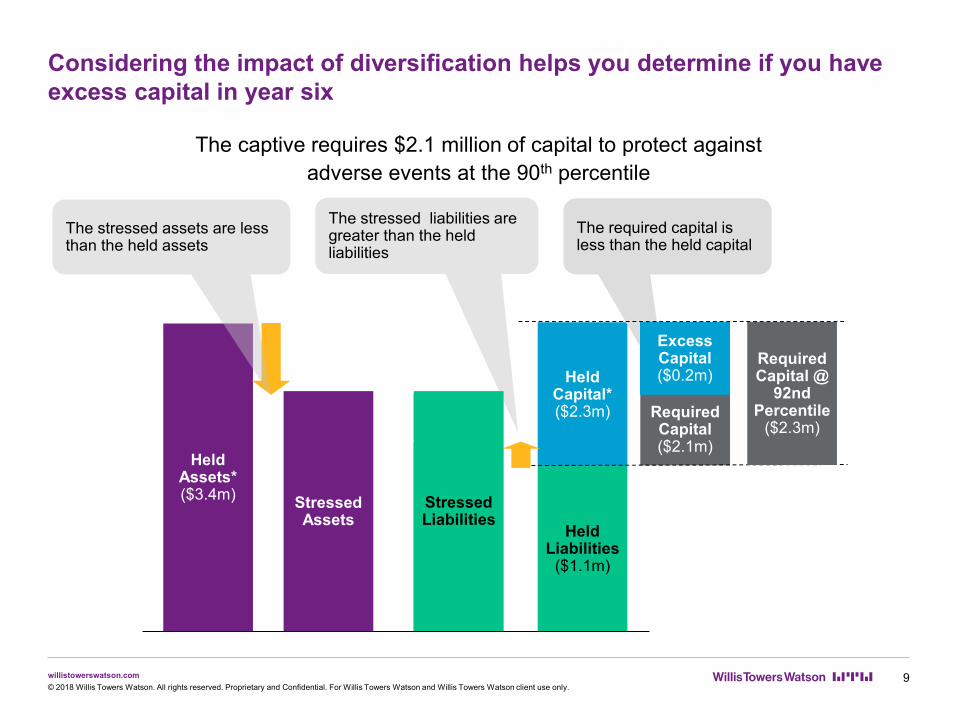
Considering the impact of diversification helps you determine if you have excess capital in year six
The captive requires $2.1 million of capital to protect against adverse events at the 90th percentile
© 2018 Willis Towers Watson. All rights reserved. Proprietary and Confidential. For Willis Towers Watson and Willis Towers Watson client use only.
HeldCapital*($2.3m)
HeldAssets*($3.4m)
HeldLiabilities
($1.1m)
StressedAssets
The stressed assets are less than the held assets
RequiredCapital($2.1m)
The required capital is less than the held capital
StressedCapital
StressedLiabilities
The stressed liabilities are greater than the held liabilities
RequiredCapital @
92ndPercentile
($2.3m)
StressedLiabilities
ExcessCapital($0.2m)
9
willistowerswatson.com
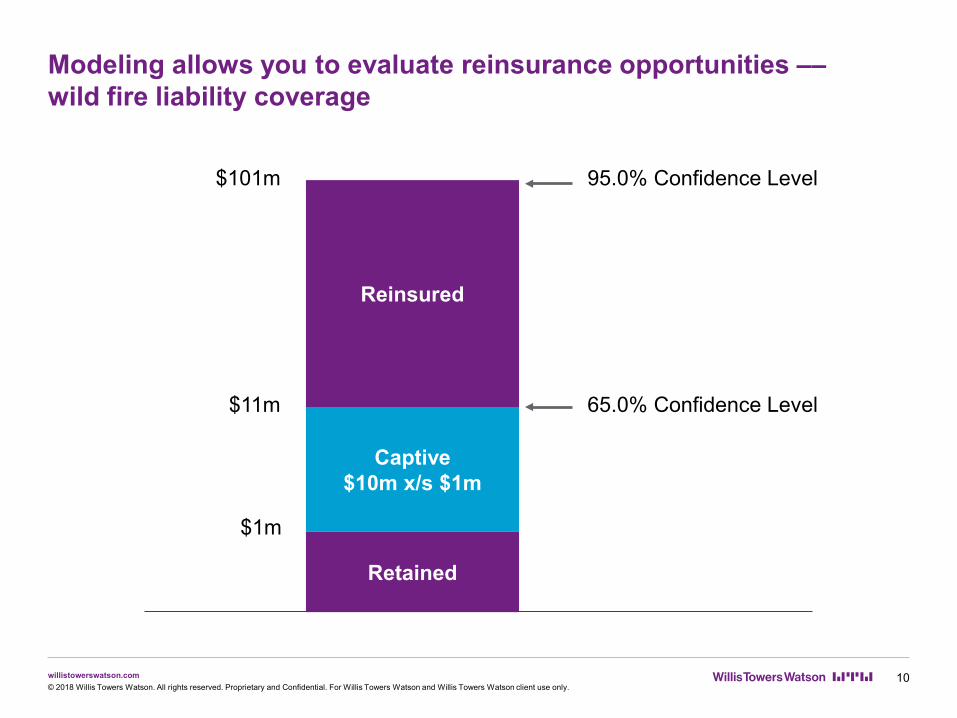
Modeling allows you to evaluate reinsurance opportunities ––wild fire liability coverage
© 2018 Willis Towers Watson. All rights reserved. Proprietary and Confidential. For Willis Towers Watson and Willis Towers Watson client use only.
Retained
Captive$10m x/s $1m
Reinsured
$1m
$11m
95.0% Confidence Level
65.0% Confidence Level
$101m
10

willistowerswatson.com
Conclusion
Taking diversification effect into consideration gives a more accurate view of the whole portfolio of retained risk allowing evaluation of the trade-offs of risk management decisions
Captive offers relief in fiscal quarters with substantial loss amounts under self-insured retentions reducing earnings volatility of the captive owner
Allows captive owner to ease into use of the captive by building surplus over time eventually permitting the captive to retain and manage additional risks
Aggregate stop-loss captive insurance can have a meaningful impact on reducing volatility in quarterly earnings per share
Captive facilitates access to reinsurance markets otherwise not available allowing for more customized risk management
© 2018 Willis Towers Watson. All rights reserved. Proprietary and Confidential. For Willis Towers Watson and Willis Towers Watson client use only.11

willistowerswatson.com
Contacts
12© 2018 Willis Towers Watson. All rights reserved. Proprietary and Confidential. For Willis Towers Watson and Willis Towers Watson client use only.
Ann ConwayManaging Director
800 Boylston Street, Prudential TowerBoston, MA 02199
T +1 617 638 3774C +1 617 519 6170E [email protected]
About Willis Towers WatsonWillis Towers Watson (NASDAQ: WLTW) is a leading global advisory, broking and solutions company that helps clients around the world turn risk into a path for growth. With roots dating to 1828, Willis Towers Watson has 40,000 employees serving more than 140 countries. We design and deliver solutions that manage risk, optimize benefits, cultivate talent, and expand the power of capital to protect and strengthen institutions and individuals. Our unique perspective allows us to see the critical intersections between talent, assets and ideas – the dynamic formula that drives business performance. Together, we unlock potential. Learn more at willistowerswatson.com.
Jim SwankeSenior Director
8400 Normandale Lake Blvd., Suite 1700Minneapolis, MN 55437
T +1 952 842 6728C +1 952 250 3170E [email protected]
willistowerswatson.com 13© 2018 Willis Towers Watson. All rights reserved. Proprietary and Confidential. For Willis Towers Watson and Willis Towers Watson client use only.