MULTI-ELEMENT UNSTRUCTURED ANALYSES OF COMPLEX …
14
MULTI-ELEMENT UNSTRUCTURED ANALYSES OF COMPLEX VALVE SYSTEMS Vineet Ahuja, Ashvin Hosangadi, and Jeremy Shipman Combustion Research and Flow Technology, Inc. Pipersville, PA 18929 [email protected] ABSTRACT The safe and reliable operation of high pressure test stands for rocket engine and component testing places an increased emphasis on the performance of control valves and flow metering devices. In this paper, we will present a series of high fidelity computational analyses of systems ranging from cryogenic control valves and pressure regulator systems to cavitating venturis that are used to support rocket engine and component testing at NASA Stennis Space Center. A generalized multi-element framework with sub-models for grid adaption, grid movement and multi-phase flow dynamics has been used to carry out the simulations. Such a framework provides the flexibility of resolving the structural and functional complexities that are typically associated with valve-based high pressure feed systems and have been difficult to deal with traditional CFD methods. Our simulations revealed a rich variety of flow phenomena such as secondary flow patterns, hydrodynamic instabilities, fluctuating vapor pockets etc. In the paper, we will discuss performance losses related to cryogenic control valves, and provide insight into the physics of the dominant multi-phase fluid transport phenomena that are responsible for the “choking like” behavior in cryogenic control elements. Additionally, we will provide detailed analyses of the modal instability that is observed in the operation of the dome pressure regulator valve. Such instabilities are usually not localized and manifest themselves as a system wide phenomena leading to an undesirable chatter at high flow conditions. INTRODUCTION In this paper we discuss simulation technology used to support testing of rocket propulsion systems by carrying out high fidelity analyses of support systems such as a cryogenic service valves, pressure regulator control valves and cavitating control elements in a feed system. Such analyses are particularly important for the reliable operation of high pressure valves and flow metering elements on test stands used for component testing of cryogenic pumps and propulsive devices. This is primarily because identification of transient anomalies stemming from hydrodynamic instabilities, valve timing and/or system based dynamic instabilities is usually difficult with empirical correlations and low-dimensional analysis methods. However, high fidelity Navier-Stokes based analysis of control valve type systems are typically very challenging because of the structural and functional complexity associated with such systems (Daines et al. [1]). Structurally a valve system can consist of a complex network of embedded plugs, diaphragms, manifolds, arterial branches with complicated junctions. For example, a control valve such as a pressure regulator valve can consist of multiple elements with complex shapes such as a variable area poppet being driven in an irregular shaped housing with very tight clearances both in the seat region and the outer housing (Figure 1). Moreover, a network of feed channels interface between the inlet duct to the valve and the chamber housing the poppet. Traditional CFD tools have severe limitations imposed on them, both in terms of accuracy and efficiency while carrying out high fidelity analyses of such complicated systems. These limitations stem from the topological constraints imposed by the structural complexity of the geometry and the rich diversity of spatial and temporal scales that have to be locally resolved in the flow domain. Functionally, characterization of such valve systems can be difficult because of the range of issues associated with them: feedback control loops, unsteady fluctuations from movement of sub- components, system instabilities that couple with operating/testing elements, multiphase flow regimes etc. So far, CFD analysis of such systems has been performed through the use of discrete steady state DISTRIBUTION STATEMENT A : “Approved for public release; distribution is unlimited.” Contract Number: NAS13-03009, NASA Stennis Space Center.
Transcript of MULTI-ELEMENT UNSTRUCTURED ANALYSES OF COMPLEX …

MULTI-ELEMENT UNSTRUCTURED ANALYSES OF COMPLEX VALVE SYSTEMS
Vineet Ahuja, Ashvin Hosangadi, and Jeremy Shipman Combustion Research and Flow Technology, Inc.
Pipersville, PA 18929 [email protected]
ABSTRACT
The safe and reliable operation of high pressure test stands for rocket engine and component testing places an increased emphasis on the performance of control valves and flow metering devices. In this paper, we will present a series of high fidelity computational analyses of systems ranging from cryogenic control valves and pressure regulator systems to cavitating venturis that are used to support rocket engine and component testing at NASA Stennis Space Center. A generalized multi-element framework with sub-models for grid adaption, grid movement and multi-phase flow dynamics has been used to carry out the simulations. Such a framework provides the flexibility of resolving the structural and functional complexities that are typically associated with valve-based high pressure feed systems and have been difficult to deal with traditional CFD methods. Our simulations revealed a rich variety of flow phenomena such as secondary flow patterns, hydrodynamic instabilities, fluctuating vapor pockets etc. In the paper, we will discuss performance losses related to cryogenic control valves, and provide insight into the physics of the dominant multi-phase fluid transport phenomena that are responsible for the “choking like” behavior in cryogenic control elements. Additionally, we will provide detailed analyses of the modal instability that is observed in the operation of the dome pressure regulator valve. Such instabilities are usually not localized and manifest themselves as a system wide phenomena leading to an undesirable chatter at high flow conditions.
INTRODUCTION
In this paper we discuss simulation technology used to support testing of rocket propulsion systems by carrying out high fidelity analyses of support systems such as a cryogenic service valves, pressure regulator control valves and cavitating control elements in a feed system. Such analyses are particularly important for the reliable operation of high pressure valves and flow metering elements on test stands used for component testing of cryogenic pumps and propulsive devices. This is primarily because identification of transient anomalies stemming from hydrodynamic instabilities, valve timing and/or system based dynamic instabilities is usually difficult with empirical correlations and low-dimensional analysis methods. However, high fidelity Navier-Stokes based analysis of control valve type systems are typically very challenging because of the structural and functional complexity associated with such systems (Daines et al. [1]). Structurally a valve system can consist of a complex network of embedded plugs, diaphragms, manifolds, arterial branches with complicated junctions. For example, a control valve such as a pressure regulator valve can consist of multiple elements with complex shapes such as a variable area poppet being driven in an irregular shaped housing with very tight clearances both in the seat region and the outer housing (Figure 1). Moreover, a network of feed channels interface between the inlet duct to the valve and the chamber housing the poppet. Traditional CFD tools have severe limitations imposed on them, both in terms of accuracy and efficiency while carrying out high fidelity analyses of such complicated systems. These limitations stem from the topological constraints imposed by the structural complexity of the geometry and the rich diversity of spatial and temporal scales that have to be locally resolved in the flow domain.
Functionally, characterization of such valve systems can be difficult because of the range of issues associated with them: feedback control loops, unsteady fluctuations from movement of sub-components, system instabilities that couple with operating/testing elements, multiphase flow regimes etc. So far, CFD analysis of such systems has been performed through the use of discrete steady state
DISTRIBUTION STATEMENT A: “Approved for public release; distribution is unlimited.” Contract Number: NAS13-03009, NASA Stennis Space Center.

single-phase calculations at different valve positions by isolating the main control element. Such flow characteristic curves provide important insight into mean performance related to these flow control devices. Furthermore, such analyses can serve as a first order approximation for a variety of important transient issues that are critical to some of the primary functions performed by such systems such as pressure regulation and flow control. High Fidelity CFD analyses can also help resolve fluidic/hydrodynamic instabilities that arise from secondary flows/recirculating regions/shedding phenomena caused by the complexities in flow geometries. Unfortunately, these instabilities can couple with the valve motion and structural elements leading to undesirable “chatter” in the valve system. Pressure fluctuations can also arise from valve operation (valve opening/closing) leading to the creation of cavitation zones in feed lines. These vapor pockets in turn can collapse and manifest themselves as dynamic instabilities by coupling with pressure oscillations from the system.
In addition to the structural and functional complexities associated with valve-based high pressure feed systems, it must be noted that rocket test facilities operate in widely varying flow regimes: from highly compressible gases feeding into preburners to cryogenic liquids used in rocket turbopumps. Simulations of cryogenic fluids can be particularly challenging as these fluids operate in proximity to their critical temperature where thermodynamic properties are very sensitive to small gradients in temperature. Furthermore, analyses of valve systems in cryogenic environments require elaborate phase change sub-models embedded in the simulation framework to accurately represent valve response to flow transients (Hosangadi and Ahuja [2]). For example venturi-type flow control devices are commonly used as flow meters in cryogenic feed lines and cavitation is the primary control mechanism used to “choke” the venturi thereby preventing any downstream pressure transients in the combustion chamber from affecting the feed line mass flow rates.
In this paper we discuss the simulation capability of the multi-element unstructured numerical framework (CRUNCH CFD®) and apply it for analyses of a host of valve based systems and control elements found in high pressure liquid rocket test facilities at NASA Stennis Space Center. This multi-element unstructured based simulation capability has been proven to provide efficient and accurate solutions for complex turbomachinery and aero-propulsive applications in the past (Ahuja et al. [3]). The hybrid unstructured methodology is embedded in a multi-phase framework and is used for simulations of valve systems ranging from a dome pressure regulator valve characteristic of highly compressible flowfields, to incompressible liquid valve systems, to venturi-type cryogenic control elements where cavitation is prevalent. In the following sections, we provide details of the multi-phase equation system and the hybrid unstructured numerical framework. We also discuss the compressible, incompressible and multi-phase valve simulations. Our simulation results are compared against experimental data and the simulations reveal a rich variety of flow phenomena over a multitude of length and time scales.
Multi-Phase Equation System
The multiphase equation system is written in vector form as:
v=S+DQ E F Gt x y z
∂ ∂ ∂ ∂∂ ∂ ∂ ∂
+ + + (1)
Here Q is the vector of dependent variables, E, F and G are the flux vectors, S the source terms
and Dv represents the viscous fluxes. The viscous fluxes are given by the standard full compressible form of Navier Stokes equations (Hosangadi et al. [4]). The vectors Q, E and S are given below with a detailed discussion on the details of the cavitation source terms to follow later:
DISTRIBUTION STATEMENT A: “Approved for public release; distribution is unlimited.” Contract Number: NAS13-03009, NASA Stennis Space Center.

2
0000
mm
m m
m m
m m
gg g g g
hm m m m
km m
m m
uu u Pv uvw uw
Q E SSuSh h uSk kuSu ε
ρρρ ρρ ρρ ρρ φ ρ φρ ρρ ρρ ε ρ ε
⎛ ⎞⎛ ⎞ ⎛ ⎞⎜ ⎟⎜ ⎟ ⎜ ⎟+⎜ ⎟⎜ ⎟ ⎜ ⎟⎜ ⎟⎜ ⎟ ⎜ ⎟⎜ ⎟⎜ ⎟ ⎜ ⎟⎜ ⎟⎜ ⎟ ⎜ ⎟= = =⎜ ⎟⎜ ⎟ ⎜ ⎟⎜ ⎟⎜ ⎟ ⎜ ⎟⎜ ⎟⎜ ⎟ ⎜ ⎟⎜ ⎟⎜ ⎟ ⎜ ⎟⎜ ⎟⎜ ⎟ ⎜ ⎟
⎜ ⎟⎜ ⎟⎜ ⎟⎜ ⎟ ⎜ ⎟ ⎜ ⎟⎝ ⎠⎝ ⎠ ⎝ ⎠
(2)
Here, ρm and are the mixture density and enthalpy respectively, and φmh g is the volume fraction or porosity of the vapor phase. The mixture energy equation has been formulated with the assumption that the contribution of the pressure work on the mixture energy is negligible which is a reasonable assumption for this flow regime. The source term for the vapor phase arises from rate of vapor mass generation due to cavitation and the corresponding source term for the energy equation is given as
, where is the change in enthalpy resulting from the phase change and is a function of the local fluid temperature.
tm
t fgm h× fgh
The mixture density and gas porosity are related by the following relations locally in a given cell volume:
ρm = ρg φg + ρL φL (3)
1= φg + φL (4)
where ρg , ρL are the physical material densities of the gas and liquid phase respectively and in general are functions of both the local temperature and pressure. In our formulation, we have assumed local thermodynamic equilibrium to significantly simplify Eqn. (1). The thermodynamic properties of the liquid and vapor in the cavity are defined by a single variable; the saturation temperature satT . Hence, all thermodynamic properties (density, vapor pressure, viscosity, etc) of both the liquid and the vapor phase may be generated as a tabular function of the saturation temperature. In our study here, these properties were generated from the Standard thermodynamic database 12 available from NIST for pure fluids.
The equation system as formulated in Eqn. (1) is very stiff since the variations in density are much smaller than the corresponding changes in pressure. Therefore to devise an efficient numerical procedure we wish to transform Eqn. (1) to a pressure based form where pressure rather than density is the variable solved for. An acoustically accurate two-phase form of Eqn. (1) is first derived, followed by a second step of time-scaling or preconditioning to obtain a well-conditioned system. We begin by defining the acoustic form of density differential for the individual gas and liquid phase as follows:
dρg =
1cg
2 dP, dρ l =1
cL2 dP (5)
DISTRIBUTION STATEMENT A: “Approved for public release; distribution is unlimited.” Contract Number: NAS13-03009, NASA Stennis Space Center.

Here cg is the isothermal speed of sound
∂P∂ρ g
⎛
⎝ ⎜
⎞
⎠ ⎟ T
in the pure gas phase, and cL is the
corresponding isothermal speed of sound in the liquid phase, which is a finite-value. We note that in Eqn. (5) the variation of the density with temperature has been neglected in the differential form. This assumption was motivated by the fact that the temperature changes are primarily due to the source term and not by the pressure work on the fluid i.e. the energy equation is a scalar equation. This simplifies the matrix algebra for the upwind flux formulation significantly, at the potential expense of numerical stability in a time-marching procedure. However, more importantly, there is no impact on the accuracy since the fluid properties themselves are taken directly from the thermodynamic data bank for each fluid.
Following the discussion above, the differential form of the mixture density ρm using Eqn. (5) is written as,
( ) 2
2 2 2
1
1
m g L g
g L
g L
d dc
c c c
φ
φ
ρ ρ ρ φ
φ φ
= − +
⎛ ⎞⎜ ⎟= +⎜ ⎟⎝ ⎠
dP
(6)
Here, cφ is a variable defined for convenience and is not the acoustic speed, cm, in the mixture, which will be defined later. Using Eqn. (6), Eqn. (1) may be rewritten as:
vv
Q E F G S Dt x y z
∂ ∂ ∂ ∂∂ ∂ ∂ ∂
Γ + + + = + (7)
and,
Qv = p,u,v,w,φg,k,ε[ ]T (8)
The numerical characteristics of the Eqn. (7) are studied by obtaining the eigenvalues of the
matrix,
∂QvΓ−1 ∂E⎛
⎜ ⎞ ⎟
⎣
⎤
⎦ ⎥
⎝ ⎠
⎡ ⎢ . The eigenvalues of the system are derived to be:
Λ = u + cm , u − cm , u,u,u,u,u( ) (9)
where cm turns out to be the well-known, harmonic expression for the speed of sound in a two-phase mixture and is given as:
1
cm2 = ρm
φg
ρgcg2 +
φL
ρLcL2
⎡
⎣
⎢ ⎢ ⎢
⎤
⎦
⎥ ⎥ ⎥ (10)
DISTRIBUTION STATEMENT A: “Approved for public release; distribution is unlimited.” Contract Number: NAS13-03009, NASA Stennis Space Center.

To obtain an efficient time-marching numerical scheme, preconditioning is now applied to the system in Eqn. (7), in order to rescale the eigenvalues of the system so that the acoustic speeds are of the same order of magnitude as the local convective velocities
CRUNCH CFD® COMPUTATIONAL FRAMEWORK
The CRUNCH CFD® code has a hybrid, multi-element unstructured framework that allows for a combination of tetrahedral, prismatic, and hexahedral cells (Ahuja et al. [2]). The grid connectivity is stored as an edge-based, cell-vertex data structure, where a dual volume is obtained for each vertex by defining surfaces that cut across edges coming to a node. An edge-based framework is attractive in dealing with multi-elements since dual surface areas for each edge can include contributions from different element types making the inviscid flux calculation "grid transparent".
For efficient computation of large 3D problems, a parallel framework for distributed memory systems has been implemented, along with a time-marching implicit solution procedure. The sparse implicit matrix is derived using an Euler explicit linearization of the first-order flux, and a variety of iterative sparse matrix solvers, e.g. GMRES, Gauss-Seidel procedure, are available in the code (see Hosangadi et al. [4],[5] for details). The parallel framework is implemented by partitioning the grid into sub-domains, with each sub-domain residing on an independent processor. The message passing between processors has been implemented using MPI to provide portability across platforms. The CRUNCH CFD® code has an integrated grid refinement and coarsening package operational within a multi-element framework [6].
SIMULATION RESULTS
SIMULATIONS OF PRESSURE REGULATOR CONTROL VALVE
CFD simulations utilizing CRUNCH CFD® were performed to carry out detailed analysis of the pressure regulator valve. The structural complexity of the geometry and consequently the complex flow path associated with the pressure regulator valve made it particularly suitable for the multi-element framework incorporated in CRUNCH CFD®. For example, the pressure regulator valve comprises of many enclosed regions with multiple corners, disparate shapes and tight clearances. The flowfields associated with these regions are replete with a rich variety of length and time scales and diverse flow regimes from low Mach number flow regions to supersonic flow in the seat region. Moreover, the multiple corners and edges have secondary flow structures and transient phenomena such as shedding vortex structures. Associated with these unsteady phenomena is a dominant chattering-like behavior that has been observed when the valve is operational.
A multi-element grid comprising of tetrahedral, prismatic, hexahedral and pyramidal cells was constructed for the dome pressure regulator geometry. Traditional structured hexahedral grids are very difficult to generate for such a complex geometry. The complexity in the geometry forces an awkward block topology with highly skewed and irregular cells in the case of a pure hexahedral grid. Furthermore, a contiguous hexahedral mesh places severe constraints on grid resolution in critical regions of the flow domain such as the seat region of the valve where the flow accelerates sharply. A grid comprising of only tetrahedral-prismatic elements is cumbersome to build because of difficulties with prismatic extrusion in concave corners and tight clearances associated with the geometry. These shortcomings are overcome in the multi-element approach wherein high quality grids were generated very efficiently in all regions of the valve/body geometry. Figure 2 depicts a planar cross-section of the multi-element grid that was generated for the dome pressure regulator valve simulations. The grid consists of 716,000 hexahedral cells with a combination of 838,989 tetrahedral, prismatic and pyramidal cells. Most of the straight sections of the geometry such as the discharge duct and the inlet pipe were predominantly meshed with high aspect ratio hexahedral cells. Hexahedral blocks were also utilized in the seat region of the valve where very high directional gradients in the flow variables exist and high aspect ratio hexahedral cells are
DISTRIBUTION STATEMENT A: “Approved for public release; distribution is unlimited.” Contract Number: NAS13-03009, NASA Stennis Space Center.
ideal to capture such gradients. Prismatic layers were extruded from the walls that comprised of the ports and pipe connections in order to resolve the boundary layers associated with these regions. The remaining portions of the geometry such as the junctions between the inlet/discharge straight portions and the valve housing were filled with tetrahedral cells that acted as buffer zones connecting the disparate topologies in different regions of the pressure regulator valve. Both steady and unsteady simulations were performed with the multi-element grid. An ideal gas flow was assumed for both simulations. Inflow boundary conditions based on an inlet total pressure of 4400 psi and a total temperature of 540 degrees R were specified at the inlet plane to the feed duct. At the outflow plane of the discharge duct a back pressure of 800 psi was maintained. The steady simulations revealed a rich variety of flow phenomena over a multitude of length scales, as illustrated in Figure 3.
Figure 3(a) shows the Mach number distribution along the plane of symmetry – it can be seen that the flow mildly accelerates as it transitions from the intake pipe to the feed ports leading into the valve housing. Furthermore, the flow accelerates sharply turning supersonic through the valve seat region, which has a very narrow clearance. The flow emerges from the valve seat region like a jet into the upper housing where it turns and transitions into a feed channel that exits into the discharge pipe. The Mach number distribution also reveals flow expansion in both the discharge feed channel and the discharge duct. These observations are corroborated by the pressure distribution along the plane of symmetry Figure 3(b). It is clear from the pressure distribution that, as expected, most of the pressure losses accrue in the seat/throat region of the dome pressure regulator where the flow experiences a sharp acceleration. Furthermore, the pressure distribution also shows a pressure gradient in the upper housing indicating that flow is being forced tangentially towards the discharge duct. The pressure distribution on the poppet Figure 3(b) also shows a region of high pressure on the shaft just downstream of the throat region. This is primarily from flow mixing due to the fact that multiple feed channels located at different azimuthal locations introduce flow into the lower housing. Furthermore the stream traces reveal a complex flow pattern with strong recirculation in the upper housing indicating that the flow does not transition smoothly from the valve assembly into the discharge piping Figure 3(c).
The unsteady modeling effort was geared towards understanding an observed “chatter” of the poppet-shaft assembly during operation of the valve. A transient analysis with a fixed plug setting was performed with a time step of 3x10⁻⁷ seconds and captured a dominant oscillation of the flow with a frequency of about 4 KHz. This frequency was detected in pressure fluctuations across seven probe points located on the poppet surface. Through flow visualization of the transient simulations, an axial mode was identified as the source of the instability, which manifested itself as a periodic pulsation of a jet like structure through the throat coupled with tangential modes in the discharge portion of the flow. Pressure histories were recorded at seven different points on the poppet close to the throat (Figure 4(a)). The recording tabs were mostly distributed along the base of the throat on the poppet. Three pairs of tabs were located on the base (on the periphery and midway on radial lines running from the shaft to the outer edges) aligned with the direction of the feeding channels leading into the inner housing. One of the tabs was located on the shaft at the location where the steady state simulations indicated a localized region of high pressure. All seven probes show an almost identical periodic variation in pressure. The variations are strongest at the three points on the periphery of the base region (1,2 and 3) that also coincides with the throat region of the valve. Fourier decomposition of the histories indicates a fundamental mode corresponding to a frequency of 4043 Hz (see Figure 4(b,c)). Furthermore, Figure 4(c) shows significant energy associated with the first harmonic. More importantly, the Fourier decomposition also revealed an active low frequency mode of approximately 250 Hz. This mode could be structurally significant since it could excite poppet vibration modes leading to significant noise and couple with structural modes leading to potential structural failure.
SIMULATIONS OF THE 10-INCH CRYOGENIC VALVE
A series of simulations were carried out for the 10-inch cryogenic control valve. In these simulations, the multi-element CRUNCH CFD® framework was used to estimate the valve flow coefficient as a function of the plug setting. The aim of this exercise was to compare the valve flow coefficient curve
DISTRIBUTION STATEMENT A: “Approved for public release; distribution is unlimited.” Contract Number: NAS13-03009, NASA Stennis Space Center.

to experimental data and simulations performed at Stennis Space Center [7]. The valve configuration that was used for the numerical tests is shown in Figure 5. The plug/seat portion of the valve exactly matches the configuration used in the experimental test bed. However, in the simulations the entire valve geometry was approximated to be axisymmteric. For the purpose of simulating the cryogenic control valve, this is a valid approximation since the discharge and inlet ducts are located away from the plug/seat region and there are little three-dimensional flow distortions affecting the plug/seat region. A series of simulations were performed on this valve configuration pertaining to five different valve settings ranging from 45% open to 75% open. Liquid nitrogen was considered the working fluid in the control valve for all the simulations with operating conditions at 162 R and 3000 psi. The density of liquid nitrogen under the operating conditions was 800 kg/m3 and the valve operated with a mass flow rate that ranged from 100-300 lbs/sec. For the sake of the simulations, the temperature was assumed to be constant in the control valve and the liquid nitrogen was modeled as an incompressible liquid with constant density and molecular viscosity. This was primarily done to get a back-to-back comparison with the simulations carried out at Stennis Space Center with identical operating conditions.
A series of five simulations were performed with valve settings at 45%, 50%, 65%, 70% and 75% open. The mass flow rates utilized for these simulations were 100lbm/sec, 150lbm/sec, 150lbm/sec, 300lbm/sec and 300lbm/sec respectively. A series of hexahedral grids consisting of 60,000 cells were utilized in the simulations. The simulations were run on a parallel PC-cluster (16 processors) to provide rapid turnaround times consistent with those required to support testing (5-6 hours). The numerical simulations were carried out using the formulation described in the previous section with a wall function procedure in the vicinity of viscous boundaries specified in conjunction with the high-Re form of the standard k −ε equation. The boundary conditions were specified by fixing flow conditions at the inflow, except for pressure, which adjusts itself to sustain the prescribed mass flow and specifying the back pressure at the outflow boundary. The simulation results are summarized in Figure 5(a), which depicts comparisons of the valve flow coefficient as a function of valve position with experimental observations and calculations performed at Stennis Space Center. The valve flow coefficient Cv is defined as the ratio of the integrated mass flow rate (lbm/s) at the inlet to the square root of pressure differential (psia) required to drive the flow through the control valve. The CRUNCH-CFD simulations show a monotonically increasing valve flow coefficient curve with valve opening, consistent with both experimental observations and Stennis calculations. Furthermore, the results are in excellent agreement with experimental measurements and the grid independent values of Cv computed at Stennis Space Center, both, in predicting the slope of the curve and the transition in slope from the lower valve settings (< 60% open) to the higher valve settings (> 65% open). The CFD simulations also reveal finer details of the flow physics and helps in identifying regions in the valve configurations associated with pressure losses and the mechanics of flow control in the valve system. Figure 5(b) shows a sample axial velocity distribution for a plug setting of 75% open. The flow accelerates as it negotiates the seat region and subsequently turns along the nose of the plug towards the center of the duct aft of the seat region. The sharp turning of the flow leads to the formation of large zones of flow separation at the outer walls downstream of the seat region. In addition, stable recirculation patterns set up in the base region of the plug for all valve settings. The flow turning and recirculation patterns are further corroborated by the figure of turbulent viscosity distribution (Figure 5(c)) that is indicative of vorticity and diffusion of the velocity core in the duct downstream of the seat/plug region.
SIMULATIONS OF A CAVITATING VENTURI WITH LIQUID OXYGEN
The venturi is primarily used as flow control device in various applications primarily because of the insensitivity of mass flow rates to pressure fluctuations. However, the cavitation based mechanism responsible for this behavior is poorly understood. The problem is exacerbated in liquid rocket engine tests due to the use of cryogenic fluids that typically operate at elevated temperatures relative to their critical temperatures. In such flow regimes the vapor pressure and the fluid density vary sharply with temperature and thermodynamic effects have to be taken into consideration. The cavitating venturi case under investigation has a throat diameter of 2.94 inches and an inlet diameter of 10 inches with a sharply contoured contraction region and a long divergent section. The freestream conditions for this case consisted of a freestream velocity of 11.5 m/s and freestream density of 1132.12 kg/m3 at a temperature
DISTRIBUTION STATEMENT A: “Approved for public release; distribution is unlimited.” Contract Number: NAS13-03009, NASA Stennis Space Center.

of 92K. The vapor pressure at the freestream temperature was 0.1219 MPa. The simulation is initiated by first obtaining a converged single-phase solution at an elevated exit back pressure. The single-phase pressure distribution is shown in Figure 6(a) where the minimum pressure is found at the throat of the venturi due to flow acceleration from area contraction. Cavitation is triggered in this case by lowering the specified pressure at the exit plane. The initial formation of the cavitation zone starts up at the throat of the venturi where the local pressure recedes below the vapor pressure at the freestream temperature. This is seen in Figure 6(b) where the pressure differential between the local pressure and the vapor pressure are plotted. Since the time scales for phase change are extremely small, heat is drawn from a thin film of liquid surrounding the cavity resulting in an evaporative cooling effect. This in turn lowers the temperature in the cavity and the liquid surrounding the cavity leading to a local depression in the vapor pressure, and consequently retardation of the cavity formation process. In general, these thermodynamic effects of cavitation i.e. pressure and temperature depression are a function of fluid/thermodynamic properties as well as flow geometry and head characteristic. As these complex heat and mass transfer mechanisms evolve, the cavity migrates downstream from the inception region forming a vaporous mixture that engulfs the entire throat region of the venturi (Figure 7). Two important observations are noted at this point: Firstly, the vapor cloud that covers the throat region is highly diffuse forming a frothy-like cavity with the bulk of the void fraction in the cavity around 0.5 except close to the walls where the void fraction is closer to 1.0. Secondly, it should be reiterated that the diffuse cavity covers the entire cross-section of the venturi just downstream of the throat. The presence of low amount of vapor void fraction throughout the cross-section of the venturi is responsible for a sharp decrease in the local speed of sound in the venturi near the throat region. Therefore, any pressure fluctuations downstream of the venturi would not directly translate into mass flow corrections at the inlet to the venturi, making the venturi an ideal device to meter propellants in liquid rocket engine test rigs. Figure 8(a). A high pressure region is seen to build up in the closure region of the cavity that closely resembles a “shock structure” in conventional compressible flow. Pressure waves are seen shedding aft of the cavity region in the downstream divergent section due to unsteadiness associated with the cavity. There is a pressure spike visible upstream of the throat region due to the re-conversion of the vapor in the throat region of the venturi to liquid. This re-conversion process is primarily due to the thermodynamic effects of cavitation in cryogenic fluids that were discussed above. The velocity distribution (Figure 8(b)) corroborates most of the observations noted from the pressure distribution above including location of the cavity. Interestingly, in the two-phase regime the highest velocity is no longer in the throat region at the point of the maximum contraction, but in the cavity region downstream of the throat. This increase in local velocity is largely attributed to the change in density between the liquid and vapor in the cavitation regions. The temperature distribution shown inFigure 8(c) indicates the importance of accurately modeling the thermodynamics in the case of the cavitating venturi. Unlike cavitation in conventional liquids such as water where thermodynamic effects are generally neglected, there is a substantial deviation in temperature (over 10K) in certain regions of the cavity from the temperature in the bulk liquid. Moreover, as mentioned earlier, the cavitation dynamics are substantially altered by the reduction in temperature close to the throat region leading to the depression in vapor pressure and re-conversion of vapor back to liquid.
SUMMARY
In this paper, a wide array of valve systems were simulated utilizing a multi-element unstructured framework (CRUNCH CFD®) with embedded sub-models for cryogenic fluids and cavitation. The valve systems represented varying degrees of structural and physical complexity and covered major regimes of flow physics. The multi-element framework provided flexibility in generating meshes for complicated geometries, and in resolving and identifying instabilities associated with the operation of the valve systems. Furthermore, the “real fluids and cavitation” sub-models permitted simulation of physical phenomena pertaining to multi-phase flow dynamics dominant in the operation of venturi-type flow control elements. CRUNCH CFD® also proved to be an efficient tool for rapid turnaround of complex solutions. This efficiency was possible primarily because the numerical scheme permits large time steps, enhanced convergence and robust parallel execution of the flow solver.
DISTRIBUTION STATEMENT A: “Approved for public release; distribution is unlimited.” Contract Number: NAS13-03009, NASA Stennis Space Center.
Steady state simulations were carried out for the operation of the 10-inch cryogenic valve at different valve settings. The flow coefficient characteristics in this case were in very good agreement with both experimental results and calculations carried out at NASA Stennis Space Center. The simulations were also able to provide details of pressure losses in the seat region and give an account of the secondary flow regions that set up aft of the seat region at the wall and in the base region of the plug.
Analyses for a pressure regulator control valve were carried out with the multi-element philosophy. The pressure regulator valve is structurally very difficult to grid with conventional CFD multi-block structured (purely hexahedral) and unstructured (tetrahedral) methodologies. A multi-element grid consisting of hexahedral, tetrahedral, prismatic and pyramidal elements, was generated for the pressure regulator valve. The hexahedral cells were used to resolve the boundary layers in the feed channels, inlet and discharge ducts and gradients in the narrow clearances around the poppet. Tetrahedral and prismatic cells were mostly used in the valve housing and the buffer regions between the inlet/discharge ducts and the valve housing. The interfacing between the tetrahedral zones and the hexahedral blocks was provided by pyramidal cells. In this manner, the cell topology was tailored to the structural complexities of the valve body, leading to a well-resolved high quality grid.
Both steady and unsteady simulations of the pressure regulator valve were performed on the multi-element grid. The steady simulations revealed a rich variety of flow phenomena over a multitude of length scales. This included a jet like penetration of the flow through the throat region, secondary flow patterns in the feed channels and corner regions of the valve housing, and significant flow expansion in the buffer channels feeding the discharge duct and in the discharge duct. Furthermore, flow from the throat region of the valve impinges on the upper wall of the wall assembly and forms a dominant re-circulation pattern before discharging through the exhaust ducting. Our transient analyses were performed with a fixed plug setting and captured a dominant chatter with a 4 KHz frequency. This frequency was detected across seven different probe points located at different parts of the poppet. Through flow visualization of the simulations we were able to identify an axial mode as the source of the instability. The instability was generated due to tangential discharge of flow from the far end of the upper housing that was periodically cutting off the axial flow through the throat region. A closer investigation of the frequency content of the instability modes revealed most of the energy associated with the fundamental frequency 4043 Hz and its first harmonic. Furthermore, there was significant energy associated with a low frequency mode (around 250 Hz). This was an important finding since this mode can potentially induce structural vibrations.
Simulations were also carried out for the LOX cavitating venturi flow control valve utilizing the cavitation sub-model with cryogenic fluids capability. The simulations demonstrated that cavitation inception initiates in the throat region where the local pressure falls below the saturation vapor pressure corresponding to the bulk temperature. As the simulation evolves, the thermodynamic effects of cavitation become more pronounced leading to evaporative cooling near the cavity region. This results in a temperature depression, and consequently a depression in the saturation pressure at the leading edge of the cavity. These results are consistent with the findings of research carried out by Stahl and Stepanoff [8], Ruggeri and Moore [9], Hord [10] and Brennen [11]. Furthermore, our simulations reveal a vaporous mixture in the entire venturi cross-section just downstream of the throat. The vapor fraction through most of the cavity is less than 0.5 indicating a highly diffused cavity. Sarosdy and Acosta [12] have made similar observations of investigating of frothy, diffusive cavities consisting of many bubbles with Freon 113. Moreover, the mass flow through the venturi gets choked due to the presence of the vapor cloud near the throat of the venturi. Any variation in back pressure is not propagated to the inlet due to a substantial reduction in speed of sound through the vaporous cavity. The computed discharge coefficient compares reasonably well with the experimentally observed discharge coefficient.
DISTRIBUTION STATEMENT A: “Approved for public release; distribution is unlimited.” Contract Number: NAS13-03009, NASA Stennis Space Center.

ACKNOWLEDGEMENTS
We acknowledge funding for this work through a NASA Phase I SBIR, Contract Number NAS13-03009 funded by NASA Stennis Flight Center. Dr. Peter Sulyma was the technical monitor and the technical inputs by Dr. Russell Daines and Mr. Jody Woods are also greatly acknowledged.
REFERENCES
[1] Daines, R.L., Woods, J.L., and Sulyma, P.R., ``Progress in Valve Modeling at Stennis Space Center,'' Penn State Propulsion Engineering Research Center Fourteenth Annual Symposium, State College, Pennsylvania, December 2002.
[2] Hosangadi, A. and Ahuja, V., “A Generalized Multi-Phase Framework For Modeling Unsteady Cavitation Dynamics And Thermal Effects,” Paper No. AIAA-2003-4000, 33rd AIAA Fluid Dynamics Conference, Orlando, FL, Jun 23-26, 2003.
[3] Ahuja, V., Shipman, J.D., Arunajatesan, S., and Hosangadi, A., "Multi-Element Unstructured Methodology for Analysis of Turbomachinery Systems " Journal of Propulsion and Power, Vol. 19, No. 5, pp. 945-952, Sept-Oct 2003.
[4] Hosangadi, A., Lee, R.A., York, B.J., Sinha, N., and Dash, S.M., "Upwind Unstructured Scheme for Three-Dimensional Combusting Flows," Journal of Propulsion and Power, Vol. 12, No. 3, pp. 494-503, May-June 1996.
[5] Hosangadi, A., Lee, R.A., Cavallo, P.A., Sinha, N., and York, B.J., "Hybrid, Viscous, Unstructured Mesh Solver for Propulsive Applications," AIAA-98-3153, AIAA 34th JPC, Cleveland, OH, July 13-15, 1998.
[6] Cavallo, P.A., and Baker, T., “Efficient Delaunay-Based Solution Adaptation for Three-Dimensional Unstructured Meshes,” AIAA Paper No. 2000-0809, 38th AIAA Aerospace Sciences Meeting at Reno, NV, Jan 10-13, 2000.
[7] Daines, R.L., Woods, J.L., and Sulyma, P.R., ``Computation Analysis of Cryogenic Flow Through a Control Valve,'' FEDSM2003-45120 4th ASME_JSME Joint Fluids Engineering Conference, Honolulu, Hawaii, July 2003.
[8] Stahl, H.A., and Stepanoff, A.J., “Thermodynamic Aspects of Cavitation in Centrifugal Pumps,” ASME J. Basic Eng., Vol. 78, pp. 1691-1693, 1956.
[9] Ruggeri, S.R., and Moore, R.D., “Method For Prediction of Pump Cavitation Performance for Various Liquids, Liquid Temperature, and Rotation Speeds,” NASA TND-5292, 1969.
[10] Hord, J., “Cavitation In Liquid Cryogens,” NASA CR-2156, January 1973.
[11] Brennen, C.E., “The Dynamic Behavior and Compliance of a Stream of Cavitating Bubbles,” Journal of Fluids Engineering, pp. 533-542, Vol. 95, 1973.
DISTRIBUTION STATEMENT A: “Approved for public release; distribution is unlimited.” Contract Number: NAS13-03009, NASA Stennis Space Center.

[12] Sarosdy L.R. and Acosta¸A.J., “Note on Observations of Cavitation in Different Fluids,” Paper No. 60-WA-83, ASME Winter Annual Meeting, New York, Nov. 27- Dec. 2, 1960.
Figure 1. Pressure regulator valve geometry with the multi-element grid (shown along the symmetry plane) used to mesh the valve flowpath.
high aspect-ratio hex/tet in straight pipes hex blocks in seat region and convex corners prism layers on walls with ports and/or pipe connections
Grid Statistics 716,000 Hexahedra 838,989 Tets/Prisms/Pyramids
tetrahedra in the remaining volume quickly joins the disconnected topologies
Figure 2. Symmetry plane of the grid illustrating the multi-element mesh topology.
DISTRIBUTION STATEMENT A: “Approved for public release; distribution is unlimited.” Contract Number: NAS13-03009, NASA Stennis Space Center.

(a) (b)
(c)
Figure 3. Plots of (a) streamlines through the valve housing colored with Mach number illustrating the large recirculation region, (b) pressure contours on the poppet surface, and (c)
Mach number contours on the symmetry plane.
(a)
(b)
(c)
Figure 4. Plots of the transient solution showing (a) location of probe points on the poppet, (b) pressure history for the seven points, and (c) frequency spectrum indicating the dominant
instability modes.
DISTRIBUTION STATEMENT A: “Approved for public release; distribution is unlimited.” Contract Number: NAS13-03009, NASA Stennis Space Center.
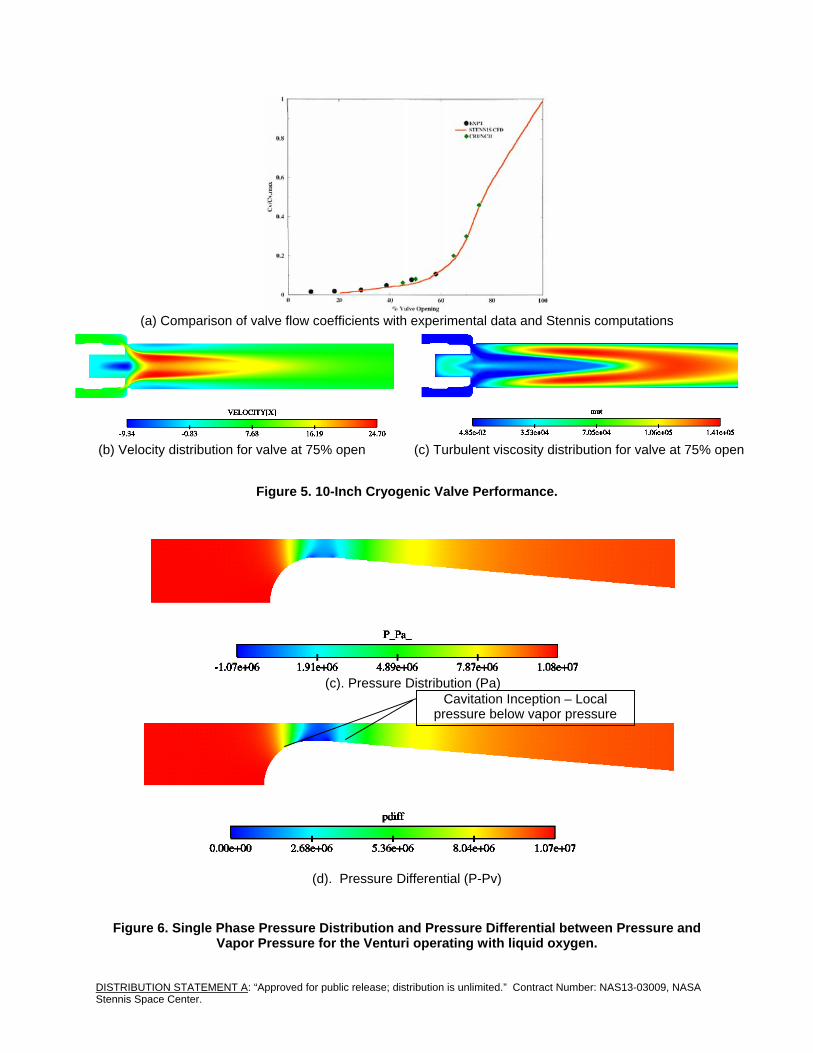
(a) Comparison of valve flow coefficients with experimental data and Stennis computations
(b) Velocity distribution for valve at 75% open (c) Turbulent viscosity distribution for valve at 75% open
Figure 5. 10-Inch Cryogenic Valve Performance.
(c). Pressure Distribution (Pa)
Cavitation Inception – Local pressure below vapor pressure
(d). Pressure Differential (P-Pv)
Figure 6. Single Phase Pressure Distribution and Pressure Differential between Pressure and Vapor Pressure for the Venturi operating with liquid oxygen.
DISTRIBUTION STATEMENT A: “Approved for public release; distribution is unlimited.” Contract Number: NAS13-03009, NASA Stennis Space Center.

Vapor Void Fraction
Figure 7. Vapor Void Fraction in Cavitating Venturi Indicating Vapor Throughout the Cross-Section of the Venturi.
Pressure waves aft of cavity Pressure spike due to condensation – decrease
in local vapor pressure due to reduction in
temperature causes vapor to convert back to
liquid
Condensation “Shock”
(a)
Local velocity increases due to change in density
(b).
(c).
Figure 8. Pressure Distribution, Axial Velocity and Temperature Distribution in the Cavitating Venturi.
DISTRIBUTION STATEMENT A: “Approved for public release; distribution is unlimited.” Contract Number: NAS13-03009, NASA Stennis Space Center.