
Multi Criteria Sun Calculation House
246
A Mul t i-Cri t er i a Dec i s i o n -Mak in g Met h o d f o r Solar Buil din g Design by Inger Andresen Thesis submitted in partial fulfillment of the requirements for the degree of Doktor Ingeniør at the Norwegian University of Science and Technology Faculty of Architecture, Planning and Fine Arts Department of Building Technology February 2000
Transcript of Multi Criteria Sun Calculation House

8/13/2019 Multi Criteria Sun Calculation House
http://slidepdf.com/reader/full/multi-criteria-sun-calculation-house 1/246
A Multi-Criteria Decision-Making Method for Solar Building Design
by
Inger Andresen
Thesis submitted in partial fulfillment of the requirements for the degree of
Doktor Ingeniør
at
the Norwegian University of Science and Technology
Faculty of Architecture, Planning and Fine ArtsDepartment of Building Technology
February 2000

8/13/2019 Multi Criteria Sun Calculation House
http://slidepdf.com/reader/full/multi-criteria-sun-calculation-house 2/246
ii
Foreword
Utilization of solar energy in buildings have been my main professional interest and
field of work since I got my Masters’ degree in Building Energy Systems at theUniversity of Colorado in 1991. During the years prior to my Ph.D. work I have done
numerous computer simulations and investigations of building integrated solar energysystems in order to evaluate their energy efficiency and cost-effectiveness. I have alsohad the pleasure to see different types of solar systems slowly emerging from more or
less stand-alone systems to becoming really integrated parts of the building. In particular, facade-integrated photovoltaic systems have had an incredible progressduring these years, especially for office buildings. Also, many different types of
active and passive solar thermal strategies, as well as daylighting systems areinteresting for future office buildings. Solar facades of office buildings have to fulfill
a wide range of criteria. They should not only be energy- and cost-efficient, theyshould also provide comfort, be “environmentally friendly”, have a nice appearance,etc.
Looking at the wide range of different solar systems for integration into facades, the
following question appeared interesting: What would be the optimal combination of systems and integration strategies for utilization of solar energy in an office building,given certain constraints? The clue was to find systems that would not only be optimal
with respect to energy and economy, but also with respect to other important designissues, such as comfort, environmental loading and aesthetics. Therefore, the initial
scope for this thesis was to search for a strategy or a combination of strategies thatwould best fulfill all these criteria. However, as I started to really define the work of the thesis, I realized that there could never be such a thing as an optimal building
integrated solar energy system. So many things are different from project to project,and moreover, the preferences of the clients and other decision-makers cannot be
generalized. Therefore, my strategy changed from that of technical optimization tofinding a strategy of how to account for all the different optimization criteria and
preferences.
This viewpoint led me into fields of expertise that had so far been quite unknown to
me. I have investigated strategies from fields ranging from behavioral sciences, psycho-physics, and management science to design theory and economics. Thechallenge was to combine the theories of these fields with my knowledge of solar
building design, and apply it to the task of the thesis. As such, I felt that my work was
deviating quite a lot from the conventional doctoral thesis, i.e. having a much wider

8/13/2019 Multi Criteria Sun Calculation House
http://slidepdf.com/reader/full/multi-criteria-sun-calculation-house 3/246
iii
profile. I must say that the work has not been very streamlined, and quite demanding,
but definitely very interesting and fun.
I wish to express my gratitude to my advisor, Professor Anne Grete Hestnes, for giving me the perfect amount of guidance and freedom during my study.
Special thanks go to Professor Øyvin Skarstein, who guided me into the field of decision analysis and helped me come through it with great joy and pleasure. Without
him, this thesis would probably have been quite different, and I believe that doing mywork would have been much less fascinating.
Also, thanks are due to Professor Øyvind Aschehoug, for trying to keep me down toearth, and for making it all possible by arranging the financial support.
During my Ph.D. work I was fortunate to be involved in two international projectsthat dealt with related topics. One was the EU project Amorphous Silicon
Photovoltaic in Commercial Buildings, where I was involved in the work withinsubtask 4.1: Optimization and Trade-Off . The financial support for participation in
this project, as well as for the entire Ph.D. work was provided by Hydro AluminumMetal Products (HAMP). I wish to express my gratitude to HAMP, and especially toMr. Einar Wathne, for giving me this opportunity and for taking such good care of
Ph.D. students. The other project was the IEA Solar Heating and Cooling Programme,Task 23: Optimization of Solar Energy Use in Large Buildings. In this project I was
mainly involved in subtask C3: Methods and Tools for Trade-Off Analysis. Myappreciation goes to all the participants of this project who provided constructivefeedback and interesting discussions that were useful for my work. Special thanks go
to Dr. Doug Balcomb of NREL, Colorado, to Pekka Houvila of VTT, Helsinki, and toMr. Nils Larsson of CANMET, Ottawa, for useful discussions and information
exchange. Finally, thanks are due to Anne Grete Hestnes for giving me theopportunity to participate in these projects, thus taking me out of the office into aninteresting international arena.
I would also like to thank the willing participants of my case studies, especially Mr.
Per Monsen of GASA, Oslo, Dr. Anne Gunnarshaug Lien of SINTEF, Trondheim,and Dr. Ida Bryn of Erichsen & Horgen, Oslo.
Finally, I would like to thank my colleagues at SINTEF Architecture and Building
Technology and Department of Building Technology, NTNU, for providing the perfect social environment for my work, for their care and cheerful support.
Last, but not least, I thank my husband, Jan Ove, for always being there, and my little
daughter, Ingvild for bringing my thoughts away from the “serious” work and into aworld of bright sunshine.

8/13/2019 Multi Criteria Sun Calculation House
http://slidepdf.com/reader/full/multi-criteria-sun-calculation-house 4/246
iv
Summary
The background for this thesis is based on the assumption that the success of solar
buildings relies on the assessment and integration of all the different designobjectives, called criteria. These criteria are often quite complicated to deal with (e.g.environmental loading) and may be conflicting. The different design issues and the
many different available energy technologies call for different areas of expertise to beinvolved in the design of solar buildings. This makes it difficult to evaluate the overall
“goodness” of a proposed design solution. Also, the communication between design professionals and the client becomes complicated.
The goal of this work was therefore to produce a means for the design team andclients to be able to better understand and handle holistic solar design. A first
hypothesis was that a structured approach for evaluating design alternatives might bea means to this end.
In order to specify an approach that would fit into the building design process, ananalysis of design process theory and building design practice was carried out
(chapter 2). Also, special solar design issues were investigated. This analysis resultedin the following conclusions:
• Most building design processes start out with no clearly defined goals or criteria
of success. The design criteria are refined and discovered through evaluation and
feedback on alternative design proposals.
• Design involves a lot of subjective value judgements, and decisions are often
based on experience, “gut feeling”, or intuition. Design options are evaluated
based on quantitative and qualitative performance measures. There exists noobjective optimal design solution.
• It is possible to identify some main activities that are common to most design
processes. These are categorized into 4 main tasks: problem formulation,
generation of alternatives, performance prediction and evaluation. The activitiesare very much overlapping and dependent on each other.
• Decision-making in design happens mainly through evaluation of proposed designsolutions.

8/13/2019 Multi Criteria Sun Calculation House
http://slidepdf.com/reader/full/multi-criteria-sun-calculation-house 5/246
v
• Close cooperation between the design team and the client is imperative for the
success of solar design. It is important that solar energy considerations are
included in the early design stages because the decisions taken here are essentialfor achieving a well-integrated solar energy system.
This led to the conclusion that a structured approach for evaluation of alternativedesign options is useful and important, but it has to be seen in relation to the other
design task, i.e. put into a framework.
The next task was therefore to search for useful ideas for structuring evaluation in theearly design stage. The search was concentrated on the building industry and the fieldof decision analysis. The field of decision analysis was included because evaluation is
an important task within this field.
The result of the search was that some structured approaches to evaluation were found
within environmental planning and the emerging field of “green building” assessment.These methods resembled somewhat the Multi-Criteria Decision-Making (MCDM)
methods that were found within the field of decision analysis.
The next task was then to evaluate these methods with respect to use in building andsolar systems design. This evaluation was based on the findings in chapter 2 about thedesign process characteristics.
The first conclusion was that a structured side-by-side comparison of alternative
solutions seemed to be essential to evaluation. However, a simple side-by-sidecomparison of alternatives with respect to the different criteria, will in most cases not
be sufficient to reveal the best alternative. This is due to the fact that the goals are
often conflicting or apparently incommensurate. Therefore, some sort of aggregationof the performance measures into an overall measure of “goodness”, is useful. From
the survey of multi-criteria evaluation approaches, the Simple Additive Weighting(SAW) approach appeared to be most suitable. Various applications of SAWapproaches were found in the “green building” and environmental impact assessment
tools. The SAW-based methods were also found to be the most simple and intuitive of the MCDM approaches. The main advantage of the SAW model is that it makes value
judgements explicit, thereby acting to increase mutual understanding among the
design team participants and the client about what is important to focus on. It is also
important that both qualitative and quantitative values can be incorporated in themodel. The model is also quite flexible, thus it can be tailored to individual needs. A problem of the method is that it is quite difficult to create commensurate measurementscales and elicit representative weights. Therefore, scaling and weighting techniques
were investigated in more detail. It was concluded that it might be possible for thedesign participants to create scales and weights to be used in an evaluation based on a
SAW approach that is adapted for the building design process. However, appropriateguidance is needed, especially concerning how to create commensurate measurementscales.
A structured evaluation approach based on the SAW method was then developed and
put into a building design framework. The framework was separated into 4 parts, problem formulation, generation of alternatives, performance prediction and

8/13/2019 Multi Criteria Sun Calculation House
http://slidepdf.com/reader/full/multi-criteria-sun-calculation-house 6/246
vi
evaluation. Although the main emphasis is placed on the evaluation part, the other
tasks are included since the different tasks are very much interconnected andoverlapping. Three different approaches to creating measurement scales are proposed.
The first approach is an open approach relying on the participants to create their ownmeasurement scales, given certain guidelines, and including consistency checks. The
second approach involves using linear measurement scales. The third approachinvolves defining a special type of logarithmic scales based on qualitativecategorization.
The evaluation approaches were then exemplified and tested in 3 different building projects. The first case was a project that aimed at designing an a-Si PV facade
concept for office buildings. The participants defined their own measurement scales.The second case project was a test of the evaluation approach in a meeting between
researchers and practitioners working on the preliminary design of a school building.In this case, the participants used pre-defined linear measurement scales. The thirdcase included an implementation of the multi-criteria evaluation approach in an
ongoing design project, using the logarithmic type scales.
The test cases suggested that the multi-criteria decision-making framework helpedorganize the design work and facilitated carefully balanced and integratedevaluations. It provided a common reference for the design team to synthesize all
judgements and values in the early design, and promoted documentation of thechoices. However, further testing is needed in order to streamline the approach and to
confirm whether the framework is an efficient means to promote holistic solar design.
8/13/2019 Multi Criteria Sun Calculation House
http://slidepdf.com/reader/full/multi-criteria-sun-calculation-house 7/246
1
Contents
1 INTRODUCTION.............................................................................................................................. 3
1.1 BACKGROUND ............................................................................................................................. 31.2 OBJECTIVES ................................................................................................................................. 51.3 LIMITATIONS ............................................................................................................................... 61.4 CONTENT AND SCIENTIFIC METHOD............................................................................................ 7
2 THE DESIGN PROCESS ................................................................................................................. 8
2.1 INTRODUCTION............................................................................................................................ 82.2 BUILDING PROCESS STAGES ........................................................................................................ 92.3 THE DESIGN PROCESS ............................................................................................................... 122.4 PROBLEM SOLVING AND DECISION MAKING ............................................................................. 162.5 THE NATURE OF THE BUILDING INDUSTRY................................................................................ 252.6 SOLAR ENERGY SYSTEMS AND DESIGN ..................................................................................... 272.7 SOLAR BUILDING DESIGN.......................................................................................................... 352.8 SOLAR DESIGN TOOLS............................................................................................................... 382.9 CONCLUSIONS ........................................................................................................................... 46
3 PROBLEM FORMULATION........................................................................................................ 50
3.1 INTRODUCTION.......................................................................................................................... 50
3.2 VALUE FOCUSED THINKING ....................................................................................................... 503.3 STAKEHOLDERS’ VALUES IN A LIFE CYCLE PERSPECTIVE........................................................... 573.4 TOOLS AND METHODS FOR ORGANIZING AND SELECTING PERFORMANCE CRITERIA ............. 583.5 CRITERIA IN HIERARCHIES ........................................................................................................ 683.6 CONCLUSIONS ........................................................................................................................... 71
4 GENERATION OF ALTERNATIVES ......................................................................................... 72
4.1 TECHNIQUES FOR GENERATING ALTERNATIVES ......................................................................... 734.2 CONCLUSIONS ........................................................................................................................... 76
5 PERFORMANCE PREDICTION.................................................................................................. 77
5.1 INTRODUCTION.......................................................................................................................... 775.2 OPTIMIZING AND SATISFICING................................................................................................... 77
5.3 TOOLS AND METHODS FOR PERFORMANCE PREDICTION ........................................................... 825.4 PRESENTATION OF RESULTS ...................................................................................................... 835.5 CONCLUSIONS ........................................................................................................................... 84
6 PERFORMANCE EVALUATION................................................................................................ 86
6.1 INTRODUCTION.......................................................................................................................... 866.2 A SURVEY OF EVALUATION METHODS USED IN THE BUILDING INDUSTRY AND ENVIRONMENTAL
ANALYSIS........................................................................................................................................... 876.3 MCDM METHODS................................................................................................................... 1056.4 UNCERTAINTY, R ISK, AND FUZZINESS .................................................................................... 1176.5 PRELIMINARY RECOMMENDATIONS FOR MULTI-CRITERIA EVALUATION OF SOLAR DESIGN
ALTERNATIVES ................................................................................................................................ 1236.6 MEASURING ATTRIBUTES ........................................................................................................ 1246.7 WEIGHTING ............................................................................................................................. 1386.8 CONCLUSIONS ......................................................................................................................... 146

8/13/2019 Multi Criteria Sun Calculation House
http://slidepdf.com/reader/full/multi-criteria-sun-calculation-house 8/246
2
7 A FRAMEWORK FOR MULTI-CRITERIA DECISION-MAKING IN SOLAR DESIGN . 149
7.1 INTRODUCTION........................................................................................................................ 1497.2 LINE OF ARGUMENT ................................................................................................................ 1497.3 PROBLEM FORMULATION......................................................................................................... 1527.4 GENERATION OF ALTERNATIVES ............................................................................................. 1537.5 PERFORMANCE PREDICTION .................................................................................................... 1547.6 PERFORMANCE EVALUATION .................................................................................................. 1557.7 THE FRAMEWORK.................................................................................................................... 157
8 INTRODUCTION TO CASE STUDIES .............................................................. ........................ 168
9 CASE 1............................................................................................................................................. 169
9.1 INTRODUCTION........................................................................................................................ 1699.2 PROBLEM FORMULATION ........................................................................................................ 1709.3 CRITERIA USED ....................................................................................................................... 1719.4 GENERATION OF ALTERNATIVES.............................................................................................. 1839.5 PERFORMANCE PREDICTION .................................................................................................... 1849.6 EVALUATION ........................................................................................................................... 1919.7 SENSITIVITY ANALYSIS ........................................................................................................... 1939.8 LESSONS LEARNED.................................................................................................................. 196
10 CASE 2........................................................................................................................................... 197
10.1 INTRODUCTION.................................................................................................................... 19710.2 THE PROCESS ...................................................................................................................... 19710.3 LESSONS LEARNED .............................................................................................................. 203
11 CASE 3........................................................................................................................................... 205
11.1 INTRODUCTION.................................................................................................................... 20511.2 THE PROCESS ...................................................................................................................... 20811.3 LESSONS LEARNED .............................................................................................................. 215
12 CONCLUSIONS ............................................................. .......................................................... .... 217
DEFINITIONS................................................................................................................................... 223
REFERENCES................................................................................................................................... 225
APPENDIX A..................................................................................................................................... 241

8/13/2019 Multi Criteria Sun Calculation House
http://slidepdf.com/reader/full/multi-criteria-sun-calculation-house 9/246
3
1 Introduction
1.1 Background
There is a wide range of available solar technologies and design strategies that mayquite easily reduce the energy consumption of buildings by more than 50% comparedto conventional designs. In spite of this, it is a fact that solar and low energy measuresin buildings have not gained widespread use. My hypothesis is that this is mainly dueto the lack of three factors: economics, knowledge and integrated design:
EconomicsThe installations are capital intensive and the energy prices have been too low for arapid return of investment. The common economic models tend to emphasize theinvestment cost and put little weight of the returns earned in the future. Very often,the added investment cost due to a solar strategy are viewed only as an isolatedexpense, and not put into the total economic framework. The cost of energy foroperating buildings is not a significant part of the total running costs of anorganization or company. Cleaning and O&M (operation and maintenance) costs, forinstance, are typically significantly higher than the energy costs, (Bjørberg, Eide et al.1993), (Morton and Jaggar 1995), (Flanagan, Norman et al. 1989). Compared to the
cost of staff (wages, social, etc.), all the “technical” costs are quite insignificant. Thus,the focus on the high investment costs seems to be a serious obstacle to widespreaduse of solar and low energy systems.
KnowledgeThere is generally too little knowledge about how solar and energy saving strategieswork, and how to successfully integrate them into buildings.
Integrated (holistic) designBuilding design involves the consideration of a wide range of complex issues,
requiring expertise within fields ranging from structural engineering andenvironmental sciences, to architectural and psychosocial issues. An integratedapproach to building design seeks to incorporate all the important aspects in a holisticsynthesis. It views the individual systems not as isolated entities, but closelyconnected and interacting with the rest of the building. In an integrated approach, allthe different design criteria need to be focused on simultaneously and traded off against each other in order to optimize the “overall goodness” of the design. Khemlaniand Kalay describe the problems of integrated design as follows (Khemlani and Kalay1997):
“Buildings must fulfill a host of diverse criteria, abide by innumerable codes and
rules, and an ever-increasing list of constraints. A direct consequence of thisincreased complexity has been an enormous growth in the number of diverse

8/13/2019 Multi Criteria Sun Calculation House
http://slidepdf.com/reader/full/multi-criteria-sun-calculation-house 10/246
4
professionals who need to be involved in the design and construction of abuilding…..Specialization makes the already involved process of building design evenmore intricate and time-consuming. All the individual design and constructionspecialists do not work together on a design. Not only are they physically located indifferent places, they are also not usually working on the same design model….. Over
and above the communication issue, however, there is yet another serious problemthat specialization brings in its wake. It is very difficult, if not impossible, for thespecialists to have a clear vision of the “overall goodness” of the project. Due totheir limited time limits, each specialist tries to optimize the design for his/her owndiscipline, which quite conceivably may come at the expense of other disciplines.”
Unfortunately, solar and energy saving measures have often been implemented and“optimized” without taking the whole building performance into account. The“optimization” procedures employed usually only include energy and economicperformances, at the most. There are numerous examples of how comfort issues,environmental issues and aesthetics have not been properly valued in the design of
energy efficient buildings. The strong focus on energy efficiency in the 1970’sdemonstrated that an emphasis on one performance area (energy) is likely to result infailure in other performance areas, such as air quality. In the 90’s the pendulum hasswung the other way; we now see a strong emphasis on indoor air quality. In Norway,this has brought forward requirements of large supplies of fresh air volumes, whichnaturally leads to an increase in the energy consumption. These are typical examplesof the lack of holistic thinking. In general, people tend to overemphasize issues thatcan be modeled numerically. We spend a lot of time calculating the daylight factors ina room, but tend to forget that these figures really tell us very little about the sensationof the lighting quality in the room. There is no use spending a lot of time on detailedcalculations of aspects that are either of marginal importance to the stakeholders 1, orhave little effect on the overall value of a design.
In a recent article about low energy building design, Dr. J. Douglas Balcomb puts theissue of energy efficiency in perspective (Balcomb 1999):
“Among design strategies, daylighting – the use of natural light to replace artificiallight – fills a unique niche. It stands alone as the most important design issue. Because daylighting affects the form and layout of the building, the decision to use it must be made early in the design process. Arguably, the most important reasons todaylight a building are, in decreasing order, to improve the aesthetics of the indoor
environment; enhance the productivity of the occupants; decrease peak electric loads;reduce emissions of pollutants from power plants, including CO2 , SO2 and NO x; and save on energy and operating costs …………….. So, if the focus is only on savingenergy, we miss the most critical factors.”
A solar energy building should not be designed primarily to save energy, but toprovide a comfortable and pleasing place for people to live or work in, while makinga limited impact on our natural environment. Buildings have a long service life thatinvolves many different participants or stakeholders: designers, builders, investors,users, maintenance personnel, etc. An integrated design approach includes a
1
A stakeholder of a business is defined as any individual or group who has an interest in the businessbecause he can effect, or is affected by the activities of the business. The stakeholders in buildingprojects will be described in section 3.3.

8/13/2019 Multi Criteria Sun Calculation House
http://slidepdf.com/reader/full/multi-criteria-sun-calculation-house 11/246
5
consideration of the interaction between the building, it’s different stakeholders, andthe environment in a life cycle perspective. There is much disagreement amongprofessionals, users and the general public about what constitutes a “good building”.Especially when it comes to issues like aesthetics and “environmental friendliness”,the disagreement and uncertainties are large. In our increasingly complex world of
science and technology, there is a growing skepticism to the technical professions, asdescribed by Hugh J. Miser:
Since the early 1960s, the professions have faced a growing crisis of confidence and legitimacy. Artifacts of science and technology have exhibited unhappy propertiesabout which their designers have not forewarned the public: Large industrial and energy plants generate acid rain at great distances; nuclear energy plants seem not as safe as the public had thought them to be; safety in the technical workplace hasbecome a public issue. Professionally designed solutions to public problems have had important unintended consequences, sometimes worse than the problems themselves.Widely publicized disagreements among professionals on possible approaches to
public problems have undermined the confidence in the knowledge bases for many of the advocated approaches (Miser 1988).
During the design process, a lot of choices have to be made based on more or less“hard data”, and many judgements and value trade-offs have to be carried out. If theprofessionals are really serious about making good buildings and keeping theircredibility, they need to cooperate in such a way that the overall “goodness” of thedesign can be clearly understood. Only in this way can we achieve an integrateddesign approach.
To conclude, the main hypothesis of the thesis is that good façade-integrated solar energy systems are a result of a holistic, multicriteria design process and will gain from some sort of formal, multi-criteria evaluation approach.
1.2 Objectives
The objective of the work is to develop a method for multi-criteria decision-making insolar design that will be a means to achieve more integrated design. The main goals of the method should be:
• to help find what design issues that are important to focus on
• to help synthesize the design issues in order to evaluate the overall “goodness” of the design solutions
• to promote documentation of the choices
The design criteria should include both quantitative and qualitative issues, such asenvironmental loading, resource use, comfort, architectural quality and economics.The method should help the design team and the client (defined below) to find themost efficient way through the myriad of different solar design strategies while takingcare of several different design objectives.
8/13/2019 Multi Criteria Sun Calculation House
http://slidepdf.com/reader/full/multi-criteria-sun-calculation-house 12/246
6
The early design phase of a building project is especially important. The main factorsthat determine the buildings’ effectiveness with respect to utilization of solar energyare determined in the briefing and concept/scheme phases. For example, theorientation, zoning, and façade layout are more or less determined in the schematicdesign. Therefore, the main focus of the method will be on the early design phase.
However, if possible, the method should also be useable in later design stages.
The method and guidelines developed in this work are primarily aimed towards thedifferent participants of the design team and the client. The construction of the designteam may differ from project to project, but essentially it consists of a design managerand experts from different design professions such as architects, HVAC and electricalengineers, construction engineers. The word “client” is used to mean the individual ororganization that is paying for the design and construction project. The methodologyshould mainly be a means to help communication between the different members of the design team, and between the design team and the client. However, the methodshould also be directed towards the other stakeholders of the building project, e.g.
future occupants, government agencies, or “neighbors”, at least as a means of documenting decisions. Since the design team manager is responsible for theintegration of the work of the design team, the overall responsibility for implementingthe method in the design process would naturally belong to him.
It is my hope that through the use of this method for multicriteria solar design, bettersolar buildings will emerge. The approach should help the decision-makers to keep abalanced view of the design work and prevent them from being swept away by onesingle performance measure. Another valuable contribution that the thesis could makeis that of increased knowledge transfer. I hope it would help each member of thedesign team (from the different design professions) to understand and value the work of the other members, so that they could create buildings that better satisfy the needsof the stakeholders.
I realize that in order to achieve fully integrated solar design there is still a long wayto go. I do not believe that this thesis will solve the entire problem. However, I hopethat it will challenge the established way of designing buildings and that it will be oneof the steps that will help ease the way towards integrated solar design.
1.3 Limitations
The methodology will be illustrated for commercial buildings. These are selectedbecause they are complex buildings (employ many different technologies andstrategies), they consume a significant amount of energy, and they are very visible toa large number of people. However, the main part of the thesis will be of general usefor building design.
Also, the methodology will only be illustrated for buildings in Norway. However, themain principles would most likely also be valid for other countries.

8/13/2019 Multi Criteria Sun Calculation House
http://slidepdf.com/reader/full/multi-criteria-sun-calculation-house 13/246
7
1.4 Content and Scientific Method
The work within this thesis has been organized as follows:
1. Investigation of how building design is carried out in general, and solar design inparticular. This is based on literature studies of design theory, design process casestories, and design tools (chapter 2).
2. Evaluation of the results in order to identify what design process characteristicshave implications for a multicriteria design method (chapter 2).
3. Further investigation and evaluation of the different design tasks in order to putthem into the framework of multicriteria solar design (chapters 3, 4, and 5).
4. Survey of methods for multicriteria evaluation used within the building industryand the fields of decision analysis and environmental impact analysis. Evaluatemethods and conclude which aspects are relevant with respect to use within thisframework, based on the findings of points 1-4 (chapter 6).
5. Development of a method for multicriteria decision-making based on the findingsof points 1-6 (chapter 7).
6. Testing of method in case studies of commercial building projects in Norway(chapters 8, 9, 10, and 11).
7. Conclusions and refinement of the method based on test results (chapter 12).

8/13/2019 Multi Criteria Sun Calculation House
http://slidepdf.com/reader/full/multi-criteria-sun-calculation-house 14/246
8
2 The Design Process
2.1 Introduction
In order to make a method for multicriteria solar design that fits into the designprocess, it is helpful to understand how building design is carried out, and solar designin particular. It may also be useful to take a wider look at design approaches ingeneral. Hence, this chapter includes an overview of how building design is carried
out and described. It also investigates some general design and decision-makingapproaches. Finally, it describes the special characteristics of solar design.
Section 2.2 gives a brief description of building process stages, i.e. how the designevolves and what tasks are carried out.
Section 2.3 deals with design theory. It includes a literature survey of how design hasbeen described by different authors, i.e. how designers work.
Section 2.4 broadens the view by looking at problem solving and decision-makingtechniques in general. The substance of this chapter is acquired from other areas such
as product design, operations research, economics, management and policy analysis.Two fields of study that were found to be of special interest for the work in this thesiswere systems analysis and systems engineering.
In section 2.5, the special characteristics of the building industry are reviewed in orderto identify important constraints for the development of a multicriteria designapproach.
Section 2.6 gives an introduction to solar energy systems, briefly explaining the mainstrategies. Emphasis is placed on building integration issues.
In section 2.7, typical characteristics of solar design processes are described. This ismainly based on the results from an international research project where several casestories from actual building projects have been documented.
In section 2.8, common solar design tools are described. These include designhandbooks, simple calculation methods, and computer simulation programs. Thedescription is very brief, including short mentions of central design tools and theirmain contents. However, two new computer simulation tools are described in moredetail because they include elements that are very interesting for the work in thisthesis.

8/13/2019 Multi Criteria Sun Calculation House
http://slidepdf.com/reader/full/multi-criteria-sun-calculation-house 15/246
9
Section 2.9 summarizes the findings of chapter 2 and points out what might beworthwhile to focus on when developing a framework for multicriteria solar design.
2.2 Building Process StagesIn the building industry, it is common to split the designprocess into separate stages. Usually, 3 main stages areidentified: brief , concept/scheme, and engineering (detailed design). Table 2-1 shows a typical description of the stagesin the design and construction processes.
Table 2-1. Stages in the design and construction processes
Main work stages Tasks
Brief(programming) Statement of needBrief developmentConcept & schemedesign
Feasibility studiesConcept (schematic) designDesign development
Engineering(detailed design)
Detailed designProduction informationBill of quantities
Procurement Tender actionProject planning
Construction Operations on siteCompletion Commissioning and hand-over
The first step is to formulate the problem, the needs and requirements of the client,and to establish a set of criteria that will form the basis for assessing and establishingthe need for the building. These may include functional specifications, timingrequirements and priorities. This is followed by a description of the building’sintended function.
The statement of need is translated into a plan with space requirements. A moreprecise definition of the functional and technical requirements is then developed.From this, a definition of the project and reliable estimates of cost and time can beproduced. Donna P. Duerk (Duerk 1993) has presented a model of issue-basedprogramming that shows the evolution of design concepts based on facts, issues andvalues, to create goals and performance requirements for the design:
The 6 phases of a design project:
1. Enthusiasm2. Disillusionment3. Panic4. Search for the guilty5. Punishment of the innocent6. Praise of the non-participants

8/13/2019 Multi Criteria Sun Calculation House
http://slidepdf.com/reader/full/multi-criteria-sun-calculation-house 16/246
10
Figure 2-1. A model of schematic design programming, (Duerk 1993).
The concept and scheme phases include evaluation of different alternative designs.Factors that are evaluated may include:
• site layout• plans, use of space, communications
• elevations, façade design
• principles for structure, acoustics, safety
• principles for mechanical and electrical services
• principles for material use, quality
A more detailed cost and time plan is also presented in this phase. The different stagesin the design process may be more or less overlapping in time, i.e. part of thebriefing/and programming may be going on after the design work has begun.
The listing of different stages indicates a linear model of the design process. Thislinearity can definitely be questioned. It is probable that the designer thinks morefreely across and around the boundaries of a problem. A complex cyclic model istherefore more realistic and representative of the process, see Figure 2-2. There aretwo parts to this model:
• the iteration and evaluation within each part
• the iteration and evaluation between parts
At any point it may be necessary to move to another part and evaluate it to understand
the original problem. The process is one of continually cycling between and withinthe part of the evaluation. In practice this tends to fall into three stages: preliminaryevaluation, probable solution and final solution.
If this interactive and reflective approach to design is typical, then it makes amethodical and analytical approach difficult to adopt. This is because the process isdifficult to specify in advance and the evaluation against many criteria is likely to leadthe designer in unexpected directions.

8/13/2019 Multi Criteria Sun Calculation House
http://slidepdf.com/reader/full/multi-criteria-sun-calculation-house 17/246
11
4
1
2
3
3
4
1
2
2
3
4
1 4
1
2
3
Problem Action
What makes them different?
Where do we go from here?
What are the alternative solutions?
A set of comparisons and references
A decision about action and policyA definition of the problem
A r ange of alternative solutions
Figure 2-2. The ”continuous whirling process” model of design, (Gray, Hughes et al. 1994).
The building process stages may also be illustrated in a total life cycle perspective,including not only the design and construction phases, but also use and operation,changes and retrofits, and demolition. Figure 2-3 shows a cyclic life cycle modelindicating that the different phases may occur many times during the lifetime of abuilding. Since important benefits of solar design appear in a long time frame, the lifecycle perspective is especially important.
RetrofitMajor upgradesNew
building
Demolition
Programmingand design
Construction
Operation, maintenanceand use
Minor upgrades,changes
Operation, maintenanceand use
Assessvalue Value/use criteria
not met!
Figure 2-3. The life cycle of a building. (By courtesy of Siri Blakstad, 1997, Faculty of Architecture, Norwegian University of Science and Technology).
8/13/2019 Multi Criteria Sun Calculation House
http://slidepdf.com/reader/full/multi-criteria-sun-calculation-house 18/246
12
2.3 The Design Process
In order to prescribe a methodology that fits smoothly into the design process, it isuseful to understand the methods and rules that design is governed by. Although
many attempts to describe the design process have been made, there is no consensusor general theory about how design is handled.
The different views on design methodology have been classified into threegenerations, (Lundequist 1992; Lundequist 1998):
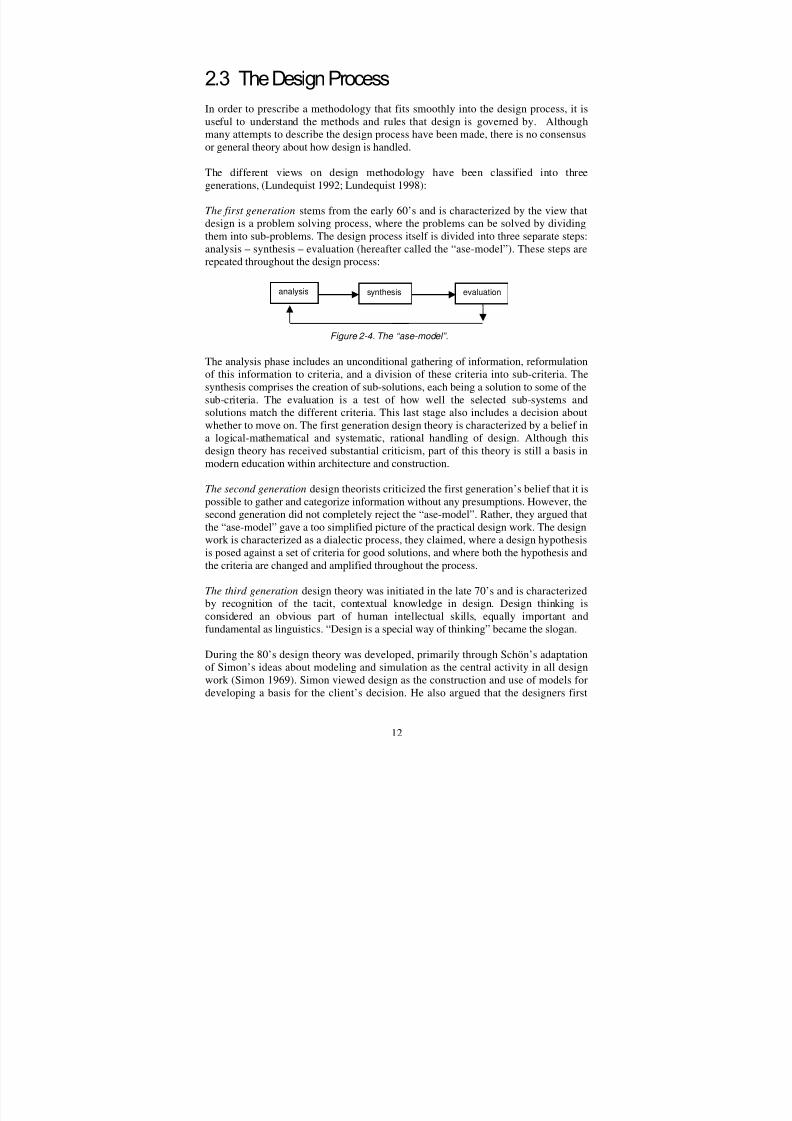
The first generation stems from the early 60’s and is characterized by the view thatdesign is a problem solving process, where the problems can be solved by dividingthem into sub-problems. The design process itself is divided into three separate steps:analysis – synthesis – evaluation (hereafter called the “ase-model”). These steps arerepeated throughout the design process:
The analysis phase includes an unconditional gathering of information, reformulationof this information to criteria, and a division of these criteria into sub-criteria. Thesynthesis comprises the creation of sub-solutions, each being a solution to some of thesub-criteria. The evaluation is a test of how well the selected sub-systems and
solutions match the different criteria. This last stage also includes a decision aboutwhether to move on. The first generation design theory is characterized by a belief ina logical-mathematical and systematic, rational handling of design. Although thisdesign theory has received substantial criticism, part of this theory is still a basis inmodern education within architecture and construction.
The second generation design theorists criticized the first generation’s belief that it ispossible to gather and categorize information without any presumptions. However, thesecond generation did not completely reject the “ase-model”. Rather, they argued thatthe “ase-model” gave a too simplified picture of the practical design work. The designwork is characterized as a dialectic process, they claimed, where a design hypothesis
is posed against a set of criteria for good solutions, and where both the hypothesis andthe criteria are changed and amplified throughout the process.
The third generation design theory was initiated in the late 70’s and is characterizedby recognition of the tacit, contextual knowledge in design. Design thinking isconsidered an obvious part of human intellectual skills, equally important andfundamental as linguistics. “Design is a special way of thinking” became the slogan.
During the 80’s design theory was developed, primarily through Schön’s adaptationof Simon’s ideas about modeling and simulation as the central activity in all designwork (Simon 1969). Simon viewed design as the construction and use of models fordeveloping a basis for the client’s decision. He also argued that the designers first
analysis synthesis evaluation
Figure 2-4. The “ase-model”.
8/13/2019 Multi Criteria Sun Calculation House
http://slidepdf.com/reader/full/multi-criteria-sun-calculation-house 19/246
13
generate a set of alternatives and then test them against a set of criteria. In hisrenowned book: “Reflection in Action”, Donald Schön presents design work as adialectic between technical-rational thinking and intuition (Schön 1983). The designeris supposed to master both of these thought and knowledge forms. Schön describesdesign as a “handling of problem situations” rather than problem solving. He argues
that designers are collecting information about different alternatives throughsimulation of their performance in a model of the situation. Problem handlinginvolves handling of uniqueness, uncertainty, instability, and value conflicts. Thisalso involves evaluation, learning from experience, and surpassing establishedroutines to find new solutions to new problems (Schön 1983; Molander 1993).
The Swedish design professor Jerker Lundequist also views design as a handling of value conflicts (Lundequist 1998): The result of a design process is a product whose properties are decided by the people that has been involved in the project. Designtherefore involves value conflicts. A value statement may be argued for or against through the use of a rational system of criteria.
The British architect and psychologist, Bryan Lawson, who has published a series of books about design methodology, has made numerous observations and descriptionsof design processes. Among his main findings are (Lawson 1997):
• Design problems cannot be comprehensively stated. Both objectives and prioritiesare quite likely to change during the design process as the solution implicationsbegin to emerge.
• Design problems tend to be organized hierarchically (e.g. doorknob – door – wall– room – building – town – country – society). There is no objective or logical
way of determining the right level on which to tackle such problems. The decisiondepends on the power, time and resources available to the designer, but it doesseem sensible to begin at as high a level as it is reasonable and practicable.
• There is an inexhaustible number of different solutions.
• There are no optimal solutions to design problems. Design almost invariablyinvolves compromise.
• Design inevitably involves subjective value judgements.
• Designers must be able to balance both qualitative and quantitative criteria in theirdecision making process.
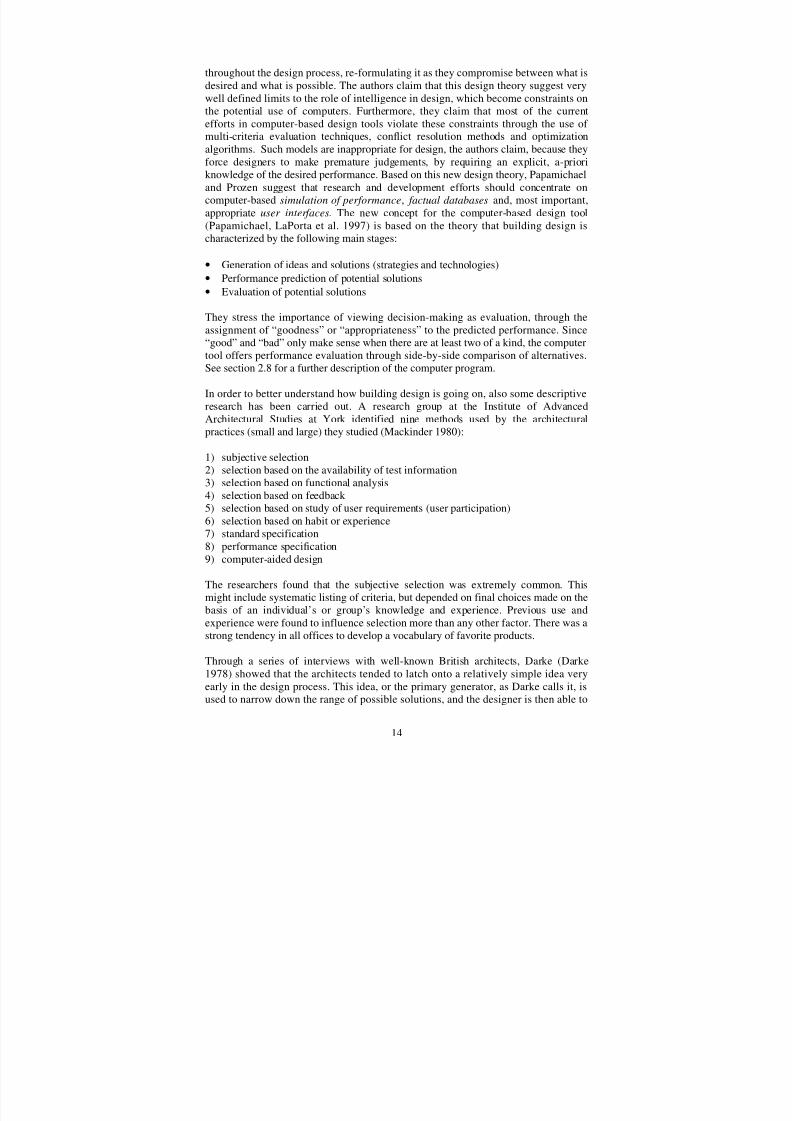
Recently, Papamichael and Prozen have presented a design theory as a basis for thedevelopment of a computer-based design tool with multiple criteria such as energy,comfort and environmental issues (Papamichael and Prozen 1993), (Papamichael,LaPorta et al. 1997). The computer program is presented in section 2.8. In their paper“The Limits of Intelligence in Design” (Papamichael and Prozen 1993), Papamichaeland Prozen present a design theory along Schön’s lines, where they suggest thatdesign involves “feeling and thinking while acting”, supporting the position thatdesign is only partially rational. They claim that design decisions are not entirely theproduct of reasoning, rather, they are based on judgments that require the notion of
“good” and “bad”, which is attributed to feelings, rather than thoughts. Designers donot “know” the relative importance of design criteria, they feel it continuously
8/13/2019 Multi Criteria Sun Calculation House
http://slidepdf.com/reader/full/multi-criteria-sun-calculation-house 20/246
14
throughout the design process, re-formulating it as they compromise between what isdesired and what is possible. The authors claim that this design theory suggest verywell defined limits to the role of intelligence in design, which become constraints onthe potential use of computers. Furthermore, they claim that most of the currentefforts in computer-based design tools violate these constraints through the use of
multi-criteria evaluation techniques, conflict resolution methods and optimizationalgorithms. Such models are inappropriate for design, the authors claim, because theyforce designers to make premature judgements, by requiring an explicit, a-prioriknowledge of the desired performance. Based on this new design theory, Papamichaeland Prozen suggest that research and development efforts should concentrate oncomputer-based simulation of performance, factual databases and, most important,appropriate user interfaces. The new concept for the computer-based design tool(Papamichael, LaPorta et al. 1997) is based on the theory that building design ischaracterized by the following main stages:
• Generation of ideas and solutions (strategies and technologies)
• Performance prediction of potential solutions• Evaluation of potential solutions
They stress the importance of viewing decision-making as evaluation, through theassignment of “goodness” or “appropriateness” to the predicted performance. Since“good” and “bad” only make sense when there are at least two of a kind, the computertool offers performance evaluation through side-by-side comparison of alternatives.See section 2.8 for a further description of the computer program.
In order to better understand how building design is going on, also some descriptive
research has been carried out. A research group at the Institute of AdvancedArchitectural Studies at York identified nine methods used by the architecturalpractices (small and large) they studied (Mackinder 1980):
1) subjective selection2) selection based on the availability of test information3) selection based on functional analysis4) selection based on feedback 5) selection based on study of user requirements (user participation)6) selection based on habit or experience7) standard specification
8) performance specification9) computer-aided design
The researchers found that the subjective selection was extremely common. Thismight include systematic listing of criteria, but depended on final choices made on thebasis of an individual’s or group’s knowledge and experience. Previous use andexperience were found to influence selection more than any other factor. There was astrong tendency in all offices to develop a vocabulary of favorite products.
Through a series of interviews with well-known British architects, Darke (Darke1978) showed that the architects tended to latch onto a relatively simple idea very
early in the design process. This idea, or the primary generator, as Darke calls it, isused to narrow down the range of possible solutions, and the designer is then able to

8/13/2019 Multi Criteria Sun Calculation House
http://slidepdf.com/reader/full/multi-criteria-sun-calculation-house 21/246
15
rapidly construct and analyze a scheme. Also, she observed that the architects did notstart with the brief and then designed based on this. Rather, they started to design andbrief simultaneously; the two activities were completely interrelated. Rowe (Rowe1987) presented further evidence supporting Darke’s idea of the primary generator.When reporting his case studies of designers in action, he wrote: “several distinct
liens of reasoning can be identified, often involving the a priori use of an organizingprinciple or model to direct the decision making process.
In the book “The Successful Management of Design. A Handbook of Building Design Management ”, Gray et al. present the following observation (Gray, Hughes et al.1994):
“The strategy that appears to be most consistently used is one that focuses onidentifying several possible solutions or hypotheses. These are evaluated and eachevaluation is used to refine the proposed solution until an acceptable answer isreached…. It seems essential to the design that the designer proposes one or more
possible solutions to the problem at an early stage, even if this is only to obtain aclearer understanding of the client’s needs. Essentially, design is a cumulativestrategy of developing a solution and critically appraising it to see whether or not it meets the criteria of the client.”
And further they conclude:
• the search for the perfect solution is potentially endless
• there is no infallible process or solution
• the process involves finding as well as solving problems
• design inevitably involves subjective value judgements
• there is no simple scientific approach to solving the design problem
Conclusions
To sum up, the descriptive and prescriptive studies cited above suggest the followingcentral activities of building design:
The activities are overlapping and the process is cyclical or iterative, where bothsolutions and criteria are continuously explored and refined. The tasks of problemdefinition and generation of alternatives are dominated by creativity and tacitknowledge. In the two last tasks (performance prediction and evaluation), formal andanalytical methods are more commonly used.
Problem definition (preliminary)
Generation of alternatives(ideas, potential solutions)
Performance prediction(modeling and simulation)
Evaluation(of potential solutions against criteria)

8/13/2019 Multi Criteria Sun Calculation House
http://slidepdf.com/reader/full/multi-criteria-sun-calculation-house 22/246
16
Design is a blend of technical-rational thinking and some sort of “intuition” or tacitknowledge. This knowledge is grounded in the knowledge and experience of thedesign team members. Building design also involves value conflicts and judgments. Itis the implementation of the tacit knowledge, the values and judgements that is the
most complicated part of the design work. However, this is also the most importantpart because it is decisive for the final outcome of the design work.
2.4 Problem Solving and Decision Making
In fact, many fields have similar approaches to problem solving and decision making.Within the fields of systems engineering, operations research, systems analysis, valueengineering, decision analysis, and policy analysis, many similarities in thedescriptions of problem solving approaches can be found. They all use some sort of
problem structuring, identification of criteria and alternatives, evaluation and finalchoice, as illustrated in Figure 2-5. The process starts with structuring of the problem.The next phase is the process of model structuring. Here the focus is on identifyingalternatives and criteria. It is described as a dynamic process, interacting with theprocess of evaluation, involving much iteration, search for new alternatives andcriteria, discarding, reinstating and redefining old ones, and extensive discussionamong the participants. Evaluation involves comparison of the different potentialsolutions in order to make a choice.
Figure 2-5. The process of problem solving, adapted from Belton (1990).
Ralph L. Keeney (Keeney 1992) identifies the most crucial activities of decisionmaking to be: identifying the decision problem, creating alternatives, and articulatethe objectives. Focusing on alternatives, Keeney argues, is a limited way to think through decision situations. It is values that are fundamentally important in anydecision situation. Alternatives are relevant only because they are means to achieveone’s values. Keeney notes that there should often be iteration between articulatingvalues and creating alternatives, but the principle is “values first”. He refers to thisthinking as value-focused thinking (as opposed to alternative-focused thinking).
Keeney argues that it can significantly improve decision making because values guide
Problem structuring
Model structuring
Identifycriteria
Identifyalternatives
Evaluation
Choice

8/13/2019 Multi Criteria Sun Calculation House
http://slidepdf.com/reader/full/multi-criteria-sun-calculation-house 23/246
17
not only the creation of better alternatives, but also the identification of better decisionsituations.
On the other hand, it may be difficult to extract the stakeholders’ values withoutpresenting concrete alternatives. Kirk and Spreckelmeyer (Kirk and Spreckelmeyer
1993) argue that “It is probably counter productive to think strictly in terms of clients’ values without considering what those values mean in a very real and physical setting. A client will not necessarily be willing to share with the entire designteam enough of his or her values to describe a problem accurately, especially in thecase of problems that might be considered controversial, politically sensitive or unfamiliar.”
Inevitably, decision making is a part of the design process. Decisions about whetherto proceed with a particular design, decisions about what technologies to use, and soon, need to be taken. Bazerman (Bazerman 1998) argues that human judgement is animportant part of all decision making:
Although a variety of decision aids (computers, decision trees, and such) areavailable, most important managerial decisions require a final decision or recommendation based on human judgement. Thus, human values and preferencesare at the core of the decision-making processes in all organizations.
In his book “Judgment in Managerial Decision Making”, Bazerman describes six“ideal” steps of decision making (Bazerman 1998):1. Defining the problem. Many times managers act without an understanding of the
problem to be solved. When this occurs, the manager may solve the wrongproblem.
2. Criteria identification. Most decisions require the decision-maker to accomplishmore than one objective. In buying a car, you may want to maximize fueleconomy, minimize cost, maximize comfort, and so on. The rational decision-maker will accurately identify all relevant criteria in the decision process.
3. Criteria weighting. The criteria identified are of varying importance to a decision-maker. The rational decision-maker will know the value he/she puts on each of thecriteria identified (e.g., the relative importance of fuel economy, cost, andcomfort).
4. Alternative generation. The fourth step in the decision-making process requiresidentification of possible courses of action. An inappropriate amount of search
time in seeking alternatives is the most common barrier to effective decisionmaking. An optimal search continues until the cost of search outweighs the value-added information.
5. Rating each alternative on each criterion. How well will each of the alternativesolutions perform on each of the defined criteria? This is often the most difficultpart of the decision process, because it typically requires forecasting events.
6. Computing the optimal decision. Ideally, after the first five steps have beencompleted, computing the optimal decision would consist of multiplying theexpected effectiveness times the weighting of each criterion times the rating of each criterion for each alternative solution; the solution with the highest expectedvalue would be chosen.

8/13/2019 Multi Criteria Sun Calculation House
http://slidepdf.com/reader/full/multi-criteria-sun-calculation-house 24/246
18
Bazerman concludes that “unfortunately, this represents a very simplistic view of thedecision making process”. He goes on to describe how decision making is going on inpractice:
In his Nobel prize work, Simon (Simon 1957) suggested that individual judgment is
bounded in it’s rationality and that we can better understand decision making byexplaining actual, rather than normative (“what should be done“) decision processes.The bounded rationality concept provides a framework for questioning the historicalassumptions of the rational model of the individual, and it provides a foundation for the study of deviations from rational judgment.
Bazerman argues that the concept of bounded rationality suggests the followingdeficiencies in decision making (Bazerman 1998):
• Decision makers may lack information ona) the definition of the problem,
b) alternatives,c) criteria, andd) the impact of choosing varying alternatives on the various criteria.
• Decision makers often have time and cost constraints that inhibit the search forfull information
• Imperfections of the decision-maker’s perceptions in obtaining information mayeffectively limit the quality of decisions.
• Human decision-makers can retain only a relatively small amount of informationin their usable memory.
• Limitations of human intelligence constrain the ability of decision-makers to
“calculate” the optimal choice accurately.
Within the fields of systems engineering and systems analysis, very structuredapproaches to product design have been developed. Therefore, it may be valuable tostudy the techniques of these fields in order to see if there are some aspects that maybe useful in a building design framework. Short outlines of these approaches are givenbelow.
Systems Analysis
Systems analysis is not a well defined methodology or distinct field. Miser and Quade(Miser and Quade 1988) put it this way: We intend the term systems analysis to
represent the portions of policy analysis, operations research, management scienceand other professional fields that share the structure outlined below, or some variant of it:
Many of the problems of modern society emerge from interactions among people, thenatural environment, and artifacts of man and his technology. Often such problemscan be addressed by systems analysis, an approach that brings to bear the knowledgeand methods of modern science and technology with appropriate consideration of social goals and equities, the larger contexts, and the inevitable uncertainties. Theaim is to acquire deep understanding of the problems and use it to help bring about improvements. In practice, analysis of this type clarifies and defines objectives;searches out alternative courses of action that are both feasible and promising;gathers data relevant to – and projects the nature of – the environments for which the

8/13/2019 Multi Criteria Sun Calculation House
http://slidepdf.com/reader/full/multi-criteria-sun-calculation-house 25/246
19
actions are proposed; and generates information about the costs, benefits, and other consequences that might ensue from their adoption and implementation
Miser and Quade (1988) stress the importance of craftmanship to the success of asystem analysis:
We have some theory or principle to guide us, but we must also use information fromthe many disciplines involved, instinct, common sense, hunches and especiallycraftmanship gained from experience.
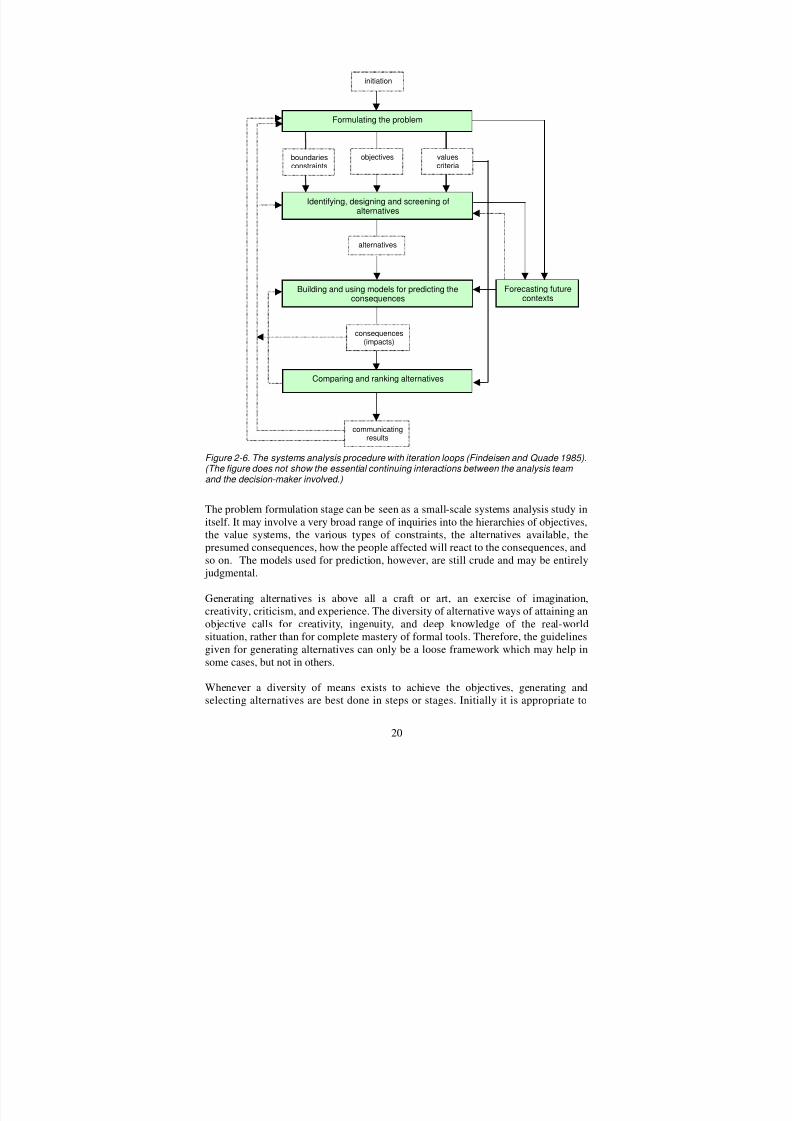
The principal activities in systems analysis are illustrated in Figure 2-6 below. Thefollowing description is based on (Findeisen and Quade 1985), unless otherwisenoted.
The analysis starts by transforming the problem situation into a more clearly definedproblem. It is not always easy to take seriously the activities involved in problem
formulation. There is sometimes a feeling that, until models are being constructed oralternatives are being evaluated, the real work has not begun. But, in fact, whichmodels to construct, which alternatives to compare, and whether the study outcome isto be a solution feasible under defined uncertainties, a formal optimization, or apresentation of alternative possibilities, are all decided in the problem formulationstage. Problem formulation implies the following elements (Checkland 1985):
• isolating the questions or issues involved
• clarifying the objectives and constraints
• identifying the people who will be affected by the decision
• discovering the major operative factors• deciding on the initial approach
It is expected that the problem formulation, among other things, will provide:
• a preliminary statement of the objectives and ways to measure their achievement
• a specification of some promising courses of action, i.e., alternatives
• a definition of the constraints
• an anticipation of the types of consequences to be expected, how to measure them,and possible criteria for ranking them
• a plan for analysis
8/13/2019 Multi Criteria Sun Calculation House
http://slidepdf.com/reader/full/multi-criteria-sun-calculation-house 26/246
20
Figure 2-6. The systems analysis procedure with iteration loops (Findeisen and Quade 1985).(The figure does not show the essential continuing interactions between the analysis team and the decision-maker involved.)
The problem formulation stage can be seen as a small-scale systems analysis study initself. It may involve a very broad range of inquiries into the hierarchies of objectives,the value systems, the various types of constraints, the alternatives available, the
presumed consequences, how the people affected will react to the consequences, andso on. The models used for prediction, however, are still crude and may be entirely judgmental.
Generating alternatives is above all a craft or art, an exercise of imagination,creativity, criticism, and experience. The diversity of alternative ways of attaining anobjective calls for creativity, ingenuity, and deep knowledge of the real-worldsituation, rather than for complete mastery of formal tools. Therefore, the guidelinesgiven for generating alternatives can only be a loose framework which may help insome cases, but not in others.
Whenever a diversity of means exists to achieve the objectives, generating andselecting alternatives are best done in steps or stages. Initially it is appropriate to
Formulating the problem
Identifying, designing and screening ofalternatives
Building and using models for predicting theconsequences
Comparing and ranking alternatives
boundariesconstraints
objectives valuescriteria
alternatives
consequences(impacts)
initiation
communicatingresults
Forecasting futurecontexts

8/13/2019 Multi Criteria Sun Calculation House
http://slidepdf.com/reader/full/multi-criteria-sun-calculation-house 27/246
21
consider a fairly large number of possibilities as alternatives; any scheme that has achance of being feasible and of meeting the objectives should be investigated. At thebeginning, it is good to encourage invention and unconventionality; foolish ideas maynot appear so foolish when looked at more closely. It may often be advisable to reachbeyond the less rigid constraints, to broaden the scope of the study outside the limits
that were initially set by the client.
The many alternatives that are considered initially cannot be investigated in detail. Itwould be too costly and, above all, excessively time-consuming. Some kind of screening, based on expert judgement, evidence from past cases, or simple models,can often be used to select a few of the alternatives as more promising. Grosslyinferior alternatives and those that are dominated by others can be screened out.During the evaluation process the good features of the better alternatives may suggestways for the analyst to design new and still better ones.
The stages that follow the initial scrutiny should include an increasing amount of
quantitative assessment. At first, the assessment of the consequences of eachalternative may still miss many details. Care should be taken that measures of effectiveness are treated only as approximations; that is, what is really better is notnecessarily demonstrated by a simple arithmetic comparison. Forecasting of the futurestate of the world is required in order to predict the consequences of an alternative.Forecasting techniques range from scenario writing to mathematical forecastingmodels. Whatever technique is used, a forecast is always based on the past and currentdata, observations, or measurements, plus assumptions about connections of thefuture. When expert judgement alone is employed, it may to a large extent be carriedout explicitly.
The last stage of the selection procedure should investigate relatively few alternatives,but in considerable detail. These alternatives should be serious candidates forimplementation. At this stage, systems analysis sometimes overlaps with systemsdesign or systems engineering, where the job is to determine all specifications for theconsecutive design of the particular part of the system. Fine tuning is an activity thatmay, in appropriate cases, make good use of mathematical models. The problems areusually well defined and setting the details may be ideal for formal procedures foroptimization, such as linear programming.

8/13/2019 Multi Criteria Sun Calculation House
http://slidepdf.com/reader/full/multi-criteria-sun-calculation-house 28/246
22
Systems Engineering
The following description is based on (Asbjørnsen 1992), (Fet 1997), and (Blanchard1990).
The Systems Engineering process involves a series of steps accomplished in a logicalmanner and directed toward the development of a product or a production system.Systems Engineering is the effective application of scientific and engineering effortsto transform an operational need into a defined system configuration through the top-down iterative process:
Figure 2-7. The Systems Engineering steps.
STEP 1: Identify needsBased on the requirements of a client, a user group, or a market, a need is identified.This step includes an iterative loop where the statement of needs is an answer to thequestions: “What is needed?, “Why is it needed?”, and “How may the need besatisfied?” The statement of need should be presented in specific qualitative and
quantitative terms, in sufficient detail to justify progression to the next step. Iterationsare carried out until the need formulation is accepted.
STEP 2: Define requirementsBased on the needs, functional, operational and physical performance requirements toeach system element are defined. Functional requirements have to do with the systemsability to carry out functions, or actions and reactions. The functional requirementsare an answer to the “what’s” in STEP 1.
Operational requirements are related to actions and functions to be carried out duringoperation of the system. An inherent requirement to the functional design of the
system is that the system has degrees of freedom to make operational change possible.Therefore, the formulation of the operational requirements in systems engineering
STEP 1: Identify needs
STEP 2: Define requirements
STEP 3: Specify performances
STEP 4: Analyze and optimize
STEP 5: Design and solve
STEP 6: Verify and test
Customer’s requirements
Additional research

8/13/2019 Multi Criteria Sun Calculation House
http://slidepdf.com/reader/full/multi-criteria-sun-calculation-house 29/246
23
includes possible requirements from operators or computer control systems to be ableto run or operate the system in a desirable fashion. The operational requirements maybe an answer to the “why’s” in STEP1.
Physical requirements reflect the needs for physical connections between subsystems
and elements, describes the physical conditions the system will be exposed to, andhow the system fits into the environment. The physical requirements may be ananswer to the “how’s” in STEP1.
STEP 3: Specify performancesThe system requirements are then translated to performance specifications, i.e.definable and measurable performance criteria of the total system and its subsystems.The system is subdivided into convenient parts, and a functional analysis related tosubsystems, system elements, and the integrated parts of the system, is performed.
The functional analysis is an iterative process of breaking requirements down from
the system level to the subsystem, and as far down the hierarchical structure asnecessary to identify input design criteria and constraints for the various componentsof the system. The performance specification helps ensuring that all facts of systemdesign and development, production, operation, and demolition and support arecovered. It also ensures that all elements of the system and its integrated parts(hardware, software, “humanware” and economy) are fully recognized and defined.Included in the performance specification should also be measures and conditions formeasurements.
STEP 4: analyze and optimizeBased on the specified performances, a representative configuration should beselected. Inherent with the systems engineering process is an on-going analyticaleffort that involves evaluating various system design alternatives. This is called trade-off analysis, and may be defined as a compromise between conflicting interests withthe need to maintain equilibrium.
The task is to select the best approach possible through the iterative process of systemanalysis using various models. The use of weight factors and information frominterested parties is an important part of the analysis. Different optimizationtechniques are used. Fair and objective evaluation of systems requires a reproducibleway of testing and evaluating. Therefore, the trade-off analysis should meet the
following requirements:
• Define the objective function for the total system performance evaluation
• Define the conditions under which the system performance is to be measured
• Establish the measurement/evaluation criteria for a ”best” satisfaction of the functional,operational and physical needs and requirements.
STEP 5: Design and SolveThe detailed design phase starts with the concept and configuration derived from thepreliminary activities like system requirement specifications, performancespecifications, synthesis and analysis. When the overall system definition has been
established in an accepted conceptual design, it is necessary to progress throughfurther definitions leading to the realization of hardware, software, “bioware” and

8/13/2019 Multi Criteria Sun Calculation House
http://slidepdf.com/reader/full/multi-criteria-sun-calculation-house 30/246
24
economics. These should be evaluated in relation to their possible environmentalimpacts throughout the system’s life cycle.
STEP 6: Verify and Test In this step the system concept should be verified by simulation or by rapid
prototyping compared with known reference systems. In particular the systemperformance should be tested according to the requirements set by the customers andusers of the system.
In Systems Engineering, the necessity of a holistic view, the cash flow and qualityview, and time effectiveness, is emphasized. A holistic view means that the differentphases of the life cycle are interrelated, have an impact on each other, and they needto be addressed in the context of the whole. A long-range approach must be applied,and the life cycle considerations are essential.
The Systems Engineering process requires a teamwork where the professional skills
of the team members are the platform for their participation in the process. The teammembers need to have a clear understanding of the needs and requirement of the userof the system and/or the customer.
Conclusions
Many of the models of problem solving and decision making resemble the modelsdescribed within the design theory literature. The models resemble the “ase-model”described in section 2.3, including distinct phases of problem structuring (analysis),model structuring (synthesis) and evaluation. Many authors emphasize the importanceof identifying the values of the stakeholders, but recognize that the values may not
emerge wholly until later in the process when alternative solutions have beenproposed. Also, it is widely recognized that human judgements is an important part of the decision process, and that this often results in a decision process that is far fromrational. The descriptive research has identified a number of heuristic biases thatmakes the decision process deviate from the ideal. These “imperfections” include timelimits, limitations of the human brain, and psychological factors.
Systems Analysis and Systems Engineering both include procedures and steps thatresemble those of building design. They include some kind of problem formulation,the generation of alternative solutions, prediction of consequences for the solutions,and comparisons among them. Both processes emphasize the need for iterations
between steps. The Systems Engineering process is more specific or “engineered”than the more loosely defined Systems Analysis. The latter seems to put moreemphasizes on craft and judgmental procedures, which are also important in buildingdesign. They both stress the need to consider future issues and the life cycleperspective. In Systems Engineering, the holistic view is given special attention, i.e.including all design disciplines in the design team, evaluating the whole range of performance criteria including technical and human factors, and integrating the lifecycle stages of the product. Therefore, there seem to be several aspects of these fieldsthat may be useful in a building design framework.

8/13/2019 Multi Criteria Sun Calculation House
http://slidepdf.com/reader/full/multi-criteria-sun-calculation-house 31/246
25
2.5 The Nature of the Building Industry
The building industry of today has some special characteristics that may putconstraints on the methodology for integrated solar building design. The increased
complexity of buildings and technologies calls for many different specialists to beinvolved in the design process. Computer technology has enabled designers tomanipulate large quantities of data quickly and inexpensively. Clients and the societyas a whole are putting higher demands on documentation of complex issues, forexample environmental concerns connected to the building industry.
The main characteristics of the building industry that affects the design, can besummarized as follows:
A high degree of specializationMany different professions are involved in the design and construction of buildings.
The increase in the number of people involved in the design process, the high degreeof specialization, and the number of conflicting goals that requires satisfaction, haswidened the communication gap between the users and designers of buildings.
Short time limitsThere is a pressure to get the project finished in time due to competitive pressures,loans, fees, etc. In particular, the early design phase is very much pressured, it is notunusual that it receives less than 10% of the total budget for the design. This willrestrict the amount of time for information search, which may again lead designers tofocus on issues that are easily modeled and solutions that are well documented.
Separation of designers, owners, and users of buildingsOwners and users of the building are frequently not the same people. The buildingmay be owned by one company, occupied by one (or more) other company, and runby a third company (outsourcing). The ownership, operation and occupation of abuilding may change several times during its lifetime. Therefore, the users of thebuilding are often unknown to the designers, and their wishes and preferences aretherefore hard to predict. Also, the wishes and values of the client are often veryvaguely formulated..
Rapid development and information overload There is an ever-increasing diversity of available products and technologies. Pricesfluctuate much and change rapidly, and many new products and technologies appearon the market every day.
One-of-a-kind projectsEvery building project is unique due to varying constraints such as client preferences,location, climate, etc.
Temporary design teamsAlthough designers may happen to have the same client and work the same buildingprofessionals, design teams are often not the same from project to project.

8/13/2019 Multi Criteria Sun Calculation House
http://slidepdf.com/reader/full/multi-criteria-sun-calculation-house 32/246
26
The importance of early decisionsThe decisions taken in the early design phase are important because they may have agreat influence on the quality of the end product. The further the design hasprogressed, the less opportunity there is to make a significant change, and the more
expensive the change will be.
A wide range of performance criteriaBuilding design involves a wide range of performance criteria that are of bothqualitative and quantitative nature. The criteria may be conflicting.
The importance of values and judgementsMany decisions taken in building design involve judgments. The different members of the design team perform judgements based on their knowledge, experience, andintuition. Often, these judgements are not well documented.
A far reaching perspectiveBuildings have a long service life compared to other products, a life time of 30 yearsis quite common for normal building products like windows and facade elements.Some parts of the building may be changed with shorter intervals, e.g. the interiorfurnishings. However, viewed as a whole, buildings may have to serve for more than100 years.

8/13/2019 Multi Criteria Sun Calculation House
http://slidepdf.com/reader/full/multi-criteria-sun-calculation-house 33/246
27
2.6 Solar Energy Systems and Design
Solar energy systems may be used to enhance the heating, cooling, ventilation, anddaylighting performances of buildings. The main purpose of employing solar energysystems is to save energy and power (thermal or electric) while maintaining goodindoor comfort conditions. Figure 2-8 shows typical figures for auxiliary energyconsumption in an office building in Norway. The space heating load is primarily aresult of losses by transmission and infiltration through the building envelope, and of losses through ventilation. These losses are partly offset by solar gains throughglazing and by usable internal gains from occupants, lights, and appliances. The space
cooling load is, on the other hand, a result of an excess of solar and internal gains. Theintroduction of stricter building codes, which generally address traditional energyconservation technologies that reduce the transmission and infiltration losses, havealready resulted in a reduction in the energy consumption for space heating. As aconsequence, the energy consumption for lights and appliances, as well as for spacecooling and ventilation, is becoming more important. In fact, the electricity demand isin many cases becoming larger than the thermal energy demand. Thus, to reduce thetotal energy consumption of office buildings, designers of the future need to look at awide range of solar technologies.
Figure 2-8. Typical energy consumption for an office building in Norway (NorEnergi 1993).
To make a good solar building, it is, of course, a prerequisite to know about thedifferent system types, technologies and integration possibilities. Also, the designerneeds to know how to assess the energy output of different systems in interaction withthe building. In order to get an overview of the available options, it may be useful to
structure the solar energy system types in groups according to their use and technicalcharacteristics, as shown in Figure 2-9.
0
10
20
30
40
50
60
70
80
90100
h e a t i n g
v e n t i l a
t i o n
h o t w
a t e r l i g
h t s
f a n s
/ p u m
p s m i s c .
k W h / m ² / y e a r
All buildings are solar collectors.
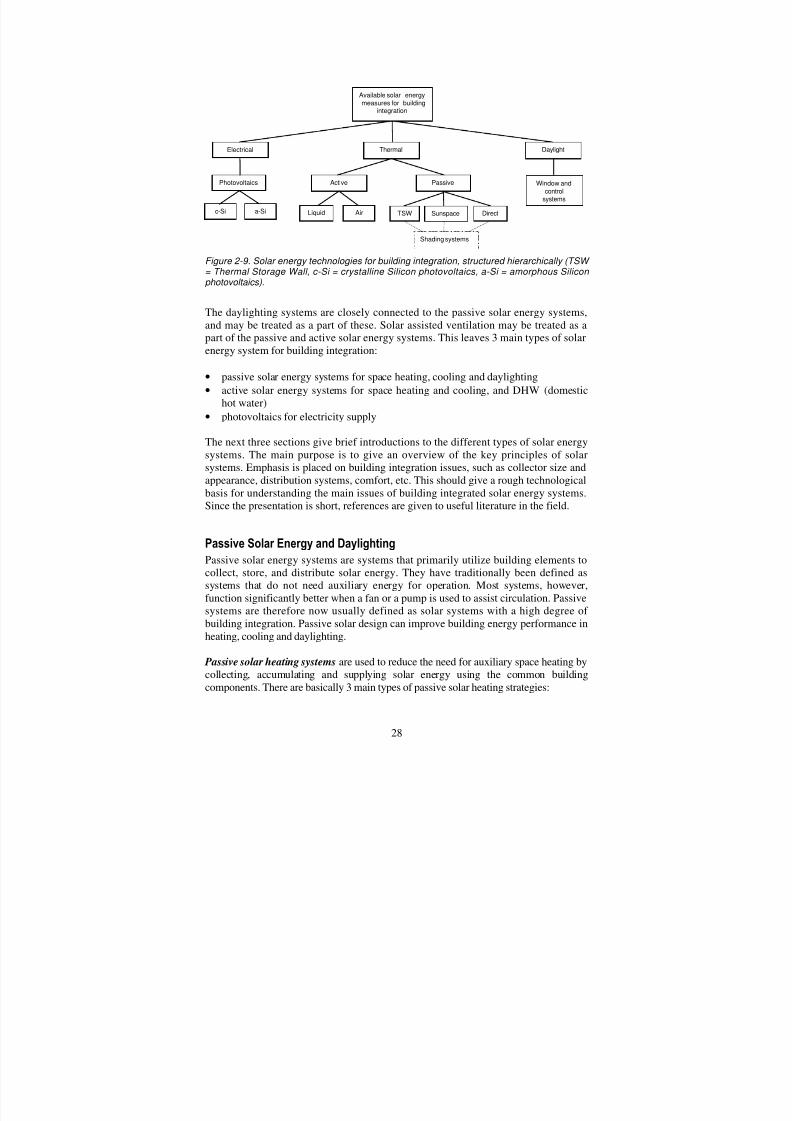
8/13/2019 Multi Criteria Sun Calculation House
http://slidepdf.com/reader/full/multi-criteria-sun-calculation-house 34/246
28
Figure 2-9. Solar energy technologies for building integration, structured hierarchically (TSW
= Thermal Storage Wall, c-Si = crystalline Silicon photovoltaics, a-Si = amorphous Silicon photovoltaics).
The daylighting systems are closely connected to the passive solar energy systems,and may be treated as a part of these. Solar assisted ventilation may be treated as apart of the passive and active solar energy systems. This leaves 3 main types of solarenergy system for building integration:
• passive solar energy systems for space heating, cooling and daylighting
• active solar energy systems for space heating and cooling, and DHW (domestichot water)
• photovoltaics for electricity supply
The next three sections give brief introductions to the different types of solar energysystems. The main purpose is to give an overview of the key principles of solarsystems. Emphasis is placed on building integration issues, such as collector size andappearance, distribution systems, comfort, etc. This should give a rough technologicalbasis for understanding the main issues of building integrated solar energy systems.Since the presentation is short, references are given to useful literature in the field.
Passive Solar Energy and DaylightingPassive solar energy systems are systems that primarily utilize building elements tocollect, store, and distribute solar energy. They have traditionally been defined assystems that do not need auxiliary energy for operation. Most systems, however,function significantly better when a fan or a pump is used to assist circulation. Passivesystems are therefore now usually defined as solar systems with a high degree of building integration. Passive solar design can improve building energy performance inheating, cooling and daylighting.
Passive solar heating systems are used to reduce the need for auxiliary space heating bycollecting, accumulating and supplying solar energy using the common building
components. There are basically 3 main types of passive solar heating strategies:
Available solar energymeasures for building
integration
Electrical DaylightThermal
Active PassivePhotovoltaics Window andcontrol
systems
TSWAirLiquid DirectSunspacea-Sic-Si
Shading systems

8/13/2019 Multi Criteria Sun Calculation House
http://slidepdf.com/reader/full/multi-criteria-sun-calculation-house 35/246
29
• Direct gain systems, where the solar energy enters directly into the room through“a solar window”.
• Indirect gain systems, where the solar energy goes through a “solar wall” before itenters the room.
• Isolated systems, where the solar energy is collected in a “sunspace” that is
separated from the living space.
Figure 2-10. Three main types of passive solar heating systems (heat storing elements in black).
Utilization of the greenhouse effect is the key to passive solar heating. Glass and othertransparent materials have the ability to let through short wave solar radiation. Thisenergy is absorbed in floors, walls, roofs and furnishings and is afterwards released aslong wave radiation. In this way the heat is trapped inside the building, because thelong wave radiation is absorbed or reflected back from the glazing. Window design istherefore a central part of passive solar design. Key parameters are orientation,
placement, solar energy and daylight transmission, thermal mass, and heat insulatingproperties. Also, the placement and solar absorption properties of heat storingconstructions and the thermal zoning (room plan) of the building are of importance.
Passive cooling systems are used to save energy and improve comfort through theexclusion or removal of unwanted solar heat. When considering cooling, the rule is tofirst limit the amount of heat from solar radiation that reaches the building, then tominimize the amount of heat within the building envelope and to reduce internal gainsform occupants, light, and appliances. Then, if it is still necessary, the final task is toremove any remaining unwanted heat.
Solar controls are used to prevent the solar radiation from reaching and entering thebuilding. It is most effectively done by sizing, positioning, and shading of windows.Fixed or movable shading devices, such as overhangs, awnings, louvers and blinds, orthe shading provided by appropriate vegetation, reduce unwanted gains through thewindows.
Ventilation, using cooler fresh air driven through the building by naturally occurringdifferences in wind or air pressure (the stack effect), will also help reduce internaltemperatures. The cooling effect of increased air speeds is also important. In relativelydry climates, the ventilation air can be cooled during the day by letting it pass over
evaporating water using pools, fountains, or water sprays. Another way to cool theventilation air is to pass it through pipes buried in the ground. In climates with large
direct system: solar window isolated system: sunspaceindirect system: solar wall
8/13/2019 Multi Criteria Sun Calculation House
http://slidepdf.com/reader/full/multi-criteria-sun-calculation-house 36/246
30
variations in temperature between day and night it is also appropriate to utilize thebuilding mass for natural cooling.
Daylight design involves the provision of natural daylight to the interiors of buildings.This may produce energy savings as well as healthier and more pleasant living
conditions. By adjusting the interior lighting according to the daylight availability,significant lighting energy and power savings may be obtained. Energy savings areobtained in two ways:
• Directly, due to the reduction in electrical energy for artificial lights.
• Indirectly, because the reduced lighting use will influence the total heat balance of the building.
In periods with excess heat, utilization of daylight will reduce the cooling demandbecause the period with the highest daylight availability coincides with the periodwith the maximum cooling demand.
Window design is, of course, central to daylight design. Orientation, placement, size,form and transmittance properties are essential variables. Also, the control strategy of electric lights, shading elements, and room layout has to be considered. In the recentyears, special products and principles for enhancing the daylight usability have beendeveloped. For example light channels, reflecting light shelves, glass prisms andlamellas may be used to direct the light deep into the room and give an even and gooddaylight distribution.
Further description of daylighting strategies are given in (Aschehoug and Arnesen1998), (Baker, Fanchiotti et al. 1993), (Bell and Burt 1995), (Littlefair 1996), and(Løfberg 1987). Computer programs for simulating the distribution of daylight as wellas the heating, cooling and electricity consumption of daylit buildings, are available(SUPERLITE, ADELINE, RADIANCE, DALITE). However, properly modeling of the daylighting in buildings is quite complicated, and consequently, the programs thatare able to do this, are quite tedious to use.
More detailed descriptions of passive solar system design are given in (Aschehougand Thyholt 1992), (Lechner 1991), (Lewis and Golding 1995), and (Yannas 1994).
Active Solar EnergyThe characteristic of an active solar energy system, as opposed to a passive solarenergy system, is that it requires an external energy input to operate. This energy ismost commonly electrical energy to run pumps or fans. Active solar systems may beused for space heating and cooling, as well as domestic hot water heating.
Active solar energy systems consist of three main parts: the collector, the heat storageunit, and a distribution system. The solar radiation is absorbed by the collector, whichhas tubes, or channels that contain the heat transfer medium. The heat transfermedium carries the heat to the storage tank or directly to the load. The distributionsystem consists of pipes or ducts that carry the heat transfer medium, and pumps or
fans to drive the heat transfer medium through the system. Most often, some kinds of system controls are also needed. The control system monitors the system performance
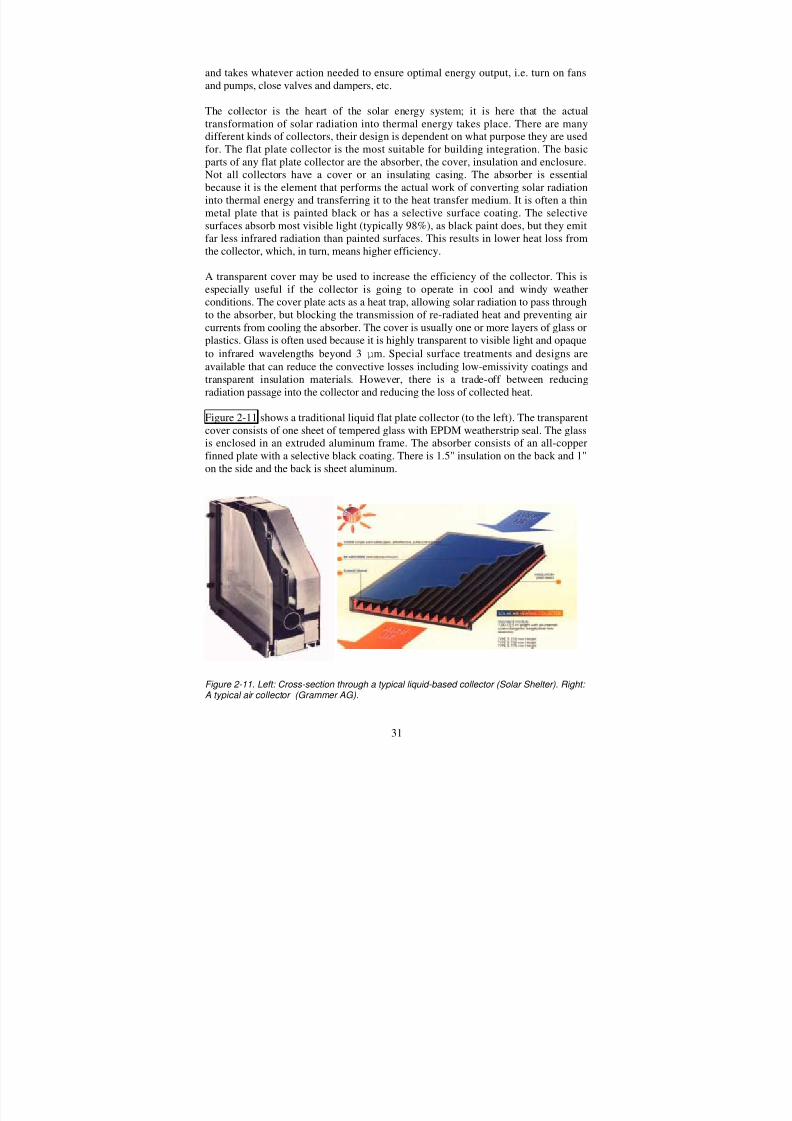
8/13/2019 Multi Criteria Sun Calculation House
http://slidepdf.com/reader/full/multi-criteria-sun-calculation-house 37/246
31
and takes whatever action needed to ensure optimal energy output, i.e. turn on fansand pumps, close valves and dampers, etc.
The collector is the heart of the solar energy system; it is here that the actualtransformation of solar radiation into thermal energy takes place. There are many
different kinds of collectors, their design is dependent on what purpose they are usedfor. The flat plate collector is the most suitable for building integration. The basicparts of any flat plate collector are the absorber, the cover, insulation and enclosure.Not all collectors have a cover or an insulating casing. The absorber is essentialbecause it is the element that performs the actual work of converting solar radiationinto thermal energy and transferring it to the heat transfer medium. It is often a thinmetal plate that is painted black or has a selective surface coating. The selectivesurfaces absorb most visible light (typically 98%), as black paint does, but they emitfar less infrared radiation than painted surfaces. This results in lower heat loss fromthe collector, which, in turn, means higher efficiency.
A transparent cover may be used to increase the efficiency of the collector. This isespecially useful if the collector is going to operate in cool and windy weatherconditions. The cover plate acts as a heat trap, allowing solar radiation to pass throughto the absorber, but blocking the transmission of re-radiated heat and preventing aircurrents from cooling the absorber. The cover is usually one or more layers of glass orplastics. Glass is often used because it is highly transparent to visible light and opaque
to infrared wavelengths beyond 3 µm. Special surface treatments and designs areavailable that can reduce the convective losses including low-emissivity coatings andtransparent insulation materials. However, there is a trade-off between reducingradiation passage into the collector and reducing the loss of collected heat.
Figure 2-11 shows a traditional liquid flat plate collector (to the left). The transparentcover consists of one sheet of tempered glass with EPDM weatherstrip seal. The glassis enclosed in an extruded aluminum frame. The absorber consists of an all-copperfinned plate with a selective black coating. There is 1.5" insulation on the back and 1"on the side and the back is sheet aluminum.
Figure 2-11. Left: Cross-section through a typical liquid-based collector (Solar Shelter). Right: A typical air collector (Grammer AG).
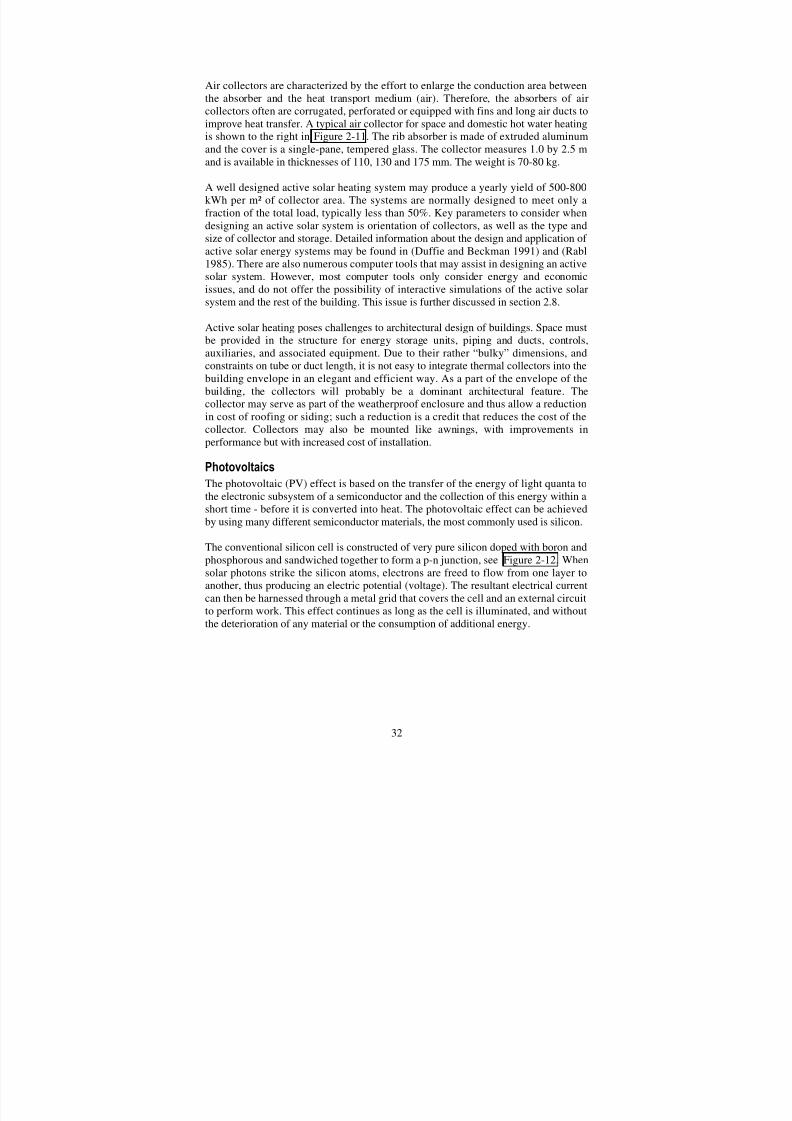
8/13/2019 Multi Criteria Sun Calculation House
http://slidepdf.com/reader/full/multi-criteria-sun-calculation-house 38/246
32
Air collectors are characterized by the effort to enlarge the conduction area betweenthe absorber and the heat transport medium (air). Therefore, the absorbers of aircollectors often are corrugated, perforated or equipped with fins and long air ducts toimprove heat transfer. A typical air collector for space and domestic hot water heating
is shown to the right in Figure 2-11. The rib absorber is made of extruded aluminumand the cover is a single-pane, tempered glass. The collector measures 1.0 by 2.5 mand is available in thicknesses of 110, 130 and 175 mm. The weight is 70-80 kg.
A well designed active solar heating system may produce a yearly yield of 500-800kWh per m² of collector area. The systems are normally designed to meet only afraction of the total load, typically less than 50%. Key parameters to consider whendesigning an active solar system is orientation of collectors, as well as the type andsize of collector and storage. Detailed information about the design and application of active solar energy systems may be found in (Duffie and Beckman 1991) and (Rabl1985). There are also numerous computer tools that may assist in designing an active
solar system. However, most computer tools only consider energy and economicissues, and do not offer the possibility of interactive simulations of the active solarsystem and the rest of the building. This issue is further discussed in section 2.8.
Active solar heating poses challenges to architectural design of buildings. Space mustbe provided in the structure for energy storage units, piping and ducts, controls,auxiliaries, and associated equipment. Due to their rather “bulky” dimensions, andconstraints on tube or duct length, it is not easy to integrate thermal collectors into thebuilding envelope in an elegant and efficient way. As a part of the envelope of thebuilding, the collectors will probably be a dominant architectural feature. Thecollector may serve as part of the weatherproof enclosure and thus allow a reductionin cost of roofing or siding; such a reduction is a credit that reduces the cost of thecollector. Collectors may also be mounted like awnings, with improvements inperformance but with increased cost of installation.
Photovoltaics
The photovoltaic (PV) effect is based on the transfer of the energy of light quanta tothe electronic subsystem of a semiconductor and the collection of this energy within ashort time - before it is converted into heat. The photovoltaic effect can be achievedby using many different semiconductor materials, the most commonly used is silicon.
The conventional silicon cell is constructed of very pure silicon doped with boron andphosphorous and sandwiched together to form a p-n junction, see Figure 2-12. Whensolar photons strike the silicon atoms, electrons are freed to flow from one layer toanother, thus producing an electric potential (voltage). The resultant electrical currentcan then be harnessed through a metal grid that covers the cell and an external circuitto perform work. This effect continues as long as the cell is illuminated, and withoutthe deterioration of any material or the consumption of additional energy.
8/13/2019 Multi Criteria Sun Calculation House
http://slidepdf.com/reader/full/multi-criteria-sun-calculation-house 39/246
33
Figure 2-12. The silicon PV cell.
Three types of silicon materials are used for the fabrication of solar cells: mono-crystalline silicon (m-Si), poly-crystalline silicon (p-Si) and amorphous silicon (a-Si).
Amorphous silicon solar cells differ in many respects from mono- and poly-crystalline silicon cells. Crystalline cells are breakable silicon wafers cut from largesilicon blocks, while amorphous cells consist of a very thin layer of un-crystallizedsilicon which is deposited onto a carrier material (substrate). Therefore, amorphoussilicon cells are often called thin-film cells. As a consequence, amorphous cells canhave a variety of forms and dimensions, whereas crystalline cells have typicaldimensions of 10 x 10 cm. Also, the different types of cells have quite differentappearances. The mono-crystalline cells usually have an even, black or gray color, thepoly-crystalline cells are most often bright blue and "shiny" because of the manysmall crystals, and amorphous cells are brownish or reddish-brown.
Solar cells are connected in a series and/or parallel configuration and placed in sealedunits called modules. The module's top layer is purposely transparent and can bemade from glass or plastics. The outermost cover keeps out water and gaseouspollutants which could cause corrosion of a cell and protects the cells from physicaldamage. The next layer is an anti-reflective coating designed to reduce the amount of reflected sunlight. The cell's bottom layer is called the back contact and is a sheet of metal which together with the front contact (the metal grid) is a bridge to the externalcircuit. To seal the whole structure, the back is covered with a layer of tedlar or glass.A frame of aluminum gives the module the needed mechanical stability.
The amount of power produced by a photovoltaic module is mainly dependent on theintensity of sunlight and the operating temperature of the cells. The output of the PVmodule is directly proportional to the amount of sunlight. The effect of temperature isnot so obvious; PV devices produce less and less electricity as the operatingtemperature increases.
The efficiency for conversion of light into electricity depends on the cell material. Theconversion efficiency of modules of amorphous silicon cells varies from 3 to 8%.Modules of poly-crystalline silicon have a conversion efficiency of about 9-12%,while modules of mono-crystalline silicon cells have an efficiency of 12-16%.
For buildings that are out of reach of the utility grid or for some other reason areindependent of the grid, a storage or back-up system is required to ensure electricity
SILICONN-TYPE
SILICONP-TYPE
PN-JUNCTION
SILICONOXIDE e-
e- _
+
8/13/2019 Multi Criteria Sun Calculation House
http://slidepdf.com/reader/full/multi-criteria-sun-calculation-house 40/246
34
production during cloudy periods or at night. Today, the only practical availablestorage options for PV systems are lead-acid or nickel/cadmium batteries. These twotypes of batteries are well known and available to the consumer. There are, however,limitations with respect to energy density, cycle life, temperature of operation andtoxicity associated with both of these options. Alternative energy storage options are
being developed that include other kinds of battery technology, fuels cells andhydrogen.
For PV applications in buildings, the inverter is a key component. The inverter is anelectronic device that converts direct current to alternating current. In grid-connectedapplications PV electricity is fed into the utility network by means of an inverter. Instand-alone systems power inverters are needed to operate common appliances withelectricity from the batteries charged directly by the solar generator.
The accurate sizing of a PV system is a quite complicated process, especially forstand-alone or hybrid systems. Most building integrated PV systems, however, are
grid connected, since most buildings are located in areas within reach of the utilities.For these systems, simple design guidelines are available, see for example (Hummand Toggweiler 1993), (Peippo 1992), (Sick and Erge 1996), or (Strong 1991). Formore accurate sizing of PV systems there are various computer tools that model theperformance of different system types.
Due to their modular layout, lightweight and simple assembling, there are manypossibilities for integration of photovoltaic panels into roof or facade elements. PVpanels may replace or assist other necessary functions, such as weather skin or solarshading. In this way, it is possible to identify three main principles for PV integrationinto buildings:
1) Weather skin: roof and facade integration2) Solar shading elements3) Daylighting elements
The traditional PV modules are often not very suitable for integration into thebuilding envelope. However, in the last few years, we have seen an increasing numberof PV modules that are specially designed for building integration. These modules canfit into conventional roof and facade structures, such as for example glazing frames.Also, specially designed facade systems are available that ease the integration of PV
modules into the building envelope. Some companies have specialized in supplyingPV facade or roof systems, and offer PV panels as well as special structuralcomponents that go together with their modules. PV panels can be mounted as fixedshading elements over the windows, on awnings or venetian blinds. Using movable orsemi-transparent PV elements, the combined function of shading and daylighting canbe achieved. As shading elements, the PV modules are oriented towards the sun formaximum energy output, while blocking the direct radiation from entering into thebuilding. Semi-transparent PV elements block most or all of the direct radiation, whileallowing diffuse light to enter the room.
Building facades represent a dominant architectural feature, and are often designed to
express the company's profile. Facade integrated PV modules can add exciting and

8/13/2019 Multi Criteria Sun Calculation House
http://slidepdf.com/reader/full/multi-criteria-sun-calculation-house 41/246
35
elegant features to the building envelope. Figure 2-13 shows PV integrated intowindow and cladding systems.
Figure 2-13. Left: Crystalline silicon PV cells between glass panes in a German building
(Pilkington Solar AG). Right: PV modules as a patchwork on a building in Switzerland (Solution AG).
2.7 Solar Building Design
How does the solar design considerations fit into the design process? In most projects,there is very little concern about solar and low energy measures in this early designstage. Advanced energy systems are often “added on” in later phases. Unfortunately,this is not a very efficient way of solar design, because the success of the solar design
is very much dependent on decisions that are made in the schematic design phase(building form, orientation, facade layout, etc.). Also, the addition of a solar systemmay have significant impact on major design issues like comfort, aesthetics, etc.Even if the design process is iterative, there is a limit to how may iterations one mayafford due to time and cost constraints. Figure 2-14 shows that the possibilities of making changes decrease dramatically as the design evolves, and that the costs of change increase similarly after the construction has begun. Thus, the decisions takenearly in the design phase are crucial for the success of the project.
If energy efficiency and the use of renewable energy through solar design are designgoals, this should be incorporated in the list of design criteria that are articulated in
the pre-design stage. The definition of design goals and criteria is discussed in chapter3. In this way, potential solar designs should be evaluated with respect to all designcriteria in the early design phase. To do this, it is necessary to have energy expertiseavailable already at this stage. The team can then evaluate the solar designs withrespect to energy efficiency as well as other important design goals.

8/13/2019 Multi Criteria Sun Calculation House
http://slidepdf.com/reader/full/multi-criteria-sun-calculation-house 42/246
36
Figure 2-14. The possibilities and costs of influencing the functions of the building during the different life cycle stages. Adopted from (Bejrum 1991).
The Canadian project C-2000 (Larsson and Pope 1999), describes an integrateddesign process along these lines. The aim of the project is to help designers achievehigh-performance buildings with low energy consumption and resource use, minimalenvironmental loading, good indoor quality, and improved functionality. The C-2000Integrated Design Process comprise:
• Including a wide range of technical skills in the design team, containing an energy
simulation specialist, and a design facilitator.• Commencing teamwork from the very start of the concept design stage.
• Defining performance goals at the outset and referring to them throughout.
• Preliminary energy analysis in concept design phase.
• Preliminary performance assessment of a broad range design criteria in conceptdesign phase.
Table 2-2 shows solar/low energy issues that need to be considered in the conceptdesign phase. The table is mainly based on preliminary results of the work within the IEA Task 232 project (Jaboyedoff, Schuler et al. 1999), with some additions and
adjustments based on (Wood 1998). The frame around the issues of building siting,layout, energy and costs is meant to designate that there are important interactionsbetween these issues, which need to be taken into account. (GRIP 1998) gives adetailed listing of issues to be considered in the concept design and designdevelopment phases in ecological design of buildings. This list also includesexamples of ecological design goals and examples of means to achieve the goals.
The first three tasks, i.e. design team selection, site analysis and building programanalysis begin in the pre-design phase. The two first tasks will not be dealt with in
2
This is a project within the International Energy Agency, Solar Heating and Cooling Programme,which was initiated in 1997 and ends in 2002. The name of the project is “Optimization of solar energyuse in large buildings”.
possibilitiesfor change
costs ofchange
BRIEF DESIGN CONSTRUCTION USE
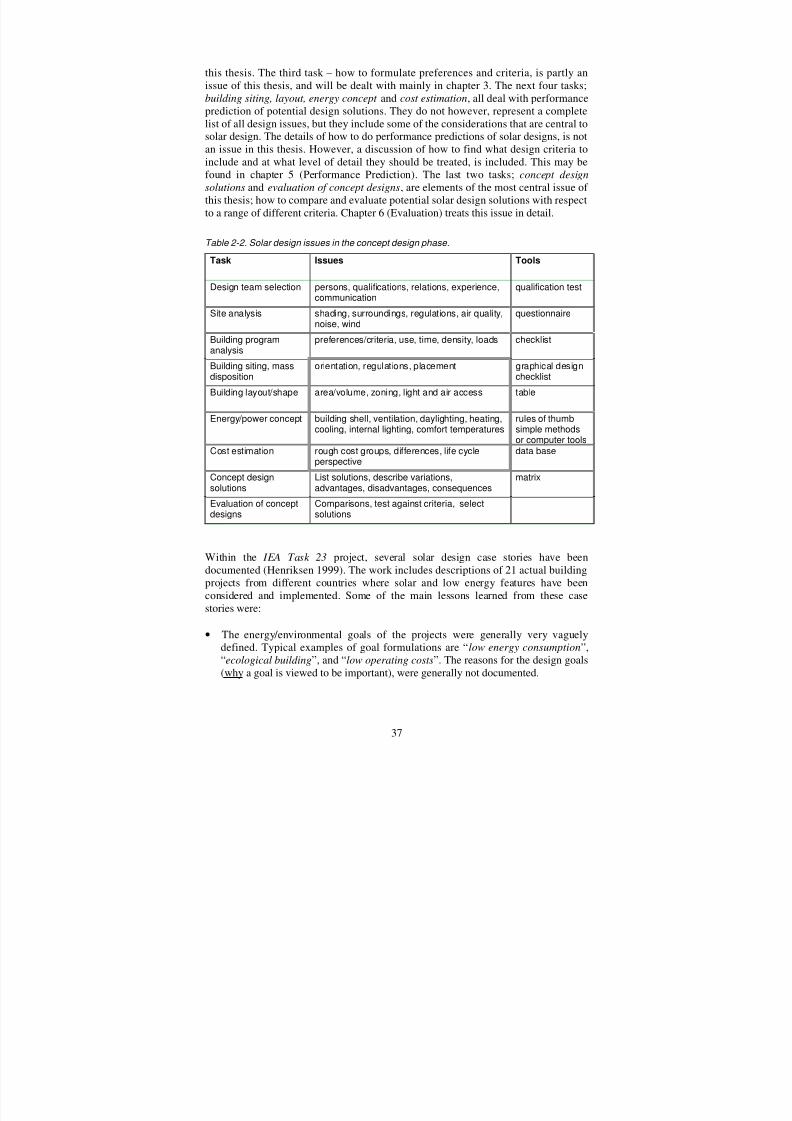
8/13/2019 Multi Criteria Sun Calculation House
http://slidepdf.com/reader/full/multi-criteria-sun-calculation-house 43/246
37
this thesis. The third task – how to formulate preferences and criteria, is partly anissue of this thesis, and will be dealt with mainly in chapter 3. The next four tasks;building siting, layout, energy concept and cost estimation, all deal with performanceprediction of potential design solutions. They do not however, represent a completelist of all design issues, but they include some of the considerations that are central to
solar design. The details of how to do performance predictions of solar designs, is notan issue in this thesis. However, a discussion of how to find what design criteria toinclude and at what level of detail they should be treated, is included. This may befound in chapter 5 (Performance Prediction). The last two tasks; concept designsolutions and evaluation of concept designs, are elements of the most central issue of this thesis; how to compare and evaluate potential solar design solutions with respectto a range of different criteria. Chapter 6 (Evaluation) treats this issue in detail.
Table 2-2. Solar design issues in the concept design phase.
Task Issues Tools
Design team selection persons, qualifications, relations, experience,communication
qualification test
Site analysis shading, surroundings, regulations, air quality,noise, wind
questionnaire
Building programanalysis
preferences/criteria, use, time, density, loads checklist
Building siting, massdisposition
orientation, regulations, placement graphical designchecklist
Building layout/shape area/volume, zoning, light and air access table
Energy/power concept building shell, ventilation, daylighting, heating,cooling, internal lighting, comfort temperatures
rules of thumbsimple methodsor computer tools
Cost estimation rough cost groups, differences, life cycleperspective
data base
Concept designsolutions
List solutions, describe variations,advantages, disadvantages, consequences
matrix
Evaluation of conceptdesigns
Comparisons, test against criteria, selectsolutions
Within the IEA Task 23 project, several solar design case stories have beendocumented (Henriksen 1999). The work includes descriptions of 21 actual buildingprojects from different countries where solar and low energy features have beenconsidered and implemented. Some of the main lessons learned from these casestories were:
• The energy/environmental goals of the projects were generally very vaguelydefined. Typical examples of goal formulations are “low energy consumption”,“ecological building”, and “low operating costs”. The reasons for the design goals(why a goal is viewed to be important), were generally not documented.

8/13/2019 Multi Criteria Sun Calculation House
http://slidepdf.com/reader/full/multi-criteria-sun-calculation-house 44/246
38
• The main obstacles for use of solar strategies were identified as: cost, time, lack of knowledge, appearance, and minimization of risk.
• The main motivations for use of solar strategies were identified as: to save energy,to achieve good comfort, to reduce environmental loading, and to reduce operating
costs.
• Close cooperation between the members of the design team and the client isnecessary to achieve good results. This was reported in almost all case stories.
• Simple calculation tools and rules of thumb were typically used to predictperformance in early design phases. Advanced computer simulation programswere typically used in later design stages.
Thus, the solar design process has many common characteristics with theconventional design process described in section 2.3. The goals are usually not veryclearly defined, and the design criteria include a range of different quantitative andqualitative issues. The integration of the knowledge of different specialists isimperative for the success of the project. The use of advanced computer simulationtools for performance prediction seems to be more prominent in solar buildingprojects than in conventional projects. The next section deals with solar design toolsin more detail.
2.8 Solar Design Tools
Solar energy systems are very much integral parts of the building. Thus, to work efficiently, solar energy systems must be designed with this in mind. This means thatthe interdependencies between the solar systems and the rest of the building; i.g. thestructure, the envelope, the mechanical systems and the interior layout, must becarefully considered. Also, the choice of strategy should be based on a considerationof all design objectives, and not on energy-efficiency alone. The designers need toselect the right technologies and combine and integrate them in the most efficientway. Trade-off considerations between competing solar strategies and conflictingdesign objectives must be carried out. This is the design approach which is the focusof this thesis; the whole-building design approach.
This chapter describes the state of the art of solar design tools, and points out theirmain pros and cons. The existing tools and guidelines to solar building design may beorganized into three main groups:
• Design handbooks or manuals
• Simple calculation methods
• Computer simulation programs
Below, an overview of the most central design approaches is given. Since none of thedesign handbooks or simple calculation methods cover what is inherent in the whole-
building design approach, only brief descriptions of these are presented. However,when it comes to computer tools, there are especially two new programs under
8/13/2019 Multi Criteria Sun Calculation House
http://slidepdf.com/reader/full/multi-criteria-sun-calculation-house 45/246
39
development that contain some of the elements of the whole-building designapproach. These will therefore be described in more detail.
Design handbooks give advice about what issues to consider along with descriptionsof the different technologies and strategies. The majority of available books are
devoted to technical descriptions of different energy related aspects of buildings. Mostare specialized to one main type of technology, for example there are separate booksabout passive solar design, active solar design, photovoltaics, and daylight. Forexample, Heating, Cooling, Lighting. Design Methods for Architects (Lechner 1991),is an excellent and comprehensive design handbook that gives a thorough backgroundon the technical issues of passive solar design. It is meant for the architecturaldesigner to use in the schematic design phase. Solar Engineering of ThermalProcesses (Duffie and Beckman 1991) is a comprehensive textbook on active andpassive solar energy systems, mainly from an engineering point of view. Theemphasis is on active systems, and building integration issues are not treatedcomprehensively. The last edition also includes a brief section on photovoltaic
systems. Photovoltaics in Buildings - A Design Handbook for Architects and Engineers (Sick and Erge 1996) includes both engineering and architectural issuesconcerning the integration of PV in buildings. It also has a brief section on trade-off considerations between competing solar strategies and conflicting design objectives.
All of the available solar energy design handbooks are mainly concerned with theenergy aspect. A few touch upon the issues of comfort, economics and architecturalquality. The issue of environmental loading is barely mentioned in a few of the books.However, there are books on “green” or sustainable building design where solardesign is treated as one of the sub-issues. The recent book A Green Vitrivius (Cofaigh,Fitzgerald et al. 1999), includes small sections on different solar energy strategies.
A few books give advice about how to structure the design work. For example, Solar Energy and Housing Design (Yannas 1994), describes the technical basis for passivesolar design measures, and how these may be treated in the different phases of thedesign process.
No one single book pays special attention to integrated design of the whole range of solar energy strategies with regard to the whole range of design criteria. The BuildingSystems Integration Handbook (Rush 1986) contains detailed descriptions andsystematic handling of the integration of different building systems with respect to six
building performance mandates: spatial performance, thermal performance, airquality, acoustical performance, visual performance, and building integrity. However,innovative energy systems or solar strategies are not included (except for anecdotalreferences), nor is there any reference of environmental loadings.
Simple calculation methods are given in handbooks and in national or internationalstandards like prEN832 (prEN-832 1999), or the coming prEN-ISO-13790 (prEN-ISO-13790 1999). They provide quick estimates of the energy performance of solarsystems based on simplified physical relations, rules of thumb, or experience. Assuch, they may be very useful in an early design stage, to give a rough idea of thepotential energy benefits of different solar design strategies. However, they don’t take
into account all the interdependencies between different energy systems and thelayout of the building, and should be used with caution. The LT Method (Baker and

8/13/2019 Multi Criteria Sun Calculation House
http://slidepdf.com/reader/full/multi-criteria-sun-calculation-house 46/246
40
Steemers 1995) is a simple calculation method that produces estimates of heating,cooling and daylighting performances based on a set of performances curves. Thecurves are drawn from a mathematical model where most parameters are givenassumed values. Only a few key design parameters related to building form andfacade design, glazing ratio, surface to volume ratio, etc., are left for the user to
manipulate. This method gives a picture of the relative importance of the variousenergy components, but says nothing about the impacts on economics, comfort orother issues.
Computer simulation programs. A number of different energy simulation tools havebeen available to the building design community since the mid 70s. The majority of these programs were originally developed in mainframe versions by and for theresearch communities. However, many of the programs are now available inworkstation and personal computer versions. Such programs include among othersTRNSYS (Klein, Beckman et al. 1997), (Schuler, Meyer et al. 1996), DOE-2(Birdshall, Buhl et al. 1990), BLAST (Andersson, Bauman et al. 1997),
SUNCODE/SERI-RES (Berleman 1997), (Judkoff 1997), ESP (Clarke, Evans et al.1997), TSBI3 (Johnsen, Grau et al. 1991), (Christensen and Johnsen 1996). Theprograms contain powerful algorithms to model the thermal behavior of buildingsunder varying environmental conditions. As such, they have the potential to givevaluable input during the building design process for predicting the consequences of different design alternatives with respect to comfort, energy and costs.
However, the traditional programs are so complicated and time consuming that theyare only used late in the design phase, if used at all. Thus, their influence on the finaldesign is limited, since most decisions that have major effect on the energyconsumption are settled in the early design phase. Also, the programs require inputdata at a level of detail that is not available in the early design stage. The output dataare often presented in such a way that they are difficult to interpret for inexperiencedusers. In addition, most of the tools only give answers to specific questions. Forexample, some programs only calculate the energy consumption, others focus on thedaylighting distribution, etc.
A new generation of computer based energy design tools is currently beingintroduced. These tools focus on the user interface and offer the opportunity to getquick and simple estimates of energy performance in the early design phase. A newaspect of these tools are also that they try to view the energy performance in a holistic
perspective, that is, they are including other performance criteria such as daylighting,comfort (room air temperature profiles), economic (LCC) and environmentalconsiderations (emissions of SO2, CO2 and NOX from fuel burning). Two interestingtools of this generation, are Energy-10 (Balcomb, Carrol et al. 1998) and Building Design Advisor (Papamichael, LaPorta et al. 1997).
Energy-10 (Version 1.2), developed by the National Renewable Energy Laboratory isa PC-based building energy simulation program for smaller commercial andinstitutional buildings. It is specifically designed to evaluate energy-efficient featuresin the early design stage. Energy-10 integrates daylighting, passive solar heating andlow-energy cooling with energy-efficient envelope design and mechanical equipment.

8/13/2019 Multi Criteria Sun Calculation House
http://slidepdf.com/reader/full/multi-criteria-sun-calculation-house 47/246
41
Energy-10 is designed to allow for smooth and easy integration of energy efficiencyin the early design. However, the program should also be useful in the later designphase. The figure below shows the intended use of Energy-10 during the designprocess.
Figure 2-15. The use of Energy-10 in the design process (Balcomb and Beeler 1998).
Energy-10 requires only 5 inputs to start the simulation and analysis process:geographic location, total floor space, intended building use, number of stories, andtype of HVAC system. From these basic inputs, Energy-10 automatically creates twosimple “shoebox” buildings: one is a reference building constructed using standardconstruction practices; the other is a low-energy building that incorporates a number
of energy-efficient strategies. The program runs a full year energy simulation andproduces graphical output of heating cooling and lighting performances. The user canselect graphical output in 27 different formats, all of which compare referencebuilding to the low-energy building.
The current version of Energy-10 offers the possibility to apply 10 specific energy-efficient strategies:
Insulation, Thermal mass (of partitions), Passive solar heating (window area andorientation), Glazing (type), Shading (fixed overhangs and sidefins), Energy-efficientlights, Daylighting (on/off and dimming control, window size and placement),
Economizer cycle, High-efficiency HVAC, HVAC Controls (heating setback, coolingsetup, occupancy control).
The energy-efficient strategies are simply applied by checking off the desiredmeasures in a special input window. The program can also do a rank ordering of theenergy-efficient strategies according to their effectiveness. The strategies can beranked by different criteria, such as energy savings, cost savings, or life cycle costs.An example is given in the figure below.

8/13/2019 Multi Criteria Sun Calculation House
http://slidepdf.com/reader/full/multi-criteria-sun-calculation-house 48/246
42
Figure 2-16. Graphical presentation of the results of a ranking of 11 strategies with respect to energy savings.
The Building Design Advisor (BDA) is developed by the Lawrence BerkeleyLaboratory. This PC-based program acts as a data manager and process controller,allowing building designers to benefit from the capabilities of multiple analysis andvisualization tools throughout the design process. The main objectives of thegraphical user interface in BDA are to allow building designers to (Papamichael,LaPorta et al. 1997):
• compare many alternative building designs with respect to many performanceparameters,
• review and edit values of input parameters in a consistent and orderly fashion, and
• select input and output parameters for review and comparison through enhanceddisplay options.
These tasks are carried out by three separate graphical user interface elements; theSchematic Graphic Editor , the Building Browser , and the Decision Desktop.
The Schematic Graphic Editor is a stand-alone, CAD-like application that allows theuser to draw and modify the geometry of a building. As the user creates building
objects, the BDA selects “smart” default values from a Prototypes Database toprepare a complete input for the simulation tools that are linked to BDA. When, for

8/13/2019 Multi Criteria Sun Calculation House
http://slidepdf.com/reader/full/multi-criteria-sun-calculation-house 49/246
43
example, the user draws a space in the Schematic Graphic Editor, BDA automaticallycreates wall, ceiling and floor objects along with default values for all requiredparameters.
The Building Browser (Figure 2-17) allows the users to navigate through the building
representation and view objects and parameters, along with their values. The buildingobjects are displayed in a hierarchical manner, similar to the standard WindowsExplorer. In this way, the user may choose to see as much or as little information ashe desires at the current design stage.
The Decision Desktop (Figure 2-18) allows for decision-making among alternativedesign options offering simultaneous side-by-side comparison with respect to thevarious performance criteria. The current version of BDA offers integratedperformance evaluation with respect to heating and cooling, daylighting, and comfort(room air temperature profiles).
Figure 2-17. The Building Browser.

8/13/2019 Multi Criteria Sun Calculation House
http://slidepdf.com/reader/full/multi-criteria-sun-calculation-house 50/246
44
Figure 2-18. The Decision Desktop.
Conclusions
Available tools and handbooks make it possible to estimate (roughly or detailed) theenergy performance of any isolated solar system or strategy. But the possibility forestimating the combined effect of different systems with respect to different designcriteria, has been rather limited. However, new computer tools are emerging that offerthe possibility to quickly evaluate many different design solutions against a range of different criteria. Although none of the tools currently include all of the major criteriaor solar system types, they seem promising with respect to becoming useful tools forthe whole-building design approach:

8/13/2019 Multi Criteria Sun Calculation House
http://slidepdf.com/reader/full/multi-criteria-sun-calculation-house 51/246
45
• They are quick and simple to use, yet offering advanced simulation possibilities.This means that the designers may get useful feedback on potential designsolutions early in the design stage.
• They offer the possibility of viewing the performance of multiple design options
against a set of different performance criteria (i.e. energy, power, daylight,thermal comfort, and emission of pollutants).
• They offer a certain amount of guidance to the user through listing of energyefficient measures and examples of standard buildings or “best practice”performance.
However, the computer tools only simulate the “hard” values, i.e. the ones that can bequantified numerically. In a building design project, there will always be the need for judgements of some kind. Evaluation of the total goodness of a design also includessoft values such as aesthetics. Conflicting performance goals also call for the need toperform trade-off analyses. This does not mean that advanced computer simulationsare useless in building design. Still, it may be useful to listen to the words of R.E.Straunch (Straunch 1974):
“This is not to denigrate the value of quantitative methodology. It has great potentialvalue, but as an aid to careful and considered human judgement, and not as areplacement for such judgment. When we forget that, and focus our attention toostrongly on our methods and our computations as the source of our answers, we donot only fail to realize that potential, but we run the risk of being seriously misled.The source of knowledge and understanding about squishy problems has always been,
and will continue to be, wise people more than sophisticated methods.
….. And if we fail to make it, there is no way we can realize the real potential of the people or of the methodology we do have available to us. I am not suggesting that wegive up quantitative methods, but rather that we use them with a goodly grain of salt,and that we grant “the computer” no more automatic and unquestioned authoritythan we would grant a shaman or a fortune teller.”
Bryan Lawson (Lawson 1997) uses the case of window design to give an excellentexample of interactive, multi-dimensional design:
As well as letting in daylight and sunlight, and allowing for natural ventilation, thewindow is also usually required to provide a view while retaining privacy. As aninterruption in the external wall, the window poses problems of structural stability,heat loss and noise transmission…… Modern building science techniques havegenerally only provided methods of predicting how well a design solution will work.They are simply tools of evaluation and give no help at all with synthesis. Daylight protractors, heat loss or solar gain calculations do not tell the architect how to designthe window but simply to assess the performance of an already designed window.
Because design problems are so multi-dimensional they are also highly interactive. Enlarging our window may well let in more light and give a better view but this will
also result in more heat loss and may create greater problems of privacy. It is the

8/13/2019 Multi Criteria Sun Calculation House
http://slidepdf.com/reader/full/multi-criteria-sun-calculation-house 52/246
46
very interconnectedness of all these factors which is the essence of design problems,rather than the isolated factors themselves.
Thus, the role of today’s computer tools is mainly to do performance predictions withrespect to some criteria. There is currently no computer tool that can do the entire job
of the building designer, i.e. generate “the optimal solution” on its own. Energy-10does an attempt of guiding the user by providing a list of energy efficient measures tochoose from, and through the use of the RANK function. However, there is noguarantee that this will produce the best possible solution, because there will alwaysbe other possible measures that are not included in the list. Also, there will be othercriteria to be taken into account. The developers of the BDA program have acceptedthis “limit to intelligence in design”, and do not attempt to give any kind of “intelligent” guidance. They restrict the computer assistance to simulation of performance and factual databases. The only guidance that is offered, is through aninternet link to a web page of built examples.
The building designer may use computer tools to do a lot of runs to see theperformance of different design options. At last he may end up with something that heis satisfied with. But how can he be sure he has found the best solution? There is noway that he can try out all possible types of systems and combinations. Also, since theprograms only do performance predictions against some of the design criteria, theoutput from the programs does not represent the total goodness of the design. To dothis, the combined knowledge of all the design professionals is needed. What islacking is a methodology that can help the designers to integrate their efforts in orderto search efficiently towards the best possible solution for their project. Computersimulation programs such as the above, may be useful tools for offering hard data toput into this methodology. However, they can not produce the entire answer to thedesign problem.
2.9 Conclusions
In an attempt to understand the underlying methods used in the creation of a design, agreat deal of analysis has been undertaken of the nature of the intellectual processused by designers. Both prescriptive (normative) and descriptive approaches havebeen devised. What is clear is that there is no single method or system used by alldesigners, nor does any one designer appear to use any single method.
The Swedish design researcher Jerker Lundequist describes design as a process thatstarts out with diffuse goals, and therefore the designer has difficulties in using aspecific method. The methodology that is applied during design is consequently basedon heuristic searching rules, that is experience based rules-of-thumb for informationsearch and problem solving grounded in available information (Lundequist 1998).
It seems like people tend to have individual methods for working that are tailored totheir specific way of seeing the world. Consequently, one should be careful not tospecify a too rigid and universal design methodology. A methodology that works for
one person may be useless to another. In his book “Making it Happen – Reflectionson Leadership”, John Harvey Jones puts it this way:
8/13/2019 Multi Criteria Sun Calculation House
http://slidepdf.com/reader/full/multi-criteria-sun-calculation-house 53/246
47
”I find myself intolerant of management books that seek to prescribe exactly how it should be done. My own experience shows that there are many different ways of achieving one’s aims and many different ways of leading an industrial company… Each one of us has to develop our own style, and our own approach, using such skills
and personal qualities as we have inherited. What each of us does over a long period of trial and error is to acquire a set of tools with which we are comfortable and whichwe can apply in different ways to the myriad problems which we need to solve.”
This represents a very individualistic view. It more or less neglects the fact that itwould be more effective to learn from the experience of others instead of just go on atrial and error trip of our own. Even though a building designer may have his ownstyle, it is probable that his search for good solutions will be more effective if heemploys a structured approach. Also, since good buildings are the products of thecombined efforts of the design team, the members of the design team must have someunderstanding of each other’s methods in order to communicate effectively. This is
not to say that all designers need to have exactly the same approach. Obviously, oneneeds to account for the fact that people are different, and that the people in the designteam are different from project to project.
Based on the previous chapters, the following points towards a structured approach:
• Designers face a lot of information. There are many different issues to include,and the amount of time that can be spent on each issue is limited and needs to bebalanced against the design objectives. The information is easier to handle if it isstructured.
• The high degree of specialization in building design may hamper the commonunderstanding of the problem. Close cooperation between the design professionalsin the early design phase is imperative for the success of solar buildings. Astructured approach may improve information exchange and understanding amongthe different professionals and the client (or other stakeholders).
• Building design is a craft that involves judgments and value conflicts. Astructured approach that aims towards making the value judgements more explicitwould help the transfer of knowledge, and produce a common understandingabout the problems. This would also facilitate the involvement of a wider range of
decision-makers including users of the building, and offer documentation to thewider community. This is particularly important if one wishes to documentenvironmental issues of the building.
The preceding chapters give the following requirements for the multicriteria designapproach:
It should be a relatively open framework.In order to fit into different design processes and suit different designers, it should notbe a rigid methodology, but rather a basic structure that allows the individuals to fit itto their needs. Therefore, we may not call it a method at all, but rather a framework
that can be used to guide the design team through the process.

8/13/2019 Multi Criteria Sun Calculation House
http://slidepdf.com/reader/full/multi-criteria-sun-calculation-house 54/246
48
It should be usable for the early design phase.The decisions taken in the early design phase are crucial for the success of the project.It is therefore most useful to have a framework that can make this process as effective
as possible. However, it would also be useful if the framework could be used in laterdesign stages.
It should be simple, easy, quick to understand and use.Because of the very limited time and resources of the early design phase, the methodhas to be quick and simple to use. This is a fundamental requirement of theframework; without this in place, the “method” would not be used at all. It also has tobe so simple that a range of different professionals can understand it.
It should help understanding and promote communication.Maybe the most important goal of the approach is that it should help the design team
to better understand the problem at hand. By encouraging discussion andcommunication among the participants, misunderstandings, biases and “knowledgeholes” may be uncovered, and a deeper understanding of the “holistic” problem maybe gained. The framework should promote and simplify communication among thedesign professionals, as well as between the design professionals and the client (andother stakeholders).
It should handle values and judgements.To increase a common understanding of the design, the approach should reveal valuesand judgements and make them as explicit as possible. It should also be able to handlevalue conflicts (trade-offs). The framework should support documentation of the judgements.
It should be an aid to organize and select relevant information and to focus on themost important issues.The framework should help the design team to navigate through the huge amount of technical and non-technical information in an effective way. This means to help themfind what issues are most important and relevant for the problem at hand. In this way,the design team would avoid jumping from issue to issue without progress or to getinvolved in heated debates over quite irrelevant issues.
It should comprise the entire life cycle of the building.Buildings have a long service life and the major part of the resources is used after theinitial design has been carried out. The design therefore has to try to incorporatefuture needs.
It should handle uncertainty and fuzziness.Since future needs are hard to predict, the design approach needs to incorporateuncertainty. Also, some design issues can not be formulated exactly, like for exampleaesthetics. Therefore, the approach needs to incorporate vaguely formulated values(qualitative values) as well as quantitative values and uncertainties.
In the previous chapters, several main activities of design were described. Althoughthere are many different approaches used, some activities seem to appear in all design

8/13/2019 Multi Criteria Sun Calculation House
http://slidepdf.com/reader/full/multi-criteria-sun-calculation-house 55/246
49
processes. Since the different tasks are very much interrelated and overlapping intime, it may be difficult to describe them individually. Nevertheless, four mainactivities may be singled out:
• problem formulation
• generation of alternatives• performance prediction
• evaluation of alternatives
The main focus of this thesis is to promote integrated, holistic solar design where alldesign criteria are included in a way that meets the values of the decision-makers. Themost emphasis will be put on the evaluation activity. This is not because thisnecessarily is the most important task in the design process, but because it is a task where there is much to gain from a formal guide. The problem formulation task andthe generation of alternatives rely more on experience, gut feeling and creativity. Withregards to the task of performance prediction, a number of tools already exist that mayhelp the designers a long way (see section 2.8). Nevertheless, there is still much work to be done within the field of performance prediction of solar systems, but this is notthe scope of this thesis. The principles of performance prediction, i.e. the level of detail and measurement techniques, however, are treated in the thesis. It is clear thatthe evaluation task cannot stand alone. To be able to evaluate, some performancecriteria and some alternatives must have been generated. The tasks are very muchinterrelated and overlapping. Also, the process should be iterative. The evaluation task should lead to refinement of the criteria and the alternatives. Therefore, the other tasksare also briefly described, and their relevance to the evaluation task is described.Chapters 3 to 6 are dedicated to a description of each of the four design tasks
separately.
8/13/2019 Multi Criteria Sun Calculation House
http://slidepdf.com/reader/full/multi-criteria-sun-calculation-house 56/246

8/13/2019 Multi Criteria Sun Calculation House
http://slidepdf.com/reader/full/multi-criteria-sun-calculation-house 57/246
51
Values are what we care about. As such, values should be the driving force for our decision-making. They should be the basis for the time and effort we spend thinkingabout decisions. But this is not the way it is. It is not even close to the way it is. Instead, decision-making usually focuses on the choice among alternatives available. It seems like as if the alternatives present themselves and the decision problem begins
when at least two alternatives have appeared.
Keeney’s theory of value focused thinking is comprehensively described in his book,and can’t possibly be cited in detail here. However, the main principles of the modelare considered to be important in this context. This is because the theory lays theground for identifying and structuring objectives in order to be able to judge theconsequences of several alternatives, assessing their relative desirability andperforming sensitivity analysis of the results. The explicit value judgements are madepossible through the value model, which forms the basis for evaluating thealternatives. Therefore, the main principles and background for Keeney’s theory aredescribed in the following.
The essence of value focused thinking is that values should be identified before thealternatives. This is opposed to alternative focused thinking where values areidentified after the alternatives. Keeney argues that thinking about values is thinkingabout what you wish to achieve in a constraint-free way. Therefore it broadens thesolution space and promotes creativity. Keeney describes several advantages of usingvalue-focused thinking, they include:
• Uncovering hidden objectives. Thinking about values naturally provides an initiallist of conscious values. This thinking may also provide keys to identifypreviously subconscious values.
• Guiding information collection. Values indicate what information is important.Specifying the values first will therefore prevent you from time-consuming effortsto collect information that turns out to be useless.
• Improving communication. The language of value-focused thinking is thecommon language about the achievement of objectives in any particular decisioncontext. It is not the language of many specialties. This basis in common languageshould facilitate communication and understanding.
• Facilitating involvement in multiple-stakeholder decisions. Value-focusedthinking makes the values explicit. This makes it possible to separatedisagreements about possible consequences from disagreements about the relative
desirability of those consequences. Otherwise, if the values are not explicitlyconsidered, disagreements must be addressed in a general discussion aboutalternatives. Value-focused thinking may therefore help identify the basis forconflicts.
• Evaluating alternatives. Value judgements can be used to evaluate the relativedesirability of alternatives. If the objectives are incomplete or not clearly defined,the insights based on evaluation with that value model are not sound.
• Creating alternatives. Value-focused thinking enhance the creation of desirablealternatives.
Keeney’s value focused thinking can be described as a four-part concept:
1. Definition of the decision context .

8/13/2019 Multi Criteria Sun Calculation House
http://slidepdf.com/reader/full/multi-criteria-sun-calculation-house 58/246
52
2. Identification of the fundamental objectives representing the values of the decision-maker4.
3. Identification of the mechanisms by which the objectives can be achieved, i.e. themeans objectives.
4. Identification of the alternatives which have control over the mechanisms.
The broadest decision context for any decision-maker is the strategic decision context .It is defined by the set of all possible alternatives available to that decision-maker.The fundamental objectives corresponding to the strategic decision context are thedecision-maker’s ultimate end objectives; the strategic objectives. For a company, thestrategic decision context may be “management of the firm”. The fundamentalobjective in this context may be “to maximize the profits”. Rarely are decisionsaddressed on the strategic level. The focus is almost always on more limited decisionsituations. It is therefore necessary to reduce the decision frame to foster usefulthinking and analyses. This is done in two ways: the decision context is reduced sothat fewer alternatives are appropriate, and, the fundamental objective for the decision
context is reduced to limit the set of consequences of concern.
A fundamental objective characterizes an essential reason for interest in the decisionsituation. A means objective is of interest in the decision context because of itsimplications for the degree to which another (more fundamental) objective can beachieved. A means objective for a company with the fundamental objective“maximize the profits” may for example be “to decrease the sick leaves”. Keeneyargues that means objectives are useful for developing models to analyze decisionproblems and for creating alternatives. However, it is the fundamental objectives thatare essential to guide all the effort in decision situations and in the evaluation of alternatives. In order to be useful for guiding all decisions, the objectives should beprecisely, completely and unambiguously formulated. Keeney states that one of themost common mistakes is to formulate objectives that are too general to be useful.
To illustrate the relationship between different decision contexts and objectives,Keeny presents the decision frame of value focused thinking shown in Figure 3-2.This decision-frame is contrasted to the frame of alternative focused thinking, shownin Figure 3-1. In this figure, the framework is drawn with broken lines to make thepoint about what is missing; the fundamental objectives and the decision contextwhich are not usually made explicit with alternative focused thinking. Points A, B,and C represent the alternatives in the set of all decisions. These alternatives are
evaluated using a means objective or a set of means objectives. There is notnecessarily a match between these objective and the available alternatives. Pictorially,there are several points representing alternatives near alternatives A, B, and C inFigure 3-2 which are not identified and yet could contribute to the same meansobjective.
4 A decision-maker is defined to be an individual or organization or any other decision-making entity.

8/13/2019 Multi Criteria Sun Calculation House
http://slidepdf.com/reader/full/multi-criteria-sun-calculation-house 59/246
53
Figure 3-1. Alternative-focused thinking with alternatives A, B, and C indicated, (Keeney 1992).
Figure 3-2. The decision frame for value-focused thinking, (Keeney 1992).
Keeny suggests that the process of framing the decision situation is likely to beginwith an intuitive rough-cut that may not be very distinct from the frame provided byalternative-focused thinking. The first step of value-focused thinking is to broaden thedecision situation and define it more carefully. The critical task at this stage is to
define the fundamental objectives for the decision context. To do this, Keeneysuggests working in two directions. The means objectives in Figure 3-2 are pushedout using a means-end logic until fundamental objectives for the evolving decisionsituation are found. From the other direction, one works back from the strategicobjective, or from other stated sets of broad objectives, to generate fundamentalobjectives for the given decision. At this point one returns to the decision context tobroaden it, that is, to increase the range of potential alternatives, and to match thedecision context to the fundamental objectives. Essentially, the decision context is theanswer to the question “What is the set of all alternatives that can affect theachievement of the fundamental objectives?”
This procedure might seem quite abstract and theoretical, but Keeney lists 10 morespecific devices that can help to stimulate the identification of objectives:
8/13/2019 Multi Criteria Sun Calculation House
http://slidepdf.com/reader/full/multi-criteria-sun-calculation-house 60/246
54
1. Use of a wish list. The decision-makers states ideal, qualitative objectives withoutlimitations.
2. Use of alternatives. Exciting or hypothetical alternatives may be a useful source of objectives. By articulating features that distinguish between alternatives (best and
worst), related objectives may be discovered.
3. Use of problems and shortcomings. Articulating problems and shortcomings, aswell as their reasons, may uncover hidden objectives.
4. Use of consequences. By describing the consequences of alternative actions,associated objectives are identified.
5. Use of goals, constraints, and guidelines. A goal is a standard that defines aspecific level of achievement. Constraints define the limits within which theacceptable solutions lie. It may be useful to identify the objectives that may meet
the goals or satisfy the constraints. Guidelines are less definitive than goals andconstraints. They only indicate, perhaps strongly either objectives or alternativesthat should or should not be considered.
6. Use of different perspectives. Viewing the issue from different perspectives, forexample by taking the perspective of different stakeholders or viewing the presentfrom the future, may reveal new objectives.
7. Use of strategic objectives. Strategic objectives are the ultimate objectives of adecision-maker. A specific decision context is only part of a large one, which isitself only a part of a still larger one, until the strategic decision context is reached.If the fundamental objectives of the broader context have been articulated, one cangenerate objectives for the narrower context by asking, for each fundamentalobjective in turn, what can be done in the present decision context to contribute toits achievement.
8. Use of generic objectives. Whereas strategic objectives are intended to define theconcerns of a single decision-maker, generic objectives attempt to define theconcerns for all decision-makers in a single decision situation. For some types of decisions, the development of generic objective hierarchies may be useful tooutline the key concerns of interest. The generic hierarchy provides a basis for
identifying specific objectives in a given decision situation.
9. Use of structuring objectives. In structuring objectives they become more clearlydefined, related to one another, and related to objectives not yet identified.
10. Use of quantifying objectives. Quantifying objectives clarifies the meanings of theobjectives, and this clarity uncovers hidden objectives and facilitates all aspects of decision-making. The process involves the identification of attributes and theconstruction of a value model. The identification of objectives and thespecification of attributes are intertwined processes. Attributes measure the degreeto which an objective is met by various alternatives. The objectives give a
preference orientation with respect to these attributes. In some cases the attributesare identified before the objectives, and in other cases the objectives are identified
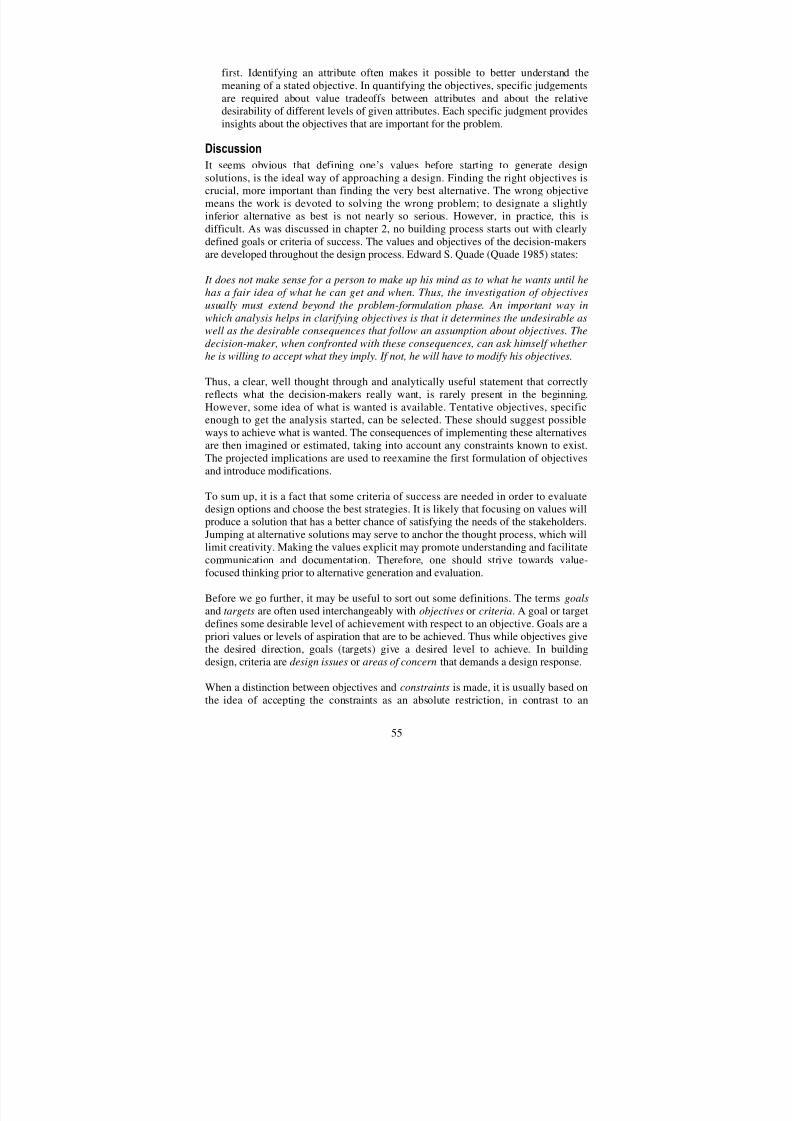
8/13/2019 Multi Criteria Sun Calculation House
http://slidepdf.com/reader/full/multi-criteria-sun-calculation-house 61/246
55
first. Identifying an attribute often makes it possible to better understand themeaning of a stated objective. In quantifying the objectives, specific judgementsare required about value tradeoffs between attributes and about the relativedesirability of different levels of given attributes. Each specific judgment providesinsights about the objectives that are important for the problem.
Discussion
It seems obvious that defining one’s values before starting to generate designsolutions, is the ideal way of approaching a design. Finding the right objectives iscrucial, more important than finding the very best alternative. The wrong objectivemeans the work is devoted to solving the wrong problem; to designate a slightlyinferior alternative as best is not nearly so serious. However, in practice, this isdifficult. As was discussed in chapter 2, no building process starts out with clearlydefined goals or criteria of success. The values and objectives of the decision-makersare developed throughout the design process. Edward S. Quade (Quade 1985) states:
It does not make sense for a person to make up his mind as to what he wants until hehas a fair idea of what he can get and when. Thus, the investigation of objectivesusually must extend beyond the problem-formulation phase. An important way inwhich analysis helps in clarifying objectives is that it determines the undesirable aswell as the desirable consequences that follow an assumption about objectives. Thedecision-maker, when confronted with these consequences, can ask himself whether he is willing to accept what they imply. If not, he will have to modify his objectives.
Thus, a clear, well thought through and analytically useful statement that correctlyreflects what the decision-makers really want, is rarely present in the beginning.
However, some idea of what is wanted is available. Tentative objectives, specificenough to get the analysis started, can be selected. These should suggest possibleways to achieve what is wanted. The consequences of implementing these alternativesare then imagined or estimated, taking into account any constraints known to exist.The projected implications are used to reexamine the first formulation of objectivesand introduce modifications.
To sum up, it is a fact that some criteria of success are needed in order to evaluatedesign options and choose the best strategies. It is likely that focusing on values willproduce a solution that has a better chance of satisfying the needs of the stakeholders.Jumping at alternative solutions may serve to anchor the thought process, which will
limit creativity. Making the values explicit may promote understanding and facilitatecommunication and documentation. Therefore, one should strive towards value-focused thinking prior to alternative generation and evaluation.
Before we go further, it may be useful to sort out some definitions. The terms goalsand targets are often used interchangeably with objectives or criteria. A goal or targetdefines some desirable level of achievement with respect to an objective. Goals are apriori values or levels of aspiration that are to be achieved. Thus while objectives givethe desired direction, goals (targets) give a desired level to achieve. In buildingdesign, criteria are design issues or areas of concern that demands a design response.
When a distinction between objectives and constraints is made, it is usually based onthe idea of accepting the constraints as an absolute restriction, in contrast to an

8/13/2019 Multi Criteria Sun Calculation House
http://slidepdf.com/reader/full/multi-criteria-sun-calculation-house 62/246
56
objective that may be open-ended. While the objectives suggest the alternatives, theconstraints restrict them and reduce the number of possibilities that can be considered.When there are several objectives they can always be traded off at the margin if thisleads to an improvement in the total utility. A constraint cannot be so exchanged, forits logical force resides wholly in its inviolability. The designers may look beyond the
less rigid constraints set by the decision-maker to see if the gains resulting fromrelaxing them would justify the sacrifice. In the formulation and analysis of criteria inbuilding design, neither objectives nor constraints should be treated as inviolable, butshould be scrutinized from many points of view as the analysis proceeds and newpossibilities emerge.
In this thesis, the word performance criteria will be used to designate the issues thatneed to be considered and optimized against in a design. The performance criteria arethe basis for the evaluation of the goodness of a design option or the value of thebuilding. The value of a building is related to how well it fulfills its purpose. Theultimate purpose of an office building may for example be to provide an environment
in which the workers can feel comfortable and be able to produce goods effectively.Markus and Alexander (1997) have described a model that links the technical buildingsystem to the work environment and the objectives system of an organization. Thissystem is illustrated in Figure 3-3. Here, the building system is depicted as a part of the total value system of an organization.
Shell
Services
Scenery
Set
Cost ofprovision
Real value
BUILDINGSYSTEM
Spatial
Visual
Cost ofmaintenance
Usevalue
ENVIRONMENTALSYSTEM
Identification
Control
Informal
activities
Cost ofproduction
Productivity
ACTIVITIESSYSTEM
Production
Adaptability
Morale
Stability
Valueachievingobjectives
OBJECTIVESSYSTEM
Work-
flow
BUILDING PROFILE ORGANIZATIONAL PROFILE
+ + >
=<
ECONOMIC INVESTMENT RETURN
Physical
Communication
SYSTEM
Figure 3-3. The Facilities Management Model, adapted from (Markus and Alexander 1997) by (Andresen and Blakstad 1997).
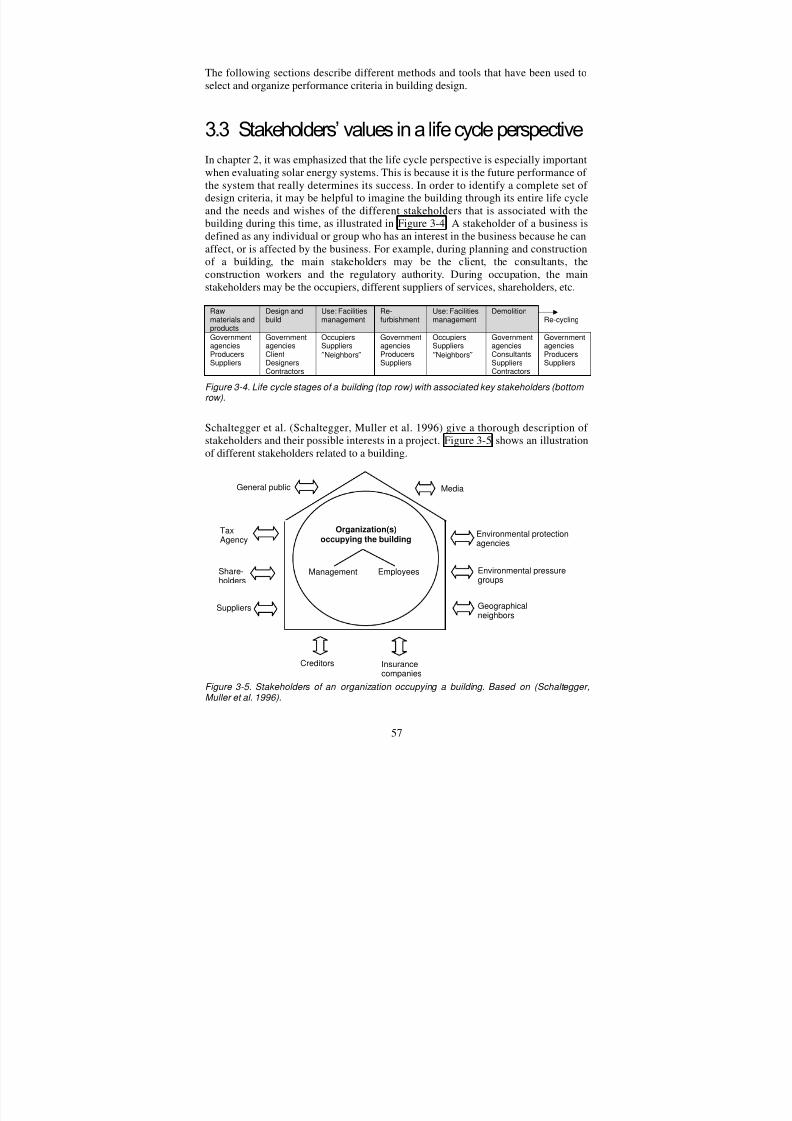
8/13/2019 Multi Criteria Sun Calculation House
http://slidepdf.com/reader/full/multi-criteria-sun-calculation-house 63/246
57
The following sections describe different methods and tools that have been used toselect and organize performance criteria in building design.
3.3 Stakeholders’ values in a life cycle perspectiveIn chapter 2, it was emphasized that the life cycle perspective is especially importantwhen evaluating solar energy systems. This is because it is the future performance of the system that really determines its success. In order to identify a complete set of design criteria, it may be helpful to imagine the building through its entire life cycleand the needs and wishes of the different stakeholders that is associated with thebuilding during this time, as illustrated in Figure 3-4. A stakeholder of a business isdefined as any individual or group who has an interest in the business because he canaffect, or is affected by the business. For example, during planning and constructionof a building, the main stakeholders may be the client, the consultants, the
construction workers and the regulatory authority. During occupation, the mainstakeholders may be the occupiers, different suppliers of services, shareholders, etc.
Rawmaterials andproducts
Design andbuild
Use: Facilitiesmanagement
Re-furbishment
Use: Facilitiesmanagement
DemolitionRe-cycling
GovernmentagenciesProducersSuppliers
GovernmentagenciesClientDesignersContractors
OccupiersSuppliers″Neighbors″
GovernmentagenciesProducersSuppliers
OccupiersSuppliers″Neighbors″
GovernmentagenciesConsultantsSuppliersContractors
GovernmentagenciesProducersSuppliers
Figure 3-4. Life cycle stages of a building (top row) with associated key stakeholders (bottom row).
Schaltegger et al. (Schaltegger, Muller et al. 1996) give a thorough description of stakeholders and their possible interests in a project. Figure 3-5 shows an illustrationof different stakeholders related to a building.
Figure 3-5. Stakeholders of an organization occupying a building. Based on (Schaltegger,Muller et al. 1996).
Organization(s)occupying the building
Management Employees
Media
Geographicalneighbors
Environmental pressuregroups
Environmental protectionagencies
Insurancecompanies
Share-holders
Suppliers
TaxAgency
General public
Creditors

8/13/2019 Multi Criteria Sun Calculation House
http://slidepdf.com/reader/full/multi-criteria-sun-calculation-house 64/246
58
Dependent on the type of building process, the different stakeholders may be more orless significant. For example, in public building projects the general public would bemore important than in private projects because public funds are being spent. Morton(Morton and Jaggar 1995) identifies three main groups of stakeholders of a building:
• The building occupiers (who may or may not be the owners)• The developers
• The providers of finance
Occupiers may be any kind of commercial organization, ranging from very largebusinesses occupying the whole of a major building, to small businesses occupying asingle floor or even just a single office.
The developers organize the purchase of the land, carry out feasibility studies todetermine the most profitable form of project, arrange finance, have the buildingdesigned and built, then ultimately sold or rented out. All these functions may actuallybe performed by different consultant organizations, but the developer will often be themain coordinator and organizer.
The financial institutions may be banks, pension funds, or insurance companies. Twotypes of finance are required. First, money need to be borrowed to cover theconstruction period, to pay for the land, the building itself and all the associated costsof bringing a project to the stage where it can be occupied. Secondly, long-termfinance is required. Developers may want to sell the property and reap their profitquickly; but at some point one organization has to be prepared to forgo cash for a longperiod of time – to sink money in the property, which will yield a return only over
many years.
3.4 Tools and Methods for Organizing andSelecting Performance Criteria
Structuring the criteria is useful because it provides a common framework and asyntax that all the decision-makers can relate to when evaluating design options. Thiswill facilitate communication and help the participants keep track of the designdevelopments. The structuring process may in itself help make clear the objectivesand it may help uncover criteria. A structure may also help secure that all importantissues have been included. Issue-based categorization provides a structured way tohandle the vast amount of information.
Numerous methodologies for organizing information have been developed and used,and still additional methods are emerging. There is no “universal” methodology thatcan be applied to all project types in all settings. It is also unlikely that an all-purposemethodology will ever be developed, given the changing nature of the buildingindustry and the uniqueness of building projects. Thus, the methodologies forinformation management should be considered as tools that can be used as aides in the
design process.

8/13/2019 Multi Criteria Sun Calculation House
http://slidepdf.com/reader/full/multi-criteria-sun-calculation-house 65/246
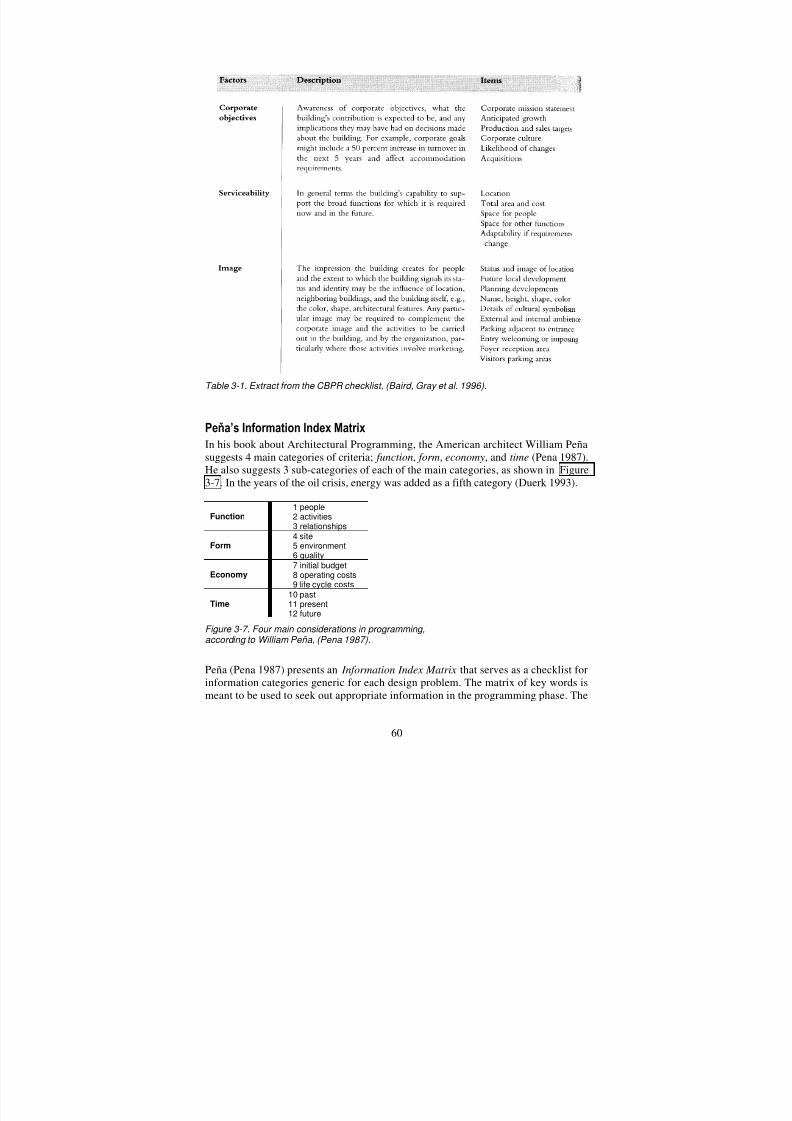
8/13/2019 Multi Criteria Sun Calculation House
http://slidepdf.com/reader/full/multi-criteria-sun-calculation-house 66/246
60
Table 3-1. Extract from the CBPR checklist, (Baird, Gray et al. 1996).
Pe!a’s Information Index Matrix
In his book about Architectural Programming, the American architect William Peñasuggests 4 main categories of criteria; function, form, economy, and time (Pena 1987).He also suggests 3 sub-categories of each of the main categories, as shown in Figure3-7. In the years of the oil crisis, energy was added as a fifth category (Duerk 1993).
Function1 people2 activities3 relationships
Form
4 site
5 environment6 quality
Economy7 initial budget8 operating costs9 life cycle costs
Time10 past11 present12 future
Figure 3-7. Four main considerations in programming,according to William Peña, (Pena 1987).
Peña (Pena 1987) presents an Information Index Matrix that serves as a checklist for
information categories generic for each design problem. The matrix of key words ismeant to be used to seek out appropriate information in the programming phase. The

8/13/2019 Multi Criteria Sun Calculation House
http://slidepdf.com/reader/full/multi-criteria-sun-calculation-house 67/246
61
issue categories (function, form, economy and time) are crossed with the five steps of programming: 1) establish goals, 2) collect facts 3) uncover concepts, 4) determineneeds, and 5) state the problem. Each cell contains a list of issues that need to betaken into account in order to be an appropriate information base for the design.
Goals Facts Concepts Needs Problem
Function
Form
Economy
Time
Figure 3-8. Peña’s Information Matrix, (Pena 1987).
Palmer’s Model
The American architect Mickey A. Palmer used another set of categories forpartitioning and organizing programming information (Palmer 1981). His matrix hasone dimension consisting of Human factors, Physical Factors, and External Factorsrelated to a design problem. The second dimension includes Ascertainments (factsabout the existing state), Predictions (trends, growth potential, etc.), andRecommendations (for the future state).
Ascertainments Predictions Recommendations
Human Factors
Physical Factors
External Factors
Figure 3-9. Palmer’s Model, (Palmer 1981).
Each of these categories has sub-categories. The cells in the matrix are specific areasfor gathering, organizing, and analyzing information.
This model is criticized by Duerk (Duerk 1993) in that it blurs the lines betweencategories. Information about behavior is listed in both the Human Factors and thePhysical Factors Categories. Codes are listed under External Factors and HumanFactors, etc. Thus overlap of categories makes it difficult to keep all informationorganized and readily accessible.
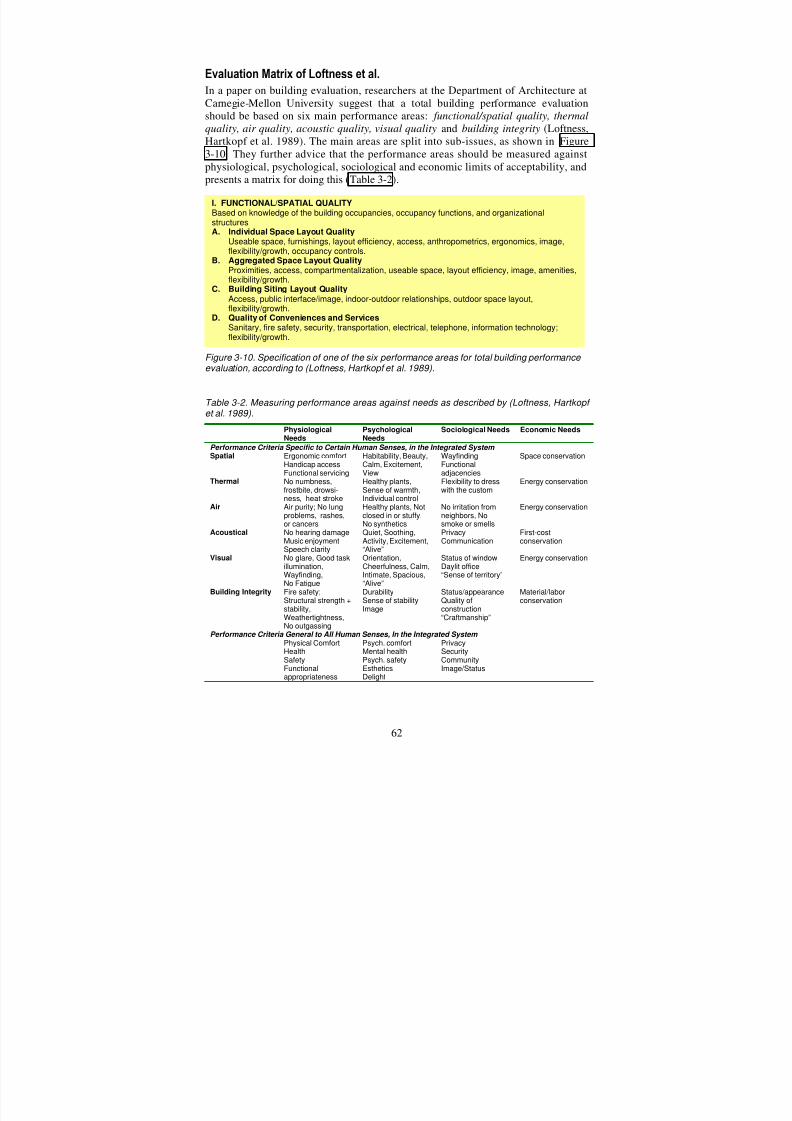
8/13/2019 Multi Criteria Sun Calculation House
http://slidepdf.com/reader/full/multi-criteria-sun-calculation-house 68/246
62
Evaluation Matrix of Loftness et al.
In a paper on building evaluation, researchers at the Department of Architecture atCarnegie-Mellon University suggest that a total building performance evaluationshould be based on six main performance areas: functional/spatial quality, thermalquality, air quality, acoustic quality, visual quality and building integrity (Loftness,Hartkopf et al. 1989). The main areas are split into sub-issues, as shown in Figure3-10. They further advice that the performance areas should be measured againstphysiological, psychological, sociological and economic limits of acceptability, andpresents a matrix for doing this (Table 3-2).
Figure 3-10. Specification of one of the six performance areas for total building performance evaluation, according to (Loftness, Hartkopf et al. 1989).
Table 3-2. Measuring performance areas against needs as described by (Loftness, Hartkopf
et al. 1989).
PhysiologicalNeeds
PsychologicalNeeds
Sociological Needs Economic Needs
Performance Criteria Specific to Certain Human Senses, in the Integrated System Spatial Ergonomic comfort
Handicap accessFunctional servicing
Habitability, Beauty,Calm, Excitement,View
WayfindingFunctionaladjacencies
Space conservation
Thermal No numbness,frostbite, drowsi-ness, heat stroke
Healthy plants,Sense of warmth,Individual control
Flexibility to dresswith the custom
Energy conservation
Air Air purity; No lungproblems, rashes,or cancers
Healthy plants, Notclosed in or stuffy,No synthetics
No irritation fromneighbors, Nosmoke or smells
Energy conservation
Acoustical No hearing damageMusic enjoyment
Speech clarity
Quiet, Soothing,Activity, Excitement,
“Alive”
PrivacyCommunication
First-costconservation
Visual No glare, Good taskillumination,Wayfinding,No Fatigue
Orientation,Cheerfulness, Calm,Intimate, Spacious,“Alive”
Status of windowDaylit office“Sense of territory”
Energy conservation
Building Integrity Fire safety;Structural strength +stability,Weathertightness,No outgassing
DurabilitySense of stabilityImage
Status/appearanceQuality ofconstruction“Craftmanship”
Material/laborconservation
Performance Criteria General to All Human Senses, In the Integrated System Physical ComfortHealthSafetyFunctionalappropriateness
Psych. comfortMental healthPsych. safetyEstheticsDelight
PrivacySecurityCommunityImage/Status
I. FUNCTIONAL/SPATIAL QUALITYBased on knowledge of the building occupancies, occupancy functions, and organizationalstructuresA. Individual Space Layout Quality
Useable space, furnishings, layout efficiency, access, anthropometrics, ergonomics, image,flexibility/growth, occupancy controls.
B. Aggregated Space Layout Quality
Proximities, access, compartmentalization, useable space, layout efficiency, image, amenities,flexibility/growth.C. Building Siting Layout Quality
Access, public interface/image, indoor-outdoor relationships, outdoor space layout,flexibility/growth.
D. Quality of Conveniences and ServicesSanitary, fire safety, security, transportation, electrical, telephone, information technology;flexibility/growth.
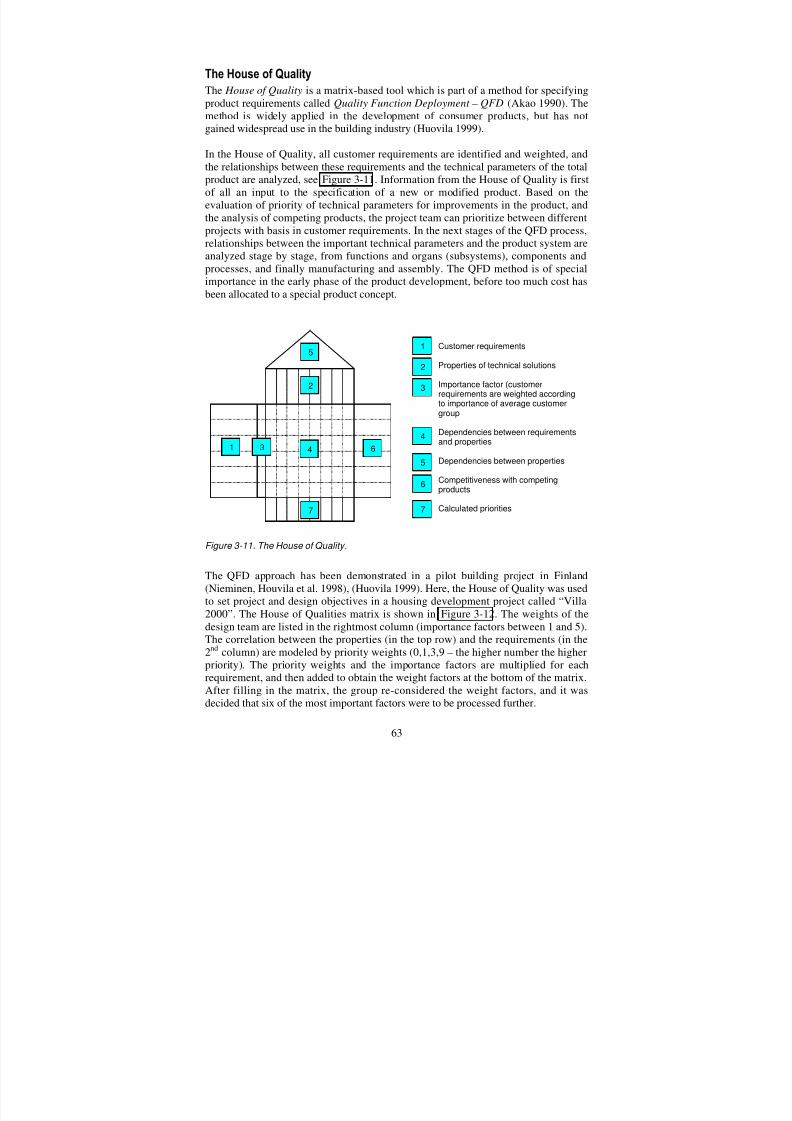
8/13/2019 Multi Criteria Sun Calculation House
http://slidepdf.com/reader/full/multi-criteria-sun-calculation-house 69/246
63
The House of Quality
The House of Quality is a matrix-based tool which is part of a method for specifyingproduct requirements called Quality Function Deployment – QFD (Akao 1990). Themethod is widely applied in the development of consumer products, but has notgained widespread use in the building industry (Huovila 1999).
In the House of Quality, all customer requirements are identified and weighted, andthe relationships between these requirements and the technical parameters of the totalproduct are analyzed, see Figure 3-11. Information from the House of Quality is firstof all an input to the specification of a new or modified product. Based on theevaluation of priority of technical parameters for improvements in the product, andthe analysis of competing products, the project team can prioritize between differentprojects with basis in customer requirements. In the next stages of the QFD process,relationships between the important technical parameters and the product system areanalyzed stage by stage, from functions and organs (subsystems), components and
processes, and finally manufacturing and assembly. The QFD method is of specialimportance in the early phase of the product development, before too much cost hasbeen allocated to a special product concept.
Figure 3-11. The House of Quality.
The QFD approach has been demonstrated in a pilot building project in Finland(Nieminen, Houvila et al. 1998), (Huovila 1999). Here, the House of Quality was usedto set project and design objectives in a housing development project called “Villa2000”. The House of Qualities matrix is shown in Figure 3-12. The weights of thedesign team are listed in the rightmost column (importance factors between 1 and 5).The correlation between the properties (in the top row) and the requirements (in the2nd column) are modeled by priority weights (0,1,3,9 – the higher number the higherpriority). The priority weights and the importance factors are multiplied for eachrequirement, and then added to obtain the weight factors at the bottom of the matrix.After filling in the matrix, the group re-considered the weight factors, and it wasdecided that six of the most important factors were to be processed further.
1 3 4
7
6
2
5 Customer requirements
Properties of technical solutions
Importance factor (customerrequirements are weighted accordingto importance of average customer
group
Dependencies between requirementsand properties
Dependencies between properties
Competitiveness with competingproducts
Calculated priorities
3
4
5
6
7
1
2
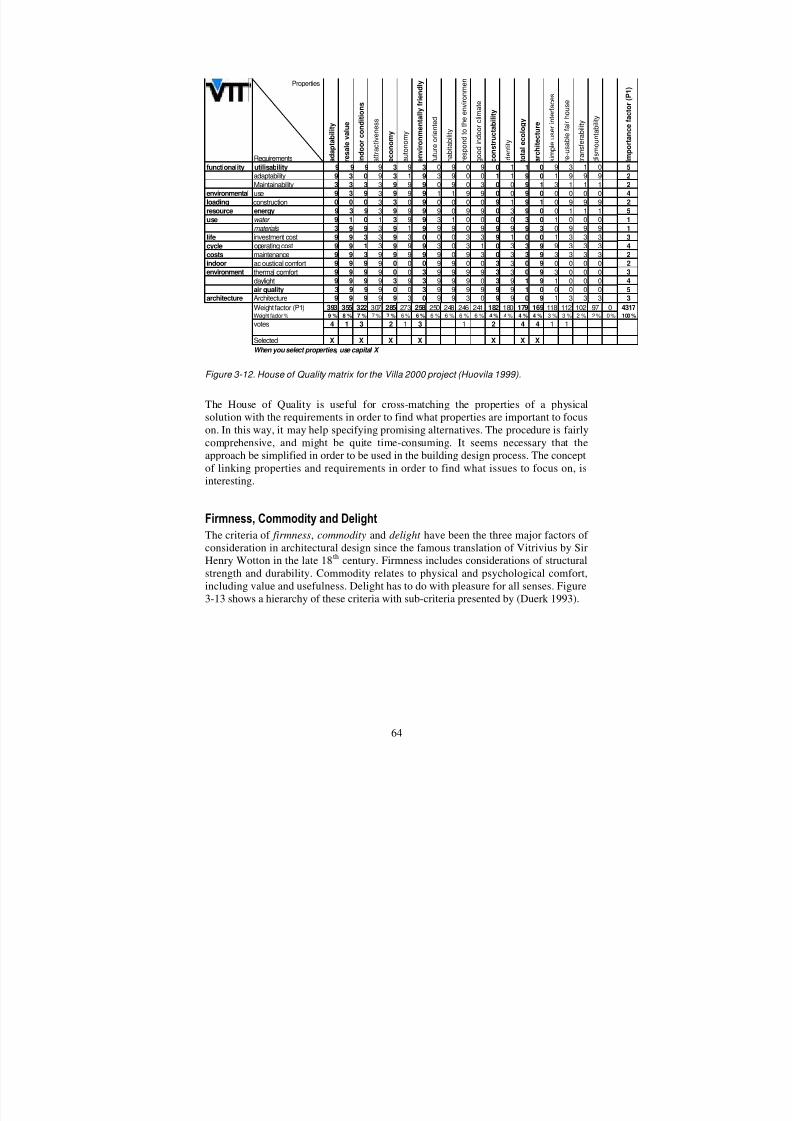
8/13/2019 Multi Criteria Sun Calculation House
http://slidepdf.com/reader/full/multi-criteria-sun-calculation-house 70/246
64
Requirements a d a p t a b
i l i t y
r e s a
l e v a
l u e
i n d o o r c
o n
d i t i o n s
a t t r a c t i v e
n e s s
e c o n o m
y
a u t o n o m
y
e n v
i r o n m e n t a
l l y f r i e n
d l y
f u t u r e o r i e n t e d
h a b i t a b i l i t y
r e s p o n d
t o t h e e n v i r o n m e n
g o o d i n d
o o r c l i m a t e
c o n s t r u c t a
b i l i t y
i d e n t i t y
t o t a
l e c o
l o g y
a r c
h i t e c
t u r e
s i m p l e u s e r i n t e r f a c e s
r e - u s a b l e f a i r h o u s e
t r a n s f e r a
b i l i t y
d i s m o u n
t a b i l i t y
I m p o r t a n c e
f a c t o r
( P 1 )
functionality utilisability 9 9 9 9 3 9 3 0 9 0 9 0 1 1 0 9 3 1 0 5
adaptability 9 3 0 9 3 1 9 3 9 0 0 1 1 9 0 1 9 9 9 2
Maintainability 3 3 3 3 9 9 9 0 9 0 3 0 0 9 1 3 1 1 1 2
environmental use 9 3 9 3 9 9 9 1 1 9 9 0 0 9 0 0 0 0 0 4
loading construction 0 0 0 3 3 0 9 0 0 0 0 9 1 9 1 0 9 9 9 2
resource energy 9 3 9 3 9 9 9 9 0 9 9 0 3 9 0 0 1 1 1 5
use water 9 1 0 1 3 9 9 3 1 0 0 0 0 3 0 1 0 0 0 1
materials 3 9 9 3 9 1 9 9 9 0 9 9 9 9 3 0 9 9 9 1
life investment cost 9 9 3 3 9 3 0 0 0 3 3 9 1 0 0 1 3 3 3 3
cycle operating cost 9 9 1 3 9 9 9 3 0 3 1 0 3 3 9 9 3 3 3 4
costs maintenance 9 9 3 9 9 9 9 9 0 9 3 0 3 3 9 3 3 3 3 2
indoor ac oustical comfort 9 9 9 9 0 0 0 9 9 0 0 3 3 0 9 0 0 0 0 2
environment thermal comfort 9 9 9 9 0 0 3 9 9 9 9 3 3 0 9 3 0 0 0 3daylight 9 9 9 9 3 9 3 9 9 9 0 3 9 1 9 1 0 0 0 4
air quality 3 9 9 9 0 0 3 9 9 9 9 9 9 1 0 0 0 0 0 5
architecture Architecture 9 9 9 9 9 3 0 9 9 3 0 9 9 0 9 1 3 3 3 3
Weight factor (P1) 393 355 322 307 285 273 258 250 248 246 241 182 180 179 169 118 112 102 97 0 4317Weight factor% 9 % 8 % 7 % 7 % 7 % 6 % 6 % 6 % 6 % 6 % 6 % 4 % 4 % 4 % 4 % 3 % 3 % 2 % 2 % 0 % 100 %
votes 4 1 3 2 1 3 1 2 4 4 1 1
Selected X X X X X X X
When you select properties, use capital X
Properties
Figure 3-12. House of Quality matrix for the Villa 2000 project (Huovila 1999).
The House of Quality is useful for cross-matching the properties of a physicalsolution with the requirements in order to find what properties are important to focuson. In this way, it may help specifying promising alternatives. The procedure is fairlycomprehensive, and might be quite time-consuming. It seems necessary that theapproach be simplified in order to be used in the building design process. The conceptof linking properties and requirements in order to find what issues to focus on, isinteresting.
Firmness, Commodity and Delight
The criteria of firmness, commodity and delight have been the three major factors of
consideration in architectural design since the famous translation of Vitrivius by SirHenry Wotton in the late 18th century. Firmness includes considerations of structuralstrength and durability. Commodity relates to physical and psychological comfort,including value and usefulness. Delight has to do with pleasure for all senses. Figure3-13 shows a hierarchy of these criteria with sub-criteria presented by (Duerk 1993).

8/13/2019 Multi Criteria Sun Calculation House
http://slidepdf.com/reader/full/multi-criteria-sun-calculation-house 71/246
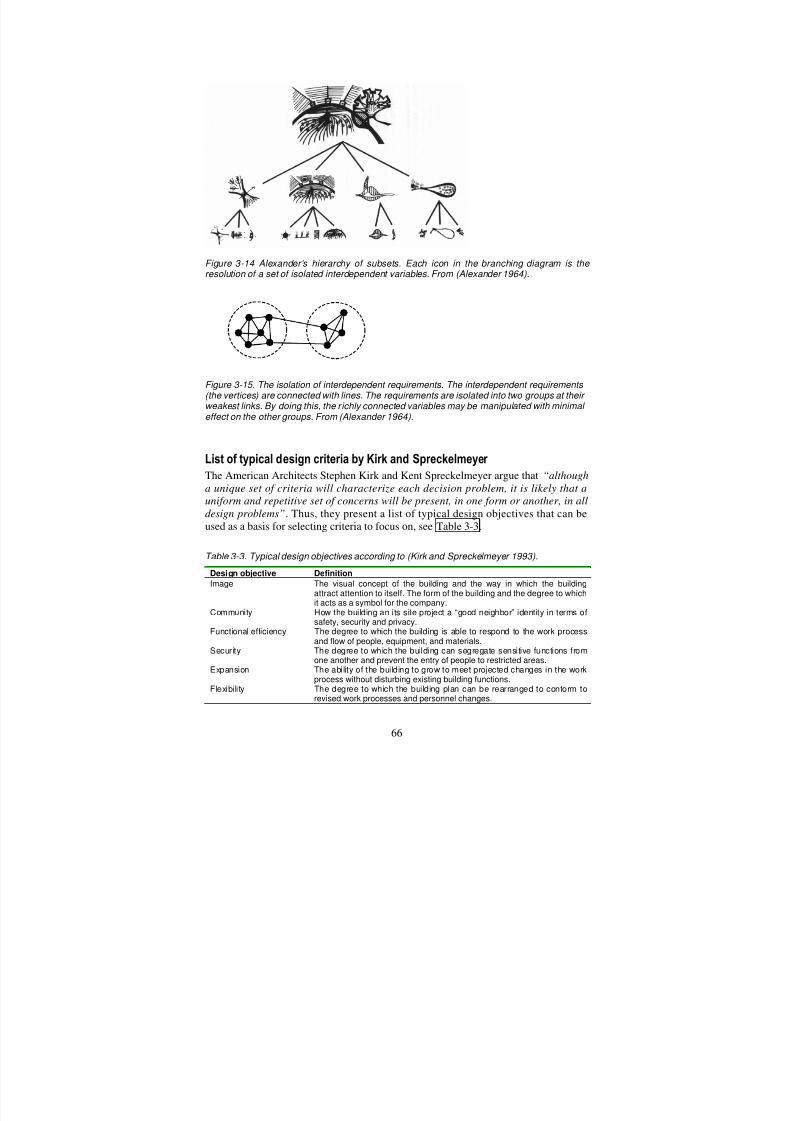
8/13/2019 Multi Criteria Sun Calculation House
http://slidepdf.com/reader/full/multi-criteria-sun-calculation-house 72/246
66
Figure 3-14 Alexander’s hierarchy of subsets. Each icon in the branching diagram is the
resolution of a set of isolated interdependent variables. From (Alexander 1964).
Figure 3-15. The isolation of interdependent requirements. The interdependent requirements (the vertices) are connected with lines. The requirements are isolated into two groups at their weakest links. By doing this, the r ichly connected variables may be manipulated with minimal effect on the other groups. From (Alexander 1964).
List of typical design criteria by Kirk and Spreckelmeyer
The American Architects Stephen Kirk and Kent Spreckelmeyer argue that “althougha unique set of criteria will characterize each decision problem, it is likely that auniform and repetitive set of concerns will be present, in one form or another, in alldesign problems”. Thus, they present a list of typical design objectives that can beused as a basis for selecting criteria to focus on, see Table 3-3.
Table 3-3. Typical design objectives according to (Kirk and Spreckelmeyer 1993).
Design objective Definition
Image The visual concept of the building and the way in which the buildingattract attention to itself. The form of the building and the degree to whichit acts as a symbol for the company.
Community How the building an its site project a “good neighbor” identity in terms ofsafety, security and privacy.
Functional efficiency The degree to which the building is able to respond to the work processand flow of people, equipment, and materials.
Security The degree to which the building can segregate sensitive functions fromone another and prevent the entry of people to restricted areas.
Expansion The ability of the building to grow to meet projected changes in the workprocess without disturbing existing building functions.
Flexibility The degree to which the building plan can be rearranged to conform torevised work processes and personnel changes.

8/13/2019 Multi Criteria Sun Calculation House
http://slidepdf.com/reader/full/multi-criteria-sun-calculation-house 73/246
67
Technical performance How the building operates in terms of mechanical systems, electricalsystems, and industrial processes.
Human performance How the building provides a physically and psychologically comfortableplace for people to work and live.
Energy conservation The degree to which the building is able to conserve energy resourcesthrough construction, site orientation and solar design.
Life-cycle costs The economic consequences of the building in terms of initial capital
investment and long-term operating costs.Others To be defined for specified project requirements.
Hierarchy of Performance Criteria in the GBC’98 Project
In the international project ”Green Building Challenge’98” (see chapter 6.2) six mainperformance areas were identified: Resource Use, Ecological Loadings, Indoor Environmental Quality, Process, Longevity, and Context (Cole and Larsson 1998). Anextract of the Resource Use performance area is shown in Figure 3-16. Contextualissues relate to site selection, building location and proximity to amenities. Processincludes issues that relate to the structuring of the design team as well as operationand maintenance practices. The main performance areas contain performancecategories at the next level of detail, followed by performance criteria and performance sub-criteria at the lowest level. Altogether there are 4 levels of criteria,adding up to a total of 120 criteria at the lowest level. In the early design stage, thislevel of detail will probably be too much to handle. The GBC’98 framework isprimarily aimed at assessing the performance of existing buildings.
Figure 3-16. Extract from performance area “Resource Consumption” in the GBC’98 framework, (Cole and Larsson 1998)
Discussion
Checklists may be useful as a starting point for identifying and selecting relevantcriteria. However, it is hard to imagine a checklist that includes all possible issues thatare applicable for all types of building projects. Thus, there is always the danger thatthe checklist does not include all the issues that are relevant for a specific case.
Another problem with checklists is that they do not simplify overview very much.
SECTION ONE: RESOURCE CONSUMPTION
R1 ENERGYR1.1 Embodied energy for initial production
R1.2 Embodied energy consumption for recurring productionR1.3 Operating energy consumption
R1.4 Decommissioning energy
R1.5 Peak demandR1.5.1 Peak electrical demandR1.5.2 Peak natural gas demandR1.5.3 Peak heating or cooling demand (if district heating)
R1.6 Thermodynamic matching of fuel type and end use
R2 LANDR2.1 Initial ecological significance and scarcity of land used
R2.2 Efficiency of land use
R2.3 Maintenance of biodiversity and ecology on building site

8/13/2019 Multi Criteria Sun Calculation House
http://slidepdf.com/reader/full/multi-criteria-sun-calculation-house 74/246
68
Grouping of related design topics is possible, but the checklist offers limitedpossibilities for mapping more complex interactions between criteria.
Matrixes are useful instruments to visualize interdependencies between pairs of issues. However, multi-level links are hard to implement within this framework.
Another problem with matrixes is that they may lead the decision-maker to think thathe has to fill in every window, even though the information is not relevant. This maylead to the generation of information that is not needed.
The hierarchical structure is more suitable to keep track of multiple interdependenciesas well as different levels of detail. The hierarchy may easily be segregated into parts,so that one can work with one branch at a time. With a hierarchy, it is possible to keepthe overview, and at the same time have the possibility of going into detail.Hierarchies are also flexible; additions or reductions to a well-structured hierarchymay easily be implemented. Thomas L. Saaty even claims that hierarchical structuringappears to be an innate method of operation of the human mind (Saaty 1996). When
presented with a multitude of elements which comprise a complex situation, the mindaggregates them into groups, according to whether they share certain properties.
In the context of this thesis, the main purpose of structuring the criteria is to form abasis for a formal evaluation process. In this respect, hierarchical representation of asystem is well suited because it describes how changes in priority at upper levelsaffect the priority of elements in lower levels. A hierarchy allows us to focus on onepart at a time, without loosing the interactions or the overview. Hierarchies are alsowell suited for mapping the theory of value focused thinking described by Keeney. Atthe top of the hierarchy is the main strategy or fundamental objective. Below, themeans objectives may be derived, from which the alternatives will spring. In the nextchapter, a further investigation of how to structure criteria in hierarchies is given.
3.5 Criteria in Hierarchies
Thomas L. Saaty gives the following description of a hierarchy (Saaty 1996):
A hierarchy is an abstraction of the structure of a system to study the functionalinteractions of its component and their impact on the entire system. This abstractioncan take several related forms, all of which decent from an apex (overall objective),down to the people who influence these forced, down to the objectives of the peopleand then to their policies, still further down to the strategies, and finally, theoutcomes which result from these strategies.
Thus, a hierarchy becomes more and more detailed as one moves down from the top.The objectives at the top of the hierarchy are usually quite abstract, such as “anefficient building” and become more specific as one follows the hierarchy down. It isusually recommended to go down the hierarchy until a measurable goal is reached.Many authors suggest to limit the number of criteria at each branch level in thehierarchy to 7. This is based on Miller’s theory (Miller 1956), that suggest that 7 ± 2
represents the greatest amount of information that an observer can give about anobject on the basis of an absolute judgment.

8/13/2019 Multi Criteria Sun Calculation House
http://slidepdf.com/reader/full/multi-criteria-sun-calculation-house 75/246
69
Within the field of decision analysis, value hierarchies are often called decision trees.In this field, two distinct approaches to structuring value hierarchies are described; thetop-down and the bottom-up approaches. The top-down approach is objective led,whilst the bottom-up approach is alternative led. In the top-down approach one starts
with defining the general values relevant to the problem. Next, one defines what theinitial value categories mean by using more specific value dimensions. The method of value-focused thinking described by Keeney (section 3.2) is an example of a top-down approach. Keeney gives a summary of advantages of the top-down approachthat may be used as guidelines for how to develop and structure the hierarchy (Keeney1992):
1. The higher-level objectives hierarchy relate to fairly general concerns, such as theenvironment, economics, health and safety, and flexibility. Consequently, they canbe identified relatively easy.
2. Higher-level objectives provide a basis for specification of lower-level objectives.
3. A hierarchy helps identify missing objectives, since logical concepts of thespecification process can fairly easily identify holes in the hierarchy.
4. Situations where redundancy or double-counting might occur can often beidentified with the logic of an objective hierarchy.
5. It is easier to identify attributes to measure the achievement of more specific(lower-level) objectives than of more general (higher-level) ones.
6. The attributes for a lower-level objective collectively indicate the degree to whichthe associated higher-level objective is achieved.
7. The complete set of lowest-level attributes for a fundamental objectives hierarchyprovides a basis for describing the consequences in the decision problem and forassessing an objective function for the problem.
Von Winterfeldt and Edwards (von Winterfeldt and Edwards 1986) give a list of questions that may be used to check the structure of the hierarchy:
1. Does the subdivision really help explain the meaning of the general valuecategory, or are the value dimensions related in some other way (e.g. functionalrelation, means-end relation)?
2. Is the proposed subordinate value dimension unique to the superordinate valuebeing explicated, or is it linked to others?
3. Is the list of value dimensions exhaustive?
4. Are some value dimensions redundant or partially redundant?
The bottom-up approach starts with identifying the characteristics that distinguish theobjects of evaluation. The idea is to identify value-relevant characteristics and tosynthesize them in order to get higher order values. The approach starts with a verylarge list of aspects, characteristics, or indicators of the outcomes of the options underconsideration. Von Winterfeldt and Edwards suggest some questions that may beposed in order to select or define value-relevant attributes from such lists (vonWinterfeldt and Edwards 1986):
1. Does the decision-maker have meaningful preferences for different degrees of an
attribute?2. Can the alternatives be distinguished on the basis of that attribute?

8/13/2019 Multi Criteria Sun Calculation House
http://slidepdf.com/reader/full/multi-criteria-sun-calculation-house 76/246
70
3. Are evaluations of some attributes dependent on other attribute values?
The first question determines whether an attribute is value relevant. For example,sulfur dioxide pollution may appear on the initial list for comparing alternative powerplants, but the decision-maker may find it hard to say much more about the pollution
level than “less is better”. The real preferences may concern the health effects of sulfur dioxide pollution.
The second question determines whether the attribute is relevant to the evaluation. Forexample, if all possible options score the same on a given attribute, that attribute isirrelevant and should not be included in the list.
The third question that von Winterfeldt and Edwards describe, determines whether theattributes are judgmentally dependent . Two attributes are judgmentally dependent if the evaluation of an alternative with respect to one attribute depends on how thealternative performs with respect to the other. For example, in judging the quality of a
rifle, accuracy and range are two important attributes. Yet if a rifle is very inaccurate,one may not care about its range. Consequently, the evaluation of the relative benefitsof a range depends on the relative accuracy of the rifle.
Keeney and Raiffa propose some general criteria that are relevant for examining thestructure of a hierarchical tree (Keeney and Raiffa 1976):
• Completeness
• Operationality
• Decomposability
• Absence of redundancy• Minimum size
Completeness requires that all relevant values be included in the superstructure of thehierarchy and that the substructure completely defines the higher level values.Operationality requires that the lowest level values or attributes be meaningful andassessable. Decomposability means that the attributes can be analyzed one or two at atime, that is that they are judgmentally independent. Absence of redundancy meansthat no two attributes or values mean the same thing. Minimum size refers to thenecessity of keeping the number of attributes small enough to manage. Theserequirements conflict. Operationality often requires further decomposition, thus
increasing the number of attributes. Completeness may lead to redundancy, since truevalue independence is often an unattainable ideal. Thus, a trade-off between thesecriteria is often necessary.
In situations where a number of alternatives are readily available for consideration,the bottom-up approach is an effective way of getting going. By using a number of techniques designed to promote thinking (for example brainstorming) one can usuallyrapidly generate many potentially relevant criteria. However, there is the danger of becoming too constrained by the alternatives. As argued in section 3.2 (value focusedthinking), a top-down approach should ideally be opted for. In practice, a combinationof the two approaches is probably needed. The key point is to start out wide with a
generic, all embracing value hierarchy (with fundamental objectives as described byKeeney, see above), then narrow it in by focusing on what issues are relevant for the
8/13/2019 Multi Criteria Sun Calculation House
http://slidepdf.com/reader/full/multi-criteria-sun-calculation-house 77/246
71
specific case. Then, many irrelevant issues will cancel out, and one will hopefully endup with a hierarchy that is manageable. In this way, the danger of omitting importantissues is limited, as one has to argue and document why some criteria are deleted fromthe all-embracing hierarchy. When potential solutions begin to emerge, these may beused to upgrade the value hierarchy, adding, removing and refining criteria. In this
way, one moves up and down the hierarchy in an iterative process alternately focusingon values and alternatives.
3.6 Conclusions
Values are the basis for evaluating the goodness of a proposed design solution.Therefore, focusing on the values of the stakeholders is essential for the success of theproject. Ideally, the best way of approaching a building design is to focus on thevalues before evaluating alternative solutions. This will broaden the solution space
and encourage creativity, and thereby the increasing the possibility of finding the bestsolution. In practice, though, the processes of generating alternatives and specifyingobjectives will be intertwined. This is because it is difficult to give very specific goalstatements before one has a clear picture of what is possible or feasible. The initial,vague objectives will be revised and refined as the design evolves.
Sorting the values into issue-based categories makes it easier to handle the vastamount of information that is important for holistic building design. Groupingtogether items in a common framework using a consistent terminology will reducemisunderstandings about meaning. This may facilitate communication amongmembers of the design team, as well as to regulatory agencies and the general public.
In order to be useful in a formal evaluation, the criteria must be selected in a mannerthat decomposes a problem statement into independent measurement scales. There area number of checklists available that may be used to get ideas of what criteria toinclude and how to structure them. A hierarchical structure seems to be well suited fororganizing the criteria. Also, people seem to find such a structure natural fororganizing information. The hierarchy allows for organizing the problem intodifferent levels of detail. In this way it is possible to keep the overview while at thesame time be able to see the details. Multi-level interdependencies may be modeled,and the hierarchy may easily be extended or reduced as new information andknowledge emerge during the design process.

8/13/2019 Multi Criteria Sun Calculation House
http://slidepdf.com/reader/full/multi-criteria-sun-calculation-house 78/246
72
4 Generation of Alternatives
The generation of good alternatives is important if the design process is to beeffective. If alternatives are generated without careful consideration, much time willbe wasted on evaluating solutions that are far from fulfilling the goals of thestakeholders. Generating alternatives is above all a craft, an exercise of creativity andexperience. Therefore, it is hard to specify a formal method for approaching it.However, there are a number of techniques that have been proposed as aids in
generating alternatives. Some of these will be briefly described in section 4.1. Inaddition, the following general guidelines are given:
• It is not possible to do a careful evaluation of all possible solutions. However, itmay be wise to start out with a fairly wide variety of solutions that will test theextremes of the design-objective definitions. This reduces the risk of overlookinggood ideas. In the beginning, one may encourage inventions andunconventionality, and it may be fruitful to look beyond the less rigid constraintsto broaden the scope of study outside the limits that were initially set by the client.The use of multidisciplinary groups in design, e.g. composed of the owner, user,
architect, engineer, and builder, is likely to generate a much wider range of ideasthan from an individual working alone.
• The many alternatives that are considered initially cannot be investigated in detail.It would be too costly and time-consuming. Only simple evaluations should becarried out at this early stage. Some kind of screening is needed to select thealternatives that are most promising for the next stages of investigation. Thescreening could be based on expert judgement, evidence from past cases, orsimple models. Examples of techniques that can help the screening process aregiven in chapter 6 (Performance Evaluation).
• The initial, rough evaluation will in turn lead to the specification of more precisedesign criteria which can be used in the next stage of more detailed evaluations.The stages that follow the initial scrutiny may include an increasing amount of quantitative analysis. The last stage of the selection procedure should investigaterelatively few alternatives, but in considerable detail.
• Including a “base case” or a “do-nothing” alternative in the set of alternativesmight be useful. By comparing the effects of other strategies to the base case it ispossible to determine if a proposed strategy will be better, and how much of animprovement can be expected. A “do-nothing” alternative is common practice inenvironmental impact analyses.
One day Alice came to a fork in the road and saw a Cheshire cat in a tree. Which road do I take? she asked. Where do you want to go? was his response. I don’t know,Alice answered. Then, said the cat,it doesn’t matter.
- Lewis Carroll

8/13/2019 Multi Criteria Sun Calculation House
http://slidepdf.com/reader/full/multi-criteria-sun-calculation-house 79/246
73
An effective process of generating alternatives is also dependent on a structuredmanagement of information. A structure based on value focused thinking as describedin chapter 3, will provide this.
4.1 Techniques for generating alternatives
This section includes a brief description of some techniques that have been proposedas aids in generating alternatives. The description is mainly based on (Kirk andSpreckelmeyer 1993) and (Kumlin 1995). The survey is by no means meant toprescribe how the task of generating alternative should be carried out, it is justincluded to show some possible ways of going about the task.
Brainstorming
Brainstorming is a technique that originates from Alex F. Osborn (Osborn 1957) and
is defined as an organized way to allow the mind to produce ideas without gettingbogged down in trying to judge the value of those ideas at the same time. It is basedon the stimulation of one person’s mind by another’s. A typical brainstorming sessiontakes place when a group of people sits around a table and spontaneously generatesideas designed to solve a specific problem. During the session, no attempt is made to judge or evaluate the ideas. Evaluation takes place after the session has ended.Normally, a group leader records each idea offered by the team, sometimes with theassistance of a tape recorder. The main guidelines of brainstorming may besummarized as follows (Dell'Isola 1997):
• Rule out criticism. Withhold adverse judgment of ideas until later. If nothing goodcan be said about an idea, nothing should be said.
• Generate a large number of possible solutions. Set a goal of multiplying thenumber of ideas produced in the first rush of thinking by five or ten.
• Seek a wide variety of solutions that represent a broad spectrum of attacks on theproblem.
• Watch for opportunities to combine or improve ideas.
Delphi
The Delphi technique is an approach for eliciting opinions from a group of experts.It’s prime motivation is the desire to avoid the psychological problems of face-to-face
discussions that can be detrimental to establishing a reliable group consensus. ADelphi process involves a series of successive questionnaires, where, in eachquestionnaire after the first, the respondents receive feedback information about theoutcome of the preceding round without learning which option was contributed bywhich particular respondent. The method was first designed by Dalkey and Helmer tobe used in a military estimation problem that arose at the Rand Corporation in theearly 1950’s (Gordon and Helmer 1964). Since then it has been employed in severalthousand cases all over the world, covering divergent subjects such as educationalreform, long-range corporate planning, the future of medicine, assessments regardingthe quality of life, etc. (Linstone and Turoff 1975). Kirk and Spreckelmeyer (1993)describes an application of the Delphi technique to the identification of design optionsfor a health care center, as follows (shortened from the original description):
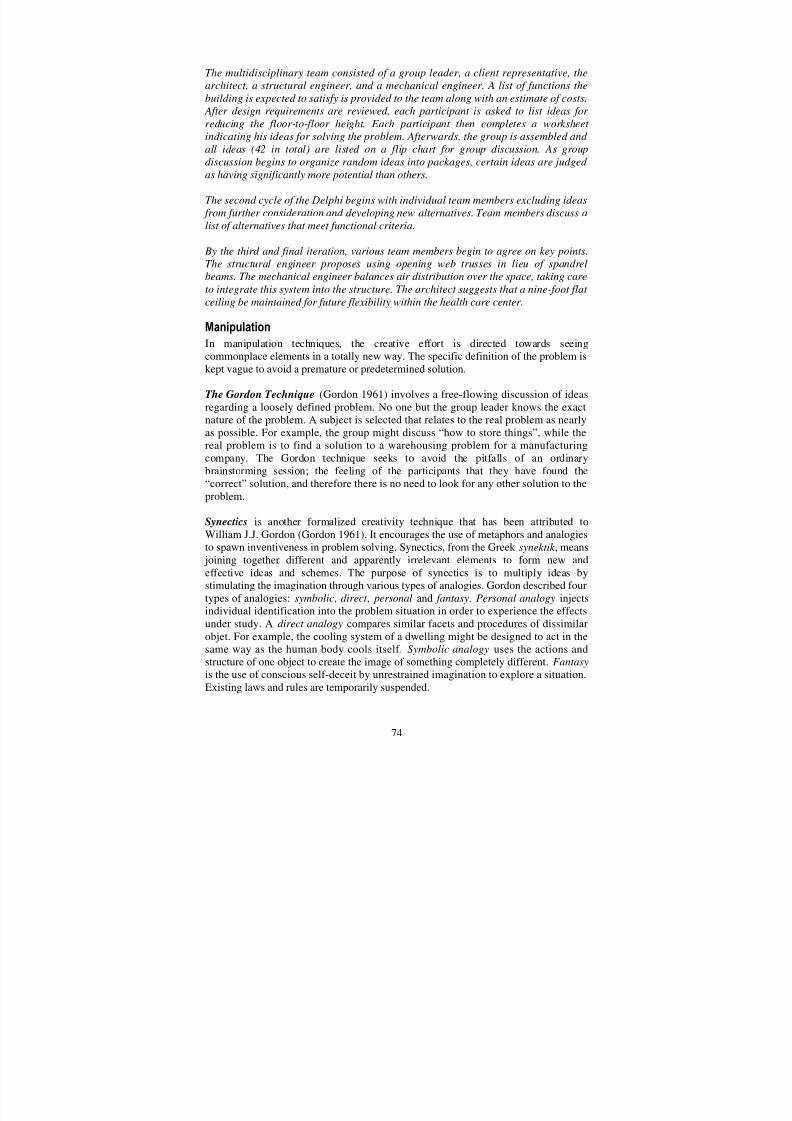
8/13/2019 Multi Criteria Sun Calculation House
http://slidepdf.com/reader/full/multi-criteria-sun-calculation-house 80/246
74
The multidisciplinary team consisted of a group leader, a client representative, thearchitect, a structural engineer, and a mechanical engineer. A list of functions thebuilding is expected to satisfy is provided to the team along with an estimate of costs. After design requirements are reviewed, each participant is asked to list ideas for reducing the floor-to-floor height. Each participant then completes a worksheet
indicating his ideas for solving the problem. Afterwards, the group is assembled and all ideas (42 in total) are listed on a flip chart for group discussion. As groupdiscussion begins to organize random ideas into packages, certain ideas are judged as having significantly more potential than others.
The second cycle of the Delphi begins with individual team members excluding ideas from further consideration and developing new alternatives. Team members discuss alist of alternatives that meet functional criteria.
By the third and final iteration, various team members begin to agree on key points.The structural engineer proposes using opening web trusses in lieu of spandrel
beams. The mechanical engineer balances air distribution over the space, taking careto integrate this system into the structure. The architect suggests that a nine-foot flat ceiling be maintained for future flexibility within the health care center.
Manipulation
In manipulation techniques, the creative effort is directed towards seeingcommonplace elements in a totally new way. The specific definition of the problem iskept vague to avoid a premature or predetermined solution.
The Gordon Technique (Gordon 1961) involves a free-flowing discussion of ideas
regarding a loosely defined problem. No one but the group leader knows the exactnature of the problem. A subject is selected that relates to the real problem as nearlyas possible. For example, the group might discuss “how to store things”, while thereal problem is to find a solution to a warehousing problem for a manufacturingcompany. The Gordon technique seeks to avoid the pitfalls of an ordinarybrainstorming session; the feeling of the participants that they have found the“correct” solution, and therefore there is no need to look for any other solution to theproblem.
Synectics is another formalized creativity technique that has been attributed toWilliam J.J. Gordon (Gordon 1961). It encourages the use of metaphors and analogies
to spawn inventiveness in problem solving. Synectics, from the Greek synektik , means joining together different and apparently irrelevant elements to form new andeffective ideas and schemes. The purpose of synectics is to multiply ideas bystimulating the imagination through various types of analogies. Gordon described fourtypes of analogies: symbolic, direct , personal and fantasy. Personal analogy injectsindividual identification into the problem situation in order to experience the effectsunder study. A direct analogy compares similar facets and procedures of dissimilarobjet. For example, the cooling system of a dwelling might be designed to act in thesame way as the human body cools itself. Symbolic analogy uses the actions andstructure of one object to create the image of something completely different. Fantasyis the use of conscious self-deceit by unrestrained imagination to explore a situation.
Existing laws and rules are temporarily suspended.
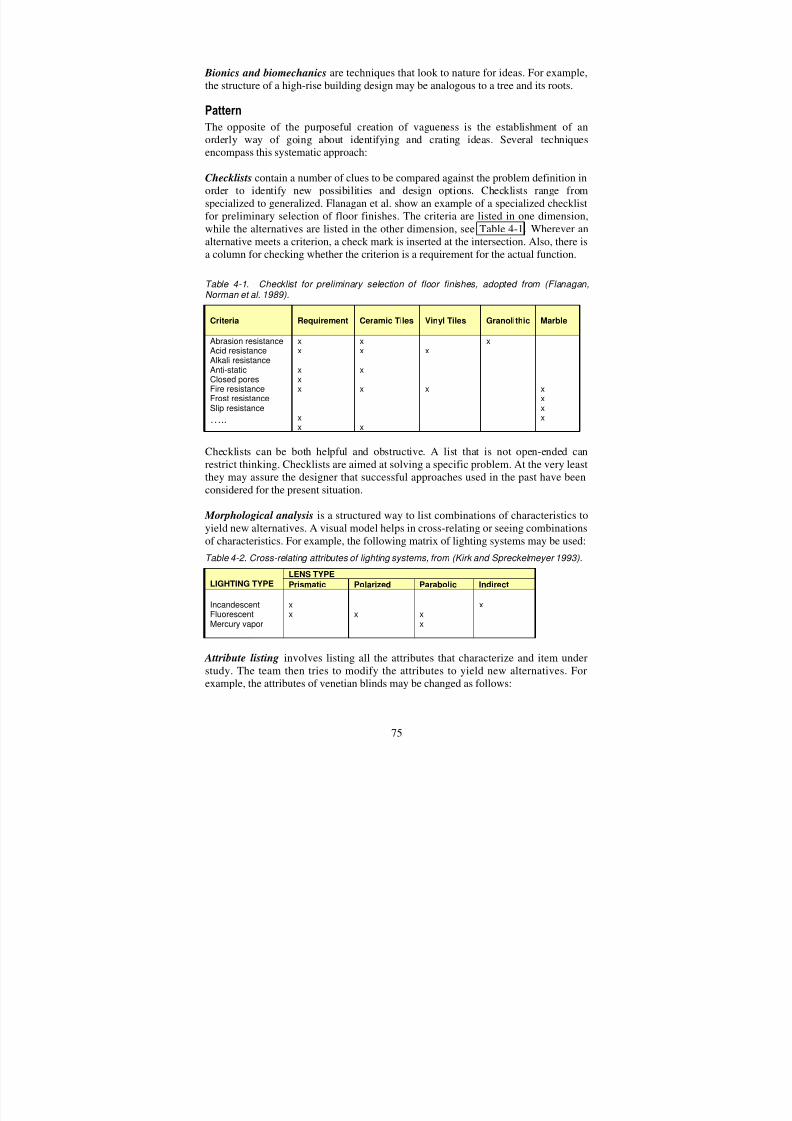
8/13/2019 Multi Criteria Sun Calculation House
http://slidepdf.com/reader/full/multi-criteria-sun-calculation-house 81/246
75
Bionics and biomechanics are techniques that look to nature for ideas. For example,the structure of a high-rise building design may be analogous to a tree and its roots.
Pattern
The opposite of the purposeful creation of vagueness is the establishment of an
orderly way of going about identifying and crating ideas. Several techniquesencompass this systematic approach:
Checklists contain a number of clues to be compared against the problem definition inorder to identify new possibilities and design options. Checklists range fromspecialized to generalized. Flanagan et al. show an example of a specialized checklistfor preliminary selection of floor finishes. The criteria are listed in one dimension,while the alternatives are listed in the other dimension, see Table 4-1. Wherever analternative meets a criterion, a check mark is inserted at the intersection. Also, there isa column for checking whether the criterion is a requirement for the actual function.
Table 4-1. Checklist for preliminary selection of floor finishes, adopted from (Flanagan,Norman et al. 1989).
Criteria Requirement Ceramic Tiles Vinyl Tiles Granolithic Marble
Abrasion resistanceAcid resistanceAlkali resistanceAnti-staticClosed poresFire resistanceFrost resistance
Slip resistance…..
xx
xxx
xx
xx
x
x
x
x
x
x
xx
xx
Checklists can be both helpful and obstructive. A list that is not open-ended canrestrict thinking. Checklists are aimed at solving a specific problem. At the very leastthey may assure the designer that successful approaches used in the past have beenconsidered for the present situation.
Morphological analysis is a structured way to list combinations of characteristics toyield new alternatives. A visual model helps in cross-relating or seeing combinationsof characteristics. For example, the following matrix of lighting systems may be used:
Table 4-2. Cross-relating attributes of lighting systems, from (Kirk and Spreckelmeyer 1993).
LENS TYPELIGHTING TYPE Prismatic Polarized Parabolic Indirect
IncandescentFluorescentMercury vapor
xx x x
x
x
Attribute listing involves listing all the attributes that characterize and item understudy. The team then tries to modify the attributes to yield new alternatives. For
example, the attributes of venetian blinds may be changed as follows:

8/13/2019 Multi Criteria Sun Calculation House
http://slidepdf.com/reader/full/multi-criteria-sun-calculation-house 82/246
76
• change horizontal slats to vertical slats
• change horizontal pivoting to vertical pivoting
• change pulley cord to twisting on a fiberglass rod
• etc.
Pattern language was developed by Christopher Alexander at the University of California at Berkeley (Alexander, Ishikawas et al. 1977). A set of prototypes for aparticular building is identified and the best is selected for the review team. Simplesketches and a few words illustrate each prototype. The sketches or diagrams aregrouped into patterns that represent the building element. The last step ismanipulation of patterns to meet the owner-user requirements, climatic conditions,and urban context.
4.2 Conclusions
The generation of alternatives is an iterative process that is closely related to the tasksof problem formulation and evaluation. The evaluation of alternatives may generatenew alternatives or objective, or it may alter the objectives. The process of generatingalternatives is mainly a craft, and it is not possible to give a general recipe that will fitany project. However, it may be made more effective by using some formal aids,especially if inexperienced participants are involved. The success of the alternativegeneration process relies heavily on the problem formulation. A well-formulated andorganized value structure that reflects the needs and wishes of the building’sstakeholders, is a prerequisite for this.

8/13/2019 Multi Criteria Sun Calculation House
http://slidepdf.com/reader/full/multi-criteria-sun-calculation-house 83/246
77
5 Performance Prediction
5.1 Introduction
The second design task that was identified in chapter 2, is performance prediction of potential solutions. Performance prediction is carried out in order to find out how wella proposed solution satisfies the objectives. In this respect, it is the basis forevaluating and choosing design solutions. Thus, the performance prediction has to
produce means to measure the relative goodness of a design with respect to the needsand wishes of the decision-makers. Also, due to constraints on time and resources, theright level of detail has to be found. In section 5.2 the concepts of optimizing andsatisficing are discussed. These represent two contradictory ways of going aboutperformance prediction. Section 5.3 deals with tools and methods that are used inpredicting the performance of buildings and solar energy systems in the design phase.Since this was also an issue of chapter 2, this section only includes a discussion of different types of prediction and the level of detail. Section 5.4 then deals with how topresent the results in an unbiased and clear manner. In section 5.5, the findings of theprevious chapters are summed up, and conclusions are made.
5.2 Optimizing and Satisficing
In principle, one could think that the ideal way of doing a performance predictionwould be to construct a model that incorporates all parameters and characteristics thatdetermines the optimum solution. One could then input all feasible values forenvironmental parameters and product characteristics and out comes the optimum, i.e.the best possible solution. However, such an approach poses several problems.Thorbjoern Mann (Mann 1992) gives an excellent discussion of the concept of optimization, which is briefly summarized below:
Optimization means simply the process of finding the best solution. The concept seemsquite straightforward, but its practical implications are not. What is the “best”solution? How is it measured? Measurements about what is good and bad inevitablyinvolve subjective judgments, which mean that people will tend to have different opinions about it. How can we achieve agreement about measurement as a condition for making decisions?
Let us assume that those persons involved in a planning or a design situationsomehow do agree upon a common measure of performance by which one can tell
which of two solutions is “better” than the other. Then, they can find the value of that performance variable for each solution, compare the values, and decide which
It is better to be roughly right than
exactly wrong.

8/13/2019 Multi Criteria Sun Calculation House
http://slidepdf.com/reader/full/multi-criteria-sun-calculation-house 84/246
78
solution has the “higher” value of that performance measure. Doing this, they willhave achieved one of the necessary conditions for optimization: there must be anagree-upon measure of performance such that each solution will be described by just one value of that variable.
However, this is just the beginning of the problem. The “optimum” is not necessarily just the better of the two alternative solutions that were compared. But if we threw theissue wide open and said “optimal” is to mean the solution with the highest value of the performance measure out of all possible solutions, we would lose our basis of agreement, unless we had actually examined all those possible solutions and determined their respective performance. This is the second of the conditions for anymeaningful talk about optimization: a well-defined solution space with well-defined constraints.
However, if we continue in our (some would say reckless) quest for optimality, weshould know about a few other terms and associated pitfalls. For their discussion, it is
helpful to visualize the solution space as a hilly landscape in which the performancemeasure forms the third dimension, that is, the height or elevation, see the figurebelow. The highest mountain in this landscape is the global optimum. There are other,smaller mountains; these are called local optima. The first potential source of error isthat our efforts of optimization would result in finding only a local and not the globaloptimum.
Even worse is another possible and very common error, that of sub-optimization. Themountain landscape consists of layers of judgment scores. The layers correspond tothe various sub-aspects that together make up the overall judgment score or overall performance measure. Because some aspects are more important than others, and also may be easier to measure, the evaluation may be looking at those measures to theexclusion of others. Thus, an unspoken assumption is made that the highest hill or global optimum also will have the highest invisible layers of the subsequent underneath it.
local optimum
global optimum
sub-optimum
design variable
design variable
performance
Figure 5-1. The performance landscape, adopted from (Mann 1992).

8/13/2019 Multi Criteria Sun Calculation House
http://slidepdf.com/reader/full/multi-criteria-sun-calculation-house 85/246
79
Thus, to sum up, a global optimization does not make sense because:
1. In our present state of the world, it is not possible to make a numerical model thatincorporates all values of a design.
2. In practice, it is not possible to find the best of all possible solutions, because thesolution space is endless.
Still, this does not necessarily mean that doing a sub-optimization is completelyuseless. One may want to study the detailed relationship between some importantdesign parameters, and in this context, sub-optimization may offer useful insight. Aslong as one is aware of the limitations and the implications on the other criteria, itmay give valuable information. An interesting approach to optimization of energy andcosts (i.e. a sub-optimization) in building design has been presented by KimmoPeippo at the Helsinki University of Technology (Peippo 1997). The low energybuilding design optimization problem has been formulated by the following two
questions:
1. Given the technical and economical characteristics of the building design optionsand their interactions as well as the project-specific boundary conditions and theeconomic environment: What is the optimum building design that minimizes thesum of the annual capital, operation and maintenance, and energy costs?
2. If, for any reason (to reduce CO2-emissions, for instance) one wishes to use lessenergy than in the least cost design above, what is the system design that gives thedesired reduced energy requirement at minimum cost. Or conversely, if extra funds are available for energy efficiency and solar measures, what is the systemdesign that gives the highest energy savings at this given extra cost?
A numerical optimization scheme is introduced that defines the optimal path so that,starting from the unconstrained least cost design, at each point on the path the systemdesign will give the desired reduced auxiliary energy requirements at minimumachievable cost. Figure 5-2 shows an illustration of the result of such an optimizationwith insulation thickness and window area as variables.

8/13/2019 Multi Criteria Sun Calculation House
http://slidepdf.com/reader/full/multi-criteria-sun-calculation-house 86/246
80
Figure 5-2. Illustration of an optimization problem in two dimensions and the optimal path for the constrained problem. X is the insulation thickness and Y is the window area of the building. All values are relative to the ones representing the minimum cost. From (Peippo 1997).
Peippo has used the procedure for a case example of finding the optimal allocation of façade area to different solar technologies, see Figure 5-3. The figure is interpreted as
follows: The lower left hand corner represents a façade configuration optimized withrespect to minimum life cycle costs. This façade consists of about 25% windows and75% opaque wall with insulation. If the client would like a design that uses a little lessenergy and can accept a little higher cost, he should move towards the right in thefigure. For example, he would like to reduce the energy consumption by 20%, thefigure would tell him that he could choose a façade with advanced windows thatcovers 35% of the area, amorphous silicon PV cladding that covers 15% of the area,and opaque insulated wall on the remaining. This façade will cost about 10% morethan the least cost design.
The example may appear somewhat theoretical because there are many other issuesthat will influence the choice of a facade cladding. The author also recognizes thatthis is in fact just a sub-optimization, and even makes mention of possibleimplications for daylight, comfort and aesthetics. Nevertheless, the example showshow a sub-optimization procedure may be used to provide insight into the relationshipbetween a set of design parameters. This could help the general understanding of relationships between important design parameters. For specific problems in practicaldesign work, however, such procedures are probably difficult to implement. Becauseevery building project is unique and has its own special characteristics and objectives,it is not possible to have a general optimization procedure that will work for all cases.So the optimization would have to be constructed specifically for every project.
Particularly in the early design phase, it is hard to justify putting a lot of time andeffort into a detailed optimization of some performance characteristics. But also in the
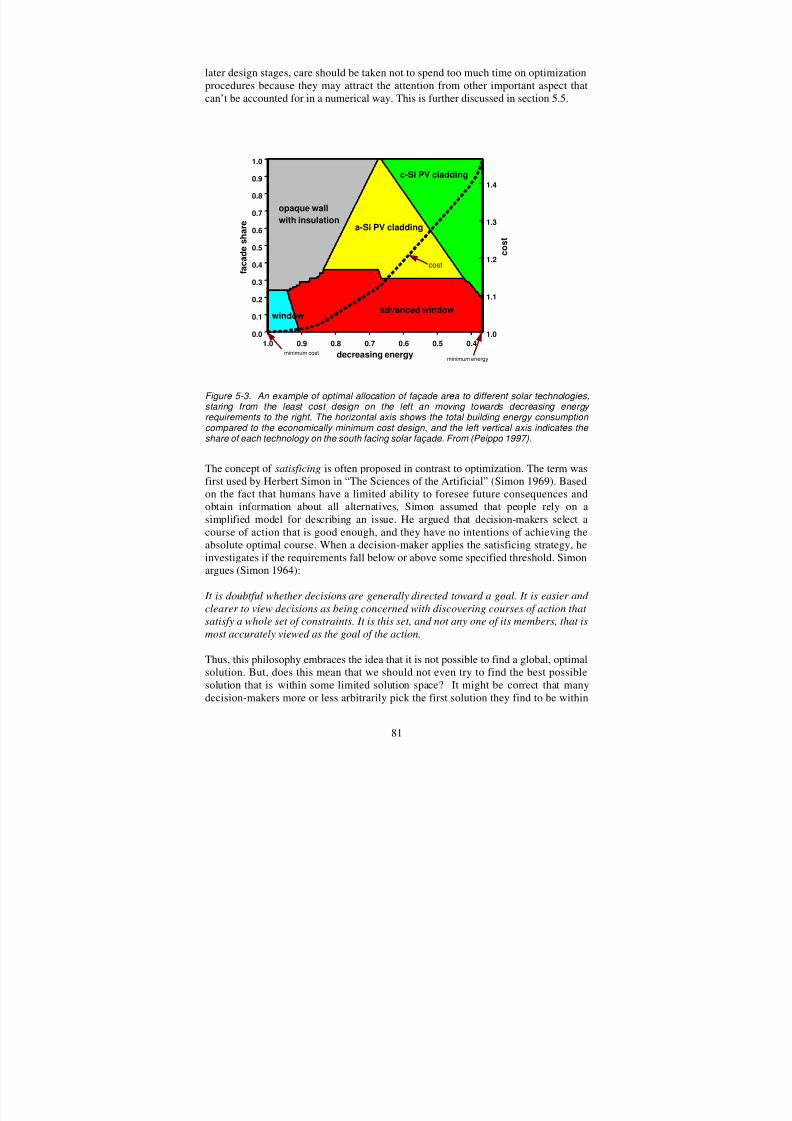
8/13/2019 Multi Criteria Sun Calculation House
http://slidepdf.com/reader/full/multi-criteria-sun-calculation-house 87/246
81
later design stages, care should be taken not to spend too much time on optimizationprocedures because they may attract the attention from other important aspect thatcan’t be accounted for in a numerical way. This is further discussed in section 5.5.
1.0 0.9 0.8 0.7 0.6 0.5 0.4
decreasing energy
0.0
0.1
0.2
0.3
0.4
0.5
0.6
0.7
0.8
0.9
1.0
advanced window
a-Si PV cladding
cost
opaque wall
with insulation
minimum costminimum energy
1.0
1.1
1.2
1.3
1.4
c o s t
c-Si PV cladding
f a c a d e s h a r e
window
Figure 5-3. An example of optimal allocation of façade area to different solar technologies,
staring from the least cost design on the left an moving towards decreasing energy requirements to the right. The horizontal axis shows the total building energy consumption compared to the economically minimum cost design, and the left vertical axis indicates the share of each technology on the south facing solar façade. From (Peippo 1997).
The concept of satisficing is often proposed in contrast to optimization. The term wasfirst used by Herbert Simon in “The Sciences of the Artificial” (Simon 1969). Basedon the fact that humans have a limited ability to foresee future consequences andobtain information about all alternatives, Simon assumed that people rely on asimplified model for describing an issue. He argued that decision-makers select acourse of action that is good enough, and they have no intentions of achieving the
absolute optimal course. When a decision-maker applies the satisficing strategy, heinvestigates if the requirements fall below or above some specified threshold. Simonargues (Simon 1964):
It is doubtful whether decisions are generally directed toward a goal. It is easier and clearer to view decisions as being concerned with discovering courses of action that satisfy a whole set of constraints. It is this set, and not any one of its members, that ismost accurately viewed as the goal of the action.
Thus, this philosophy embraces the idea that it is not possible to find a global, optimalsolution. But, does this mean that we should not even try to find the best possible
solution that is within some limited solution space? It might be correct that manydecision-makers more or less arbitrarily pick the first solution they find to be within
8/13/2019 Multi Criteria Sun Calculation House
http://slidepdf.com/reader/full/multi-criteria-sun-calculation-house 88/246
82
the thresholds of acceptance. An alternative is chosen for implementation if it is judged to be “good enough” to satisfy the objectives and constraints. However, thisseems to be a mediocre way of going about a design. Should we not strive towardsachieving the best, even though we know that we cannot find the best of all possible?An attractive compromise seems to be that we should try to find the “best” alternative,
in the opinion of the decision-makers, among the set of available and analyzedalternatives, but accepting the fact that this not necessarily is the best among allconceivable alternatives.
However, the point that Simon makes about a set of constraints, is interesting. Thisindicates that the alternatives have to be measured against a set of design criteria, andnot one single one. This issue is further discussed in section 5.5.
5.3 Tools and Methods for Performance Prediction
In chapter 2, several tools for performance prediction of solar energy systems weredescribed. There is a large number of tools available to the designers, includinghandbooks, simple calculation methods, and computer simulation models forquantitatively estimating the performance of solar buildings. Most of the toolsconcentrate on predicting the energy and economic performance of buildings andsystems, some also give indications of comfort and environmental impacts. There isno tool that can predict the total performance of a building.
Thus, the designers are left with a wide range of different tools, ranging from simpleguidelines to complicated computer simulation programs. Care should be taken not to
employ more apparently accurate methods of measurement in design than thesituation really deserves. There are two reasons why relatively simple models areusually quite sufficient in the early design phase. One is that there are inevitableunquantifiable aspects, hence it is impossible to deal with them on a purelyquantitative basis There is therefore bound to be some fuzziness in the finalrecommendations no matter how precisely the quantitative aspects are handled.Hence, it is a waste of effort to seek out great precision.
The second reason is that reality is far more complicated than any model can be. Informulating a model one omits a great many factors that one judges to be relativelyunimportant to the central issue of the analysis. It would be a waste of effort to try tomake a highly elaborate model of a real situation when a sensible simplification willserve approximately as well. The marginal utility of increased accuracy in a modeldecreases with great speed once it begins to provide approximate results.
In addition, there is usually not enough detailed information available in the earlydesign phase to support a detailed performance prediction. However, as the designevolves, and more details are being specified, more precise performance predictionsmay be carried out. This is reflected in the fact that the most common methods andtools for performance prediction in the early design phase are rules of thumb,intuition, gut feeling, experience, and simple calculation procedures. Detailed
computer simulation tools are normally not used until later in the design.

8/13/2019 Multi Criteria Sun Calculation House
http://slidepdf.com/reader/full/multi-criteria-sun-calculation-house 89/246
83
5.4 Presentation of Results
Presentation of the results of the performance prediction is important because it is the
basis for evaluating and choosing what alternatives to use. Several studies suggest thatpeople’s preferences are dictated by the presentation of a problem, (Tversky andKahneman 1981), (Keller 1985), (Bell, Raiffa et al. 1988) describe the followingillustrative case:
A group of subjects were asked to imagine that they had lung cancer and had tochoose between two therapies on the basis of the following probabilistic assessments:
• Of 100 people having treatment A, 90 live through the treatment. A total of 70people are alive by the end of the first year and a total of 38 people are alive by theend of five years.
• Of 100 people having treatment B, all live through the treatment. A total of 79people are alive by the end of the first year and a total of 26 people are alive by theend of five years.
A second group of individuals was presented with the same choice, except that thedata were presented in terms of mortality rates rather than survival rates (e.g., of 100people having treatment A, 10 die during treatment, etc.).
There were vast differences in the responses depending on whether the data werepresented in terms of survival rates or in terms of mortality. The proportion of subjects that preferred treatment B to A was 61% when the data were presented interms of mortality and was only 37% when presented in terms of survivability.
Bazerman (Bazerman 1998) describes several examples where he shows that thechoice of reference point influences the decision. In building design it is common tocompare the performance of a potential solution with a mean performance, i.e. theaverage value for existing buildings. The location of the reference point can determinewhether the decision will be positively or negatively framed, which may influence thedecision in a similar way as in the example above.
Another aspect with presentation of results is that it needs to be clear to the peoplethat are going to use it. The decision-makers are often clients or users that areunfamiliar with the language of the professionals. Also, the design professionals haveto understand the results from the other fields in order to implement them into theirown special area of expertise. Moreover, the results have to be put together in a waythat makes the overview easy. At the same time, it should be possible to go behind theoverall conclusions to see more details. Graphics are often useful to illustrateperformances, e.g. pie charts, bar charts, and so on. This is a “language” that mostpeople can understand. Graphics are also useful in showing relations and givingoverview. The Decision Desktop in the BDA program that was described in chapter 2(see Figure 2-18) is an example of an informative presentation of performance data
for different design alternatives. The performances of the alternatives on the differentcriteria are displayed side-by-side to facilitate direct comparison of the alternatives.

8/13/2019 Multi Criteria Sun Calculation House
http://slidepdf.com/reader/full/multi-criteria-sun-calculation-house 90/246
84
5.5 Conclusions
There is no doubt that judgement is very important in building design, especially in
the early design phases. There are many qualitative design considerations that cannotbe included in a numerical calculation procedure. The qualitative issues are often veryimportant to the decisions. In his book The Reflective Practitioner (Schön 1983),Donald Schön contrasts what he calls technical rationality to such judgements:
In the varied topography of professional practice, there is a high, hard ground where practitioners can make effective use of research-based theory and techniques, and there is a swampy lowland where situations are confusing “messes” incapable of technical solution. The difficulty is that the problems of the high ground, however great their technical interest, are often relatively unimportant to clients or to thelarger society, while in the swamp are the problems of greatest human concern. Shall
the practitioner stay on the high, hard ground where he can practice rigorously, as heunderstands rigor, but where he is constrained to deal with problems of relativelylittle social importance? Or shall he descend to the swamp where he can engage themost important and challenging problems if he is willing to forsake technical rigor?
The British architect and psychologist Bryan Lawson also criticizes the overemphasison rigor at the expense of relevance. He calls it “the numerical measuring disease”(Lawson 1997):
Perhaps it is because design problems are often so intractable and nebulous that thetemptation is so great to seek out measurable criteria of satisfactory performance.
The difficulty for the designer here is to place value on such criteria and thus balancethem against each other and factors that cannot be quantitatively measured. Regrettably numbers seem to confer respectability and importance on what might bequite trivial factors.
It is essential to keep the balance in performance prediction. This means that it maynot be worthwhile to put a lot of efforts into fine-tuning and optimization of oneaspect, if it is of little importance, or if other important issues are only treatedsuperficially. A problem with advanced computer simulation tools is that people tendto be so fascinated and absorbed in the program that it is taken as the answer to theproblem, and other issues may be neglected. In the 70’s and 80’s we saw a lot of
examples of how the emphasis on energy savings led to neglect of indoorenvironment and occupant health. We may also find examples where tediouscalculations of the overheating probability in offices have been carried out to find thatthere is no need for shading of windows - but glare problems have been forgotten.
Schön (1983) also warns against putting too much confidence in technical precisionwhen in reality there are large uncertainties in the predictions:
Many practitioners, locked into a view of themselves as technical experts, find nothingin the world of practice to occasion reflection. They have become too skillful at techniques of selective inattention, junk categories, and situational control techniqueswhich they use to preserve the constancy of their knowledge-in-practice. For them,uncertainty is a threat; its admission a sign of weakness. Others, more inclined
8/13/2019 Multi Criteria Sun Calculation House
http://slidepdf.com/reader/full/multi-criteria-sun-calculation-house 91/246
85
toward reflection-in-action, nevertheless feel profoundly uneasy because they cannot say what they know how to do, cannot justify its quality or rigor.
In the early building design phase, there is definitely a lot of uncertainty, and it isoften ignored. Handling of uncertainty is further described in chapter 6.
In section 5.2, it was concluded that a global optimization procedure is not useful forbuilding design, or at least it would be too ambitious for building design at its currentstate. On the other hand, satisficing was deemed to be too little ambitious because itdoes not encourage a search for improvements. Somewhere in between these twoextremes lies the pursuit of a “best” solution with respect to a set of criteria andconstraints, given limited time and resources.
Although a global optimization is not feasible, a sub-optimization may be useful. Asub-optimization permits using greater detail in the analysis and may help understandimportant interactions. It allows us to study a part of a problem at a time, thus making
the performance prediction simpler. Also, a study will, to some extent, always be asub-optimization because there will always be some limitations. On the other hand, asub-optimization leaves out important considerations. How then, can we sub-optimizeproperly? The answer is that we must make sure that the action that improves one partalso improves the whole. This may be achieved by using a hierarchical structure of criteria and keeping the criteria at the lower-level problem consistent with the criteriaat the higher levels.
In chapter 3 (Problem Formulation) it was argued that a hierarchical structure of design criteria would be useful for information management and a suitable basis forevaluating alternative solutions. Such a structure may also be a useful basis forperformance prediction. If the hierarchy is structured according to the objectives of the stakeholders, it will help promote a balanced performance prediction. Thehierarchy allows for dividing the problem into separate units while keeping track of the interactions. If the problem is carefully separated into parts at places where theinteractions between parts are weakest, improvement in a subsystem will produce theappropriate improvement in the system as a whole.
Finally, presentation of the results of the performance prediction is important. Severalstudies show that choice is strongly influenced by the framing of the outcome. Whenevaluating design solutions, the conclusion may depend on the choice of reference for
the different criteria. A consistent set of reference points for the criteria shouldtherefore be used, and different viewpoints should be tried out. In this way the designteam could really live up to the ideal of being reflective practitioners.

8/13/2019 Multi Criteria Sun Calculation House
http://slidepdf.com/reader/full/multi-criteria-sun-calculation-house 92/246
86
6 Performance Evaluation
6.1 Introduction
This chapter deals with the central issue of this thesis; the task of performanceevaluation. The objective of performance evaluation is to test if potential solutionsmeet the design objectives, in order to select the most promising design. It is
presumed that a set of potentially feasible design solutions has been generated (or canbe imagined). The design solutions are described by a set of attributes. An attribute isa characteristic of an option being evaluated that is measurable against some objectiveor subjective yardstick. It is also assumed that some design criteria (objectives) havebeen prescribed. If more than one alternative satisfy all the criteria to some extent, itis necessary to do some sort of evaluation to determine how well the differentalternatives satisfy the criteria. Also, it may be needed to identify what criteria aremore important, i.e. to determine the weights between the criteria.
The following section of this chapter (6.2) contains a survey of evaluation modelsused within the building industry and within the field of environmental planning.
Section 6.3 includes a survey of Multi-Criteria Decision-Making (MCDM) methods.The purpose of MCDM methods is to identify a preferred alternative from a set of alternative solutions that are characterized by multiple, usually conflicting attributes.Thus, they seem to fit well into the scope of this thesis. MCDM methods have foundapplications in many fields, including policy analysis, management science,psychology, and environmental planning. However, there are very few applications tobe found within the building industry, although recently some efforts have beeninitiated. The most central of the MCDM methods are described and theirappropriateness for the framework of the thesis is discussed.
Section 6.4 includes a discussion of how to include and treat uncertainty, risk, andfuzziness in the evaluation of design options.
Section 6.5 is a conclusion of the three previous sections, where the most promisingfeatures of the models described in sections 6.2, 6.3 and 6.4 are pointed out. Here, amulti-criteria evaluation model for use in solar building design is beginning toemerge.
Section 6.6 takes a closer look at measurement theories, discusses different models,and identifies what procedures are most suitable for use in building design.
In section 6.7, techniques for weighting of design criteria are discussed.
Everything is relative.

8/13/2019 Multi Criteria Sun Calculation House
http://slidepdf.com/reader/full/multi-criteria-sun-calculation-house 93/246
87
Section 6.8 is the conclusion of chapter 6. It summarizes the findings of the previoussections, and identifies promising aspects to include in a multi-criteria evaluationmodel for building design.
6.2 A Survey of Evaluation Methods used in theBuilding Industry and Environmental Analysis
This section includes a survey of evaluation models used within the building industryand the field of environmental analysis. Within the building industry, there is nopractice for multi-criteria evaluations. Although a range of different design objectivesis implicitly present in building design, it is not common to use any kind of model inorder to systemize them. Most often, some sort of cost estimate is carried out which in
turn is compared to the quality or value of the building design in some informal way.The models from environmental analysis are interesting because they seek to makethe comparison of cost and benefits more explicit.
Cost-Benefit Analysis (CBA)
Cost-benefit analysis (or benefit-cost analysis) is the principal analytical framework used to evaluate public expenditure decisions. A CBA consist of the following steps(Mishan 1971; Pearce 1971; Dasgupta and Pearce 1972; Pearce and Nash 1989; Bojö,Mäler et al. 1990):
• Identification of costs and benefits
• Quantification and evaluation of costs and benefits in terms of a commonmonetary unit
• Choice of a social rate of discount
• Choice of a time horizon
• Construction of a one-dimensional indicator bringing together all the benefits andcosts (many authors suggest the use of the net present value)
Having measured all benefits and costs in money terms, the following maximizationrule is applied:
where B t and C t are benefits and costs in time period t , r is the discount rate and T isthe time horizon. Obviously, if Bt and C t are in different units, no such decision rulecan be used. In order to be consistent with the objective of maximizing social welfare,it is necessary that the prices attached to the benefits and costs reflect society’svaluation of the final goods and resources involved. For this, different valuationapproaches have been proposed, for example the use of “conventional markets”,“implicit markets”, and “artificial markets”, see (Bojö, Mäler et al. 1990) for a furtherdescription.
+−
T
t t
t t
r C B)1(
max
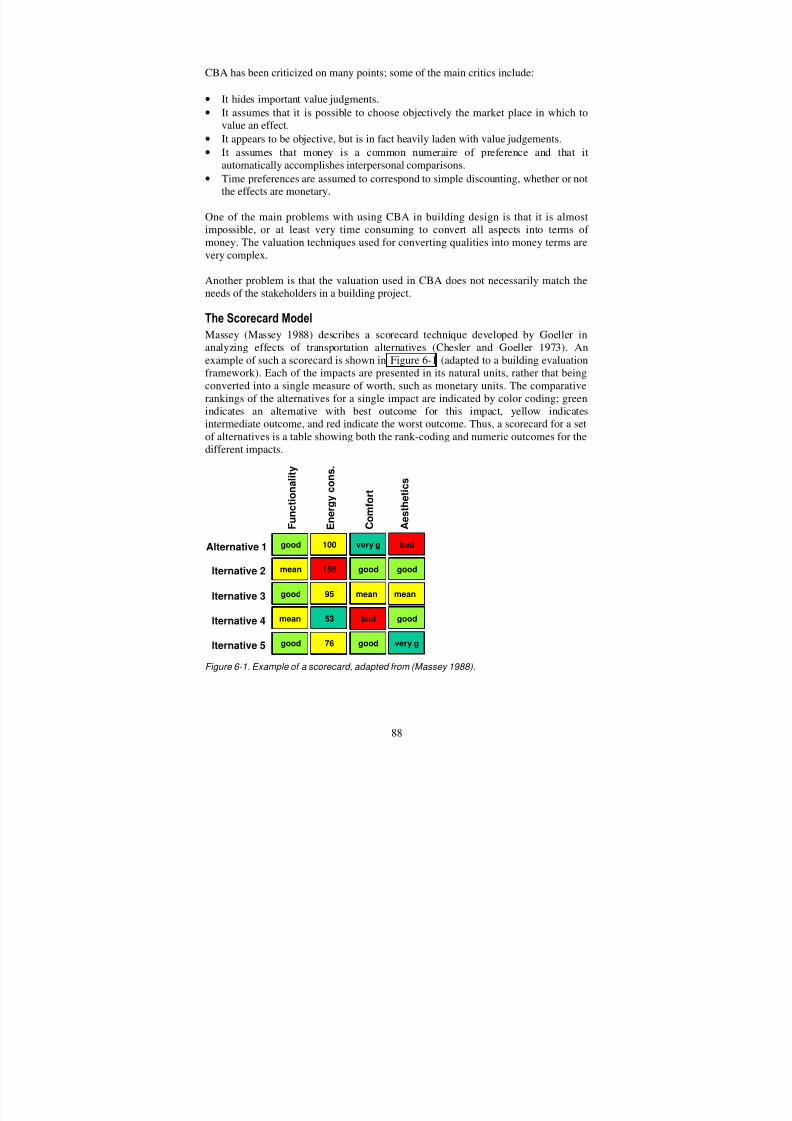
8/13/2019 Multi Criteria Sun Calculation House
http://slidepdf.com/reader/full/multi-criteria-sun-calculation-house 94/246
88
CBA has been criticized on many points; some of the main critics include:
• It hides important value judgments.
• It assumes that it is possible to choose objectively the market place in which tovalue an effect.
• It appears to be objective, but is in fact heavily laden with value judgements.• It assumes that money is a common numeraire of preference and that it
automatically accomplishes interpersonal comparisons.
• Time preferences are assumed to correspond to simple discounting, whether or notthe effects are monetary.
One of the main problems with using CBA in building design is that it is almostimpossible, or at least very time consuming to convert all aspects into terms of money. The valuation techniques used for converting qualities into money terms arevery complex.
Another problem is that the valuation used in CBA does not necessarily match theneeds of the stakeholders in a building project.
The Scorecard Model
Massey (Massey 1988) describes a scorecard technique developed by Goeller inanalyzing effects of transportation alternatives (Chesler and Goeller 1973). Anexample of such a scorecard is shown in Figure 6-1 (adapted to a building evaluationframework). Each of the impacts are presented in its natural units, rather that beingconverted into a single measure of worth, such as monetary units. The comparativerankings of the alternatives for a single impact are indicated by color coding; green
indicates an alternative with best outcome for this impact, yellow indicatesintermediate outcome, and red indicate the worst outcome. Thus, a scorecard for a setof alternatives is a table showing both the rank-coding and numeric outcomes for thedifferent impacts.
Alternative 1
lternative 2
lternative 3
lternative 4
lternative 5
F u n c t i o n a l i t y
E n e r g y c o n s .
C o m f o r t
A e s t h e t i c s
good 100
mean
good
155
95
53 bad
meanmean
good
very g
goodmean
good
bad
good 76 good very g
Figure 6-1. Example of a scorecard, adapted from (Massey 1988).
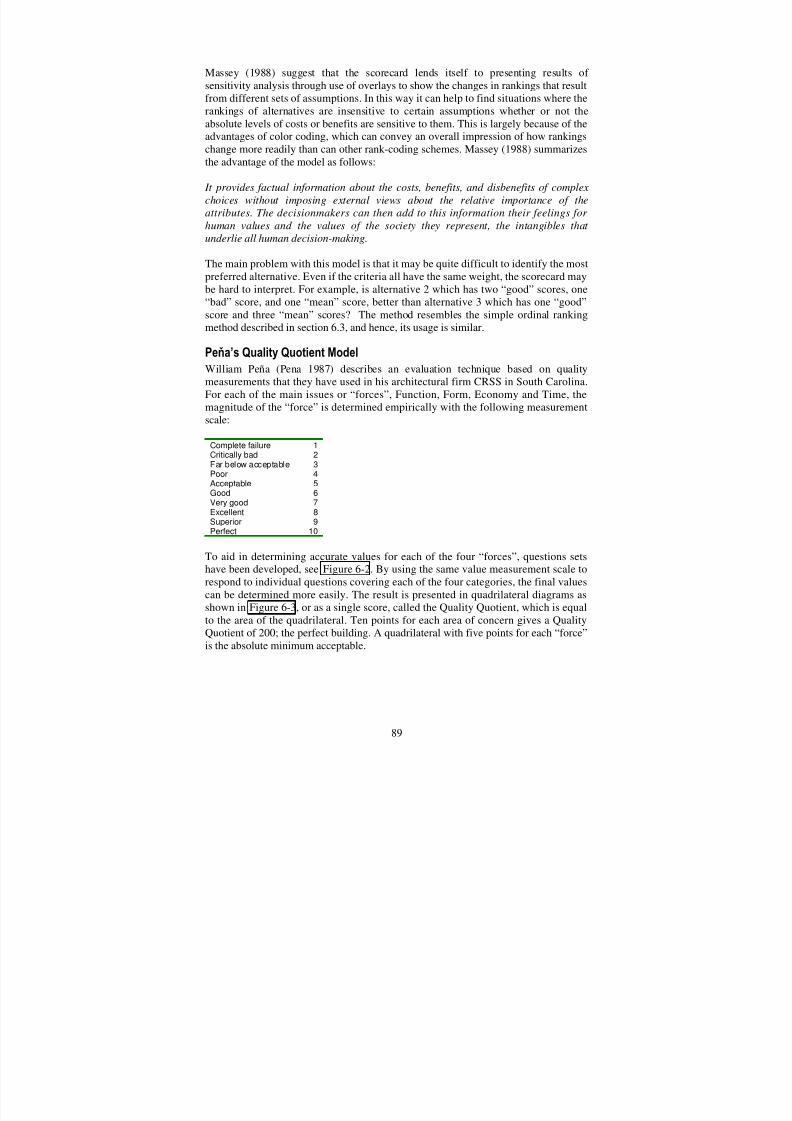
8/13/2019 Multi Criteria Sun Calculation House
http://slidepdf.com/reader/full/multi-criteria-sun-calculation-house 95/246
89
Massey (1988) suggest that the scorecard lends itself to presenting results of sensitivity analysis through use of overlays to show the changes in rankings that resultfrom different sets of assumptions. In this way it can help to find situations where therankings of alternatives are insensitive to certain assumptions whether or not theabsolute levels of costs or benefits are sensitive to them. This is largely because of the
advantages of color coding, which can convey an overall impression of how rankingschange more readily than can other rank-coding schemes. Massey (1988) summarizesthe advantage of the model as follows:
It provides factual information about the costs, benefits, and disbenefits of complexchoices without imposing external views about the relative importance of theattributes. The decisionmakers can then add to this information their feelings for human values and the values of the society they represent, the intangibles that underlie all human decision-making.
The main problem with this model is that it may be quite difficult to identify the most
preferred alternative. Even if the criteria all have the same weight, the scorecard maybe hard to interpret. For example, is alternative 2 which has two “good” scores, one“bad” score, and one “mean” score, better than alternative 3 which has one “good”score and three “mean” scores? The method resembles the simple ordinal rankingmethod described in section 6.3, and hence, its usage is similar.
Pe!a’s Quality Quotient Model
William Peña (Pena 1987) describes an evaluation technique based on qualitymeasurements that they have used in his architectural firm CRSS in South Carolina.For each of the main issues or “forces”, Function, Form, Economy and Time, the
magnitude of the “force” is determined empirically with the following measurementscale:
Complete failure 1Critically bad 2Far below acceptable 3Poor 4Acceptable 5Good 6Very good 7Excellent 8Superior 9Perfect 10
To aid in determining accurate values for each of the four “forces”, questions setshave been developed, see Figure 6-2. By using the same value measurement scale torespond to individual questions covering each of the four categories, the final valuescan be determined more easily. The result is presented in quadrilateral diagrams asshown in Figure 6-3, or as a single score, called the Quality Quotient, which is equalto the area of the quadrilateral. Ten points for each area of concern gives a QualityQuotient of 200; the perfect building. A quadrilateral with five points for each “force”is the absolute minimum acceptable.

8/13/2019 Multi Criteria Sun Calculation House
http://slidepdf.com/reader/full/multi-criteria-sun-calculation-house 96/246
90
FunctionA. To what extent have organizational concepts
been uncovered?
B. How well documented are the client’sfunctional relationships and goals?C. How much discrimination has been used to
distinguish between important form giversand details?
D. How realistic are the space requirementsbased on statistical projections, client needsand building efficiency?
E. How well identified are the user’scharacteristics and needs?
EconomyK. To what extent are the client’s economic
goals and budget limitations defined?
L. How well documented is the local cost dataconsidering methods of financing, planningand construction?
M. How well documented are the factors ofclimate and activities consideringmaintenance and operation costs?
N. How comprehensive and realistic is the costestimate analysis?
O. To what extent have economy concepts beenuncovered?
FormF. How clearly expressed are the client’s form
goals?
G. To what degree was rapport established withthe client and the design team on quality andthe cost per square foot?
H. How thoroughly is the site and climate dataanalyzed and documented?
I. To what extent has the surroundingneighborhood been analyzed for its social,historical and aesthetic implications?
J. To what extent have psychosocialenvironment concepts been uncovered?
TimeP. To what extent does the program consider
historical preservation and cultural values?
Q. To what degree have major activities beenidentified as static or dynamic?R. To what extent does the program anticipate
the effects of change and growth?S. How well has the time factor been utilized to
escalate costs and determine phasing?T. How realistic is the time schedule for the total
project delivery?
Figure 6-2. Question sets for evaluating performance during programming, (Pena 1987).
Figure 6-3. Scoring Diagrams for a “Perfect Building”, a “Barely Passing Building”, and a “Normal Building”, adapted from (Pena 1987).
This model shows a way of performing an evaluation that starts out with qualitativemeasures and converts them into numerical values. Peña argues strongly forquantification of qualities, because, as he states, “a symbol such as a score is a good way to immediately perceive a situation”, (Pena 1987). Furthermore, he claims thatquantification of quality is important because everyone, particularly users, judges ourbuildings. However, he does not devise a very specific way of transforming thequalities into the numerical scale; the question set that he supplies as an evaluationaid, is very loose.
The scoring diagrams that are used to present the results of the evaluation are veryillustrative. They give a picture of the overall score of the design, while at the same
Economy
Form
Time
Function
10
10
10
10
Economy
Form
Time
Function
8
4
8
6
5
5
5
5
Economy
Form
Time
Function

8/13/2019 Multi Criteria Sun Calculation House
http://slidepdf.com/reader/full/multi-criteria-sun-calculation-house 97/246
91
time showing the scores on the individual criteria (“forces”). Note that no weightingof the criteria is included.
The Weighted Evaluation Technique of Dell’Isola and Kirk
Dell’Isola and Kirk (Kirk and Dell'Isola 1995) describe a weighted evaluationtechnique that they have developed for use in building design projects. The method isillustrated for a case of choosing between different exterior wall constructions. Thevarious criteria are weighted numerically according to the importance that is attachedto them. The wall constructions are scored according to the degree to which they meetthe criteria. Finally, an overall score is calculated for each alternative. The weightedevaluation procedure works in the following way (see Figure 6-4):
Each of the criteria that the wall must satisfy are listed in the criteria scoring matrix inthe top half of the form (A, B, C, etc.). Then, the criteria are systematically comparedwith each other in terms of direction and strength of performance. For example,“Durability” (criterion F) is given minor preference over “Operational Effectiveness”(criterion e) and so is assigned a score of 2 (F-2) in the appropriate cell of the criteriascoring matrix. “Image/Aesthetics” (A) and “Color Rendition” (B) are ranked equally,giving the entry A/B. The process is repeated until all the criteria have been comparedwith one another.
The raw scores for each criterion are found by adding up the numbers in each cellwhere a preference for a particular criterion has been registered. For example, toobtain the raw score for criterion D, all the cell in the two diagonals originating fromD are examined. The upward sloping diagonal contains D-2, D-2, and D-3, and the
downward sloping diagonal D/E, D/F, and D-4. This gives a total score for G of 2+2+3+1+1+4=13. This is done for every criterion to generate the raw score line.These raw scores can now be used directly in the next stage of the exercise. However,for convenience, they are converted into a set of weights on a scale from 1 to 10.
The second stage requires each wall construction to be scored (on a range of 1 to 5)according to the degree to which it satisfies each of the criteria. These scores areinserted in the top box of each cell of the analysis matrix, beneath the criteria matrix.Thus, for example, construction type 1 is rated as “good” (score of 3) on criteria Cand G. The scores are then multiplied by the weights to give the entries in the lowerbox of each cell of the analysis matrix. For example, construction type 1 is given a
score of 20 (2x10) for criterion F.
The overall score of each wall construction type is computed simply by adding thescores in the lower boxes across the whole row of criteria. In summary, what theweighted evaluation of Figure 6-4 does is firstly to identify the relative importance of the various criteria. Secondly, it shows the extent to which the various finishes satisfythese criteria, both individually and in aggregate.
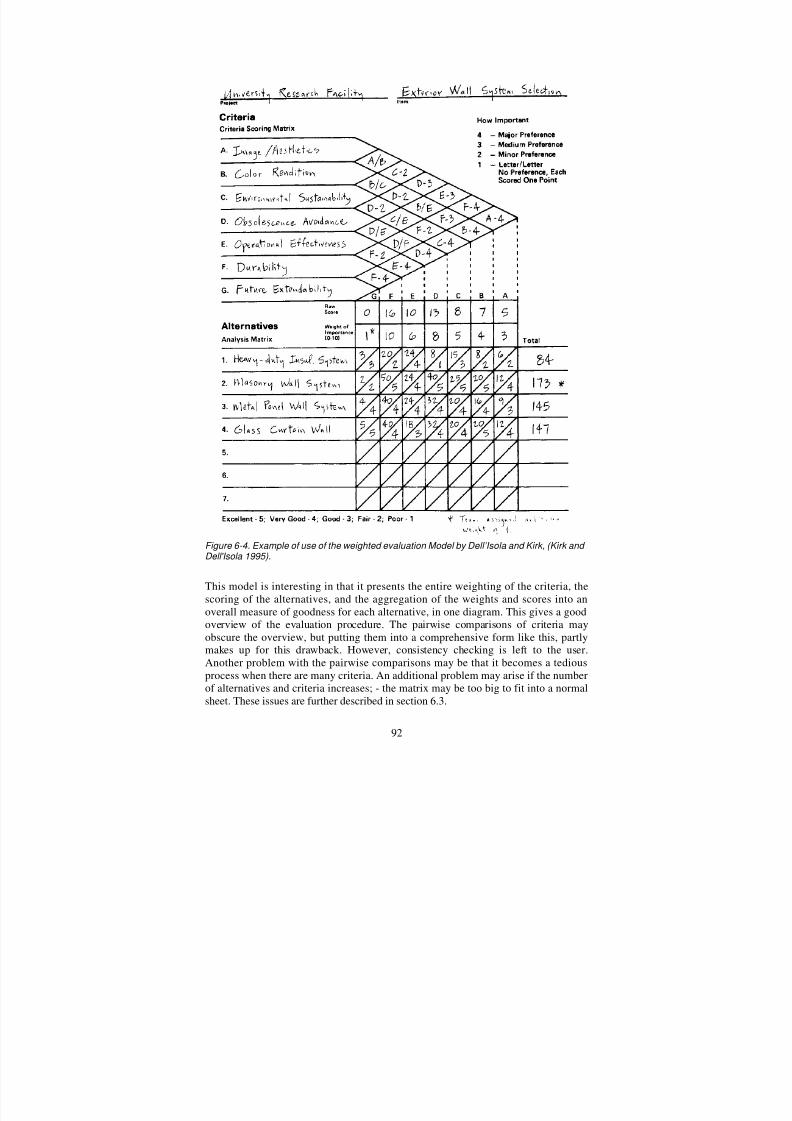
8/13/2019 Multi Criteria Sun Calculation House
http://slidepdf.com/reader/full/multi-criteria-sun-calculation-house 98/246
92
Figure 6-4. Example of use of the weighted evaluation Model by Dell’Isola and Kirk, (Kirk and Dell'Isola 1995).
This model is interesting in that it presents the entire weighting of the criteria, thescoring of the alternatives, and the aggregation of the weights and scores into anoverall measure of goodness for each alternative, in one diagram. This gives a goodoverview of the evaluation procedure. The pairwise comparisons of criteria mayobscure the overview, but putting them into a comprehensive form like this, partlymakes up for this drawback. However, consistency checking is left to the user.Another problem with the pairwise comparisons may be that it becomes a tediousprocess when there are many criteria. An additional problem may arise if the number
of alternatives and criteria increases; - the matrix may be too big to fit into a normalsheet. These issues are further described in section 6.3.

8/13/2019 Multi Criteria Sun Calculation House
http://slidepdf.com/reader/full/multi-criteria-sun-calculation-house 99/246
93
The Synthesis Model of Kirk and Spreckelmeyer
In their book “Enhancing Value in Design Decisions” (Kirk and Spreckelmeyer1993), the American architects Stephen J. Kirk and Kent F. Spreckelmeyer propose amodel for comparing design alternatives. In this model, the performances of individual components are measured against the design goals, in a similar manner asthe previous model. The model may be used during different stages of the designprocess.
Figure 6-5. Building layout evaluation and synthesis, from (Kirk and Spreckelmeyer 1993).
Figure 6-5 shows an example of the model used during the feasibility study. Heredifferent building layouts are evaluated. The layouts are measured with respect to thesix main design goals: flexibility of space, capital costs, owning and operating costs,expansion capabilities, energy conservation, and image & visibility. The performance
scale ranges from “poor” to “excellent”. The bottom bar shows the overall rankingwhich is a synthesis of the rankings on the individual criteria. Figure 6-6 shows and

8/13/2019 Multi Criteria Sun Calculation House
http://slidepdf.com/reader/full/multi-criteria-sun-calculation-house 100/246
94
example of the model used in a later design phase. Here, different exterior closuresare studied. In addition to showing performance scores, the model in this case alsoshows the weighting of the criteria and the aggregated weights and scores for all thealternatives. A simple additive weighting model (described in section 6.3) is used toaggregate scores and weights.
Figure 6-6. Evaluation of exterior closures, from (Kirk and Spreckelmeyer 1993).
The graphical display of this model gives a good overview of the performanceevaluation as a whole, while showing the individual performance measures that havebeen carried out. However, there is a limit to the amount of detail that can be shown.

8/13/2019 Multi Criteria Sun Calculation House
http://slidepdf.com/reader/full/multi-criteria-sun-calculation-house 101/246
95
An Expert Based Qualitative System Used in LCA
In a basically qualitative Life Cycle Analysis (LCA), Christiansen et al. (Christiansen,Grove et al. 1990) used two different matrixes for the evaluation. The first matrix wasused for a specific assessment and the second for a comparative assessment.
In the specific assessment matrix, six steps of the life cycle were combined with sixconsequence elements, as shown in Table 6-1. Key impact areas are noted using a 4-level scale:
Potential for severe impact: ---Potential for impact: -Potentially no impact: 0 Lack of knowledge: ?
In the comparative assessment, an alternative was compared to the base alternative in
a similar matrix. The same steps in the life cycle were included, however, theexposure and effect parts of the work and external environment were combined. Ascale going from “potentially much less impact than the base alternative” (+++) to“potentially much greater impact than the base alternative” (---) was used. Thevaluation system was completely expert-based and no criteria were given for therepresentation of different impacts in neither of the matrixes.
Table 6-1. Example of a specific assessment matrix used in the study, (Christiansen, Grove et al. 1990).
Life Cycle Stage
Consequence
Production
of rawmaterials
Production
of semi-products
Manufacturing
of finalproducts
Use Recovery Waste
Management
Consumptionof resources --- --- 0 - 0 0
Accidents-- -- - ? - -
Workenvironment – exposure
- -- - --- - -
Workenvironment – effect
-- --- - - - --
External
environment – exposure
-- ? - - 0 -
Externalenvironment – effect
--- - - -- - 0
The separation of impacts of different life cycle stages may be interesting also for usein building design. Designers tend to focus only on the construction phase, and forgetto include the consequences prior and following the construction that might be of significant importance.
The use of +/- signs to indicate scores gives a very crude indication of the relative
performances. This may be useful to screen out inferior alternatives, which is valuablein the early design stage. However, it is not suitable for aggregation of the different
8/13/2019 Multi Criteria Sun Calculation House
http://slidepdf.com/reader/full/multi-criteria-sun-calculation-house 102/246
96
scores in order to get a measure of the total value of an alternative action. Dissimilarweights of the different criteria are also hard to include in such a model. This issue isfurther discussed in later sections of this chapter.
An Expert-Based Quantitative Method Used in LCAIn a Dutch study (Annema 1992), an expert based quantitative system was used forpositioning different options on a diagram with the environmental yield on one axisand the economic impact on the other axis. The scores for the different impactcategories were normalized by relating the scores to the total score of that category inthe Netherlands, resulting in an environmental profile. The final step was to applyweighting factors to the different impact categories. This was done in a Delphi-likeprocess (the Delphi process is described in chapter 4).
In the weighting process, members of a steering group representing industry,government, environmental groups and some independent persons from universitiesand scientific institutes were involved. The process was a four-step approach. The aimof the first step was to gain a common understanding of the importance of the impactcategories and of facts that were included in the environmental and economic profiles.A basis for the discussion was a framework in which different aspects of the differentcategories were defined. This could involve a discussion about whether the impactaffects humans or ecosystems or both, the degree of scientific uncertainty, the degreeof reversibility of the impact, the scale of the impact, the timing of the impact, andother issues.
The second step of the weighting process was a first assessment of the weighting
factors. This step was done by each member confidentially. In the third step, theresulting positioning on the diagram was presented to the members who continuedtheir discussion to improve the common understanding of the problems. The fourthstep was a second assessment. The process was then repeated until all options hadbeen positioned on the diagram.
The “EPS-system”
The EPS (Environmental Priority Strategies in product design) system is developedby the Swedish Environmental Research Institute (IVL) and described by (Steen andRyding 1992). It is a system for assessing environmental impacts in terms of
ecological and health consequences. Five “safe guard objects” are valued, these are:biodiversity, production, human health, resources, and aesthetic values. These objectsare valued according to the willingness to pay to restore them to their normal status.Emissions, use of resources and the human activities connected to a product are thenvalued according to their estimated contribution to the changes in the safe guardobjects, and added. The resulting environmental effect of an action is expressed inELU (Environmental Load Unit). One ELU corresponds approximately to one EURO.The EPS system thus results in an economic valuation of the environmental impacts.In this respect it is similar to the Cost Benefit Method described earlier.

8/13/2019 Multi Criteria Sun Calculation House
http://slidepdf.com/reader/full/multi-criteria-sun-calculation-house 103/246
97
“Green Building” Assessment Tools
Recently, a number of “green building” assessment tools for evaluating theenvironmental performance of buildings have been developed. Virtually everydeveloped country now has their own program, for example the U.K. BREEAM (Prior1993), the Canadian BEPAC (Cole, Rousseau et al. 1993), The Dutch Eco-Quantum(Mak, Anink et al. 1996), the French ESCALE (Chatagnon, Nibel et al. 1998), theU.S. LEED (U.S.G.B.C 1999), and the Norwegian Økoprofil (GRIP 1996). Inessence, these programs are devoted mainly to evaluating the environmentalperformance of existing buildings by some sort of rating system. Through aninternational collaboration, the Green Building Challence’98, a second-generationenvironmental assessment tool has been developed - GBTool (Larsson and Cole1998). This tool incorporates a wider range of criteria, i.e. other criteria thanenvironmental loadings, such as functionality and management issues. GBTool is alsodeveloped with the future use as a design tool in mind. Hence, this program is the onethat is most closely related to the work in this thesis. Therefore, a closer look at this
program may be useful.
The GBTool was developed within the Green Building Challence’98 project, a 2 yearinternational project with 17 countries participating (Larsson and Cole 1998). GBToolis a framework and software tool for assessing the energy and environmentalperformance of buildings. Main design goals were:
• to focus on relativistic assessments, by relating assessments to benchmarks thatare based on applicable regulations or industry norms in each of the participatingregions
• to establish a structure that can be used at various levels of detail, from broad-brush assessments to detailed ones, and that can also subsequently be expanded toa design guideline system
• to establish a scoring system that accepts both hard and soft data in similar format.
GBTool is structured hierarchically in four levels, with the higher levels logicallyderived from the weighted aggregation of the lower ones:
1. Performance Areas2. Performance Categories
3. Performance Criteria4. Performance Sub-Criteria
The nesting principle of four levels is a critical feature of the framework in that itenables a building performance to be described at successively detailed levels. Ascoring scale ranging from –2 to +5 is used for assessing all criteria and sub-criteria.The performance level required to achieve a certain score is based on the 0 level beingthe reference or industry norm level; a –2 is significantly inferior and a +5 is set sothat it is extremely difficult to reach. Most of the scores for the various criteria arepresented on a scale that gives more points for a given increment in performance asthe overall performance level increases. The rationale for this being that it becomesincreasingly more difficult to attain performance improvements. Figure 6-7 gives an

8/13/2019 Multi Criteria Sun Calculation House
http://slidepdf.com/reader/full/multi-criteria-sun-calculation-house 104/246
98
example of such a performance scale. Performance scales are further discussed insection 6.6.
Score Default Performance
-2 The annual operating energy per m2 of gross floor area of the case-study building is 45% GREATER than that
of the Reference Building.
-1 The annual operating energy per m2 of gross floor area of the case-study building is 20% GREATER than thatof the Reference Building.
0 The annual operating energy per m2 of gross floor area of the case-study building is EQUIVALENT to theReference Building.
1 The annual operating energy per m2 of gross floor area of the case-study building is 25% LESS than that of theReference Building.
2 The annual operating energy per m2 of gross floor area of the case-study building is 40% LESS than that of theReference Building.
3 The annual operating energy per m2 of gross floor area of the case-study building is 55% LESS than that of theReference Building.
4 The annual operating energy per m2 of gross floor area of the case-study building is 65% LESS than that of theReference Building.
5 The annual operating energy per m2 of gross floor area of the case-study building is 70% LESS than that of theReference Building.
Figure 6-7. Performance scale for the criterion “Operating energy consumption” in the GBTool, (Cole and Larsson 1998).
Within the GBC documentation a series of criteria is offered as a basis for developingappropriate weightings such as: Is the effect upon the environment irreversible? Is theeffect upon the environment long lasting? What are the numbers of people effected bythe issue covered by the sub-criterion or criterion? Does the practice in question have
momentum that will require an extraordinary effort to counter? However, no clearlydefined methodology was proposed for their application. The weights and scores forthe different criteria are aggregated using a simple additive weighting method (seesection 6.3).
Several criticisms and observations were raised about the GBTool process (Cole andLarsson 1998), summarized as follows:
• Users felt that the tool required excessive time and effort to gather the datanecessary to make the assessments. The perception that after a massive effort of data collection and input, the final performance scoring can be skewed by asubjective judgement.
• The level of detail must be the same for both the quantitative and qualitativeinformation. If this is not possible, then it would be better to exclude thequalitative parts from the assessment based on a scoring system, and simply relyon a descriptive evaluation.
• The approach mixes the importance of a criterion with the difficulty of achievingit. In customizing the weighting system, “degree of difficulty” should not be afactor. Instead, the difficulty of achieving a specific level of importance should be
reflected in the benchmarks; if a sub-criterion is particularly difficult, the zerovalue should be set at a level that is easier to achieve.

8/13/2019 Multi Criteria Sun Calculation House
http://slidepdf.com/reader/full/multi-criteria-sun-calculation-house 105/246
99
• GBTool does not compare or assess groups of issues between criteria, nor does itassign importance to synergies. Given that green buildings are recognized as muchby the integration of systems and strategies, this is a serious limitation,particularly if used as a design tool.
It was an overall consensus that GBTool had to be streamlined to distinguish betweenthose issues that are important and those that are merely interesting, and omitting thelatter. The experiences of the GBC project are very useful also for the framework of this thesis.
Discussion
It is possible to identify 3 different approaches to performance evaluation:
1. Side-by-side comparison of alternatives with respect to performance criteria. Eachattribute is measured on it’s own separate scale, see Table 6-2. This means that theselection of the preferred alternative is made implicit, i.e. without any formalapproach for comparison of attributes or weighting of criteria. The scorecardmodel is an example of this approach.
2. All attributes are measured on the same scale, but weighting of criteria is doneimplicit. The scale may be numerical or non-numerical, see Table 6-3 and Table6-4. The expert-based LCA methods described above are examples of thisapproach.
3. An overall measure of the relative “goodness” of each of the alternatives iscalculated by one of the following approaches:(a) Converting all aspects into one criterion (e.g. money), like in the CBA.(b) All attributes are measured on the same scale, the criteria are weighted, and
the scores and weights for each alternative are aggregated into an overallmeasure of goodness. Most of the “green building” assessment tools use thisapproach. Also the method proposed by Dell’Isola and Kirk and the methodby Peña (assuming equal weights) are based on this approach.
Table 6-2. Side-by-side comparison of alternative solutions using individual performance indicators.
Criterion 1 Criterion 2 Criterion 3 Criterion 4 Criterion 5
Alternative 1 50 kWh 100 g good $ 4000 niceAlternative 2 20 kWh 70 g average $ 3500 uglyAlternative 3 10 kWh 40 g very good $ 3000 normalAlternative 4 15 kWh 50 g bad $ 2800 very nice
Table 6-3. Side-by-side comparison of alternative solutions using a common numerical scale (0-10) for performance measurement.
Criterion 1 Criterion 2 Criterion 3 Criterion4 Criterion 5
Alternative 1 4 2 7 3 7Alternative 2 5 4 5 4 1
Alternative 3 7 7 9 5 5Alternative 4 6 5 2 6 9

8/13/2019 Multi Criteria Sun Calculation House
http://slidepdf.com/reader/full/multi-criteria-sun-calculation-house 106/246
100
Table 6-4. Side-by-side comparison of alternative solutions using a common non-numerical scale for performance measurement.
Criterion 1 Criterion 2 Criterion 3 Criterion4 Criterion 5
Alternative 1 - - ++ -- ++Alternative 2 0 - 0 - ---Alternative 3 ++ ++ +++ 0 0Alternative 4 + 0 -- + +++
Evaluation involves judgments about how well the potential design solutions arelikely to fulfill the performance criteria. This implies assignments of “goodness” or“appropriateness” to the predicted performances. Since “good” and “bad” only makesense when there is at least two of a kind, a comparison of the different alternativesmust be carried out. Direct side-by-side comparison of the alternative solutions withrespect to the performance criteria can be effectively achieved by using a matrix
structure such as the one in Table 6-1 (type 1 approach). Some sorts of performanceindicators are used in order to show how well the different alternatives perform withrespect to the different criteria. Different performance indicators for the differentcriteria are used. For example, energy performance may be measured in annual kWhelectricity and fuel consumption per square meter, environmental loadings in annualemissions of kg CO2, SO2 and NOx per square meter, etc.
To get an explicit and overall measure of how well the alternatives score with respectto all criteria, a common set of performance indicators is required (type 2 approach).This can be achieved by establishing a common reference scale for each of thecriteria. For example, a numerical scale from 0 to 10 may be used, with 0 designating
the minimum acceptable or practically realizable value and 10 designating the bestpossible value. Several of the models use a reference value for each attribute as abasis for the measurement, i.e. determines the deviation from this.
In CBA (approach 3a), an overall measure of goodness is calculated by converting allaspects into one criterion (money). This gives a well-defined mathematical model thatcan be used to select the best alternative. However, this approach involves valuationtechniques that may be very complex and time consuming. Criteria weights are buriedinto the valuation model. In the other approach that involves the measurement of multiple attributes (3b), the weights for the different criteria are determined explicitly.The weights and the scores are then aggregated to produce an overall measure of
goodness for each alternative. Thus, the introduction of weights is a way of modelingthe relationship between the different criteria. This is in essence quite the same asmerging all criteria into a single criterion. Therefore, (3a) and (3b) are very muchrelated techniques. The difference is that in 3b the common scale does not have to bemoney, and that the weights are explicitly defined instead of being buried into thevaluation. In my view, model (3b) is more transparent and mathematically lesscomplicated, which makes it the most interesting for building design. Unfortunately,it still does not make the evaluation an easy task. The details of the model will befurther discussed in sections 6.3, 6.6 and 6.7.
In the models included in the above survey, the most used aggregation model is asimple additive weighting method, where the attributes are measured on a common

8/13/2019 Multi Criteria Sun Calculation House
http://slidepdf.com/reader/full/multi-criteria-sun-calculation-house 107/246
101
scale, multiplied by their respective weights, and added into an overall measure of goodness (3b). However, I did not find any information about the background forchoosing this method or the prerequisites for using it, in any of the approachessurveyed. When it comes to measuring attributes and creating scales, the methodsgive very little guidance or discussion of how to do this. This is surprising, since the
measurement of attributes may be crucial for the final outcome of the evaluation. Inthe “green building” assessment tools, the scales are generally predetermined, i.e.created by the developers of the method. This may be appropriate for “objective”values, i.e. where there is a consensus about their respective importance. Discussionsof techniques for weighting are also limited. In the environmental orientedapproaches, weighing is either based on expert judgement, on the concept of “willingness to pay”, or on political goals. The link between the measurement of attributes and the weighting (which is important in the simple additive weightingmethod, see sections 6.3, 6.6 and 6.7), has not received much attention in any of thesurveyed literature of the approaches that applies this concept. A further discussion of measurement and weighting techniques is given in sections 6.6 and 6.7.
Advocates of the type 1 approaches (i.e. no scoring or weighting) argue that peopletend to reject an opaque numerical process, trusting more in their own ability to weighfactors and come to a decision. They also claim that the weighting and scoringprocesses tend to hide important details, thus making the decision-making process lesstransparent. For example, the American system analyst Hugh J. Miser writes (Miserand Quade 1988):
All of these weighting approaches suffer from two important drawbacks: theycombine the large spectrum of information developed by the analysis into a singlemeasure, therefore acting to conceal its details from any parties at interest who donot participate in the weighting process; the weights, although they may beacceptable to the analyst and the decision-maker, may not represent the weights that might be assigned by the larger community.
The second objection may be valid in the case of public buildings, or for buildingwhere the users are not known. However, in the case where the client is a privatecompany that is going to occupy the building, the objection is not justified. In anycase, there will be value judgements inherent in the design decisions. In my view, itwould be better to make the value judgements explicit, so that outsiders can see whatand who’s values are included, than to just leave them “floating in the air”. Even
though a weighting procedure is applied, the details of the performance measurementcould still be revealed. This defies the first argument about concealing details.
Another objection against the weighting methods is that people may find it difficult toexpress their weights with respect to different objectives. Another American systemanalyst puts it like this (Quade 1995):
It is generally much easier for a group of decision-makers to determine whichalternative they prefer (perhaps for different reasons) than what weights to assign thevarious impacts.
This may be true, but it does not necessarily produce a good decision. If there aremany different objectives and conflicting interests, it is not easy to structure

8/13/2019 Multi Criteria Sun Calculation House
http://slidepdf.com/reader/full/multi-criteria-sun-calculation-house 108/246
102
everything in your head and come to a conclusion that you feel comfortable is theright one.
In any case, I believe that a formal way of expressing performance scores andweighting values, will produce more discussion among design team members than if
the scoring and weighing is just done implicitly. Therefore, a formalized process ismore likely to produce new insight and uncover values and biases among teamparticipants. This view is supported by Kirk and Spreckelmeyer, who has applieddecision-analysis approaches in practical building design:
In a practical application the process of scoring should generate much discussion,causing participants in the process to focus on the interpretation of the criteria theyhave defined in addition to assessment of options. It will often come to light that thesame words have very different meaning for different individuals, which can lead to arestructuring of the model. The process of setting end points on the scales can lead toan active search for alternative options, spurred by the feeling of “Can we not do
better than that”.
Scaling the objectives of a problem in this manner not only helps the design teamarrive at uniform measurement scales but is also a way to define the general natureand context of the problem. The process of defining and constructing thesemeasurement scales involves the collective participation of the entire team and allowseach team member to express his or her own values and expertise to the group as awhole. The establishment of the five scalar points represents not only a convenient measuring device for a decision-analysis exercise, but also presents a visible and public statement of the feeling about a specific design criterion that is shared by thedesign team. If, at a later stage of design, someone disagrees with the circulationscale or new information shows that the scale is incorrect, a mechanism has beencreated to allow the team to adjust this definition and to reach a new consensus. (Kirk and Spreckelmeyer 1993).
There is also a discussion about whether or not qualities could or should bequantified. Some argue that qualities are subjective values, hence they can not betransformed into an (objective) numerical scale. Others argue that measuring takesaway the focus from the most important thing, i.e. the process of improvement.Edward S. Quade writes (Quade 1980):
Actually, even our ideal measure is defective, for we should be talking about learning,not grades, if we remember what’s important rather than what’s measurable.
However, it is a fact that people do use quantitative measures for some properties of buildings. Bryan Lawson’s before mentioned criticisms of “the numerical measuringdisease”, also implies that people even tend to put more weight on the factors that canbe quantified. (Lawson 1997):
Perhaps it is because design problems are often so intractable and nebulous that thetemptation is so great to seek out measurable criteria of satisfactory performance.The difficulty for the designer here is to place value on such criteria and thus balance
them against each other and factors which cannot be quantitatively measured.

8/13/2019 Multi Criteria Sun Calculation House
http://slidepdf.com/reader/full/multi-criteria-sun-calculation-house 109/246
103
Regrettably numbers seem to confer respectability and importance on what might bequite trivial factors.
In my view, this is an argument that should lead us to either quantify the qualitativevalues or make quantities qualitative. The American architect William Peña argues in
favor of quantification (Pena 1987):
We know all the reasons why we should not quantify quality too – it’s subjective, it’sbased on value judgements which is different in every individual. It’s not scientificallyaccurate, and so on. Nevertheless everyone, particularly users, judge our buildings – the ultimate products of our services. That’s primarily why we are interested inevaluating our own intermediate products…..A symbol such as a score is a good wayto immediately perceive a situation. For that reason, we need to quantify quality – tohave a score.
The Dutch decision analyst Freerk A. Lootsma argues that measurement techniques
must be useful because they have widely been used for grading students (Lootsma1999):
The assignment of grades has been current practice during many centuries. Althoughwe do not assert that it is a perfect system, it has extensively been used for theevaluation of alternatives (students) under a variety of criteria (subjects or courses),and the decisions to be made were important.
It is a fact that building designers use value judgments that are important for the finaloutcome of the project. Building designers also use different numerical measures as abasis for decisions about what systems to choose. The crux of the problem then, ishow to combine the data and expertise from the different designers in such a way thatthe goals of the client are best fulfilled. It is difficult to compare different types of criteria, like some say you can’t apples and oranges. However, sometimes we have tochoose between them, we can’t get both the best apple and the best orange. An appleand an orange can be characterized by some common criteria: size, shape, taste,aroma, color, seediness, juiciness, etc. The strength of our preference for these criteriamay vary. It may vary with our mood at the time of selection, it may vary accordingto the use of the fruit, i.e. for display, for eating, for making a cake, etc.
When no formal approach is used, much of the background for the decisions will be
hidden inside the heads of the different experts. It is difficult for the other membersof the design team, as well as the client, to see what assumptions one expert has made.It is my hypothesis that the outcome of the project would be better if the expert judgements are revealed and documented through a formal approach. To be able toreach a conclusion, different values have to be compared and traded-off against eachother. Transforming all values into a common numerical scale may not be the best andonly answer to this problem. Nevertheless, using numbers to measure properties is away to communicate about values that everybody can understand. The process of creating numerical measures for different values may promote discussions aboutassumptions and values, reveal hidden value judgments, and promote understanding.It may also help structure the discussion and to focus on the issues that are of most
importance. Therefore, I think a formal, unified approach based on numerical scalesand weights deserves a chance. Yet, one should not expect that everybody would feel

8/13/2019 Multi Criteria Sun Calculation House
http://slidepdf.com/reader/full/multi-criteria-sun-calculation-house 110/246
104
comfortable with it in the beginning. Hence, a stepwise procedure, starting with thesimplest and most intuitive approaches, is recommended.
The conclusion, then, would be that an evaluation process should start with the type 1setup, i.e. making a side-by-side comparison of alternatives with respect to criteria,
using individual performance indicators (similar to the scorecard model). If there is anobvious choice that emerges from this model, the analysis could stop here. Otherwise,the next step is to measure the attributes on a common scale, weight the criteria, andproduce an overall measure of goodness for each alternative. This process shouldproduce a lot of discussion about judgements and values, which may lead to new orrevised design alternatives. The process may then be repeated.
Thus, a discussion of how to measure and aggregate a range of different attributes iscalled for. Within the field of decision analysis there is a range of so-called multi-criteria decision making (MCDM) methods where the measurement and aggregationof attributes are the central issues. The next section explores these methods.

8/13/2019 Multi Criteria Sun Calculation House
http://slidepdf.com/reader/full/multi-criteria-sun-calculation-house 111/246
105
6.3 MCDM Methods
Multiple Criteria Decision-Making (MCDM) methods include Multiple Objective
Decision Making (MODM) methods and Multiple Attribute Decision Making(MADM) methods.
MODM methods are concerned with the identification of a preferred alternative froma potentially infinite set of alternatives. Options are not defined explicitly, butimplicitly by a set of constraints. By far the majority of MODM approaches usemathematical programming in some way, see for example (Hwang and Masud 1979)or (Caballero, Ruiiz et al. 1997).
MADM is defined as “making preference decisions (e.g. evaluation, prioritization,selection) over the available alternatives that are characterized by multiple, usually
conflicting, attributes” (Yoon and Hwang 1995). MADM methodology is designedfor problems that are concerned with the evaluation of, and possibly choice between,discretely defined alternatives.
The MODM methods do not easily fit into a practical building design framework.This is first of all due to their rather complicated mathematical form. The use of computers may facilitate this, but still it is important that the users understand thetheory behind the methods in order to use them correctly. Also, the MODM methodsrequire explicit formulation of constraints and objectives as equations prior to theirapplication. This is difficult to obtain in the case of building design. Moreover, theyrequire a large amount of time to collect data that in the early design phase will have a
questionable accuracy. In building design, there is little time and understanding forvery sophisticated procedures like these, especially in the early design phase. Also, itis a fact that, in general, there are few practical applications of MODM methods inplanning of projects. MADM methods are much easier to understand and apply, andsince building design is very much about evaluating different design options, theycould be useful. Thus, the rest of the discussion will be devoted to MADMapproaches only.
There are numerous MADM methods, ranging from relatively simple andstraightforward models to advanced mathematical approaches. However, all MADMproblems share some common characteristics (Yoon and Hwang 1995):
• Alternatives: A finite number of alternatives are screened, prioritized, selectedand/or ranked. The term “alternative” is synonymous with “option”, “policy”,“action”, or “candidate”.
• Multiple Attributes: Each problem has multiple attributes. A decision-maker mustgenerate relevant attributes for each problem setting. The number of attributesdepends on the nature of the problem. For example, to evaluate cars, one may usethe attributes “price”, “gas mileage”, “safety”, “warranty period”, and “style”.
• Incommensurable Units: The attributes may have different units of measurement.In the car selection problem, gas mileage is expressed in miles per gallon, ride

8/13/2019 Multi Criteria Sun Calculation House
http://slidepdf.com/reader/full/multi-criteria-sun-calculation-house 112/246
106
comfort may be expressed in cubic feet, selling price in dollars, and safety isexpressed in a non-numerical way.
• Criteria Weights: Almost all MADM methods require information regarding therelative importance of each criterion (objective).
In an article published in “Operational Research Tutorial Papers, 1990”, ValerieBelton gives a description of the purpose of Multi-Attribute Decision-Making(MADM) methods5, (Belton 1990):
It is well known from psychological research that the human brain can onlysimultaneously consider a limited amount of information. The very nature of multiplecriteria problems is that there is much information of a complex and conflictingnature, often reflecting differing viewpoints and often changing with time. One of the principal aims of MADM methods is to help decision-makers organize and synthesizesuch information in a way that leads them to feel comfortable about making a
decision. In addition, the need to justify and explain why a particular course of actionwas chosen, are reasons for adopting a structured approach.
The context in which MADM is useful does not fit into the traditional optimization paradigm of operational research. The concept of an optimum does not exist, there isno such thing as a “right answer”. The aim of MADM methods is to help decisionmakers learn about the problem they face, to learn about their own and other parties’value systems, to learn about organizational values and objectives, and throughexploring these in the context of the problem to guide them through a process of learning, understanding, information processing, assessing and defining the problemand its circumstances.
This description suggests that MADM methods may be useful also in building design.There is definitely a lot of information of complex and conflicting nature. The conceptof an optimum does not exist. Most important, MADM methods would be useful if itcould really help the design professionals and decision-makers learn about their ownand each other’s values and judgements, and gain a deeper understanding of thedesign problems.
A survey of MADM methods has been carried out and is reported in Appendix A.Comprehensive surveys of MADM methods are given in (Hwang and Yoon 1981),
(Yoon and Hwang 1995) and (Chen and Hwang 1992). From these surveys, the mostrelevant methods are selected and described below. As underlined before, one of themost important requirements of a method to be used in building design, is that it isquick, simple and easy to use and understand. Many of the MADM methods involvequite complicated mathematics, thus they do not appear to have the user-friendlinessand transparency that is required for use in building design. Nevertheless, it might bepossible to use some aspects of the methods and adapt them into a building designframework.
5
Belton uses the word Multi-Criteria Decision Analysis (MCDA). However, I have replaced it withMADM methods to avoid confusion. Although Belton uses the more general term (MCDA), what sheis discussing in the paper is really MADM methods.

8/13/2019 Multi Criteria Sun Calculation House
http://slidepdf.com/reader/full/multi-criteria-sun-calculation-house 113/246
107
According to Valerie Belton (Belton 1990), the MADM approaches can be separatedinto two major, distinct categories, plus a few individual, fringe approaches. The twodistinct categories are the aggregate value function approaches, principally developedand applied in the USA, and the outranking approaches, principally developed inFrance and Belgium.
In addition to these two main categories, there are a few simple and intuitiveapproaches that should be mentioned. These are called methods for screening of alternatives, and ranking methods.
Methods for screening of alternatives
The dominance method is based on the concept that an alternative is dominated if there is another alternative that excels it in one or more attributes and equals it in theremainder. The first two alternatives are compared, and if one is dominated by theother, the dominated one is discarded. Next, the undiscarded alternative is comparedwith the third alternative, and the dominated one is discarded. Then, the fourthalternative is introduced, and so on. In the end, only the non-dominated alternativesare left. Since this non-dominated set usually has multiple elements, the dominancemethod is mainly used for the initial filtering. The method should be used with care,since it has been shown that some dominated alternatives might overall be better thanthe non-dominated alternatives (Yoon and Hwang 1995), see Appendix A. Yoon andHwang therefore suggest using a conjunctive method first.
In the conjunctive method the decision-maker sets up the minimal attribute valueshe/she will accept for each alternative (cutoff level). Any alternative that has anattribute value less that the minimum level, will be rejected. The cutoff level plays the
key role in eliminating the unacceptable alternatives; if the cutoff level is too high,none is left; if the value is relatively low, quite a few alternatives are left afterfiltering. Hence increasing the cutoff level in an interactive way, the alternatives can,in principle, be narrowed down to a single choice.
The disjunctive method also requires the decision-maker to establish cutoff values forthe attributes. An alternative is chosen if and only if it exceeds a minimal cutoff level.Where only one standard needs to be exceeded, most alternatives will pass unless thestandards are set at or near the maximal level. If all alternatives are disqualified, thedecision-maker can reduce the cutoffs of one or more attributes and resume theevaluation of alternatives. For example, professional football players may be selected
according to this method. A player is selected because he can either passexceptionally, run exceptionally, or kick exceptionally, etc. The player’s passingability is irrelevant if he is chosen for his kicking ability. While the conjunctivemethod guarantees rejection of all alternatives with extremely small talent, thedisjunctive method guarantees selection of all alternatives with any extreme talent.
Ranking Methods
The lexicographic ordering method assumes that the criteria can be ordered frommost to least important (ordinal scale, see chapter 6.6). The alternatives that satisfythe first criterion are judged with respect to the second criterion and if more than twoalternatives satisfy this criterion, a third one is used, and so on down the list until justone alternative is identified. Thus, a unique solution is not guaranteed, and theprocedure does not allow any tradeoffs among criteria. Lexicographic ordering does

8/13/2019 Multi Criteria Sun Calculation House
http://slidepdf.com/reader/full/multi-criteria-sun-calculation-house 114/246
108
not produce a classification of all the feasible alternatives and not all the informationfor the full set of criteria is necessarily used. In the process of comparing alternativesfor a particular criterion it is possible to take account of measurement errorsassociated with the estimates for the impacts. For example, a threshold value can bedefined which must be exceeded before one alternative is rated more attractive than
another. By altering the threshold values for each criterion one can judge if the samealternative consistently appears as the most attractive.
In (NIBR 1975b) two methods called simple rank and ordinal method are described.These methods are variations of the lexicographic method.
In the simple rank method the different alternatives are ranked (first, second, third,etc.), according to their degree of goal-achievement. All goals are assumed to beequally important, and the rankings are added to a total measure for the goal-achievement for each alternative:
Impact analysis variable(indicator)
1. place 2. place 3. place
Global warming Alternative 2 Alternative 3 Alternative 1Acidification Alternative 2 Alternative 3 Alternative 1Aesthetics Alternative 1 Alternative 2 Alternative 3Economy Alternative 3 Alternative 2 Alternative 1
# 1. places # 2. places # 3. places Rank
Alternative 1 1 0 3 lastAlternative 2 2 2 0 bestAlternative 3 1 2 1 second best
The alternative with the highest number of first places, is the preferred one.
The ordinal method is similar to simple rank , except that the goals are weighted. Thealternative with the highest number of first places with respect to the goal with thehighest weight, is the preferred one:
Impact analysis variable Weight 1. place 2. place 3. place
Global warming 4 Alt. 2 Alt. 3 Alt. 1Acidification 1 Alt. 2 Alt. 3 Alt. 1Aesthetics 3 Alt. 1 Alt. 2 Alt. 3Economy 2 Alt. 3 Alt. 2 Alt. 1
# 1. places and(weight)
# 2. places and(weight)
# 3. places and(weight)
Rank
Alternative 1 1(3) 0 1(4)+1(1)+1(2) lastAlternative 2 1(4)+1(1) 1(3)+1(2) 0 bestAlternative 3 1(2) 1(4)+1(1) 1(3) second best
The Median Ranking Method stems from the work of Cook and Sieford (Cook andSieford 1978). They introduced a distance function as a measure of agreement ordisagreement between rankings. The disagreement (indicator) for an alternative Ai tobecome the k th overall rank is defined as the sum of distances between the
attributewise rank and the k th rank. That is:
=
−=n
j
ij jik k swd
1
8/13/2019 Multi Criteria Sun Calculation House
http://slidepdf.com/reader/full/multi-criteria-sun-calculation-house 115/246
109
where sij is the attributewise rank of Ai according to the jth attribute and w j is theweight of the attribute. The next step is to pick the elements in the distance matrix toassign ranks to each alternative; that is choosing the elements in the different rowsand columns whose sum is the minimum. This can be accomplished by using the so-called “Hungarian Method” of linear programming. The resulting overall ranking
differs as little as possible from all available attributewise ranks. For a furtherexplanation of this method, see (Yoon and Hwang 1995).
Aggregate Value Function Approaches
Belton (1990) describes two major components of a value function – the evaluation of each of the options with respect to the criteria (objectives), known as the value
functions or scores, and scaling factors which reflect the relative importance of eachof the criteria, known as the weights. This information is then synthesized to give aninitial overall evaluation for each option using an aggregation model .
Value functions and scoringThe value of an alternative with respect to a criterion is measured using some sort of rating scale or a value function. Sometimes, a “natural scale” exists that captures theimportant values of the attribute. A natural scale is a scale that is in everyday use andhas a common interpretation. Often such quantitative scales are not readily availableor are too remotely related to the values of the decision-maker to be useful. Then,qualitative scales may be constructed that coincide with the decision-maker’spreferences. A value function may be constructed by converting a natural scale to avalue scale by means of relative judgements. Alternatively, if no physicalmeasurement exists, the value scale can be constructed simply by direct judgement.
Section 6.6 describes different scaling techniques in further detail.
WeightingWeights serve to express the importance of each criterion relative to the others. Theweight assigned to a criterion is essentially a scaling factor that relates scores on thatcriterion to the scores on all other criteria. There are numerous weight assessmenttechniques, some of the most common ones are discussed in section 6.7.
Aggregation modelsThe aggregation model defines how weights and value functions for each attribute aresynthesized in order to find an overall value for each alternative. The simplest one,
and by far the most frequently used is the simple additive weighting (SAW ) model:
where:v is the overall value of the evaluation object x, xi is the measurement of object x on attribute i,vi is the single-attribute value function,wi is the weight of attribute i,n is the number of attributes
=
=n
i
iii xvw xv1
)()(

8/13/2019 Multi Criteria Sun Calculation House
http://slidepdf.com/reader/full/multi-criteria-sun-calculation-house 116/246
110
If additivity cannot be assumed (see below), there are also multiplicative andmultilinear models. The simplest multiplicative model requires only the addition of aninteraction term. These models are considerably more complicated in appearance, andwill not be shown here. Von Winterfeldt and Edwards give detailed descriptions of these models (von Winterfeldt and Edwards 1986).
Belton (1990) distinguishes between different groups of aggregate value functionapproaches. One group is the Inverse Preference Methods. These approaches take astheir starting point holistic judgements about the value of alternatives from which theyinfer a value function, as in the case of PREFCALC (Lagreze and Shakun 1984), or a judgment policy as in the case of POLICY (Rohrbaugh and Wehr 1978). Due to thehigh demands on information and complicated value function elicitation procedures,these models are not considered to be relevant for the scope of this thesis.
Within the remaining aggregate value function approaches Belton identifies a numberof schools. The most widely used are versions of the Simple Multi-Attribute Rating
Process (SMART) described by Edwards and Newman (Edwards and Newman 1982),and the Analytic Hierarchy Process (AHP) by Saaty (Saaty 1990).
SMART (Simple Multi-Attribute Rating Theory) was developed by Edwards(Edwards 1971; Edwards 1977) in an attempt to make a simpler version of the Multi-Attribute Utility Theory (MAUT) described by (Keeney and Raiffa 1976). MAUTincorporates the concept of utility functions, while SMART uses value functions. Autility function differs from a value function in that it also takes account of attitude torisk (through the introduction of gambles, see Appendix A and section 6.4). As aconsequence, the value functions are much less complicated and the assessmentprocedures less complex. Edwards was frustrated by the complicated measurementand elicitation techniques of MAUT, and sought simple and robust procedures insteadof theoretical soundness and elegance.
The earliest version of SMART consisted of the following 10 steps:1. Identify the organization whose values are to be maximized2. Identify the purpose of the value elicitation3. Identify the entities (alternatives, objects) that are to be evaluated4. Identify the relevant dimensions of value (attributes)5. Rank the dimensions in order of importance6. Make ratio estimates of the relative importance of each attribute relative to the one
ranked lowest in importance7. Sum the importance weights; divide each by the sum8. Measure the relative value of each entity (alternative, object) on each dimension
on a scale of 0 to 1009. Calculate the overall values using a weighted additive model (SAW)10. Choose the alternative that maximizes the overall value
In more recent versions of SMART the structuring steps (1-4) have been emphasized.In particular, recognition of the hierarchical nature of structures of objectives andattributes frequently leads to versions of SMART that make use of value trees andhierarchical weighting procedures. Variations of SMART differ in the specific
techniques for constructing single-attribute values of the objects under evaluation and

8/13/2019 Multi Criteria Sun Calculation House
http://slidepdf.com/reader/full/multi-criteria-sun-calculation-house 117/246
111
in the specific method of weighting (von Winterfeldt and Edwards 1986). Differentscoring and weighting techniques are described in sections 6.6 and 6.7 .
AHP (Analytical Hierarchy Process) was developed by Saaty (Saaty 1990). The twobasic features of the AHP are the formulation of the problem in the form of a
hierarchy and the judgement in the form of pairwise comparisons. The hierarchy hasat least three levels:
• Top level: Overall goal of the problem.
• Middle level: Multiple criteria that define alternatives.
• Bottom level: Competing alternatives.
When criteria are highly abstract, such as “well being”, sub-criteria (or sub-sub-criteria) are generated sequentially through a multilevel hierarchy. An example of such a hierarchy is shown in Figure 6-8.
Figure 6-8. Example of a hierarchy of criteria and alternatives as devised by the AHP method.
A pairwise comparison matrix approach is applied to compare elements at a singlelevel with respect to an objective from the adjacent higher level. The process isrepeated up the hierarchy. Next, for each criterion a pair-wise matrix of thealternatives is established and for each alternative a score is calculated, using thenormalized principal eigenvector (see Appendix A). A final score for each alternativeis calculated by summing the weighted values for the set of criteria. The alternativescan then be ordered using these scores.
In order to help a decision-maker to assess the pairwise comparisons, Saaty created anine-point scale of importance or preference, see Figure 6-9. The numbers expressdegrees of preference between the two elements.
Since it is quite likely that the pairwise comparisons will be inconsistent, Saatypresented the eigenvector prioritization method to compensate for inconsistencies of human judgment (see Appendix A).
Numericalvalues
Definition
13579
2,4,6,8
Equally important or preferred.Slightly more important or preferred.Strongly more important or preferred.Very strongly more important or preferred.Extremely more important or preferred.
Intermediate values to reflect compromise.
Figure 6-9. The fundamental scale for pairwise comparisons, adapted from (Saaty 1990).
Small environmentalloading
Good architecturalqualities
Good economicperformance
Good comfort
Satisfactory building integratedsolar energy system
Level 1:Objective
Level 2:Criteria
Level 3:Alternatives
Active solarcollectors
Increasedwindowarea
Photovoltaiccladding

8/13/2019 Multi Criteria Sun Calculation House
http://slidepdf.com/reader/full/multi-criteria-sun-calculation-house 118/246
112
Outranking Approaches
The outranking school of thought differs from the aggregate value functionapproaches in that it rejects the notion that all alternatives are comparable,maintaining that in some circumstances a decision-maker or group will be unwillingor unable to compare some options. The output is not a value for each option, but anoutranking graph indicating preferences, indifferences and incompatibilities.According to Belton (1990), the two most prominent groups of outranking methodsare those proposed by Roy et al., (Roy 1973; Roy and Bertier 1973; Roy 1977; Roy1978; Roy and Hugonnard 1982; Roy 1985) known as the ELECTRE methods, andthose proposed by (Brans, Mareschal et al. 1986), known as the PROMETHEEmethods.
ELECTRE II (Roy and Bertier 1973) is one of the earliest and simplest of theoutranking approaches. The starting point is a set of options evaluated according to
specified criteria. The criteria may be weighted to reflect importance. Unlike theweights used in value functions these do not represent trade-offs, but their meaning isnot well defined (Yoon and Hwang 1980; Belton 1990). The method is based on theevaluation of two indices, a concordance index and a discordance index, see Figure6-10. The concordance index measures the strength of support in the informationgiven for the hypothesis that option A is preferred to option B. The discordance indexmeasures the strength of evidence against this hypothesis. Concordance anddiscordance indices are determined for each ordered pair of options, A and B. Fromthese indices, an outranking relationship is built (step 3 in Figure 6-10). The thresholdlevels C* and D* are specified for a particular outranking relation and they may bevaried to give more or less severe outranking relations. The selection of threshold
levels is arbitrary and is not based on any theoretical or practical grounds (Massam1988), (Yoon and Hwang 1995).

8/13/2019 Multi Criteria Sun Calculation House
http://slidepdf.com/reader/full/multi-criteria-sun-calculation-house 119/246
113
Figure 6-10. Building an outranking relation in ELECTRE II, from (Belton 1990).
The PROMETHEE methods were developed by (Brans, Mareschal et al. 1986) andinvolve defining a preference function for each criterion, utilizing the informationabout differences in performance. The preference function describes the intensity of preference for option A over option B as a function of the difference in evaluation onthat criterion. The function takes values between 0 and 1 and a number of standardshapes have been selected (Belton 1990). A preference matrix P j(A,B) can be cratedfor each criterion j. The next step is to determine a preference index for A over B.This is defined as:
P(A,B) = SUM j (P j(A,B))/N or P(A,B) = SUM j (w jP j(A,B))/SUM j(w j)
N is the number of criteria. Criteria weights w j may be introduced, as shown in theright equation. As with the ELECTRE methods these weights do not represent scalingfactors, but some notion of global importance. If weights are introduced thepreference index should be normalized by the sum of weights rather than the numberof criteria.
The method uses this information to determine the value of two indices, the positiveoutranking flow, Q+(A), and the negative outranking flow Q-(A):
Q+(A) = SUM X P(A,X) Q-(A) = SUM X P(X,A)
1. For each pair of options, A and B, calculate the concordance coefficient, C(A,B), and thediscordance coefficient, D(A,B).
2. Set thresholds of concordance, C*, and discordance, D*.
3. For each pair of options determine if A outranks B, and B outranks A, or A and B areincomparable, using the following tests:
Is C(A,B) >= C*?
Is C(B,A) >= C*? Is D(A,B) <= D*?
Is D(B,A) <= D*?
B outranks A A and B areincomparable
A outranks B
no
no no
no
yes
yes
yes
yes
4. The thresholds C* and D* can be varied to give more or less severe outranking relations.

8/13/2019 Multi Criteria Sun Calculation House
http://slidepdf.com/reader/full/multi-criteria-sun-calculation-house 120/246
114
The positive outranking flow expresses the extent to which A outranks all otheroptions, X . The negative outranking flow expresses the extent to which A is outrankedby all other options. These indices are then used to construct a partial order of thealternatives.
Discussion
The dominance method and the conjunctive method may be useful in order to screenout inferior alternatives. For example, the decision-maker may decide that all designoptions that have an initial cost above a specified level, are unacceptable no matterhow high it scores on other criteria. The disjunctive method may be used to screen outthe most promising alternatives by specifying a performance standard for all attributesthat needs to be exceeded in order to qualify for further investigation. However,neither of these methods will solve the problem of conflicting values. Therefore, thesemethods will not help us all the way to the end.
The advantages of the ranking methods are that they are easy to apply, they involveno numerical computation (except for the median ranking), and they are easy toexplain and justify in terms of a priority ordering defined on the aspects. The maindisadvantage is the non-compensatory nature of the selection process. The rankingmethods do not guarantee that the most preferred solution is found. Also, if morespecific preference information is available, like interval or ratio data (see section6.6), this can not be utilized in order to get a finer differentiation between alternatives.In building design, there are normally several parameters that can be quantified, forexample cost data and energy consumption. If these data are transferred to an ordinalscale, a lot of information will be lost. On the other hand, there may be contexts in
which ranking methods provide good approximations and could thus serve as usefulsimplification procedures.
Bernard Roy developed ELECTRE because he was critical to the utility function andvalue function methods on the grounds that they require all options to be comparable.He describes the ELECTRE methods as providing weaker, poorer models than a valuefunction, built with less effort, and fewer hypotheses, but not always allowing aconclusion to be drawn (Roy 1977). Roy and Bouyssou (1986) admits that ELECTRE“has no axiomatic basis, and consequently it is often difficult to interpret certain parameters in it ”. They add, “only considerations based on common sense allow thedecision-maker and the analyst to give them a numerical value”.
By using outranking methods, some incomparable actions become comparablebecause realistic information exists, but other actions remain, nevertheless,incomparable. Since a comparison of all alternatives and criteria is necessary to reacha conclusion, these methods cannot help us to the end. Belton (Belton 1990)comments on ELECTRE that “I feel that the approach is a useful one for roughingout a problem, and possibly identifying a small set of options for further, moredetailed analysis. However, the information needed for this is quite substantial.”
The most serious drawback of the outranking methods in relation to use in buildingdesign, is that they are very difficult to understand for people that are not experts in
the field. Even the experts themselves admit that they are difficult to interpret (seeabove). The value function approaches are much more intuitive and simple. The most

8/13/2019 Multi Criteria Sun Calculation House
http://slidepdf.com/reader/full/multi-criteria-sun-calculation-house 121/246
115
simple and straight forward of the value function approaches is the Simple AdditiveWeighting method (SAW). Also, the Analytical Hierarchy Process (AHP) is gainingattention.
However, these too are fraught with difficulties. The aggregation of impacts across a
wide range of variables may be worrying to decision-makers. Some argue that theworth of a particular plan is not a simple additive function of the worth of the variouscomponents or even a readily identifiable multiplicative function, for that matter. Thisis stressed in a paper by Roy and Bouyssou (Roy and Bouyssou 1986). Some evenargue that no multi-attribute formulation can ever capture the subtlety and delicacy of the human mind’s ability to compare holistic alternatives (Duckstein, Kisiel et al.1975; Goicoechea, Hanson et al. 1982). One the other hand, there seems to be a lack of empirical support for this view (French 1988). Also, it has been showed thatholistic assessments in practice give weight to fewer attributes than a guided multi-attribute approach (Slovic and Lichtenstein 1977; Fischer 1979).
The Simple Additive Weighting method uses all attribute values of an alternative andapplies regular arithmetical operation of multiplication and addition. Therefore, theattribute values must be numerical and comparable. Also, for the method to be strictlyvalid, the criteria should satisfy the conditions known as preference independence andutility independence. Preference independence states that the tradeoffs a decision-maker is willing to accept between any two criteria are not dependent on any othercriteria. For example, given three criteria: “minimum environmental loading”,“minimum cost”, and “good aesthetics”. If a decision maker is willing to accept a10% increase in building costs given that he will get 20% lower environmentalloading, this should be the case for any implications on aesthetics. Utilityindependence means that criteria are neither complementary nor substitutes. Criteriaare complementary if excellence with respect to one attribute enhances the utility of excellence with respect to another. Criteria are substitutes if excellence with respect toone attribute reduces the utility gain associates with excellence with respect to otherattributes.
The verification of these two conditions depends upon the confidence one can attachto options regarding trade-offs among criteria at hypothetical levels. These types of questions may not be easy to pose to the decision-makers in manageable practicalways. Row and Pierce (Rowe and Pierce 1982) argue that those who are asked todescribe indifference levels or trade-offs may not have great confidence in their
ability to make the necessary judgements.
While the legitimacy of using simple additive weighting methods may be contested, itis a fact that they are the most commonly used of the MADM methods. This is due totheir simplicity and intuitive appeal. Also, several studies have shown that theory,simulation computations, and experience all suggest that the SAW method yieldsextremely close approximations to very much more complicated non-linear forms,while remaining far easier to understand (Hwang and Yoon 1981) .
The AHP has become quite popular, and has found applications in a wide number of fields, recently including decisions about indoor comfort in buildings (Clements-
Croome 1997), environmental assessment of buildings (Glaumann and Malm 1998),(Lippiatt 1998), and hydropower plant upgrading (Tangen 1996). In the US, the AHP

8/13/2019 Multi Criteria Sun Calculation House
http://slidepdf.com/reader/full/multi-criteria-sun-calculation-house 122/246
116
method has even been incorporated in a standard for decisions of investments relatedto building and building systems (ASTM 1998), and an accompanying softwareproduct is available (Forman, Chapman et al. 1998).
There has been extensive debate about the AHP in the literature, centering on a
number of issues with both practical and theoretical significance, see (Watson andFreeling 1982; Watson and Freeling 1983; Saaty and Vargas 1984; Belton and Gear1985; Belton and Gear 1985; Vargas 1985; Dyer 1990; Dyer 1990; Harker and Vargas1990; Saaty 1990). The most important drawbacks of the AHP for use in buildingdesign are:
• The pairwise comparisons may lead the decision-maker to feel that he looses theoverview of the problem. The link between the pairwise comparisons on the ratioscale and the final ranking of the alternatives is complicated. The decision makerfocuses on small parts of the problem at a time, and when the overall result ispresented, the details of the cause-effect relationship are difficult to see. If the
decision-maker does not understand this relationship, the result might be hard toaccept. This is perhaps the most serious drawback of the method with respect toit’s use in building design.
• When there are many attributes, the number of pairwise comparisons becomeslarge (n·(n-1)/2, where n is the number of attributes). For example, if there are 10attributes, there will be 45 pairwise comparisons. Thus, the process may be tootime-consuming for “busy builders”.
• A positive feature of the AHP is that it offers feedback on the degree of
consistency between comparisons of alternatives within one attribute. However,this does not necessarily mean that the decision-makers will have no problems inanswering the attribute weighting questions consistently. For example, one canwonder whether the questions should be answered with respect to averageperformance levels or maximum performance levels of the alternatives. Inaddition to understanding what the attributes actually imply, the relations in thepairwise comparisons must be interpreted in a consistent manner (i.e. the scalesmust be used in the same way for all attributes). Hence, the decision-maker mustachieve a conscious understanding of terms like “moderately more preferable”,“strongly more preferable”, etc., that is comparable between attributes. Thus, theprocess of answering the pairwise comparison questions in a consistent way may
be exhaustive and confusing to decision-makers.
The advantage of the AHP is first of all that it offers a formal and logical way of including qualitative values in the analysis. The consistency check may help uncoverbiases and inconsistencies in judgements. Also, the hierarchical way of structuring theproblem may help the understanding of the problem and the value system.
An important advantage of multicriteria methods is that they make subjectivity and judgements explicit. Multicriteria methods allow one to take into account conflictual,multidimensional and incommensurable effects of decisions in a formal way. Theymay help to uncover and discover values and aspects that would otherwise have been
forgotten. A good MCDM method may stimulate discussion among team participantsand promote a common understanding of the design problem. In this way they seem
8/13/2019 Multi Criteria Sun Calculation House
http://slidepdf.com/reader/full/multi-criteria-sun-calculation-house 123/246
117
to fit perfectly into the framework of this thesis. However, the methods may appearvery complex and “foreign” to building designers. Also, the reliability of the methodsis questionable, especially when used by someone inexperienced. Experiments doneby (Hobbs and Meier 1994) indicate that different MCDM methods can yieldsignificantly different decisions. Studies done by (Srivatava, Conolly et al. 1995) even
indicate that the methods don’t always give similar results when used repeatedly insimilar context. However, in building design, one can’t expect to find the one and only right answer in any case. Therefore, the most important feature of the methods isthat they can produce deeper understanding of the design problem. Thus, as long asthe users understand the logic and shortcomings of the methodology, some aspects of MCDM approaches may be adapted into a building design framework.
Until now, how to deal with uncertainties or vagueness in the design process has notbeen dealt with. Therefore, the next section will discuss this. Also, the details of howto measure attributes and weight criteria need further investigation. These issues arediscussed in sections 6.6 and 6.7.
6.4 Uncertainty, Risk, and Fuzziness
Uncertainty and Risk
A common way to deal with uncertainty is to ignore it. The need to do away withuncertainties frequently leads people to take too much credit for successes and toomuch blame for failures, (Dawes 1988).
Building design is concerned with specifying a product that (hopefully) will be usedand operated for many years into the future. Consequently, the future costs andbenefits that the alternative building designs will bring, include many uncertainties.For example, it is hard to predict exactly how the energy prices will develop duringthe next 30 years, though it is likely that they will rise on an average. The ability topredict and evaluate future consequences of a design option may be crucial for thesuccess of a project. How then, should the uncertainties best be accounted for in theevaluation of design options?
The concept of risk is often used in connection to uncertainties. The meaning of risk varies somewhat. Often, risk is associated with highly negative consequences, which
rarely occur. Sometimes it means the probability of a negative consequence. In othercases, it may mean the negative consequences themselves. In yet other cases, risk mayrefer to the statistical expectation of the negative consequences. Most commonly,however, risk refers to the entire spectrum of negative consequences with theirassociated probabilities.
Risk assessment is often thought of as consisting of two parts: risk estimation and risk evaluation. In risk estimation, one is concerned with identifying the various seriousnegative consequences of a project or activity, and assigning probabilities to thoseconsequences. In risk evaluation, one appraises the acceptability of the risk.
Mann defines the difference between risk and uncertainty as follows (Mann 1992):

8/13/2019 Multi Criteria Sun Calculation House
http://slidepdf.com/reader/full/multi-criteria-sun-calculation-house 124/246
118
“Suppose that we assume that there are several possible future “states of the world”,and that our alternatives will have different levels of performance for each of them. If it is possible to make reliable estimates about the probability of occurrence of thedifferent states of the world, we are faced with a situation of decision-making under risk . When no probability estimates can be made, we are in a decision-making
situation under uncertainty.”
There are different way of dealing with risk, some are described in (Mann 1992),(Flanagan, Norman et al. 1989), (Dror 1988), (Bejrum 1991), (Bazerman 1998), and(French 1988). The following brief description is based mostly on (Mann 1992).
Gambles with known odds are situations of decision-making under risk . Game theorysuggests a criterion for this type of decision based on what one would “win” on theaverage in the long run if one played the same bet many times over. This long termaverage payoff is called the “expectation value”. It is formally defined as the sum of all possible outcomes (gains or losses), with each outcome multiplied by its particular
probability of occurrence, or:
where: EV j = the expectation value associated with alternative j.Oi,j = the payoff or outcome resulting from the choice of alternative j when state of theworld i occurs pi = the probability of state of the world i occurring.
The decision rule is to select the alternative with the highest expectation value. The
argument for the expected value decision rule is that in the long run, decisions madeaccording to this rule will, in the aggregate, be optimal; that is, good and bad randomerrors will cancel out over time. In gambling, this decision rule has been called the“rich man’s strategy” because it may be necessary to endure a long series of lossesbefore achieving the expected large gain. For those who do not have the means tocover such a series of losses, it could be a fatal strategy. Also, there is other evidencethat people do not always follow the expected-value rule.
Daniel Bernoulli (1738) suggested replacing the criterion of expected value with thecriterion of expected utility. Expected utility theory suggests that each level of anoutcome is associated with some degree of pleasure or net benefit, called utility. The
expected utility of a certain choice is the weighted sum of the utilities of its outcomes,each multiplied by its probability. While an expected value approach would treat$1,000,000 as being worth twice as much as $500,000, a gain of $1,000,000 does not always create twice as much expected utility as a gain of $500,000. Most individualsdoes not obtain as much utility from the second $500,000 as they did from the first$500,000 (Bazerman 1998). In expected utility theory, each choice that we make isviewed within the context of the overall utility that we are currently experiencing andof what that choice would mean to our overall utility in the future.
Kahneman and Tversky (1979) developed a new theory called prospect theory. Thistheory states that we tend to overweight the probability of low-probability events andunderweight the probability of moderate and high-probability events (Bazerman1998). It also suggests that decision-makers tend to avoid risks concerning gains and
=
⋅=n
i
i ji j pO EV ...2,1
,

8/13/2019 Multi Criteria Sun Calculation House
http://slidepdf.com/reader/full/multi-criteria-sun-calculation-house 125/246
119
seek risks concerning losses. Kahneman and Tversky presented data that suggest that“perceived certainty” has a special value to most people. This means for example thatindividuals may buy insurance not only to protect against risk, but also to eliminatethe worry caused by any amount of uncertainty (Tversky and Kahneman 1981).Slovic, Lichtenstein, and Fischhoff (1982) argue that “any protective action that
reduces the probability of harm from, say, 0.01 to zero will be valued more highlythan an action that reduces the probability of the same harm from 0.02 to 0.01”,(Slovic, Fischhoff et al. 1982).
When nature’s probabilities are not known, or if the states of the world are the resultsof actions by other intelligent players who try to anticipate our game moves and selecttheir strategies as to yield outcomes in their best interest, we are faced with decisionmaking under uncertainty. Decision theory has developed some recipes for dealingwith such situations:
• The MaxMin or MinMax rule, recommending that one maximize one’s minimum
gains or minimize one’s maximum losses, respectively. This is a pessimisticdecision rule, always assuming that the worst situation will happen. Accordingly,the recommendation is to select that course of action for which the worst possibleoutcome is least undesirable – that is, to “maximize the minimum gains” if theoutcomes are defined as gains, and to “minimize the maximum losses” if theoutcomes are defined as losses.
• Hurwicz Alpha: Partial Optimism/Pessimism. Most people don’t considerthemselves as complete optimists or pure pessimists, but rather somewhere inbetween. This means that neither the completely pessimist MinMax/MaxMindecision rule nor its theoretical opposite MaxMax (maximize our maximum gains,not a highly recommended rule) quite represents their true attitudes. Hurwiczproposed a “partial pessimism/optimism coefficient” called “Hurwicz alpha” thatincorporates this. The max and min payoffs for each of a player’s strategies areplotted on the opposite ends of a graph representing 100% optimism and zerooptimism, respectively. Lines are drawn between these extreme payoff points. Thedecision-maker can now select a point that appropriately reflects his degree of optimism and then read off which alternative is “best”, given that attitude.
• The Equal-Likelihood Criterion recommend that if probabilities are not known,one should decide on the basis of the expectation value calculated for the
assumption that the states of the world are equally likely.
• Minimizing Regret or Opportunity Cost. When we have made a move that doesnot result in the most favorable outcome, we say that we experience regret – weare sorry we did not pick another move that would have produced a betteroutcome. A measure of the extent of this regret is the difference between theoutcome we actually achieved and the best outcome we could have obtained,given the state of the world or the opponent’s move that actually occurred. Thismeasure is also called the “opportunity cost”. The corresponding decision rule foruncertainty decisions is to “minimize one’s maximum regret”, that is, to select thatalternative j whose largest regret over the set of i states of the world is smallest.

8/13/2019 Multi Criteria Sun Calculation House
http://slidepdf.com/reader/full/multi-criteria-sun-calculation-house 126/246
120
French shows that none of these decision rules satisfy all the axioms for gooddecision-making (French 1988), for example he shows that they may lead to different“best” choices. Thus, he rejects the concept of strict uncertainty and suggests that adecision analysis should be based on the concepts of decisions with risk, and thensubject the results to a careful sensitivity analysis.
Sensitivity analysis is performed by changing the values used for one or more of thefactors in the analysis and redoing the calculations or estimations. One aim is toidentify the factors on which the results are particularly dependent. Another is todiscover how great a change is required to affect the rankings of the alternatives.Usually, the uncertain assumptions are changed twice; once to see how increasing orstrengthening them will affect the results; and once to see what lessening them willdo. It is common to change one factor at a time. However, this does not necessarilymake a fully satisfactory sensitivity analysis. To achieve this, all combinations of theuncertain factors; two, three, four, and so on, must be examined. If there are a largenumber of uncertain assumptions, this may become excessively time-consuming and
expensive. Some form of Monte Carlo sampling of the parameters may then beapplied to solve this (Emerson 1969).
Fuzzyness
The value of a potential design solution may be described by attributes that are bothqualitative and quantitative. The evaluation of the quantitative attributes may perhapsbe based on calculations involving probabilities. However, the qualitative attributescannot be modeled by this concept. The main problem with representing thequalitative information, is not a lack of information, but the nature of the information.Linguistic characterizations such as “beautiful”, “good”, and “attractive” clearly have
no quantitative base variable. If an event cannot be described unambiguously and ischaracterized by subjectivity, incompleteness and imprecision, it is called fuzzy.Statements such as “the quality of the environment is good”, and “the building looksnice” are said to be fuzzy. Consequently, the use of fuzzy mathematics has beenproposed to model this.
Fuzzy mathematics, stemming from the founding work of Zadeh (Zadeh 1965), hasfound applications in many disciplines, and has also been incorporated in MCDMapproaches. Fuzzy set theory tries to encode a concept of set membership thatacknowledges ambiguity. The major contribution of the fuzzy analysis is toemphasize that judgements are not precise and to seek to incorporate this in the
analysis in an explicit way. A short introduction to the theory is given below, basedon (French 1988). Full surveys may be found in (Dubois and Prade 1980), (Kaufmann1975), and (Negoita and Ralescu 1975).
Consider a classical set, A. Associated with it is a set membership function, µA(x),defined by:
µA(x) =
Thus µA(x) may take one of precisely two values, 1 or 0. If we allow ambiguity, thatis a degree of membership, then we allow that µA(x) may take any value between 0
1 if x ∈ A
0 if x ∉ A

8/13/2019 Multi Criteria Sun Calculation House
http://slidepdf.com/reader/full/multi-criteria-sun-calculation-house 127/246
121
and 1, the greater the value, the greater the degree of membership in A and vice versa.For instance, consider the set of tall men. Under classical set theory we should have todefine a precise height, say 6 ft, above which a man would be tall and below whichnot tall. Thus the set membership function would have the form shown in Figure 6-11(a). However, if we admit that tallness is a much vaguer concept, then we might feel
that the set membership function shown in Figure 6-11 (b) would be moreappropriate. Fuzzy set theory formalizes this notion. A fuzzy set is a real-valuedfunction that takes values in the unit interval. This function is called the setmembership function.
Figure 6-11. Set membership functions for the set of tall men, from (French 1988).
Conclusions
The theories of decision making under risk and uncertainty assume that decision-makers will behave rationally, with the definition of rationality being something like“trying to maximize one’s utility” and that such utility can be adequately measured inthe payoffs. It further assumes that the payoffs can be predicted with reasonableaccuracy in a quantifiable manner. In building design, these conditions are hardlypresent. Take, for example, the most tangible of the values: cost. It is difficult enough just to establish a reliable estimate of the initial cost, let alone its long-termperformance. Given the very limited time and resources of the early design stage,advanced risk assessment procedures do not appear to be realistic. Also, the decision-makers in building design will most likely find the concept of gambles strange andartificial. Moreover, there are intangible values that cannot be modeled using these
concepts.
Von Winterfeldt and Edwards (1986) argue that the methods incorporating risk do notenhance the quality of decisions when compared to riskless assessments:
In many practical applications, utility and value functions elicited with risky versusriskless methods are hardly distinguishable because of judgmental errors and because of stimulus and response mode effects.
…there is little experimental evidence for drastic differences between risky and riskless utility functions and there are good theoretical arguments that they are
identical…
2 4
1
6 8
0
0 2 4
1
6 8
0
0
(a) classical set (b) fuzzy set

8/13/2019 Multi Criteria Sun Calculation House
http://slidepdf.com/reader/full/multi-criteria-sun-calculation-house 128/246
122
We would argue then that an analyst should attempt to structure attributes so that they are additive in a riskless sense –and we have not found that to be and exceedingly difficult task.
Some researchers argue that risky procedures are useful because they make the
decision-maker think about the decision in the context of the prevailing uncertainties,and that they therefore can help clarify preferences and values (Keeney 1980). This,however, may be adequately achieved through sensitivity analysis.
The fuzzy set theory makes the assumption that the fuzziness in our perception is wellmodeled by the abstract concept of a fuzzy set. However, the fuzzy analysis is aquantitative theory; numerical values are as much a part of it as they are of any otherquantitative analysis. Thus, the qualitative values still need to be quantified, andconsequently the fuzzy set theory does not offer a way around this problem. Kouloriand Belton recently performed a series of experiments with management sciencegraduate students using a fuzzy multicriteria model (Koulori and Belton 1998). They
conclude, “there is no indication that the human perception of ambiguity isadequately captured by the notion of fuzzy sets”.
Thus, the fuzzy set theory does not offer a way around the difficult problem of quantifying qualities. In addition, fuzzy set theory is hard to understand for peoplethat are not highly skilled in mathematics. Even professionals in the field of decisionanalysis seem to have a hard time understanding how to use the fuzzy set theory intheir field. For example, Simon French comments (French 1988):
How the numbers enters the analysis, what the operations involved mean, how I am tointerpret the result: all remain a mystery to me.
Also, Koulori and Belton concludes (Koulori and Belton 1998):
Considering the meaning of membership functions as expressions of preference judgments: we, as our subjects did, have difficulty to comprehend what fuzzy scoresmean and what they describe.
For some judgements, relatively simple fuzzy membership may be constructed quiteeasily. For example, a statement like: The loss associated with the event x is difficult to predict, but it will surely be less than r 1 , much likely between r 2 and r 3 , and not
greater than r 4. With the development of efficient algorithms and supporting softwareit is possible that fuzzy set theory may be of help in the modeling of imprecise judgements in building design. To my knowledge, such tools are not yet available foruse in practical, multi-criteria decision making. For use in the early stages of buildingdesign, such tools would have to be simple, quick and easy to use.
What seems to be the most appropriate approach for handling risk and uncertainties inthe early design stage, is sensitivity analysis. If the uncertain assumptions are not toomany, a sensitivity analysis may quite easily be carried out. Through a sensitivityanalysis, one will hopefully find a good and robust alternative, that is, one that willperform well even though the future turns out to be different from what is considered
most likely. The sensitivity study may also alert the decision-makers that the resultrelies crucially on a few sensitive parameters, which in itself is a useful outcome.

8/13/2019 Multi Criteria Sun Calculation House
http://slidepdf.com/reader/full/multi-criteria-sun-calculation-house 129/246
123
6.5 Preliminary Recommendations for Multi-CriteriaEvaluation of Solar Design Alternatives
To draw conclusions about how a multi-criteria evaluation of solar design alternativesshould be carried out, it is useful to review the findings of chapter 2. The mostrelevant prerequisites for the evaluation part are:
- it should create discussion about values and judgements, to reveal hidden valuesand biases and to create a deeper understanding of the problem at hand
- it should handle values and judgements and conflicting objectives- it should be quick and simple to use- it should handle uncertainties and fuzziness
When evaluating the MCDM approaches, it is important to bear in mind that theseapproaches are very foreign to the participants in the building design process.Moreover, the time and resources that are available in building design is much morelimited than what is common in the settings where MCDM approaches havetraditionally been used. Therefore it is recommended to start out with a very simpleMCDM-base approach. Then, when this approach has been tried out in the buildingindustry, and the participants have been familiarized with the ideas, perhaps somemore advanced methods may be introduced. It is not an ultimate goal to find a methodthat secures the “optimal” answer at all stakes. As discussed before, there is no suchthing as an optimum answer to the design problem. However, it is a goal to find thebest possible choice within the limited time, given a set of preferences and
performances. Hence, the most important prerequisite of the approach should be to promote discussion about alternative solutions, so that the design team members canlearn more about their mission in an effective way, and thus produce a better product.
Based on these criteria and the preceding chapters, the following preliminaryrecommendations are given for multi-criteria evaluation of solar design alternatives:
1. A side-by-side comparison matrix is constructed to show the performance of eachalternative solution with respect to each of the design criteria. The performancecriteria are expressed in their “natural units”, e.g. energy consumption in kWh/m²,costs in $/m², etc.
2. If the number of alternative design solutions are numerous, a screening process isrecommended to eliminate alternatives that are clearly inferior. This may be doneusing the concept of dominance and the conjunctive/disjunctive methods.
3. A ranking method may be used for further screening, and might select the mostpreferred alternative, especially if one of the following conditions are present: 1)There are only qualitative values to be considered. 2) The qualitative values aremuch more important or numerous than the quantitative ones.
4. If there are both qualitative and quantitative attributes to be included, convertthem into a common numerical scale, weight the criteria, and aggregate the

8/13/2019 Multi Criteria Sun Calculation House
http://slidepdf.com/reader/full/multi-criteria-sun-calculation-house 130/246
124
weights and criteria into an overall measure of goodness for each alternative usinga simple additive weighting (SAW) method. The SAW method is simple andintuitive, and it is the most widely used of the MCDM approaches. Although it isnot used according to strict theoretical axioms, experience shows that the SAWmethod agrees well with more sophisticated approaches. Consistency may be
checked by posing a few questions regarding trade-offs between criteria. Thisrequires that decision-makers are able to communicate strength of preference judgements. Details about the measuring and weighing procedures are given in thenext two sections (6.6 and 6.7).
5. Perform a sensitivity analysis to study the robustness of the conclusion when themost uncertain parameters are varied within plausible bounds.
Thus, for now, it is assumed that the simple additive weighting (SAW) method is themost suitable aggregation method for multi-criteria decision-making in buildingdesign. This method, however, requires that the decision-makers are able to make
strength of preference judgements. It is also a prerequisite that they can measureperformances on different attributes in such a way that the scores and weights can beaggregated in a consistent manner. In the next section, theories and techniques formeasuring attributes are discussed.
6.6 Measuring attributes
Measurement theory
Evaluating design options inevitably involve value judgements or measurements.What sort of value judgments can we expect the decision-makers in building design tobe able and willing to perform? Preferably, judgements should be performed withease and accuracy (i.e. be valid and reliable). Almost all decision theorists agree thatpeople presented with two alternatives, A and B, that are to be evaluated against onecriterion, can meaningfully say whether they prefer A to B, or B to A, or whether theyare indifferent . Some theorists go further and claim that people can also communicateabout strength of preference. Von Winterfeldt and Edwards (1986) take this view andexplain it with the following example (the presentation is somewhat simplified fromthe original):
Imagine you have the opportunity to win one of the following 3 prizes:1. Receiving a sum of $1002. Receiving a sum of $5003. Receiving a sum of $10,000
Consider how you would feel about receiving the amounts. Presumably, all would please you, and you would be more pleased by option 3 than by 2, and more by 2 thanby 1. Can you make a meaningful comparison of the intensities of those feelings? Is, for example, the following statement a representative description of your feelings?“Prize 1 would be pleasant to receive. Prize 2 would be somewhat more so. But prize3 would really delight me; the change in my feelings from 2 to 3 would be much
greater than the change in my feelings from 1 to 2.” If you find this statement

8/13/2019 Multi Criteria Sun Calculation House
http://slidepdf.com/reader/full/multi-criteria-sun-calculation-house 131/246
125
meaningful, you agree with us that you can make judgments of strength of preference – in the example so far, ordinal ones.
Von Winterfeldt and Edwards go on to discuss how sophisticated such strength of preference judgements can be. The next step beyond ordinal strength of preference
judgements, is ratio ones. Von Winterfeldt and Edwards give the following test:
Is the difference between 3 and 2 (in attractiveness, not money) more than twice asmuch as the difference between 2 and 1?
They claim that if you can answer such questions (it makes no difference whether theanswer is yes or no), you can make difference or ratio judgements of attractiveness.They further claim that they have no trouble answering the question.
The last step in the measurement ability that von Winterfeldt and Edwards describe isstimulus ratings. The test they present to this goes as follows:
Let us define the attractiveness of prize 1 as 0 and the attractiveness of prize 3 as 100.On that scale, how attractive is bonus 2? You may find that question hard to answer. If so, start by asking if 90 would be and appropriate answer. For us, the answer tothat question is no. Would 2 be an appropriate answer? For this question, that judgement is difficult, because 2 comes close to being an appropriate rating, but it isa bit too low. Again, by trying out various numbers we believe we can come up withone that expresses our feelings well enough.
Thus, 4 main levels of value judgements may be defined:Level 1: Preference and indifference judgementsLevel 2: Ordinal strength of preference judgementsLevel 3: Ratio strength of preference judgementsLevel 4: Stimulus ratings
The higher the level, the more difficult it is to communicate the judgements. On theother hand, the higher the level, the more specific are the judgements, andconsequently the simpler decision models may be used.
Von Winterfeldt and Edwards (1986) present several arguments to support their viewthat strength of preference judgements are valid. Of these, I find the following
arguments especially convincing:
• Strength of preference judgements greatly simplifies the decision model.
• Empirical evidence shows that strength of preference judgements are not inferiorin either reliability or validity to judgements based on preference itself; if anything, it is the other way around.
Taxonomy of Value and Utility Measurement Techniques
Von Winterfeldt and Edwards (1986) categorize the available value and utilitymeasurement techniques by the stimuli used and the response judgements required.Stimuli can be either riskless or gambles. Riskless outcomes are used in value
measurement, while gambles are used in utility measurement techniques. Judgmentscan either be indifference judgments or direct numerical judgments. According to this,
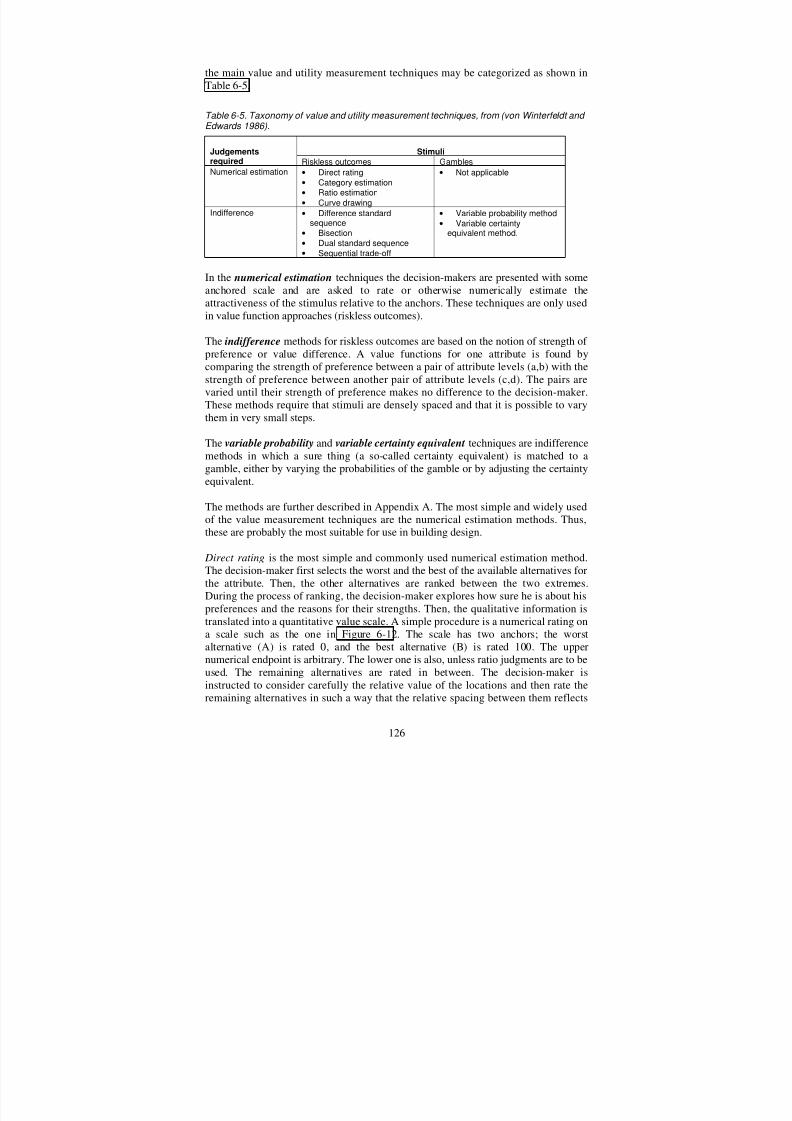
8/13/2019 Multi Criteria Sun Calculation House
http://slidepdf.com/reader/full/multi-criteria-sun-calculation-house 132/246
126
the main value and utility measurement techniques may be categorized as shown inTable 6-5.
Table 6-5. Taxonomy of value and utility measurement techniques, from (von Winterfeldt and Edwards 1986).
StimuliJudgementsrequired Riskless outcomes GamblesNumerical estimation • Direct rating
• Category estimation• Ratio estimation• Curve drawing
• Not applicable
Indifference • Difference standardsequence
• Bisection• Dual standard sequence• Sequential trade-off
• Variable probability method• Variable certainty
equivalent method.
In the numerical estimation techniques the decision-makers are presented with someanchored scale and are asked to rate or otherwise numerically estimate theattractiveness of the stimulus relative to the anchors. These techniques are only usedin value function approaches (riskless outcomes).
The indifference methods for riskless outcomes are based on the notion of strength of preference or value difference. A value functions for one attribute is found bycomparing the strength of preference between a pair of attribute levels (a,b) with thestrength of preference between another pair of attribute levels (c,d). The pairs arevaried until their strength of preference makes no difference to the decision-maker.These methods require that stimuli are densely spaced and that it is possible to varythem in very small steps.
The variable probability and variable certainty equivalent techniques are indifferencemethods in which a sure thing (a so-called certainty equivalent) is matched to agamble, either by varying the probabilities of the gamble or by adjusting the certaintyequivalent.
The methods are further described in Appendix A. The most simple and widely usedof the value measurement techniques are the numerical estimation methods. Thus,these are probably the most suitable for use in building design.
Direct rating is the most simple and commonly used numerical estimation method.The decision-maker first selects the worst and the best of the available alternatives forthe attribute. Then, the other alternatives are ranked between the two extremes.During the process of ranking, the decision-maker explores how sure he is about hispreferences and the reasons for their strengths. Then, the qualitative information istranslated into a quantitative value scale. A simple procedure is a numerical rating ona scale such as the one in Figure 6-12. The scale has two anchors; the worstalternative (A) is rated 0, and the best alternative (B) is rated 100. The uppernumerical endpoint is arbitrary. The lower one is also, unless ratio judgments are to beused. The remaining alternatives are rated in between. The decision-maker is
instructed to consider carefully the relative value of the locations and then rate theremaining alternatives in such a way that the relative spacing between them reflects

8/13/2019 Multi Criteria Sun Calculation House
http://slidepdf.com/reader/full/multi-criteria-sun-calculation-house 133/246
127
the strengths of his preferences for one alternative over another. We assume that hetentatively assigns ratings to the alternatives C, D and E as shown in Figure 6-12(b).
Figure 6-12. Construction of a simple value scale. (a) creating end points; (b) rating alternatives in between; (c) rerating after consistency checks and placing a midpoint. From
(von Winterfeldt and Edwards 1986).
Consistency checks can now be made. First, the relative ratings can be cross-checkedagainst one another. For example, the decision-maker may ask himself whether thevalue steps D-E and E-B should really be equal, as indicated in the ratings. Next, thedecision-maker should explore more complex questions such as: Is the differencebetween alternative C and D truly smaller than between D and E? Finally, thedecision-maker can rate a few alternatives not in the original list. Such ratings couldrefine and enrich the original scale.
The scale construction process stops when the decision-maker feels comfortable withthe assessments. The assessments need not be refined to the last digit. Instead it isimportant that the relative spacings make sense and that the scale has meaning for thedecision-maker. If he has trouble placing alternatives on the scale because themeaning shifts from one inter-alternative comparison to another, it may be useful todecompose the scale further. Finally, the meaning of the scale and the justifications of the values of alternatives on the scale should be recorded for further reference.
The category estimation method is a variation of the direct rating method. In categoryestimation, the possible responses of the decision–maker are reduced to a finitenumber of categories. For example, when judging job locations, the decision-maker
may be given the following category scale:
very bad __ __ __ __ __ __ __ very goodlocation –3 –2 –1 0 +1 +2 +3 location
The decision-maker is instructed to sort possible job locations so that the adjacentcategories are considered equally spaced in value. The categorization of the scalemakes the task somewhat simpler, but fine distinctions may get lost, unless thenumber of categories is increased.
In ratio estimation, one stimulus (e.g. a job) is presented as a standard, and the
respondent is asked to compare all other stimuli (jobs) with that standard. For each,the respondent is then asked to state how much more or less valuable that job offer is
A B
0 100
A B
0 100
C D E
10 30 65
A B
0 100
C D E
15 40 6050
(a)
(b)
(c)

8/13/2019 Multi Criteria Sun Calculation House
http://slidepdf.com/reader/full/multi-criteria-sun-calculation-house 134/246
128
than the standard, in a ratio sense. Ratio measurement makes sense only if thedecision-maker compares increments or losses with a standard (which could, e.g., bethe present job). A ratio scale is essentially a difference scale, thus there is alogarithmic relationship between the ratio and the difference information (Lootsma1999). Sound and light intensities are usually recorded as differences on a logarithmic
scale. The dB scale, for example, is logarithmic. With a step of +10dB, the soundintensity is felt to be doubled.
The last variant of numerical estimation is curve drawing, which can be used whenthe attribute has a numerical scale and the decision-maker is knowledgeable aboutvalue functions. The value curves may be drawn directly or general function formsmay be selected.
Creating Scales
A scale is in essence a means to assign values to each alternative reflecting thecontribution to the overall evaluation from their performance on each criterion.Sometimes, “natural scales” exist that may be used to represent the decision-maker’svalues. For example, the energy consumption of a building takes a linear, numericalscale that might match the values of the decision-maker. Or, this natural scale may beused as a basis for constructing a value scale, see Figure 6-13. Alternatively, if nonatural scale exists, a qualitative scale may be constructed that defines the attribute,its end points, and perhaps some intermediate marker points by means of verbaldescriptions. To compare this qualitative scale to a quantitative scale, the qualitativedescriptions are associated with numbers that relate the decision-maker’s preferencesto the levels of the qualitative scale. This “direct” estimation approach has beencriticized because of its lack of theoretical foundation. However, recent studies
indicate that a theoretical justification for the quantification of vague meanings of inexact linguistic terms by means of direct estimation can be established (Munda1995).
Assessment scales may be linear or curved. A linear scale may be used if thepreference of a given quality improvement is the same irrespective of whether thequality level is high or low. A curved scale may be used to demonstrate for instancethat an improvement on a lower quality level is more valuable than an improvementon a higher level. Figure 6-13 shows examples of linear and curved assessment scales.
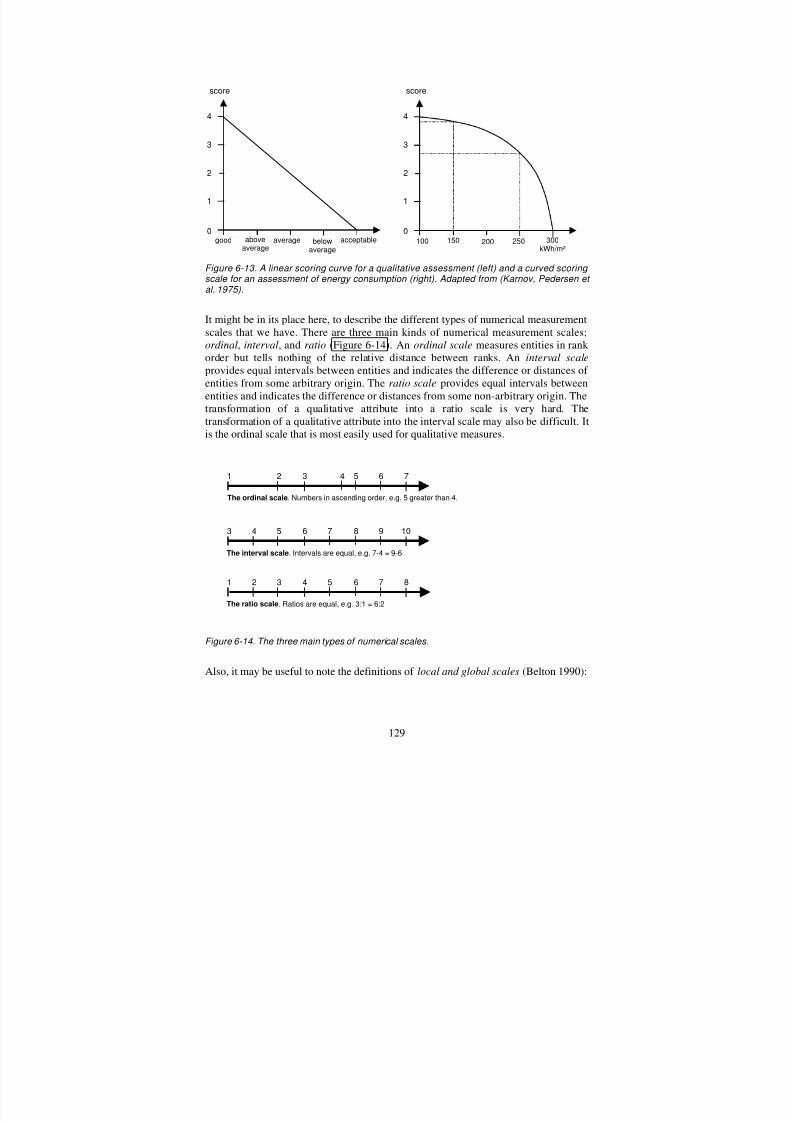
8/13/2019 Multi Criteria Sun Calculation House
http://slidepdf.com/reader/full/multi-criteria-sun-calculation-house 135/246
129
Figure 6-13. A linear scoring curve for a qualitative assessment (left) and a curved scoring scale for an assessment of energy consumption (right). Adapted from (Karnov, Pedersen et al. 1975).
It might be in its place here, to describe the different types of numerical measurementscales that we have. There are three main kinds of numerical measurement scales;ordinal, interval, and ratio (Figure 6-14). An ordinal scale measures entities in rank order but tells nothing of the relative distance between ranks. An interval scaleprovides equal intervals between entities and indicates the difference or distances of entities from some arbitrary origin. The ratio scale provides equal intervals betweenentities and indicates the difference or distances from some non-arbitrary origin. The
transformation of a qualitative attribute into a ratio scale is very hard. Thetransformation of a qualitative attribute into the interval scale may also be difficult. Itis the ordinal scale that is most easily used for qualitative measures.
Figure 6-14. The three main types of numerical scales.
Also, it may be useful to note the definitions of local and global scales (Belton 1990):
The ordinal scale. Numbers in ascending order, e.g. 5 greater than 4.
1 3 4 5 6 7 82
1 2 3 4 5 6 7
3 5 6 7 8 9 104
The interval scale. Intervals are equal, e.g. 7-4 = 9-6
The ratio scale. Ratios are equal, e.g. 3:1 = 6:2
score
1
3
4
2
0good above
averageaverage acceptablebelow
average
score
1
3
4
2
0100 150 200 250 300
kWh/m²

8/13/2019 Multi Criteria Sun Calculation House
http://slidepdf.com/reader/full/multi-criteria-sun-calculation-house 136/246
130
A local scale is one that is defined by the set of alternatives under consideration. Forexample, the alternative that does best on a particular criterion is assigned a score of 100 and the one that does least well is assigned a score of 0. All other alternatives aregiven intermediate scores that reflect their performance relative to these two endpoints.
A global scale is defined by reference to the wider set of possibilities. For example,the end points may be defined by the best possible and worst conceivable alternatives.
A local scale has the advantage that it can be defined without the need to establishexternal reference points, which can be a time consuming and difficult process. Adisadvantage of a local scale is that if new options need to be considered at a laterstage, then some of the scales may have to be redefined, which has consequences forthe weighting of criteria.
A special type of scale that has been frequently used in evaluation of qualitative
values is the semantic differential. This is a list of paired opposite words with a scalebetween them used to rate the qualities of an object or a place. Usually, the scale is afive point or more odd-numbered scale, unless it is not desirable to have a neutralpoint in the middle of the scale. Figure 6-15 gives examples of such scales.
Figure 6-15. Examples of Semantic Differential Scales. Adapted from (Duerk 1993).
Duerk (Duerk 1993) argues that most novices using this instrument would have agreat deal of difficulty developing an interpretation useful for design from a surveyusing the semantic differential. This is because words have so many interpretations –especially when one’s aesthetic judgment comes into play. Also, when there is a mixof qualitative and quantitative assessments, the problem of comparison amongattributes still remains.
Yoon and Hwang (1995) suggest the following procedures for comparing qualitativeand quantitative attributes: If the number of qualitative attributes is much larger thanthe number of quantitative attributes, we convert quantitative into qualitativeattributes and apply the Median Ranking method . Otherwise the assignment of numerical values to qualitative data (i.e. by quantification) is the preferred approach.The Median Ranking method is described in section 6.4.
One of the common ways for conversion of qualitative attributes into an interval scale
is to utilize the Bipolar scale or the Linkert-type scale (McIver and Carmines 1981;Spector 1992). A set of statements, composed of approximately an equal number of
static ____ ____ ____ ____ ____ dynamic
warm ____ ____ ____ ____ ____ cool
hard ____ ____ ____ ____ ____ soft
beautiful ____ ____ ____ ____ ____ ugly
cluttered ____ ____ ____ ____ ____ clean

8/13/2019 Multi Criteria Sun Calculation House
http://slidepdf.com/reader/full/multi-criteria-sun-calculation-house 137/246
131
favorable and unfavorable statements covering the qualitative attributes, isconstructed. For example, a 5-point scale may be chosen, as shown in the figurebelow. The scale may be calibrated by starting with end points, giving 5 points to themaximum value that is practically or physically realizable, and 1 point to theminimum attribute value that is practically realizable. The midpoint would also be a
basis for calibration, since it would be the breakpoint between values that arefavorable (or better than average) and values that are unfavorable (or worse thanaverage). However, the points in between may be hard to determine. The decision-maker is asked to pick a statement that best describes the given attribute property.
The Dutch operational analyst Freerk A. Lootsma has presented an interesting modelfor measuring quantitative and qualitative data on a 7-point scale (Lootsma 1999).The justification of the procedure is based on arguments from behavioral sciences andpsycho-physics. Lootsma argues that human beings follow a uniform pattern in manyunrelated areas when they subdivide a particular scale into subjectively equalsubintervals. Examples are sound (the dB scale), time, and light. The number of subintervals is small because humans have a limited vocabulary. For example, thefollowing verbal terms may be used to categorize prices:
cheapcheap/somewhat more expensivesomewhat more expensivesomewhat more/more expensivemore expensivemore/much more expensivemuch more expensivemuch more/vastly more expensive
vastly more expensive
The subintervals are demarcated by a geometric sequence of six to nine grid pointscorresponding to major and threshold echelons, and the progression factor is roughly2 (see below). This is based on Weber’s law of psycho-physics stating that a changein sensation is noticed when the stimulus is increased by a constant percentage of thestimulus itself. This means, for example, that people while holding in their handdifferent weights, can distinguish between a weight of 20g and a weight of 21g, butnot if the second weight is only 20.5g. On the other hand, they can not distinguishbetween 40g and 41g, but they can between the former and 42g, etc.
Lootsma exemplifies this by a car selection problem. He assumes that the acceptableprices are anchored between a minimum price Pmin to be paid anyway for the type or
1 very unfavorable
2 unfavorable
3 neutral
4 favorable
5 very favorable
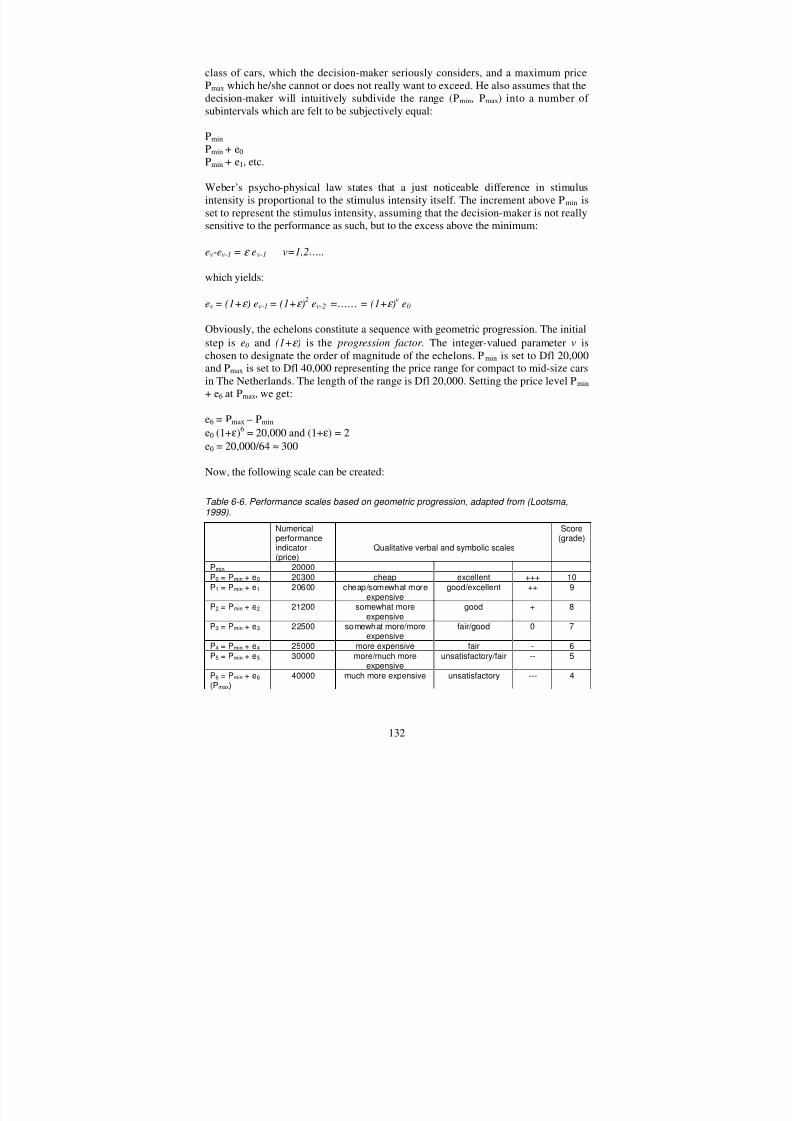
8/13/2019 Multi Criteria Sun Calculation House
http://slidepdf.com/reader/full/multi-criteria-sun-calculation-house 138/246
132
class of cars, which the decision-maker seriously considers, and a maximum pricePmax which he/she cannot or does not really want to exceed. He also assumes that thedecision-maker will intuitively subdivide the range (Pmin, Pmax) into a number of subintervals which are felt to be subjectively equal:
Pmin
Pmin + e0
Pmin + e1, etc.
Weber’s psycho-physical law states that a just noticeable difference in stimulusintensity is proportional to the stimulus intensity itself. The increment above Pmin isset to represent the stimulus intensity, assuming that the decision-maker is not reallysensitive to the performance as such, but to the excess above the minimum:
ev-ev-1 = ε ev-1 v=1,2…..
which yields:
ev = (1+ε ) ev-1 = (1+ε )2 ev-2 =…… = (1+ε )v e0
Obviously, the echelons constitute a sequence with geometric progression. The initial
step is e0 and (1+ε ) is the progression factor. The integer-valued parameter v ischosen to designate the order of magnitude of the echelons. Pmin is set to Dfl 20,000and Pmax is set to Dfl 40,000 representing the price range for compact to mid-size carsin The Netherlands. The length of the range is Dfl 20,000. Setting the price level Pmin
+ e6 at Pmax, we get:
e6 = Pmax – Pmin
e0 (1+ε)6 = 20,000 and (1+ε) = 2
e0 = 20,000/64 ≈ 300
Now, the following scale can be created:
Table 6-6. Performance scales based on geometric progression, adapted from (Lootsma,1999).
Numericalperformance
indicator(price)
Qualitative verbal and symbolic scales
Score(grade)
Pmin 20000P0 = Pmin + e0 20300 cheap excellent +++ 10P1 = Pmin + e1 20600 cheap/somewhat more
expensivegood/excellent ++ 9
P2 = Pmin + e2 21200 somewhat moreexpensive
good + 8
P3 = Pmin + e3 22500 somewhat more/moreexpensive
fair/good 0 7
P4 = Pmin + e4 25000 more expensive fair - 6P5 = Pmin + e5 30000 more/much more
expensiveunsatisfactory/fair -- 5
P6 = Pmin + e6
(Pmax)
40000 much more expensive unsatisfactory --- 4

8/13/2019 Multi Criteria Sun Calculation House
http://slidepdf.com/reader/full/multi-criteria-sun-calculation-house 139/246
133
The table also shows that qualitative attributes can be measured directly in this scale,exemplified in the 4th column, using verbal terms like excellent, good, fair, etc, oralternatively using symbols as indicated in the 5th column. A numerical scale from 4-10 is used instead of 1-7 because the grades 1, 2, and 3 are normally used for a verypoor performance that cannot be compensated elsewhere, thus they can be ignored.
The crucial assumption here is that the decision-maker considers the prices from theso-called desired target Pmin at the lower end of the range of acceptable prices. Fromthis viewpoint the decision-maker looks at less favorable alternatives.
Some of the scales proposed within the Green Building Challenge project (Larssonand Cole 1998) resemble the geometric scales suggested by Lootsma. As shown inFigure 6-16, the scales have a curved form indicating that the marginal worth of a unitdecrease of energy consumption increases as the energy consumption decreases.
0
20
40
60
80
100
120
140
160
-4 -2 0 2 4 6
Figure 6-16. Example of performance scale (for operating energy consumption) from the GBC’98 project, based on (Cole and Larsson 1998).
The American architects Kirk and Spreckelmeyer (Kirk and Spreckelmeyer 1993)describe a method that has been used to construct scales for building designobjectives. The method makes use of a design objective scaling worksheet , such as theone shown in Figure 6-17. Given a particular design objective, design team membersare asked to assess the range of extremes that might be acceptable and desirable in agiven problem. Questions are posed to the decision-makers to stimulate discussionabout the nature of the objective being considered. A question such as “What is the
least you would expect in a potential design solution for how people circulate throughthis facility?” might prompt the design team to define the issue of “circulation”. Thequestion is repeated for the most desirable value. This allows the decision group toestablish the upper and lower bounds of the measurement scale (that is the 5 and 1values of Figure 6-17). This process is continued for the intermediate points on thescale. Then the intervals between points are tested for accuracy. If the perceivedinterval between the first and third, and the third and fifth scalar pairs are judged to beequal, then this particular scale can be considered valid. After all comparisons amongthe various scalar intervals are completed, the circulation design objective scale canbe set aside and another objective definition tested. This procedure resembles thedirect rating technique described above.

8/13/2019 Multi Criteria Sun Calculation House
http://slidepdf.com/reader/full/multi-criteria-sun-calculation-house 140/246
134
Project: Corporate Headquarters Date: 3/23/81Objective Name: Circulation Objective No: 1
Objective Descriptions:1 Extended amount of employee walking for communication.
Circulation system that satisfies simple, clear, and direct movement with safety.
Mixed circulation for people, vehicles, and service Controlled access to building.
2 Tolerable amount of employee walking for communication.Circulation system that satisfies simple, clear, and direct movement with safety.Separate circulation for people, vehicles, and service Controlled access to building.
3 Moderate amount of employee walking for communication.Circulation system that satisfies job function, personal needs and safety.Separate circulation for people, vehicles, and service Controlled access to building.
4 Minor amount of employee walking for communication.Circulation system that improves job function and personal needs.Separate circulation for people, vehicles, and service Restricted access to building and parking with separate visitor entry pt.
5 Minimal amount of employee walking for communication.Circulation system that greatly improves job function and personal needs.Separate circulation for people, vehicles, and service.Restricted access to building and parking with controlled entry points for employees and visitors.
Figure 6-17. Design objective scaling worksheet, (Kirk and Spreckelmeyer 1993).
Comparing scales - Normalization
In order to get an overall measure of the goodness of each alternative, all the attributeshave to be aggregated in a consistent manner. One way to do this is to transform allthe data into a common numerical scale by normalization. Massam (Massam 1988)lists 5 different ways of normalizing raw data:
H i g h v a l u e
L o w
v a l u e

8/13/2019 Multi Criteria Sun Calculation House
http://slidepdf.com/reader/full/multi-criteria-sun-calculation-house 141/246
135
5. Use a transformation function
Massam shows an example that illustrates that the relative positions between thealternatives remains the same whatever procedure (1-4) is used, but the differencesbetween the alternatives depend on the normalization procedure, see Figure 6-18.
Figure 6-18. Example of normalization of raw data using procedures 1 to 4, adopted from (Massam 1988).
The maximum values in procedures 2 and 3 can be set by using hypothetical orpractically acceptable levels, or the maximum value from the raw scores. The fourthprocedure tends to put greater emphasis on larger values and hence extends the scalein comparison to the results using procedure 1. The second procedure always gives a
value of 1.0 for the highest level and procedure 3 scales all the observations betweenzero and unity.
The fifth procedure that Massam describes involves a transformation function thatconverts the raw scores into a scale that range from zero to unity. This scale has beencalled a constant worth scale, a subjective scale, or a utility scale. The variations of this scale do not necessarily use 0 and 1 as end points. The scale may be non-linear,which in some cases may better reflect the values of the decision-maker. It may forexample be that there is a limiting value for a criterion; once this is reached thealternative ceases to be a feasible one, and the utility drops to zero. This can bereflected in the transformation curve. Massam reports that analyst who have usedtransformation functions as part of an MCDM technique recognize that this allowsconsiderable flexibility and has greater intuitive appeal in deriving the utility values
scoresall
scoreraw
Σ.1
score
scoreraw
max.2
scorescore
scorescoreraw
minmax
min.3
−
−
2)(.4
scoreraw
scoreraw
Σ
E B C A D
E B C A D
E B C A D
E B C A D
E B C A D
RAW DATA
PROCEDURE 1
PROCEDURE 2
PROCEDURE 3
PROCEDURE 4
8/13/2019 Multi Criteria Sun Calculation House
http://slidepdf.com/reader/full/multi-criteria-sun-calculation-house 142/246
136
than the other four normalization procedures (Massam 1988). Massam (1988) pointsout two ways to determine the shape of the transformation curve. First, by directspecification and second, as a result of questioning the decision-makers in order todetermine points of indifference on the curves and hence the shape of the function.The first way corresponds to the direct rating technique described above, while the
second relates to the indifference methods also mentioned above.
Norris and Marshall report that procedures 1 and 2 sometimes may lead to differentfinal results (Norris and Marshall 1995). Consequently, they suggest using bothmethods and re-examining any cases where choice of a normalization procedure altersthe final conclusions. It is also important to be aware of the fact that normalization isnot valid for ordinal or interval scales.
Saaty criticizes normalization on the grounds that it may easily be misused (Saaty1994):
Among the various number crunching procedures the most pernicious is to assign judgements to the alternatives under a particular criterion. This is done by selectingnumbers from some arbitrary set, and then normalizing the numbers (multiplyingthem by a constant that is the reciprocal of their sum). Generally, the sets of numbers from which the judgments are assigned are different for each criterion. Still, thenormalized sets now lie in the interval [0,1], no matter what scale they originallycame from, and can be passed off to the uninitiated as comparable.
This is an important point, reminding us that the generation of scales is not anautomatic, straight forward procedure, but a careful task in order to find a usefulrepresentation of the values of the decision-maker. As will be discussed in the nextsection, it is essential that the scales are viewed in connection to the weights.
Discussion
In this section it has been argued that it is likely that people are able to make strengthof preference judgements. This is grounded in empirical evidence and persuasiveillustrations. Different techniques for making such judgements have also beendescribed. The attributes in the evaluation of building design options are verydifferent in nature, and to measure them requires skill and judgement. The crux of theproblem is how to measure the attributes in such a way that they can be aggregated in
a consistent manner.
Natural scales may be appealing because they are well-defined and readily available.However, the decision-makers should consider whether the scales really reflect theirvalues and how the scales compare to each other. Saaty warns against uncritical use of standard scales (Saaty 1994):
One may be inclined to think that scales of measurement are scientific discoveriesthat have an objectivity beyond the dimensions they are designed to measure……. But on looking into the history of development of these instruments, one finds that theywere invented for convenience and have evolved over a long period of time….. We
invent ways to justify their use even when some other property may be the moreimportant.
8/13/2019 Multi Criteria Sun Calculation House
http://slidepdf.com/reader/full/multi-criteria-sun-calculation-house 143/246
137
Keeney argues that the use of any scale requires subjective judgement (Keeney 1992):
Even though the selection of a natural attribute may appear to be completely obvious,it is still the case that the selection involves value judgement… The use of any
attribute, even a natural attribute, requires subjective judgment.
Von Winterfeldt and Edwards (1986) suggest that well-defined scales, preferablylinear in value, are often useful because they allow the analyst to disassociate the task of measuring the location of the alternatives on that scale from the task of valuemeasurement for the scale itself. Such disassociation, they argue, is particularlyhelpful when respondents have a strong commitment to one alternative or find itdifficult to think of locations in one attribute without considering simultaneouslocations in other attributes. Edwards and Newman (1982) state that curved functionsare probably often more precise representations of how people feel than straight ones,but such curvature almost never makes any difference to the decision.
In building design it is not possible to find natural, numerical scales for all attributes.In addition, in order to be aggregated, the measurements need to be transformed into aunit that is common to all of them. All the value measurement techniques described inthis section may be a means to accomplish this. The strict constraints on time andresources in the early design phase suggest the use of the most simple of themeasurement techniques, i.e. the numerical estimation methods. According to VonWinterfeldt and Edwards (1986), these methods have in the past been shown to bereliable, but they may be subject to response mode and stimulus effects. Examples arecentering effects (people like to use the middle of a given scale) and spacing effects(people like to space responses equally over the whole scale, no matter what theanchoring points are).
The indifference methods require that the evaluation objects are densely spaced. Inmany cases, therefore, unrealistic or imaginary alternatives would have to be createdin order to get useful results. According to von Winterfeldt and Edwards (1986) thesemethods may suit sophisticated decision-makers and experts who tend to think interms of trade-offs and incremental changes. Massam (1988) comments: Whiletheoretically appealing, it is likely that for practical purposes it is difficult to obtainmeaningful results to hypothetical trade-off questions. Hence, most likely, thedecision-makers of the building industry are not yet quite ready for these kinds of
methods.
Thus, the numerical estimation techniques seem to be the most suitable, even thoughthey may not be the most theoretically accurate. Von Winterfeldt and Edwards (1986)suggest to start with a direct estimation approach and to use a simplified indifferentmethod for consistency checking. For example, after rating the attractiveness of analternative on a 0 to 100 scale, the decision-maker may check whether he truly feelsthat the strength of preference between an alternative rated at 50 and the 0 anchor isequal to the strength of preference of the 100 anchor over the alternative rated at 50.Nevertheless, this may still be a cumbersome and time-consuming process. It is alsoimportant that the value measurement is viewed in close connection to the weighting.
The weights are essentially re-scaling parameters that convert all scales into acommon unit so they can be aggregated. The scaling technique suggested by Lootsma

8/13/2019 Multi Criteria Sun Calculation House
http://slidepdf.com/reader/full/multi-criteria-sun-calculation-house 144/246
138
(1999) based on evidence that humans follow a uniform way of judging ratios of subjective values as differences of grades, may be a way around this difficulty. Thiswill be further discussed in the next section.
In any case, one cannot expect to get a high degree of accuracy using the most quick
and simple of the approaches. However, one must bear in mind that the mostimportant goal of the evaluation process is not to find the absolute optimum choice,but to gain further insight in order to arrive at the best choice given the limited timeand resources available. Thus, a simple, but less accurate method can be justified if the users are aware of its limitations.
6.7 Weighting
The weighting techniques can be categorized in a similar way as the value
measurement techniques in the previous section, see Table 6-7.
Table 6-7. Taxonomy of techniques for constructing attribute weights, from (von Winterfeldt and Edwards 1986).
Stimuli used
Riskless outcomes GamblesNumerical estimation • Ranking
• Direct rating• Ratio estimation• Swing weights
• Not applicable
Indifference • Cross-attribute indifference
• Cross-attribute strength ofpreference
• Variable probability method
• Variable certainty equivalentmethod.
The simplest way of assessing weight is ranking, that is listing the criteria in order of importance. The most important criterion is assigned a value of 1, and the leastimportant one is assigned a value of n, which is equal to the number of criteria. Theseranks can be transformed into normalized weights by several rules, see (Stillwell,Seaver et al. 1981). The most common ones are the rank reciprocal weighting and therank sum weighting methods. According to the rank reciprocal rule the weight for theith criterion is calculated as follows:
where Ri is the rank of criterion i, and n is the number of criteria.
In the rank sum weighting procedure, weights are estimated from:
=
= n
j
j
ii
R
Rw
1
/ 1
/ 1
=
+−
+−=
n
j
j
ii
Rn
Rnw
1
)1(
)1(
8/13/2019 Multi Criteria Sun Calculation House
http://slidepdf.com/reader/full/multi-criteria-sun-calculation-house 145/246
139
A typical approach to direct rating is distribution of 100 points over the criteria sothat the number of points assigned to each reflects its relative importance.
In the ratio estimation procedure, the decision-maker directly estimates how muchmore important a criterion is than the least important one.
Swing weighting is a procedural hybrid derived from an indifference method in whichcross-attribute strengths of preference are systematically compared. In this procedureone determines the weights by matching the strength of preference in one attribute toa strength of preference in another. Similarly, cross-attribute indifference methods
systematically vary alternatives in two attributes to generate simple equations that canbe solved for the attribute weights.
The idea of creating indifferences to generate equations that have simple weightingsolutions also appears in the variable probability and variable certainty equivalent
methods. In these methods the respondents compare sure things and gambles that
have outcomes varying on at least two attributes.
Belton describes an application of swing weighting in value function methods (Belton1990): An effective way of weighting criteria is to consider a hypothetical option which israted zero on all criteria and imagine that you are allowed to increase just onecriterion to its maximum level. Which one would you choose? This will be the most highly weighted criterion. Imagine now an option having the criterion you have just selected at its maximum level and all other criteria at zero; then select the criterion you would raise to its maximum level next – it will have the second highest weight – and so on until all the criteria have been ranked. It is important to remember that these weights are dependent on the scales being used for scoring as well as theintrinsic importance of the criteria. If an intrinsically important criterion does not differentiate much between the options then it may be ranked quite low. Havingestablished a rank order assign values to the weights by assigning a weight of 100 toone criterion, possibly the highest rank, possibly the lowest ranked, and then consider each criterion in turn relative to that one bearing in mind the interpretation outlined above. It is generally accepted that these weights are measured on a ratio scale. It isusual to normalize them to sum to 1 or 100.
In their book titled “Enhancing Value in Design Decisions” Kirk and Spreckelmeyer
(1993) propose to use a trade-off exercise in order to verify the relative degrees of importance of the objectives (criteria):
The exercise begins with the assumption that decision-makers believe one particular design objective is more important to the success of the project than all other objectives. Assume, for example, that the team has defined and constructed measurement scales for five independent objectives (Figure 6-19) and hasdetermined, for this particular problem, that functional efficiency should take priority. A trade-off diagram similar to the one in Figure 6-20 is constructed for each of the four trade-off comparisons between the functional efficiency objective and the other,less important criteria. A question is posed to the team:

8/13/2019 Multi Criteria Sun Calculation House
http://slidepdf.com/reader/full/multi-criteria-sun-calculation-house 146/246
140
“If circulation and function could be compared one to the other, and if the former were to be increased to its highest scalar value (that is 5), how much of the preferred function objective could be traded off in order to achieve this level of circulation?”
In essence, the group is asked to consider how much of one objective’s value can be
sacrificed in order to get value from a less important design goal. The distinction of importance between function and circulation is fairly great in this example (Figure6-20) , primarily because the decision-makers in this instance apparently consider theway the building is arranged to be much more important from a functional point of view.
The mechanics for rank ordering design objectives are shown in Figure 6-21. Thecompletion of this exercise is likely to produce a different rank ordering from that originally expressed by the design team. This is a common outcome of decisionanalysis and one that should be considered a useful consequence, indicating that adiscussion and analysis of the objectives of the problem has produced a deeper
understanding of the design project. It is important to remember that the primary goalof decision analysis is not to provide definite answers to complex questions, but toenhance the ability of all decision-makers to comprehend the problem at hand.
Project: Corporate Headquarters Date: 3/81Location: Southwest U.S. Phase: Early Schematic
Objectives:
No. Name Description/DefinitionRank orWeight
1 Circulation movement of workers and materials in a well-defined manner
4
2 Functional efficiency
organization and arrangement of activities to allow for maximum work productivity
1
3 Expansion the ability to grow and change within the building and on the site
5
4 Image comfort of the user in physical and psychological terms,positive corporate image
2
5 Life-cycle costs minimization of capital, operating, maintenance,salvage, and tax costs
3
6
7
8
9
10
Figure 6-19. Initial client and user objectives, (Kirk and Spreckelmeyer 1993).

8/13/2019 Multi Criteria Sun Calculation House
http://slidepdf.com/reader/full/multi-criteria-sun-calculation-house 147/246
141
Figure 6-20. Trade-off assessment, (Kirk and Spreckelmeyer 1993).
Functional Efficiency
1
5
4
3
2
1 432 5
i r c u l a t i o n
b j e c t i v e “ Y ” V a l u e s
Objective “X” Values
Project: Corporate Headquarters Date: 3/81
Objective “X” Name: Functional Efficiency Objective “X” No. 2 Objective “Y” Name: Circulation Objective “Y” No. 1
High “X” Objective: Grouping of functions match organizational needs (in all dept.’s)Low “X” Objective: Clusters of activity areas are compatible in only two dept.’s
High “Y” Objective: Minimal employee walking distances. Separate circ. systems Low “Y” Objective: Extended amount of walking. Clear circ. system. Controlled access.

8/13/2019 Multi Criteria Sun Calculation House
http://slidepdf.com/reader/full/multi-criteria-sun-calculation-house 148/246
142
Figure 6-21. Weights of importance and rankings of objectives, (Kirk and Spreckelmeyer 1993).
This approach also shows how the attribute scales and weights may be viewed inconnection to each other. Another interesting aspect is that it promotes discussionabout both scales and weights, and the emphasis on iterations due to increased insight.
Lootsma (1999) describes a way of linking the weights directly to the measurementscales for the impact scores. The starting point is the scoring method described insection 6.6. Lootsma asks us to consider the numerical scale to quantify the relativeimportance (the weight ratio) of any two criteria. The first thing we want to establishis the range of possible values for the relative importance. Equal importance of twocriteria is expressed by the ratio 1:1 of the criteria weights, but how do we express
much more or vastly more importance? By the ratio of 100:1 of the criterion weights?In order to answer the question Lootsma carries out an imaginary experiment: Thedecision-maker is asked to consider two real or imaginary alternatives A j and Ak andtwo criteria such that his preference for A j over Ak under the first criterion Cf isroughly equal to his preference for Ak of A j under the second criterion Cs. Moreover,it is supposed that the situation is extreme: the impact grades assigned to the twoalternatives are 6 units apart under each of the two criteria. That is the maximumdistance on the seven-point scales 4,….,10 and 1,….,7. Accordingly, the impactgrades assigned to A j are gfj and gsj and the impact grades assigned to Ak are:
gfk = gfj - 6
gsk = gsj + 6
Functional efficiency : This objective was judged to be the most important.Set the weight at 1.00. = 1.00
Circulation : A trade-off value at the 2.3 points on the Function scale wasestablished (see Figure 6-20). Since this point is approximately a third of the distanceup the scale, use a weight of 0.33. = 0.33
Life cycle cost : A trade-off value of 3.75 of the Function scale was chosen by theteam. Since this value is somewhat less than three-quarters of the distance up thisscale, use a weight of importance of 0.69. = 0.69
Expansion : A trade-off value at the 3.5 point of the Function scale was chosen.This value is just slightly less than assigned to the Life-cycle cost goal. Assigna weight of importance of 0.65. = 0.65
Image : A trade-off value of 2.3 was chosen. Assign the same weight asCirculation at 0.33. = 0.33
Grand Total = 3.00
The new normalized weights of importance of the value statements (in descending order) are:
Function = 1.00/3.00 = 0.33Life-cycle cost = 0.69/3.00 = 0.23Expansion = 0.65/3.00 = 0.22Circulation = 0.33/3.00 = 0.11Image = 0.33/3.00 = 0.11---------------------------------------------------------
Total = 1.00

8/13/2019 Multi Criteria Sun Calculation House
http://slidepdf.com/reader/full/multi-criteria-sun-calculation-house 149/246
143
If the final grades f j and f k are 5 units apart, the ratio ω = wf /ws of the correspondingcriterion weights has to satisfy the relation:
f j – f k = 5
The arithmetic mean aggregation rule is applied to calculate the final grades:
where n is the number of alternatives, m is the number of criteria, ci is theperformance criterion normalized weight, and gij is the performance grade foralternative A j with respect to criterion C i. This yields:
This yields ω = 11. Such a ratio implies that the strong preference of A j over Ak
under Cf almost completely wipes out the equally strong but opposite preferenceunder Cs. In addition, Lootsma introduces two new assumptions:
1. The number of gradations to express relative preference for the alternatives equalsthe number of gradations for the relative importance of the criteria.
2. The numerical values associated with the gradations of relative importanceconstitute a sequence with geometric progression.
Thus, in the example above, where a much higher preference under the first criterionis practically wiped out by a much higher preference under the second criterion,Lootsma accordingly refers to the relative importance of the first criterion withrespect to the second one as much higher. So, a ratio of 8:1 may be taken to stand formuch more importance. Similarly, if we have a 9 point scale and the impact grades of
the alternatives are 8 units apart, Lootsma shows that it yields ω = 15. Thus, he takesa ratio of 16:1 to stand for vastly more importance.
A simple geometric sequence of values, with echelons corresponding to equal,somewhat more, more, much more, and vastly more importance, and “covering” therange of values between 1/16, and 16, is given by the sequence 1/16, 1/8, ¼, ½, 1, 2,
4, 8, 16 with progression factor 2. Hence, a geometric scale similar to the one in Table6-8 is obtained.
5)6(1
1)6(
11
1
1=
+
++−
+−
++
+ sj fjsj fj gggg
ω ω
ω
ω ω
ω
=
==m
i
iji j n jgc f 1
,...1,

8/13/2019 Multi Criteria Sun Calculation House
http://slidepdf.com/reader/full/multi-criteria-sun-calculation-house 150/246
144
Table 6-8. Geometric scale showing the relative importance of criteria ( ω ). The corresponding arithmetic scale is also indicated (rightmost column).
geometric scale
(ratio ω)description arithmetic scale
(differences of grades, h i )
16 C f vastly more important than Cs 88 C f much more important than Cs 64 C f more important than Cs 42 C f somewhat more important than Cs 21 C f as important as Cs 0
If we allow for gradations to express hesitations between two adjacent qualificationsin the above list, we have a geometric sequence with progression factor equal to thesquare root of 2. The ratios of subjective value may be recorded as differences of grades, as shown in the rightmost column of Table 6-8. A difference of 6 units has to
represent the ratio 8. This can be achieved with the progression factor equal to thesquare root of 2. Taking hi to stand for the grade assigned to criterion C i, we estimatethe ratio of the weights of two criteria C f and C s by:
An unnormalized weight of C i is accordingly given by:
The normalized weight of criterion Ci becomes:
Thus, based on the uniform scale presented in section 6-6 (Table 6-6), this shows thatit is possible to find a corresponding quantification of the gradations of the relativeimportance of the criteria. In this way, using the arithmetic mean aggregation rule in asimple additive weighting approach, the relative substitution rate between the criteriais independent of the performance of the alternatives under the remaining criteria.Thus, using these scales, the criteria weighting may be done in isolation from the
performance assessment, and those who judge the criteria do not have to be the samepersons who assess the performance of alternatives.
Discussion
Criteria weights are indicators of the influence of the individual criteria on thedecision. In the value function approaches, the weights are scaling values that defineacceptable tradeoffs between criteria – thus they are related to the scales on whichattributes are defined. Therefore, the weight assigned to a criterion is essentially ascaling factor which relates scores on that criterion to scores on all other criteria.
Hence if criterion A has a weight which is twice that of criterion B, this should beinterpreted that the decision-maker values 10 value points on criterion A the same as
( ) s f hh −
2
( ) ih
2
( )( )
=i
i
h
h
ic2
2

8/13/2019 Multi Criteria Sun Calculation House
http://slidepdf.com/reader/full/multi-criteria-sun-calculation-house 151/246
145
20 value points on criterion B and would be willing to trade one for the other. Or putanother way, the decision-maker should be indifferent to a trade between 1 unit of Aand 2 units of B.
The most simple and intuitive of the weighting approaches, i.e. the ranking, direct
rating and ratio estimation methods, all rely on the notion of attribute importance.This concept has been criticized because it assumes that decision-makers are able toappropriately adjust the importance judgments in relation to the scales. VonWinterfelt and Edwards (1986) give an example to illustrate this:
Think about evaluating alternative proposals for abating acid rain. Consider theattributes cost of abatement and percentage of trees in the United States that will dieas a result of acid rain. Preserving the trees is obviously very important compared with abatement costs if the policies lead to somewhere between 0 and 50% dying treesand all cost relatively little. However, if the range of dying trees is between 0 and 2%,the relative importance of that attribute should decrease, as long as the range of
abatement costs stays the same. The problem is that direct judgement of importancemay be insensitive to the ranges of the scales under consideration, and thusimportance may distort the rescaling of single-attribute value functions. Without explicit consideration of the ranges, a respondent is likely to state, “The danger toU.S. forests is more important than abatement costs”. That statement would, of course, be absurd if it turned out that saving three or four trees cost billions of dollars.
Von Winterfeldt and Edwards (1986) states that the evidence on whether or notpeople can appropriately adjust the importance judgements, is mixed. However, theylist three ideas that may help elicit this problem:
1. Use the natural ranges that the decision-makers have in mind – if need be, elicitthem first.
2. Be very explicit about the range you are using; make sure the decision-makersknow what it is and understand the relation between ranges and weights.
3. Don’t change ranges in midstream. Once you have picked a range that defines 0and 100, stick with it, even if some new options score –50 or +275 on thatattribute because your initial choice of ranges was unwise.
Von Winterfeldt and Edwards (1986) also describe an alternative solution to the range
problem; to give up the notion of importance altogether and use swing weightsinstead:
Swing weighting goes a long way toward countering the criticism of using extraneousand perhaps even distorting importance judgements. In fact, swing weighting coupled with carefully anchored single-attribute value elicitation techniques is virtuallyindistinguishable from the methods that are formally appropriate in the differencemeasurement techniques.
However, it may still be difficult or at least quite time-consuming for decision-makersthat are inexperienced with the concepts, to appropriately adjust the importance
judgements according to the attribute scales. Then, the method suggested by Lootsma(1999) might be a possible solution. Lootsma shows how verbal scales can be used to

8/13/2019 Multi Criteria Sun Calculation House
http://slidepdf.com/reader/full/multi-criteria-sun-calculation-house 152/246
146
measure both quantitative and qualitative attributes as well as criteria weights. Theverbal scales are linked to numerical scales that can be aggregated in a consistentmanner.
The most important function of the weighting exercise is that it should be a catalyst in
the learning process. Therefore, a good weighting technique is one that stimulatesdiscussion among participants and reveals hidden values and biases. It should also beeasy to understand and use for the inexperienced building professionals. Thus, it maybe wise to start with a simple numerical estimation method (for example a simplerank) that the design team members all feel comfortable with. The link between theweighting and the attribute scales should be made clear. If the decision-makers feelsomewhat uneasy that the result really reflects their values, consistency checks mustbe applied. The process should not follow a straight line from the beginning to theend, it should be iterative. The necessity to go back and re-evaluate the preliminaryfindings is not a sign of failing, but an indication that the team members have gainednew knowledge of the problem.
6.8 Conclusions
The discussion in this chapter gives the following conclusions:
• The structured approaches to performance evaluation may be separated into 3levels. The least formal (level 1) approach is side-by-side comparison of alternatives described by separate (different) performance indicators. Comparisonof attributes and weighting of criteria are not formalized. At the next level (level
2), the alternatives are measured on a common scale, but the weighting is notformalized. The third approach (level 3), also formalizes the weighting. Thesupporters of the 1st level argue that level 2 and 3 evaluations hide value judgements and make the process less transparent. However, it is my assumptionthat the higher level methods lead to better documentation of value judgements.This is because participants of the design team are encouraged to reveal theirvalues and judgements to the other members, thereby promoting discussion anddocumentation. It is recommended to start at the first level, and to go as far asneeded towards the 3rd level.
• The MCDM methods are structured approaches that seek to identify the decision-makers’ values with respect to multiple criteria in order to help them find the mostsuitable choice. They seek to make value judgements explicit and may in thisprocess reveal values or biases that would otherwise have been overlooked. In thisway they may promote understanding and learning and ease the communicationbetween design team members.
• MCDM approaches have not found a widespread use in the building industry. Thefew applications that are found use some sort of simple additive weightingapproach.
• If the number of alternatives is large, the concept of dominance as well as thedisjunctive/conjunctive methods may be useful to screen out inferior alternatives.
8/13/2019 Multi Criteria Sun Calculation House
http://slidepdf.com/reader/full/multi-criteria-sun-calculation-house 153/246
147
• Simple ordinal ranking of alternatives is intuitively best suited for evaluatingqualitative data. However, this approach does not always lead to a unique choice.Also, when more accurate quantitative data should be evaluated, ranking methodsmay not identify the best choice. Nevertheless, ordinal ranking methods may be
useful for screening purposes.
• Compensatory MCDM models are probably too complicated to serve as the firststep of introducing MCDM methods into building design. Also, the fact that theydo not model trade-offs is viewed as a disadvantage. This is because buildingdesign is full of conflicting values, and decision-makers really need to make trade-offs in order to reach a choice. It is better to focus on the value trade-offs, to makethem explicit and solve them, than to ignore them.
• The Analytical Hierarchy Process (AHP) offers a rational way to evaluatequalitative design issues. The hierarchical structure of criteria helps organize theproblem. It also has the advantage of being relatively simple to use, although itmay be time consuming if there are many criteria and alternatives to evaluate.However, the method is quite difficult to understand, and the pairwisecomparisons may lead decision-makers to loose the overview and feel that theyare not in control.
• The simple additive weighting (SAW) method seems to be the simplest and mostintuitive approach to aggregating values and performance measures. Also,experience has shown that it yields good results even though it is not applied on astrict axiomatic basis. Therefore, it seems to be the most suitable approach for
introduction into building design. It may help to structure the design work, tofocus on the most important issues, and to promote understanding andcommunication among the participants. However, it needs to be adapted to fit thespecial needs of building design. Guidelines are needed to be able to use iteffectively in a building design framework.
• The simple additive weighting approach is dependent on the users being able toemploy measurement and weighting techniques in an efficient way. Directmeasurement techniques are simple and intuitive and may be used for any kind of attributes in any setting. However, they are sensitive to biasing errors. Also, it isimportant that the value measurements are viewed in close connection to the
weighting. The simplest of the weighting approaches are the numerical estimationmethods. Since these types of importance weightings are closely linked to themeasurement scales, it is crucial that the weighting is done with the scales inmind. Some simple indifference questions can be used to check that the weightingand scales are matched in a consistent manner. Another solution to this problemmight be to use the logarithmic coding procedure as suggested by Lootsma(1999).
• Sensitivity analysis is considered the most suitable approach for studying theeffects of uncertainties and fuzzy statements. The existing models for evaluatingrisk are too detailed and time consuming for use in the early design phase. The
concept of fuzzy sets is quite difficult to understand, but may be used to modelvague value statements in this context. However, this requires that simple tools for

8/13/2019 Multi Criteria Sun Calculation House
http://slidepdf.com/reader/full/multi-criteria-sun-calculation-house 154/246
148
incorporating it into building design are available. This is probably still a longway to go, and is considered beyond the scope of this thesis.
Based on these conclusions, a framework for multi-criteria decision-making in solar
design is proposed and outlined in chapter 7. Then, in chapters 9, 10, and 11, tests of the approach will be reported.

8/13/2019 Multi Criteria Sun Calculation House
http://slidepdf.com/reader/full/multi-criteria-sun-calculation-house 155/246
149
7 A Framework for Multi-Criteria Decision-Making in Solar Design
7.1 Introduction
The first part of this chapter contains a summary and discussion of the findings in theprevious chapters, clarifying the line of argument. Then a review of the different
design activities related to the proposed framework, i.e. the discussion in chapters 3 to6 (problem formulation, generation of alternatives, performance prediction, andevaluation) follows. Finally, a specification of the framework that is proposed formulti-criteria decision-making in solar design is outlined.
7.2 Line of Argument
The preceding chapters have produced a line of argument as illustrated in Figure 7-1.The background for the work was based on the fact that solar building design needs
to address many different design objectives, called criteria. These criteria are oftenquite complicated to deal with (e.g. environmental loading) and may be conflicting.The different design issues and the many different available energy technologies callfor different areas of expertise to be involved in the design of solar buildings. Thus, itmay be difficult to evaluate the overall “goodness” of a proposed design solution.Also, the communication between design professionals and the client may becomplicated.
The goal of this work was therefore to produce a means for the design team andclients to be able to better understand and handle holistic solar design. A first
hypothesis was that a structured approach to evaluate design alternatives might be ameans to this end.
In order to specify an approach that would fit into the building design process, ananalysis of design process theory and building design practice was then undertaken.This analysis resulted in the following conclusions:
• Most building design processes start out with no clearly defined goals or criteriaof success. Most clients find it easier to give feedback based on a proposed designsolution than to come up with performance requirements to an abstract project.Thus, the design problem is explored and defined throughout the design process.
The design criteria are refined and discovered through evaluation and feedback onalternative design proposals.
Everything should be made as simple aspossible, but not one bit simpler.
- Albert Einstein

8/13/2019 Multi Criteria Sun Calculation House
http://slidepdf.com/reader/full/multi-criteria-sun-calculation-house 156/246
150
• Design involves a lot of subjective value judgements, and decisions are oftenbased on experience, “gut feeling” or intuition. Design options are evaluated basedon quantitative and qualitative performance measures. Each design is unique dueto different actors, different constraints, different organization, etc. For these
reasons, there exists no objective optimal design solution. Hence, it is impossibleto perform a numerical, global optimization.
• Close cooperation between the members of the design team (including the client)is imperative for the success of solar design. It is important that solar energyconsiderations are included in the early design stages because the decisions takenhere are important for achieving a well-integrated solar energy system.
• It is possible to identify some activities that are common to most design processes:
- problem formulation- generation of alternatives- performance prediction- evaluation
The activities are very much overlapping and dependent on each other.
• Decision making in design happens mainly through evaluation of proposed designsolutions. The conclusion was therefore that a structured approach for evaluationof alternative design options is useful and important, but it has to be seen inrelation to the other design task, i.e. put into a framework.
The next task was therefore to search for useful ideas for structuring evaluation in theearly design stage. The search was concentrated on the building industry and the fieldof decision analysis. The field of decision analysis was included because evaluation isan important task in decision making.
The result of the search was that some structured approaches to evaluation werefound within environmental planning and the emerging field of “green building”assessment. These methods resembled somewhat the Multi-Criteria Decision-Making(MCDM) methods that were found within the field of decision analysis. Thestructured evaluation methods were classified into three levels:
1. Side-by-side comparison of alternative solutions using different units of performance measurement
2. Side-by-side comparison of alternative solutions using a common measurementscale
3. Side-by-side comparison of alternative solutions using an overall measure of goodness based on a combination of a common measurement scale and criteriaweights.

8/13/2019 Multi Criteria Sun Calculation House
http://slidepdf.com/reader/full/multi-criteria-sun-calculation-house 157/246
151
Figure 7-1. The line of argument.
BACKGROUND
GOAL
HYPOTHESIS
DESIGN PROCESSCHARACTERISTICS
CONCLUSION
Conflicting design goalsComplicated design issues (e.g.environment)
Difficult to see thewhole picture
Difficult tocommunicate
Increase understanding of holistic solar design
A structured approach for evaluating alternative designsolutions might be helpful
• No well formulated a priori goals• Problem is defined throughout the process• There is no general, structured design approach
• Involves many value judgements, often not explicitly stated• Building design includes the following main activities:
- problem formulation
- generation of alternatives- performance prediction- evaluation
• Interrelated, overlapping activities• Early design phase is most important
Evaluation is important, but is interrelated with the other designtasks. Make a structured approach for evaluation, but includerelations to the other tasks.
Look for useful ideas for structuring evaluation within thebuilding industry and decision analysis.
Problem formulation
Generation of alternatives
Performance prediction
Evaluation: - Common scale- Weighting- Aggregation- Sensitivity analysis
TASK
FRAMEWORK
Found “green building” assessment tools and MCDM methods.RESULT
Evaluate methods with respect to use in building and solarsystems design.
TASK
The SAW method seems to be the most appropriate basis,because of simplicity, intuitiveness, and acceptability.
CONCLUSION
Develop method for building design frameworkTASK
LINE OF ARGUMENT

8/13/2019 Multi Criteria Sun Calculation House
http://slidepdf.com/reader/full/multi-criteria-sun-calculation-house 158/246
152
The next task was then to evaluate these methods with respect to use in building andsolar systems design. This evaluation was based on the findings in chapter 2 about thesolar building design process characteristics.
The first conclusion of this evaluation was that a structured side-by-side comparison
of alternative solutions seemed to be essential to evaluation. To ensure properdocumentation of the performance measures, it was recommended to start with asimple side-by-side comparison of the alternatives according to the level 1 evaluationdescribed above. Such an evaluation may not reveal a clear best alternative. This isdue to the fact that the goals are often conflicting or apparently incommensurate. Inthat case, a level 2 or 3 evaluation is needed. From the survey of multi-criteriaevaluation approaches, the Simple Additive Weighting (SAW) approach appeared tobe most suitable. Various applications of SAW approaches were found in the “greenbuilding” and environmental impact assessment tools. The SAW methods were alsofound to be the most simple and intuitive of the MCDM approaches. The mainadvantage of the SAW approach is that it makes value judgements explicit, thereby
acting to increase mutual understanding among the design team participants and theclient about what is important to focus on. It was also important that both qualitativeand quantitative values could be incorporated in the model. The model is also quiteflexible, thus it can be tailored to individual needs. A problem of the method is that itis quite difficult to create commensurate measurement scales and elicit representativeweights. Therefore, scaling and weighting techniques were investigated in moredetail. It was concluded that it might be possible for the design participants to createscales and weights to be used in an evaluation based on a SAW approach that isadapted for the building design process. However, appropriate guidance is needed.Also, some simple screening methods were found to be potentially useful innarrowing the range of alternatives.
Methods for including risk and uncertainty were also evaluated. Formal concepts forthis were quite complicated and were considered to be too time-consuming for theearly design phase. Still, with the development of advanced computer models, theseconcepts could be applicable even in early design evaluations. However, a furtherdiscussion of this was defined to be outside the scope of this thesis. For the currentsituation, methods based on sensitivity analysis were found to be the most suitable.
The next section summarizes the conclusions for the 4 parts of the framework (i.e. problem formulation, generation of alternatives, performance prediction and
evaluation) followed by a section where the framework is specified.
7.3 Problem formulation
In chapter 3, the concept of value focused thinking (Keeney 1992) was presented asthe basis for generating and evaluating potential design solutions. The crux of thistheory is that the values of the decision-makers should be elicited before one goes onto generate and evaluate alternatives. This was based on the view that focusing on
alternatives without having the objectives in mind, may limit the possibilities of finding the best alternative. Focusing on alternatives instead of values may anchor the

8/13/2019 Multi Criteria Sun Calculation House
http://slidepdf.com/reader/full/multi-criteria-sun-calculation-house 159/246
153
search, limit creativity, and make the search for a solution less effective. However, theidea of values first is an ideal goal, since in practice it is difficult to specify one’svalues until one has a fair idea of what is possible or feasible. Therefore, in practice,the tasks of formulating the problem and generating/evaluating alternatives areintertwined.
In his theory of value focused thinking, Keeney also implied a hierarchy of objectives,with the fundamental and strategic objectives at the highest level and the meansobjectives below. The means objectives are derived from the strategic objectives andused to measure the performance of potential solutions. The problem formulation task should contain a discussion of criteria to form a common understanding of whatdesign issues are important and to have a standardized vocabulary that all members of the design team and decision-makers can relate to.
Because of the large amount of information needed to holistically evaluate buildingconcepts, some sort of organization and classification of information into manageable
chunks is needed. A survey of models and tools for organizing information in buildingdesign was carried out. Checklists, matrixes and hierarchies were found to be the toolsmost commonly used. Checklists may be helpful as a starting point to get an idea of what issues may be relevant. However, a checklist cannot deal with interactionsbetween its contents at any level of detail. In design of solar buildings, it is importantto keep track of interrelations and synergy effects between systems and criteria. Amatrix structure provide the possibility to model interactions between pairs of issues,however, multi-dimensional links are difficult to implement. A hierarchical structureseems to be most suited for multi-criteria evaluation of solar building systems. It fitswell into the theory of value focused thinking, with the fundamental objectives at thetop, and the specific, means objectives at the bottom. It is possible to go into detailwithout loosing the overview. In a well-structured hierarchy, it is also possible tofocus on a part of the problem at a time, because the links to the rest of the system areensured.
7.4 Generation of Alternatives
The next step that was identified as a prerequisite for evaluation, is generation of alternatives. This is above all a craft, mainly based on creativity, knowledge, andexperience. Thus, no general, formal approach can be specified for this task.However, there are some techniques that can be used as aids in the process. Some of these techniques were briefly described in chapter 4 (brainstorming, Delphi,manipulation and pattern techniques). It may be wise to start out with a wide range of ideas that test the extremes of the objectives. This will reduce the risk of overlookinggood ideas. The wide range of alternatives may only be evaluated very roughly.Screening techniques, described in chapter 6, may be useful to narrow it down to asmaller set of alternatives that can be evaluated more in detail. The task of generatingalternatives may generate new design criteria or it may alter the “old” ones, and assuch, this task is very much a part of the iterative loop of problem formulation andevaluation.
8/13/2019 Multi Criteria Sun Calculation House
http://slidepdf.com/reader/full/multi-criteria-sun-calculation-house 160/246
154
7.5 Performance Prediction
The last step that was identified prior to evaluation was performance prediction of potential solutions. In chapter 5, two opposite theories of performance prediction werepresented; optimizing and satisficing. Optimizing can be viewed as the ideal way of finding the solution that best fits the objectives. It involves constructing a model thatincorporates all parameters and characteristics that have an effect on the optimalsolution. Given all feasible values of these characteristics, the model can then predictthe optimal solution. However, in practice, such an approach is not possible. This isbecause such a model would be too time-consuming to construct, and in any case, it isnot possible to model all values numerically. Also, the search for an optimal solutionwould be endless, because there is an infinite number of possible solutions. Therefore,the concept of satisficing is closer to what happens in practical life. Satisficing
involves selecting a solution that is “good enough”, i.e. it falls within some specifiedlimits of acceptance. However, it is questionable whether this is an approach that isreally good enough. While the optimizing approach is too ambitious, satisficing seemsto be not ambitious enough. Of course, it depends on what limits of acceptance thatare specified; if the limits are ambitious, the solution would be ambitious. However, itis hard to know at what level the limits should be set. The best approach seems to liesomewhere in between the two extremes: to search for a solution that satisfies a set of objectives in a best possible way, given the limited time and resources of the givenproject. In this process, the decision-maker would have to consider trade-offs betweenconflicting objectives in accordance with the relative importance of the criteria.
Since available tools for predicting the performance of solar and low energy buildingswere described in chapter 2, this chapter concentrated on discussing the level of detailneeded. The importance of balance in performance prediction was emphasized. Thismeans that the level of detail of performance prediction should be viewed in relationto the importance of the design criteria. For example, it is fruitless to do a detailedanalysis of the embodied energy in the materials, if this is insignificant in relation tothe total energy use of the building, or if the decision-makers do not consider energyuse to be an important issue. Also, if there are a lot of uncertainties that cannot bemodeled, a detailed performance prediction is futile. Moreover, if there are a lot of criteria that can only be evaluated on a coarse, qualitative scale, it may not beworthwhile to measure the other criteria on a detailed scale.
It was also argued that a hierarchical structure of criteria would help promote abalanced performance prediction. A hierarchy divides the problem into differentlevels of detail, and keeps track of the interactions between issues. In a properlydesigned criteria hierarchy, one can easily see how improvements in one subsystemwill affect the system as a whole. In such a framework, a sub-optimization may evenbe useful, because it is possible to focus on one limited problem at a time, whilekeeping track of the relations to the rest of the system. A sub-optimization may beuseful to better understand the relationship between a limited set of parameters.
Finally, the presentation of results of the performance prediction was discussed.Several studies indicate that choice is strongly influenced by the way the results are

8/13/2019 Multi Criteria Sun Calculation House
http://slidepdf.com/reader/full/multi-criteria-sun-calculation-house 161/246
155
presented. When evaluating building design solutions, it is common to compare theperformance to a reference performance, e.g. the average energy consumption forsimilar buildings, etc. Thus, the choice of reference performance for each criterionwill determine if the decision will be positively or negatively framed with respect tothe different criteria. It was also emphasized that the presentation should be clear and
understandable for outsiders, and it should focus on giving an illustrative overview,while at the same time offer the opportunity to see the details behind.
7.6 Performance Evaluation
The last and most central task of the multicriteria decision-making framework of thisthesis, is performance evaluation. Evaluation is comparison of the performance of apotential solution to the design objectives in order to see how well it fulfills these.The evaluation forms a basis for decisions about what strategies to choose. The
objectives in building projects are often vague or even unknown. The evaluationprocess may in itself serve to specify and clarify the design goals. However, even withrelatively clearly defined design goals it may be difficult to select the best optionbecause the goals are apparently incommensurate or conflicting. A structuredapproach to evaluation may help overcome these problems.
In sections 6.2 and 6.3 a survey of structured approaches to evaluation was carriedout. The survey revealed 3 different levels of performing a structured evaluation:
1) Side-by-side comparison of alternative solutions using different units of performance measurement.
2) Side-by-side comparison of alternative solutions using a common measurementscale.
3) Side-by-side comparison of alternative solutions using an overall measure of goodness based on a combination of a common measurement scale and criteriaweights.
Evaluation requires assignment of “goodness” or “appropriateness” to the predictedperformances. Since “good” and “bad” only make sense when there are at least two of a kind, evaluation requires side-by-side comparison of alternatives. A structured wayto do this is to make a matrix with the alternatives listed on one “axis” and the criteriaon the other “axis”. The cells of the matrix will then contain performance measuresfor each alternative with respect to each criterion. In this way, the background for theevaluation will be well documented. Also, clearly inferior alternatives may beidentified and screened out. In some cases, the best alternative may also emerge. Inmost cases, however, it will be difficult to identify the best choice because of conflicting and apparently incommensurate goals. Thus, a model for measuringperformances on a common scale, weighting the criteria, and synthesizing it all into acommon measure of goodness, seems necessary. However, the question of whether ornot such an aggregation is fruitful, is raised. Some argue that the worth of a designoption is not a simple additive function of the worth of it’s various components. Thismay be true, but addition still seems to be the most suitable way to determine the
overall worth, mainly because it is easy to understand and implement. Others arguethat the aggregation hides value judgements and conceals details. To this last

8/13/2019 Multi Criteria Sun Calculation House
http://slidepdf.com/reader/full/multi-criteria-sun-calculation-house 162/246
156
argument I have argued that the contrary is true. Since the aggregation requiresexplicit formulation of measurements and value judgements, it serves to betterdocument the decisions and to promote discussion and common understanding aboutthe design problems. In this way it may help define the general nature and context of the problem. The process of scoring and weighting may also help to identify weak
points where the building needs to be improved.
Because it is important that the model can be used in the early building design phase,it should be quick and simple to use. The survey of multi-criteria evaluation modelssuggested that some sort of Simple Additive Weighting (SAW) approach would bemost appropriate. The SAW model appeared to be the most simple and intuitive. Also,most of the evaluation approaches that were found to be applied within the buildingindustry, used some variations of the SAW model. The other models that were found,were either mathematically complicated, very time-consuming to use, or requiredinput data that would be almost impossible to find. The SAW model also seemed tocontain the flexibility that is needed in order to be transformed into a building design
framework. However, the problem of creating commensurate measurement scales andweights in an efficient and consistent manner, still remained.
Building design involves evaluation with respect to both qualitative and quantitativecriteria. The qualitative criteria can only be measured on a relatively coarse scalebecause humans have a limited vocabulary to describe qualities. In chapter 6,examples of such qualitative scales were given, e.g. excellent, good, fair unsatisfactory, poor . The quantitative attributes of a system may be measured in muchmore detail. Consequently, the quantitative criteria may easily receive much moreattention than they really deserve. Also, in the early design phase there is muchuncertainty and there is not enough data available to justify very detailed performanceassessments. Therefore, it seems most worthwhile to base the evaluation on a fairlycoarse scale.
The SAW model requires that the weighting be viewed in connection to themeasurement scales. In chapter 6 it was discussed whether decision-makers are ableto appropriately adjust the importance judgements in relation to the scales. It wasconcluded that the evidence about this is mixed. Indifference questions that sort outthe decision-makers trade-offs between criteria may be a means to help ensureconsistency. However, such checks may be time-consuming, especially if thedecision-makers are unfamiliar with the concept or the number of criteria is large. The
method presented by Lootsma may be a possible way around this problem. Thismethod offers a way to measure all quantitative and qualitative data on a common,verbal scale. Thus, the scaling exercise becomes easier and quicker as one does nothave to do consistency checks. In addition, using this technique, the relativeimportance of the criteria seems to be a meaningful concept even in isolation from theunits of performance measurement. The observation that human beings are sensitive,not to marginal but to relative changes, is grounded in a century of psycho-physicalresearch on the relationship between the intensities of physical stimuli and sensoryresponses. The concept is also intuitively compelling. Nevertheless, it is a prerequisitethat the decision-makers feels comfortable with the scales and that they accept themas representative of their values. The decision-makers may disagree that the geometric
progression scale can be used to represent their values, or they may have difficultiesin understanding the concept.

8/13/2019 Multi Criteria Sun Calculation House
http://slidepdf.com/reader/full/multi-criteria-sun-calculation-house 163/246
157
7.7 The Framework
It is not possible to make a method that will fit all types of projects. Thus, the
suggested methodology will only be a framework or general guideline that should betailored to fit individual needs and preferences. The main focus of this thesis is on theschematic design phase, because the early design phase is most important for the finaloutcome of the project. However, the framework may also be used in the later designphases. In Figure 7-2 the framework is illustrated in relation to the design phases. Theproblem formulation starts in the programming/briefing phase. Here, the first set of design criteria is formulated using the theory of value-focused thinking and ahierarchical organization. Based on these criteria, alternatives are generated and theirperformances with respect to the different criteria are predicted. The alternatives arethen evaluated based on performance scores and weights for the different criteria. Theevaluation may lead to a revision of the criteria, or the need for further performance
prediction. Thus, there is an iterative loop between the tasks. Evaluation is written inbold types, because the focus of the framework is on the evaluation of alternativesolutions. As the design evolves, the principles of the methodology remains the samewhile the details of the design decisions become more refined. The methodology isapplied as often as necessary during each phase in order to solve specific projectproblems.
Figure 7-2. The Framework in relation to the design phases.
The framework is primarily directed towards the multidisciplinary design team andthe client, but the methodology should be a common point of reference to which allstakeholders can relate. However, there is a need for a central decision-maker that canguide the process. This may be the architect, a representative of the client, or aspecially appointed project leader.
Below follows the specification of the different tasks in the framework.
Brief,Programming
Schematicdesign
Designdevelopment
Detaileddesign
Problemformulation
Criteria
Generation ofalternatives
Performanceprediction
Evaluation
Generation ofalternatives
Performanceprediction
Evaluation
Generation ofalternatives
Performanceprediction
Evaluation
re-formulation re-formulation
Re-formulation
of criteria
Re-formulation
of criteria

8/13/2019 Multi Criteria Sun Calculation House
http://slidepdf.com/reader/full/multi-criteria-sun-calculation-house 164/246
158
1. Problem Formulation
A hierarchy of design criteria should be developed using the principles of value focused thinking (Keeney 1992) outlined in chapter 3. Although it is difficult tospecify the objectives before any concrete design alternatives are present, it isimportant to focus on the values first, not to impose any destructive constraints to thecreative process. In value focused thinking, the design criteria are specified using atop-down approach. This means that one starts with defining the higher-levelobjectives, i.e. the general, strategic objectives of the decision-makers. Then, the moreprecise, lower-level criteria are specified. Although, it is recommended to start with atop-down approach to eliciting criteria, a bottom-up approach may be useful in thenext step of the process. In a bottom-up approach, potential solutions are used to helpspecifying the criteria.
It is not possible to give a general recipe of what criteria to consider or to what extentthey should be included. The number and nature of the criteria will vary from case to
case. Generally, it may be useful to focus on the reasons why a criterion is important,and to document this. This will also help clarify the objectives for the differentmembers of the design team and the other stakeholders. For solar and low energybuildings, the life cycle perspective is important. The stakeholders of the building andtheir present and future needs and requirements have to be projected. The number of criteria and sub-criteria and the level of detail should be chosen based on anestimation of the available time and resources, and the needed accuracy of theevaluation. The following general guidelines may be given:
The criteria hierarchy should be complete and exhaustive. This means that allimportant performance attributes deemed relevant to the final decision should be
represented. The real value attributes should be separated from topics people aremerely interested in. One should focus the design effort on those issues that make amajor difference in the quality of the outcome.
The criteria hierarchy should contain mutually exclusive items. When eliciting criteriathe same concept may arise under different headings. If both are included in theanalysis then it is likely that as a consequence the concept will be attributed greaterimportance. If the hierarchy is restricted to mutually exclusive items, it would permitthe decision-maker to view the attributes as independent entities among whichappropriate trade-offs may later be made.
In addition, the number of main criteria and sub-criteria must be considered. If thereare a large amount of criteria, the problem may be difficult to handle, and one mayloose the overview. Also, with a large number of criteria, the importance weights endup small and thus the meaningfulness of the weights is blunted. On the other hand, if there are only a small number of criteria, it may lead to an oversimplification of thereal world. The number of criteria may affect the “value balance” of the hierarchy.The greater the level of detail pertaining to an objective, possibly reflected in thenumber of sub-criteria, the more likely it is that it will be attributed a high level of importance. Miller’s theory (Miller 1956) suggests that it may be wise to limit thenumber of major and sub-criteria to approximately seven. Miller claimed that sevenplus or minus two represents the greatest amount of information that an observer can
give us about an object on the basis of an absolute judgement. This theory is widelyaccepted within behavioral sciences.

8/13/2019 Multi Criteria Sun Calculation House
http://slidepdf.com/reader/full/multi-criteria-sun-calculation-house 165/246
159
Figure 7-3 gives an example of a hierarchy that may be used to evaluate potentialsolutions for building energy systems. At the top is the overall goal of the design; “theoptimal energy system” for this particular building. Then, at the next level follows themain criteria, which are divided into sub-criteria, sub-sub-criteria, and so on. The sub-
criteria are presented in separate entities due to space limitations. Also, the criteria areindicated using key words only, e.g. full criteria statements are “minimumenvironmental loading”, “maximum comfort”, etc. This hierarchy may have beenderived from a hierarchy of fundamental objectives as described by Keeney (1992).Note that some of the sub-criteria are crossed out; this is to show how the finalhierarchy has been deducted from a wider, more general one. A more detailedexample of how such a hierarchy may be developed is given in chapter 9 (case 1).
Figure 7-3. Example of a criteria hierarchy for evaluation of energy systems for buildings.
Finally, a simple assessment of the relative importance of the criteria should becarried out in this phase. This will provide a basis for the next two tasks, to help seewhat is important to focus on when generating alternatives and predicting theirperformance. This may also help specifying the level of detail for the differentbranches in the hierarchy. A simple ranking of criteria weights may be sufficient.
Environmentalloading Comfort Architecturalquality Economics Functionality
Optimal energy system
Fun ctio na lity Fle xib ility P R-va lue Ma in tain ab ility
Functionality
Investmentcosts
Operatingcosts
Maintenancecosts
Economics
Energy use
Resourcedepletion
Humanhealth
Effects ofenergy use
Ecologicalimpacts
Environmentalloading
Visualcomfort
Thermalcomfort
Atmosphericcomfort
Acousticalcomfort
Mechanicalcomfort
Psychosocialcomfort
Comfort
Identity Scale/ proportion
Integrity/ coherence
Integration inurban context
Architecturalquality

8/13/2019 Multi Criteria Sun Calculation House
http://slidepdf.com/reader/full/multi-criteria-sun-calculation-house 166/246
160
2. Generation of Alternatives
Since the generation of alternatives ismainly a craft, little formal guidancecan be given for this task. However, it
is important that the alternatives aregenerated based on the criteria and theirrelative importance. Techniques topromote creativity may be used, e.g.brainstorming techniques. It may bewise to start out wide to test theextremes of the criteria and to be surethat a wide range of possibilities hasbeen considered. Different screeningtechniques may be helpful, for examplesimple ranks or the concept of dominance.
It may be useful to categorize the alternative solutions into main groups andsubgroups, according to their purpose or main principles. For example, the maincategories for façade systems may be Thermal Collectors, PV collectors, andWindows. An example of a hierarchy of solar systems is given in chapter 9 (case 1).
3. Performance Prediction
The performance prediction should be done in accordance with the criteria hierarchy.The criteria hierarchy and the preliminary weights dictate the level of detail needed in
the performance predictions for the different criteria. In this way, an appropriate andbalanced performance prediction may be carried out.
The result of the performance prediction may be presented in a matrix structure tofacilitate side-by-side comparison. The matrix should contain descriptions of thealternatives’ performances with respect to the different criteria. Different types of performance indicators may be used, i.e. numbers may be used for the quantitativecriteria and verbal statements for the qualitative criteria. Uncertainties should bespecified, for example by indicating the plausible ranges of deviation from theexpected value. Table 7-1 shows an example of such a matrix. At this stage, theresults should be presented as objectively as possible, i.e. as “raw data” without any
relation to reference values.
Decrease thenumber of
alternatives
Increase thelevel of detail
The screening of alternatives.
many alternatives……………………………………….
………………..…………….
………….………
……
few

8/13/2019 Multi Criteria Sun Calculation House
http://slidepdf.com/reader/full/multi-criteria-sun-calculation-house 167/246
161
Table 7-1. Example of a matrix structure to assemble the performance assessments.
Criterion 1:energy consumption
Criterion 2:aesthetics
Criterion 3:life cycle cost
Criterion 4:comfort
Alternative 1 200 ± 10% Overallscale/proportion iswell accomplished.Some deteriorationof colors may occur.
500 ± 15% 20 hours ofoverheating in southfacing rooms duringsummer. Some colddraft from eastwindows in diningarea.Good lighting,daylighting….
Alternative 2…………………...…………………...
…………………...…………………...
…………………...…………………...
…………………...…………………...
Alternative 3…………………... …………………... ………………
…...…………………...
A so-called “star diagram” has been used to present the overall performance of analternative, see the figure below. In this diagram it is possible to show multipledimensions, thus all the individual performance measures can be gathered into onepicture. Each “finger” represents the scale for one criterion. The performance on each
criterion is plotted on each “finger” (thecenter of the star usually designates thelowest/worst performance). However,there is a limit to the number of dimensions that can be presentedwithout making the graphics look cluttered. Following Miller’s theory(Miller 1956), a maximum of 9 fingers isprobably the limit. Only the main criteriashould be plotted in the star diagram.The sub-criteria may possibly be
indicated below the main criterion.
Although the star diagram may be used to give an indication of the overallperformance of an alternative, it should be used with caution. This is because theperformance scales for the criteria are not commensurate; individual scales are used,and no weights are applied to make them comparable. Therefore, it is recommendedto show the individual scales on each “finger”, to clarify that the scales are notdirectly comparable.
The next task is to prepare for the evaluation. Evaluation involves measuring andcomparing the alternative solutions with respect to the objectives. To measure and
compare something, you need to have a reference. The choice of reference isimportant, because it may have a big influence on the results. Common references are
Star diagram.
maximum (best)performance
actualperformance
minimum (worst)performance

8/13/2019 Multi Criteria Sun Calculation House
http://slidepdf.com/reader/full/multi-criteria-sun-calculation-house 168/246
162
minimum, maximum or mean values. In the case of building design, these may be“least acceptable”, “standard/common practice”, and “best practice”. Alternatively,one of the proposed solutions may serve as a reference. The reference performancesmay be indicated in the star diagram, as shown in Figure 7-2.
Figure 7-2. Star diagram with individual criteria scores and reference scores indicated.
Task 4: Performance Evaluation
The evaluation process is separated into 4 steps:
1. Scaling and scoring: The performances of each attribute are transformedinto a common scale.
2. Weighting. The criteria are weighted based on the chosen scales.3. Aggregation. The weights and the scores are aggregated to obtain an
overall evaluation of each alternative.4. Sensitivity analysis. Sensitivity analyses are performed to test the
robustness of the results. Conclusions are drawn and recommendations aremade.
It may be necessary to do several iterative loops in this process. Firstly, the weightingmay lead to a need to redefine the scales. Secondly, the sensitivity analysis may reveala need to change both the scales and the weights.
Step 1: Scaling and scoringThe common measurement scale need not have a large number of intervals. This isbecause fine gradations do not make sense for the qualitative criteria; these criteriacan only be described verbally, and humans have a limited vocabulary to express
qualitative gradations. Also, for the quantitative criteria, it does not makes sense tohave a very fine scale, partly because of the large uncertainties of the performance
least acceptable
standard/mean
best practice
predicted performanceof potential solution
cost($/m
2 /yr)comfort
aesthetics
excellent
good
fair
50
70
200
energy(kWh/m
2 /yr)

8/13/2019 Multi Criteria Sun Calculation House
http://slidepdf.com/reader/full/multi-criteria-sun-calculation-house 169/246
163
predictions in the early design phase, and partly because they should be compatible tothe qualitative ones. A 9- or 10-point scale seems to be the maximum usablegradation. When comparing alternatives, we have 5 main terms to express the relativeattractiveness of one alternative to the other, see Table 7-2. The categories in betweencan be used when the decision-maker hesitates between the neighboring
qualifications. The 10-point scale is usually reduced to a 7-point scale because theperformances that are assigned a score lower than 4 are so poor that they cannot becompensated elsewhere. The 7-point scale has also been widely used withinbehavioral sciences. Thus, a 7-point scale, with scores ranging from 4 to 10 seems tobe most appropriate.
Table 7-2. Verbal terms to express the relative attractiveness of an object.
relative judgement direct judgement
10 reference excellent9
8 somewhat less attractive good76 less attractive fair54 much less attractive unsatisfactory32 vastly less attractive poor1
The qualitative criteria are rated directly on this scale. When constructing scales forthe quantitative criteria, the qualitative scale should be used as a basis. First, the endpoints should be decided. The end points should be realistic, that is, it should be easy
to imagine that some of the alternatives being considered might realistically score atthe maximum and minimum value. The scale should be wide enough that it isprobable that new alternatives do not fall outside the boundaries, and narrow enoughso that the alternatives are well spread out in order to be able to differentiate amongthem. This can be done by considering the acceptable range instead of the possiblerange, i.e. the range that one would be willing to consider. For example, if thecriterion is “energy consumption”, one could ask the following question to thedecision-makers: “What is the best performance of energy consumption you wouldexpect in a potential design solution?” and “What is the least you would accept?”
The scale needs to be divided into intervals that are felt to be equal. There are three
different approaches that may be used to determine the points in between theextremes. The easiest approach is to apply a linear scale. However, such a scaleimplies that our preference follow a linear progression, which is probably not likely,at least not for all criteria. Nevertheless, a linear scale may be a useful approximation.Some experiments suggest that straight-line approximations to curved utilities makelittle difference to the final decision (Edwards and Newman 1982), (von Winterfeldtand Edwards 1986).
The second approach is to manually subdivide the scales so that the intervals are feltto be equal, e.g. the difference between the first and the third, and the third and thefifth scalar pairs have to be subjectively equal. This, however, might be a
cumbersome and time-consuming process.

8/13/2019 Multi Criteria Sun Calculation House
http://slidepdf.com/reader/full/multi-criteria-sun-calculation-house 170/246
164
The third approach is based on the assumption that our preferences follow a geometricprogression. In his recent work, Lootsma (1999) presents convincing arguments basedon behavioral sciences and psycho-physics, which supports this. He shows that oursensory systems for the perception of sound, light, smell, taste and time all followgeometric sequences that are very similar. Then he shows that this enables us to
categorize quantitative values on scales using verbal expressions like fair, good,excellent, etc. The qualitative attributes can be rated directly on this scale. Thus, a link between the quantitative and qualitative scale is established. A prerequisite for thisapproach is that the decision-maker considers the range of acceptable performancedata from the so-called desired target (Pmin in Table 7-3).
Table 7-3. The geometric progression scale, based on Lootsma (1999).
Numericalperformance
indicator(e.g. price)
Qualitative verbal and symbolic scalesScore
(grade)
Pmin(reference) 20000
P0 = Pmin + e0 20300 desirable excellent +++ 10
P1 = Pmin + e1 20600 good/excellent ++ 9
P2 = Pmin + e2 21200 somewhat lessdesirable
good + 8
P3 = Pmin + e3 22500 fair/good 0 7
P4 = Pmin + e4 25000 less desirable fair - 6
P5 = Pmin + e5 30000 unsatisfactory/fair -- 5
P6 = Pmin + e6(Pmax) 40000 much less desirable unsatisfactory --- 4
The choice of scaling and scoring approach must be viewed in connection to theweighting approach.
Step 2: WeightingA weight assigned to a criterion is essentially a scaling factor that relates scores onthat criterion to scores on all other criteria. This is a subtle idea, and is not always
easy to see. Therefore, it may have to be explained to the decision-makers, forexample by giving an example similar to the one given in section 6.7. Using the firsttwo scaling approaches described above, the link between the scales and the weightsneed to be established. Thus, consistency checks have to be made using trade-off questions or indifference questions. The link to the scales may be established byshowing the scales and asking the decision-makers about their trade-offs orindifference between the criteria. For example, a set-up like the one in Figure 7-3 maybe used. The scales for the different criteria are drawn side-by-side next to thecommon scale of grades. The trade-offs between the criteria given by the ratio of weights are then checked by indifference questions such as the ones below the scalesin the figure.

8/13/2019 Multi Criteria Sun Calculation House
http://slidepdf.com/reader/full/multi-criteria-sun-calculation-house 171/246
165
Figure 7-3. Set-up for linking the scales to the weights.
An alternative is to use an approach based on the preference theories of Lootsma(1999), explained in section 6.7. The criteria weights are determined on a 7-pointscale similar to the one used for scoring the performances, see Table 7-3 above. Thisis based on the deduction leading to Table 6-8. The decision-maker can express theimportance of criteria in grades on the scale 4,5,…,10, as follows (grades lower than 4are possible but will practically eliminate the corresponding criteria):
Table 7-4. Grading scale for determining weights.
grade h i description10 Preferred criterion (reference)98 Somewhat less preferred 76 Less preferred 54 Much less preferred
The most important criterion receives a grade of 10. All the other criteria arecompared to this, e.g. if a criterion is felt to be somewhat less important than the most
200
250
300
350
400
450
500
excellent
good
fair
unsatisfactory
80
100
120
140
160
180
200
7
6
5
4
3
2
1
excellent
good
fair
unsatisfactory
Common grade scale
Energy consumption (kWh/m
2 /yr)
Life cycle cost
($/m 2 /yr)
Aesthetic pleasure
Given the weight ratio energy : cost : aesthetics = 2 : 4 : 1, the following checks may be made:
• The decision-makers should be indifferent to a trade between 4 units of the energyconsumption criterion and 2 units of the cost criterion. This means for example that theenergy consumption may be increased from 120 to 200 kWh/m
2 /yr if the cost is decreased
from 300 to 200 $/m 2 /yr .
• The decision-makers should be indifferent to a trade between 1 unit of the energyconsumption criterion and 2 units of the aesthetic pleasure criterion. This means for examplethat the energy consumption may be increased from 160 to 180 kWh/m
2 /yr if the aesthetics is
increased from fair to good .
• Etc.

8/13/2019 Multi Criteria Sun Calculation House
http://slidepdf.com/reader/full/multi-criteria-sun-calculation-house 172/246
166
important one, it receives a grade of 8. The normalized weight of criterion C i iscalculated as follows:
Using this approach, the link between the scales and the weights is embedded in theprocedure, and does not have to be established explicitly.
Step 3: AggregationThe simple additive weighting (SAW) model is proposed to aggregate theperformance grades and the criteria weights:
where f j is the final score for alternative A j, n is the number of alternatives, m is thenumber of criteria, ci is the normalized weight of the performance criterion Ci, and gij
is the performance grade (score) for alternative A j with respect to criterion C i.
The calculations needed are so simple that a hand calculator is sufficient to producethe result (or it may even be done manually). However, a simple worksheet setupmight be useful because the process can be more automated and it gives thepossibility to produce graphics to illustrate the results. The results of the evaluationshould be presented in such a way that it is possible to trace the weighing and scoring
outcomes. Figure 7-4 shows an example of such a presentation where the total scoresfor the alternatives are shown (top) together with the performance scores with respectto the different criteria (bars – different colored sections), and the weights of thecriteria (pie-chart).
-7
-6
-5
-4
-3
-2
-1
01
2
3
4
5
6
7
alt 1 alt 2 alt 3 alt 4 alt 5
criterion 6
criterion 5
criterion 4
criterion 3
criterion 2
criterion 1
weights
1,9 -2,0 -3,5 -0,1 0,5
Figure 7-4. Graphical presentation of the aggregation of weights and scores. The scores are
indicated on the vertical axis. The numbers above the bars are the total weighted scores for each alternative. The weights are shown in the pie chart at the top right.
( )( )
=i
i
h
h
ic2
2
=
==m
i
iji j n jgc f 1
,...1,

8/13/2019 Multi Criteria Sun Calculation House
http://slidepdf.com/reader/full/multi-criteria-sun-calculation-house 173/246
167
Step 4: Sensitivity studyA sensitivity study is a test of the robustness of the results with respect to variations inthe assumptions used in the evaluation, i.e. the criteria weights and the performancemeasures. It would probably be wise to start with investigating the sensitivity to
weights. The criteria weights are the essence of value judgements; they very muchdetermine the outcome. Also, the weights are more likely to be in dispute than theperformance measures (scores). It is usually sufficient to vary the weights at thehigher level of the trees, because the lower-level weights have much less effect on theresult. Obviously, one should vary the weights that are most dubious. The next task isto investigate variations of the performance measures. This is only needed if someperformance measures discriminate much between alternatives. The result may betested with extreme values for different future scenarios.
The results of the sensitivity analysis may also be illustrated graphically, for exampleas shown in Figure 7-5. Here, the weights have been changed, and the resulting bars
can be compared to the ones in Figure 7-4.
-7
-6
-5
-4
-3
-2
-1
0
1
2
3
4
5
6
7
alt 1 alt 2 alt 3 alt 4 alt 5
criterion 6
criterion 5
criterion 4
criterion 3
criterion 2
criterion 1
weights
4,6 3,0 2,1 3,3 5,2
Figure 7-5. Illustrating the sensitivity to weights. The performance scores are kept the same as in Figure 7-4, but the criteria weights are different.
In the following chapters, the suggestions of this framework is exemplified and testedin 3 case projects.

8/13/2019 Multi Criteria Sun Calculation House
http://slidepdf.com/reader/full/multi-criteria-sun-calculation-house 174/246
168
8 Introduction to Case Studies
The tree case studies that have been carried out are somewhat different in nature. Thefirst two case studies were carried out before the multi-criteria decision-makingmethod was fully developed. Also, the first studies are partly theoretical, i.e. theywere not fully carried out in real life building design projects. The first case study wasdone as a part of an EU research project that aimed at designing a generic officebuilding facade based on a-Si photovoltaic panels. Thus, this case study does notmatch exactly with the target of this thesis. However, the study was still useful
because it served to illustrate the use of the method among a group of designers, and itallowed for going into greater detail of documentation than a more “practical” casewould have done. In this case the participants created their own measurement scales,i.e. they used the first type of measurement approach described above.
The second case study was a test of the method in the schematic design phase of aschool building. However, the test was not completely put into “real life”; it was doneusing an actual building project as a case, but including only the architect from theactual design team. The other participants of the test did not participate in the actualbuilding project. In this case study, the participants used predefined, linearmeasurement scales, i.e. the second type of measurement approach described above.
The third case study was a test of the method fully implemented in a real life buildingproject. All the actual members of the real-life design team, including the client,participated in the test. In this case, the participants used the logarithmic type scales,i.e. the third type of measurement approach described above.

8/13/2019 Multi Criteria Sun Calculation House
http://slidepdf.com/reader/full/multi-criteria-sun-calculation-house 175/246
169
9 Case 1
9.1 Introduction
This case is an example of how a multi-criteria decision-making method may be usedin the development of a solar facade for an office building. The approach was appliedin the EU project ASICOM (Amorphous Silicon Photovoltaics in CommercialBuildings), where the aim was to develop solar facade solutions based on a-Si PV.
This work was carried out before the concept of the MCDM framework presented inthis thesis was fully developed. Nevertheless, the example serves to show how theMCDM framework may work in a product development case.
Design team
To represent the values and expertise of potential clients and designers in theEuropean market place, a “model” design team was constructed. The design teamconsisted of scientists from the Norwegian University of Science and Technology,Faculty of Architecture. The scientists were playing the roles of an architect (AnneGunnarshaug Lien, Ph.D. in architecture), an energy engineer (Inger Andresen, M.Sc.
in building engineering), and a client (Anne Grete Hestnes, professor in architecture).The scientists possess considerable knowledge in solar energy design. In addition, thedesign team had the expertise of the rest of the ASICOM partners to draw on whendesigning the facade concepts. The design was based on the work that had previouslybeen carried out within the ASICOM project.

8/13/2019 Multi Criteria Sun Calculation House
http://slidepdf.com/reader/full/multi-criteria-sun-calculation-house 176/246
170
9.2 Problem Formulation
Reference building
A generic type office building, relatively high standard, was chosen to represent atypical office building that would be a candidate for solar facade applications inEurope. The evaluations were done for 3 different locations that are representative forthe range of European climates: Oslo – Norway, Würtzburg – Germany, and Nice –France.
Key numbers
Gross floor area 1890 m2
Gross volume 5670 m3
Number of floors 3
Area of exterior walls 954 m2
Area of interior walls 1920 m2
Window area 190 m²Number of parking spaces 20Number of off ice work places 64
Occupation 8 am to 5 pm, Monday-FridayIndoor air temperature Temperature set point: minimum 22°C, maximum 26°C during occupied
hours. Minimum 16°C, maximum 31°C during unoccupied hours.Thermal insulation Oslo, Norway: U = 0.22 W/m²K for wall, U= 0.15 W/m²K for floors and roofs
Würtzburg, Germany: U = 0.5 W/m²K for wall, U= 0.3 W/m²K for floors androofsNice, France: U = 0.7 W/m²K for wall, U= 0.5 W/m²K for floors and roofs
Windows bxh = 2x1m, placed in the middle of the façade of each cellularoffice, double pane insulating windows with aluminum frames.Oslo, Norway: Uglazing = 1.5 W/m²KWürtzburg, Germany: Uglazing = 1.8 W/m²KNice, France: Uglazing = 2.5 W/m²KTotal solar energy transmittance = 0.61,Light transmittance =0.77.Automatic external venetian blinds (south windows only).
Ventilation Air conditioning with cooling. Air volume 15 m3 /m
2h. Constant temperature
and volume of supply air. Zoning. Heat recovery with 65% efficiency.Heating Water based radiators.Cooling Local cooling in computer centers. Cooling of ventilation air and local
cooling ceilings.Infiltration 0.2 ACH
Internal gains Lights: 9 W/m², Equipment: 5 W/m², Persons: 4 W/m² (peak loads)Exterior wall cladding ½-stone brick with special patterns.
3 5 0 0 0
18000

8/13/2019 Multi Criteria Sun Calculation House
http://slidepdf.com/reader/full/multi-criteria-sun-calculation-house 177/246
171
9.3 Criteria Used
It was assumed that the typical European clients that would consider a solar facade fortheir buildings, would wish to emphasize low environmental loading, good indoor
comfort, nice appearance, good functionality and good economics. Thus, the maincriteria were:
• environmental loading
• comfort
• aesthetics
• functionality
• economics
The criteria were then described, and different possible ways to evaluate them werediscussed. Then, the most appropriate level of evaluation was chosen for each
criterion, and the background for these choices were documented. The description anddiscussion of the criteria were as follows:
Economy
Three different levels of doing an economic evaluation of a building project werediscussed:
Level 1: Investment costsLevel 2: Life cycle costsLevel 3: “Total economic value”
Level 1 includes a consideration of the investment costs only. Until recently, this hasbeen the most common procedure used as decision support for building investments inmany European countries. The problem with this method is that it does not accountfor the future economic impacts of the project.
The method of Life Cycle Costs, LCC (level 2) is becoming more common. Inaddition to the initial construction costs, costs of physical operation over the usefullife of the building are considered, see Figure 9-1. These include the costs of acquisition, maintenance, repair, replacement, and disposal. All costs are expressed aspresent value or other discounted value. There is an extensive literature on the use of
LCC as a tool in the planning of buildings, including different methods for calculationand presentation of the cost-effectiveness of a project, see for example (Dell'Isola andKirk 1981; Blom, Stenstad et al. 1988; Flanagan, Norman et al. 1989; Bejrum 1991;Mann 1992; Bjørberg, Eide et al. 1993; Bjørberg, Eide et al. 1993). The problem withthe LCC method is that future costs of maintenance, replacement, etc., are hard toestimate. To deal with this, different methods for incorporating uncertainty and risk have been devised, see for example (Dell'Isola and Kirk 1981; Flanagan, Norman etal. 1989; Bejrum 1991; Mann 1992). Another problem is the determination of the rateof return, which very much influences the outcome of the calculation.
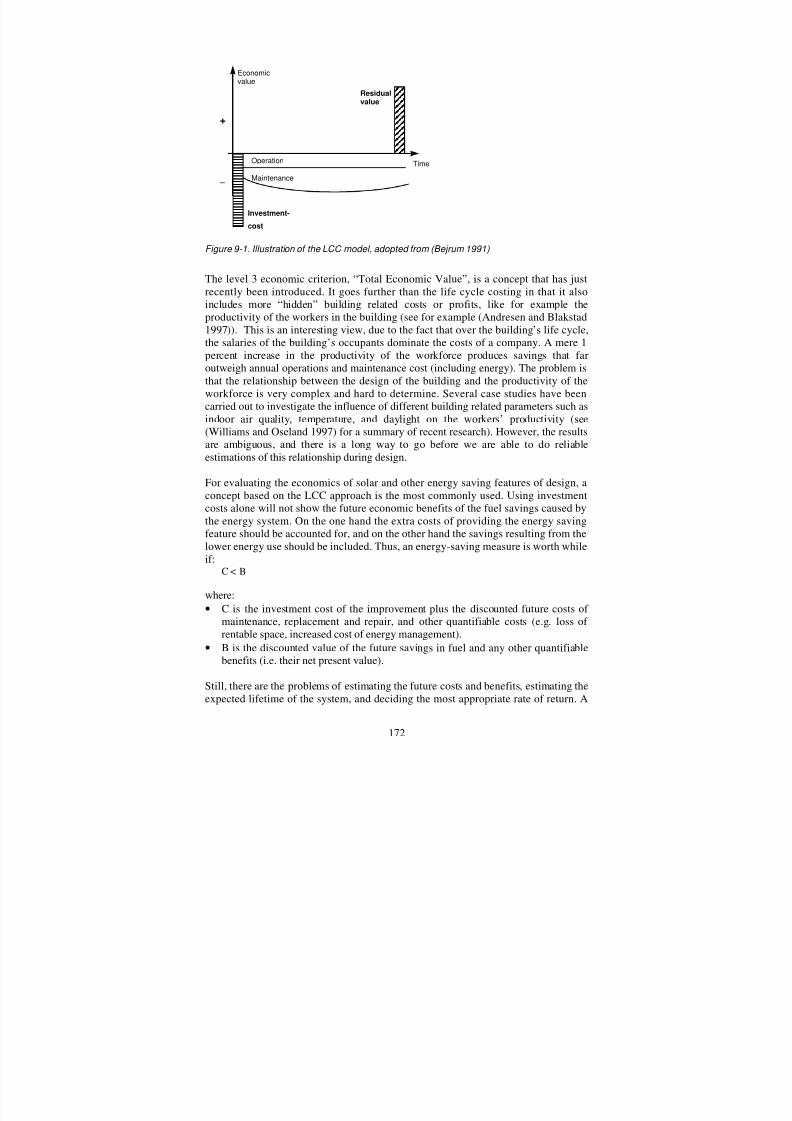
8/13/2019 Multi Criteria Sun Calculation House
http://slidepdf.com/reader/full/multi-criteria-sun-calculation-house 178/246
172
Operation
Maintenance
Residualvalue
Investment-
cost
Time
Economicvalue
+
_
Figure 9-1. Illustration of the LCC model, adopted from (Bejrum 1991)
The level 3 economic criterion, “Total Economic Value”, is a concept that has justrecently been introduced. It goes further than the life cycle costing in that it alsoincludes more “hidden” building related costs or profits, like for example theproductivity of the workers in the building (see for example (Andresen and Blakstad1997)). This is an interesting view, due to the fact that over the building’s life cycle,the salaries of the building’s occupants dominate the costs of a company. A mere 1percent increase in the productivity of the workforce produces savings that faroutweigh annual operations and maintenance cost (including energy). The problem isthat the relationship between the design of the building and the productivity of theworkforce is very complex and hard to determine. Several case studies have been
carried out to investigate the influence of different building related parameters such asindoor air quality, temperature, and daylight on the workers’ productivity (see(Williams and Oseland 1997) for a summary of recent research). However, the resultsare ambiguous, and there is a long way to go before we are able to do reliableestimations of this relationship during design.
For evaluating the economics of solar and other energy saving features of design, aconcept based on the LCC approach is the most commonly used. Using investmentcosts alone will not show the future economic benefits of the fuel savings caused bythe energy system. On the one hand the extra costs of providing the energy savingfeature should be accounted for, and on the other hand the savings resulting from the
lower energy use should be included. Thus, an energy-saving measure is worth whileif:
C < B
where:
• C is the investment cost of the improvement plus the discounted future costs of maintenance, replacement and repair, and other quantifiable costs (e.g. loss of rentable space, increased cost of energy management).
• B is the discounted value of the future savings in fuel and any other quantifiablebenefits (i.e. their net present value).
Still, there are the problems of estimating the future costs and benefits, estimating theexpected lifetime of the system, and deciding the most appropriate rate of return. A

8/13/2019 Multi Criteria Sun Calculation House
http://slidepdf.com/reader/full/multi-criteria-sun-calculation-house 179/246
173
common way of dealing with this, is to do a sensitivity analysis to check whathappens to the conclusions when these parameters are varied within expected ranges.
Based on this discussion, the following recommendation was given:
Table 9-1. Summary of the logic behind the choices regarding the economic criterion.
Possible representations Chosenrepresentation
Why
Investment cost No Does not account for the effect of the energysaved (as a consequence of the solar system)during the operation of the building.
Life cycle cost Yes Includes effect of marginal investment costs and
future energy savings.Total economic value No Too complicated and time consuming. Not
sufficient data.
Environment
It is a well-established fact that buildings have a significant impact on theenvironment. Table 9-2 illustrates the comprehensive environmental effects of buildings.
Table 9-2. Environmental effects of buildings, (Roodman and Lenssen 1995).
Problem Buildings’ share of problem Effects
Use of virgin minerals 40% of raw stone, gravel and sand.Comparable share of other processedmaterials such as steel.
• Landscape destruction
• Toxic runoff from minesand tailings
• Deforestation• Air and water pollution
Use of virgin wood 25% for construction • Deforestation• Flooding• Siltation• Biological and cultural
diversity lossesUse of energy
resources
40% of total energy use • Local air pollution
• Acid rain• Damming of rivers• Nuclear waste• Risk of global warming
Use of water 16% of total water withdrawals • Water pollution• Competes with agriculture• and ecosystems for water
Production of waste Comparable in industrial countries tomunicipal solid waste generation
• Landfill problems, such asleaching of heavy metalsand water pollution
Use a LCC approach including the marginal investment cost of the solar energy system
plus the discounted value of the future maintenance, replacement and repair costs, plus thediscounted value of the future fuel savings. Add a sensitivity analysis studying the effect ofvarying interest rates and fuel prices within expected ranges.

8/13/2019 Multi Criteria Sun Calculation House
http://slidepdf.com/reader/full/multi-criteria-sun-calculation-house 180/246
174
A complete environmental assessment of a building should include all life cyclephases of the building, from “cradle to grave or cradle”. The method of Life CycleAssessment (LCA) has been internationally accepted through Society of Environmental Toxicology and Chemistry /SETAC, 1991/ and ISO 14000. Themethod includes an assessment of all environmental inputs and outputs of a process or
a product of its life time, see Figure 9-2.
Figure 9-2. Life Cycle Assessment, (Lawrence Livermore Laboratory).
The main categories of environmental impacts are usually categorized into 3 mainareas: resource depletion, human health, and ecological impacts, see Table 9-3.
Table 9-3. Main environmental impacts of a LCA, (Ministerråd 1994).
Impact Category
Resource 1. Resource depletion - energy and materialsdepletion 2. Resource depletion – water
3. Resource depletion - land (including wetlands)Human 4. Human health - toxicological impactshealth 5. Human health - non-toxicological impacts
6. Human health impact in work environmentEcological 7. Global warming
impacts 8. Depletion of stratospheric ozone9. Acidification10. Eutrophication11. Photo-oxidant formation12. Ecotoxicolgical impacts13. Habitat alteration and impacts on biological diversity
Due to the high degree of complexity, a complete life cycle analysis will be too timeconsuming in a standard building project. Therefore, it is necessary to concentrate theanalysis on the most important issues. Unfortunately, it is not very easy to decidewhat are the most important issues. In the literature of environmental impactassessment, three helpful indicators are often mentioned to aid this assessment: time,
exposure, and magnitude. Time refers the duration of the environmental impact, that ishow long the impact will last. Exposure refers to the size of the geographic area and

8/13/2019 Multi Criteria Sun Calculation House
http://slidepdf.com/reader/full/multi-criteria-sun-calculation-house 181/246
175
the number of people that will be affected. The magnitude refers to the severity of theimpact. Often, also the probability of the occurrence and the reversibility of the effectare included.
For evaluating the environmental impact of solar energy systems in this case, it was
decided to concentrate only on energy use. As was shown in Table 9-2, energy use inbuildings is the source of very significant environmental effects. Therefore, anassessment of the energy performance of the building is probably the most importantissue when comparing different energy saving measures. This does not mean that weshould forget the other issues, such as waste minimization and toxic releases.Nevertheless, due to time limitations, energy performance was the only environmentalcriterion included here.
The energy performance may be assessed through three main life cycle stages:
• Energy for production of materials, products, systems, and building
• Energy for operation of the building• Energy for demolishing of the building
Several studies (SBI 1990; Østergaard 1992; Myhre and Haugen 1993; Adalberth1995; Fossdal 1995; Winther and Hestnes 1995; Winther 1998) have shown that theenergy for operation accounts for the majority of the energy consumption, in the orderof 90% of the total. However, if the amount of technical installations is very high, theenergy for production should also be included in the assessment, see Figure 9-3.
0
10000
20000
30000
40000
50000
60000
70000
80000
90000
100000
house 1 house 2 house 3 house 4
k W h
operation
production
house 1: super insulated with advanced ventilation heat recovery, heat pump and PV system.house 2: well-insulated dwelling with ventilation heat recovery and solar thermal collectors.house 3: well-insulated house with heat pump for space and water heating.house 4: standard insulated house with no special energy saving measures.
Figure 9-3. Energy consumption for production and operation (50 years) of a row house unit with 4 different levels of energy efficient measures, (Winther and Hestnes 1995).
The energy consumption for operation may be separated into thermal and electricalenergy, since these are associated with different environmental loadings. Thermal
energy consumption consists of space and domestic hot water heating. The electricalenergy consumption is composed of space cooling and electricity for fans, pumps,

8/13/2019 Multi Criteria Sun Calculation House
http://slidepdf.com/reader/full/multi-criteria-sun-calculation-house 182/246
176
lights and appliances. These may be estimated using computer simulation programs,simple calculation tools, or rules of thumb.
Table 9-4. Summary of logic for the choice of representation of the environmental criterion.
Possible representations Chosenrepresentation
Why
Complete LCA No Too time consuming, sufficient data notavailable.
Energy consumption forconstruction and operation,separated into thermal andelectric energy.
Yes Probably the main environmental effect of solarsystems is their effect on energy use forconstruction and operation. There is no otherspecial characteristics of solar systems thatsignificantly affects the environment differentlythan other building materials or systems.
Figure 9-4. Hierarchical structure for the environmental criterion.
Aesthetics
Aesthetics can be defined as that which is concerned with the characteristics of objects and of the human being perceiving them that make the object pleasing to thesenses (U.S.Army 1989). However, numerous definitions of aesthetics exist, and thereis no agreement among professionals or the public related to any one of thesedefinitions. Furthermore, what is particularly pleasing in terms of aesthetic quality toone individual may not necessarily be pleasing to another. Reekie (Reekie 1972)suggests that there may be some way to handle the problem more objectively:
A distinction has to be made between the term “visually satisfactory” and the word “aesthetic”. The latter should properly be used in regard to beauty – a special and intense visual quality. But beauty is subjective. What one person finds beautiful,another may find unattractive or ugly. Visual satisfaction results from the objectiveappreciation of the appearance of objects which are well-designed in accordancewith generally accepted basic principles.
Reekie also specifies a number of visual design parameters (Reekie 1972):
• Light
• Color (harmony, contrast, psychological effects)
• Surfaces – texture, transparency, translucency, reflectivity, shadows, shade,pattern
Energy
Resourcedepletion
Humanhealth
Effects of energyconsumption
EcologicalImpacts
Environmental
loading

8/13/2019 Multi Criteria Sun Calculation House
http://slidepdf.com/reader/full/multi-criteria-sun-calculation-house 183/246

8/13/2019 Multi Criteria Sun Calculation House
http://slidepdf.com/reader/full/multi-criteria-sun-calculation-house 184/246
178
only are people differently dressed and have different metabolic rates, theirassessment of comfort is also influenced by their psychosocial environment.
No calculation method can predict exactly what will happen in a building under actualoperating conditions. Important variables such as occupant density, shading, and
equipment heat gain are dependent on factors that are more or less impossible topredict accurately. Sensitivity analyses may help to reveal the robustness of thebuilding, but the amount of effort required is considerable.
Despite this, there are standards and so called “objective” methods for assessingthermal comfort quantitatively. The most common ones are ASHRAE standard 55-92(ASHRAE 1992), ISO Standard 7730 (ISO 1984). Typically, six basic variables areused to describe the effect of thermal comfort:
• clothing level
• degree of activity
• air temperature
• radiant temperature
• air velocity
• relative humidity
Both standards are based on the concepts of PMV and PPD developed by P.O. Fanger(Fanger 1970). Based on laboratory experiments, Fanger has developed a correlationbetween parameters in the indoor environment and people’s sensation of thermalcomfort. This thermal index is called the “Predicted Mean Vote” (PMV) and is afunction of activity, clothing, air temperature, mean radiant temperature, relative air
velocity and air humidity. As a measure for the thermal sensation, the followingpsychosocial scale is used:
-3 = cold-2 = cool-1 = slightly cool0 = neutral+1 = slightly warm+2 = warm+3 = hot
The mathematical expression for PMV is rather complex, but tables and diagrams areavailable from which PMV can easily be determined. The “Predicted Percentage of Dissatisfied” (PPD) of a large group of persons is an indication of the number whowill be inclined to complain about the environment. PPD is therefore suggested as ameaningful “figure of merit” for rating the thermal quality of a given indoorenvironment. The predicted percentage of dissatisfied, PPD, is related to the PMV asfollows:
PPD = 100 – 95 exp[-(0.03353 PMV4 + 0.2179 PMV2)]
Accepting that no single environment is judged satisfactory by everybody, the
standards specify a comfort zone based on 90% acceptance or 10% dissatisfied. Thiscriterion leads to an upper limit for operative temperature in summer of 26°C, given

8/13/2019 Multi Criteria Sun Calculation House
http://slidepdf.com/reader/full/multi-criteria-sun-calculation-house 185/246
179
50% relative humidity, sedentary activity, 0.5 clo and a mean air speed of less than0.15 m/s.
The PMV model is interpreted as a constant set-point for a given clothing, metabolicrate and air velocity. It does not consider any effects due to adaptation, cultural
differences, climate and seasons, age, sex or psychosocial attributes. Recent researchcasts doubt upon the application of steady-state heat exchange equations to what inpractice is a variable environment (Clements-Croome 1997). People are not passiverecipients of the environment, but take adaptive measures to secure thermal comfort.They may modify their clothing or activity, modify the lighting or solar heat gains, ormodify the ventilation rate through opening of doors and windows. This suggests thata more “adaptable” method of comfort judgement is needed.
Thus, the evaluation of thermal comfort conditions at the design stage becomes a verycomplicated task. Advanced computer simulation programs may predict operativetemperatures, temperature swings, relative humidities and air speeds in a building
with “predictable” occupants. However, the behavior and adaptability of the futureoccupants is hard to predict. Therefore, putting a lot of effort into advancedsimulation of thermal comfort may be useless. A more practical approach may be tomake sure that the air temperature and the “cold draught” from windows stays withinacceptable limits. Many thermal computer simulation codes offer the possibility tocheck the room temperature, or it could be checked by simple hand calculations for acold and a warm day. The cold draught from windows can easily be evaluated throughthe use of diagrams such as the one shown in Figure 9-5.
Cold draught from windows
0,0
0,5
1,0
1,5
2,0
2,5
3,0
-5 -10 -15 -20
Ambient temperature, o
C
H e i g h t o f g l a z i n g , m
U = 0,7
U = 1,1
U = 1,3
U = 1,4
U = 1,7
U = 2,9
Figure 9-5. Maximum height of window that prevents unacceptable cold draft as a function of ambient temperature and window center U-value (W/m²K). (By courtesy of Marit Thyholt,SINTEF Civil and Environmental Engineering, Trondheim).
Visual ComfortVisual comfort and ease of seeing are dependent on:
• illuminance level• glare

8/13/2019 Multi Criteria Sun Calculation House
http://slidepdf.com/reader/full/multi-criteria-sun-calculation-house 186/246
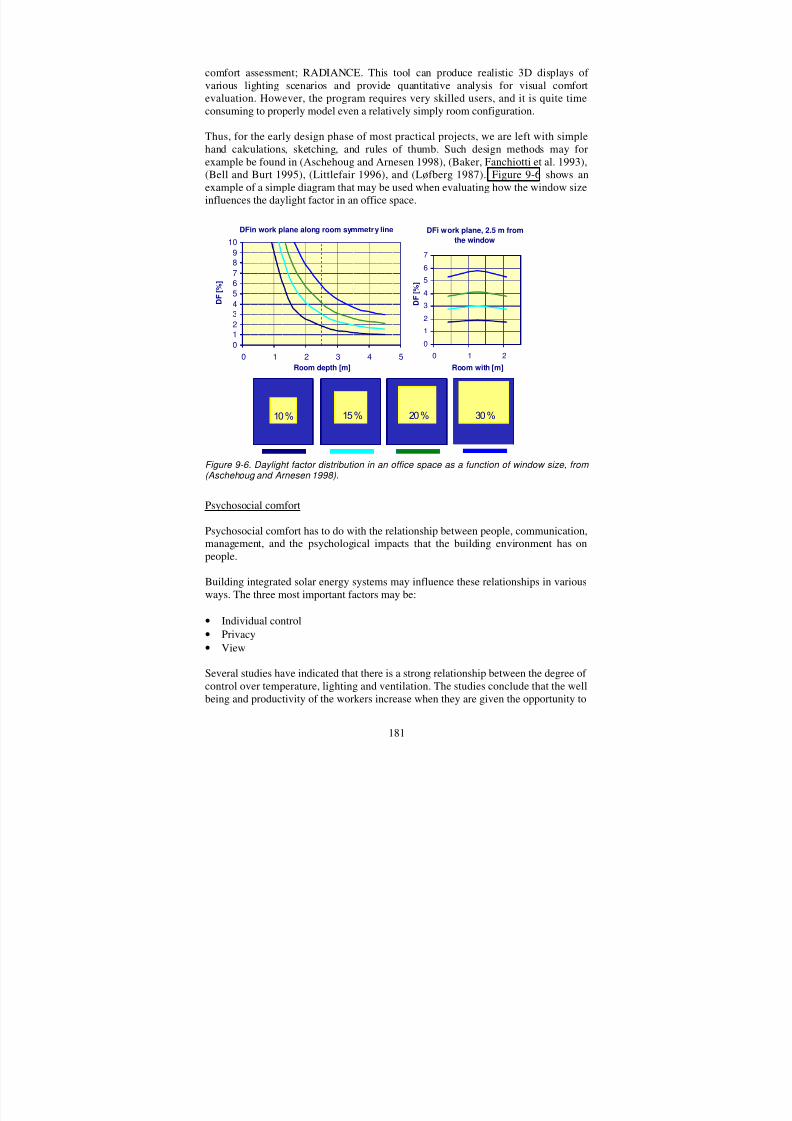
8/13/2019 Multi Criteria Sun Calculation House
http://slidepdf.com/reader/full/multi-criteria-sun-calculation-house 187/246
181
comfort assessment; RADIANCE. This tool can produce realistic 3D displays of various lighting scenarios and provide quantitative analysis for visual comfortevaluation. However, the program requires very skilled users, and it is quite timeconsuming to properly model even a relatively simply room configuration.
Thus, for the early design phase of most practical projects, we are left with simplehand calculations, sketching, and rules of thumb. Such design methods may forexample be found in (Aschehoug and Arnesen 1998), (Baker, Fanchiotti et al. 1993),(Bell and Burt 1995), (Littlefair 1996), and (Løfberg 1987). Figure 9-6 shows anexample of a simple diagram that may be used when evaluating how the window sizeinfluences the daylight factor in an office space.
Figure 9-6. Daylight factor distribution in an office space as a function of window size, from (Aschehoug and Arnesen 1998).
Psychosocial comfort
Psychosocial comfort has to do with the relationship between people, communication,
management, and the psychological impacts that the building environment has onpeople.
Building integrated solar energy systems may influence these relationships in variousways. The three most important factors may be:
• Individual control
• Privacy
• View
Several studies have indicated that there is a strong relationship between the degree of
control over temperature, lighting and ventilation. The studies conclude that the wellbeing and productivity of the workers increase when they are given the opportunity to
10 % 15 % 20 % 30 %
DFin work plane along room symmetry line
0
1
2
34
5
67
89
10
0 1 2 3 4 5
Room depth [m]
D F [ % ]
DFi work plane, 2.5 m from
the window
0
1
2
3
4
5
6
7
0 1 2
Room with [m]
D F [ % ]
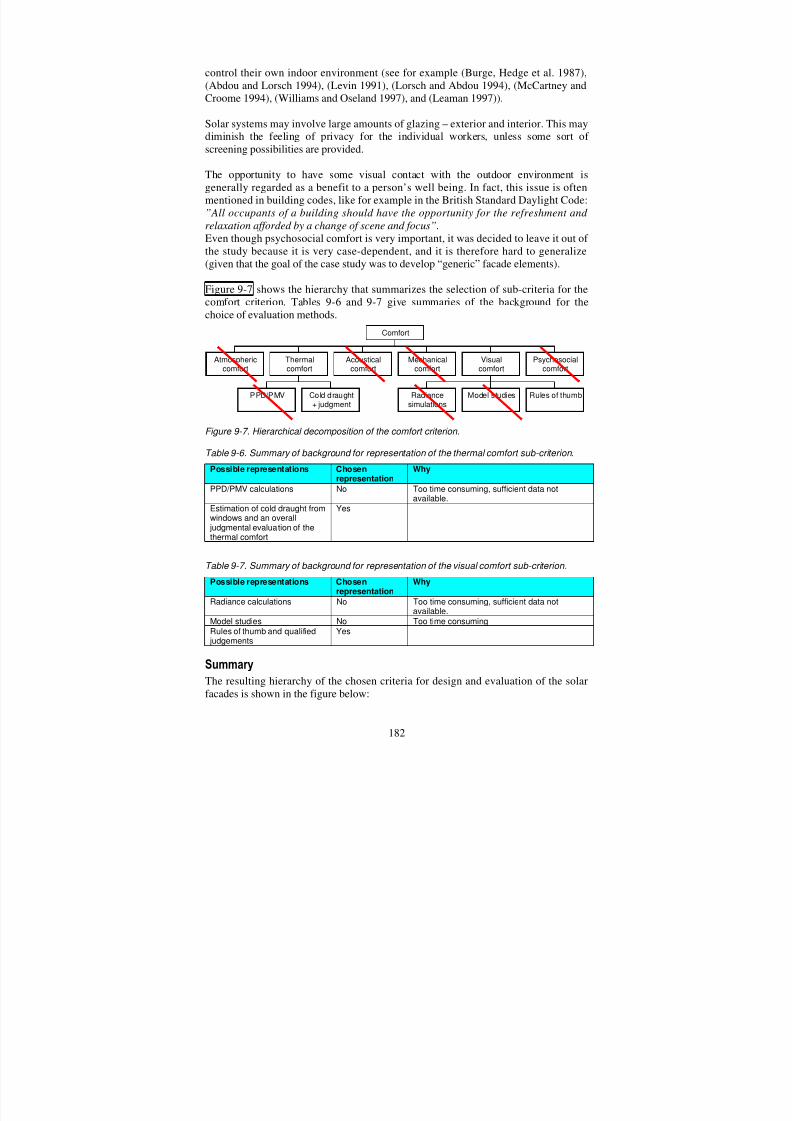
8/13/2019 Multi Criteria Sun Calculation House
http://slidepdf.com/reader/full/multi-criteria-sun-calculation-house 188/246
182
control their own indoor environment (see for example (Burge, Hedge et al. 1987),(Abdou and Lorsch 1994), (Levin 1991), (Lorsch and Abdou 1994), (McCartney andCroome 1994), (Williams and Oseland 1997), and (Leaman 1997)).
Solar systems may involve large amounts of glazing – exterior and interior. This may
diminish the feeling of privacy for the individual workers, unless some sort of screening possibilities are provided.
The opportunity to have some visual contact with the outdoor environment isgenerally regarded as a benefit to a person’s well being. In fact, this issue is oftenmentioned in building codes, like for example in the British Standard Daylight Code:”All occupants of a building should have the opportunity for the refreshment and relaxation afforded by a change of scene and focus”.Even though psychosocial comfort is very important, it was decided to leave it out of the study because it is very case-dependent, and it is therefore hard to generalize(given that the goal of the case study was to develop “generic” facade elements).
Figure 9-7 shows the hierarchy that summarizes the selection of sub-criteria for thecomfort criterion. Tables 9-6 and 9-7 give summaries of the background for thechoice of evaluation methods.
Figure 9-7. Hierarchical decomposition of the comfort criterion.
Table 9-6. Summary of background for representation of the thermal comfort sub-criterion.
Possible representations Chosenrepresentation
Why
PPD/PMV calculations No Too time consuming, sufficient data notavailable.
Estimation of cold draught fromwindows and an overall
judgmental evaluation of thethermal comfort
Yes
Table 9-7. Summary of background for representation of the visual comfort sub-criterion.
Possible representations Chosenrepresentation
Why
Radiance calculations No Too time consuming, sufficient data notavailable.
Model studies No Too time consumingRules of thumb and qualified
judgementsYes
Summary
The resulting hierarchy of the chosen criteria for design and evaluation of the solarfacades is shown in the figure below:
Atmosphericcomfort
PPD/PMV Cold draught+ judgment
Thermalcomfort
Acousticalcomfort
Mechanicalcomfort
Radiancesimulations
Model studies Rules of thumb
Visualcomfort
Psychosocialcomfort
Comfort

8/13/2019 Multi Criteria Sun Calculation House
http://slidepdf.com/reader/full/multi-criteria-sun-calculation-house 189/246
183
Energyconsumptionfor operation
Environmental
loading
Life cyclecosts
Economics
Integrity/coherenceScale/proportion
Aesthetics
Visual andthermalcomfort
Comfort
FlexibilityPR value
Functionality
Optimum building integratedsolar energy system
Figure 9-8. Hierarchy of criteria for solar facades.
9.4 Generation of alternatives
The different solar energy system types were structured in groups according to theiruse and technical characteristics, as shown in the following figure:
Figure 9-9. Solar energy technologies for building integration, structured hierarchically.
Based on an evaluation of the possible solar strategies, it was decided to concentrateon three main types of solar facade options for office buildings:
1. A-Si cladding. Amorphous silicon photovoltaic cladding elements with aluminumframing. Efficiency 4%.
2. C-Si cladding. Multi-crystalline silicon photovoltaic cladding elements withaluminum framing. Efficiency 12%.
3. Thermal collector cladding. Low efficiency air-collectors for space and water
heating. FRUL = 5.0, FR(τα) = 0.5.
Based on the developments and evaluations that had been carried out within theASICOM project, the following 3 facade configurations were chosen for furtherevaluation:
Available solar energymeasures for façade
integration
Electrical DaylightThermal
Active PassivePhotovoltaics Window andcontrol
systems
TSWAirLiquid DirectSunspacea-Sic-Si
Shading systems

8/13/2019 Multi Criteria Sun Calculation House
http://slidepdf.com/reader/full/multi-criteria-sun-calculation-house 190/246
184
Case 1: Opaque solar cladding elements are compared to a reference cladding of natural stone. The solar cladding elements are: a-Si elements (developed in theASICOM project), c-Si elements, and thermal collector elements. The c-Si andthermal collector elements are assumed to be comparable in standard to the ASICOMa-Si elements.Case 2: Translucent solar glazing elements are compared to a reference glazing of colored glass (of the same translucency). The solar glazing elements include a-Sielements (developed in the ASICOM project), and similar mosaic crystalline-Sielements.Case 3: Opaque solar cladding elements are compared to a reference of colored glasscladding. The solar cladding elements are: a-Si elements (developed in the ASICOM
project), crystalline silicon elements, and thermal collector elements.
9.5 Performance Prediction
Performance prediction with respect to environmental loading, comfort, economics,aesthetics and functionality was carried out by the team. For the PV systems, theenergy output was simply estimated based on the panel efficiency and yearlyinsolation on the facade, assuming grid-connected systems and electricity buy priceequal to the sell price. For the thermal collector systems, the F-CHART method
(Klein and Beckman, 1992) was used.
Performance Scales
Performance scales ranging from –1 to 2 were constructed for each of the criteria, asshown in the table below. The performances of the alternative facade claddings werethen measured on these scales. For example, a solar facade layout that is judged tohave “good” functionality (compared to the reference facade), is given a score of 1 onthis criterion. Similarly, if the building with the solar facade consumes 10% lessenergy than the reference building, it receives a score of 1 on the environmentalcriterion.
window
translucent a-Siopaque a-Si
case 1 case 2 case 3

8/13/2019 Multi Criteria Sun Calculation House
http://slidepdf.com/reader/full/multi-criteria-sun-calculation-house 191/246
185
Table 9-8. Performance scales for the criteria.
score: -1 0 1 2
comfort bad as reference (neutral) good very good
functionality bad as reference (neutral) good very good
aesthetics bad as reference (neutral) good very good
economy 10% increase inLCC
as reference (neutral) 10% reduction inthe LCC
20% reduction inLCC
environment 10% increase inenergy use
as reference (neutral) 10% reduction inthe energy use
20% reduction inthe energy use
The performance prediction for facade type 1 is given below.
The reference facade has natural stone cladding. This is replaced by solar panels onthe south facade. Figure 9-10 shows the layout of the facade of one office modulewith a cladding of solar panels. The active PV cell area / active solar collector area is5.57 m² per office module, which gives a total of 184 m2 for the south facade.
3060 mm
1 4 0 0 m m
CASE 1: MINIMUM WINDOW AREA
Opaque a-Si panel (920 x 310)
Window
Window area ~ 10% of net floor area (with room depth = 4.2 m)
7 0 0 m m
7 0 0 m m
2 8 0 0 m m ( f l o
o r t o c e i l i n g h
e i g h t )
1020 mm 1020 mm1020 mm
Figure 9-10. Office module facade layout, case 1.

8/13/2019 Multi Criteria Sun Calculation House
http://slidepdf.com/reader/full/multi-criteria-sun-calculation-house 192/246
186
Comfort
Changing the facade cladding will give no significant impact on the thermal or visualcomfort in the room. Therefore, a score of “neutral” (0) is assigned to all the
alternatives.
Aesthetics and Functionality
a-Si PV-facadeWith respect to scale and proportion the aesthetics of this facade is evaluated asnegative because the window area is limited and the possibilities for different designsof the facade are therefore also limited. The windows have to be located in similarpositions for every office, and this facade type will therefore always appear as asurface with small holes in it. With respect to integrity and coherence this facade is
also evaluated as negative. This facade type, with small holes in a large wall gives theimpression of being a heavy building. The reference case with stone facade elementstherefore has a more logical appearance. Seen from the inside of the room there willbe no difference between case 1 and the reference case. Both cases have cladding onan opaque wall and the appearance of the interior is evaluated as neutral. Theconclusion is that a-Si PV-facades used on case 1 scores "bad" (-1) on aesthetics.
The functionality (PR-value and flexibility) for this case is evaluated as positivealthough cases 2 and 3 fit better to the "green thinking and modern hi-techappearance" image than case 1. This image is important also for case 1. Flexibilityincludes technical flexibility, energy flexibility and the possibility of interior
flexibility. The technical flexibility is not as good for the PV-facades as for aconventional facade because of the complications of needed wiring. Interior flexibilityis neutral and energy flexibility is a little positive for buildings with PV. Theconclusion for PR-value and flexibility together is that case 1 scores "good" (+1) onfunctionality.
c-Si PV-facadeWith respect to the integrity of this type of "heavy facade" the metallic look of the c-Si elements is evaluated as a little better than the a-Si elements. The conclusion is thatc-Si PV-facades used on case 1 is not quite as attractive as the reference case andscores "bad to neutral" (–0.3).
The functionality is evaluated as a little better than "good to very good" (1.2) becauseof the hi-tech image of these elements.
Thermal collectorsThermal collectors will have an appearance that is very much similar to a-Si PV-elements and the appearance is evaluated as the same for these two facade types. Thescore is "bad" (-1) on aesthetics.
The technical flexibility of a building with ducts in the facade is not good. Energyflexibility for thermal heat is not very important for office buildings. The PR-value fora high quality solar collector is quite good, though. The conclusion for PR-value andflexibility together is that case 1 scores "bad" (-1) on functionality.
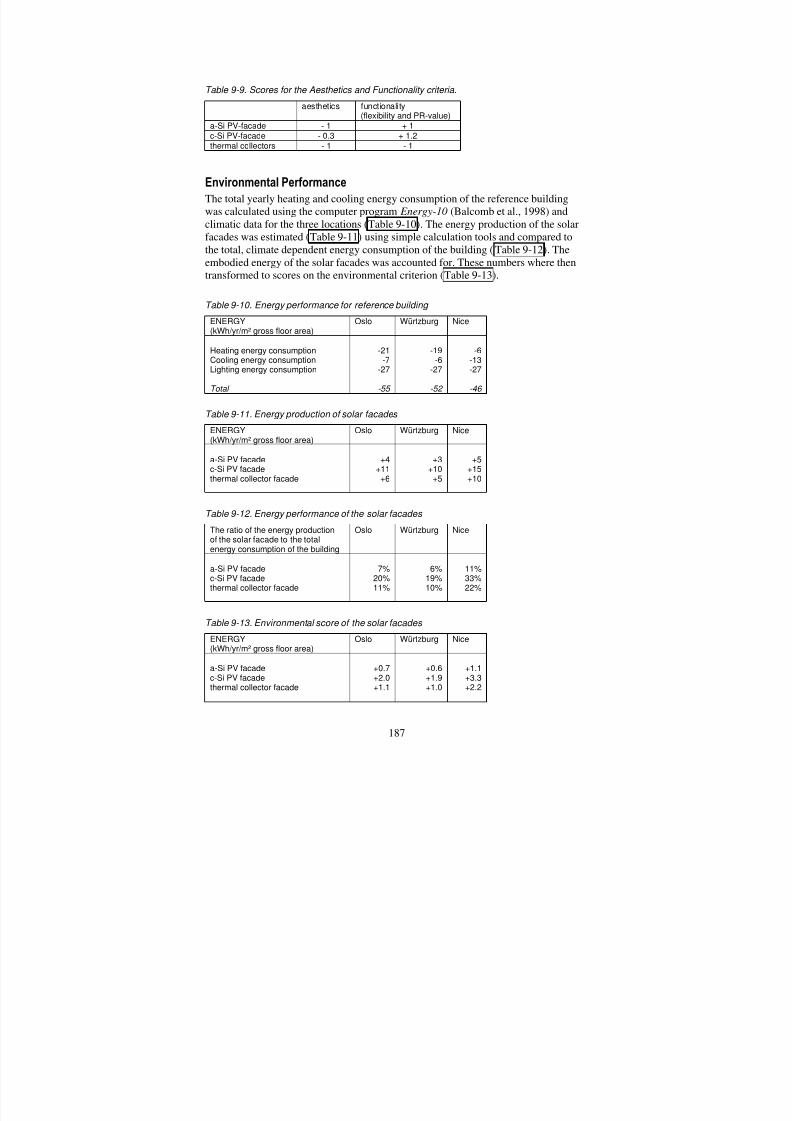
8/13/2019 Multi Criteria Sun Calculation House
http://slidepdf.com/reader/full/multi-criteria-sun-calculation-house 193/246
187
Table 9-9. Scores for the Aesthetics and Functionality criteria.
aesthetics functionality(flexibility and PR-value)
a-Si PV-facade - 1 + 1
c-Si PV-facade - 0.3 + 1.2thermal collectors - 1 - 1
Environmental Performance
The total yearly heating and cooling energy consumption of the reference buildingwas calculated using the computer program Energy-10 (Balcomb et al., 1998) andclimatic data for the three locations (Table 9-10). The energy production of the solarfacades was estimated (Table 9-11) using simple calculation tools and compared tothe total, climate dependent energy consumption of the building (Table 9-12). Theembodied energy of the solar facades was accounted for. These numbers where then
transformed to scores on the environmental criterion (Table 9-13).
Table 9-10. Energy performance for reference building
ENERGY(kWh/yr/m² gross floor area)
Oslo Würtzburg Nice
Heating energy consumptionCooling energy consumptionLighting energy consumption
Total
-21-7
-27
-55
-19-6
-27
-52
-6-13-27
-46
Table 9-11. Energy production of solar facades
ENERGY(kWh/yr/m² gross floor area)
Oslo Würtzburg Nice
a-Si PV facadec-Si PV facadethermal collector facade
+4+11
+6
+3+10
+5
+5+15+10
Table 9-12. Energy performance of the solar facades
The ratio of the energy productionof the solar facade to the total
energy consumption of the building
Oslo Würtzburg Nice
a-Si PV facadec-Si PV facadethermal collector facade
7%20%11%
6%19%10%
11%33%22%
Table 9-13. Environmental score of the solar facades
ENERGY(kWh/yr/m² gross floor area)
Oslo Würtzburg Nice
a-Si PV facadec-Si PV facade
thermal collector facade
+0.7+2.0
+1.1
+0.6+1.9
+1.0
+1.1+3.3
+2.2
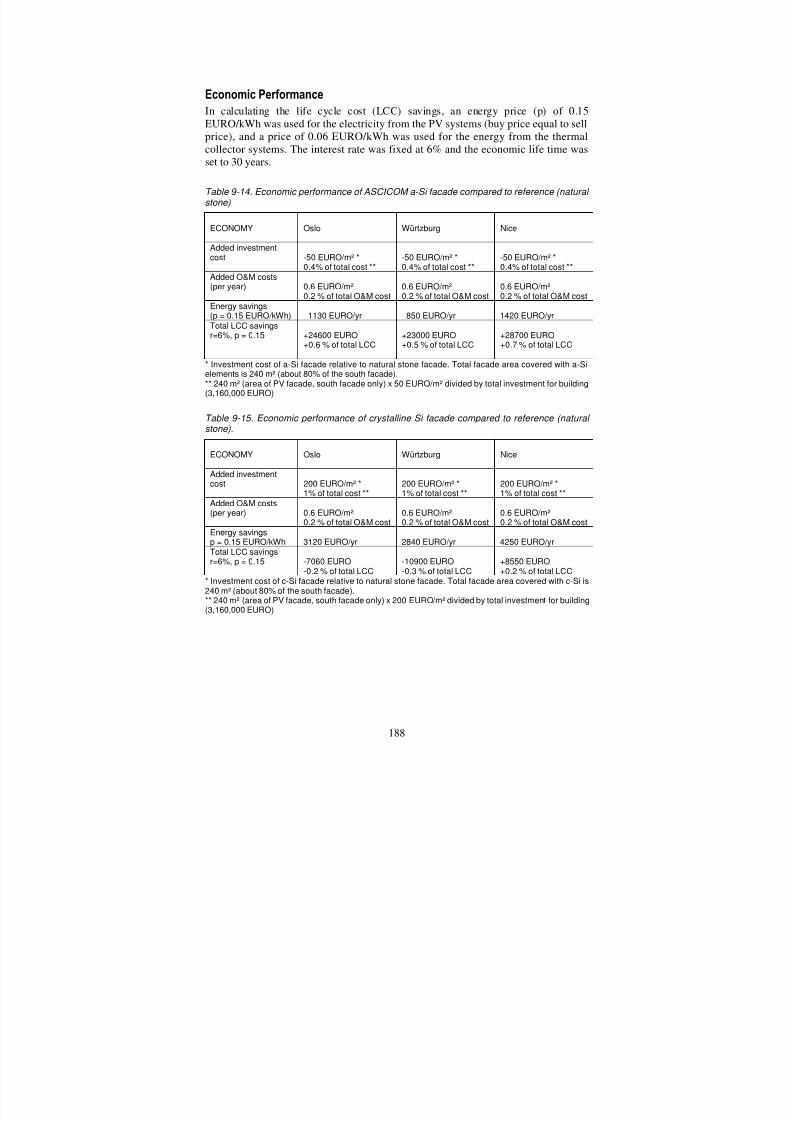
8/13/2019 Multi Criteria Sun Calculation House
http://slidepdf.com/reader/full/multi-criteria-sun-calculation-house 194/246
188
Economic Performance
In calculating the life cycle cost (LCC) savings, an energy price (p) of 0.15EURO/kWh was used for the electricity from the PV systems (buy price equal to sell
price), and a price of 0.06 EURO/kWh was used for the energy from the thermalcollector systems. The interest rate was fixed at 6% and the economic life time wasset to 30 years.
Table 9-14. Economic performance of ASCICOM a-Si facade compared to reference (natural stone)
ECONOMY Oslo Würtzburg Nice
Added investmentcost -50 EURO/m² *
0.4% of total cost **-50 EURO/m² *0.4% of total cost **
-50 EURO/m² *0.4% of total cost **
Added O&M costs(per year) 0.6 EURO/m²
0.2 % of total O&M cost0.6 EURO/m²0.2 % of total O&M cost
0.6 EURO/m²0.2 % of total O&M cost
Energy savings(p = 0.15 EURO/kWh) 1130 EURO/yr 850 EURO/yr 1420 EURO/yrTotal LCC savingsr=6%, p = 0.15 +24600 EURO
+0.6 % of total LCC+23000 EURO+0.5 % of total LCC
+28700 EURO+0.7 % of total LCC
* Investment cost of a-Si facade relative to natural stone facade. Total facade area covered with a-Sielements is 240 m² (about 80% of the south facade).** 240 m² (area of PV facade, south facade only) x 50 EURO/m² divided by total investment for building(3,160,000 EURO)
Table 9-15. Economic performance of crystalline Si facade compared to reference (natural stone).
ECONOMY Oslo Würtzburg Nice
Added investmentcost 200 EURO/m² *
1% of total cost **200 EURO/m² *1% of total cost **
200 EURO/m² *1% of total cost **
Added O&M costs(per year) 0.6 EURO/m²
0.2 % of total O&M cost0.6 EURO/m²0.2 % of total O&M cost
0.6 EURO/m²0.2 % of total O&M cost
Energy savingsp = 0.15 EURO/kWh 3120 EURO/yr 2840 EURO/yr 4250 EURO/yr
Total LCC savingsr=6%, p = 0.15 -7060 EURO
-0.2 % of total LCC-10900 EURO-0.3 % of total LCC
+8550 EURO+0.2 % of total LCC
* Investment cost of c-Si facade relative to natural stone facade. Total facade area covered with c-Si is240 m² (about 80% of the south facade).** 240 m² (area of PV facade, south facade only) x 200 EURO/m² divided by total investment for building(3,160,000 EURO)

8/13/2019 Multi Criteria Sun Calculation House
http://slidepdf.com/reader/full/multi-criteria-sun-calculation-house 195/246
189
Table 9-16. Economic performance of thermal collector facade compared to reference (natural stone)
ECONOMY Oslo Würtzburg Nice
Added investmentcost 250 EURO/m² *2% of total cost **
250 EURO/m² *2% of total cost **
250 EURO/m² *2% of total cost **
Added O&M costs(per year) 0.6 EURO/m²
0.2 % of total O&M cost0.6 EURO/m²0.2 % of total O&M cost
0.6 EURO/m²0.2 % of total O&M cost
Energy savingsp = 0.06 EURO/kWhp = 0.2 EURO/kWh
670 EURO/yr2200 EURO/yr
716 EURO/yr2400 EURO/yr
1100 EURO/yr3700 EURO/yr
Total LCC savingsr=6%, p = 0.06
r=6%, p = 0.2
-53000 EURO-1.2 % of total LCC-31000 EURO-0.7 % of total LCC
-52000 EURO-1.2 % of total LCC-29000 EURO-0.7 % of total LCC
-47000 EURO-1.1 % of total LCC-11000EURO-0.3 % of total LCC
* Investment cost of thermal collector facade (650 EURO/m²) relative to natural stone facade (400EURO/m²). Total facade area covered with thermal collector facade is 240 m² (about 80% of the southfacade). ** 240 m² (area of PV facade, south facade only) x 250 EURO/m² divided by total investmentfor building (3,160,000 EURO)
Table 9-17. Economic score of the solar facades
ENERGY(kWh/yr/m² gross floor area)
Oslo Würtzburg Nice
a-Si PV facadec-Si PV facadethermal collector facade
+0.06-0.02-0.12
+0.05-0.03-0.12
+0.07+0.02-0.11
Similar assessments were carried out for alternatives 2 and 3, see (Andresen, A. G.Lien et al. 1999) for a detailed description. The scores for the different alternativeswere presented in “star diagrams”. A star diagram show an overall picture of howwell the facades score on the different criteria (with equal weights on all criteria).The center of the star will represent the lowest point on the scale, i.e. the worst score(-1). Thus, the better the score, the more of the star will be filled, or shaded. Forexample, the reference building which has a score of "0" on all criteria, will have astar diagram as shown in Figure 9-11 (shaded area). A very good building will coverthe whole area of the star.
Only the star diagrams for the solar facades on buildings located in Oslo are shownhere, Figure 9-12.

8/13/2019 Multi Criteria Sun Calculation House
http://slidepdf.com/reader/full/multi-criteria-sun-calculation-house 196/246
190
Figure 9-11. Star diagram for the reference building.
Figure 9-12. Star diagrams showing the score for the different facade options for the office located in Oslo (the star diagram in the middle of the lower row is not shown because a thermal facade is not feasible for type 2 layout.
Based on the above star-diagrams, the following preliminary findings were stated:
• Case 1 with a c-Si facade scores the highest on the environmental criterion. This isbecause case 1 has a large area for energy production.
Reference
-10
1
2Functionality
Aesthetics
EconomicsEnvironment
Comfort

8/13/2019 Multi Criteria Sun Calculation House
http://slidepdf.com/reader/full/multi-criteria-sun-calculation-house 197/246
191
• The thermal facades have low scores on functionality. Case 2 and 3 score betteron the functionality criterion than case 1.
• Case 1 has a low score on aesthetics for all the solar facade options.
• There are almost no differences between the facade options with respect to theeconomic score.
9.6 Evaluation
The team weighted the criteria in two different ways:1. A direct ranking of the criteria starting with the most important criterion which
was given a weight of 1.0. The remaining criteria were assigned weights between0 and 1 according to their relative weights.
2. A ranking using a trade-off analysis as described in chapter 6 (Figure 6-20).
The two methods produced different outcomes, as illustrated in Figure 9-13.
Figure 9-13. Results of weightings. Direct weighting to the left, weighting through trade-off analysis to the right. The larger the size of the pie slice, the higher weight.
The scores on the different criteria were multiplied by the respective weights andadded into an overall score for each facade solution:
where i represent the criteria (environment, economics, comfort, aesthetics,functionality).
The overall scores for the two different weighting methods are shown in Figure 9-14.
i
i
i scoreweight S ×=

8/13/2019 Multi Criteria Sun Calculation House
http://slidepdf.com/reader/full/multi-criteria-sun-calculation-house 198/246
192
Figure 9-14. Total weighted scores. The bars to the left are based on the direct weighting method, the bars to the right are based on weighting through trade-off analysis.
Looking at the figure above and the star diagrams, the following preliminaryconclusions were drawn:
Case1: The c-Si PV facade receives the highest score. It has superior score on the
environmental and the aesthetic criteria.
Case 2: The a-Si PV facade receives the highest score, closely followed by the c-Sifacade. This is mainly because the a-Si facade scores better on aesthetics, which has arelatively high weight.
Case3: The c-Si PV facade receives the highest overall score, closely followed by thea-Si PV facade. This is because it scores better on the environmental criterion.
Overall: Case 2 with the a-Si facade receives the highest overall score. In general, thethermal collector facades do not compete because they score low on functionality.
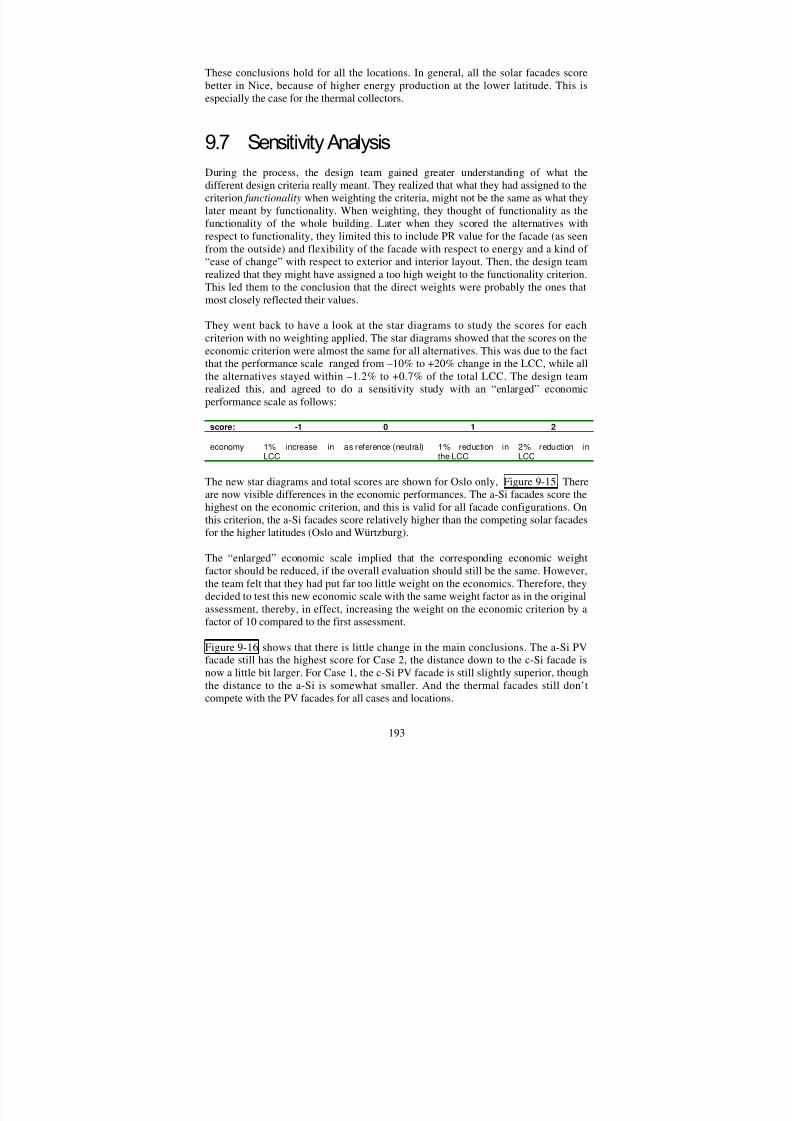
8/13/2019 Multi Criteria Sun Calculation House
http://slidepdf.com/reader/full/multi-criteria-sun-calculation-house 199/246
193
These conclusions hold for all the locations. In general, all the solar facades scorebetter in Nice, because of higher energy production at the lower latitude. This isespecially the case for the thermal collectors.
9.7 Sensitivity Analysis
During the process, the design team gained greater understanding of what thedifferent design criteria really meant. They realized that what they had assigned to thecriterion functionality when weighting the criteria, might not be the same as what theylater meant by functionality. When weighting, they thought of functionality as thefunctionality of the whole building. Later when they scored the alternatives withrespect to functionality, they limited this to include PR value for the facade (as seenfrom the outside) and flexibility of the facade with respect to energy and a kind of “ease of change” with respect to exterior and interior layout. Then, the design team
realized that they might have assigned a too high weight to the functionality criterion.This led them to the conclusion that the direct weights were probably the ones thatmost closely reflected their values.
They went back to have a look at the star diagrams to study the scores for eachcriterion with no weighting applied. The star diagrams showed that the scores on theeconomic criterion were almost the same for all alternatives. This was due to the factthat the performance scale ranged from –10% to +20% change in the LCC, while allthe alternatives stayed within –1.2% to +0.7% of the total LCC. The design teamrealized this, and agreed to do a sensitivity study with an “enlarged” economicperformance scale as follows:
score: -1 0 1 2
economy 1% increase inLCC
as reference (neutral) 1% reduction inthe LCC
2% reduction inLCC
The new star diagrams and total scores are shown for Oslo only, Figure 9-15. Thereare now visible differences in the economic performances. The a-Si facades score thehighest on the economic criterion, and this is valid for all facade configurations. Onthis criterion, the a-Si facades score relatively higher than the competing solar facadesfor the higher latitudes (Oslo and Würtzburg).
The “enlarged” economic scale implied that the corresponding economic weightfactor should be reduced, if the overall evaluation should still be the same. However,the team felt that they had put far too little weight on the economics. Therefore, theydecided to test this new economic scale with the same weight factor as in the originalassessment, thereby, in effect, increasing the weight on the economic criterion by afactor of 10 compared to the first assessment.
Figure 9-16 shows that there is little change in the main conclusions. The a-Si PVfacade still has the highest score for Case 2, the distance down to the c-Si facade isnow a little bit larger. For Case 1, the c-Si PV facade is still slightly superior, though
the distance to the a-Si is somewhat smaller. And the thermal facades still don’tcompete with the PV facades for all cases and locations.

8/13/2019 Multi Criteria Sun Calculation House
http://slidepdf.com/reader/full/multi-criteria-sun-calculation-house 200/246
194
Figure 9-15. Star diagrams for the solar facades located in Oslo, “enlarged” economic scale.
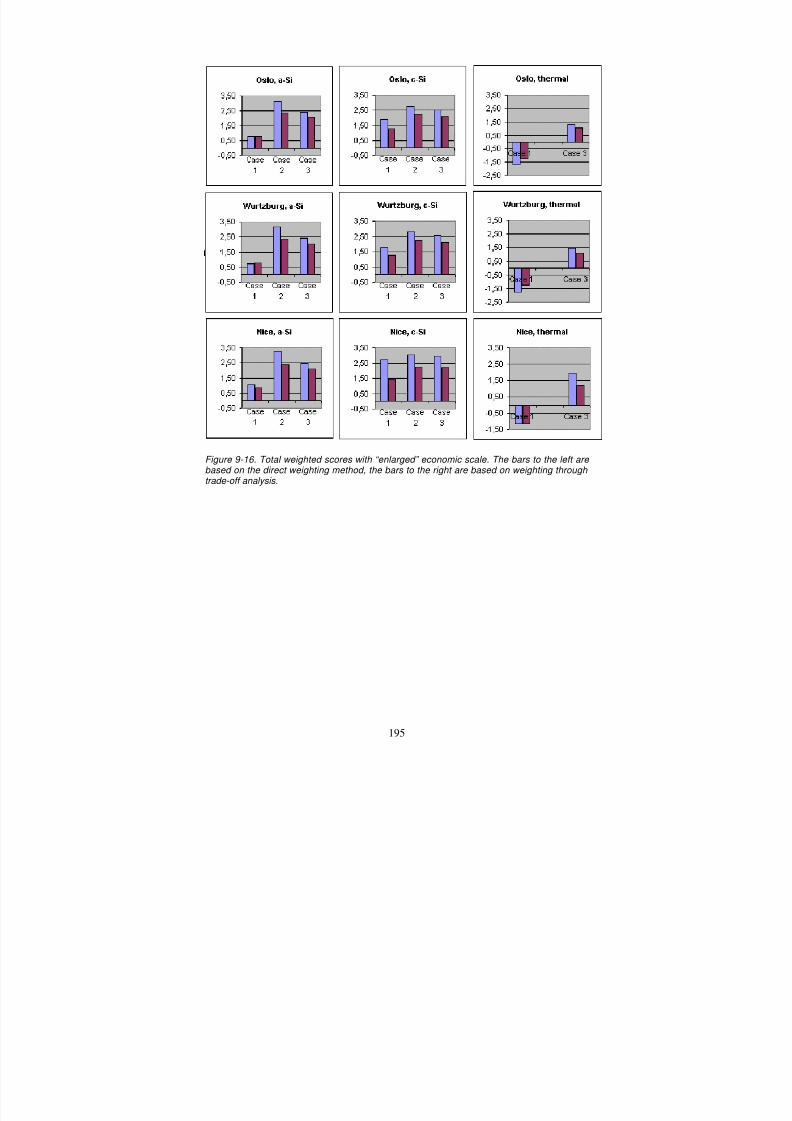
8/13/2019 Multi Criteria Sun Calculation House
http://slidepdf.com/reader/full/multi-criteria-sun-calculation-house 201/246
195
Figure 9-16. Total weighted scores with “enlarged” economic scale. The bars to the left are based on the direct weighting method, the bars to the right are based on weighting through trade-off analysis.

8/13/2019 Multi Criteria Sun Calculation House
http://slidepdf.com/reader/full/multi-criteria-sun-calculation-house 202/246
196
9.8 Lessons Learned
The design team found that the hierarchical way of structuring the criteria was auseful tool to help see the whole picture, while at the same time focusing on what is
most important. It was also helpful in finding the right level of detail in which to dothe evaluations of the criteria (i.e. the balance between criteria).
The team had some problems finding appropriate scales for the criteria. The economicscale was first chosen so wide that it did not discriminate between the alternatives.The reason for this might be that it is hard to generalize economics, and thus the teamhad problems finding a generic value system for this criterion.
The star diagrams were found to be valuable in comparing individual attributeperformances across alternatives. However, the team realized that they could not beused to compare overall performances unless the weights were equal.
The team had some trouble determining the proper weights. This was due to the factthat they were to express preferences of a “generic solar building market”. This was just based on the experience or “gut feeling” of the team members. A market surveymight have made the task less ambiguous. The team also felt the need for a formalizedand simple way of connecting the weights to the scales.
In general, the team felt that the approach was a useful way to document theconclusions of the evaluations. Even though they had some a priori feeling about whatsolutions would be more feasible, they felt more comfortable that the best solutionwas found when using this structured approach. They also found that the method
brought up interesting discussions about issues that might otherwise have beenoverlooked. Furthermore, the team members felt that they had gained a deeperunderstanding of each other’s fields of expertise, e.g. the architect learned more aboutenergy engineering issues, and the energy engineer learned more about architecture.

8/13/2019 Multi Criteria Sun Calculation House
http://slidepdf.com/reader/full/multi-criteria-sun-calculation-house 203/246
197
10 Case 2
10.1 Introduction
This case was a test of the (preliminary) MCDM approach that was conducted duringa meeting in Oslo, June 24, 1999 (09:30-15:30). The test was partly theoretical andpartly practical. It was practical in that it was conducted on a real building projectthat the architect (Per Monsen) was currently working on. It was theoretical in that the
other members of the test group were playing the roles of the “real” members of thedesign team.
The design team consisted of the following:
• Anne Grete Hestnes, Professor at the Department of Building Technology,Norwegian University of Science and Technology, Trondheim. Playing the role of the representative of the client.
• Per Monsen, architect with GASA Architectural Office A/S , Oslo. The architect of the building project.
• Ida Bryn, HVAC engineer at the HVAC consultant Erichsen and Horgen A/S ,Oslo. Playing the role of the HVAC engineer of the project.
• Inger Andresen, Ph.D. student at the Department of Building Technology,Norwegian University of Science and Technology, Trondheim. Process leader.
10.2 The Process
The process leader suggested a 7- step procedure for the test:
1. Presentation of the case project by the architect.2. Description, structuring, and selection of design objectives (criteria), including apreliminary weighting.
3. Generation of alternative solutions.4. Performance prediction.5. Weighting of criteria.6. Aggregation.7. Sensitivity analysis.
This procedure was accepted.

8/13/2019 Multi Criteria Sun Calculation House
http://slidepdf.com/reader/full/multi-criteria-sun-calculation-house 204/246
198
1. Presentation of the case project.Per Monsen presented the case project. The project is a school located at SøndreNordstrand, near Oslo. At the time of the meeting, the schematic design had beencarried out. The building has a net floor area of 10000 m². Floor plans and sectionsare shown in Figures 10-1 to 10-3.
Figure 10-1. Vertical cross-section.
Figure 10-2. Horizontal cross-section showing the 3rd floor.

8/13/2019 Multi Criteria Sun Calculation House
http://slidepdf.com/reader/full/multi-criteria-sun-calculation-house 205/246
199
Figure 10-3. Facades facing north-east (top) and south-west (bottom).
The proposed schematic design was chosen as the reference case for the MCDM test.
This building is specified according to the current building code, and has no specialsolar or low-energy features.
The building has been partially integrated into the steep hill to reduce the facade areaand to avoid overheating problems. The main facade is facing north-east. This allowsfor good daylight conditions while reducing overheating and glare problems due todirect solar insolation. Daylight may also enter into the corridors and group rooms atthe 1st and 2nd floors through the north facing windows at the 3 rd floor (Figure 10-1).The school is designed to meet the new educational specifications in Norway; the 60m² classrooms are connected to the 30 m² group rooms. Wardrobes are located in thegroup rooms.
There are 4 ventilation rooms, each serving the accompanying section of the building.This allows for only vertical ductwork through the four vertical shafts, 5 stories high.
2. Description, structuring and selection of design objectives (criteria)The design team discussed the criteria proposed for IEA Task 23 (Table 10-1). Theydecided to use only the total life cycle cost as the economic criterion, instead of splitting it into construction, operating and maintenance costs. For resource use, theydecided only to include electricity and fuel consumption, and disregard the other sub-criteria. This was because data on water, land and materials consumption was
impossible to obtain during their limited time. The team also decided to drop theEnvironmental Loading criterion. Since the gas emissions listed below this criterionare mainly connected to energy use, they argued that this could be accounted for inthe Resource Use criterion. For the remaining criteria (Architectural Quality, IndoorQuality, and Functionality), they decided to keep them as proposed by Task 23. Thedesign team concluded that in this way, the most important criteria had been included.

8/13/2019 Multi Criteria Sun Calculation House
http://slidepdf.com/reader/full/multi-criteria-sun-calculation-house 206/246
200
Table 10-1. The IEA Task 23 Criteria.
3. Generation of alternative solutionsA quick brainstorming session was carried out to generate possible strategies forsolar/energy savings. The different strategies were grouped together into 5 maindesign schemes:
Reference case: Energy supply from district heating and distribution by radiators Alternative 1: Energy supply from ground coupled heat pump and distribution byradiators
Alternative 2: Local electric radiators + well insulated windows Alternative 3: Utilization of daylight in classrooms and group rooms. Increased floorto-ceiling height, elevation of windows, light reflecting surfaces. Alternative 4: Natural/hybrid ventilation through the use of the shafts and stairwaysfor exhaust air/solar chimneys. Alternative 5: Photovoltaics (crystalline silicon) cladding on south part of ventilationtowers (total 50 m²).
4. Performance predictionThe team did a performance prediction of the different solutions with respect to thedifferent criteria. The predictions were based on experience, rules of thumb, andexpert judgement. For the Life-Cycle Cost and the Resource Use criteria, theperformances were expressed in terms of % change compared to the reference case.
Criteria Sub-criteria
Life-Cycle Cost Added construction cost
Annual operating cost *
Annual maintainance costResource Use Annual electricity *
Annual fuel *
Annual water
Construction materials
Land
CO2 emissions from construction
SO2 Emissions from construction
NOX emissions from construction
Annual CO2 emissions from operation *
Annual SO2 emissions from operation *
Annual NOX emissions from operation *
Identity
Scale / Proportion
Integrity / Coherence
Integration in urban context
Indoor Quality Air quality
Lighting quality
Thermal quality
Acoustic quality
Functionality
Flexibility
Maintainability
Public relations value
Architectural
Quality
Functionality
Environmental
Loading
8/13/2019 Multi Criteria Sun Calculation House
http://slidepdf.com/reader/full/multi-criteria-sun-calculation-house 207/246
201
The reference case received a score of 100% on all criteria. Thus, if one alternativeperformed 10% better than the reference case on a specific criterion, the alternativereceived a score of 90% (smaller is better). For the Architectural Quality, IndoorQuality, and Functionality, the proposed scale 0-10 (bigger is better, 5 is typical) wasused.
The team briefly discussed these scales. They were not sure whether they were themost appropriate scales to use. Anyway, they decided to have a go with the proposedTask 23 scales.
The performance prediction was done using estimations based on rules of thumb andthe experience and knowledge of the team members. The only tool was a calculator;no computer simulations were carried out. Some of the predictions were subject tolong discussions, especially the ones related to economics, while others were settledquickly and with confidence.
Due to time limitations, alternative 5 (photovoltaics) was not included in this firstround.
The results of the scorings were entered into to the Evaluation Worksheet. Stardiagrams were produced, shown in Figure 10-4. Looking at the star diagrams, thedesign team realized that they might not have used the scales correctly. There werealmost no distinctions between the scores for the different alternatives. The teamdecided to proceed with the weighting, and return to investigate the scaling problemin more detail after that.
Figure 10-4. Star diagrams.

8/13/2019 Multi Criteria Sun Calculation House
http://slidepdf.com/reader/full/multi-criteria-sun-calculation-house 208/246
202
5. Weighting of criteriaThe criteria and sub-criteria were weighted directly on a scale from 0 to 1 (bigger isbetter). The weights were produced through an open discussion among the teammembers where everybody except the process leader voiced his/her opinion and an
agreement was reached. The main criteria were weighted first, then the sub-criteria.The result was as follows:
Table 10-2. Result of criteria weighting.
Criteria Criteriaweights
Sub-criteria Sub-criteriaweights
Life Cycle-Cost 0.8
Annual electricity 1.0Resource Use &Environmentalloading
0.8Annual fuel 0.5
Identity 1Scale/Proportion 1Integrity/Coherence 1
ArchitecturalQuality
0.8
Integration in urbancontext
1
Air quality 0.8Lighting quality 0.8
Thermal quality 1
Indoor Quality 1
Acoustic quality 0.8Functionality 1Flexibility 0.9
Maintainability 0.9
Functionality 1
Public relations value 0.5

8/13/2019 Multi Criteria Sun Calculation House
http://slidepdf.com/reader/full/multi-criteria-sun-calculation-house 209/246
203
6. AggregationMultiplying the scores on each criterion with the weights (performed by theevaluation worksheet), produced the following results:
Table 10-3. Total weighted scores on a scale from 0 to 10, where bigger is better and
reference is 5.
Design scheme Total weighted
score
Reference case: Energy supply from districtheating and distribution by radiators Alternative 1: Energy supply from groundcoupled heat pump and distribution by radiators Alternative 2: Local electric radiators + wellinsulated windows
Alternative 3: Utilization of daylight in classrooms and group rooms. Alternative 4: Natural/hybrid ventilation throughthe use of the shafts and stairways as for exhaustair/solar chimneys.
5.00
5.12
5.11
5.34
5.09
Thus, alternative 3 (daylight) seems to be the best scheme, while alternative 1, 2 and 4get approximately equal values. However, the relative improvements in scorescompared to the reference case are small. The best score is only 7% higher than thereference score.
7. Sensitivity analysisThis was not carried out due to time restrictions.
10.3 Lessons learned
The process of scoring the quantitative criteria was quite straight forward, because itwas possible to calculate hard numbers for performances of the design schemes (i.e.energy consumption) and compare them to the reference case. However, the pre-determined scales did not turn out to be well suited for all the criteria. Only the
middle of the scales were used, so the differences between the alternatives were small.To be able to better see the differences between the alternatives, the scales shouldhave been smaller.
In scoring the quantitative criteria first, a basis for scoring the qualitative ones wasestablished. In this way, the qualitative scales were implicitly linked to thequantitative ones. However, the relationships between the scales and the weights werenot totally clear.
All the team members felt quite comfortable with using this kind of methodology, andthe process went smoothly and without major difficulties. The participants especially
felt it was a good way to structure the design work, thus making it more efficient.However, this positive reception may be due to the fact that all the participants had

8/13/2019 Multi Criteria Sun Calculation House
http://slidepdf.com/reader/full/multi-criteria-sun-calculation-house 210/246
204
some experience with similar methods. Still, the team felt that they did not haveenough information or accurate data so that they were able to predict all performanceswith certainty. In particular, they felt the need for more information about costs.
The team members found the exercise interesting, useful, and fun. Since they did not
have the time to complete the exercise, they would like to try it again at anothermeeting. At this next meeting, the team would go on to investigate combinations of the alternative schemes.
However, the actual building project went so fast that there was no time for anothermeeting.

8/13/2019 Multi Criteria Sun Calculation House
http://slidepdf.com/reader/full/multi-criteria-sun-calculation-house 211/246
205
11 Case 3
11.1 Introduction
This case was a test of the MCDM approach that was conducted during thepreliminary design phase for the construction of a new administration building for theNorwegian State Railways (NSB) in Oslo.
The organization of the design project is illustrated in Figure 11-1.
Figure 11-1. Design project organization.
The MCDM approach was introduced into the project in the late part of thepreliminary design. Design criteria had been formulated, and a design concept hadbeen proposed. Still, many factors concerning the energy system had not yet beenevaluated or decided. The overall goals of the project were to develop a profitablebuilding that should give a “positive impression to the public” and be a “benefit to thelocal environment”. Internally, the building should aim at “improving the well-being
Steering committee
Project responsible
Project leader
Design group leader
Project board
Users
StaffOrganization and developmentHVAC/Facilities management
Electrical/ITEconomy/ContractsEnergy/Environment
Architecture HVAC Electrical Geotechnical BuildingPhysics Traffic Fire

8/13/2019 Multi Criteria Sun Calculation House
http://slidepdf.com/reader/full/multi-criteria-sun-calculation-house 212/246
206
and production efficiency of the employees”. The overall design criteria may beformulated as follows:
• safety
• environment
• functionality• aesthetics
• cost effectiveness
The safety specifications were given as compliance to codes and standards.Environmental issues included energy use, pollution control, minimization of solidwaste, and indoor environment, see Figure 11-2. With respect to functionality, thefollowing key issues were stressed:
• flexibility (dynamics, future oriented)
• effective use of space (openness, communication, cooperation)• maintainability
Figure 11-2. Structure of the criteria regarding environment.
The preliminary design at the time of the evaluation is shown in Figures 11-3 to 11-5.The building has a net floor area of approximately 25000 m2 and includes 7 stories. Itis set in a typical urban environment, surrounded by buildings of about the sameheight. The interior atrium has an exterior facade facing south.
Environment
Pollution
• emissions to
water, ground,and air
• noise
Solid waste Indoorenvironment
• thermal comfort• visual comfort
• air quality• noise
Energy andpower

8/13/2019 Multi Criteria Sun Calculation House
http://slidepdf.com/reader/full/multi-criteria-sun-calculation-house 213/246
207
Figure 11-3. Floor plan (6 th
floor).
Figure 11-4. Section.
8/13/2019 Multi Criteria Sun Calculation House
http://slidepdf.com/reader/full/multi-criteria-sun-calculation-house 214/246
208
Figure 11-5. South facing facade.
11.2 The Process
The MCDM-approach was introduced to the design team and two members of thestaff (responsible for HVAC/facilities management and energy/environment) at ameeting. The group found the approach interesting, and agreed to test it in their designwork. They decided to do an evaluation of 4 alternative designs of the atrium, asfollows:
Alternative 1: Double construction in the roof and facade of the atrium. Minimum air
temperature in the atrium is 20°C. Alternative 2: Single construction in the roof and facade of the atrium. Minimum air
temperature in the atrium is 10°C. Alternative 3: Single construction in the roof and double construction in the facade of
the atrium. Minimum air temperature in the atrium is 10°C. Alternative 4: Single construction in the roof and double construction in the facade of
the atrium. Minimum air temperature in the atrium is 20°C.
The single construction is a double glazing with low-E coating. The doubleconstruction has an outer double glazing with low-E coating and a single inner
glazing with low-E coating. The distance between the outer and inner glazing isapproximately 1.0 m. This space is used for ventilation air which may filtered andheated as needed.
For the evaluation of the alternative atrium constructions, the following criteria werechosen to be most relevant:
• Environment:- energy consumption- thermal comfort- daylight availability
• Functionality• Flexibility

8/13/2019 Multi Criteria Sun Calculation House
http://slidepdf.com/reader/full/multi-criteria-sun-calculation-house 215/246
209
• Aesthetics
• Cost effectiveness
Safety was not included because all alternatives were presumed to satisfy the safetyrequirements. Power consumption was not included in the environment because it was
included in the cost effectiveness criterion. Also, pollution, solid waste and noisewere not included in the environmental criterion because they were not considered tomake significant differences for the alternative atrium constructions. Flexibility wasdefined to be “how easily the space could be changed to accommodate other, futureuses”. This might be a part of the functionality criterion, but it was kept separatebecause it was considered to be important enough to warrant this. The measurementscales were constructed as geometric preference scales based on Lootsma’s theories.Table 11-1 shows an overview of the scales that were used for the different criteria.The relative scale was also used for the criteria weighting.
Table 11-1. Measurement scales (a progression factor of 2 was used for the energy and cost scales).
Absolute scale Relative scale Energy-consumption*(kWh/m
2/year)
Life CycleCosts**
(NOK/year)
Thermal comfortAesthetics
FunctionalityFlexibilityDaylight
10 – Excellent 10 – Preferred 110 Kmin 10 – Excellent / Preferred
9 9 112 Kmin + 15.000 9
8 – Good 8 – Somewhatless preferred
115 Kmin + 50.000 8 – Good / Somewhatless preferred
7 7 120 Kmin + 100.000 7
6 – Fair 6 – Lesspreferred
130 Kmin + 250.000 6 – Fair / Less preferred
5 5 160 Kmin + 500.000 5
4 – Min.acceptable
4 – Much lesspreferred
200 Kmin + 1.000.000 4 – Min. acceptable / Much less preferred
*This scale is based on a goal for energy consumption of 75% of the norm for cost effective low energy buildings (which results in a goal of 110 kWh/m
2 /year). The maximum acceptable
energy consumption was set to 75% of the average energy consumption for existing office buildings.**The cost scale is based on the cheapest alternative being the most preferred. This alternative has a life cycle cost of K
min . The lowest score (minimum acceptable) was defined
to a cost of K min + 1.000.000 NOK/year.
The energy consumption of the building was calculated by the HVAC engineer usingcomputer simulations and rules of thumb. The results are given in Table 11-2.

8/13/2019 Multi Criteria Sun Calculation House
http://slidepdf.com/reader/full/multi-criteria-sun-calculation-house 216/246
210
Table 11-2. Specifications of Energy scores.
Absolute scale Relative scale Energyconsumption(kWh/m
2/year)
Ranking ofalternatives
10 – Excellent 10 – Preferred 110
9 9 1128 - Good 8 – Somewhat lesspreferred
115 Alternative 3 (115)
7 7 120 Alternative 2 (120)6 – Fair 6 – Less preferred 130
5 5 160 Alternative 1 (150)Alternative 4 (170)
4 – Min. acceptable 4 – Much less preferred 200
The cost estimations were carried out by the HVAC engineer, assisted by a sub-contractor specializing in cost assessment. Details of the cost estimations are given inFigure 11-6. The resulting life cycle costs are illustrated in Figure 11-7.
Alternative 1: Double facade and double roof construction, T min = 20°°°°C
Extra glass in facade: + 1800 m2⋅ 3200 NOK/m
2= 5.760.000 NOK
Extra glass in roof: + 900 m2⋅ 2600 NOK/m
2= 2.340.000 NOK
No in-glazing*: - 4.200.000 NOKNo extra ventilation: - 300.000 NOKLess cleaning: - 75.000 NOK/yearHigher energy consumption: + 150.000 NOK/year
Alternative 3: Double facade and single roof construction, T min = 10°°°°C
Extra glass in facade: + 1800 m2⋅ 3200 NOK/m
2= 5.760.000 NOK
Less cleaning: - 60.000 NOK/yearLess energy consumption: - 25.000 NOK/year
Alternative 4: Double facade and single roof construction, T min = 20°°°°C:
Extra glass in facade: + 1800 m2 ⋅ 3200 NOK/m2 = 5.760.000 NOKNo in-glazing*: - 4.200.000 NOKNo extra ventilation: - 300.000 NOKExtra radiative heating: + 450.000 NOKExtra floor heating: + 75.000 NOKLess cleaning: - 60.000 NOK/yearHigher energy consumption: + 200.000 NOK/year
Figure 11-6. Cost data (relative to alternative 2: Single facade and single roof construction,T min = 10 ° C ) used in the estimation of life cycle costs. *In-glazing means that some of the interior zones within the atrium are glazed in when the atrium temperature, T min = 10 ° C (i.e.
reception, some offices and meeting rooms, café, and library).
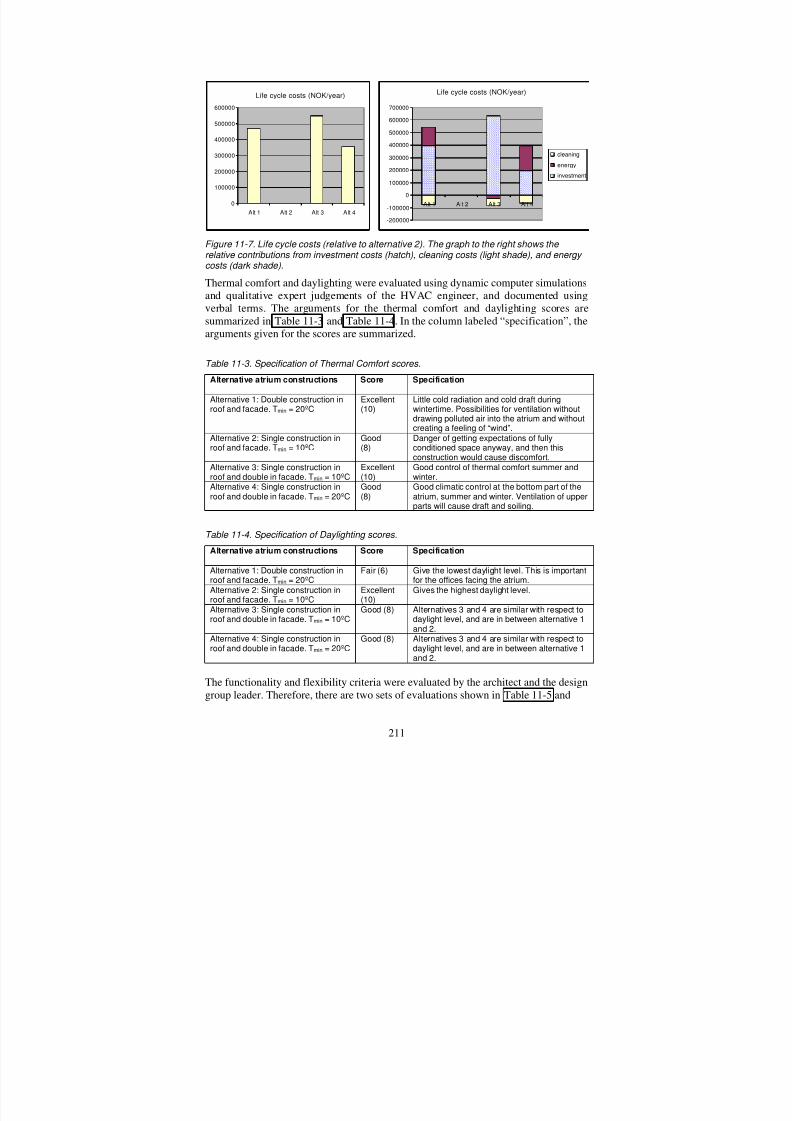
8/13/2019 Multi Criteria Sun Calculation House
http://slidepdf.com/reader/full/multi-criteria-sun-calculation-house 217/246
211
Life cycle costs (NOK/year)
0
100000
200000
300000
400000
500000
600000
Alt 1 Alt 2 Alt 3 Alt 4
Life cycle costs (NOK/year)
-200000
-100000
0
100000
200000
300000
400000
500000
600000
700000
Alt 1 Alt 2 Alt 3 Alt 4
cleaning
energy
investment
Figure 11-7. Life cycle costs (relative to alternative 2). The graph to the right shows the relative contributions from investment costs (hatch), cleaning costs (light shade), and energy costs (dark shade).
Thermal comfort and daylighting were evaluated using dynamic computer simulationsand qualitative expert judgements of the HVAC engineer, and documented usingverbal terms. The arguments for the thermal comfort and daylighting scores aresummarized in Table 11-3 and Table 11-4. In the column labeled “specification”, thearguments given for the scores are summarized.
Table 11-3. Specification of Thermal Comfort scores.
Alternative atrium constructions Score Specification
Alternative 1: Double construction in
roof and facade. Tmin = 20ºC
Excellent
(10)
Little cold radiation and cold draft during
wintertime. Possibilities for ventilation withoutdrawing polluted air into the atrium and withoutcreating a feeling of “wind”.
Alternative 2: Single construction inroof and facade. Tmin = 10ºC
Good(8)
Danger of getting expectations of fullyconditioned space anyway, and then thisconstruction would cause discomfort.
Alternative 3: Single construction inroof and double in facade. Tmin = 10ºC
Excellent(10)
Good control of thermal comfort summer andwinter.
Alternative 4: Single construction inroof and double in facade. Tmin = 20ºC
Good(8)
Good climatic control at the bottom part of theatrium, summer and winter. Ventilation of upperparts will cause draft and soiling.
Table 11-4. Specification of Daylighting scores.
Alternative atrium constructions Score Specification
Alternative 1: Double construction inroof and facade. Tmin = 20ºC
Fair (6) Give the lowest daylight level. This is importantfor the offices facing the atrium.
Alternative 2: Single construction inroof and facade. Tmin = 10ºC
Excellent(10)
Gives the highest daylight level.
Alternative 3: Single construction inroof and double in facade. Tmin = 10ºC
Good (8) Alternatives 3 and 4 are similar with respect todaylight level, and are in between alternative 1and 2.
Alternative 4: Single construction inroof and double in facade. Tmin = 20ºC
Good (8) Alternatives 3 and 4 are similar with respect todaylight level, and are in between alternative 1and 2.
The functionality and flexibility criteria were evaluated by the architect and the designgroup leader. Therefore, there are two sets of evaluations shown in Table 11-5 and

8/13/2019 Multi Criteria Sun Calculation House
http://slidepdf.com/reader/full/multi-criteria-sun-calculation-house 218/246
212
Table 11-6. Aesthetics was evaluated by the architect only, shown inTable 11-7.
Table 11-5. Specification of Functionality scores.
Alternative atrium constructions Score Specification
Alternative 1: Double construction inroof and facade. Tmin = 20ºC
Excellent(10)
Excellent !
(9)
There is no need for extra efforts forheating/cooling the cafeteria.
Takes up space.
Alternative 2: Single construction inroof and facade. Tmin = 10ºC
Fair (6)
Fair (6)
Local efforts needed to make the cafeteriaacceptable. The meeting rooms next to theatrium cannot be used in parts of the year.Large cleaning needs.
More limitations with respect to places to sit.Alternative 3: Single construction inroof and double in facade. Tmin = 10ºC
Fair/Good(7)
Good (8)
Some efforts needed to make the cafeteriaenvironment acceptable. Similarly for meeting
rooms at walking bridges. Large cleaningneeds.
Less cold surfaces than for alternative 2, thusless limitations with respect to places to sit.
Alternative 4: Single construction inroof and double in facade. Tmin = 20ºC
Fair ! (5)
Excellent/ Good (9)
Too high energy consumption.
Table 11-6. Specification of Flexibility scores.
Alternative atrium constructions Score Specification
Alternative 1: Double construction inroof and facade. Tmin = 20ºC
Excellent(10)
Excellent(10)
May be used for public meetings, concerts,etc. and shopping mall.
Alternative 2: Single construction inroof and facade. Tmin = 10ºC
Fair ! (5)
Fair + (7)
Limitations on usage parts of the year.
More limitations on places to sit.Alternative 3: Single construction inroof and double in facade. Tmin = 10ºC
Fair/Good(7)
Good (8)
Some limitations on usage parts of the year.
Less cold surfaces than for alternative 2,therefore less limitations on places to sit.
Alternative 4: Single construction inroof and double in facade. Tmin = 20ºC
Excellent(10)
Excellent !
(9)
Table 11-7. Specification of Aesthetics scores.
Alternative atrium constructions Score Specification
Alternative 1: Double construction inroof and facade. Tmin = 20ºC
Fair (6) Bulky construction. More mullions, fasteningdevices, etc.
Alternative 2: Single construction inroof and facade. Tmin = 10ºC
Excellent !
(9)Slim construction – as simple as possible.
Alternative 3: Single construction in
roof and double in facade. Tmin = 10ºC
Good ! (7)
Alternative 4: Single construction inroof and double in facade. Tmin = 20ºC
Good ! (7)
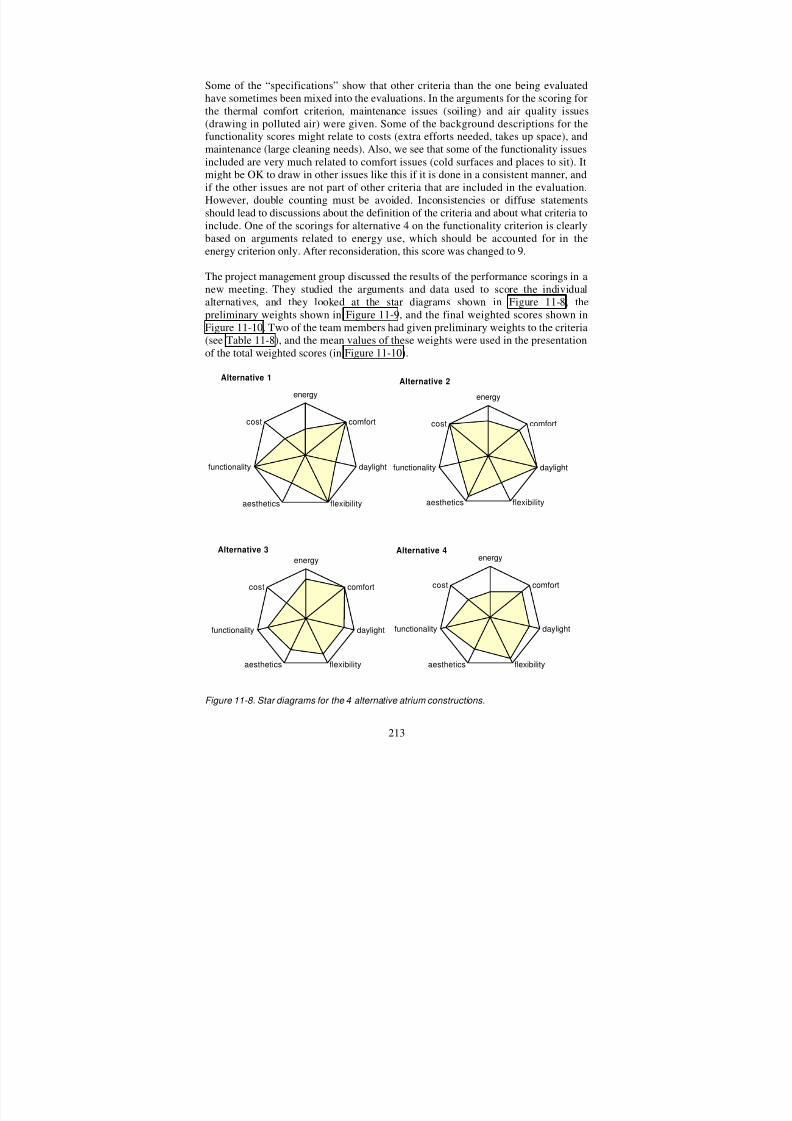
8/13/2019 Multi Criteria Sun Calculation House
http://slidepdf.com/reader/full/multi-criteria-sun-calculation-house 219/246
213
Some of the “specifications” show that other criteria than the one being evaluatedhave sometimes been mixed into the evaluations. In the arguments for the scoring forthe thermal comfort criterion, maintenance issues (soiling) and air quality issues(drawing in polluted air) were given. Some of the background descriptions for the
functionality scores might relate to costs (extra efforts needed, takes up space), andmaintenance (large cleaning needs). Also, we see that some of the functionality issuesincluded are very much related to comfort issues (cold surfaces and places to sit). Itmight be OK to draw in other issues like this if it is done in a consistent manner, andif the other issues are not part of other criteria that are included in the evaluation.However, double counting must be avoided. Inconsistencies or diffuse statementsshould lead to discussions about the definition of the criteria and about what criteria toinclude. One of the scorings for alternative 4 on the functionality criterion is clearlybased on arguments related to energy use, which should be accounted for in theenergy criterion only. After reconsideration, this score was changed to 9.
The project management group discussed the results of the performance scorings in anew meeting. They studied the arguments and data used to score the individualalternatives, and they looked at the star diagrams shown in Figure 11-8, thepreliminary weights shown in Figure 11-9, and the final weighted scores shown inFigure 11-10. Two of the team members had given preliminary weights to the criteria(see Table 11-8), and the mean values of these weights were used in the presentationof the total weighted scores (in Figure 11-10).
energy
comfort
daylight
flexibilityaesthetics
functionality
cost
energy
comfort
daylight
flexibilityaesthetics
functionality
cost
energy
comfort
daylight
flexibilityaesthetics
functionality
cost
Alternative 1
Alternative 3
Alternative 2
energy
comfort
daylight
flexibilityaesthetics
functionality
cost
Alternative 4
Figure 11-8. Star diagrams for the 4 alternative atrium constructions.

8/13/2019 Multi Criteria Sun Calculation House
http://slidepdf.com/reader/full/multi-criteria-sun-calculation-house 220/246
214
Table 11-8. Preliminary criteria weighting given by two of the staff members.
Relative scale Preliminary weighting,staff #1
Preliminary weighting,staff #2
10 – Preferred Cost effectiveness Thermal comfort,Flexibility,
Functionality
9 Aesthetics, Functionality Energy, Costs8 – Somewhat less preferred Energy
7 Comfort, Daylight, Flexibility Aesthetics, Daylight6 – Less preferred
5
4 – Much less preferred
energy
14%
comfort14%
daylight
13%
flexibility
14%
aesthetics
14%
functionality
16%
cost
15%
Figure 11-9. Chart showing the relative importance weights of criteria that was used in creating the final scores in Figure 11-10.
0
1
2
3
4
5
6
7
8
9
10
E x c e l l e
n t
M i n
. a c c
e p t .
A l t 1
A l t 2
A l t 3
A l t 4
cost
functionality
aesthetics
flexibility
daylight
comfortenergy
Figure 11-10. Total weighted scores for the alternative atrium constructions with the contributions of the different criteria indicated. (Imaginary alternatives with overall excellent
performance (10) and minimum acceptable performance (4) are included as references).

8/13/2019 Multi Criteria Sun Calculation House
http://slidepdf.com/reader/full/multi-criteria-sun-calculation-house 221/246
215
The group discussed the performance assessments and the importance of the criteria.Several arguments were raised to document why different criteria were considered tobe important. The performance scale for costs was questioned. The participants feltthat the preference scale for cost-assessment should be curved, but found it a bitdifficult to specify the end points. They suggested that it might be better to keep the
costs separate from the other criteria, i.e. to do a “cost – quality” assessment wherethe cost of each alternative solution is posed against the other (aggregated) qualities.The team questioned some of the cost data, and decided that this needed furtherinvestigation. Also, energy and thermal comfort issues were further discussed, e.g. theminimum acceptable temperature level and the corresponding functionality andenergy consumption of the atrium. They decided that the thermal comfort issueneeded further investigation, e.g. to see how long periods of time the temperature
level would float below, say 18°C, in alternatives 2 and 3.
The group concluded that they had one alternative with high costs and high energyuse that performed well with respect to functionality and comfort (alternative 1) and
another alternative with low costs that did not function very well with respect tocomfort and functionality (alternative 2). Also, alternative 4 was not considered goodenough with respect to energy, and alternative 3 was questioned with respect tofunctionality and comfort. The team asked the question “can we not do better thanthis?”, and started discussing other alternatives. They discussed temperature controlstrategies, and considered different roof and facade constructions, and local heatinginstallations.
11.3 Lessons learned
Due to external circumstances, this third case study received much less time than wasoriginally planned. It was the intention in this case to introduce the MCDM approachfrom the beginning of the planning process, and follow the entire process to the end.However, as it turned out, the MCDM approach was introduced in the middle of theplanning process, and was only used for evaluating a part of the design (i.e. theglazing of the atrium). There was little time to interactively define and discuss thecriteria and the results, and there was no time for iterations in order to follow theevaluation to the final choice of design strategy.
Nevertheless, the case study provided information that can be used to draw someconclusions. First of all, the participants seemed to understand the scaling andweighting concepts well, and they were able to quickly give evaluations of thedifferent alternatives on the pre-defined scales. However, the participants found itsomewhat difficult to set end points on the cost scale. It was therefore suggested thatit might be better to keep the costs separate from the other criteria. Also, some mix-ups of different criteria were encountered (e.g. including energy issues in thefunctionality criterion). However, this problem could easily have been avoided if there had been time for a proper discussion and definition of the criteria and thealternatives. It was interesting to see that the assessments of functionality andflexibility by two different members of the design team, were quite similar. This
suggests that their comprehension of the scales were similar (given, of course, thattheir actual performance assessments agreed).

8/13/2019 Multi Criteria Sun Calculation House
http://slidepdf.com/reader/full/multi-criteria-sun-calculation-house 222/246
216
In summary, the case study suggested that the MCDM approach might be a usefulway of assessing and presenting the overall performance of potential design solutions.However, some problems were encountered with respect to constructing a suitableperformance scale for cost-assessment. Apart from this, the presentation of the results
seemed to be useful in order to get a picture of the overall performance of thealternative design solutions. It also provided a common reference for a structureddiscussion of design criteria and for the performance assessment of alternatives, and itspurred the search for better solutions. However, the test was too limited to draw anyfinal conclusions about whether such an approach would improve the overall designprocess.

8/13/2019 Multi Criteria Sun Calculation House
http://slidepdf.com/reader/full/multi-criteria-sun-calculation-house 223/246
217
12 Conclusions
The background of this thesis was that solar building design needs to address manydifferent criteria that are complicated and often conflicting. In order to deal with therange of different technologies and design criteria, different design experts need to beinvolved. Therefore, it may be difficult to evaluate the overall “goodness” of aproposed design solution. Also, the communication between design professionals andthe client may be complicated.
The hypothesis of the thesis was that a structured approach to evaluation of designsolutions would help promote a solar design process where all the important criteriawould be included in an appropriate and efficient manner.
An investigation of the building design process confirmed that evaluation of alternative design solutions is an important task, but it is closely connected to othertasks such as problem formulation, generation of alternatives, and performanceprediction. The investigation also showed that design decisions are often based onexperience, “gut feeling” and intuition. The quantitative measures are often betterdocumented than the qualitative ones, and therefore, they tend to receive moreattention. All this suggested that a formal evaluation approach might be useful.
A few multi-criteria evaluation models have been proposed and used in buildingdesign. The models resemble somewhat the Multi-Criteria-Decision-Making(MCDM) methods found within the fields of operational research, managementscience, and physical planning. However, very little formal documentation was foundabout their theoretical basis or their rationale for use. Also, there was little evidencefound of how they fit into the design process. This spurred a comprehensive searchwithin the area MCDM methods. The thesis explores a range of different MCDMmodels to test how well they fit into a building design framework.
It was found that many of the existing MCDM models are very complicated anddifficult to understand and use. Therefore, it was recommended to start with the mostsimple of the models for a first introduction into building design. However, it wasfound that a crucial problem of these models is how to take care of the link betweenthe measurement scales and the importance weights. The weights are essentially re-scaling parameters that convert all scales into a common unit so that they can beaggregated. This issue has not received much attention in the few models that werefound in building applications.
Therefore, a thorough discussion of measurement and preference theory was included
in the thesis. Some techniques for establishing the link between the scales and theweights were proposed. One of the techniques involved using trade-off or indifference

8/13/2019 Multi Criteria Sun Calculation House
http://slidepdf.com/reader/full/multi-criteria-sun-calculation-house 224/246
218
checks. However, this technique was found to be quite cumbersome and time-consuming. The experience from the case studies indicated that the design teamtended to disregard these checks. Therefore, another approach for taking care of thescaling/weighting link was proposed. This technique involves using logarithmicpreference scales both for measuring the performance of alternatives and for criteria
weighting. It is based on a theory by Freerk A. Lootsma, which suggests that humansare sensitive, not to marginal, but to relative changes in value, and that this might bemapped onto scales containing a certain number of preference categories. Lootsmashows how human beings follow a uniform pattern in many unrelated areas when theysubdivide a particular scale into subjectively equal subintervals. The dB-scale formeasuring sound intensities, is an example of this. Although the arguments for usingthese scales are convincing, it is not certain that all decision-makers of buildingdesign are able to map their preferences onto such scales. In case 3, these scales weretested. Geometric scales with a progression factor of 2 were used for mapping thepreferences of the quantitative criteria. The results suggested that the scales workedwell for categorizing alternatives on all criteria except for costs, were some problems
were encountered in setting the end points of the scale. One solution to this problemcould be to leave the costs out of the aggregation, and do a “cost-quality” analysis.Another solution could be to test out different variants of the logarithmic coding in arange of building projects, using different end points and different progression factors.This may result in a set of “standardized” performance scales that could be used tohelp the decision-makers model their preferences.
To conclude, the method based on Lootsma’s theories seems to help simplifying theevaluation process, while ensuring the link between the scales and the weights.However, more research should be carried out to characterize the preferences used bydecision-makers in building projects.
Also, it was found that there is a need for further investigation of how to fit MCDM-approaches into the building design practice. Therefore, the thesis includes adiscussion of how the formal evaluation model may be integrated into the designprocess. This was based on general building design theory and ideas from morestructured design approaches such as systems analysis and systems engineering. Itwas found that the different tasks of building design were very much intertwined. Tobe able to do an evaluation, it is necessary to have some performance criteria andsome alternatives to compare. Also, some predictions of the alternatives’ fulfillmentof the criteria, are required. The specification of performance criteria may lead to
generation of alternatives, and the evaluation of alternatives may lead to a revision of the criteria. Thus, the evaluation task was placed into an iterative process of problemformulation, generation of alternatives, and performance prediction. A properspecification of the values of the stakeholders was found to be an importantprerequisite for generating and evaluating alternatives. This is because it is thesevalues that determine how good the design really is (in the stakeholders’ view). Byencouraging the decision-makers to explicitly formulate design criteria, discussionsabout values are initiated. It also helps specifying the meaning of terms whichpromotes a common understanding of what is important to focus on. This is especiallyimportant when there are qualitative criteria. For example, what does the criterion“good indoor quality” mean? It may have different meanings for different people.
Using a structured approach for eliciting and specifying criteria also ensures that allrelevant issues are included, and focuses the attention on the most important issues. In

8/13/2019 Multi Criteria Sun Calculation House
http://slidepdf.com/reader/full/multi-criteria-sun-calculation-house 225/246
219
this way, the set of criteria will guide the search for information so that no time iswasted on collecting information that turns out to be of no relevance. The experiencefrom the test cases showed that the elicitation and hierarchical structuring of criteriahelped the design teams to focus on the important issues, while at the same timekeeping the overview.
From the investigation of the building design process in general and solar design inparticular, the following requirements of the multi-criteria evaluation approach werefound:
• It should be a relatively open framework.
• It should be usable for the early design phase.
• It should be simple and quick to understand and use.
• It should promote understanding of the holistic design problem.
• It should handle judgements and values.
• It should be an aid to focus on the most important issues.• It should handle uncertainty.
Based on these requirements, a multi-criteria decision-making framework for solardesign was developed. The approach was tested in 3 design projects. This empiricalevidence is of course quite limited, and further testing of the approach in practicaldesign projects is needed in order to conclude whether or not the requirements havebeen met. However, based on the test cases and the theoretical discussion in thisthesis, the following conclusions may be drawn with respect to fulfillment of thedifferent requirements:
It should be a relatively open framework.The suggested approach is really quite flexible. The case studies showed that themethod could easily incorporate different types of criteria, different numbers of criteria, and it worked for different kinds of building projects involving differentkinds of people. Also, it was shown that the method might be used at different levelsof detail in different stages of the design process. The team members may choosebetween a variety of techniques and tools for problem structuring. Flexibility is alsosupported by the stepwise procedure for evaluation, starting with a simple side-by-side comparison of alternatives and ending up with a numerical additive weightingmethod. Also, the design team members may choose between different techniques forscoring and weighting.
It should be usable for early design phase.In Case 2, the approach was tested in the schematic design phase. The process wentsmoothly and the team members all felt comfortable with the method. Some problemswere encountered, but these were due to the fact that the method was not fullydeveloped, and was accounted for in the further development of the method. In theearly design phase, decisions often need to be based on expert judgements. Themethod seems to be well suited for decisions based on judgmental evaluations.However, more testing is needed in order to confirm that the approach is useful inimproving the decisions in the early design phase.

8/13/2019 Multi Criteria Sun Calculation House
http://slidepdf.com/reader/full/multi-criteria-sun-calculation-house 226/246

8/13/2019 Multi Criteria Sun Calculation House
http://slidepdf.com/reader/full/multi-criteria-sun-calculation-house 227/246
221
criteria and the weighting procedure were useful tools to streamline the work and toavoid getting bogged down with insignificant issues.
It should handle uncertainty and fuzzyness.The framework is able to handle uncertainty through the use of sensitivity analysis, or
alternatively to add conventional probability assessments to the quantitativeevaluations. Case 1 demonstrated that incorporating a sensitivity analysis in theframework worked well. Used with skill, the sensitivity analysis may give a goodoverview of the uncertainties of the assessments. The qualitative measurement scalesseemed to be well suited for handling fuzzy or vague value statements.
In general, more testing is needed in order to find whether the proposed approachreally will improve solar design processes. Due to limited time, the tests have onlyincluded parts of the design process. Ideally, one needs to test the approach byfollowing the entire design process, and maybe even include the construction and usephases in order to check if the approach really leads to improvements. Also different
types of building projects need to be tested, involving different kinds of people andorganizations.
The approach needs to be further refined and streamlined if it is going to fit smoothlyinto the design process. The success of the MCDM-methodology is dependent on theparticipants’ understanding of the underlying theory. In the case studies, the processwas lead by a person that was knowledgeable about MCDM theory (me). In realbuilding projects, the leader of the MCDM-approach will typically be the design teamleader. It is questionable whether it is realistic to expect that project leaders are able orwilling to adopt such an approach, since it requires some time and interest in learningabout the theory. An interactive computer program may help ease the learning and useof the approach. However, the computer program needs to be carefully designed topromote discussion and reflection and to avoid appearing as the producer of “the oneright answer to the problem”.
In principle, the approach should not only be useful for solar design, but also forgeneral building design, especially where many complex design issues are present(e.g. environmental loading). However, it is particularly useful for solar designbecause it is typically more complex than conventional design tasks. In solar designthere are many different technologies and strategies to be considered, and they areoften very much interacting and dependent on each other and external factors like
climate, use patterns, etc. In addition, solar technologies are developing very fast, andthey need to be considered in a life-cycle perspective. Also, sustainability is a centralissue of solar design, and this is an issue that is very complex and should bedocumented to the larger society. Therefore, solar design calls for the involvement of many different professionals, and cooperation, communication, and documentationare imperative for its success.
To sum up, the proposed framework seems promising with respect to improving thequality of decisions in the early phases of solar design because it encourages morecarefully balanced and integrated evaluations. All the case studies suggested that thestructuring of values and objectives into separate criteria seemed to be natural and
logical to the participants. This also helped structure the discussions in the team, andprovided a common reference for the design work. Also, the approach makes values

8/13/2019 Multi Criteria Sun Calculation House
http://slidepdf.com/reader/full/multi-criteria-sun-calculation-house 228/246
222
and judgements explicit and promotes better documentation of the choices. Hopefully,this will make people more knowledgeable about all the different issues of solardesign. Whether or not this will be a useful step towards making better solarbuildings, remains to be seen.

8/13/2019 Multi Criteria Sun Calculation House
http://slidepdf.com/reader/full/multi-criteria-sun-calculation-house 229/246
223
Definitions
a-SiAmorphous Silicon (used to denote type of photovoltaic cell).
AttributeThe most common usage of this term seems to be a characteristic of the options beingevaluated which is measurable against some objective of subjective yardstick, i.e. aperformance measure. Thus, each alternative can be characterized by a number of attributes, for example the energy consumption, the cost, or the aesthetics of abuilding. It is often used interchangeable with objective.
c-SiCrystalline Silicon (used to denote type of photovoltaic cell).
CriterionThe dictionary definition of the term is standards of judgement or rules to testacceptability. In the MCDM literature it is used interchangeably with objective andattribute. The meaning of criterion is close to the meaning of objective, i.e. areflection of the desire of the decision-maker that indicates the direction of changedesired. Examples of criteria of building design are “minimum energy consumption”,“minimum cost”, “good aesthetic qualities”, etc.
Constraint A constraint is a limit on the values that attributes and decision variables may assume.For examples, there may be an upper limit to the energy consumption of a building,specified in the building code.
Decision-maker The phrase decision-maker is used throughout this thesis in general terms to mean anindividual, an organization or any other decision-making entity.
Expected UtilityDaniel Bernoulli (1738) first suggested replacing the criterion of expected value withthe criterion of expected utility. The expected utility theory suggests that each level of an outcome is associated with some degree of pleasure or net benefit, called utility.
The expected utility of a certain choice is the weighted sum of the utilities of itsoutcomes, each multiplied by its probability (Bazerman 1998).
Expected ValueThe expected value of an alternative is the weighted sum of all potential outcomesassociated with that alternative multiplied with the probabilities of the respectiveoutcomes (Bazerman 1998).
GoalA goal defines some desirable level of achievement with respect to an objective.Goals are a priori values or levels of aspiration that are to be either achieved or not
exceeded. Thus while objectives give the desired direction, goals give a desired (ortarget) level to achieve.

8/13/2019 Multi Criteria Sun Calculation House
http://slidepdf.com/reader/full/multi-criteria-sun-calculation-house 230/246
224
Multiple Attribute Decision Making (MADM)Evaluation problems that are concerned with the evaluation of, and possible choicebetween, discretely defined alternatives. A survey of MADM methods is given inAppendix A.
Multiple Objective Decision Making (MODM) Design problems that are concerned with the identification of a preferred alternativefrom a potentially infinite set of alternatives implicitly defined by a set of constraints.
Multi Attribute Utility Theory (MAUT)The process of estimating the scores and measuring impacts is fraught withdifficulties. One way of handling this problem is to assign some probability values tothe scores and impacts. The problem can then be recast as one that seeks to evaluatethe expected utilities of the alternatives, seeking to identify the alternative with thehighest expected utility value and define this as the best one. This is usually referred
to as the MAUT problem. It has been extensively described by two of its proponents,Keeney and Raiffa (1976), as an appropriate way of aiding in a decision process.
O&M Operation and maintenance.
ObjectiveAn objective defines the direction of preference. Objectives are reflections of thedesires of the decision-maker and they indicate the direction of change desired. Anobjective is something to be pursued to a maximum extent.
Preference FunctionDefines the nature of the decision-maker’s preference for a particular attribute
ProbabilityThe concept of probability conveys the likelihood that any particular outcome willoccur. A probability of 1.0 represents certainty that an event will occur. A probabilityof 0.0 represents certainty that an event will not occur (Bazerman 1998).
PV Photovoltaics. A PV system is a system that converts solar energy into electricity
using the photovoltaic principle (solar cells).
Risk In everyday usage, risk means that the consequences of a decision are uncertain.
Stakeholder A stakeholder is a person or group of people that has interests in a project or isaffected by a project.
Value Function, Utility functionDefines the nature of the decision-maker’s preference for a particular attribute.

8/13/2019 Multi Criteria Sun Calculation House
http://slidepdf.com/reader/full/multi-criteria-sun-calculation-house 231/246
225
References
Abdou, O. A. and H. G. Lorsch (1994). “The Impact of the Building IndoorEnvironment on Occupant Productivity: Part 3: Effects of Indoor Air Quality”,
ASHRAE Transactions, 100 (2).
Adalberth, K. (1995). "Bygga. Bruka. Riva. Energianvanding i småhus ur ettkretsløpsperspektiv", Lund Tekniske Høgskola, Inst. for Byggnadsteknik, Avd. forBygnadsfysik, Lund.
Akao, Y. (1990). "Quality Function Deployment (QFD). Integrating CustomerRequirements into Product Design", Cambridge, Massachusetts, Productivity Press.
Alexander, C. (1964). "Notes on Synthesis and Form", Harvard University Press,Cambridge, Massachusetts.
Alexander, C., S. Ishikawas, et al. (1977). "A Pattern Language", New York, OxfordUniversity Press.
Andersson, B., F. Bauman, et al. (1997). "BLAST - Building Loads Analysis andSystem Thermodynamics", University of Illinois, Urbana, Illinois.
Andresen, I., A. G. Lien, et al. (1999). "Optimized System Concepts and DesignGuidelines", Norwegian University of Science and Technology, Trondheim, Norway.
Andresen, I. and S. H. Blakstad (1997). "Total Economy and Productivity (InNorwegian:Totaløkonomi og produktivitet)", Norwegian University of Science andTechnology, Department of Building Technology, Trondheim, Norway.
Annema, J. A. (1992). “Methodology for the evaluation of potential action toreduce the environmental impact of chemical substances”, SETAC Europe, 1992.
Asbjørnsen, O. A. (1992). "Systems Engineering. Principles and Practices",Arnold, Maryland, SKARPODD.
Aschehoug, Ø. and H. Arnesen (1998). "Daylight in Buildings. Design Guideline.
(Original title in Norwegian: Dagslys i bygninger. Prosjeteringsveiledning)",Lyskultur, Stabekk, Norway.
Aschehoug, Ø. and M. Thyholt (1992). "Passive Solar Energy in Dwellings. ADesign Guide (In Norwegian: Passiv sol i boliger. En prosjekteringsveileder)",Norwegian Building Services, Oslo, Norway.
ASHRAE (1992). "ASHRAE Standard 55-92: Thermal EnvironmentalConditions for Human Occupancy", American Society of Heating, Refrigerationand Air-Conditioning Engeneers, Atlanta, USA.
ASTM (1998). "Standard Practice for Applying Analytical Hierarchy Process(AHP) to Multiattribute Decision Analysis of Investments Related to Buildings

8/13/2019 Multi Criteria Sun Calculation House
http://slidepdf.com/reader/full/multi-criteria-sun-calculation-house 232/246
226
and Building Systems", American Society for Testing and Materials (ASTM), WestConshohocken, PA, USA.
Baird, G., J. Gray, et al. (1996). "Building Evaluation Techniques", New York,McGraw-Hill.
Baker, N., A. Fanchiotti, et al. (1993). "Daylighting in Architecture. A EuropeanReference Book", Brussels and Luxembourg, Commision of the EuropeanCommunities Directorate-General XII for Science, Research and Development.
Baker, N. and K. Steemers (1995). "The LT Method Version 2.0: An energy designtool for non-domestic buildings", Cambridge Architectural Research, Ltd.,Cambridge, UK.
Balcomb, D. (1998). "Star Diagram, Unpublished work", International EnergyAgency, Solar Heating and Cooling Programme, Task 23: Optimization of Solar
Energy Use in Large Buildings.
Balcomb, D., W. Carrol, et al. (1998). "Energy 10", National Renewable EnergyLaboratory, Golden, Colorado.
Balcomb, J. D. (1999). “A Building Design Revolution”, Solar Today, Vol. 13 (No4.).
Balcomb, J. D. and G. Beeler (1998). "Designing Low-Energy Buildings withEnergy-10", Proceedings of the 23rd National Passive Solar Conference,Albuquerque, New Mexico, American Solar Energy Society, American Institute of Architects.
Bazerman, M. H. (1998). "Judgment in Managerial Decision Making", New York,John Wiley & Sons.
Bejrum, H. (1991). "Life Cycle Economics for Buildings and Properties (InSwedish: Livscykelekonomiska kalkyler för byggnader och fastighter)",Stockholm, Sweden, Technical University of Stockholm.
Bejrum, H. (1991). "Livscykelekonomiska kalkyler för byggnader och fastighter",
Stockholm, Tekniska Högskolan i Stockholm.
Bell, D. E., H. Raiffa, et al. (1988). "Descriptive, normative, and prescriptiveinteractions in decision making". Decision Making. Descriptive, Normative, andPrescriptive Interactions, D. E. Bell, H. Raiffa and A. Tversky (eds), Cambridge, UK,Cambridge University Press.
Bell, J. and W. Burt (1995). "Designing buildings for daylight", Building ResearchEstablishment, London, England.
Belton, V. (1990). “Multiple Criteria Decision Analysis - Practically the Only
Way to Choose”, Operational Research Tutorial Papers, 1990.

8/13/2019 Multi Criteria Sun Calculation House
http://slidepdf.com/reader/full/multi-criteria-sun-calculation-house 233/246
227
Belton, V. and A. E. Gear (1985). “The legitimacy of rank reversal - a comment”,Omega, 13.
Belton, V. and A. E. Gear (1985). “On shortcomings of Saaty's method of analytical hierarchies”, Omega, 11.
Berleman, K. (1997). "SUNCODE-PC 5.7", Ecotope, Inc., Seattle, Washington.
Birdshall, B. E., W. F. Buhl, et al. (1990). "Overview of the DOE-2 building energyanalysis program, version 2.1D", Lawrence Berkeley Laboratory, San Francisco.
Bjørberg, S., I. Eide, et al. (1993). "Annual costs for buildings. Book 1: Calculationguide for buildings. (In Norwegian: Årskostnader for bygninger. Bok 1Beregningsanvisning for bygninger)", Norwegian Building Research Institute, Oslo,Norway.
Bjørberg, S., I. Eide, et al. (1993). "Årskostnader for bygninger. Bok 1Beregningsanvisning for bygninger.", Norges byggforskningsinstitutt, Oslo.
Blanchard, B. S. (1990). "Systems Engineering and Analysis", USA, Prentice Hall.
Blom, P., V. Stenstad, et al. (1988). "Energiøkonomisk prosjektering avbygninger", Norges Byggforskningsinstitutt, Oslo.
Bojö, J., K. G. Mäler, et al. (1990). "Environment and Development: An EconomicApproach", Dordrecht, Kluwer Academic Publishers.
Brans, J. P., B. Mareschal, et al. (1986). “How to select and how to rank projects.The PROMETHEE method”, European Journal of Operational Research, 24.
Burge, S., A. Hedge, et al. (1987). “Sick Building Syndrome: A study of 4373 officeworkers”, Annals of Occupational Hygiene, 31.
Caballero, R., F. Ruiiz, et al. (1997). "Advances in Multiple Objective and GoalProgramming", Berlin, Springer Verlag.
Chatagnon, N., S. Nibel, et al. (1998). "ESCALE, A Method of Assessing a
Building's Environmental Performance at the Design Stage", Green BuildingChallenge'98, Vancouver, Canada, Natural Resources Canada.
Checkland, P. B. (1985). "Formulating Problems for Systems Analysis". Handbook of Systems Analysis. Overview of Uses, Procedures, Applications, and Practice, H. J.Miser and E. S. Quade (eds), Chichester, John Wiley & Sons.
Chen, S.-J. and C.-L. Hwang (1992). "Fuzzy Multiple Attribute Decision Making",Berlin, Springer-Verlag.
Chesler, L. G. and B. F. Goeller (1973). "The STAR Methodology for Short-Haul
Transportation: Transportation System Impact Assessment", The RandCorporation, Santa Monica, California.

8/13/2019 Multi Criteria Sun Calculation House
http://slidepdf.com/reader/full/multi-criteria-sun-calculation-house 234/246
228
Christensen, J. E. and K. Johnsen (1996). "Third Generation of a ThermalSimulation Program: tsbi3", Proceedings of the Biennial Congress of theInternational Solar Energy Soceiety, Denver, Colorado, Pergamon Press.
Christiansen, K., A. Grove, et al. (1990). "Environmental assessment of PVC andselected alternative materials (Original title in Danish: Miljøvurdering av PV ogudvalgte alternative materialer)", Miljøstyrelsen, Copenhagen, Denmark.
Clarke, J., M. Evans, et al. (1997). "The ESP-r System for Building EnergySimulation. User Guide Version 9 Series", University of Strathclyde, EnergySystem Research Unit, Glasgow.
Clements-Croome, D. J. (1997). "Specifying Indoor Climate". Naturally VentilatedBuildings. Building for the Senses, the Economy and Society, D. J. Clements-Croome(eds), Padstow, UK, E & FN Spon.
Cofaigh, E. O., E. Fitzgerald, et al. (1999). "A Green Vitrivius. Principles andPractice of Sustainable Architectural Design.", London, James&James.
Cole, R. J. and N. Larsson (1998). "GBC'98 Assessment Manual: Volume 2: OfficeBuildings", University of British Columbia / Canmet Energy Technolgy Centre,Canada.
Cole, R. J. and N. Larsson (1998). "Preliminary Analysis of the GBC AssessmentProcess", Green Building Challence'98, Vancouver, Natural Resources Canada.
Cole, R. J., D. Rousseau, et al. (1993). "Building Environmental PerformanceAssessment Criteria: Version 1 - Office Buildings", The BEPAC Foundation,Vancouver, Canada.
Cook, W. D. and L. M. Sieford (1978). “Priority ranking and consensusformation”, Management Science, 24.
Darke, J. (1978). "The primary generator and the design process", New Directionsin Environmental Design Research, Washington, EDRA.
Dasgupta, A. K. and D. W. Pearce (1972). "Cost-benefit analysis", London, England,MacMillan.
Dawes, R. M. (1988). "Rational choice in an uncertain world", New York, HarcuortBrace Jovanovich.
Dell'Isola, A. J. (1997). "Value Engineering: Practical Applications for Design,Construction, Maintenance & Operations", Kingston, MA, R.S. Means Company,Inc.
Dell'Isola, P. E. and S. J. Kirk (1981). "Life Cycle Costing for Design
Professionals", New York, McGraw Hill.

8/13/2019 Multi Criteria Sun Calculation House
http://slidepdf.com/reader/full/multi-criteria-sun-calculation-house 235/246
229
Dror, Y. (1988). "Uncertainty. Coping with it and with Political Feasibility".Handbook of Systems Analysis. Craft Issues and Procedural Choices, H. J. Miser andE. S. Quade (eds), Chichester, England, John Wiley and Sons.
Dubois, D. and H. Prade (1980). "Fuzzy Sets and Systems: Theory and
Applications", London, Academic Press.
Duckstein, L., C. C. Kisiel, et al. (1975). "Interactive multi-objective decision-making under uncertainty". The Role and Effectiveness of Theories of Decision inPractice, D. J. White and K. C. Bowen (eds), Hodder and Stoughton.
Duerk, D. P. (1993). "Architectural Programming. Information Management forDesign", New York, Van Norstrand Reinhold.
Duffie, J. A. and W. A. Beckman (1991). "Solar Engineering of ThermalProcesses", New York, John Wiley & Sons.
Dyer, J. S. (1990). “A clarification of "Remarks on the Analytic HierarchyProcess"”, Management Science, 36.
Dyer, J. S. (1990). “Remarks on the Analytic Hierarchy Process”, ManagementScience, 36.
Edwards, W. (1971). "Social Utilities", Engineering Economist.
Edwards, W. (1977). "Use of multiattribute utility measurement for socialdecision making". Conflicting Objectives in Decisions, D. E. Bell, R. L. Keeney andH. Raiffa (eds), New York, Wiley.
Edwards, W. and R. J. Newman (1982). "Multiattribute Evaluation", SageUniversity, Beverly Hills.
Emerson, D. E. (1969). "UNCLE - A New Force Exchange Model for AnalyzingStrategic Uncertainty", The Rand Corporation, Santa Monica, California.
Fanger, P. O. (1970). "Thermal Comfort. Analysis and Applications inEnvironmental Engineering", New York, McGraw-Hill.
Farmer, T. A. (1987). “Testing the robustness of multiattribute utility theory in anapplied setting”, Decision Sciences (18).
Fet, A. M. (1997). "Systems Engineering Methods and Environmental Life CyclePerformance within Ship Industry", Department of Thermal Energy andHydropower, Norwegian University of Science and Technology, Trondheim.
Findeisen, W. and E. S. Quade (1985). "The Methodology of Systems Analysis: AnIntroduction and Overview". Handbook of Systems Analysis. Overview of Uses,Procedures, Applications, and Practice, H. J. Miser and E. S. Quade (eds), Chichester,
John Wiley & Sons.

8/13/2019 Multi Criteria Sun Calculation House
http://slidepdf.com/reader/full/multi-criteria-sun-calculation-house 236/246
230
Fischer, G. W. (1979). “Utility models for multiple objective decisions: do theyadequately represent human preferences?”, Decision Science (10).
Flanagan, R., G. Norman, et al. (1989). "Life Cycle Costing. Theory and Practice",Oxford, BSP Professional Books.
Forman, E. H., R. E. Chapman, et al. (1998). "Software to Support ASTM E1765:Standard Practice for Applying Analytical Hierarchy Process (AHP) toMultiattribute Decision Analysis of Investments Related to Buildings andBuilding Systems", American Society for Testing and Materials (ASTM), WestConshohocken, PA, USA.
Fossdal, S. (1995). "Energi- og miljøregnskap for bygg. Fremstilling avbyggematerialer. Regnskap for boliger og kontorbygg.", Norgesbyggforskningsinstitutt, Oslo.
French, S. (1988). "Decision Theory: An Introduction to the Mathematics of Rationality", New York, Ellis Horwood.
Glaumann, M. and T. Malm (1998). "Environmental Assessment of Buildings - TheCBE Version", Green Building Challenge'98, Vancouver, Canada, Natural ResourcesCanada.
Goicoechea, A., D. R. Hanson, et al. (1982). "Multi-objective Decision Analysiswith Engineering and Business Applications",, John Wiley.
Gordon, T. and O. Helmer (1964). "Report on a Long-Range Forecasting Study",The Rand Corporation, Santa Monica, California.
Gordon, W. J. J. (1961). "Synectics: The Development of Creative Capacity", NewYork, Harper.
Gray, C., W. Hughes, et al. (1994). "The successful management of design. Ahandbook of building design management.", UK, Centre for Strategic Studies inConstruction, University of Reading.
GRIP (1996). "Eco-profile for buildings (In Norwegian: Økoprofil for bygg)",
GRIP center, Oslo, Norway.
GRIP (1998). "Environmental design of buildings (In Norwegian: Miljøriktigbygg-prosjektering)", GRIP centre for sustainable production and consumption,Oslo, Norway.
Harker, P. T. and L. G. Vargas (1990). “Reply to "Remarks on the AnalyticHierarchy Process"”, Management Science, 36.
Henriksen, C. (1999). "Description of Case Stories. A Technical Report of IEATask 23: Optimization of Solar Energy Use in Large Buildings", International
Energy Agency, Solar Heating and Cooling Programme, Sønderborg, Denmark.

8/13/2019 Multi Criteria Sun Calculation House
http://slidepdf.com/reader/full/multi-criteria-sun-calculation-house 237/246
231
Hickling, A. (1982). "Beyond a Linear Iterative Process". Changing Design, Evanset al. (eds), Chichester, Wiley.
Hobbs, B. F. and P. M. Meier (1994). “Multicriteria Methods for ResourcePlanning: An Experimental Comparison”, IEEE Transactions on Power Systems, 9
(No. 4, November).
Humm, O. and P. Toggweiler (1993). "Photovoltaics in Architecture", Basel,Birkhauser Verlag.
Huovila, P. (1999). "Managing the life cycle requirements of facilities", 8thInternational Conference on Durability of Building Materials and Components,Vancouver, Canada.
Hwang, C.-L. and A. S. M. Masud (1979). "Multiple Objective Decision Making -Methods and Applications. A State-of-the-Art Survey.", Berlin, Springer Verlag.
Hwang, C.-L. and K. Yoon (1981). "Multiple Attribute Decision Making. Methodsand Applications. A State-of-the-Art Survey.", Berlin, Springer Verlag.
ISO (1984). "Standard 7730: Moderate Thermal Environments - Determinationof the PMV and PPD Indices and Specifications of the Conditions for ThermalComfort", International Standardization Organisation, Geneva, Switzerland.
Jaboyedoff, P., M. Schuler, et al. (1999). "Issues of solar and low energy measuresin design stages (draft note)", International Energy Agency, Solar Heating andCooling Programme, Task 23: The Optimization of Solar Energy Use in LargeBuildings, Subtask B: Design Process Guidelines.
Jesch, L. F. (1998). “The Daylit Office Environment. A Story of Energy andProductivity from the Western USA”, SunWorld, Volume 22 (Number 4).
Johnsen, K., K. Grau, et al. (1991). "User's Guide to the Program tsbi3: ThermalSimulation of Building and Installations.", Danish Building Research Institute,Hørsholm, Denmark.
Judkoff, R. (1997). "SERI-RES", National Renewable Energy Laboratory, Golden,
Colorado.
Kahneman, D. and A. Tversky (1972). “Subjective probability: A jugdement of representativeness”, Cognitive Psychology (3).
Kahneman, D. and A. Tversky (1973). “On the psychology of prediction”,Psychological Review (80).
Kahneman, D. and A. Tversky (1979). “Prospect theory: An analysis of decisionunder risk.”, Econometrica (47).
Kahneman, D. and A. Tversky (1982). “Psychology of preferences”, ScientificAmerican.

8/13/2019 Multi Criteria Sun Calculation House
http://slidepdf.com/reader/full/multi-criteria-sun-calculation-house 238/246
232
Karnov, H. H., D. O. Pedersen, et al. (1975). "Building Planning using ValueAnalysis (In Danish: "Bygningsplanlegning med verdianalyse")", Danish BuildingResearch Institute, Hørsholm, Denmark.
Kaufmann, A. (1975). "Introduction to the Theory of Fuzzy Subsets", AcademicPress.
Keeney, R. L. (1980). "Siting energy facilities", New York, Academic press.
Keeney, R. L. (1992). "Value Focused Thinking. A Path to CreativeDecisionmaking", Cambridge, Massachusetts, Harvard University Press.
Keeney, R. L. and H. Raiffa (1976). "Decision with Multiple Objectives:Preferences and Value Trade-offs", John Wiley & Sons.
Keller, L. R. (1985). “The effects of problem representation on the sure thing andsubstitution principles”, Management Science, 31.
Khemlani, L. and Y. E. Kalay (1997). "An Integrated Commuting Environmentfor Collaborative, Multi-Disciplinary Building Design", CAAD Futures 1997.Proceedings of the 7th International Conference on Computer Aided ArchitecturalDesign Futures., Munich, Germany, Kluwer Academic Publishers.
Kirk, S. J. and A. J. Dell'Isola (1995). "Life Cycle Costing for Design Professionals.Second Edition.", New York, McGraw Hill.
Kirk, S. J. and K. F. Spreckelmeyer (1993). "Enhancing Value in Design Decisions",Evergreen, Colorado, USA.
Klein, S. A., W. A. Beckman, et al. (1997). "TRNSYS - A Transient SystemSimulation Program", Solar Energy Laboratory, University of Wisconsin-Madison,Madison, USA.
Koulori, A. and V. Belton (1998). "Fuzzy Multi-Criteria DSS: their Applicabilityand their Practical Value", University of Strathclyde, Department of ManagementScience, Glasgow, UK.
Kumlin, R. R. (1995). "Architectural Programming", New York, McGraw-Hill.
Lagreze, E. J. and M. F. Shakun (1984). “Decision support systems for semi-structured buying decisions”, European Journal for Operational Research (16).
Larsson, N. and R. Cole (1998). "Green Building Assessment Tool - GBTool 1.3. ASecond-Generation Environmental Performance Assessment System forBuildings", CETC Buildings Group, CANMET, Natural Resources Canada, Ottawa,Canada.
Larsson, N. and S. F. Pope (1999). "C-2000 Integrated Design Process", NaturalResources Canada, Ottawa, Canada.

8/13/2019 Multi Criteria Sun Calculation House
http://slidepdf.com/reader/full/multi-criteria-sun-calculation-house 239/246
233
Larsson, N. K. and R. J. Cole (1998). "GBC'98: Context, History and Structure",Green Building Challence'98, Vancouver, Canada, Natural Resources Canada.
Lawson, B. (1997). "How Designers Think. The Design Process Demystified.",
Oxford, Butterworth Architecture.
Leaman, A. (1997). "Productivity in Buildings: The Killer Variables", WorkplaceComfort Forum, London, Abacus Communications.
Lechner, N. (1991). "Heating, Cooling, Lighting. Design Methods for Architects.",New York, John Wiley & Sons.
Leopold, L. B. and e. al. (1971). "A Procedure for Evaluating EnvironmentalImpact", U.S. Geological Survey, Washington, D.C.
Levin, H. (1991). “IAQ, Productivity, and Occupant Control”, Indoor Air Bulletin,Vol 1 (No 7).
Lewis, J. O. and J. Golding (1995). "Passive Solar Heating", Dublin, Ireland,European Commission Directorate-General XII for Science, Research andDevelopment.
Linstone, H. A. and M. Turoff (1975). "The Delphi Method: Techniques andApplications", Reading, Massachusetts, Addison-Wesley.
Lippiatt, B. C. (1998). "Building for Environmental and Economic Sustainability(BEES)", Green Building Challence'98, Vancouver, Canada, Natural ResourcesCanada.
Littlefair, P. J. (1996). "Designing with innovative daylighting.", Building ResearchEstablishment, Watford, England.
Loftness, V., V. Hartkopf, et al. (1989). "Critical Frameworks for BuildingEvaluation: Total Building Performance, Systems Integration, and Levels of Measurement and Assessment". Building Evaluation, W. F. E. Preiser (eds), NewYork, Plenum Press.
Lootsma, F. A. (1999). "Multi-Criteria Decision Analysis via Ratio and DifferenceJudgement", Dordrecht, the Netherlands, Kluwer Academic Publishers.
Lorsch, H. G. and O. A. Abdou (1994). “The Impact of the Building IndoorEnvironment on Occupant Productivity”, ASHRAE Transactions, Vol 100 (2).
Lundequist, J. (1992). “The development of design theory (Original in Swedish:Om designteorins uppkomst)”, Nordisk Arkitekturforsking, 1992:4.
Lundequist, J. (1998). "Design Theory and Methodology - An Introduction to
Design Theory (In Swedish: Prosjekteringens teori och metod - en introduksjon

8/13/2019 Multi Criteria Sun Calculation House
http://slidepdf.com/reader/full/multi-criteria-sun-calculation-house 240/246
234
til designteorin)", Kungliga Tekniska Høgskolan, Inst. for Arkitektur ogstadsbyggnad, Stockholm, Sweden.
Lundequist, J. (1998). "Prosjekteringens teori och metod - en introduksjon tildesignteorin", Kungliga Tekniska Høgskolan, Inst. for Arkitektur og stadsbyggnad,
Stockholm, Sweden.
Løfberg, H. L. (1987). "Calculating Daylight (In Swedish: Rakna med Dagsljus)",Swedish Building Research Institute, Gavle, Sweden.
Mackinder, M. (1980). "The Selection and Specification of Building Materials andComponents", York Institute of Advanced Architectural Education, York.
Mak, J. P., D. A. F. Anink, et al. (1996). "Eco-Quantum, final report: design of acalculation method to determine the environmental load of a building in aquantitative way", Gouda, The Netherlands.
Mann, T. (1992). "Building Economics for Architects", New York, USA, VanNostrand Reinhold.
Markus, T. and K. Alexander (1997). "A Facilities Management Model", Universityof Strathclyde, Department of Architecture and Building Science, Glasgow, Scotland.
Massam, B. H. (1988). “Multi-criteria decision making (MCDM) techniques inplanning”, Progress in Planning, 30 (Part 1).
Massey, H. G. (1988). "Cost Considerations". Handbook of Systems Analysis. CraftIssues and Procedural Choices, H. J. Miser and E. S. Quade (eds), Chichester, U.K.,John Wiley & Sons.
McAnarney, D. K. (1987). "Multiple Attribute Decision Making Methods: AComparative Study. Unpublished master's thesis.", Kansas State University, USA.
McCartney, K. J. and D. J. Croome (1994). "A Study of the Effects of User-Controlled Localised Environmental Systems on Comfort, Energy andProductivity", Proceedings of the 3rd International Conference: HealthyBuildings'94.
McIver, J. P. and E. G. Carmines (1981). "Unidimensional Scaling", Newsbury Park,California, Sage.
Miller, G. A. (1956). “The magic number seven, plus or minus two”, PsychologicalReview (63).
Ministerråd, N. (1994). "Nordic Manual on Product Live Cycle Assessment -PLCA", Nordic Council of Ministers, Copenhagen, Denmark.
Miser, H. J. (1988). "Underlying Concepts for Systems and Policy Analysis".
Handbook of Systems Analysis. Craft Issues and Procedural Choices, H. J. Miser andE. S. Quade (eds), New York, Wiley.

8/13/2019 Multi Criteria Sun Calculation House
http://slidepdf.com/reader/full/multi-criteria-sun-calculation-house 241/246
235
Miser, H. J. and E. S. Quade (1988). "Analytic Strategies and Their Components".Handbook of Systems Analysis. Craft Issues and Procedural Choices, H. J. Miser andE. S. Quade (eds), Chichester, UK, Wiley.
Miser, H. J. and E. S. Quade (1988). "Introduction. Craftmanship in Analysis".Handbook of Systems Analysis. Craft Issues and Procedural Choices, H. J. Miser andE. S. Quade (eds), New York, Wiley.
Mishan, E. J. (1971). "Cost-benefit analysis", London, England, Allen and Unwin.
Molander, B. (1993). "Knowlede in Doing (Origninal in Swedish: Kunskap ihandling)", Göteborg, Sweden, Daidalos.
Morton, R. and D. Jaggar (1995). "Design and the Economics of Building", London,E & FN SPON.
Munda, G. (1995). "Multicriteria Evaluation in a Fuzzy Environment.",Heidelberg, Germany, Physical-Verlag.
Myhre, L. and T. Haugen (1993). "Energy- and Environmentally FriendlyBuildings. (Original in Norwegian: Energi og mljøvennlige bygninger. Nordiskseminar om bygningers totalenergiforbruk og miljøbelastning, Trondheim 14.-15. oktober, 1992)", SINTEF, Trondheim, Norway.
Negoita, C. V. and D. A. Ralescu (1975). "Applications of Fuzzy Sets to SystemsAnalysis", Birkhauser Verlag.
NIBR (1975b). "Methods for comparison - general decision oriented methods(In Norwegian: Sammenlikningsmetodikk - generelle beslutningsorientertemetoder)", Norwegian Institute for Town and Regional Planning, Oslo, Norway.
Nicklas, M. and G. Bailey (1996). “Daylit Students Shine Brighter”, SunWorld,Volume 20 (Number 3).
Nieminen, J., P. Houvila, et al. (1998). "QFD in Setting the Guidelines for aDemonstration Project", VTT Building Technology, Helsinki, Finland.
NorEnergi (1993). "Benchmarks for energy and power consumption in buildings(In Norwegian: Normtallspermen: energi- og effektforbruk i bygninger)",Norwegian Utilities Association (Norges Energiverksforbund), Oslo, Norway.
Norris, G. A. and H. E. Marshall (1995). "Multiattribute Decision Analysis.Method for Evaluating Buildings and Building Systems", U.S. Department of Commerce, Office of Applied Economics, Building and Fire Research Laboratory,Gaithersburg, MD, USA.
Osborn, A. F. (1957). "Applied Imagination: Principles and Procedures of
Creative Thinking", New York, Scribner's.

8/13/2019 Multi Criteria Sun Calculation House
http://slidepdf.com/reader/full/multi-criteria-sun-calculation-house 242/246
236
Palmer, M. A. (1981). "The Architect's Guide to Facility Programming",Washington, D.C., The American Institute of Architects.
Papamichael, K., J. LaPorta, et al. (1997). “Building Design Advisor: Automatedintegration of multiple simulation tools”, Automation in Construction, 6 (4).
Papamichael, K., J. LaPorta, et al. (1997). "Decision Making through the Use of Interoperable Simulation Software", Building Simulation'97 ConferenceProceedings, Prague, Czech Republic.
Papamichael, K. M. and J. P. Prozen (1993). "The Limits of Intelligence in Design",Focus Symposium on Computer-Assisted Building Design Systems of the 4thInternational Symposium on Systems Research, Information and Cybernetics, Baden-Baden, Germany.
Pearce, D. W. (1971). "Cost-Benefit Analysis", London, England, MacMillian.
Pearce, D. W. and C. A. Nash (1989). "The social appraisal of projects", London,England, MacMillan.
Peippo, K. (1992). "The Reasons for Use and Design of Solar Electric Systems (InSwedish: Grunderna för användningen och dimensioneringen av sol-el-system)",Helsinki University of Technology, Department of Technical Physics, Helsinki,Finland.
Peippo, K. (1997). "A numerical multivariate approach to optimization of photovoltaic solar low energy building designs.", Helsinki University of Technology, Department of Engineering Physics and Mathematics, Helsinki, Finland.
Pena, W. (1987). "Problem Seeking. An Architectural Programming Primer",Washington, AIA Press.
prEN-832 (1999). "Thermal Performance of Buildings - Calculation of Energy usefor heating. Residential Buildings", Norwegian Council for BuildingStandardization, Oslo.
prEN-ISO-13790 (1999). "Thermal performance of buildings - Calculation of
energy use for heating", Norwegian Council for Building Standardization, Oslo.
Prior, J. (1993). "Building Research Establishment Environmental AssessmentMethod (BREEAM)", Building Research Establishment, Garston, UK.
Quade, E. S. (1980). "Pitfalls in formulation and modeling". Pitfalls of Analysis, G.Majone and E. S. Quade (eds), Chishester, UK, Wiley.
Quade, E. S. (1985). "Objectives, Constraints and Alternatives". Handbook of Systems Analysis. Overview of Uses, Procedures, Applications, and Practice, H. J.Miser and E. S. Quade (eds), Chichester, John Wiley & Sons.

8/13/2019 Multi Criteria Sun Calculation House
http://slidepdf.com/reader/full/multi-criteria-sun-calculation-house 243/246
237
Quade, E. S. (1995). "Examples of Systems Analysis". Handbook of SystemsAnalysis. Volume 1 -- Overview of Uses, Procedures, Applications, and Practice, H.J. Miser and E. S. Quade (eds), Chichester, UK, Wiley.
Rabl, A. (1985). "Active Solar Collectors and Their Applications", New York,
Oxford University Press.
Raiffa, H. (1968). "Introductory lectures on choice under uncertainty", AddisonWesley Publication Company.
Reekie, R. F. (1972). "Design in the built environment", London, Edward Arnold.
Rietveld, P. (1980). "Multiple Objective Decision Methods and RegionalPlanning", Amsterdam, the Netherlands, North Holland.
Rohrbaugh, J. and P. Wehr (1978). “Judgement analysis in policy formulation. A
new method for improving public participation.”, Public Opinion Q (42).
Roodman, D. M. and N. Lenssen (1995). "A Building Revolution: How Ecologyand Health Concerns Are Transforming Construction", Worldwatch Institute,Washington, DC.
Rowe, M. D. and B. L. Pierce (1982). “Some test of analytical multiobjectivedecision-making methods”, Socio-Economic Planning Sciences, 16 (3).
Rowe, P. G. (1987). "Design Thinking", Cambridge, Massachusetts, M.I.T Press.
Roy, B. (1971). “Problems and methods with multiple objective functions”,Mathematical Programming (1).
Roy, B. (1973). "How outranking helps multiple criteria decision making", SouthCarolina, USA, University of South Carolina Press.
Roy, B. (1977). "Partial preference analysis and decision aid", New York, Wiley.
Roy, B. (1978). “Une algorithme de classements fonde sur un representation flouede preferences en presence de citeres multiples”, Cahiers du Centre d'Etudes de
Recherche Operationelle, 20 (1).
Roy, B. (1985). “Methodolgie Mulicitere d'aide a la decision”, .
Roy, B. and P. Bertier (1973). "La methode ELECTRE II: un application aumedia planning", New York, North Holland.
Roy, B. and D. Bouyssou (1986). “Comparison of two decision-aid models appliedto a nuclear power plant siting example”, European Journal of OperationalResearch, 25.
Roy, B. and J. C. Hugonnard (1982). “Ranking of suburban line extension projectson the Paris metro by a multicriteria method”, Transportation Research, 16A.

8/13/2019 Multi Criteria Sun Calculation House
http://slidepdf.com/reader/full/multi-criteria-sun-calculation-house 244/246
238
Rush, R. D. (1986). "The Building Systems Integration Handbook", Stoneham,MA, USA, Butterworth-Heinemann.
SBI (1990). "Total energy use and environmental loadings of buildings (Original
in Danish: Bygningers totalenegiforbrug og miljøbelastning. Konferanse iKøbenhavn den 11. september 1990)", Danish Building Research Institute,Hørsholm, Denmark.
Schaltegger, S., K. Muller, et al. (1996). "Corporate Environmental Accounting",England, John Wiley & Sons.
Schuler, M., H. Meyer, et al. (1996). "TRNSYS 14 Goes Windows and Window 4.1.Tool for Energetic and Visual Building Simulation.", EuroSun'96, 10.Internationales Sonnenforum., Freiburg, Germany, DGS-Sonnenenergie Verlags-GmbH.
Schön, D. A. (1983). "The Reflective Practitioner", London, Temple Smith.
Sick, F. and T. Erge (1996). "Photovoltaics in Buildings. A Design Handbook forArchitects and Engineers", London, James & James Ltd.
Simon, H. (1964). “On the concept of organization goal”, Administrative ScienceQuarterly, 9 (1).
Simon, H. (1969). "The Sciences of the Artificial", USA, MIT Press.
Simon, H. A. (1957). "Models of Man", New York, Wiley.
Slovic, P., B. Fischhoff, et al. (1982). "Response mode, framing, and informationprocessing effects of risk assessment.". New directions for methodology of socialbehaviour science: The framing of questions and the consistency of response, R. M.Hogarth (eds), San Francisco, California, Jossey-Bass.
Slovic, P. and S. Lichtenstein (1977). “Comparison of Bayesian and regressionapproaches to the study of information processing in judgement”, OrganizationalBehavior and Human Performance (6).
Spector, P. E. (1992). "Summated Rating Scale Construction: An Introduction",Thousand Oaks, California, Sage.
Srinivasan, V. and A. D. Shocker (1973). “Linear Programming Techniques forMultidimensional Analysis of Preference”, Psychometrika, 38 (3).
Srivatava, J., T. Conolly, et al. (1995). “Do Ranks Suffice? A Comparison of Alternative Weighting Approaches in Value Elicitation.”, OrganizationalBehaviour and Human Decision Processes, 63 (No. 1, July).
Steen, B. and S.-O. Ryding (1992). "The EPS Enviro-Accounting Method",Swedish Environmental Research Institute, Gøteborg.

8/13/2019 Multi Criteria Sun Calculation House
http://slidepdf.com/reader/full/multi-criteria-sun-calculation-house 245/246
239
Stillwell, W. G., D. A. Seaver, et al. (1981). “A comparison of weightapproximation techniques in multiattribute utility decision making”,Organizational Behaviour and Human Performance (28).
Straunch, R. E. (1974). "A critical assessment of quantitative methodology as apolicy analysis tool", The Rand Corporation, Santa Monica, California.
Strong, S. (1991). "The Solar Electric House", Massachusetts, USA, SustainabilityPress.
Saaty (1986). "Expert Choice. Version 8. Decision Support Software. GettingStarted.", Expert Choice, Inc., The Decision Support Software Company, Pittsburgh,PA.
Saaty, T. L. (1990). "Analytical Hierarchy Process", New York, McGraw-Hill.
Saaty, T. L. (1990). “An exposition of the AHP in reply to the paper "Remarks onthe Analytic Hierarchy Process"”, Management Science, 36.
Saaty, T. L. (1994). "Fundamentals of Decision Making and Priority Theory.With the Analytic Hierarchy Process", Pittsburgh, PA, RWS Publications.
Saaty, T. L. (1996). "Analytical Hierarchy Process. Planning, Priority Setting,Resouce Allocation", Pittsburgh, PA, RWS Publications.
Saaty, T. L. and L. G. Vargas (1984). “The legitimacy of rank reversal - acomment”, Omega, 12.
Tangen, G. (1996). "Decision Making Support Applied to Hydropower PlantUpgradig", Norwegian University of Science and Technology, Trondheim, Norway.
Tversky, A. and D. Kahneman (1981). “The framing of decisions and thepsychology of choice”, Science, 211.
U.S.Army (1989). "Environmental Review Guide for USAREUR", Champaign,Illinois, US Army Construction Engineering Research Laboratory.
U.S.G.B.C (1999). "LEED Green Building Rating System. Leadership in Energyand Environmental Design", U.S. Green Building Council, San Francisco, USA.
Vargas, L. G. (1985). “ A rejoiner”, Omega, 13.
Vincke, P. (1986). “Analysis of multicriteria decision aid in Europe”, EuropeanJournal of Operational Research (25).
von Winterfeldt, D. and W. Edwards (1986). "Decision Analysis and BehavioralResearch", Cambridge, UK, Cambridge University Press.

8/13/2019 Multi Criteria Sun Calculation House
http://slidepdf.com/reader/full/multi-criteria-sun-calculation-house 246/246
Voogd, H. (1983). "Multicriteria Evaluation for Urban and Regional Planning",London, UK, Pion.
Watson, S. R. and A. Freeling (1982). “Assessing attribute weights”, Omega, 10.
Watson, S. R. and A. N. S. Freeling (1983). “Comment on assigning attributeweights by ratios”, Omega, 11.
Westerman, A. (1980). "Aesthetic value of building exteriors (Original in Swedish:E t ti k d i b d t i )" S di h B ildi R h I i


![SPACECRAFT SUN SENSORS - NASA · PDF filenasa space vehicle design criteria [guidance and control] nasa sp-8047 spacecraft sun sensors june 1970 national aeronautics and space administration](https://static.fdocuments.us/doc/165x107/5a70e08a7f8b9aa7538c697f/spacecraft-sun-sensors-nasa-nbsppdf-filenasa-space-vehicle-design.jpg)


