Multi Airport System
33
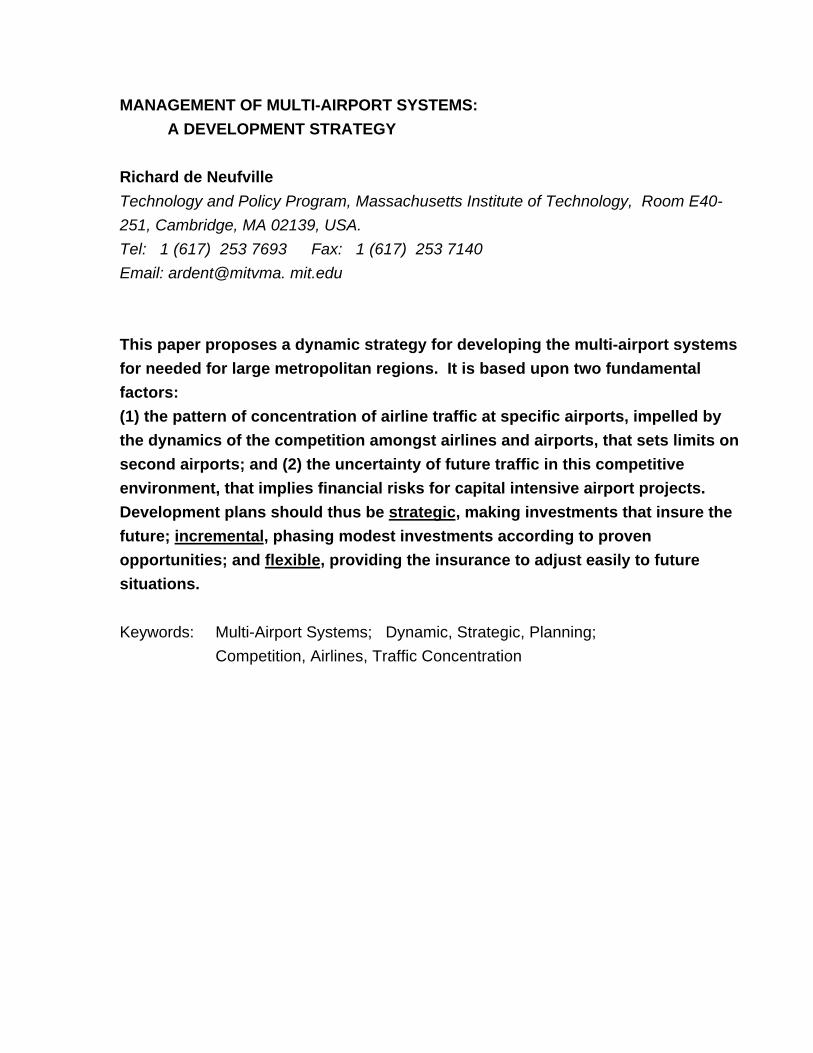
MANAGEMENT OF MULTI-AIRPORT SYSTEMS: A DEVELOPMENT STRATEGY Richard de Neufville Technology and Policy Program, Massachusetts Institute of Technology, Room E40- 251, Cambridge, MA 02139, USA. Tel: 1 (617) 253 7693 Fax: 1 (617) 253 7140 Email: ardent@mitvma. mit.edu This paper proposes a dynamic strategy for developing the multi-airport systems for needed for large metropolitan regions. It is based upon two fundamental factors: (1) the pattern of concentration of airline traffic at specific airports, impelled by the dynamics of the competition amongst airlines and airports, that sets limits on second airports; and (2) the uncertainty of future traffic in this competitive environment, that implies financial risks for capital intensive airport projects. Development plans should thus be strategic, making investments that insure the future; incremental, phasing modest investments according to proven opportunities; and flexible, providing the insurance to adjust easily to future situations. Keywords: Multi-Airport Systems; Dynamic, Strategic, Planning; Competition, Airlines, Traffic Concentration
-
Upload
irbasukirahardjoces -
Category
Documents
-
view
51 -
download
10
description
ref
Transcript of Multi Airport System
MANAGEMENT OF MULTI-AIRPORT SYSTEMS:
A DEVELOPMENT STRATEGY
Richard de Neufville
Technology and Policy Program, Massachusetts Institute of Technology, Room E40-
251, Cambridge, MA 02139, USA.
Tel: 1 (617) 253 7693 Fax: 1 (617) 253 7140
Email: ardent@mitvma. mit.edu
This paper proposes a dynamic strategy for developing the multi-airport systems
for needed for large metropolitan regions. It is based upon two fundamental
factors:
(1) the pattern of concentration of airline traffic at specific airports, impelled by
the dynamics of the competition amongst airlines and airports, that sets limits on
second airports; and (2) the uncertainty of future traffic in this competitive
environment, that implies financial risks for capital intensive airport projects.
Development plans should thus be strategic, making investments that insure the
future; incremental, phasing modest investments according to proven
opportunities; and flexible, providing the insurance to adjust easily to future
situations.
Keywords: Multi-Airport Systems; Dynamic, Strategic, Planning;
Competition, Airlines, Traffic Concentration

The Issue
The proper management and development of multi-airport systems are a major concern
of airport managers worldwide. All metropolitan regions generating more than 10
million originating passengers a year have several airports serving commercial carriers.
Some thirty cities already have or are planning for second airports. Major second
airports:
* have recently opened at London and Osaka;
* are under development at Bangkok, Hong Kong, Kuala Lumpur, Oslo, Seoul,
and Sydney; and
* are in various stages of consideration for Atlanta, Berlin, Boston,
Minneapolis/St.Paul, St.Louis, and Seattle.
Yet the experience in managing multi-airport systems is poor. It is routinely marked by
expensive mistakes. Planners fail to anticipate the patterns of traffic distribution
between airports, and managers consequently over invest in second airports, over
building facilities for a traffic that is unlikely to be there. Some examples illustrate the
point:
* Edmonton: The International airport has been emptied as passengers flock to
the more convenient downtown Municipal Airport (Edmonton Airports, 1992, 1994);
* London: Despite long-term predictions that a Third London Airport was
urgently needed, the magnificent passenger buildings at London/Stansted are virtually
deserted (BAA, 1992);
* Montreal: Montreal/Mirabel, the International airport, receives about less than
3 million passengers a year, in facilities built 20 years ago for 6 to 10 million
passengers (Carr, 1994);
* Osaka: Planners for the new Osaka/Kansai airport failed to anticipate that the
convenient Osaka/Itami airport would remain open and thus over built facilities for the
opening;
* Washington: The major international airport at Washington/Dulles remained
largely underutilized for about two decades, despite strenuous regulations designed to
force airlines to use the facility (de Neufville, 1986, 1994).
How can airport managers avoid over investing in second airports? The answer is first
to understand how traffic develops at second airports, and then to adopt a management
process that suits this reality.
Theory and the analysis of practice indicate that the pattern of traffic distribution among
multiple airports in a region is determined by the dynamics of competition among the
airlines and airports. Their competitive behaviour leads to:
* concentration of traffic at primary airports, and
* volatility of traffic at second airports.
This reality means that investments in second airports, while clearly desirable in the
long run for large metropolitan regions, are risky in the short run. As always in dealing
with risky investments, prudent management minimises exposure and hedges risk.
Dynamic strategic planning seems to be the best approach to managing the
development of second airports (de Neufville, 1991). As indicated below, it is strategic,
making investments that insure the future; incremental, phasing modest investments
according to proven opportunities; and flexible, providing the insurance -- physical,
financial or organisational -- to adjust easily to future situations.
Concept of Multi-Airport Systems
A multi-airport system is the set of airports that serve the airline traffic of a metropolitan
area. The multi-airport system for London, for example, includes -- among others -- its
major airports: London/Heathrow, London/Gatwick and London/Stansted. The fact that
a single organisation, the BAA, owns and operates these airports reinforces the idea
that they are part of a system. Yet unity of ownership or control does not define the
system for transport planning and management -- the independently owned
London/Luton airport is certainly part of the London multi-airport system.
From the perspective of the users, a multi-airport system properly includes all the
airports that effectively serve the region. For example, the Baltimore airport is
effectively part of the multi-airport system serving the Baltimore- Washington region,
even though it is in a different state and under different ownership than
Washington/National and Washington/Dulles airports. It is even called the
Baltimore/Washington International Airport.
The fact that airports associated with different cities and jurisdictions can be part of the
same multi-airport system needs to be stressed. This concept is a definite shift from
past thinking, when airport planners generally assumed that airports served "catchment

areas", that the Baltimore airport only served Baltimore, the Washington airports only
served Washington, and so on.
The change to a functional, geographic definition of a metropolitan airport system
results from worldwide changes in urban structure. The combined effect of population
growth and the spread of rapid modes of transport such as expressways and high
speed rail systems, has been to extend cities over much wider areas, merge cities into
each other, and create metropolitan regions that function as a unit despite traditional
boundaries. Thus as a practical matter Baltimore and Washington merge as a market
for air transport, even though their centers are 60km. apart. Many Washington
suburbanites find it more attractive to use the Baltimore airport than either
Washington/National or Washington/Dulles.
Airline airports can be considered part of a multi-airport system if they are either:
* as close as one of the existing major airports for a significant fraction of the
metropolitan region, in particular the suburban centers of traffic, or
* officially so designated by local authorities.
The criterion of accessibility applies according to the context. Around Tokyo, where
urban travel is comparably difficult, it includes airports within about 2 to 3 hours. In the
United States it includes all airports within about an hour of the suburban centers of a
region, which are often located some distance from the traditional city center. For
Boston, for example, the multi-airport system properly includes three airports
(Providence, Rhode Island; Manchester, New Hampshire; and Worcester,
Massachusetts) that are closer in time to Bostonians along the ring road than the main
airport (Boston/Logan), although two of these airports serve the capitals of different
states.
The second criterion applies only in special situations. The most obvious case is that
of Sao Paulo/Viracopos, the international airport located some 100 km. from the city
center over difficult roads.
Military facilities, general aviation airfields without substantial airline service and
private airports closed to the public are not part of multi-airport systems for air
transport. They must be considered in the context of air traffic control. They can be

excluded, however, when considering how to develop airport capacity to serve airlines,
passengers and cargo.
Impetus for Successful Multi-Airport Systems
In the context of serving passengers and cargo, a multi-airport system is successful to
the extent that airlines and passengers use the several airports to some significant
degree. If the secondary airport is underutilized compared to its cost, it is a failure as a
transport investment, regardless of its technical features and architectural beauty.
London/Stansted -- over built for its prospective traffic -- might now be an example of
such a failure.
Successful multi-airport systems must be more likely to exist in metropolitan areas with
a high level of airline and passenger traffic: the greater the traffic, the more likely that
there will be enough to justify a second airport and a multi-airport system. Yet a high
level of passenger traffic is clearly not sufficient: Atlanta and Frankfurt are among the
busiest airports on their continents, but neither is part of a multi-airport system.
A second airport will be a transport success if it is sufficiently attractive, in comparison
with the alternative primary airport, to draw a sizable clientele. To develop successful
second airports, it is necessary to understand the factors that make them attractive.
The attractiveness of an airport is always defined in comparison to its competition.
Passengers and airlines will not use a second airport when they can get better service
elsewhere. To develop second airports, it is necessary to understand this competition.
The passengers' perspective
For passengers and shippers, a second airport is attractive when it provides convenient
access to desired air services. In thinking about this, it is necessary to distinguish
between originating and transfer traffic. Originating traffic consists of the passengers
who either live in the metropolitan area or who have been there for some time.
Transfer traffic on the other hand consists of the passengers who arrive at the airport
by plane for the purpose of changing to another aircraft to continue their journey.
Transfers require easy connections. They do not want to change between airports and,
rather than do so, prefer to connect through some other hub. Transfers thus do not

constitute a sizable market for second airports. The focus needs to be on the
passengers that originate in a region.
Originating passengers seeking access to air services consider two factors: the
geographic accessibility of an airport and the frequency of departures. Passengers
consider the time it takes both to get to the airport and to wait for a flight. Airports with
minimal air services are unattractive. Passengers routinely by-pass close airports to
use more distant airports that provide better service. Frequency of flights to any
destination is a key aspect of the value of the service to passengers. Airlines
recognize this and respond accordingly.
The Airlines' perspective
Airlines generally have considerable choice about which airport they serve, and choose
according to their commercial advantage. Sometimes they have to use a second
airport for technical reasons. This is the case when the runways at the primary airport
are too short for long-range aircraft, as they are for example at Milan/Linate,
Taipei/Shen Shan, and Washington/National. These exceptional cases modify the
general rules.
A second airport is commercially attractive to airlines if it provides a good market. That
is obvious. The subtlety comes in understanding how airlines decide when the market
at a second airport is worthwhile.
Airlines continually try to optimise the use of their major assets, that is their aircraft.
Specifically, the airlines allocate flights to routes, by means of large-scale optimisation
programmes. These procedures have the great virtue of being able to account not only
for the value of individual flights but, most importantly, for the multiplier effect of
concentrating flights in a market. Understanding this multiplier effect is the key to
appreciating the distribution of traffic to secondary airports.
Theory and experience indicate that the market share achieved by an airline is
disproportionate to its "frequency share", the fraction of the total flights it offers in a
market (Fruhan, 1972; de Neufville, 1976; Cohas, 1993). An airline that offers 60% of
the flights in a market may, for example, get 75% of the passengers. Airlines that
dominate a market will achieve higher yields and greater profits. Airlines thus try to
concentrate their flights to dominate markets, or at least prevent competitive airlines
from doing so. This is the competitive dynamic that leads airlines to match flights on
specific routes.
Because of this multiplier effect, the profitability of allocating any flight to a route is not
determined merely by its own loads. An additional flight in a major market reinforces
the value of the other flights in that market. When airlines consider the possibility of
allocating flights to secondary airports, they thus have to consider not only whether
they can achieve competitive load factors in the secondary market, but whether there is
sufficient additional traffic that will compensate for the loss in the airline's market share
in the major market. This is a subtlety that analysts all too often ignore.
This competitive dynamic that leads airlines to match flights on routes also leads them
to allocate flights to the primary airports rather than provide service to second airports.
This is a stable result of the competitive game between airlines (Gelerman and de
Neufville, 1973).
When airlines have the choice, they tend to allocate flights to secondary airports either
when their primary airport either is heavily congested or has so much frequency that
there is little penalty to allocating a flight elsewhere, which occurs only when the
primary airport has very high levels of traffic. In short, airlines voluntarily use second
airports only when the metropolitan traffic is substantial.
Pattern of Concentration
The dynamics of the competition between airlines thus establish a pattern of
concentration of traffic among the airports in multi-airport systems. The evidence
demonstrates this quite clearly. As Table 1 indicates, the second busiest airport in a
multi-airport system now typically has 3 times less traffic than the busiest airport.
[Table 1 about here]
As a rule, second airports only have more than 50% of the traffic of the busiest airport if
there are overwhelming political or technical constraints to the concentration of traffic.
At Tokyo, Washington, Osaka and Montreal for instance, the government mandated
international flights to use more distant airports. In Paris, the French government

directed its national carrier, Air France, to serve Paris/de Gaulle. The more accessible
airports in Washington, Taipei, Houston/Galveston and Buenos Aires have technical
restrictions that force flights to use second airports.
Second airports will also have traffic comparable to the primary airport when the traffic
to the metropolitan region is so large that is saturates several major airports. This
situation only exists in the busiest centers of air transport, currently New York and
London. Note that the traffic to these regions still concentrates noticeably, as indicated
by the relatively low levels of traffic at their third, fourth and fifth airports.
The pattern of concentration of traffic is so important that it extends to the type of traffic
that locates at secondary airports. The traffic at the several airports in a multi-airport
system differ not only in size but in character. Each airport tends to concentrate on its
own market. Secondary airports, being smaller, tend to serve niche markets. The
traffic that does develop at second airports is not just a random spill-over of traffic that
does not get served at the principal airport in the system. The traffic at secondary
airports is normally a concentrated block of specialised traffic, often represented by just
one dominant airline, as Table 2 indicates.
[Table 2 about here]
This pattern of concentration of air transport is an example of a larger phenomenon. It
is a commonplace of location theory and urban planning that services concentrate.
Cities thus have financial districts, theatre districts and so on.
The concentration of traffic at specific airports in a multi-airport system is inevitable. It
has withstood many governmental attempts to alter it, in London and Washington in
particular (see de Neufville, 1986 and 1994 for detailed examples). Traffic
concentration is a persistent phenomenon that airport managers must deal with
realistically.
Threshold of Viability
Combination of the passengers' perspective that leads to a focus on originating
passengers, with the airlines' perspective that emphasizes concentration of flights at
the primary airport, implies that multi-airport systems will be most successful only when
the level of originating traffic is quite high. The evidence validates this conclusion.
The worldwide data on all the metropolitan regions with the most traffic (Table 3)
illustrates a simple and most important proposition:
Above a threshold level of originating traffic from a metropolitan region, the
multi-airport system will be successful. Below this level it is only successful if
the primary airport is limited technically or if special political circumstances
apply.
The threshold for successful multi-airport systems is now around 10 million originating
passengers a year. It has been rising over time, along with the introduction of wide-
body aircraft, the improvements in air traffic control and peak spreading -- all of which
permit more frequent operations from existing runways. A decade ago this threshold
was about 8 million originating passengers a year (de Neufville, 1984a, 1984b, 1985a,
1985b). If the trend continues, the threshold may reach 12 million originating
passengers a year sometime before the year 2010.
[Table 3 about here]
Table 4 completes the inventory of multi-airport systems worldwide. As can be seen,
multi-airport systems for regions with less than 10 million originating passengers a year
exist almost exclusively from technical necessity or overwhelming political reasons.
The situation for Oslo is unclear as the development at Gardemoen seems uncertain.
Glasgow and Edinburgh perhaps ought not to be considered part of a multi-airport
system, these cities are about 80km. apart which may appear considerable although it
is not in other contexts. The lack of any salient examples of multi-airport systems that
are successful for commercial reasons validates the concept of the threshold for
success.
[Table 4 about here]
Traffic Volatility
Traffic at second airports is especially volatile and variable compared to traffic at major
metropolitan airports. It tends to fluctuate by large percentages over the short term.
This phenomenon complicates both the physical and the financial planning for second
airports.
The natural uncertainties in traffic (see de Neufville, 1976 for example) are amplified at
secondary airports, because their traffic is small. A shift of traffic from one airport to
another obviously has a relatively much larger effect on the smaller facility: what is
comparatively small for the big airport is ten times as significant for an airport with only
a tenth of the region's traffic -- as typical of many second airports.
The volatility of traffic at secondary airports is further increased because these are
often dominated by specialised carriers. When the activities of these smaller airlines
shift, as they frequently do, the traffic at the secondary airport can change radically
both in level and in character.
The recent experience at Chicago/Midway illustrates the problem, see Table 5. In 1990
and 1991 its total annual traffic was both small (around 6 million total passengers, that
is 3 million emplanements or about 10% of the Chicago traffic) and specialized, since
Midway Airlines accounted for about two-thirds of the passenger traffic. When Midway
Airlines ceased operations in November 1991, the effect on Chicago/Midway was
tremendous: the airport lost not only about one-third of its traffic but also around
$700,000 a month in concession revenues (Cohas, 1993). Meanwhile, any impact on
the traffic at Chicago/O'Hare was barely perceptible.
[Table 5 about here]
The volatility of traffic at an airport is usefully defined as a percentage change around
the long term trend (de Neufville and Barber, 1991). Specifically, a practical formula is:
Volatility = [(Actual Traffic - Trend Traffic)/Trend] 100
The higher volatility of traffic at second airports was demonstrated analytically by
Cohas (1993). He examined three multi-airport systems, those of New York, San
Francisco and Washington, using quarterly data over the eleven-year period of 1980
through 1990, and found that the volatility of traffic at the secondary airports was
clearly higher than at the primary airports. Table 6 gives the details.
[Table 6 about here]
Traffic is, furthermore, much more volatile in a deregulated environment than under
strict regulation that prevents airlines from rapidly changing their routes, fares or
frequency of service (de Neufville and Barber, 1991). For regions experiencing
deregulation, such as the European Common Market in the 1990's, it can be expected
that the traffic at secondary airports will be doubly volatile -- once because of the
airlines' new freedom to move operations, and again because of the greater
vulnerability of secondary airports.
Traffic at the secondary airports with less than 1 million total annual passengers (that
is, less than 500 thousand emplanements) can be expected to be most highly variable.
The statistics in Table 7 illustrate some possibilities.
[Table 7 about here]
Planning Issues
The appraisal of how and why multi-airport systems develop brings three issues to the
fore. First, managers of larger airports need to develop a vision, a strategy of how and
where they will develop the multi-airport system they already or may soon have.
Second, they should develop relatively modest programs of investment at second
airports, suitable to the relatively low levels of traffic at these platforms. Third, they
should insist that these plans be flexible, and can easily be adapted to various levels
and types of traffic.
A Strategic Vision
Since multi-airport systems seem inevitable for large metropolitan areas, airport
managers in those regions ought to plan actively for their intelligent development.
Specifically, they need to determine and acquire sites for prospective second airports.
If airport planners do not secure a site early, the natural growth of the built-up areas of
the city will tend to preclude the most accessible, desirable sites.
All regions with 10 to 15 million passengers a year probably should develop a vision of
how they will develop their multi-airport system. These regions may have 30 to 40
million passengers a year in about 15 years, and thus be beyond the threshold for a
successful multi-airport system. (This assumes that the compound rate of growth of air
traffic is in the plausible range of between 5 to 7 percent annually.) Experience shows
that it may easily take 10 to 15 years to select, acquire and develop a site for a second
airport.
Securing a site for a second airport insures that future developments will be possible.
As it is impossible to determine what kind of airport will be needed so far in advance,
no major investments in facilities are appropriate until needs are demonstrated.
However, if a site is truly to represent an option for future development, it must actually
be an airport. If the site looks like a nature preserve, as does the land set aside for the
one-time putative Toronto/Pickering airport, its later transformation into an airport may
be politically impossible.
To secure a site as an option for future development, it seems necessary to lay down
some kind of runway and establish some pattern of use. This is what the developers of
the Fort Worth/Alliance airport did.
Managers in regions that already have several active airports should likewise define
how they will develop these facilities. They need to make sure that their investments
will accord with the patterns of relatively low, specialised traffic that are characteristic of
second airports. In short, they ought to avoid the kind of financially wasteful
investments apparently typified by the expensive, and virtually unused passenger
buildings at London/Stansted.
Incremental Investments
When future demands are certain, it makes sense to build large facilities, achieve
economies of scale and thus reduce the present value cost of providing for some level
of need. There is a trade-off between the economies of scale that accrue to a design
and the cost of the money required to build in advance of need. The determination of
the optimum level of construction in advance of need is quite straightforward (see de
Neufville, 1990b, for a textbook presentation).

When future demands are quite uncertain, as they have been for second airports, it is
wasteful to build far in advance of need. This is because an over built facility can
become a white elephant if anticipated demands do not materialise. This is what
happened at Montreal/Mirabel, London/Stansted and at New York/Newark, where the
owners literally boarded up a major terminal for more than a decade, and at
Washington/Dulles, which was under utilised for nearly 20 years.
When there are risks, prudent managers buy insurance. In the case of constructed
facilities, the obvious insurance against having white elephants is to build facilities only
incrementally, according to demonstrated need. The cost of this insurance is the loss
of economies of scale and the resulting higher costs per unit of capacity. The value of
this insurance is, of course, the potential savings that result from not having to pay for
capacity that turns out to be unneeded.
The optimum level of insurance to buy as a hedge against uncertain future levels of
traffic is easy to calculate by decision analysis. The idea is to maximise expected value
by weighting the consequences of possible futures by their estimated probability (see
de Neufville, 1990b, for a textbook presentation). This method is at the heart of the
dynamic strategic planning procedure discussed in the next session.
Uncertainty in the traffic at second airports concerns more than the level of traffic. The
type of traffic at secondary facilities is also quite changeable. A decade ago, no
designer anticipated that Washington/Dulles would develop as a transfer hub for United
Airlines, or that Los Angeles/Ontario would become a major cargo center for UPS,
which still is primarily a trucking company.
Flexible Plans
Because the type of traffic is variable at second airports, the configuration and the
nature of the facilities ought also to be flexible. For example, the planners should
design passenger buildings that can easily be reconfigured to accommodate different
proportions of domestic and international traffic, or of transfer and terminating traffic. In
this context it is well known that some designs (such as gate-arrival or unit terminals)
are quite inflexible (see de Neufville, 1973).

When investing in risky projects such as second airports, managers should consider
using the payback criterion to evaluate alternatives -- along with the traditional rate of
return methods. The payback analysis disregards all benefits that occur beyond the
payback period, which is normally only a few years. When these later consequences
are so uncertain, it may be just as well to set them aside and focus on immediate
consequences that are quite certain, as to sully the evaluation with quite speculative
benefits. The managers of the Toronto airport have used this approach successfully
(McCoomb. 1994).
Dynamic Strategic Plan
Dynamic strategic planning is the approach to take when the future cannot be forecast
accurately. The approach is:
1) Strategic, in that it takes the long term view; and
2) Dynamic, in that it recognizes and thus anticipates the need to adjust
plans to meet the actual circumstances that eventually prevail
This approach consists of three elements (Clark et al, 1994):
1) Recognition of the risk;
2) Analysis of the consequences of different choices at different periods,
using what is known as "decision analysis" in operational research; and
3) Choosing a strategy of development that commits only to immediate
decisions and that buys flexibility to respond to future developments.
A most practical way to recognise the risk of investing in second airports is to collect
data on similar facilities, in similar contexts, over the previous 10 to 20 years. This
exercise will demonstrate that forecasters do not manage to anticipate correctly what
the traffic will be a decade hence, which is a minimal period for major construction. The
exercise will also provide a reasonable approximation of the range of variation in the
forecasts and the probability of specific deviations from the most likely forecast. As a
result, managers should have a fair assessment of the real risks they face.
With the estimates of risk, managers can estimate the consequences of alternative
investments using decision analysis. Since the future is uncertain, these outcomes are
assessed as expected values (see de Neufville, 1990b, for a textbook explanation of
the method). The analysts will associate these results, together with the possible range
of outcomes, with each of the scenarios for phasing investments over time that are
under consideration. With the recent development of computer programmes to do this
on personal computers, this seemingly arduous task is quite easy. Once these results
are available, it is relatively simple to choose the best strategy to initiate.
Choosing an initial strategy of development only commits to a first phase, of course.
Because the future is uncertain, good planning will respond to whatever events unfold.
Good managers will therefore choose their investments in later phases according to
how the market and traffic have developed. To insure that they can do this, they will
have chosen designs that are flexible -- these are the ones that will emerge as
preferable from the decision analysis.
Doing dynamic strategic planning is comparable to playing chess well: the planner
considers many moves ahead, but commits to only one move at a time -- moreover the
decision-maker chooses this move to provide flexible response to future challenges,
either to protect against threats or to exploit opportunities.
In practical terms for planning multi-airport systems, dynamic strategic planning leads
to:
1) Building up incrementally the capabilities of the primary airport in a
system -- to give the region the accessibility to compete effectively with other regions
for business, industrial and touristic activity; while
2) Safeguarding the possibility of developing major additions to capacity in
the future, such as new runways or second airports in the system.
This is the approach successfully taken for the development of the multi-airport system
for Sydney, Australia (See de Neufville, 1991). In that case, the Federal Government
recognized the desirability of both developing more airport capacity where it would do
the most good immediately (at the existing primary airport of Sydney/Kingsford Smith)
and providing future capacity for the region, when and if it would be needed, by
reserving a sufficient site for at major second airport (at Badgery's Creek, now named
Sydney/West).
Acknowledgments

This paper has benefited from many suggestions from colleagues at the Aeroports de
Paris, the Cranfield Department of Air Transport, the Massachusetts Institute of
Technology, Transport Canada, and the US Federal Aviation Administration. The FAA
supported the two reports on which this paper is built (de Neufville, 1986 and 1994).
References
Alamdari, F. and Black, I. (1992) "Passengers' Choice of Airline under Competition: theuse of the Logit Model," Transport Reviews, Vol.12, No.2, pp. 152-170.
Ashford, N.(1989) "Predicting the Passengers' Choice of Airport," Airport Forum, No.3,pp.42-44.
Ashford, N. and Bencheman, M. (1987) "Passengers' Choice of Airport: An Applicationof the Multinomial Logit Model," Transportation Research Record 1147, pp. 1-5.
Australia, Department of Aviation (1985) Second Sydney Airport: Site SelectionProgramme, Draft Environmental Impact Statement, Canberra, ACT.
BAA plc (1992) 1991 Annual Review, London, England.
Brooke, A.S., Caves, R.E. and Pitfield, D.E. "Methodology for predicting Europeanshort-haul air transport demand from regional airports," Journal of Air TransportManagement, Vol.1, No.1, March, pp.27-46.
Carr, D. (1994) "Answers lie in the pockets of passengers," Airport Review, Vol. 6, No.6, December, pp. 27-28.
Clark, J., Field, F., and de Neufville, R. (1994) Manual of Case Studies andApplications in Dynamic Strategic Planning, Revised version, Technology and PolicyProgram, Massachusetts Institute of Technology, Cambridge, MA.
Cohas, F. (1993) "Market-Share Model for a Multi-Airport System," Master of ScienceThesis, Department of Aeronautics and Astronautics and Technology and PolicyProgram, Massachusetts Institute of Technology, Cambridge, MA.
de Neufville, R. (1976) Airport Systems Planning: A critical look at the Methods andExperience, Macmillan, London (UK) and MIT Press, Cambridge, MA (USA).
de Neufville, R. (1984a) "Multi-airport Systems -- How do they work best?" AirportForum, June, pp.55-59.
de Neufville, R. (1984b) "Planning for Multiple Airports in a Metropolitan Region," BuiltEnvironment, 10, No.3, pp.159-167.

de Neufville, R. (1985a) "Systemes Metropolitains d’Aeroports -- Commentfonctionnnents-ils le mieux?" Cahiers du Transport, pp.25-30.
de Neufville, R. (1985b) "The Role and Nature of a SecondAirport," Chapter 2 in Australia, Department of Aviation (1985).
de Neufville, R. (1986) "Multi-Airports in Metropolitan Regions -- A Guide for policybased upon the analysis of experience in distributing traffic among airports", Reportsubmitted to the US FAA under Procurement Request 42-5293.
de Neufville, R. (1990a) "Airport System Alternatives," Chapter 5 in Federal AirportsCorp.(1990).
de Neufville, R. (1990b) Applied Systems Analysis: Engineering Planning andTechnology Management, McGraw-Hill, New York.
de Neufville, R. (1991) "Strategic Planning for Airport Capacity," Australian Planner,29, No.4, pp.174-180.
de Neufville, R. (1994) "Planning Multi-Airport Systems in Metropolitan Regions in the1990s," Report submitted to the US FAA under Procurement Order DTFA01-92-P-01243.
de Neufville, R. and Barber, J. (1991) "Deregulation Induced Volatility of AirportTraffic," Transportation Planning and Technology, Vol.16, pp. 117-128.
Doganis, R. (1994) "The Impact of liberalization on European airline strategies andoperations," Journal of Air Transport Management, Vol.1, No.1, March, pp.15-25.
Edmonton Airports (1992) The Muni & the International, Edmonton, Alberta.
Edmonton Airports (1994) Aviation Statistics Summary, Edmonton, Alberta.
Federal Airports Corp.(1990) Proposed Third Runway: Sydney (Kingsford Smith)Airport, Draft Environmental Impact Statement, Mascot, NSW, Australia.
Fruhan, W.E., Jr. (1972) The Fight for Competitive Advantage, Harvard BusinessSchool, Boston, MA.
Gelerman,W. and de Neufville, R. (1973) "Planning for Satellite Airports," ASCETransportation Journal, August, pp. 537-551.
Harvey, G.(1987) "Airport Choice in a Multiple AirportRegion," Transportation Research, Vol.21A, No.6, pp. 439-449.
International Civil Aviation Organization (1993) Airport Traffic 1991, Digest of StatisticsNo.394, Series AT-34, Montreal, Canada.

International Civil Aviation Organization (1994) Civil Aviation Statistics of the World1993, 19th. ed., ICAO Doc. 9180/19, Sept., Montreal, Canada.
Hong Kong, Provisional Airport Authority (1991) New Airport Master Plan,Environmental Impact Statement, Final Report Prepared by Greiner-Maunsell,December
Kanafani, A. and Ghobrial, A. (1985) "Airline Hubbing -- Some Implications for AirportEconomics," Transportation Research, Vol.19A, No.1, pp. 15-27.
Maldonado, J.(1990) Strategic Planning: am Approach to Improving Airport PlanningUnder Uncertainty, Master of Science Thesis, Technology and Policy Program,Massachusetts Institute of Technology, Cambridge, MA.
Mao, C.K.(1993) "Developing CKS Airport as an Air Transportation Hub in the AsiaPacific Region," Presented at the 17th. Joint Conference of USA-ROC and ROC-USAEconomic Councils, Hilton Head, SC, Sept.
Massachusetts, Port Authority (1989) Boston Regional Airport System Study, RevisedFinal Report, July, Prepared by Flight Transportation Associates, Cambridge, MA.
McCoomb, L. (1994) Personal communication.
Minnesota, Metropolitan Council (1990) Major New Airport Search Area DesignationEnvironmental Review Process, Publication 559-90-159, October, St.Paul, MN.
Ozoka, A. and Ashford, N. (1989) "Application of Disaggregate Modeling in AviationSystems Planning in Nigeria: a Case Study," Transportation Research Record 1214,National Research Council, Washington, DC, pp.10-20.
Page, K. (1994) "Rethink needed for Privatisation Plans," Jane's Airport Review,Jan/Feb., pp.13-15.
Peat, Marwick (1989) New Airport Economic Analysis, final report, Prepared for the Cityand County of Denver, August.
Port of Seattle, Puget Sound Air Transportation Committee, Flight Plan Project (1991)Phase II: Development of Alternatives, Final Report, June.
Republic of China, Ministry of Transportation and Communications, Institute ofTransportation (1992) Development of an Air Transportation Hub in the Taiwan Area,Taipei, Taiwan.
SH&E (1993) Edmonton Area Airports -- Air Service Development Options, Waltham,MA, Nov.
St.Louis, Airport Authority (1992) Lambert-St.Louis International Airport Master Plan,Prepared by Landrum and Brown, September, St. Louis, MO.
Transportation Research Board, Committee for the Study of Long-Term AirportCapacity Needs (1990) Airport System Capacity: Strategic Choices, Special Report226, National Research Council, Washington, DC.
Transportation Research Board (1991) Winds of Change: Domestic Air Transport SinceDeregulation, Special Report 230, National Research Council, Washington, DC.
U.K., Commission on the Third London Airport (1970) Papers and Proceedings, HerMajesty's Stationery Office, London.
U.K., Commission on the Third London Airport (1971) Report, Her Majesty's StationeryOffice, London.
U.K., Department of Trade (1975) Airport Strategy for Great Britain Part 1: The LondonArea, Her Majesty's Stationery Office, London.
U.K., Department of Trade (1976) Airport Strategy for Great Britain Part 1: RegionalAirports, Her Majesty's Stationery Office, London.
U.K., Department of Transport, Working Group on Runway Capacity to Serve the SouthEast (RUCATSE) (1993) Runway Capacity to Serve the South East, Report, July, HerMajesty's Stationery Office, London.
U.S., Federal Aviation Administration, Research and Special Projects Administration(Yearly) Airport Activity Statistics of Certified Route Air Carriers (12 months endingDec.31,), Washington, DC.
U.S., Federal Aviation Administration, Research and Special Projects Administration(1993) Airport Activity Statistics of Certified Route Air Carriers (12 months endingDec.31, 1992), FAA-APO-93-8, Washington, DC.
U.S., Federal Aviation Administration (1992a) Federal Aviation Regulations, Part 93 --Special Air Traffic Rules and Airport Traffic Patterns, Subpart K -- High DensityAirports.1
U.S., Federal Aviation Administration (1992b) Federal Aviation Regulations, Part 91 --General Operating and Flight Rules, Subpart I -- Operating Noise Limits.
U.S., Federal Aviation Administration (1992c)) Federal Aviation Regulations, Part 93 --Special Air Traffic Rules and Airport Traffic Patterns.2
U.S., Office of Technology Assessment, (1982) Airport and Air Traffic Control Systems,Government Printing Office, Washington, DC.
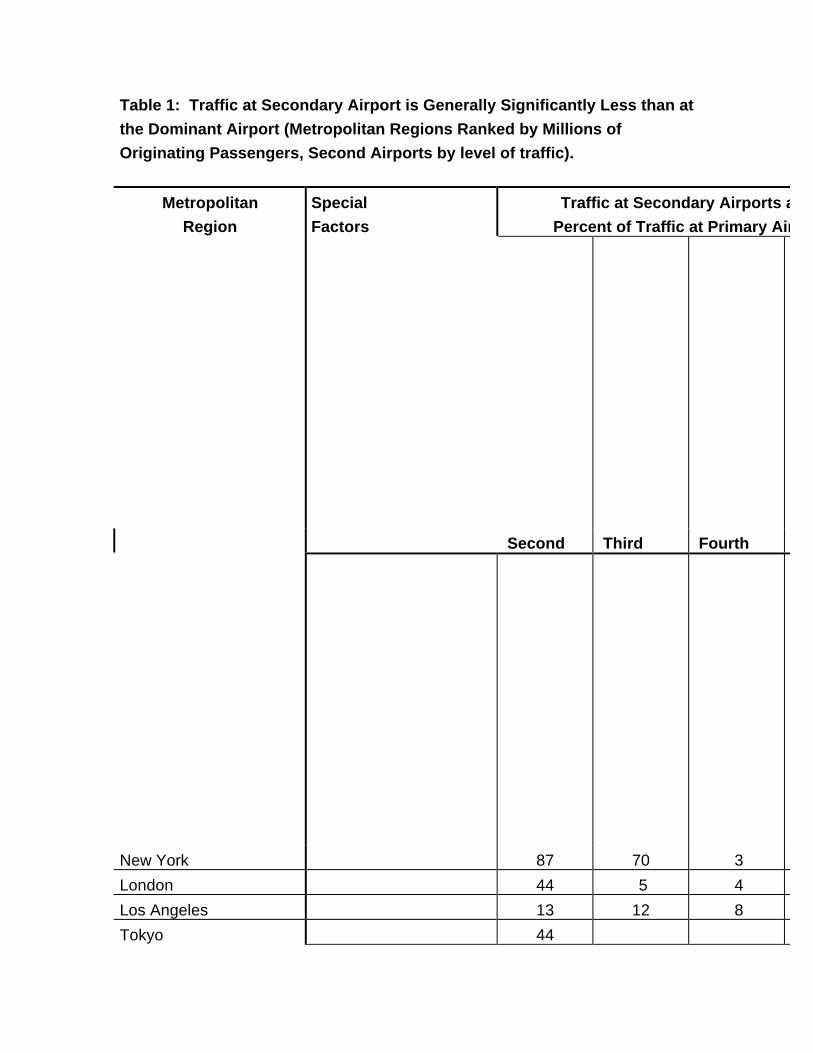
Table 1: Traffic at Secondary Airport is Generally Significantly Less than at
the Dominant Airport (Metropolitan Regions Ranked by Millions of
Originating Passengers, Second Airports by level of traffic).
Metropolitan
Region
Special
Factors
Traffic at Secondary Airports as a
Percent of Traffic at Primary Airport
Second Third Fourth
New York 87 70 3
London 44 5 4
Los Angeles 13 12 8
Tokyo 44

Paris 99
Chicago 7
San Francisco 18 17
Washington /
Baltimore
Technical 48 43
Miami 26 18
Dallas /
Fort Worth
12
Boston 9 2 1
Osaka NA
Taipei Technical 38
Houston /
Galveston
Technical 42
Manchester, UK 5 1
Rhine-Ruhr
Valley
Political 27
Hong Kong Political 10
Milan Technical 25
Moscow Political NA
Oslo 11
Rio de Janeiro Technical NA
Montreal 53
Berlin Political NA
Glasgow 57 2
Buenos Aires Technical 80
Edmonton 65
ent 27
s less ~ 4
Sources:ICAO (1993) Airport Statistics 1991ICAO (1994) Aviation Statistics of the World, 1993 ;U.S.FAA (1993) Airport Activity StatisticsU.K.DoT (1993) RUCATSE ReportMao (1993) Developing CKS Airport...Edmonton Airports (1994)
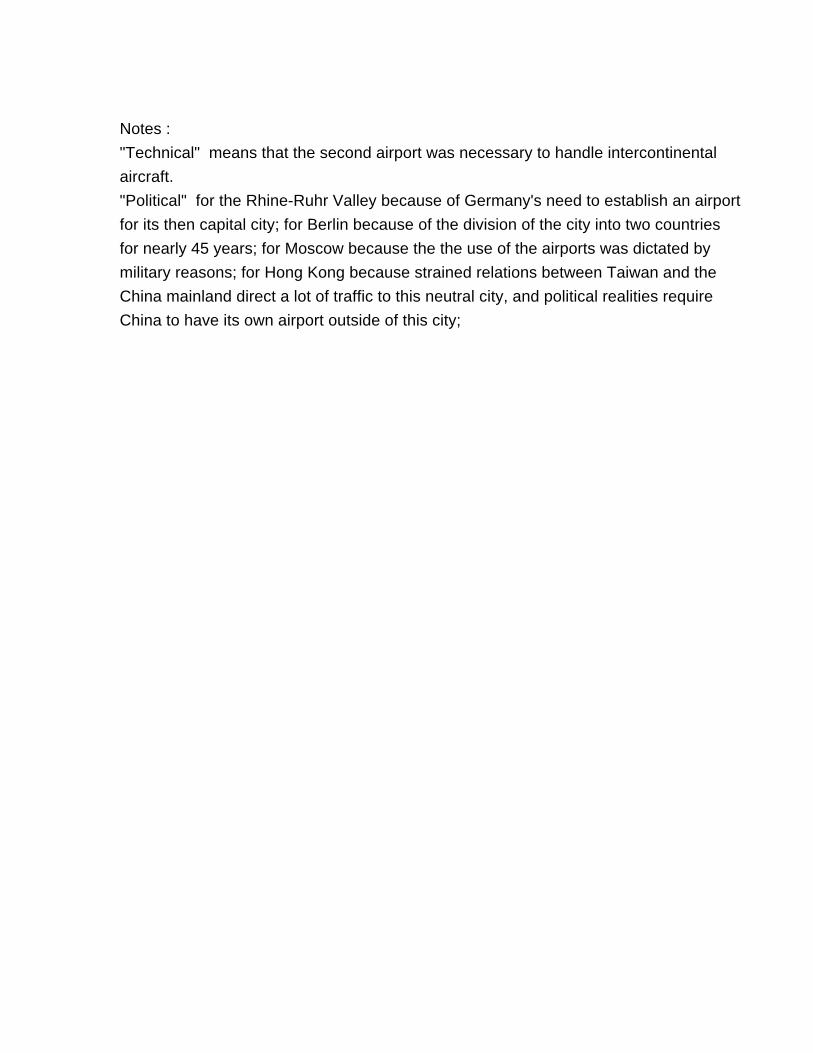
Notes :
"Technical" means that the second airport was necessary to handle intercontinental
aircraft.
"Political" for the Rhine-Ruhr Valley because of Germany's need to establish an airport
for its then capital city; for Berlin because of the division of the city into two countries
for nearly 45 years; for Moscow because the the use of the airports was dictated by
military reasons; for Hong Kong because strained relations between Taiwan and the
China mainland direct a lot of traffic to this neutral city, and political realities require
China to have its own airport outside of this city;

Table 2: Role of Second Airports in Metropolitan Regions
Metropolitan
Region
Second
Airports
Special
Roles
New York Newark
LaGuardia
Hub for Continental/SAS
Short-range
London Gatwick
Luton
Stansted
Non-British Airways
Summer tour
???
Los Angeles Ontario
Orange Co.
Burbank
Hub for UPS
Short-Range
Short-Range
Tokyo Narita International
Paris de Gaulle
Orly
Intercontinental
Domestic and African
Chicago Midway Hub for Midway
San Francisco San Jose
Oakland
Hub for American
Local Traffic
Washington /
Baltimore
Dulles
Baltimore
International; Hub for UAL
Local Traffic
Miami Ft.Lauderdale
West Palm Beach
Local Traffic
Local Traffic
Dallas /
Fort Worth
Love Field Short Range
Boston Providence Local Traffic
Osaka Kansai International
Taipei Shen Shan Domestic
Houston /
Galveston
Hobby Local Traffic
Manchester, UK
Rhine-Ruhr
Valley
Koln/Bonn Capital Traffic
Hong Kong Shenzhen Mainland China
Milan Malpensa International
Moscow Vnukovo
Oslo Gardemoen Summer tours

Rio de Janeiro Santos Dumont Local Traffic
Montreal Mirabel International
Berlin Schonfeld Local Traffic
Glasgow Edinburgh Local Traffic
Buenos Aires Ezeiza Local Traffic
Edmonton Municipal Local Traffic
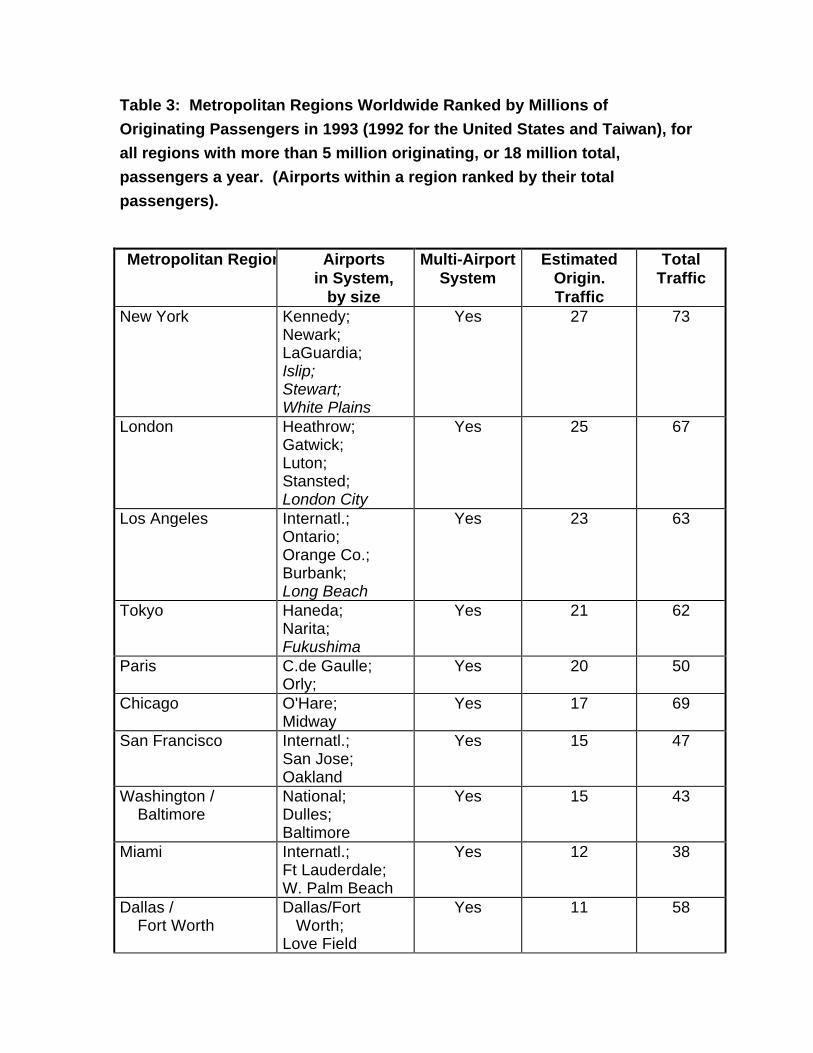
Table 3: Metropolitan Regions Worldwide Ranked by Millions of
Originating Passengers in 1993 (1992 for the United States and Taiwan), for
all regions with more than 5 million originating, or 18 million total,
passengers a year. (Airports within a region ranked by their total
passengers).
Metropolitan Region Airportsin System,
by size
Multi-AirportSystem
EstimatedOrigin.Traffic
TotalTraffic
New York Kennedy;Newark;LaGuardia;Islip;Stewart;White Plains
Yes 27 73
London Heathrow;Gatwick;Luton;Stansted;London City
Yes 25 67
Los Angeles Internatl.;Ontario;Orange Co.;Burbank;Long Beach
Yes 23 63
Tokyo Haneda;Narita;Fukushima
Yes 21 62
Paris C.de Gaulle;Orly;
Yes 20 50
Chicago O'Hare;Midway
Yes 17 69
San Francisco Internatl.;San Jose;Oakland
Yes 15 47
Washington / Baltimore
National;Dulles;Baltimore
Yes 15 43
Miami Internatl.;Ft Lauderdale;W. Palm Beach
Yes 12 38
Dallas / Fort Worth
Dallas/Fort Worth;Love Field
Yes 11 58

Boston Logan;Providence;Manchester,NHWorcester
Yes 10 25
Osaka Itami;Kansai
Yes 10 24
Taipei Chiang Kai Shek;Shen Shan
Technical 9 18
Atlanta 8 45Frankfurt 8 30Toronto International;
Island;Hamilton
Insigni-ficant
7 19
Seoul Kimpo;Young Jong inconstruction
8 21
Orlando 7 17Las Vegas 7 17Rome Fuimicino;
CiampinoInsigni-ficant
7 19
Madrid 7 18Houston / Galveston
Intercont.;Hobby
Technical 6 27
Denver 6 27Detroit Metro;
CityInsigni-ficant
6 23
Honolulu 6 21Amsterdam 6 19Singapore 6 17Bangkok Don Muang;
Second Bangkokin development
6 15
Manchester Internatl;Leeds/ BradfordLiverpool
Insigni-ficant
6 15
Sydney KingsfordSmith;Sydney Westin development
6 14
Madrid 6 14Rhine-Ruhr Valley
Dusseldorf;Koln/Bonn
Political 6 14
Stockholm Arlanda;Bromma
Insigni-ficant
6 13

Phoenix 5 22Hong Kong Kai Tak;
Shenzhen;Chep Lak Kokunder const.
Political 5 23
St. Louis 5 20Minneapolis / St.Paul
5 19
Seattle 5 18Sources:ICAO (1993) Airport Traffic 1991 ;ICAO (1994) Aviation Statistics of the World, 1993 ;U.S.FAA (1993) Airport Activity Statistics ;U.K.DoT (1993) RUCATSE Report ;Mao (1993) Developing CKS Airport
Airports in Italics have less than 1 million total passengers a year.
Notes :"Technical" means that the second airport was necessary to handle intercontinentalaircraft."Political" for the Rhine-Ruhr Valley because of Germany's need to establish an airportfor its then capital city; for Hong Kong because strained relations between Taiwan andthe China mainland direct a lot of traffic to this neutral city, and political realities requireChina to have its own airport outside of this city;"Insignificant" means that the second airport serves less than 1 million totalpassengers a year and a trivial fraction of the traffic for the region, so that amulti-airport system is embryonic.

Table 4: Metropolitan Regions Worldwide With Multi-Airport Systems butless than either 5 million Originating, or 18 million Total, Passengers in1993 (Airports within a region ranked by their total passengers).
MetropolitanRegion
Airportsin System,
by size
Multi-AirportSystem
EstimatedOriginat'g
Traffic
TotalTraffic
Milan Linate;Malpensa
Technical 5 12
Moscow Shreremetyevo;Vnukovo;Domodedovo
Political 4 9
Oslo Fornebu;Gardemoen
Yes 3 7
Rio de Janeiro Galeao;Santos Dumont
Technical 3 7
Montreal Dorval;Mirabel
Yes 3 7
Berlin Tegel;Schonfeld;Tempelhof
Political 3 7
Sao Paulo Garulhos;Viracopos
Technical 3 7
Glasgow/ Edinburgh
Glasgow;Edinburgh;Prestwick
Maybe 3 7
Buenos Aires AeroparqueEzeiza
Technical 3 7
Edmonton InternationalMunicipal
Technical 1 3
Sources:ICAO (1993) Airport Traffic 1991ICAO (1994) Civil Aviation Statistics of the World, 1993BAA (1992) 1991 Annual ReviewEdmonton Airports (1994) Aviation Statistics
Airports in Italics have less than 1 million total passengers a year.
Notes :
"Technical" means that the second airport was necessary to handle intercontinental
aircraft.

"Political" for Berlin because of the division of the city into two countries for
nearly 45 years; for Moscow because the the use of the airports was dictated by
military reasons;
"Insignificant" means that the second airport serves less than 1 million total
passengers a year and a trivial fraction of the traffic for the region, so that a
multi-airport system is embryonic.

Table 5 : Rapid fluctuations in Traffic at Secondary Airport of
Chicago/Midway
Airport;
Airline
Emplanements in thousands, by year; Percent
1987 1988 1989 1990 1991 1992
Chicago/Midway 2541 3174 3410 3547 2937 1972
Midway Airline, % 65 65 65 71 69 0
Source:
U.S.FAA (1993) Airport Activity Statistics
Table 6 : Increased Volatility of Traffic at Individual Airports in Multi-
Airport Systems
Multi-Airport System Higher Traffic Volatility
at Individual Airports (%)
New York + 10
San Francisco + 86
Washington / Baltimore + 127
Source:
Cohas (1993)

Table 7 : Rapid fluctuations in Traffic at North American Secondary
Airports with less than 0.5 Million Annual Emplanements
Emplanements in thousands, by year
Airport 1987 1988 1989 1990 1991 1992
Detroit City 0 130 345 363 321 284
Hamilton 9 48 75 56 39 25
Island 200 168 141 135 72 78
Islip 495 513 427 422 415 375
Long Beach 605 579 662 693 650 400*
Manchester, NH 112 169 229 268 293 282
Stewart 0 0 0 183 357 325
White Plains 174 117# 145 160 178 203
Worcester 92 142 129 105 74 68Sources:U.S.FAA (1998 to 1993) Airport Activity Statistics Transport Canada (1993) Official Forecasts
* Between 1991 and 1992 American Airlines, which had 227 thousand
emplanements at Long Beach in 1991, dropped its service, causing a drop of
about 40% in emplanements at Long Beach.
# Between 1987 and 1988 Continental Airlines, which had 68 thousand
emplanements at White Plains in 1987, dropped its service, causing a drop of
about 40% in emplanements at White Plains.
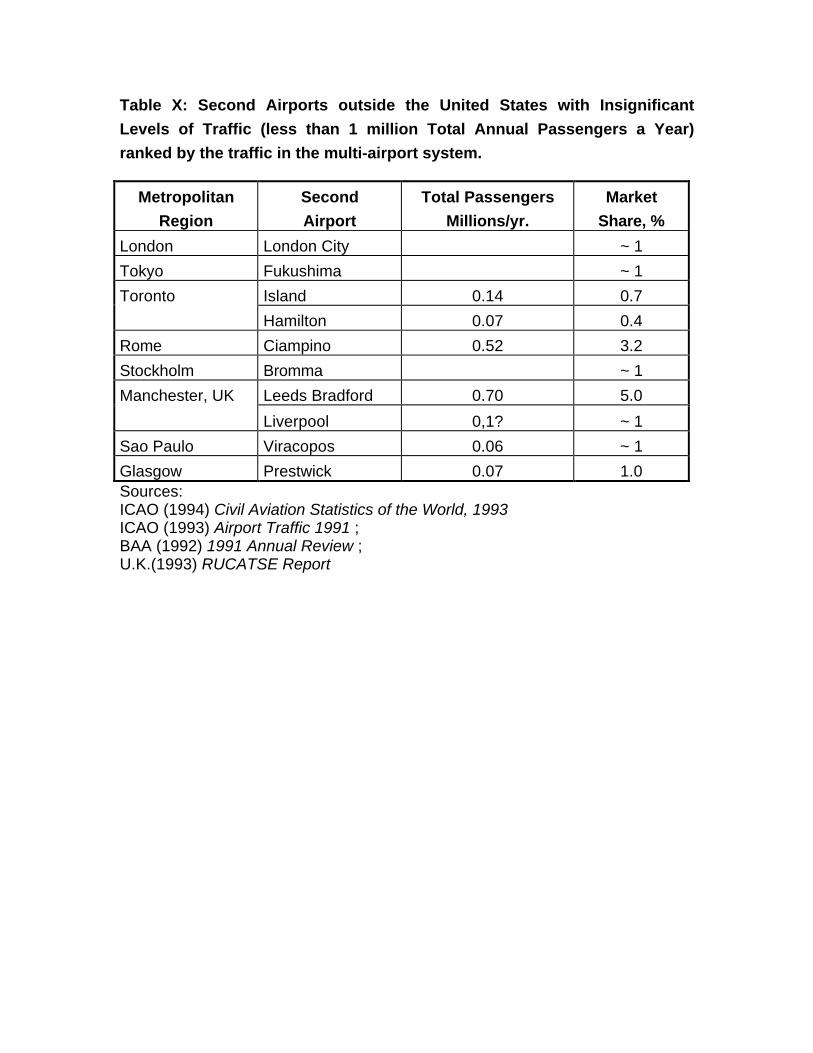
Table X: Second Airports outside the United States with Insignificant
Levels of Traffic (less than 1 million Total Annual Passengers a Year)
ranked by the traffic in the multi-airport system.
Metropolitan
Region
Second
Airport
Total Passengers
Millions/yr.
Market
Share, %
London London City ~ 1
Tokyo Fukushima ~ 1
Toronto Island 0.14 0.7
Hamilton 0.07 0.4
Rome Ciampino 0.52 3.2
Stockholm Bromma ~ 1
Manchester, UK Leeds Bradford 0.70 5.0
Liverpool 0,1? ~ 1
Sao Paulo Viracopos 0.06 ~ 1
Glasgow Prestwick 0.07 1.0Sources:ICAO (1994) Civil Aviation Statistics of the World, 1993ICAO (1993) Airport Traffic 1991 ;BAA (1992) 1991 Annual Review ;U.K.(1993) RUCATSE Report
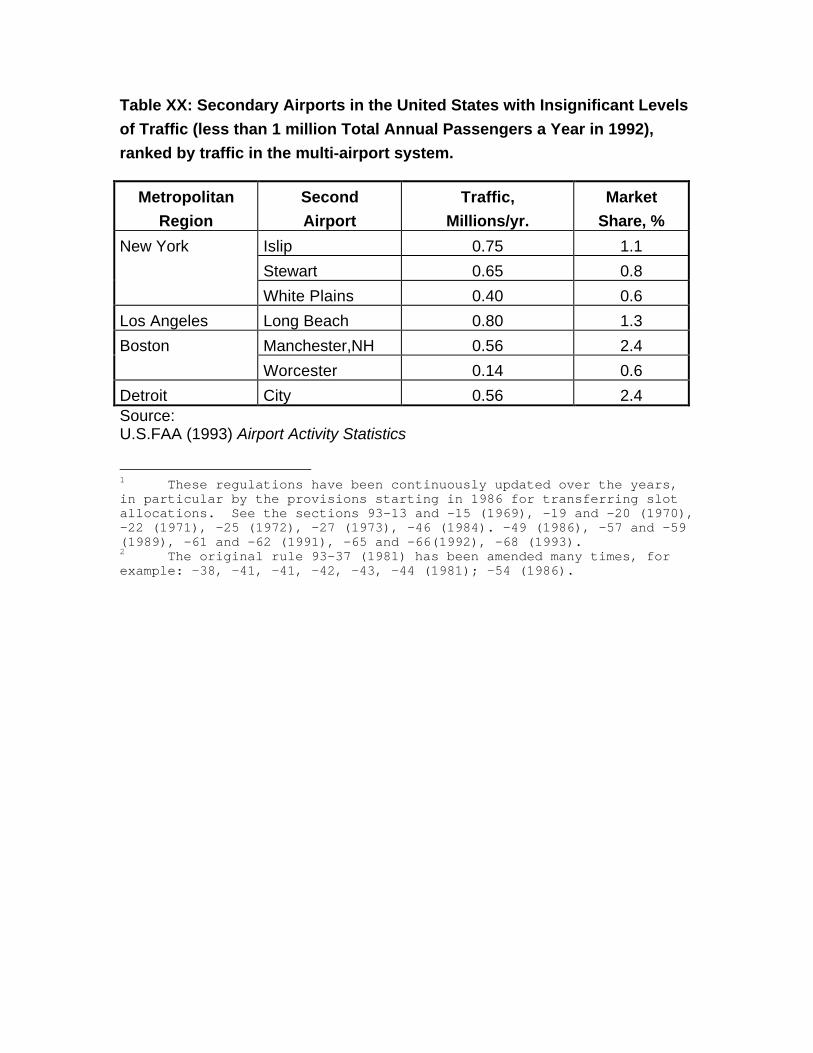
Table XX: Secondary Airports in the United States with Insignificant Levels
of Traffic (less than 1 million Total Annual Passengers a Year in 1992),
ranked by traffic in the multi-airport system.
Metropolitan
Region
Second
Airport
Traffic,
Millions/yr.
Market
Share, %
New York Islip 0.75 1.1
Stewart 0.65 0.8
White Plains 0.40 0.6
Los Angeles Long Beach 0.80 1.3
Boston Manchester,NH 0.56 2.4
Worcester 0.14 0.6
Detroit City 0.56 2.4Source:U.S.FAA (1993) Airport Activity Statistics
1 These regulations have been continuously updated over the years,in particular by the provisions starting in 1986 for transferring slotallocations. See the sections 93-13 and -15 (1969), -19 and -20 (1970),-22 (1971), -25 (1972), -27 (1973), -46 (1984). -49 (1986), -57 and -59(1989), -61 and -62 (1991), -65 and -66(1992), -68 (1993).2 The original rule 93-37 (1981) has been amended many times, forexample: -38, -41, -41, -42, -43, -44 (1981); -54 (1986).