Montgomery County Government: Organizational and Fiscal Structure

MunicipalEnvironmental
Laboratory Report
BenchmarkingStudy
MULTI-AGENCY
December 1999


MULTI-AGENCY BENCHMARKING STUDY
Municipal Environmental Laboratory Report
Participating Agencies
Central Contra Costa Sanitation District
City of Los Angeles Bureau of Sanitation
City of Portland Bureau of Environmental Services
East Bay Municipal Utility District
King County Department of Natural Resources
Orange County Sanitation District
Sacramento Regional County Sanitation District
City of San Jose/Santa Clara Water Pollution Control
Massachusetts Water Resources Authority
December 1999
Data and information used to develop this report are from Fiscal Year 1997 (FY1997).


i
Table of Contents
Introduction ......................................................................................................................................1
Agency Overviews ...........................................................................................................................2Central Contra Costa Sanitary Distinct......................................................................................2City of Los Angeles ...................................................................................................................4City of Portland Bureau of Environmental Services..................................................................5City of San Jose/Santa Clara Water Pollution Control ..............................................................6East Bay Municipal Utility District ...........................................................................................8King County Department of Natural Resources ......................................................................10Massachusetts Water Resources Authority..............................................................................13Orange County Sanitary District..............................................................................................14Sacramento Regional County Sanitation District ....................................................................15
Process Benchmarking Summary...................................................................................................19Workload Management............................................................................................................19Customer Service .....................................................................................................................20Employee Development and Morale........................................................................................21Staffing Strategies....................................................................................................................21
Performance Benchmarking Summary...........................................................................................23Multi-agency Template............................................................................................................23Microbiology............................................................................................................................26Biomonitoring..........................................................................................................................26Conventional Chemistry ..........................................................................................................27Metals.......................................................................................................................................27Organic Chemistry ...................................................................................................................28Additional Context for the Study.............................................................................................28
“Zeroing Out”: Reconciling the Test Cost Spreadsheet with a Lab’s Budget...........28Detailed Time Tracking versus Expert Estimates .....................................................29Limitations of Test Count Comparisons ...................................................................29Comparison of Benchmarking Costs, Marginal Costs and Prices.............................30
Summary and Conclusions .............................................................................................................32MABS Findings .......................................................................................................................32Cost Model Findings................................................................................................................32Areas for Further Study ...........................................................................................................34
Appendices .....................................................................................................................................37


Multi-Agency Benchmarking
1
IntroductionThe management of municipal environmental laboratories has undergone significant changeduring the past 10 years. Laboratory managers have been faced with: increasing pressure to pro-vide cost-effective service, higher expectations from customers, increasing regulatory require-ments, and increasing complexity of work (such as lower detection limit requirements). Theyhave had to respond by making their operations more efficient, competitive with the private sec-tor, and responsive to their customers’ needs and requirements.
To meet these challenges, a group of nine municipal government laboratories joined together in abenchmarking study of the laboratory component of the wastewater industry. Participants in thisstudy included laboratories from the seven agencies participating in the multi-agency study(Central Contra Costa Sanitary District, East Bay Municipal Utility District, King County De-partment of Natural Resources, City of Los Angeles, Orange County Sanitation District, PortlandBureau of Environmental Services, and Sacramento Regional County Sanitation District), plustwo additional agency labs, the City of San Jose and The Massachusetts Water ResourcesAuthority. In addition, although the City of Phoenix participated on a limited basis in the earlystages of the benchmarking process, it is committed to full participation in next round of datacollection.
Goals of the laboratory benchmarking component of the multi-agency study included:
• Improving the functional operation of the participating laboratories;
• Minimizing costs and maximizing efficiencies wherever possible;
• Developing a model that could be used to compare costs for individual analyses;
• Developing a model that can be used in the future to compare changes from year to year;
• Identifying best practices of individual agency laboratories; and
• Identifying laboratory costs associated with individual components of the wastewatertreatment process.
The major work products of the group included:
• Process benchmarking survey;
• Tables comparing staffing, salaries, benefits, workload, and lab organization;
• Extensive budget, cost per test and productivity comparison data;
• Input to the laboratory portion of the multi-agency template; and
• Normalized data comparing agency costs for the multi-agency template categories.
All of the agencies have participated in the first three work products, and only those in the multi-agency study have participated in the last two work products. The study period was fiscal year(FY) 1997, with the exception of King County, which reported calendar year (CY) 1997.
Municipal Environmental Laboratory Management2
Agency OverviewsCentral Contra Costa Sanitary Distinct
The laboratory is located on the District’s wastewater treatment plant site in Martinez, Califor-nia. The laboratory facility measures approximately 6,400 useable square feet, which includes asuperintendent’s office, a senior chemist’s office, analytical testing areas (biology, conventionalchemistry, metals and organics) a sample receiving area, a common preparation room, chemicalstorage, and office space for the chemists.
Staffing for FY1997 included a laboratory superintendent, one senior chemist, six chemists, andone co-op student. Clerical support is provided by the Administrative Section and is not includedin the laboratory budget.
The laboratory is a full-service environmental testing facility that is certified by the CaliforniaDepartment of Health and the Department of Fish and Game for various types of water andwastewater analyses. Major laboratory instrumentation includes: graphite furnace and flameAAs, GC/MS, a cold vapor mercury analyzer, HPLC, gel permeation chromatography, and anautomated organic extraction and concentration system. The entire laboratory data handling isautomated through the Laboratory Information Management System (LIMS).
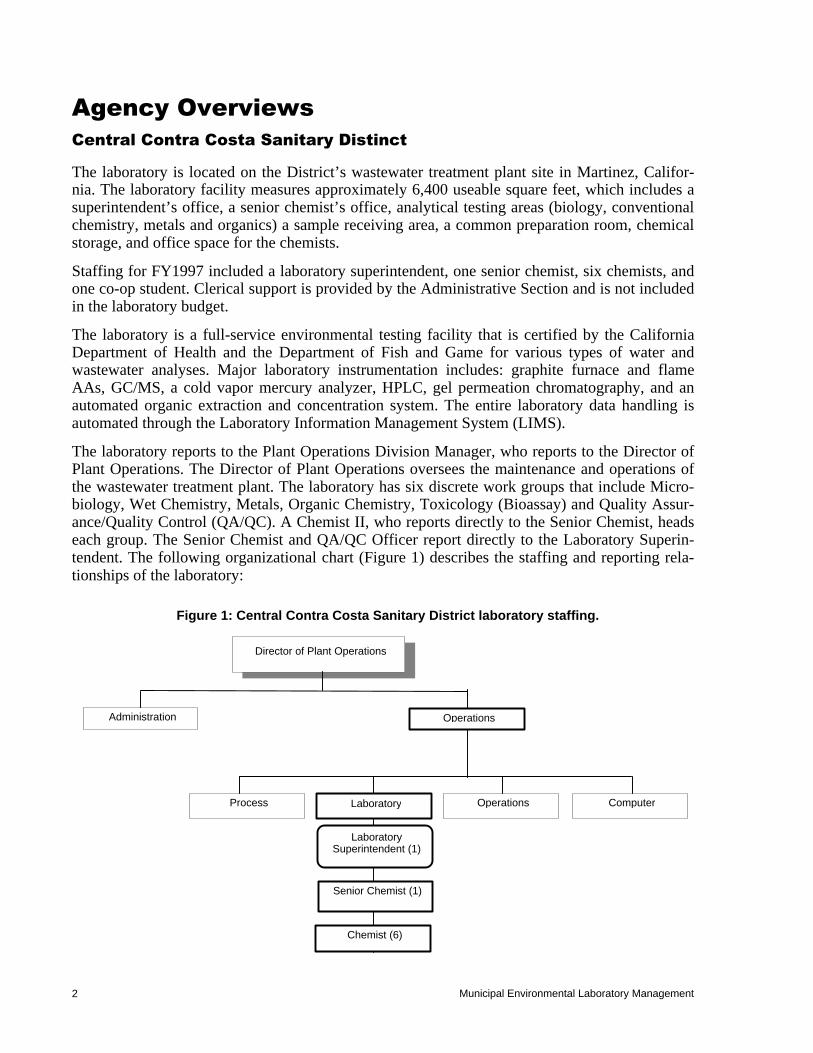
The laboratory reports to the Plant Operations Division Manager, who reports to the Director ofPlant Operations. The Director of Plant Operations oversees the maintenance and operations ofthe wastewater treatment plant. The laboratory has six discrete work groups that include Micro-biology, Wet Chemistry, Metals, Organic Chemistry, Toxicology (Bioassay) and Quality Assur-ance/Quality Control (QA/QC). A Chemist II, who reports directly to the Senior Chemist, headseach group. The Senior Chemist and QA/QC Officer report directly to the Laboratory Superin-tendent. The following organizational chart (Figure 1) describes the staffing and reporting rela-tionships of the laboratory:
Director of Plant Operations
Administration Operations
Process Laboratory Operations Computer
LaboratorySuperintendent (1)
Senior Chemist (1)
Chemist (6)
Figure 1: Central Contra Costa Sanitary District laboratory staffing.

Multi-Agency Benchmarking
3
The workload for the CCCSD laboratory can be divided into the following areas:
• Wastewater operations support accounts for the 72% of the overall laboratory workload.Of that amount, 20% is discretionary and 52% is related to compliance monitoring.
• Source Control, Collection System Operations and Engineering support account for ap-proximately 8% of the overall laboratory workload.
• Supervision, LIMS, research and development, QA/QC, and safety accounts for 20% ofthe laboratory workload.
Approximately 9% of the FY1997 laboratory budget covered analytical costs for work subcon-tracted to outside laboratories.

Municipal Environmental Laboratory Management4
City of Los Angeles
The Environmental Monitoring Division (EMD) of the Bureau of Sanitation, Department ofPublic Works, City of Los Angeles, provides quality environmental data and assessment in sup-port of the bureau’s activities. The division is organized into five sections (Biology, Chemistry,Industrial Waste, Process Control, and Technical Support) and three groups. Each section is thensubdivided into one or two units, with the exception of Process Control, which has four processcontrol laboratories located at each of the City’s treatment plants. The three groups are: theQA/QC group (reporting to the Industrial Waste section manager), the LIMS group (reporting tothe Technical Support section manager), and the Legal Reporting group (reporting to the assis-tant division manager). The organizational structure is summarized in Figure 2:
The staffing level for the division in FY1997 was approximately 115, of which 104 were dedi-cated to wastewater activities and 11 to non-wastewater activities. The division staff consists oflaboratory managers, supervisors, chemists, water biologists, water microbiologists, and labora-tory technicians. The division occupies approximately 53,000 square feet of laboratory space in10 buildings located at four treatment plants. The main laboratory is located at the HyperionWastewater Treatment Plant. The California Department of Health Services accredits the divi-sion’s laboratories through their Environmental Laboratory Accreditation Program.
Analytical capabilities of the Environmental Monitoring Division include conventional chemis-try, microbiology, aquatic toxicology, organics, metals, air testing, and marine biology. The divi-sion provides support for treatment plant processes, NPDES permit requirements, source control,landfill operations, the sewer collection system, receiving water monitoring programs, and capi-tal improvement projects. In addition to providing analytical services, the division is also respon-sible for preparing plant NPDES permit reports and annual assessment reports on receiving
Process ControlLab Manager
ChemistryLab Manager
BiologyLab Manager
Technical Sup-port/LIMS
Lab Manager
Industrial Waste -QA/QC Lab Manager
Environmental MonitoringDivision Manager
Secretary
HTP
TITP
DCT
LAG
Organic
Inorganic
Microbiology
OceanAssmt.
LIMSInd. Waste
QA/QC
LegalReporting
Figure 2: City of Los Angeles laboratory staffing.

Multi-Agency Benchmarking
5
waters, providing consultation on environmental compliance and regulatory issues, and partici-pating in the activities of various engineering projects planning teams. Plant operators collectmost samples for routine process monitoring tests. Laboratory staff usually collects grab sam-ples, samples for special studies, ocean monitoring samples, and microbiology test samples. Lessthan 0.1% of the operating workload is sub-contracted to outside labs. This is primarily in areaswhere the limited number of samples does not make it cost effective to maintain the testing ca-pability in-house. Testing is also subcontracted occasionally as a backup in case of sample over-load or equipment breakdown.
The Environmental Monitoring Division has an annual operating budget of $9.16 million, whichincludes salaries, contractual services, laboratory supplies and expense, and equipment. Thelaboratory staff charge their time to work order numbers on timesheets, which are associatedwith customer projects (template categories) in both wastewater and non-wastewater operations.Expense costs are tracked at the unit level. Each unit then apportions these costs to each templatecategory according to the total staff time spent in support of that category.
Most of the division’s resources are directed in support of the wastewater program. Within thewastewater program, 73% of the laboratory work is dedicated to the fulfillment of the NPDESrequirements of the four treatment plants and source control. The remaining effort of the divisionis used by the bureau to provide the best waste management services to the public while protect-ing the air, land, and water of the City of Los Angeles.
City of Portland Bureau of Environmental Services
The City of Portland’s Water Pollution Control Laboratory is a full-service analytical laboratorythat provides water quality analysis to all of the Bureau’s water quality programs. The laboratoryis located in the St. Johns area of Portland, approximately three miles from the Columbia Boule-vard Wastewater Treatment Plant. The laboratory occupies approximately 11,000 square feet in a37,000-square-foot building. Included in the laboratory are analytical areas for General Chemis-try, Nutrient Analysis, Process Control, Organics and Metals Analysis. In addition, there arestorage areas, prep areas, sample receiving/sample custodian areas and office space for the labstaff. The offices for Source Control, Field Operations, Spill Response, Data Acquisition andManagement, Investigation and Monitoring and Industrial Stormwater Management are also lo-cated in the building.
Laboratory staffing for FY1997 was 16 people, including a Laboratory Manager, a QA/QCChemist, an Inorganic Chemist, an Organic Chemist, a Process Control Chemist, and 11 Labo-ratory Technicians. The building receptionist (who is covered by the Administrative SupportSection) performs all clerical responsibilities. The management of all laboratory data is assistedby a Laboratory Information Management System (LIMS). The laboratory reports to the Envi-ronmental Investigations Manager, who in turn reports to the Business Services Group Manager.The laboratory has five discrete sections: QA/QC, Inorganic Chemistry, Organic Chemistry, Pro-cess Control and Microbiology. The organizational structure is summarized in Figure 3:
The laboratory’s operational hours are from 6:00 a.m. to 5:30 p.m., Monday through Friday. Thelaboratory is staffed on Saturday and Sunday for wastewater treatment plant process con-trol/NPDES permit analyses; however, the building is not open to the public.

Municipal Environmental Laboratory Management6
In FY1996-97, the laboratory performed 70,131 analyses on 12,850 samples. The distribution ofthe work is as is shown in Table 1:
Table 1. City of Portland
Bureau of Environmental ServicesFY 1996-97 Laboratory Analyses
Wastewater Treatment 38%
Discretionary (16%)
Required by Permit (22%)
Source Control 28%
Stormwater Management 12%
Fresh Water Quality Mgmt. 18%
Miscellaneous 4%
TOTAL: 100%
Approximately 2% of the laboratory’s workload is subcontracted to an outside laboratory.
City of San Jose/Santa Clara Water Pollution Control
The San Jose/Santa Clara Water Pollution Control Plant Laboratory is located at the southern tipof the San Francisco Bay. The laboratory moved into a new state-of-the-art facility in 1996, pro-viding over 12,000 square feet of laboratory space and 3,600 square feet of open office area.Special features include separate “clean rooms” for ultra-trace-level organic and inorganic analy-ses, dedicated HVAC systems optimized for trace level biological and chemical determinations,and specialized biomonitoring and culture facilities.
Portland Bureau ofEnvironmental
Services
Business ServicesGroup Manager
EnvironmentalInvestigations
Manager
Field Operations Data Management Investigation &MonitoringLaboratory
LaboratoryManager (1)
QA/QC(3)
Organics(2)
ProcessControl (3)
Inorganics(5)
Microbiology(2)
Figure 3: City of Portland Bureau ofEnvironmental Services laboratorystaffing.

Multi-Agency Benchmarking
7
Staffing for FY1998 included a Laboratory Supervisor, two Research Chemists, one AquaticToxicologist, one Research Microbiologist, 11 Chemists, three Biologists, two Microbiologists,21 Laboratory Technicians, and one Office Specialist. The Environmental Enforcement andTechnical Support Division’s also provide ancillary clerical support.
The laboratory is a full-service environmental testing facility that is certified by the CaliforniaDepartment of Health Services for a variety of drinking water, wastewater and hazardous wasteanalyses. Major laboratory instrumentation includes graphite furnace and flame AAs, ICP,ICP/MS, a cold vapor mercury analyzer, ICs, GCs and GC/MSs. Laboratory data handling is ac-complished with personal computers on a local area network utilizing various computer softwareprograms, as well as PE Nelson’s SQL*LIMS, which is in the process of being interfaced withall major laboratory instrumentation.
The laboratory reports to the Technical Support Division Manager, who in turn reports directlyto the Director of the Environmental Services Department (ESD) for the City of San Jose. ESDadministers the Water Pollution Control Plant for eight tributary cities in Silicon Valley. Thelaboratory has five work groups: Administration, Aquatic Toxicology, Inorganic Chemistry, Or-ganic Chemistry and Process Control/Microbiology. The analytical sections are supervised bythe research chemists, the research microbiologist and the aquatic toxicologist, each of whomreports to the laboratory supervisor. Chemists are directly responsible for sample receivingQA/QC activities, and they report directly to the Laboratory Supervisor. The organizationalstructure is summarized in Figure 4:
Figure 4: City of San Jose/Santa Clara Water Pollution Control laboratory staffing.
City of San Jose/EnvironmentalServices Dept.
City of San Jose/EnvironmentalServices Dept.
Water PollutionControl PlantLaboratory
Administration
LaboratorySupervisor (1)
Chemist (2)Sr. Env. Spec. (1)
Technician (2)Office Spec. (1)
Metals (12)Microbiology/Process (14)
Organics (7) Aquatic Toxicology(7)
The laboratory analyzes approximately 90,000 samples per year. Analyses conducted includevolatile and semi-volatile organics, chlorinated pesticides and PCB’s, microbiology (includingpathogens), priority pollutant metals, acute and chronic toxicity and conventional chemistry pa-rameters.

Municipal Environmental Laboratory Management8
East Bay Municipal Utility District
The Laboratory Services Division is a full-service, production-oriented, environmental labora-tory that provides analytical support for the East Bay Municipal Utility District’s (EBMUD)water and wastewater systems. The laboratory serves as a central facility for managing allEBMUD analytical services except on-site process monitoring performed by treatment plant op-erators for operations control purposes. The State of California Environmental Laboratory Ac-creditation Program (ELAP) certifies the laboratory for water, wastewater and hazardous wasteanalyses in 17 separate fields of testing. In FY1997, the laboratory was organized into four ana-lytical sections and one support section as shown in Figure 5:
Administratively, the two clerical support staff are not assigned to the laboratory’s budget, how-ever, functionally they both work for the Laboratory Services Division. In FY1997, two positionsremained vacant throughout the year, thus the total staff count for budgetary purposes was 50.
Located at EBMUD’s main Wastewater Treatment Plant near the Oakland Army Base, the labo-ratory occupies approximately 30,000 square feet of analytical and office area. The District’slaboratory also manages a second 800-square-foot remote laboratory at the District’s NorthRichmond Water Reclamation Plant.
The laboratory’s Mission is: To provide analytical data to address the regulatory, operational andproject-related needs of the District. As a full service, production oriented, environmental labo-ratory, we strive to provide high quality, legally defensible data for our clients in the most effi-cient, cost-effective way possible.
In FY1997, the laboratory was staffed as follows: 1 manager, 5 section supervisors, 34 analysts,and 10 support staff (clerical, purchasing, LIMS, QAO, client services and safety). With the ex-ception of limited on-site monitoring programs, the laboratory is not responsible for sample col-lection and delivery. The laboratory analytical staff are divided into the following jobclassifications: Research Chemist (2), Chemist I/II (7), Microbiologist I/II (3), Lab TechnicianIII (11), and Lab Technician I/II (11). Support staff include: Senior Chemist (4), Senior Microbi-ologist (1), Quality Assurance/Safety Officer (1), LIMS Administrator (1), Clerical (2) and Tem-porary Worker (1). Administrative staff include: Manager (1), Supervising Chemists (3),Supervising Microbiologist (1) and Aquatic Toxicologist (1).
WastewaterOperations
Organic Chemistry(9)
Biology(12)
Metals(7)
Client Support(10)
Inorganic Chemistry(10)
Quality Assurance Officer (1) Clerical Support (2)
Laboratory Services(52)
Source ControlSupport Services
Wastewater Department
Figure 5: East Bay Municipal Utility District laboratory staffing.

Multi-Agency Benchmarking
9
Laboratory staff work several alternative work schedules (standard 8-hour days, compressedworkweek schedules, and staggered work hours and days) to functionally extend the laboratory’soperation from 6:00 a.m. to 6:00 p.m. on Monday through Friday, and from 7:45 a.m. to 4:15p.m. on Saturday and Sunday.
In FY1997, the laboratory performed approximately 130,000 analyses on 60,000 samples dis-tributed among the analytical groups as shown in Table 2:
Table 2.East Bay Municipal
Utility DistrictFY 1997 Laboratory AnalysesMetals 37,650
Microbiological 30,350
Biomonitoring 100
Organic chemical 3,300
Inorganic chemical 58,650
The distribution of analytical costs for this work between the District’s water and wastewatersystems was approximately 63.3% water (31.65 FTEs) and 36.7% wastewater (18.35 FTEs). Outof an adjusted laboratory budget of $4,884,422 developed in the Benchmarking Unit Cost Model,this would translate to a water system budget of $3,091,839 and a wastewater system budget of$1,792,583.
The wastewater component of the laboratory’s budget can be further broken down in Table 3:
Table 3.East Bay Municipal
Utility DistrictLaboratory Wastewater Budget
Discretionary laboratory support 37.9%
Required compliance monitoring 37.4%
Source control monitoring 13.5%
Special programs & projects 5.5%
Research 2.9%
Wet weather program monitoring 1.9%
Other non-specific work 0.9%
Beyond the typical equipment and skills needed for conventional water and wastewater chemicaland microbiological analyses, the District Laboratory is also equipped and staffed for:
• Pathogen monitoring using advanced microscopic procedures;
• Biomonitoring using both acute and chronic assays;
• TOC and TOX monitoring;

Municipal Environmental Laboratory Management10
• Low-level metals analyses using GFAA (2), HGAA, ICP and ICP/MS, and
• Low-level organic chemical monitoring using GC (6), GC/MS (3) and HPLC (1).
The types of analytical procedures used by the laboratory for both the water and wastewatersystems are quite diverse. In each of the analytical groups, the number of distinct United StatesEnvironmental Protection Agency (US EPA), Department of Health Services, or in-house proce-dures used is shown in Table 4:
Table 4.East Bay Municipal
Utility DistrictWater and Wastewater Systems
Analytical Procedures
ProceduresNumber ofMethods
Metals 11
Microbiological 22
Biomonitoring 8
Organic chemical 39
Inorganic chemical 79
TOTAL 159
King County Department of Natural Resources
The King County laboratory system includes two process laboratories, one at each treatmentplant (Renton and West Point), and the Environmental Laboratory located centrally in metro-politan Seattle. Organizationally, the process laboratories and the Environmental Laboratory arein different divisions within the Department of Natural Resources. The process laboratories arepart of the Wastewater Treatment Division, and the Environmental Laboratory is part of theWater and Land Resources Division, as shown in Figures 6 and 7.
Each process lab employs six to seven process specialists, who are supervised by a chief processanalyst. The process labs are part of the treatment plants’ Process Control Units, which includepersonnel such as process engineers and process analysts who do not perform laboratory func-tions. Each process control section has a supervisor who reports to the plant manager. The proc-ess laboratories perform conventional chemistry and microbiology analyses in support of plantprocess optimization and NPDES requirements. The process laboratories also provide support tocapital projects such as effluent reuse and the Applied Wastewater Technology (AWT) program.Computer specialists within the process control group provide LIMS support in one of the proc-ess laboratories. In the other process laboratory, LIMS is supported by centralized services in theWastewater Treatment Division. Process lab specialists and treatment plant operators share sam-pling duties at the plants.
The Environmental Laboratory employs approximately 70 staff including chemists, biologists,microbiologists and environmental specialists. Environmental Laboratory staffing also includessupport positions such as sample manager, QA officer, laboratory assistants and laboratory proj-ect managers. The organizational structure of the Environmental Laboratory includes five ana-

Multi-Agency Benchmarking
11
lytical labs plus field sampling, data management, and client services groups. Each group has asupervisor who reports to the laboratory manager. Analytical capabilities of the environmentallaboratory include conventional chemistry, organic chemistry, trace metals, microbiology andaquatic toxicology.
The Environmental Laboratory provides support for NPDES permit requirements, the biosolidsand source control programs, as well as receiving water, collection system, CSO, and lakes andstreams monitoring. The Environmental Laboratory also provides sampling and analytical sup-port for wastewater capital projects such as effluent reuse, construction projects, facilities plan-ning, and AWT, as well as services to other public agencies and non-wastewater funded groupsin King County on a reimbursable basis. Approximately 2% of the operating workload is sub-contracted, primarily for analyses that lack sufficient volume to make them cost effective to per-form in-house.
Program support costs for the process labs were determined based on time-per-test data, and thenumber of analyses per process area to develop a relative percent effort per area. This figure wasapplied as a multiplier to consumable and other non-labor operating costs and applied to the cal-culated lab support cost for each operational area of the plant. The Environmental Laboratoryexpenditures were allocated to multi-agency template categories based on data from the time-keeping system. The Environmental Laboratory staff charge their time to customer projects andin-house activities such as method development. These data were used to calculate the percent-age of workload for the template categories, which were used to apportion the EnvironmentalLaboratory expenditures that remained after expenditures such as benefits and training were allo-cated to other areas of the template. Expenditures for the process and environmental labs wereallocated to the lowest level of template detail possible based on detail available from the timekeeping system. Field sampling expenditures were allocated to the template category corre-sponding to the process area they support, and environmental laboratory expenditures for non-wastewater related operations were allocated to the Z category.
Discretionary monitoring refers to all analyses that are not directly required by permit. Many ofthese discretionary tests are essential to optimize plant performance to meet effluent dischargelimits. For example, suspended solids tests in the secondary process area are used to determinesolids inventory and, ultimately, wasting rate. Approximately 85% of the monitoring performedat the treatment plants is discretionary. All non-permit required influent monitoring costs wereassigned to the source control category. Biosolids monitoring included work to support theagency’s beneficial Reuse Land Application program, which includes monitoring required by the503 regulations. Source control monitoring includes analyses in support of the Industrial Pre-Treatment program, the Industrial Surcharge program, the Key Manhole Monitoring program,and any source tracing conducted in response to elevated levels in plant influent samples.
Expenditures in the non-source control, non-required monitoring category include work on a re-ceiving water ambient monitoring program, trouble call, and non-required CSO monitoring in thecollection system. Method development efforts in 1997 included seawater and ultra-trace metalsby ICP-MS, automated conventional chemistry tests, tributyl tin, and improvements to microbi-ology methods. LIMS and PC support expenditures were high primarily because of the level ofdata management staffing maintained at the environmental laboratory. These staff support all thelab PCs; the lab’s local area network and connection to the wide area network; the LIMS system;the maintenance of the 35-year historical database; and customer and public information act re-quests for electronic data and reports. They have also spent a significant amount of time in the

Municipal Environmental Laboratory Management12
study year responding to specialized format sediment data requests from the Washington De-partment of Ecology and preparing laboratory systems for the year 2000.
D e p a r t m e n t o fN a tu r a l
R e s o u r c e s
D e p a r t m e n t o fN a tu r a l
R e s o u r c e s
W a s t e w a t e r T r e a t m e n tD i v i s i o n
M a in te n a n c e F a c i l i t ie sP la n n in g
C a p ita lIm p r o v e m e n t
P r o g a r mF i n a n c eW e s t O p e r a t i o n s E a s t O p e r a t io n s
W a te r & L a n dR e s o u r c e s D i v i s i o n
S o lid W a s t eD iv i s io n
P r o c e s s C o n t r o lS u p e r v is o r ( 1 )
P r o c e s s C o n t r o lS u p e r v is o r ( 1 )
C h ie f P r o c e s sA n a l y s t ( 1 )
P r o c e s s A n a l y s t( 5 )
P r o c e s s L a bS p e c ia l is t ( 6 )
P r o c e s sE n g in e e r ( 1 )
C h ie f P r o c e s sA n a l y s t ( 1 )
P r o c e s s L a bS p e c ia l is t ( 7 )
P r o c e s s A n a l y s t( 4 )
P r o c e s sE n g in e e r ( 1 )
Department ofNatural
Resources
Department ofNatural
Resources
Water & Land ResourcesDivision
RegionalWatershed
Teams
ResourceLands
LocalDrainageServices
Open SpaceBond
Finance &Administration
PublicOutreach
Rivers BusinessOutreach
EnvironmentalLab
Manager(1)
Microbiology/Aquatic
Toxicology(13.65)
Conventionals(9)
DataManagement &Analysis (6.5)
EnvironmentalServices (12)
Trace Metals(9)
TraceOrganics
(12)
ClientServices
(9)
WastewaterTreatment Division
Solid WasteDivision
QA Officer(1)
Figure 6: King County Department of Natural Resources process laboratories staffing.
Figure 7: King County Department of Natural Resources environmental laboratory staffing.

Multi-Agency Benchmarking
13
Massachusetts Water Resources Authority
The Central Laboratory of the Sewerage Division of the Massachusetts Water ResourcesAuthority (MWRA) is located at the Deer Island Treatment Plant. The laboratory opened in 1995as part of the Boston Harbor Project to improve water quality by constructing a 1.2 billion-gallonwastewater treatment plant and upgrading the remainder of the sewerage infrastructure. Thelaboratory reports to the Environmental Quality Department (ENQUAD), making it organiza-tionally separate from its clients: Wastewater treatment, NPDES, Toxic Reduction and Control(Industrial Pre-Treatment), Residuals Management (biosolids fertilizer pelletizing plant), HarborStudies, and Waterworks Division.
There are approximately 55 regular staff at the environmental laboratory, including chemists,biologists, microbiologists, technicians, and support staff. Several interns and contract employeesare available to augment the laboratory’s capacity. The organizational structure of the environ-mental laboratory includes six laboratory teams, covering the testing areas of microbiology, con-ventional chemistry, trace metals and trace organics, plus field sampling/sample management,and client services. Each team has a laboratory specialty plus several other tests. The team re-ports to a supervisor, who in turn reports to a laboratory manager, as shown in Figure 8.
The laboratory conducts compliance sampling at the treatment plant; otherwise treatment plantoperators or other clients collect samples. Approximately 2% of the operating workload is sub-contracted, primarily for analyses with insufficient volume to make it cost effective to do thework in-house.
Laboratory staff charge their time and supplies purchases to specific tests or to other generalcategories (e.g., training, method development), and these data were used to calculate the pro-duction rates (hours per test) for all types of tests.
The laboratory has an extensive quality assurance/quality control (QA/QC) program to ensurethat client’s laboratory needs are met. This includes certification from the Massachusetts De-partment of Environmental Protection for testing both drinking water and wastewater. The labo-ratory also participates in the annual NOAA “National Status and Trends” (Mussel Watch) inter-laboratory performance evaluation program for both trace organics and metals.
Figure 8: Massachusetts Water Resources Authority laboratory staffing.
LaboratorySuperintendent (1)
LaboratorySuperintendent (1)
Lab Manager (1) Lab Manager (1) QA Manager (1)
SupervisorRed Team (1)
TechnicalStaff (7)
SupervisorOrange Team (1)
SupervisorGreen Team (1)
SupervisorBlue Team (1)
SupervisorIndigo Team (1)
SupervisorViolet Team (1)
Technical Staff (6)
LIMS Analyst (1)
Client Coordinator(1)
QA Specialist (1) AdministrativeCoordinator (1)
AdministrativeStaff (2)
TechnicalStaff (6)
TechnicalStaff (8)
TechnicalStaff (6)
TechnicalStaff (5)

Municipal Environmental Laboratory Management14
Orange County Sanitary District
The Orange County Sanitary District laboratory reports to the Director of Technical Services andis organized into a general administrative function and four laboratory sections: Quality Assur-ance, Microbiology, Inorganic Chemistry (including trace metals) and Organic Chemistry. Thelaboratory has a staff of 35 FTE including approximately three FTE for sample collection. TheLIMS support functions are managed within the Quality Assurance Section (Figure 9).
The lab occupies approximately 20,000 square feet of a two-level steel-and-concrete buildingthat was designed and built in 1990-91 specifically as a laboratory building. The mission of thelaboratory is to provide analytical services in support of operations, compliance, and source con-trol activities and to conduct research directed toward improving the effectiveness of the labora-tory and in furthering the overall mission of the sanitation district. Approximately 100,000analyses, not including quality control samples, are performed annually.
The laboratory defines its role in terms of its customers and its ability to provide analytical serv-ices in support of their programs. In order to meet the analytical and compliance related needs ofour customers, it is accredited with the California Department of Health Services EnvironmentalLaboratory Accreditation Program.
The distribution of testing by customer group is:
Table 5.Orange County Sanitary District
Distribution of Testing byCustomer Group
NPDES Required 26.2%
Source Control 23.1%
Plant Process Support 30.8%
Solids Testing 13.8%
Air Standards Compliance 1.2%
Special Projects Incl. Engineering 6.0%
Technical Services Department
Quality AssuranceSection
Inorganic ChemistrySection
Organic ChemistrySection
Microbiology Section
Laboratory Division
Secretary
Figure 9: Orange County Sanitary District laboratory staffing.

Multi-Agency Benchmarking
15
The laboratory internally performs about 98% of the required testing, and 2% is performed atcontract laboratories.
All permit required bioassay work is performed at contract laboratories. Some non-permit, re-search directed bioassay testing is performed within the Environmental Compliance and Moni-toring Division (ECM) which is also part of the Technical Services Department. The ECMDivision through contract with SAIC or other consulting services manages all receiving waterand ocean monitoring studies.
The first priority of the laboratory is to support various programs involved in the treatment ofwastewater. These programs include compliance with the NPDES permit, support of wastewaterprocessing operations, support of the source control pre-treatment monitoring process, and sup-port of the ocean receiving water monitoring program, including surfzone microbiology moni-toring.
Laboratory staff also participate in various engineering project teams. Their role is to provideexpert advice in chemistry and microbiology and to properly coordinate and conduct analyticalwork that flows from the projects into the laboratory.
The distribution of costs within the various wastewater treatment areas, defined in the Bench-mark Template, were determined by multiplying the annual number of each type of test by thefully burdened cost for each type of test. These costs were then summed for all type of tests.
The laboratory at OCSD is responsible for developing and publishing the NPDES DischargeMonitoring Report. This is a function that requires approximately 2 FTE, over and above normaldata reporting, and is not routinely performed by other laboratories in the benchmark study.
Sacramento Regional County Sanitation District
The Water Quality Control Laboratory is a part of the Sacramento Regional County SanitaryDistrict’s 181 MGD pure oxygen activated sludge Wastewater Treatment Plant facility locatedon 3,300 acres of land approximately nine miles south of downtown Sacramento. The usablesquare footage of the laboratory facility is approximately 13,000. Laboratory support and ad-ministrative spaces include offices for the lab manager, supervisors and senior staff and clericalsupport, as well as a sample receiving room and a common prep-room area. The analytical areasinclude space for biological, conventional, metals and organics testing. There is also floor spaceand rooms provided for chemical, gas, glassware supply and equipment storage. A remote, 700-square-foot laboratory facility exists at the effluent discharge station on the Sacramento River,where the District’s state-of-the-art continuous flow-through acute fish bioassay tests are con-ducted.
The laboratory reports directly to the Wastewater Treatment Plant Manager. The WastewaterTreatment Plant Manager reports directly to the Chief of Water Quality, who oversees the main-tenance and operations section of the wastewater collection and treatment systems. The DistrictEngineer reports directly to the District Board of Directors. The laboratory has four discretework groups that include the Biology, Chemistry, Conventional Chemistry, and Lab SupportSections, each headed by a section supervisor who reports directly to the Laboratory Manager.One QA/QC officer position reports directly to the laboratory manager as well. The organizationstructure is shown in Figure 10:

Municipal Environmental Laboratory Management16
District EngineerDistrict Engineer
Maintenance andOperations
WastewaterTreatment Plant
Plant EngineeringWater Quality
ControlLaboratory
PlantAdministrattion
Plant Operations& Maintenance
Laboratory Support(5)
ConventionalChemistry
(10)
Chemistry SectionMetals/Organics
(7)
Biological TestingSection
(5)
Quality Assurance(1)
Division Chief,Water Quality
A total staff of 29 was assigned to the laboratory for the FY1997. Employees included a labmanager, two supervisors, four chemists, three biologists, 13 journey-level technicians (fivesenior environmental laboratory analysts, eight environmental lab analysts), and four apprentice-level technicians (two lab assistants and two lab helpers). Two clerical support positions assignedto the laboratory, whose salaries came out of the Plant’s Administration Section budget, wereincluded in overhead costs.
The Chemistry Section is primarily involved in testing for low-level concentrations of metals andorganic components of environmental samples. It is divided into two sub-sections for Metals andOrganics analysis. The metals testing section is certified to conduct low-level metals analysis onwater and wastewater samples with GFAA, FAA, ICP-MS instrumentation. Low-level mercuryanalysis is conducted using a cold vapor mercury analyzer. In the organics testing part of theChemistry Section, GC analyzers are used to conduct US EPA 601, 602, and 608 tests on envi-ronmental samples. Digester gas and cyanide gas analyses are conducted in the Organics Section.Although neither organic nor metal, testing for nitrate, nitrite, chloride, ammonia, and ortho-phosphate analyses are conducted in the Chemistry section using a Lachat segmented flow auto-analyzer.
The Conventional Chemistry Section performs standard wet chemistry and physical tests thatinclude solids testing (total and suspended), moisture, TKN, pH analyses, conductivity, turbidity,H2S volatile acids, CODs, and MBAS analyses for process monitoring and permit required test-ing.
The Biology section conducts biologically related testing including:
• Bacteriological analyses (total/fecal coliform, salmonella, fecal streptococcus, E. coil,and heterotrophic plate counts) of water, wastewater, and biosolids;
• Algae identification and cell counts;
• Continuous flow-through and static fish bioassays;
• Chlorophyll a analysis;
Figure 10: Sacramento RegionalCounty Sanitation District laboratorystaffing.

Multi-Agency Benchmarking
17
• Helminthes ova tests on biosolids;
• ELISA tests for diazinon and chlorpyrifos; and
• Bioluminescence toxicity analysis.
Some specialty testing for treatment plant applications are also conducted in this section, in-cluding radical length determination, surface tension, flourometry, viscosity, O2 consumptionrate, microscopic assessments of activated sludge mixed liquor samples, Nocardia sp. identifica-tion and enumeration testing, mixed liquor foam tests, and germination index.
The Laboratory Support/Administration Section includes the Lab Manager, LIMS administra-tion, Quality Control/Quality Assurance program administration, Data Management administra-tion, program coordination, clerical staff, and customer relation functions.
The workload can be divided into the wastewater operations support (related to template catego-ries) and wastewater capital support. The overall laboratory workload to support wastewater op-erations is 75.1%. Of that amount, 39.5% is discretionary and 35.6% is related to compliancemonitoring (28.0% required and 7.6% special programs). The workload associated with waste-water capital support was included in the operations support. Approximately 18.4% of the totalworkload represents costs related to capital support including special studies for new facilitiessuch as constructed wetlands, biosolids dewatering, biosolids classification study, ultravioletdisinfection study, and dedicated land disposal for biosolids.
Testing activities conducted for agencies outside of the Water Quality Division are directly re-imbursable to the Treatment Plant through a journal voucher system and direct billing. Servicesthat fall into this billing category represents approximately 5% of the laboratory’s total workloadand includes drinking water and well water coliform testing.
Approximately 13% of the FY1997 laboratory budget covered costs for work sent to outsidelaboratories. Work is sent to outside laboratories when: 1) workload exceeds capacity; 2) re-source limitations (staff, equipment/instrumentation or space); 3) instrument failure; or 4) lack ofcertification to perform the requested procedures. The laboratory determines the appropriatecourse of action to take based on the above-listed factors.
Labor costs for the laboratory during the FY1996-97 can be divided in the following activitygroupings (Table 6):
Table 6.Sacramento Regional County
Sanitation DistrictLaboratory Labor Costs FY
1996-97Discretionary monitoring 39.4%
Compliance monitoring 35.6%
Source control monitoring 8.2%
Special programs and projects 7.6%
Laboratory support 8.9%

Municipal Environmental Laboratory Management18
The laboratory performed approximately 62,000 billable tests on 25,000 samples during theFY1996-97. The workload was distributed as follows among the analytical groups (Table 7):
Table 7.Sacramento Regional County Sanitation
DistrictBillable Tests FY 1996-97
Section
Testsby
Section
% ofTotalTests
Metals 9,946 16.1%
Biology 4,655 7.5%
Organics 1,606 2.6%
Conventional chemistry 45,709 73.8%
TOTAL 61,916 100%
Work assignments are diverse and vary from performing standard tests at the bench, to partici-pating as technical experts in special studies, to program coordination, to participating in routinefield monitoring and sampling operations of the receiving water in support of a multi-agencyCoordinated Monitoring Program (CMP) of the Sacramento River. The laboratory has a boat,sampling equipment and staff dedicated to contribute the necessary resources and support for themonthly CMP events. In addition, staff may be assigned to participate in various capacities insupport of numerous District and other Agency programs. Some of these other programs include:
• Sampling and monitoring of the bufferland groundwater wells;
• Sampling and testing of soils from dedicated land disposal areas used for biosolids dis-posal;
• Collecting and analyzing potable water samples for the County-owned and -operatedWater Maintenance Districts; and
• Sampling and monitoring the Plant’s bufferland ambient onsite streams.
Cross training of staff is emphasized to allow for maximum operating efficiency and flexibilityin allocation of resources.

Multi-Agency Benchmarking
19
Process Benchmarking SummaryEarly in the benchmarking process, the laboratories established an extensive list of processbenchmarking questions in the following categories:
• Human Resources;
• Support Systems;
• Planning;
• Data Management;
• Analytical Work;
• Safety and Waste Management; and
• Quality Improvement.
Each laboratory manager completed the survey (Appendix A) and shared the results with theothers in the group. The results of the process benchmarking survey were condensed into an ab-breviated table format to facilitate comparison (Appendix B). The process benchmarking tableand information shared in meetings helped laboratory managers identify “best practices” amongthe laboratories. Best practices were defined as management tools or laboratory practices thatcontribute to efficiencies, improved operations, better customer service or higher quality data.The best practices fell into four categories, which are discussed below:
• Workload Management;
• Customer Service;
• Employee Development and Morale; and
• Staffing Strategies.
Workload Management1. Minimizing the cost-per-test is mostly a function of optimizing batch size to best utilize
laboratory capacity. Lab managers also felt that it was helpful to have a predictable andsomewhat stable workload. Some of the laboratories reported that they had gained effi-ciency by working with customers to best match the schedule and size of sample batcheswith laboratory capacity. Laboratories have also found it helpful to coordinate schedulingto minimize weekend and off-hours work as much as possible, thereby reducing costs forovertime. A sporadic workload and customer needs for rapid turnaround are not condu-cive to optimizing batch size.
2. One agency has implemented a policy that requires the agency lab be given the right offirst refusal for all of the agency’s laboratory workload. This way, the lab is fully re-sponsible for managing both the data and the data quality of the agency’s analyticalworkload. The agency also gains purchasing efficiencies of scale for contract lab serv-ices. Agency resources that had been used for contract management can be redirected.The lab has increased opportunities to optimize the batch size of their own workload; andcan better project and plan for resource needs from year to year.
3. Some laboratories reported improved operations through the implementation of a proj-ect manager approach. Laboratory Project Managers work closely with clients to evalu-ate their short- and long-term analytical needs, often on an annual basis. Lab managers

Municipal Environmental Laboratory Management20
who have implemented project manager systems reported improved communication be-tween the laboratory and customers by providing a single point of contact, as well as areduction in the number of interruptions for bench analysts. Laboratory Project Managersare expected to be familiar with customers’ projects and make scheduling decisions andprovide consulting services on behalf of the laboratory. Lab consulting services includeproviding assistance in developing cost-effective sampling and analysis plans that addressproject data quality objectives. While some laboratories have reported success by imple-menting project management as a separate section with dedicated project managers, otherlabs have reported success by assigning this function to supervisors and other laboratoryprofessionals. This model allows supervisors and scientists to expand beyond their tradi-tional laboratory functions, and it has been found to be positive for morale. The choice ofmodel may be related to the scope of the laboratory. Labs with fewer customers, most ofwhom are internal to the agency, may benefit most from assigning project managementfunctions to laboratory supervisors and scientists. Labs with more customers and/or cus-tomers who are external to the agency may find that a dedicated project managementsystem works best in their organization.
4. When lab managers compared times per test for various analytical methods, laboratorieswith higher efficiency often were those with higher levels of automation.
5. Within the limits allowed by regulations, lab managers reported increased efficiency byimplementing more productive methods. For example, replacing single-elementgraphite furnace AA methods with multiple-element ICP-MS technology for low detec-tion limit work significantly reduces the per-element analysis time.
6. Some laboratories reported reduced supply and hazardous waste disposal costs by“miniaturizing” analyses and reducing volumes whenever possible.
7. Some laboratories reported savings by not setting up to do a particular test in house ifthere is not sufficient workload to make the test cost effective, or if the cost of developingand implementing the method is not cost effective
8. One laboratory reported they manage workload by having annual meetings with theircustomers to evaluate programs based on data quality objectives. Based on this in-formation, the laboratory programs are readjusted every year.
Customer Service1. Some laboratories reported that they had established customer advisory or monitoring
committees. In one example, the advisory committee is composed of representativesfrom major client groups. The committee meets with the lab manager to provide directionand strategic planning insight from the perspective of the customer. Discussion topics arewide ranging and include: lab performance (including criticisms); anticipated method de-velopment and resource needs; and opportunities for cost savings such as workload re-ductions. In another laboratory, the committee focuses on prioritizing needs forlaboratory resources and identifying opportunities for laboratory customers to coordinatedata uses. The premise of these committees is that the lab is not an infinite resource, andthe customers need to work with the lab to balance workload and set priorities. An addi-tional reported benefit of the committee is that clients hear each other’s perspectives, rec-ognize conflicting interests, and better understand lab decisions.
2. Some laboratories reported success in working with regulatory authorities and customersto reduce or modify monitoring requirements.
Multi-Agency Benchmarking
21
3. One laboratory reported that they had found it both educational and beneficial for cus-tomers to spend a day in the laboratory to see how their samples are processed. Oftenlaboratories are portrayed as “black boxes” that receive samples and send out results.Hands-on experience in the laboratory can help customers understand the process of pro-ducing high-quality analytical data.
4. Several laboratories reported invoicing systems that they felt were beneficial for custom-ers. In some cases, the systems are required because of multiple fund sources such aswastewater and drinking water, and in other cases the systems are informational. Labmanagers feel that in either case, these systems provide cost accountability for clients.
5. One laboratory reported success with customer surveys. Data from customer surveyshave helped the laboratory to identify and focus on issues such as turnaround time andflexibility of services that are important to the customers.
Employee Development and Morale1. One laboratory reported success with a career progression system that allows employ-
ees to advance as they gain proficiency and meet rigorous performance standards.As a measure of the success of the system, this laboratory reported that their output hadincreased four-fold since the system was implemented, while budget and staffing had in-creased two-fold. This laboratory also reported that the staff proficiency and reducedturnover attributed to this system has helped them successfully transition to an increas-ingly complex workload.
2. Lab managers reported success with providing professional development opportunitiesfor staff motivation. For example, one laboratory budgets $300 per year per person fordiscretionary training.
3. One laboratory reported success with the implementation of continuous quality im-provement training. Staff are expected to take responsibility for identifying efficienciesand streamlining processes in their work. They are taught to look for problems with sys-tems rather than blaming others, and they are encouraged to problemsolve based on dataand performance measures. Another laboratory reported success by establishing clear labperformance goals such as 21-day or less turnaround time for 95% of all analyses and re-ports, less than 0.5% exceedance of hold times, less than 0.5% lost analyses, and 100% ofbilling invoices delivered to customers on time.
4. One laboratory reported the use of an annual staff survey tool to identify issues that af-fect morale and productivity. Annual administration of the tool enables lab manage-ment to monitor trends over time and to track success in addressing issues raised in theprevious survey.
Staffing Strategies1. One laboratory reported success with an interdisciplinary team structure that provides
flexibility to move people around to respond to workload fluctuations. Another labo-ratory reported a similar strategy that involves cross-training staff in other analytical ar-eas and shifting resources as the workload shifts.
2. One laboratory reported salary savings by hiring clerical staff to do clerical work soscientists can focus on analytical work. Other laboratories reported success with strate-gies such as reallocating vacancies to lower levels before filling them and considering notfilling vacancies whenever possible.

Municipal Environmental Laboratory Management22
It is important to note that various combinations of best practices may improve lab performancedepending on individual circumstances, but this is not intended to be a checklist of steps to betaken by all the laboratories. What works well in one laboratory may not fit well with the pro-gram and workload needs of another laboratory. For example, some laboratories reported salarysavings by limiting the number of scientists and assigning routine tasks to technicians. However,laboratories with more complex workloads felt they would not be able to meet analytical re-quirements with this approach to staffing. Also, one laboratory that had previously staffed with asplit of technicians and scientists reported employee morale problems and a lack of flexibility torespond to workload fluctuations.

Multi-Agency Benchmarking
23
Performance Benchmarking SummaryPerformance benchmarking, or metric benchmarking, is a quantitative tool that captures the nu-merical input and output of each laboratory. Performance benchmarking in this study consistedof two major products:
1. Input to the multi-agency performance benchmarking template; and2. Development of a detailed budget model and extensive cost-per-test comparison spread-
sheet.
As noted above, all laboratories participated in the cost-per-test comparison, and only thoseagencies in the multi-agency study input data to the performance benchmarking template.
Multi-agency Template
In order to compare the costs for the multi-agency template, the laboratory data were normalizedto lab full time equivalents per million gallons per year multiplied by 1,000 (FTE/MGY*1000)and laboratory expenditures per million gallons per year (lab $/MGY, Appendix C). It is impor-tant to note that the costs in the laboratory template include only those costs associated withanalytical work. Costs for activities such as sampling, although they may be included within thebudget of a given agency, have been allocated to the program with which they are associated. Forexample, the costs associated with sampling for NPDES monitoring requirements have been in-cluded in T. 1. C. 3. a (technical support NPDES permits). Those laboratories that perform workfor non-wastewater programs such as drinking water or hazardous waste backed these costs outof the expenditures reported in the multi-agency template.
When costs are compared for the wastewater operation categories such as discretionary moni-toring or source control, there are two components that contribute to the variation:
1. The scope of work requested; and2. The laboratory’s efficiency in performing the work.
The consensus among laboratory managers is that the scope of work component contributes mostto the cost. The number and type of analyses that are requested by customers have the most im-pact on the analytical cost of a given monitoring program. To a lesser extent, the cost is influ-enced by the efficiency with which the laboratory performs the analyses. This is not to diminishthe importance of laboratory efficiency in identifying cost savings. However, the laboratory canonly explain a small percentage of the cost differences between agencies for a given templatecategory (such as discretionary monitoring or source control) based on cost-per-test differences.A comprehensive analysis of the cost differences needs to include input from the customer groupresponsible for determining the sampling and analysis plan for a given category.
As discussed above, process benchmarking suggested that laboratories should work closely withcustomers to optimize batch size and sampling schedules. Another suggestion from processbenchmarking was the importance of implementing laboratory project management systems. Themost significant benefit of project management is the collaborative relationship that evolves be-tween the laboratory and its customers when they work together to develop cost-effective sam-pling and analysis plans. Through this process, both parties are responsible for addressing thecost-effectiveness of monitoring programs associated with the scope of work cost driver. On theother hand, the laboratory benchmarking effort focused on analytical cost-effectiveness. The re-

Municipal Environmental Laboratory Management24
mainder of this section will focus on the comparison tool that was developed to compare budg-ets, costs-per-test and productivity.
The first step in calculating costs-per-test was to develop a cost model that would generate com-parable budgets for all the participating laboratories. The goal was to begin with “apples-to-apples” budgets that included the same components. This step involved decisions about whichactivities (and associated budgets) to include in the model. For example, there are some costs(such as field sampling) that are not included in everyone’s budget. In order for agencies to com-pare their budgets on an “apples-to-apples” basis, the group needed to make a decision aboutwhether to include sampling costs in the model. If the decision was made not to include such acost, then the agencies with this component in their budget would back it out for purposes of themodel. On the other hand, if a decision was made to include a cost that some agencies did nothave in their base budget, then these agencies had to add that cost to the model. For example, itwas decided that the cost of equipment depreciation would be included in the model because it isa major cost of analytical work. Laboratories whose capital equipment budget resides in anotherpart of the agency budget had to add this cost to their budget in the model. Details of thesebudget decisions are listed in a summary table (Appendix D).
After developing comparable budgets, the next step was to calculate overhead burdened averagesalary costs for the four major analytical areas (metals, organics, biology and conventionalchemistry). Overhead was defined to include two components:
1. Administrative overhead (management, support such as QA/QC and LIMS, etc. ); and2. Section overhead (supply costs, supervision, equipment depreciation, etc.).
A budget spreadsheet was developed to ensure that costs were correctly allocated to direct andoverhead categories, and that overhead costs were calculated uniformly (Appendix E).
The next step was to calculate the cost for each analysis by multiplying the overhead burdenedhourly rate by the number of hours required to do the test. For example, if the average hourly rateincluding overhead for organic chemical analyses is $60 and the time required to do a PCBanalysis is two hours, then the cost for a PCB analysis for that laboratory is $120. In all, 222analyses, differing in test of constituent or test method, were included in the cost/test spread-sheet. Again, a spreadsheet was developed to ensure uniform identification of analytical methodsand consistent calculations (Appendix F). The cost-per-test exercise has been a valuable tool tocompare both cost- and time-per-test data for various analyses, as well as the numbers and typesof analyses performed by each laboratory. Because there may be more than one available methodto analyze for a given parameter, the cost-per-test table is also useful for comparing the efficien-cies of various methods, such as automated versus manual procedures.
Another measure that the laboratories agreed to generate was a “reconciled cost-per-test.” Oncethe study year data were loaded for times-per-test and the number of analyses performed by eachmethod, it was possible to calculate the total budget covered by that year’s workload using theaverage hourly rate data generated earlier. Because laboratory staff does not spend 100% of theirtime doing analytical work, the total revenue is typically less than the total budget included in themodel. The reconciliation process involves multiplying the cost-per-test by a cost adjustmentfactor that forces revenue to equal the budgeted cost for each analytical section. A table of thereconciliation or cost adjustment factors is found in Appendix G.
Cost adjustment factors have been useful to the laboratories as a comparison tool and as an indi-cation of the amount of time spent in “indirect” activities. There has been considerable discus-

Multi-Agency Benchmarking
25
sion, for example, about the relationship between “capacity” and the cost adjustment factor. Eachlaboratory has its own work capacity and an associated sample throughput volume and rate thatoptimizes the use of available staff and equipment. The consensus among the laboratories is thatthe better the sample volume matches the available capacity, the more efficient the laboratory,and hence the lower the cost adjustment factor. The laboratories have also developed a list of in-direct activities and compared the percentage of staff time spent on indirect activities. In addi-tion, the cost adjustment factor also adds a correction for errors in the estimation of the time pertest figures.
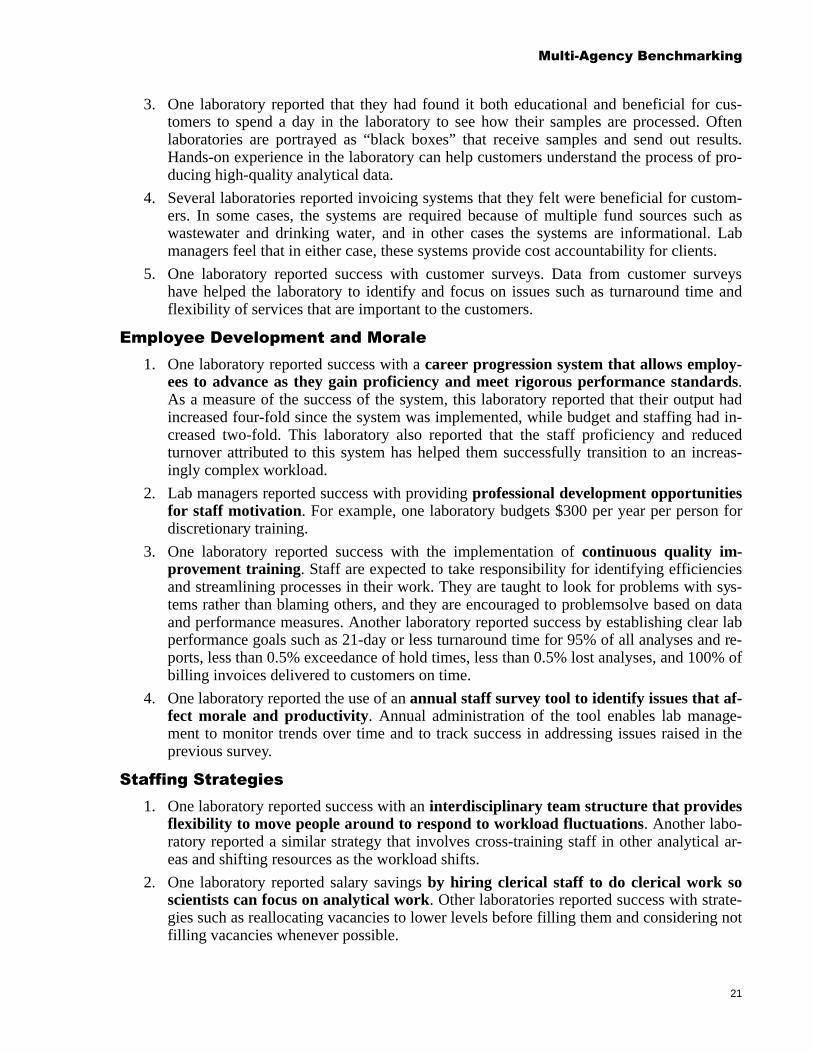
In developing the cost-per-test model, the group agreed that analyses would be defined bymethod, with the exception of metals and ion chromatography analyses, which were defined byelement. Benchmarking participants then spent considerable time developing a ten-page spread-sheet that contains an exhaustive list of all the different analyses performed by the nine labs inthe study. One of the most interesting findings of the study is that there are only five specificmethods of testing out of 222 in the table that are conducted by every agency. In addition, thereare only five specific methods of testing out of 222 that are conducted by eight of the nine par-ticipating laboratories. The frequency data plotted in Figure 11 demonstrate the diversity of theworkload for laboratories participating in the study.
The data in Figure 11 reinforce the group’s observation of significant differences between thelaboratories, despite the fact that they are all public sector laboratories that support wastewatertreatment agencies. It also helps to explain some of the differences observed in the benchmarkingstudy, which will be discussed later in this report. Although the lab managers noted significantdifferences, they also observed several similarities among the laboratories. For example, therewas greater-than-expected similarity in the times-per-test and in the percentages of staff timespent on indirect activities.
The lab managers discussed factors that affect cost and productivity to better understand inter-laboratory differences for times and costs-per-test. Spreadsheets were generated comparing thenumber of tests-per-year (Appendix H), the cost-per-test (Appendix I), and the time-per-test
TABLE I. Frequency Distribution of the 222 Analytical Methods in the Cost/Test Model
0
20
40
60
80
100
120
140
160
1 2 3 4 5 6 7 8 9
Number of Labs Performing the Same Analytical Method
Nu
mb
er o
f An
alyt
ical
Met
ho
ds
Figure 11: Frequency distribution of the 222 analytical methods in the cost/test model.

Municipal Environmental Laboratory Management26
(Appendix J) by method for each agency. A summary table (Appendix K) was also produced tocompare the number of tests-per-FTE-per-month by analytical area (microbiology, biomoni-toring, general chemistry, organic chemistry and metals). Discussions of these tables producedthe following observations about similarities and dissimilarities between laboratories that affectproductivity. For the purposes of these discussions, productivity was defined by the metrictests/FTE/month.
Microbiology1. Differences in sample matrices affect times and costs-per-test. Laboratories that per-
formed primarily process-oriented water and wastewater analyses had higher productivityas defined by tests/FTE/month. Conversely, agencies that have a significant number ofsolid matrix samples such as biosolids and tissues had lower productivity
2. Agencies performing a significant number of pathogen analyses in addition to the indi-cator organisms tended to have lower productivity.
3. Lab managers observed that productivity followed a continuum of complexity for indi-cator organism analyses. The continuum from low to high complexity was fecal coli-forms < total coliforms < fecal and total coliforms < E. coli < fecal strep. The laboratorywith the highest productivity for microbiology tests had the highest proportion of tests forfecal and total coliforms.
4. Laboratories with high microbiological sample volume also had high levels of productiv-ity, which was credited to optimum batch sizes.
5. The times-per-test for microbiology analyses range from a low of less than half an hourfor some indicator organisms to highs of 10 to 20+ hours for some pathogens. Therefore,laboratories performing tests for complex pathogens such as Salmonella sp., Listeria sp.and enteric virus had lower levels of productivity than those who do not conduct a sig-nificant proportion of pathogen testing
6. Laboratories involved in significant levels of method development had lower levels ofproductivity. One laboratory also reported lower levels of productivity due to staffing forfuture, anticipated workload.
Biomonitoring1. Chronic assays require significantly more time than acute assays, which explained the
higher productivity for two laboratories that conduct only acute analyses.2. More staff time is required to culture organisms in house than to purchase organisms for
testing. Therefore, laboratories with significant in-house culturing efforts tended to havelower productivity. It should be noted, however, that the decision to rely on in-houseculturing efforts might be dictated by factors outside the laboratory’s control.
3. The Microtox assay was included in the biomonitoring section. However, it requires sig-nificantly less time than other biomonitoring procedures (an hour versus days in somecases). As a result, including Microtox numbers in the tests/FTE/month metric caused themeasure to range from 332 for a laboratory conducting only Microtox analyses to lessthan 10 for labs conducting only acute and chronic bioassays. Therefore lab managers feltthat the Microtox numbers needed to be factored out to provide a meaningful comparisonof biomonitoring productivity data.
4. Laboratories that are involved in method development or research efforts reported lowerlevels of productivity. Such activities may be the direct result of customer requests.

Multi-Agency Benchmarking
27
5. Productivity was observed to be inversely proportional to the diversity of tests conductedby the laboratory. The three laboratories that conducted the highest number of differentassays (five, eight and nine different tests) had lower productivity numbers. Likewise,both the complexity of the assays and the batch size inversely influence productivity.
6. Three of the laboratories maintain remote operations where biomonitoring assays areconducted, which was observed to lower productivity. The assumption is that this reducedproductivity is related to transportation and maintenance time associated with remote op-erations.
Conventional Chemistry1. Productivity was proportional to the level of process monitoring tests (i. e., the higher the
percentage of process monitoring conventional chemistry tests, the higher the productiv-ity). This is because process monitoring tests tend to be less complex and are submitted tothe lab in higher numbers. To a lesser degree, this also applies to microbiology as notedabove.
2. One laboratory suggested that their lower level of productivity for conventional chemis-try tests might be due the lack of an analytical group devoted to conventional chemistrytesting. Instead, this laboratory spreads its conventional chemistry workload among an-other analytical areas, which provides a more equitable distribution of workload and im-proves staff morale.
3. The laboratory with the lowest level of productivity for conventional chemistry attributedthis to low numbers of samples and underutilized laboratory capacity. Likewise, laborato-ries that reported inefficient batch sizes demonstrated lower productivity.
4. Some laboratories with high levels of productivity for conventional chemistry reportedthat automation increased their productivity.
5. One laboratory attributed lower productivity levels for conventional chemistry to theirorganizational structure. This laboratory reported that multiple laboratories resulted in re-duced productivity related to inefficient batch sizes.
6. One laboratory reported that orientation of new staff had negatively impacted their con-ventional chemistry productivity numbers for the study year.
Metals1. The laboratory with the highest level of productivity for metals analyses attributed their
success to replacing the more labor-intensive graphite furnace analyses with ICP-MStechnology. The same laboratory also had a particularly high workload during the studyyear, which helped them to optimize batch sizes and efficiency. In addition, they extendedhours for metals laboratory operations to meet workload demands by maximizing use ofinstrumentation.
2. Instrumentation issues resulting in lower productivity are most commonly related toproblems with instrument reliability and the lack of ICP and ICP-MS technology. Onelaboratory found their productivity was severely limited by having to use an outdated ICPinstrument incapable of automated gas shutoff, which meant the instrument could not berun overnight.
3. Requirements to meet ultra-trace detection limits or work with complex matrices (such asseawater and tissues) negatively impacted productivity for metals analyses. Likewise,significant method development efforts tended to lower productivity for metals analyses.

Municipal Environmental Laboratory Management28
4. One laboratory explained their higher level of productivity for metals analyses by cus-tomer requests for a high number of elements-per-sample. The reader may recall thatmetals analyses were counted by element, whereas other analyses were counted bymethod. Therefore, multiple element ICP and ICP-MS technologies cost little more toanalyze for 15 elements than for one element per sample.
5. One laboratory attributed their low productivity for metals analyses to inefficiencies as-sociated with decentralized operations. This is because fewer samples are processed ateach laboratory facility with redundant staffing and instrumentation, resulting in lower ef-ficiency.
Organic Chemistry1. Laboratories that conduct a significant number of less-complex analyses demonstrated
higher levels of productivity for organic analyses. Conversely, laboratories with low de-tection limit requirements and complex matrix samples tended to have lower levels ofproductivity for organic analyses.
2. Significant method development efforts accounted for lower productivity for organicanalyses.
3. Productivity for organic analyses was observed to be inversely proportional to the varietyof analytical methods conducted by the laboratory. Laboratories that focus on a smallervariety of tests had higher efficiency levels for organic analyses. Conversely, laboratoriesconducting a greater diversity of tests tended to have lower levels of productivity for or-ganic analyses. This observation is linked to batch size and monitoring frequency. In ex-treme cases, laboratories sometimes analyze more samples for the method-required QCthan samples themselves, in which case it may be more desirable to contract the work toan outside laboratory (unless there is an overriding reason to do the work in-house).
4. Laboratories that frequently experience less-than-optimum batch sizes had lower levels ofproductivity for organic analyses. One laboratory reported that their batch size was nega-tively impacted by their decentralized structure and resulting redundancies.
5. One laboratory attributed lower productivity to problems with instrument reliability.
Additional Context for the Study
This study was designed to provide input to the multi-agency benchmarking study and to allowcomparisons among participating laboratories. Therefore, the study is not all encompassing, andsome care should be exercised in using the results. Points to keep in mind when evaluating thestudy results are discussed below.
“Zeroing Out”: Reconciling the Test Cost Spreadsheet with a Lab’s Budget
In the reconciliation process described above, each laboratory was instructed to reconcile the testcost spreadsheet with the total budget included in the model. However, the spreadsheet only ac-counts for the routine testing performed by the laboratory. It does not include other activities,such as method development, consulting, meetings, or training. If the “hours-per-test” figuresaccurately reflect the actual time spend performing the test, there will be a certain amount of“unaccounted-for” time.

Multi-Agency Benchmarking
29
To make the spreadsheet and the budget reconcile, two options were considered:1. Creating a reconciled (increased) cost-per-test; or2. Inflating the hours-per-test figures.
Both options have the effect of increasing the cost-per-test figures. The group decided to applythe reconciliation factor to the cost/test numbers rather than the hours-per-test numbers to keepthe process simple. Not distorting the hours-per-test figures also had the advantage of maintain-ing their value for comparing method efficiency.
The reconciliation factor takes into account two uncertainties in the numbers:1. The hours-per-test figures are estimates; and2. Analyst time is also spent on indirect activities such as method development, purchasing,
training and meetings.
Rather than utilize a single reconciliation factor for all analytical areas, the group agreed to cal-culate an adjustment factor for each section. This accounts for the fact that different analyticalareas in a given laboratory may have different levels of indirect activities.
Detailed Time Tracking versus Expert Estimates
Different laboratories took different approaches to getting hours-per-test figures. The approachesvaried significantly, but fell into two general categories: 1) expert estimates; and 2) actual timetracking measurements. Expert estimates are obtained by asking a group of supervisors and/oranalysts to determine how long it takes to analyze a batch of a certain number of samples. Theseestimates may tend to be aggressive because they are made with the assumption of not beingsample-limited (optimum capacity utilization). They also may not accurately take into accountfactors that detract from efficiency, such as interruptions, conflicting/changing priorities, prob-lem samples and reruns.
Time tracking may produce more accurate measurements of how long each test takes to perform,but it requires considerable effort. In this approach, everyone fills out a weekly time trackingform that details how time was spent on specific tests and a limited number of general categoriessuch as purchasing and training. For the system to be successful, lab staff must recognize theneed for accurate time tracking and take responsibility for entering accurate data into the system.If too much time is charged to a test, it will appear inefficient. If too little time is charged to atest, insufficient resources will be budgeted for that test. One advantage of a good time trackingsystem is that it can be used to monitor on-going performance and improvements because it takesinto account the actual batch sizes used and the effects of interruptions or changing priorities.
Limitations of Test Count Comparisons
Although simple performance metrics, such as tests-per-person, are easy to compute, they do notnecessarily facilitate meaningful comparisons. Some tests are performed quickly while otherstake hours. Tests-per-person measures in areas such as organic chemistry and biomonitoring withtime-consuming tests were considerably lower than test-per-person measures in areas such asconventional chemistry, metals and conventional chemistry with less time consuming tests.However, the laboratory managers observed that comparing tests-per-person by analytical areaprovides more meaningful comparison than comparing test-per-person person on a lab-widelevel. If the mix of tests between two laboratories is different, comparisons of tests-per-personvary even more at a lab-wide level and have limited relevance.

Municipal Environmental Laboratory Management30
Another factor to keep in mind when comparing costs and times-per-test is the fact that there areadditional “value-added” services that aren’t adequately captured in the detailed cost-per-testspreadsheet. Laboratories in the benchmarking study reported that they provide a wide variety ofadditional services beyond test results. These services include consulting, special studies, datainterpretation, project designs, sampling and analysis plan development, special report prepara-tion, and regulatory review and negotiation. For this study, these services were rolled into thelaboratory’s overhead. Lab managers estimated that the percentage of time spent on these serv-ices ranges between 10% to 25%. Many of these services stem from a long-standing, customer-focused commitment to meeting the needs of the agency. These are often intangible benefits thatare difficult to quantify, but their impact is significant.
Comparison of Benchmarking Costs, Marginal Costs and Prices
The costs-per-test in the detailed spreadsheet cover the actual cost for performing each analysis,subject to the assumptions in this study. In addition, the costs in the model do not represent mar-ginal costs, which are the incremental cost for adding one more test to an existing batch of tests.The marginal cost does not include the cost of the instrumentation or the labor and supply costsassociated with running and calibrating the instrument because these have already been ac-counted for in the study model. Likewise, marginal costs do not include the cost of QC sampleswhen the sample can be added to an existing batch of samples that has not reached the QC limit.Marginal costs only include the actual labor and supplies associated with performing the addi-tional tests. Therefore, marginal costs for additional work to fill the gap between existing work-load and laboratory capacity are typically much lower than the costs in this study.
In addition, care must be taken when comparing costs in this study with commercial laboratoryprices. First, it is important to keep in mind the difference between actual costs, which are fixed,and prices, which vary depending on factors such as market drivers and whether or not they re-flect marginal costs. Second, it is important to factor in agency overhead costs associated withsubcontracting work when evaluating commercial laboratory prices. Subcontracting analyticalwork requires procurement, contract management, QA/QC oversight, coordination, data man-agement, and incorporation of the results in the agency’s historical database. Lab managers esti-mated that these activities add 10% to 30% to the cost of commercial laboratory prices.
After taking these factors into account, there may be situations in which it is more cost effectiveto sub-contract analytical work than to do it in-house, as has been noted previously in this report.One example is the situation in which there is insufficient annual workload to make it cost effec-tive to purchase equipment and spend method development time required to establish a methodin-house. Sub-contracting may also be beneficial even if a method has been established in-housein the event that samples do not arrive at the laboratory in sufficient batch sizes to make the workcost effective. For example, herbicide analyses that require considerable effort for one or twosamples can be done more economically at a contract laboratory that can batch them with workfrom other customers. A sub-contract laboratory can also be helpful when instrumentation goesdown, especially if samples are currently in-house and at risk of exceeding holding times.
Another point to keep in mind when evaluating the results of this study and considering cost-saving measures is the relationship between batch size and cost. It is important to evaluatewhether proposed savings associated with reduced sample volume would be marginal costs oractual costs. Depending on the magnitude of the reduction, fewer samples may only reduce thenumber of samples in an analytical batch rather than reduce the number of analytical batches. Asa result, the cost-per-test may actually increase as efficiency decreases. This reinforces the im-

Multi-Agency Benchmarking
31
portance of customers working closely with their agency laboratory to evaluate strategies to op-timize laboratory utilization by scheduling samples as efficiently as possible.

Municipal Environmental Laboratory Management32
Summary and ConclusionsMABS Findings
When costs are compared for MABS template categories, two components contribute to varia-tion between agencies:
1. The scope of work requested, and2. The laboratory’s efficiency at performing the work.
The number and type of analyses that are requested by customers have the most impact on theanalytical cost, and cost is influenced to a lesser extent by the cost of an individual analysis.Therefore, the cost differences between agencies for given template categories cannot be ex-plained solely on the basis of cost-per-test differences.
One inter-laboratory comparison was total laboratory expenditures versus flow-normalized labo-ratory expenditures, as shown in Figure 12. The bars in Figure12 represent the total annual labo-ratory expenditure for each agency, and the connected points represent laboratory expendituresnormalized by annual flow. In general, the gap between total expenditures and flow-normalizedexpenditures narrows as annual flow increases. These data are considered to demonstrate theeconomy of scale factor that is achieved for larger systems.
Table I. Laboratory Costs as Total $ and $/MGY
0
1
2
3
4
5
6
CPBES CCCSD EBMUD SRCSD OCSD KCDNR CLABS
To
tal $
Mill
ion
0
10
20
30
40
50
60
$/M
GY
$/MGY
Million $
Figure 13 shows lab costs displayed by template categories as a percent of the total lab cost foreach agency. This information provides additional context as agencies discuss differences in lev-els of laboratory support for wastewater operations, source control, and monitoring programs.
Cost Model Findings
A “productivity” metric was calculated for each analytical area (biology, microbiology, organicchemistry, metals chemistry and conventional chemistry). The comparison of these numbersformed the basis of a discussion about factors that either positively or negatively affect produc-
Figure 12: Laboratory costs as total $ and $/MGY.
Agency A Agency B Agency C Agency D Agency E Agency F Agency G

Multi-Agency Benchmarking
33
tivity. Laboratory managers also shared information on best practices that they had found to besuccessful in addressing efficiency, customer service, data quality, and cost effectiveness. Fol-lowing is a list of key findings that were identified in these discussions.
1. Minimizing the cost-per-test is mostly a function of optimizing batch size and bestutilizing laboratory capacity. Batch size affects cost-per-test because a predefined num-ber of quality control (QC) samples are required at a fixed rate per analytical batch. Forexample, if there are 20 samples in an analytical batch and the QC rate is 5%, then oneset of QC samples is required for these 20 samples. Depending on the analytical method,the QC set may include several different samples such as matrix spikes, duplicates,blanks, and standard reference materials. The same set of QC samples is required whetherthe batch size is one sample or 20 samples. Therefore, the cost-per-individual-test is low-est when batch sizes are run at their maximum capacity.
2. Regarding the utilization of laboratory capacity, there are several fixed costs associ-ated with maintaining instrumentation and other aspects of the laboratory. If the labora-tory capacity is under-utilized, these costs are spread across fewer samples, and the cost-per-analysis increases. Conversely, the cost-per-analysis decreases as the percent of labo-ratory capacity utilization increases.
3. Laboratory analysts can streamline analytical procedures by employing the most ef-ficient methods and instrumentation, they can use process flow analysis to improve sam-ple processing, and they can investigate ways to reduce reruns associated with problemssuch as QC failure. However, for the reasons stated above, minimizing the cost-per-test ismostly a function of optimizing batch size and efficiently utilizing laboratory capacity.
4. It is critical for laboratories to work closely to schedule workload efficiently. Thebest way for laboratories to achieve the cost reductions associated with optimizing batchsize and efficiently utilizing laboratory capacity is to work closely with customers onscheduling. This is particularly important for samples with short holding times that pro-vide less flexibility for batching. One best practice example of a useful scheduling strat-egy was the agency that established a policy giving their laboratory the right of firstrefusal for all agency lab work.
5. It is critical for laboratories to work closely with their customers to develop cost-effective sampling and analysis plans that address data quality objectives. In addition todoing things right, it is important that laboratories do the right things. The wise use oflaboratory resources requires that laboratories work closely with their customers to en-sure they are doing the appropriate analyses that best meet the customer’s project needsand data quality objectives.
6. Flexible staffing strategies help laboratories respond to workload fluctuations. Onceworkflow has been leveled as much as possible through improved scheduling with cus-tomers, the laboratory can work internally to improve their ability to deal efficiently withpeaks and valleys in the workload if they have cross-trained staff who can shift from ar-eas with less work to areas with workload peaks.
7. Laboratories with higher efficiency often were those with higher levels of automa-tion. In addition to faster throughput and higher levels of productivity, laboratory auto-mation can improve laboratory accuracy and precision.
8. Factors such as variety of analyses offered, complexity of analyses and matrices, ex-tent of QC and reporting requirements, and detection limit requirements affectlaboratory efficiency and productivity. Lab managers reported that productivity and ef-

Municipal Environmental Laboratory Management34
ficiency decreased as analytical complexity and the variety of service offerings increased.The most efficient laboratory for organic chemistry analyses, for example, conducts onlythree different analyses compared with a high of 39 different analyses. Other complexi-ties such as very low detection limits requirements or difficult matrices were also ob-served to lower productivity
9. Tools such as customer surveys, customer advisory committees, staff surveys, proj-ect management systems and job progression help laboratories improve customerservice and employee morale. For example, labs with customer advisory committeesfound they helped customers work with the lab to balance workload and set priorities.They also found it beneficial for customers to hear each other’s perspectives, recognizeconflicting interests, and better understand lab decisions. Customer surveys were reportedby some laboratories to help identify and focus on issues that are important to their cus-tomers. Project management systems help improve the coordination between the labora-tory and customers, and that is important in optimizing utilization of laboratory capacityand developing good sampling and analysis plans. In addition to improving employeeretention and morale, job progression systems were reported to help laboratories improvetheir flexibility to respond to workload fluctuations by increasing the level of cross-training.
Areas for Further Study
Laboratory managers agreed that it is important to continue to collect data in future years tomonitor trends, to evaluate the success of efficiency measures, and to periodically share infor-mation with each other. They also agreed that it is important to work with customers to explainagency differences in analytical costs associated with wastewater treatment operations andmonitoring programs. Laboratories also need to continue to strengthen relationships with cus-tomers because optimal and cost-effective use of laboratory resources is a collaborative processbetween laboratories and their customers.

Multi-Agency Benchmarking
35
Table III. Lab Costs by Template Category as a Percent of Total
0%
20%
40%
60%
80%
100%
CCCSD OCSD EBMUD KCDNR CLABS CPBES SRCSD
% ofTotal
Clerical
Non Req'd Non SC
Method Development
LIMS
Supervision
Source Control
Discretionary
Compliance
Figure 13. Lab costs by template category as a percentage of total.
Agency B Agency E Agency C Agency F Agency G Agency A Agency D


Multi-Agency Benchmarking
37
Appendices