MUFG Global Fund SICAV · PDF fileMARCH 31, 2014 R.C.S. Luxembourg No. B 182 ... 2014 to 31st...
39
MUFG Global Fund SICAV Société d'Investissement à Capital Variable Luxembourg AUDITED ANNUAL REPORT FOR THE PERIOD FROM NOVEMBER 20, 2013 (DATE OF INCORPORATION) TO MARCH 31, 2014 R.C.S. Luxembourg No. B 182.362
Transcript of MUFG Global Fund SICAV · PDF fileMARCH 31, 2014 R.C.S. Luxembourg No. B 182 ... 2014 to 31st...
MUFG Global Fund SICAV Société d'Investissement à Capital Variable Luxembourg
AUDITED ANNUAL REPORT FOR THE PERIOD FROM NOVEMBER 20, 2013 (DATE OF INCORPORATION) TO MARCH 31, 2014 R.C.S. Luxembourg No. B 182.362

1
MUFG Global Fund SICAV Société d'Investissement à Capital Variable Luxembourg
AUDITED ANNUAL REPORT FOR THE PERIOD FROM NOVEMBER 20, 2013 (DATE OF INCORPORATION) TO MARCH 31, 2014
2
MUFG Global Fund SICAV
AUDITED ANNUAL REPORT FOR THE PERIOD FROM NOVEMBER 20, 2013 (DATE OF INCORPORATION) TO MARCH 31, 2014
Any subscriptions not based on the information contained in the relevant currently valid prospectus accompanied by the relevant key investor information document, and the most recent annual report and semi-annual report, if the latter was published after the annual report, shall be invalid.

MUFG Global Fund SICAV
TABLE OF CONTENTS
3
MANAGEMENT AND ADMINISTRATION 4
INFORMATION TO SHAREHOLDERS 6
MANAGER'S REPORT 7
RISK DISCLOSURE 9
AUDIT REPORT 10
STATEMENT OF NET ASSETS 12
STATEMENT OF OPERATIONS 14
STATEMENT OF CHANGES IN NET ASSETS 16
MUFG Asia Pacific ex Japan Equity High Growth Fund Statement of investments and other net assets 19 Geographical classification of investments 22
MUFG Asia Pacific ex Japan Equity Income Growth Fund Statement of investments and other net assets 23 Geographical classification of investments 25
MUFG Asia Pacific ex Japan Equity Stable Growth Fund Statement of investments and other net assets 26 Geographical classification of investments 29
CHANGES IN THE NUMBER OF SHARES AND STATISTICAL INFORMATION 30
NOTES TO THE FINANCIAL STATEMENTS 33
MUFG Global Fund SICAV
MANAGEMENT AND ADMINISTRATION
4
REGISTERED OFFICE
287-289, route d’Arlon, L-1150 Luxembourg
MANAGEMENT COMPANY
MUGC Lux Management S.A., 287-289, route d’Arlon, L-1150 Luxembourg
BOARD OF DIRECTORS OF THE SICAV
Chairman MUGC Lux Management S.A. represented by Jean-François FORTEMPS, Managing Director, MUGC Lux Management S.A., Luxembourg
Director
Director
Mr. Hiroaki MATSUYAMA, Senior Vice President, Mitsubishi UFJ Global Custody S.A., Luxembourg
Mr. Teruaki KOBAYASHI, First Vice President, Mitsubishi UFJ Global Custody S.A., Luxembourg
BOARD OF DIRECTORS OF THE MANAGEMENT COMPANY
Chairman Mr. Hisakata ISOMURA, Managing Director, Mitsubishi UFJ Global Custody S.A., Luxembourg
Director Mr. Jean-François FORTEMPS, Managing Director, MUGC Lux Management S.A., Luxembourg
Director Mr. Eiji IHORI, Executive Officer in the Trust Asset Planning Division of Mitsubishi UFJ Trust and Banking, Japan
Director Mr. Paul Emile Mathias GUILLAUME, Non Executive Director, MUGC Lux Management S.A., Luxembourg (appointed on March 1, 2014)
CONDUCTING OFFICERS
Mr. Jean-François FORTEMPS, Managing Director
Mr. Krzysztof DUDEK, Conducting Officer
INVESTMENT MANAGER
Mitsubishi UFJ Asset Management (UK) Ltd, 24 Lombard Street, London EC3V 9AJ, United Kingdom
SUB-INVESTMENT MANAGER
Mitsubishi UFJ Trust and Banking, Corporation 4-5, Marunouchi 1-Chome, Chiyoda-ku, Tokyo 100-8212, Japan
MUFG Global Fund SICAV
MANAGEMENT AND ADMINISTRATION (continued)
5
ADMINISTRATION
DEPOSITARY BANK, DOMICILIARY AGENT, REGISTRAR, TRANSFER, ADMINISTRATIVE AND PAYING AGENT
Mitsubishi UFJ Global Custody S.A., 287-289, route d’Arlon, L-1150 Luxembourg
AUDITOR OF THE FUND
PricewaterhouseCoopers, Société coopérative, 400 route d’Esch, L-1471 Luxembourg
AUDITOR OF THE MANAGEMENT COMPANY
Deloitte Audit, Société à responsabilité limitée, 560, rue de Neudorf, L-2220 Luxembourg
MUFG Global Fund SICAV
INFORMATION TO SHAREHOLDERS
6
Financial period and reporting
The financial year starts on April 1 and ends on March 31 of each year.
The first financial year started on November 20, 2013 (date of incorporation) of the SICAV and end on March 31, 2014.
Audited annual reports will be made available at the registered office of the Fund no later than four months after the end of the financial year and unaudited semi-annual reports will be made available two months after the end of such period.
The Fund’s Annual General Meeting will be held on Wednesday of the 3rd week in July. If such day is a legal bank holiday in Luxembourg, the Annual General Meeting shall be held on the next following full bank business day in Luxembourg. The first general annual meeting will be held on Wednesday of the 3rd week in July 2014.
Documents available for inspection
Copies of the following documents can be inspected during normal business hours (except for weekends and holidays) at the registered office of the company and the depositary bank:
The Fund’s full prospectus;
The Fund’s Key Investor Information Document (KIID);
The Fund’s Articles of Incorporation;
The Fund’s annual and semi-annual financial report.
The statement of changes in the investment portfolio during the period from November 20, 2013 (date of incorporation) to March 31, 2014 is available free of charge at the Registered Office of the Management Company.
MUFG Global Fund SICAV
MANAGER'S REPORT
7
For the year ended 31st March, 2014
Performance Summary <MUFG Asia Pacific ex Japan Equity Stable Growth Fund> During the period from 1st January, 2014 to 31st March, 2014, the Fund returned +2.2% (in USD, class I share) outperforming MSCI AC Asia Pacific ex Japan Total Net Total Return Index, USD (the “Reference Index”) which finished the period with +1.0%. <MUFG Asia Pacific ex Japan Equity High Growth Fund> During the period from the initial subscription (21st February, 2014) to 31st March, 2014, the Fund returned +1.2% (in USD) underperforming the Reference Index which finished the period with +2.6%. <MUFG Asia Pacific ex Japan Equity Income Growth Fund> During the period from the initial subscription (21st February, 2014) to 31st March, 2014, the Fund returned +0.6% (in USD) underperforming the Reference Index which finished the period with +2.6%. Equity Market Review Asia-Pacific equity market ended up flat during the period from 1st January 2014 to 31st March 2014 although the market became volatile in the course of the period along with worsened sentiment on emerging markets. In January, the market declined due to growing anxiety for emerging economies on the back of trust product default concern and weak PMI in China along with currency sell-off in emerging markets such as Argentina and Turkey. In February, the market rebounded on the back of receding for emerging economies and resilient US equity market. In March, market was volatile and ended with a slight increase. Chinese market showed weakness as concern on Chinese economy persisted while other markets such as Southeast Asia and India performed well on the back of improving economy and political stability. Performance Review <MUFG Asia Pacific ex Japan Equity Stable Growth Fund> MUFG Asia Pacific ex Japan Equity Stable Growth Fund ("Fund") focuses on companies that can achieve 1) long-term, 2) stable and 3) above-market earnings growth regardless of external environment such as macro-economic conditions. The Fund tries to identify such growth by conducting bottom-up research mainly focusing on business model, management ability and financial stability. The Fund outperformed the Reference Index by 1.24% (in USD, class I shares) over the three-month period. In January, our fund concept worked well in this volatile market and our stock selection which focuses on structural growth factor performed well, particularly in China. One of the top positive contributors was “Ajisen China”; we appreciated highly their steady earnings growth achieved by new ramen shop openings. In terms of country allocation, our overweight of Indonesia contributed positively as the market went up due to strong economic numbers and emerged expectations for coming election. Our overweight in Thailand also contributed positively despite political turmoil as the downside was limited after a huge selling from foreign investors in December. In February, the fund performance lagged the overall market as stock selection in China struggled. The worst contributor was Lenovo. We highly valued its ability to generate profit backed by its high market share in the consolidated PC market and growth potential in emerging and smartphone market. The share price dropped steeply as they announced a large-scale acquisition of loss-making Motorola handset business from Google. In terms of country allocation, our overweight in Indonesia contributed positively as the market continued to go up due to expectation for improving economic situation. Underweight in Korea also contributed positively. In March, the fund performance slightly lagged the overall market as stock selection in China struggled while stock selection in other markets generally worked. In China, we prefer structural growth names to cyclical ones. But investors’ preference towards cyclical to structural growth increased backed by expectation for stimulus policy towards the end of March. As for individual names, the most negative contributor was Labi Xiao Xin(1262 HK), snack food maker. We believed the company could achieve stable growth by adding new distributors and introducing new products. The share price collapsed after accounting scandal was reported by magazine in China. We have completely sold the share in March.
MUFG Global Fund SICAV
MANAGER'S REPORT (continued)
8
<MUFG Asia Pacific ex Japan Equity High Growth Fund> In March, Asia-Pacific equity market became volatile and ended with slight increase. Chinese market was weak as concern on Chinese economy persisted while other markets such as Southeast Asia and India performed well on the back of improving economy and political stability. The fund performance lagged the overall market as stock selection in China contributed negatively while stock selection in other markets generally worked. In China, we prefer structural growth names over cyclical ones. However towards the end of March, investors’ preference for cyclical names over structural growth ones heightened backed by expectation for stimulus policy. As for individual names, share price of Chinese stocks with structural growth potential fell down in March. They are China Oilfield Services (2883 HK), Tencent Holdings (700 HK) and REXLot (555 HK). We still believe growth potential of these names. <MUFG Asia Pacific ex Japan Equity Income Growth Fund> In March, Asia-Pacific equity market became volatile and ended with slight increase. Chinese market was weak as concern on Chinese economy persisted while other markets such as Southeast Asia and India performed well on the back of improving economy and political stability. The fund performance lagged the overall market as stock selection in Taiwan or India didn't work well. We prefer structural growth names over cyclical ones. However towards the end of March, investors’ preference for cyclical names over structural growth ones heightened backed by expectation for stimulus policy in China. As for individual names, the worst negative contributor was St. Shine Optical (1565 TT), contact lens maker. We highly valued the ability of generating growth by adding production capacity. It underperformed due to market concern on color contact lens demand in Japan, one of their largest markets. We think the market concern was overdone and we still keep the holdings. Luxembourg, June 30, 2014 The figures stated in this report are historical and not necessarily indicative of future performance.

MUFG Global Fund SICAV
RISK DISCLOSURE
9
The Management Company uses a Risk Management Process for the Company in accordance with the Law of December 17, 2010 as amended and other applicable regulations, in particular CSSF Circular 11/512. This Risk Management Process provides for the measurement and control of the overall risk of all funds using the commitment approach.

PricewaterhouseCoopers, Société coopérative, 400 Route d’Esch, B.P. 1443, L-1014 Luxembourg T: +352 494848 1, F:+352 494848 2900, www.pwc.lu
Cabinet de révision agréé. Expert-comptable (autorisation gouvernementale n°10028256) R.C.S. Luxembourg B 65 477 - TVA LU25482518
10
Audit report To the Shareholders of MUFG Global Fund SICAV We have audited the accompanying financial statements of MUFG Global Fund SICAV and of each of its sub-funds, which comprise the statement of net assets and the statement of investments and other net assets as at March 31, 2014 and the statement of operations and the statement of changes in net assets for the period from November 20, 2013 (date of incorporation) to March 31, 2014, and a summary of significant accounting policies and other explanatory notes to the financial statements.
Responsibility of the Board of Directors of the SICAV for the financial statements
The Board of Directors of the SICAV is responsible for the preparation and fair presentation of these financial statements in accordance with Luxembourg legal and regulatory requirements relating to the preparation of the financial statements and for such internal control as the Board of Directors of the SICAV determines is necessary to enable the preparation of financial statements that are free from material misstatement, whether due to fraud or error.
Responsibility of the “Réviseur d’entreprises agréé”
Our responsibility is to express an opinion on these financial statements based on our audit. We conducted our audit in accordance with International Standards on Auditing as adopted for Luxembourg by the “Commission de Surveillance du Secteur Financier”. Those standards require that we comply with ethical requirements and plan and perform the audit to obtain reasonable assurance about whether the financial statements are free from material misstatement.
An audit involves performing procedures to obtain audit evidence about the amounts and disclosures in the financial statements. The procedures selected depend on the judgment of the “Réviseur d’entreprises agréé”, including the assessment of the risks of material misstatement of the financial statements, whether due to fraud or error. In making those risk assessments, the “Réviseur d’entreprises agréé” considers internal control relevant to the entity’s preparation and fair presentation of the financial statements in order to design audit procedures that are appropriate in the circumstances, but not for the purpose of expressing an opinion on the effectiveness of the entity’s internal control. An audit also includes evaluating the appropriateness of accounting policies used and the reasonableness of accounting estimates made by the Board of Directors of the SICAV, as well as evaluating the overall presentation of the financial statements.
We believe that the audit evidence we have obtained is sufficient and appropriate to provide a basis for our audit opinion.
„7 ... pwc
Opinion
In our opinion, the financial statements give a true and fair view of the financial position of MUFG Global Fund SICAV and of each of its sub-funds as of March 31, 2014, and of the results of their operations and changes in their net assets for the period from November 20, 2013 (date of incorporation) to March 31, 2014 in accordance with Luxembourg legal and regulatory requirements relating to the preparation of the financial statements.
Other matters
Supplementary information included in the annual report has been reviewed in the context of our mandate but has not been subject to specific audit procedures carried out in accordance with the standards described above. Consequently, we express no opinion on such information. However, we have no observation to make concerning such information in the context of the financial statements taken as a whole.
PricewaterhouseCoopers, Société cooperative Luxembourg, June 30, 2014 Represented .y
f / _.
,:_:_---------' Laurent Marx
11
MUFG Global Fund SICAV
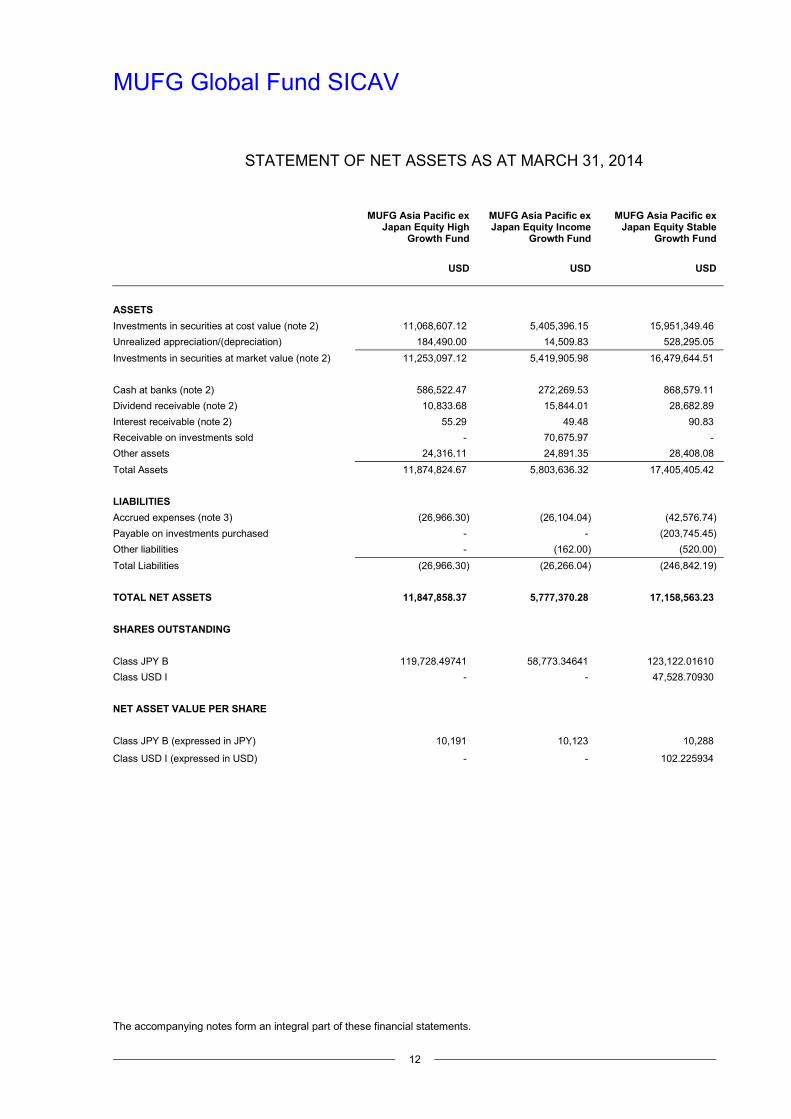
STATEMENT OF NET ASSETS AS AT MARCH 31, 2014
The accompanying notes form an integral part of these financial statements.
12
MUFG Asia Pacific ex Japan Equity High
Growth Fund
MUFG Asia Pacific ex Japan Equity Income
Growth Fund
MUFG Asia Pacific exJapan Equity Stable
Growth Fund
USD USD USD
ASSETS
Investments in securities at cost value (note 2) 11,068,607.12 5,405,396.15 15,951,349.46
Unrealized appreciation/(depreciation) 184,490.00 14,509.83 528,295.05
Investments in securities at market value (note 2) 11,253,097.12 5,419,905.98 16,479,644.51
Cash at banks (note 2) 586,522.47 272,269.53 868,579.11
Dividend receivable (note 2) 10,833.68 15,844.01 28,682.89
Interest receivable (note 2) 55.29 49.48 90.83
Receivable on investments sold - 70,675.97 -
Other assets 24,316.11 24,891.35 28,408.08
Total Assets 11,874,824.67 5,803,636.32 17,405,405.42
LIABILITIES
Accrued expenses (note 3) (26,966.30) (26,104.04) (42,576.74)
Payable on investments purchased - - (203,745.45)
Other liabilities - (162.00) (520.00)
Total Liabilities (26,966.30) (26,266.04) (246,842.19)
TOTAL NET ASSETS 11,847,858.37 5,777,370.28 17,158,563.23
SHARES OUTSTANDING
Class JPY B 119,728.49741 58,773.34641 123,122.01610
Class USD I - - 47,528.70930
NET ASSET VALUE PER SHARE
Class JPY B (expressed in JPY) 10,191 10,123 10,288
Class USD I (expressed in USD) - - 102.225934
MUFG Global Fund SICAV
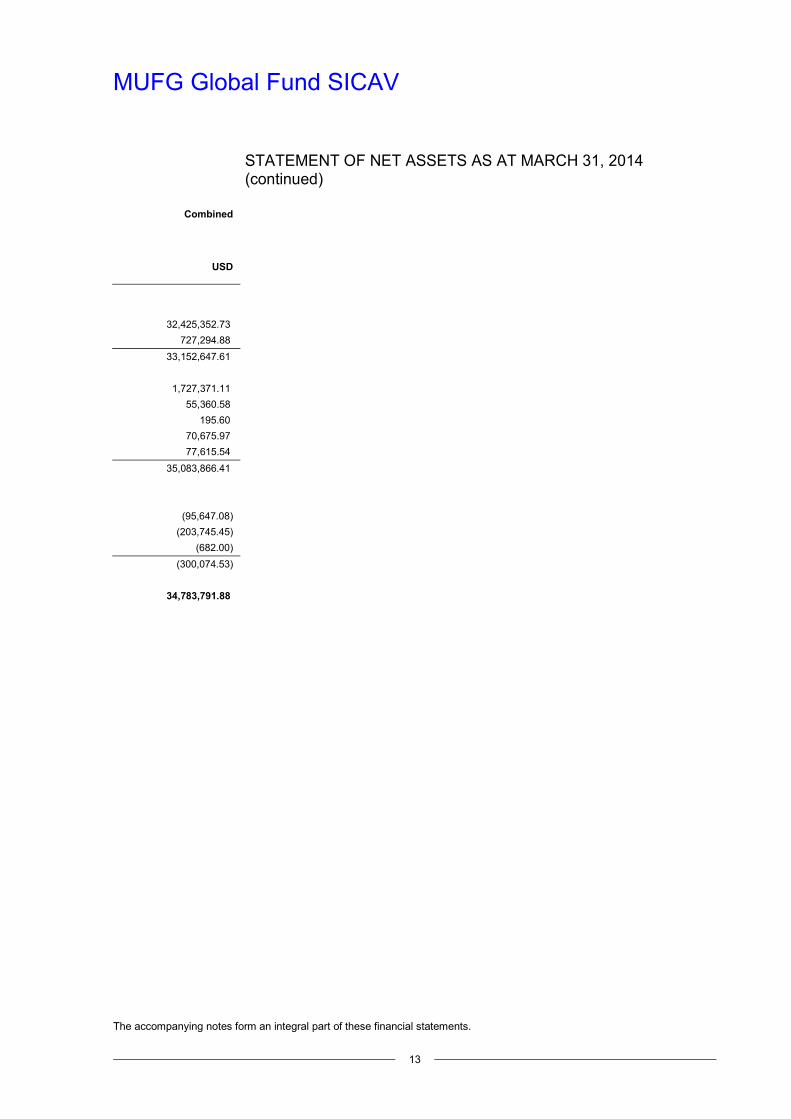
STATEMENT OF NET ASSETS AS AT MARCH 31, 2014 (continued)
The accompanying notes form an integral part of these financial statements.
13
Combined
USD
32,425,352.73
727,294.88
33,152,647.61
1,727,371.11
55,360.58
195.60
70,675.97
77,615.54
35,083,866.41
(95,647.08)
(203,745.45)
(682.00)
(300,074.53)
34,783,791.88
MUFG Global Fund SICAV
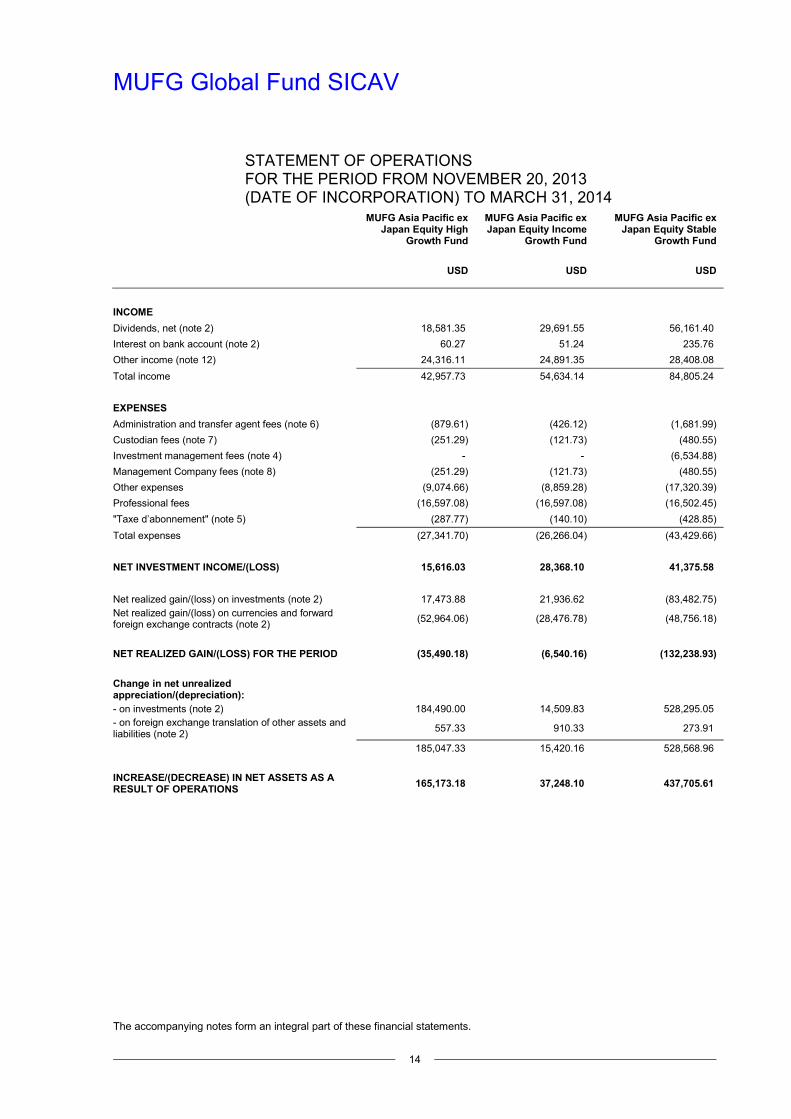
STATEMENT OF OPERATIONS FOR THE PERIOD FROM NOVEMBER 20, 2013 (DATE OF INCORPORATION) TO MARCH 31, 2014
The accompanying notes form an integral part of these financial statements.
14
MUFG Asia Pacific ex Japan Equity High
Growth Fund
MUFG Asia Pacific ex Japan Equity Income
Growth Fund
MUFG Asia Pacific exJapan Equity Stable
Growth Fund
USD USD USD
INCOME
Dividends, net (note 2) 18,581.35 29,691.55 56,161.40
Interest on bank account (note 2) 60.27 51.24 235.76
Other income (note 12) 24,316.11 24,891.35 28,408.08
Total income 42,957.73 54,634.14 84,805.24
EXPENSES
Administration and transfer agent fees (note 6) (879.61) (426.12) (1,681.99)
Custodian fees (note 7) (251.29) (121.73) (480.55)
Investment management fees (note 4) - - (6,534.88)
Management Company fees (note 8) (251.29) (121.73) (480.55)
Other expenses (9,074.66) (8,859.28) (17,320.39)
Professional fees (16,597.08) (16,597.08) (16,502.45)
"Taxe d’abonnement" (note 5) (287.77) (140.10) (428.85)
Total expenses (27,341.70) (26,266.04) (43,429.66)
NET INVESTMENT INCOME/(LOSS) 15,616.03 28,368.10 41,375.58
Net realized gain/(loss) on investments (note 2) 17,473.88 21,936.62 (83,482.75) Net realized gain/(loss) on currencies and forward foreign exchange contracts (note 2)
(52,964.06) (28,476.78) (48,756.18)
NET REALIZED GAIN/(LOSS) FOR THE PERIOD (35,490.18) (6,540.16) (132,238.93)
Change in net unrealized appreciation/(depreciation): - on investments (note 2) 184,490.00 14,509.83 528,295.05 - on foreign exchange translation of other assets and liabilities (note 2)
557.33 910.33 273.91
185,047.33 15,420.16 528,568.96
INCREASE/(DECREASE) IN NET ASSETS AS A RESULT OF OPERATIONS
165,173.18 37,248.10 437,705.61

MUFG Global Fund SICAV
STATEMENT OF OPERATIONS FOR THE PERIOD FROM NOVEMBER 20, 2013 (DATE OF INCORPORATION) TO MARCH 31, 2014 (continued)
The accompanying notes form an integral part of these financial statements.
15
Combined
USD
104,434.30
347.27
77,615.54
182,397.11
(2,987.72)
(853.57)
(6,534.88)
(853.57)
(35,254.33)
(49,696.61)
(856.72)
(97,037.40)
85,359.71
(44,072.25)
(130,197.02)
(174,269.27)
727,294.88
1,741.57
729,036.45
640,126.89
MUFG Global Fund SICAV MUFG Asia Pacific ex Japan Equity High Growth Fund
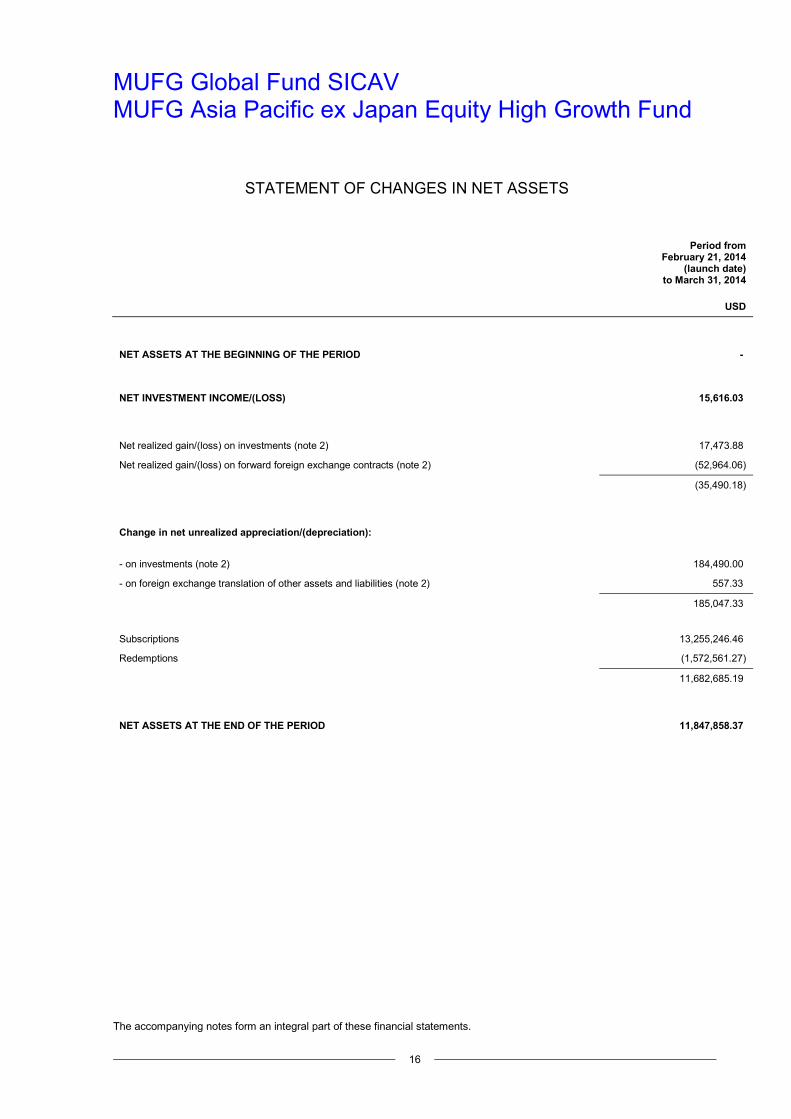
STATEMENT OF CHANGES IN NET ASSETS
The accompanying notes form an integral part of these financial statements.
16
Period fromFebruary 21, 2014
(launch date)to March 31, 2014
USD
NET ASSETS AT THE BEGINNING OF THE PERIOD -
NET INVESTMENT INCOME/(LOSS) 15,616.03
Net realized gain/(loss) on investments (note 2) 17,473.88
Net realized gain/(loss) on forward foreign exchange contracts (note 2) (52,964.06)
(35,490.18)
Change in net unrealized appreciation/(depreciation):
- on investments (note 2) 184,490.00
- on foreign exchange translation of other assets and liabilities (note 2) 557.33
185,047.33
Subscriptions 13,255,246.46
Redemptions (1,572,561.27)
11,682,685.19
NET ASSETS AT THE END OF THE PERIOD 11,847,858.37
MUFG Global Fund SICAV MUFG Asia Pacific ex Japan Equity Income Growth Fund
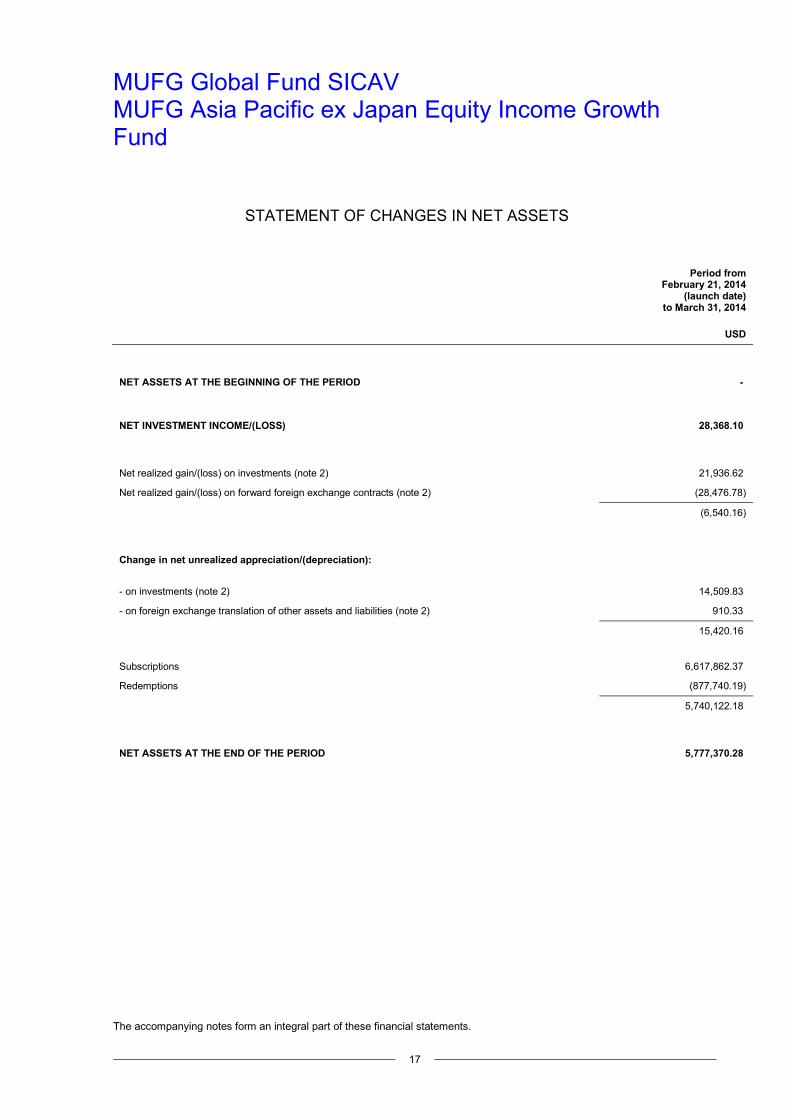
STATEMENT OF CHANGES IN NET ASSETS
The accompanying notes form an integral part of these financial statements.
17
Period fromFebruary 21, 2014
(launch date)to March 31, 2014
USD
NET ASSETS AT THE BEGINNING OF THE PERIOD -
NET INVESTMENT INCOME/(LOSS) 28,368.10
Net realized gain/(loss) on investments (note 2) 21,936.62
Net realized gain/(loss) on forward foreign exchange contracts (note 2) (28,476.78)
(6,540.16)
Change in net unrealized appreciation/(depreciation):
- on investments (note 2) 14,509.83
- on foreign exchange translation of other assets and liabilities (note 2) 910.33
15,420.16
Subscriptions 6,617,862.37
Redemptions (877,740.19)
5,740,122.18
NET ASSETS AT THE END OF THE PERIOD 5,777,370.28
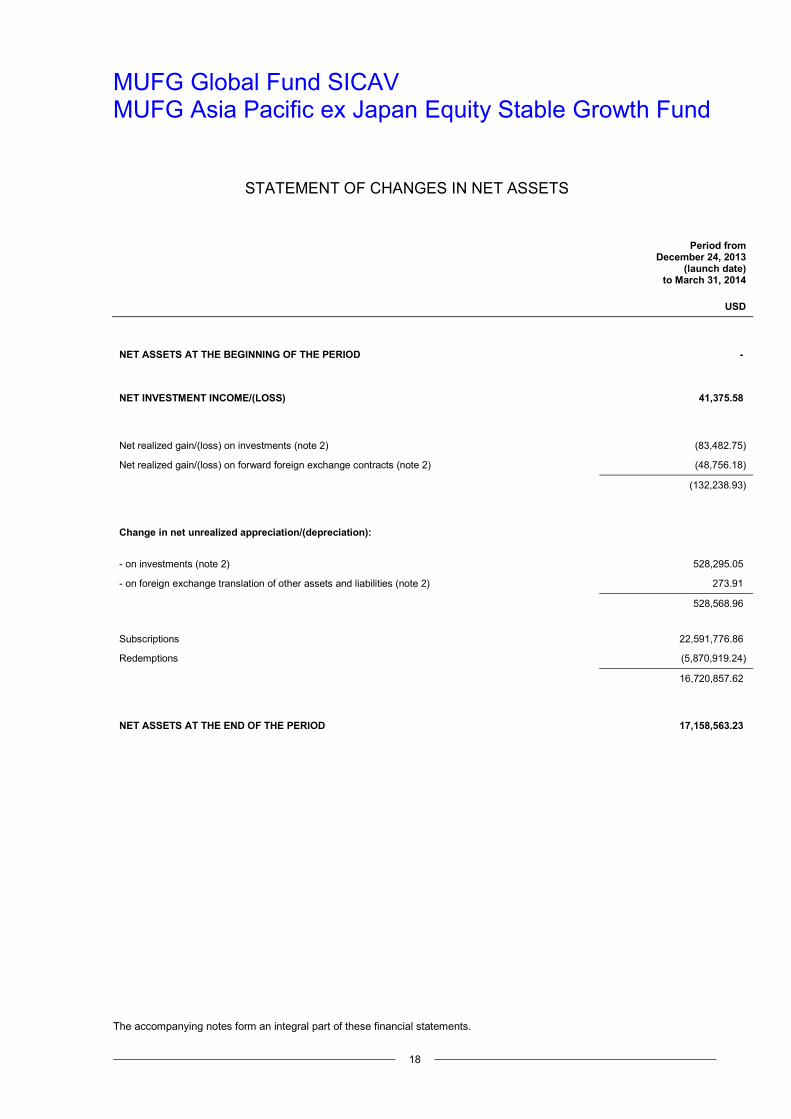
MUFG Global Fund SICAV MUFG Asia Pacific ex Japan Equity Stable Growth Fund
STATEMENT OF CHANGES IN NET ASSETS
The accompanying notes form an integral part of these financial statements.
18
Period fromDecember 24, 2013
(launch date)to March 31, 2014
USD
NET ASSETS AT THE BEGINNING OF THE PERIOD -
NET INVESTMENT INCOME/(LOSS) 41,375.58
Net realized gain/(loss) on investments (note 2) (83,482.75)
Net realized gain/(loss) on forward foreign exchange contracts (note 2) (48,756.18)
(132,238.93)
Change in net unrealized appreciation/(depreciation):
- on investments (note 2) 528,295.05
- on foreign exchange translation of other assets and liabilities (note 2) 273.91
528,568.96
Subscriptions 22,591,776.86
Redemptions (5,870,919.24)
16,720,857.62
NET ASSETS AT THE END OF THE PERIOD 17,158,563.23
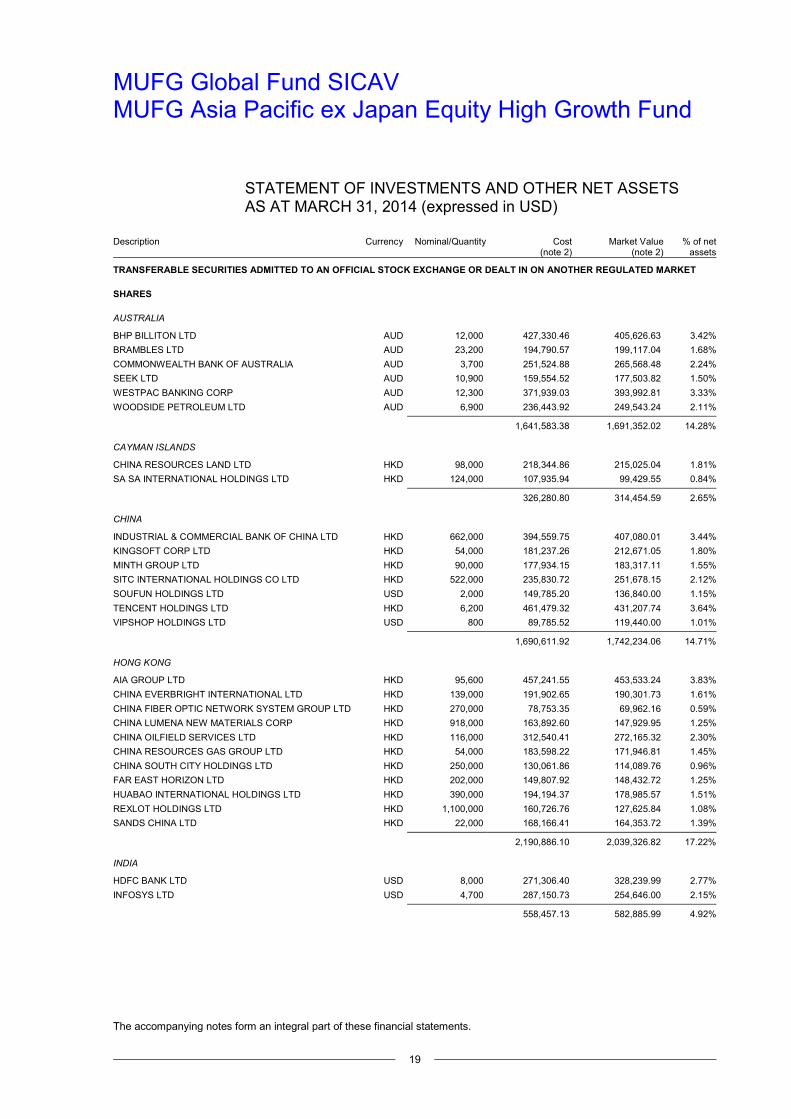
MUFG Global Fund SICAV MUFG Asia Pacific ex Japan Equity High Growth Fund
STATEMENT OF INVESTMENTS AND OTHER NET ASSETS AS AT MARCH 31, 2014 (expressed in USD)
The accompanying notes form an integral part of these financial statements.
19
Description Currency Nominal/Quantity Cost (note 2)
Market Value (note 2)
% of netassets
TRANSFERABLE SECURITIES ADMITTED TO AN OFFICIAL STOCK EXCHANGE OR DEALT IN ON ANOTHER REGULATED MARKET
SHARES
AUSTRALIA
BHP BILLITON LTD AUD 12,000 427,330.46 405,626.63 3.42%
BRAMBLES LTD AUD 23,200 194,790.57 199,117.04 1.68%
COMMONWEALTH BANK OF AUSTRALIA AUD 3,700 251,524.88 265,568.48 2.24%
SEEK LTD AUD 10,900 159,554.52 177,503.82 1.50%
WESTPAC BANKING CORP AUD 12,300 371,939.03 393,992.81 3.33%
WOODSIDE PETROLEUM LTD AUD 6,900 236,443.92 249,543.24 2.11%
1,641,583.38 1,691,352.02 14.28%
CAYMAN ISLANDS
CHINA RESOURCES LAND LTD HKD 98,000 218,344.86 215,025.04 1.81%
SA SA INTERNATIONAL HOLDINGS LTD HKD 124,000 107,935.94 99,429.55 0.84%
326,280.80 314,454.59 2.65%
CHINA
INDUSTRIAL & COMMERCIAL BANK OF CHINA LTD HKD 662,000 394,559.75 407,080.01 3.44%
KINGSOFT CORP LTD HKD 54,000 181,237.26 212,671.05 1.80%
MINTH GROUP LTD HKD 90,000 177,934.15 183,317.11 1.55%
SITC INTERNATIONAL HOLDINGS CO LTD HKD 522,000 235,830.72 251,678.15 2.12%
SOUFUN HOLDINGS LTD USD 2,000 149,785.20 136,840.00 1.15%
TENCENT HOLDINGS LTD HKD 6,200 461,479.32 431,207.74 3.64%
VIPSHOP HOLDINGS LTD USD 800 89,785.52 119,440.00 1.01%
1,690,611.92 1,742,234.06 14.71%
HONG KONG
AIA GROUP LTD HKD 95,600 457,241.55 453,533.24 3.83%
CHINA EVERBRIGHT INTERNATIONAL LTD HKD 139,000 191,902.65 190,301.73 1.61%
CHINA FIBER OPTIC NETWORK SYSTEM GROUP LTD HKD 270,000 78,753.35 69,962.16 0.59%
CHINA LUMENA NEW MATERIALS CORP HKD 918,000 163,892.60 147,929.95 1.25%
CHINA OILFIELD SERVICES LTD HKD 116,000 312,540.41 272,165.32 2.30%
CHINA RESOURCES GAS GROUP LTD HKD 54,000 183,598.22 171,946.81 1.45%
CHINA SOUTH CITY HOLDINGS LTD HKD 250,000 130,061.86 114,089.76 0.96%
FAR EAST HORIZON LTD HKD 202,000 149,807.92 148,432.72 1.25%
HUABAO INTERNATIONAL HOLDINGS LTD HKD 390,000 194,194.37 178,985.57 1.51%
REXLOT HOLDINGS LTD HKD 1,100,000 160,726.76 127,625.84 1.08%
SANDS CHINA LTD HKD 22,000 168,166.41 164,353.72 1.39%
2,190,886.10 2,039,326.82 17.22%
INDIA
HDFC BANK LTD USD 8,000 271,306.40 328,239.99 2.77%
INFOSYS LTD USD 4,700 287,150.73 254,646.00 2.15%
558,457.13 582,885.99 4.92%
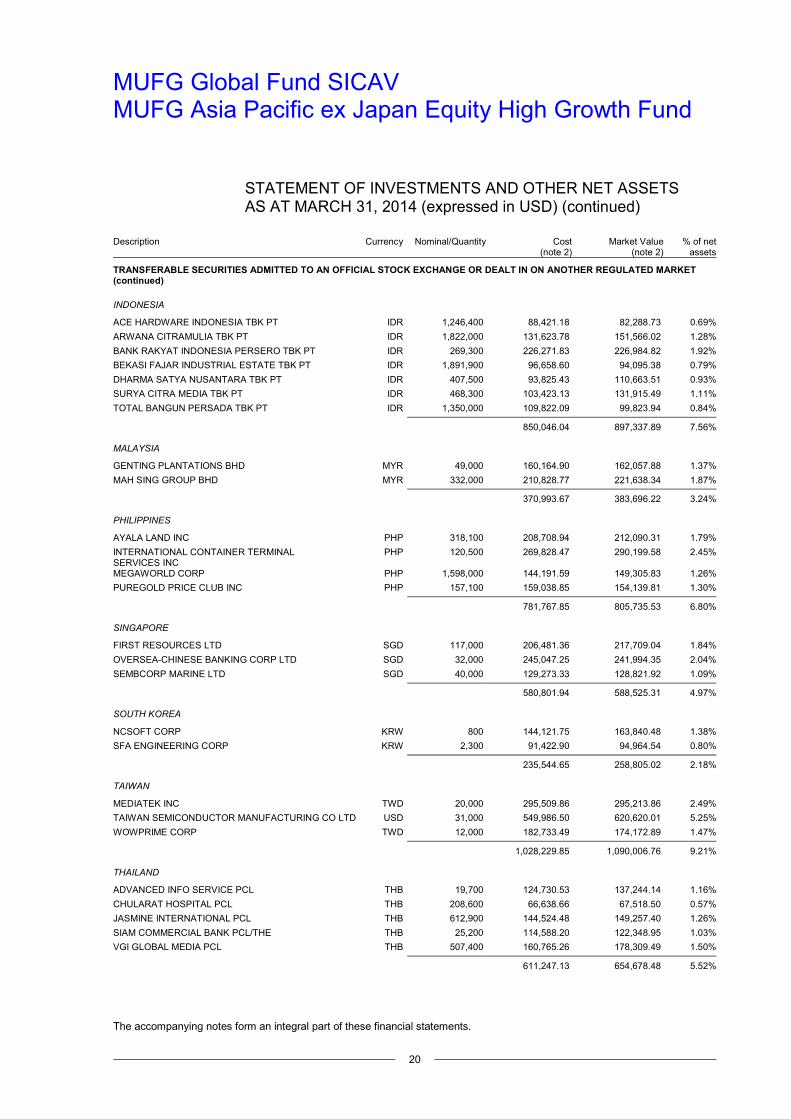
MUFG Global Fund SICAV MUFG Asia Pacific ex Japan Equity High Growth Fund
STATEMENT OF INVESTMENTS AND OTHER NET ASSETS AS AT MARCH 31, 2014 (expressed in USD) (continued)
The accompanying notes form an integral part of these financial statements.
20
Description Currency Nominal/Quantity Cost (note 2)
Market Value (note 2)
% of netassets
TRANSFERABLE SECURITIES ADMITTED TO AN OFFICIAL STOCK EXCHANGE OR DEALT IN ON ANOTHER REGULATED MARKET (continued)
INDONESIA
ACE HARDWARE INDONESIA TBK PT IDR 1,246,400 88,421.18 82,288.73 0.69%
ARWANA CITRAMULIA TBK PT IDR 1,822,000 131,623.78 151,566.02 1.28%
BANK RAKYAT INDONESIA PERSERO TBK PT IDR 269,300 226,271.83 226,984.82 1.92%
BEKASI FAJAR INDUSTRIAL ESTATE TBK PT IDR 1,891,900 96,658.60 94,095.38 0.79%
DHARMA SATYA NUSANTARA TBK PT IDR 407,500 93,825.43 110,663.51 0.93%
SURYA CITRA MEDIA TBK PT IDR 468,300 103,423.13 131,915.49 1.11%
TOTAL BANGUN PERSADA TBK PT IDR 1,350,000 109,822.09 99,823.94 0.84%
850,046.04 897,337.89 7.56%
MALAYSIA
GENTING PLANTATIONS BHD MYR 49,000 160,164.90 162,057.88 1.37%
MAH SING GROUP BHD MYR 332,000 210,828.77 221,638.34 1.87%
370,993.67 383,696.22 3.24%
PHILIPPINES
AYALA LAND INC PHP 318,100 208,708.94 212,090.31 1.79%
INTERNATIONAL CONTAINER TERMINAL SERVICES INC
PHP 120,500 269,828.47 290,199.58 2.45%
MEGAWORLD CORP PHP 1,598,000 144,191.59 149,305.83 1.26%
PUREGOLD PRICE CLUB INC PHP 157,100 159,038.85 154,139.81 1.30%
781,767.85 805,735.53 6.80%
SINGAPORE
FIRST RESOURCES LTD SGD 117,000 206,481.36 217,709.04 1.84%
OVERSEA-CHINESE BANKING CORP LTD SGD 32,000 245,047.25 241,994.35 2.04%
SEMBCORP MARINE LTD SGD 40,000 129,273.33 128,821.92 1.09%
580,801.94 588,525.31 4.97%
SOUTH KOREA
NCSOFT CORP KRW 800 144,121.75 163,840.48 1.38%
SFA ENGINEERING CORP KRW 2,300 91,422.90 94,964.54 0.80%
235,544.65 258,805.02 2.18%
TAIWAN
MEDIATEK INC TWD 20,000 295,509.86 295,213.86 2.49%
TAIWAN SEMICONDUCTOR MANUFACTURING CO LTD USD 31,000 549,986.50 620,620.01 5.25%
WOWPRIME CORP TWD 12,000 182,733.49 174,172.89 1.47%
1,028,229.85 1,090,006.76 9.21%
THAILAND
ADVANCED INFO SERVICE PCL THB 19,700 124,730.53 137,244.14 1.16%
CHULARAT HOSPITAL PCL THB 208,600 66,638.66 67,518.50 0.57%
JASMINE INTERNATIONAL PCL THB 612,900 144,524.48 149,257.40 1.26%
SIAM COMMERCIAL BANK PCL/THE THB 25,200 114,588.20 122,348.95 1.03%
VGI GLOBAL MEDIA PCL THB 507,400 160,765.26 178,309.49 1.50%
611,247.13 654,678.48 5.52%

MUFG Global Fund SICAV MUFG Asia Pacific ex Japan Equity High Growth Fund
STATEMENT OF INVESTMENTS AND OTHER NET ASSETS AS AT MARCH 31, 2014 (expressed in USD) (continued)
The accompanying notes form an integral part of these financial statements.
21
Description Currency Nominal/Quantity Cost (note 2)
Market Value (note 2)
% of netassets
TRANSFERABLE SECURITIES ADMITTED TO AN OFFICIAL STOCK EXCHANGE OR DEALT IN ON ANOTHER REGULATED MARKET (continued)
UNITED STATES OF AMERICA
ACCESS BIO INC KRW 20,300 202,156.66 204,058.43 1.72%
202,156.66 204,058.43 1.72%
TOTAL INVESTMENTS IN SECURITIES 11,068,607.12 11,253,097.12 94.98%
CASH AT BANKS 586,522.47 4.95%
OTHER NET ASSETS/(LIABILITIES) 8,238.78 0.07%
TOTAL NET ASSETS
11,847,858.37 100.00%
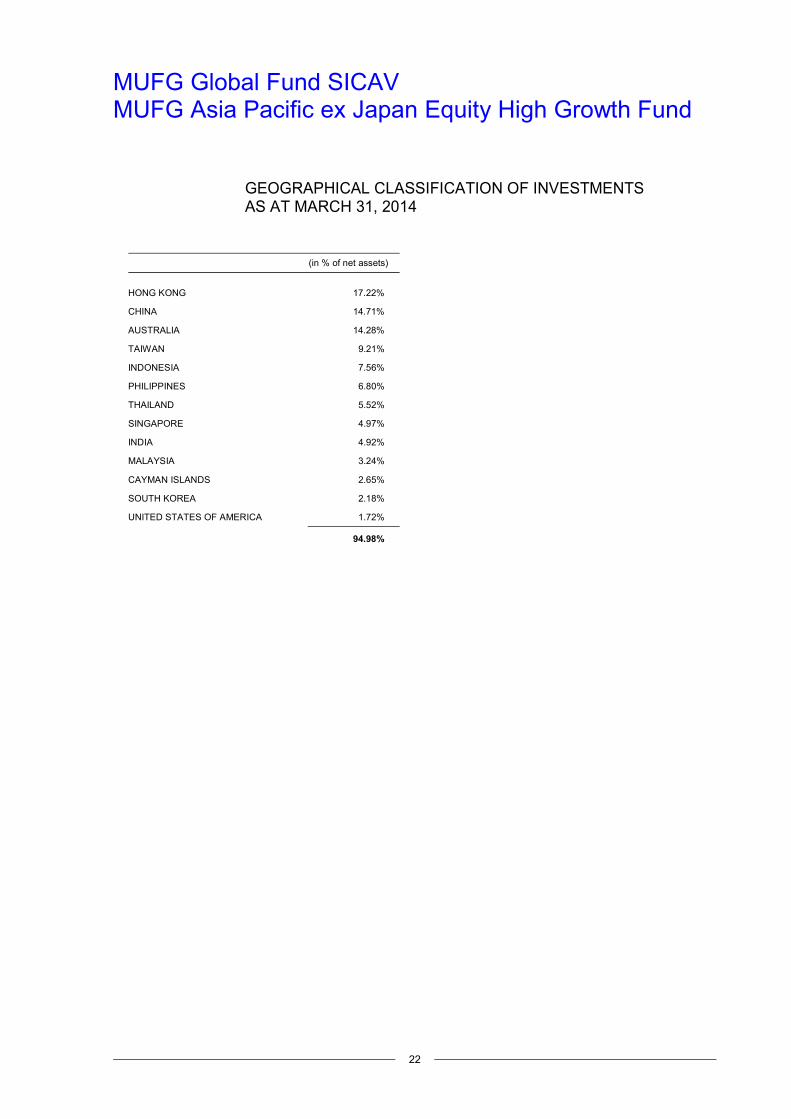
MUFG Global Fund SICAV MUFG Asia Pacific ex Japan Equity High Growth Fund
GEOGRAPHICAL CLASSIFICATION OF INVESTMENTS AS AT MARCH 31, 2014
22
(in % of net assets)
HONG KONG 17.22%
CHINA 14.71%
AUSTRALIA 14.28%
TAIWAN 9.21%
INDONESIA 7.56%
PHILIPPINES 6.80%
THAILAND 5.52%
SINGAPORE 4.97%
INDIA 4.92%
MALAYSIA 3.24%
CAYMAN ISLANDS 2.65%
SOUTH KOREA 2.18%
UNITED STATES OF AMERICA 1.72%
94.98%
MUFG Global Fund SICAV MUFG Asia Pacific ex Japan Equity Income Growth Fund
STATEMENT OF INVESTMENTS AND OTHER NET ASSETS AS AT MARCH 31, 2014 (expressed in USD)
The accompanying notes form an integral part of these financial statements.
23
Description Currency Nominal/Quantity Cost (note 2)
Market Value (note 2)
% of netassets
TRANSFERABLE SECURITIES ADMITTED TO AN OFFICIAL STOCK EXCHANGE OR DEALT IN ON ANOTHER REGULATED MARKET
SHARES
AUSTRALIA
AMCOR LTD AUD 13,800 132,866.09 132,893.61 2.30%
APA GROUP AUD 14,200 83,216.59 84,626.97 1.46%
ASX LTD AUD 3,800 128,842.44 127,039.62 2.20%
BHP BILLITON LTD AUD 7,000 249,276.11 236,615.54 4.09%
FLIGHT CENTRE TRAVEL GROUP LTD AUD 2,400 106,717.90 116,760.86 2.02%
INSURANCE AUSTRALIA GROUP LTD AUD 21,500 109,708.27 110,994.92 1.92%
INVOCARE LTD AUD 10,300 105,216.29 103,293.73 1.79%
SONIC HEALTHCARE LTD AUD 9,600 151,731.64 153,664.32 2.66%
TRANSURBAN GROUP AUD 12,900 81,853.06 86,803.21 1.50%
WESTPAC BANKING CORP AUD 8,700 263,078.83 278,677.84 4.81%
WOOLWORTHS LTD AUD 5,400 177,943.50 178,778.24 3.08%
1,590,450.72 1,610,148.86 27.83%
CHINA
INDUSTRIAL & COMMERCIAL BANK OF CHINA LTD HKD 298,000 177,611.56 183,247.50 3.16%
XUEDA EDUCATION GROUP USD 8,100 52,545.51 43,740.00 0.76%
230,157.07 226,987.50 3.92%
HONG KONG
BOC HONG KONG HOLDINGS LTD HKD 26,000 80,333.23 74,074.55 1.28%
CHINA COMMUNICATIONS SERVICES CORP LTD HKD 128,000 66,606.60 59,239.01 1.03%
CHINA OVERSEAS LAND & INVESTMENT LTD HKD 28,000 72,739.49 72,553.35 1.26%
CHINA PETROLEUM & CHEMICAL CORP HKD 136,000 112,187.38 121,675.12 2.11%
CHINA SOUTH CITY HOLDINGS LTD HKD 146,000 75,956.19 66,628.42 1.15%
DAIRY FARM INTERNATIONAL HOLDINGS LTD USD 8,100 74,661.58 78,894.00 1.37%
HUABAO INTERNATIONAL HOLDINGS LTD HKD 181,000 90,126.10 83,067.66 1.44%
JARDINE MATHESON HOLDINGS LTD USD 1,600 90,255.00 100,928.00 1.75%
SHANGHAI INDUSTRIAL HOLDINGS LTD HKD 22,000 74,802.13 73,313.95 1.27%
SJM HOLDINGS LTD HKD 37,000 114,243.43 103,982.83 1.80%
851,911.13 834,356.89 14.46%
INDIA
INFOSYS LTD USD 2,000 122,191.80 108,360.00 1.88%
122,191.80 108,360.00 1.88%
INDONESIA
BANK RAKYAT INDONESIA PERSERO TBK PT IDR 95,700 80,409.26 80,662.63 1.40%
MALINDO FEEDMILL TBK PT IDR 167,800 51,742.89 48,375.44 0.84%
SURYA CITRA MEDIA TBK PT IDR 309,900 68,440.80 87,295.77 1.51%
TOTAL BANGUN PERSADA TBK PT IDR 646,000 52,551.91 47,767.61 0.83%
UNILEVER INDONESIA TBK PT IDR 36,800 90,055.75 94,753.52 1.64%
343,200.61 358,854.97 6.22%
MUFG Global Fund SICAV MUFG Asia Pacific ex Japan Equity Income Growth Fund
STATEMENT OF INVESTMENTS AND OTHER NET ASSETS AS AT MARCH 31, 2014 (expressed in USD) (continued)
The accompanying notes form an integral part of these financial statements.
24
Description Currency Nominal/Quantity Cost (note 2)
Market Value (note 2)
% of netassets
TRANSFERABLE SECURITIES ADMITTED TO AN OFFICIAL STOCK EXCHANGE OR DEALT IN ON ANOTHER REGULATED MARKET (continued)
MALAYSIA
AXIATA GROUP BHD MYR 42,500 85,019.46 86,809.06 1.50%
KOSSAN RUBBER INDUSTRIES MYR 61,500 85,847.71 80,229.67 1.39%
MALAYAN BANKING BHD MYR 46,700 139,090.32 138,433.93 2.40%
MEDIA PRIMA BHD MYR 102,400 78,195.24 74,005.21 1.28%
388,152.73 379,477.87 6.57%
NEW ZEALAND
AUCKLAND INTL AIRPORT LTD NZD 34,000 105,864.51 112,408.33 1.95%
FLETCHER BUILDING LTD NZD 10,500 85,585.32 86,740.29 1.50%
191,449.83 199,148.62 3.45%
SINGAPORE
FIRST RESOURCES LTD SGD 59,000 104,123.08 109,784.90 1.90%
KEPPEL CORP LTD SGD 15,000 124,332.13 129,895.43 2.25%
OVERSEA-CHINESE BANKING CORP LTD SGD 12,000 91,892.72 90,747.88 1.57%
OVERSEAS EDUCATION LTD SGD 51,000 33,469.55 34,471.79 0.60%
SINGAPORE TECHNOLOGIES ENGINEERING LTD SGD 45,000 135,301.05 136,694.37 2.37%
SINGAPORE TELECOMMUNICATIONS LTD SGD 44,000 126,513.64 127,708.64 2.21%
615,632.17 629,303.01 10.90%
TAIWAN
ADVANTECH CO LTD TWD 17,000 106,725.32 110,253.67 1.91%
CHICONY ELECTRONICS CO LTD TWD 37,000 96,030.84 95,985.55 1.66%
LITE-ON TECHNOLOGY CORP TWD 77,000 111,939.76 114,795.17 1.99%
MAKALOT INDUSTRIAL CO LTD TWD 12,000 66,140.16 66,595.52 1.15%
ST SHINE OPTICAL CO LTD TWD 3,000 82,340.11 66,891.06 1.16%
STANDARD FOODS CORP TWD 42,000 122,265.81 114,473.36 1.98%
TAIWAN CEMENT CORP TWD 55,000 86,831.76 84,886.30 1.47%
TAIWAN SEMICONDUCTOR MANUFACTURING CO LTD USD 7,600 134,835.40 152,152.00 2.63%
TECO ELECTRIC AND MACHINERY CO LTD TWD 104,000 116,543.77 115,944.50 2.01%
YUNGTAY ENGINEERING CO LTD TWD 20,000 57,710.88 57,400.87 0.99%
981,363.81 979,378.00 16.95%
THAILAND
PTT EXPLORATION & PRODUCTION PCL THB 19,400 90,886.28 93,890.26 1.63%
90,886.28 93,890.26 1.63%
TOTAL INVESTMENTS IN SECURITIES 5,405,396.15 5,419,905.98 93.81%
CASH AT BANKS 272,269.53 4.71%
OTHER NET ASSETS/(LIABILITIES) 85,194.77 1.48%
TOTAL NET ASSETS
5,777,370.28 100.00%
MUFG Global Fund SICAV MUFG Asia Pacific ex Japan Equity Income Growth Fund
GEOGRAPHICAL CLASSIFICATION OF INVESTMENTS AS AT MARCH 31, 2014
25
(in % of net assets)
AUSTRALIA 27.83%
TAIWAN 16.95%
HONG KONG 14.46%
SINGAPORE 10.90%
MALAYSIA 6.57%
INDONESIA 6.22%
CHINA 3.92%
NEW ZEALAND 3.45%
INDIA 1.88%
THAILAND 1.63%
93.81%
MUFG Global Fund SICAV MUFG Asia Pacific ex Japan Equity Stable Growth Fund
STATEMENT OF INVESTMENTS AND OTHER NET ASSETS AS AT MARCH 31, 2014 (expressed in USD)
The accompanying notes form an integral part of these financial statements.
26
Description Currency Nominal/Quantity Cost (note 2)
Market Value (note 2)
% of netassets
TRANSFERABLE SECURITIES ADMITTED TO AN OFFICIAL STOCK EXCHANGE OR DEALT IN ON ANOTHER REGULATED MARKET
SHARES
AUSTRALIA
AMCOR LTD AUD 47,700 456,856.99 459,349.64 2.68%
ARB CORP LTD AUD 15,500 163,705.29 172,968.75 1.01%
BHP BILLITON LTD AUD 8,700 303,490.45 294,079.31 1.71%
COMMONWEALTH BANK OF AUSTRALIA AUD 7,600 517,009.33 545,492.01 3.18%
INVOCARE LTD AUD 25,400 256,949.26 254,724.33 1.48%
RAMSAY HEALTH CARE LTD AUD 8,700 345,395.68 388,100.83 2.26%
SLATER & GORDON LTD AUD 40,000 166,347.85 169,428.18 0.99%
SONIC HEALTHCARE LTD AUD 16,300 253,273.95 260,909.20 1.52%
TELSTRA CORP LTD AUD 102,200 472,767.81 481,198.28 2.80%
WESTPAC BANKING CORP AUD 13,500 399,316.19 432,431.14 2.52%
3,335,112.80 3,458,681.67 20.15%
CAYMAN ISLANDS
AJISEN CHINA HOLDINGS LTD HKD 183,000 199,438.36 165,140.10 0.96%
HAITIAN INTERNATIONAL HOLDINGS LTD HKD 175,000 389,839.97 351,035.51 2.05%
589,278.33 516,175.61 3.01%
CHINA
ENN ENERGY HOLDINGS LTD HKD 58,000 400,419.17 404,135.59 2.36%
GREAT WALL MOTOR CO LTD HKD 48,000 226,666.72 240,710.06 1.40%
INDUSTRIAL & COMMERCIAL BANK OF CHINA LTD HKD 554,000 332,734.17 340,668.17 1.99%
SUN ART RETAIL GROUP LTD HKD 80,000 101,841.56 100,553.69 0.59%
TAL EDUCATION GROUP USD 5,900 146,888.81 132,868.00 0.77%
TENCENT HOLDINGS LTD HKD 8,600 611,734.52 598,126.87 3.49%
XINHUA WINSHARE PUBLISHING AND MEDIA CO LTD HKD 283,000 160,952.16 161,254.60 0.94%
XUEDA EDUCATION GROUP USD 26,000 170,665.45 140,400.00 0.82%
2,151,902.56 2,118,716.98 12.36%
HONG KONG
AIA GROUP LTD HKD 135,000 646,920.57 640,449.66 3.72%
CHINA COMMUNICATIONS SERVICES CORP LTD HKD 158,000 85,455.36 73,123.16 0.43%
CHINA OVERSEAS LAND & INVESTMENT LTD HKD 150,000 393,090.54 388,678.69 2.27%
DAIRY FARM INTERNATIONAL HOLDINGS LTD USD 30,600 283,533.50 298,044.00 1.74%
GUANGDONG INVESTMENT LTD HKD 228,000 226,918.51 217,799.29 1.27%
HENGAN INTERNATIONAL GROUP CO LTD HKD 17,500 187,251.37 181,270.59 1.06%
JARDINE MATHESON HOLDINGS LTD USD 5,600 310,639.61 353,248.00 2.06%
LENOVO GROUP LTD HKD 140,000 153,714.28 154,672.20 0.90%
MTR CORP LTD HKD 84,500 304,629.08 312,638.18 1.82%
2,592,152.82 2,619,923.77 15.27%
INDIA
HDFC BANK LTD USD 9,900 336,025.17 406,196.99 2.37%
INFOSYS LTD USD 6,500 389,326.12 352,170.00 2.05%
725,351.29 758,366.99 4.42%

MUFG Global Fund SICAV MUFG Asia Pacific ex Japan Equity Stable Growth Fund
STATEMENT OF INVESTMENTS AND OTHER NET ASSETS AS AT MARCH 31, 2014 (expressed in USD) (continued)
The accompanying notes form an integral part of these financial statements.
27
Description Currency Nominal/Quantity Cost (note 2)
Market Value (note 2)
% of netassets
TRANSFERABLE SECURITIES ADMITTED TO AN OFFICIAL STOCK EXCHANGE OR DEALT IN ON ANOTHER REGULATED MARKET (continued)
INDONESIA
MALINDO FEEDMILL TBK PT IDR 579,300 172,618.26 167,007.70 0.97%
MATAHARI PUTRA PRIMA TBK PT IDR 892,700 159,533.72 210,994.67 1.23%
TIGA PILAR SEJAHTERA FOOD TBK IDR 2,052,800 323,460.19 372,250.70 2.17%
UNILEVER INDONESIA TBK PT IDR 112,300 268,983.72 289,152.73 1.69%
924,595.89 1,039,405.80 6.06%
MALAYSIA
GENTING MALAYSIA BHD MYR 136,800 180,429.27 175,948.55 1.03%
HARTALEGA HOLDINGS BHD MYR 145,500 312,611.31 305,213.60 1.78%
MALAYAN BANKING BHD MYR 145,400 434,640.08 431,012.71 2.51%
UMW HOLDINGS BHD MYR 46,300 168,777.27 155,680.29 0.91%
1,096,457.93 1,067,855.15 6.23%
PHILIPPINES
JOLLIBEE FOODS CORP PHP 87,500 321,646.04 333,649.24 1.94%
321,646.04 333,649.24 1.94%
SINGAPORE
OVERSEAS EDUCATION LTD SGD 124,000 82,816.94 83,813.76 0.49%
SEMBCORP INDUSTRIES LTD SGD 73,000 312,590.39 318,691.11 1.86%
SILVERLAKE AXIS LTD SGD 245,000 168,862.88 170,470.36 0.99%
SINGAPORE TECHNOLOGIES ENGINEERING LTD SGD 130,000 393,047.34 394,894.84 2.30%
957,317.55 967,870.07 5.64%
SOUTH KOREA
HALLA VISTEON CLIMATE CONTROL CORP KRW 5,700 205,179.61 260,247.08 1.52%
HANSSEM CO LTD KRW 5,000 269,067.37 328,808.30 1.92%
I-SENS INC KRW 6,110 276,490.87 304,222.84 1.77%
750,737.85 893,278.22 5.21%
TAIWAN
GINKO INTERNATIONAL CO LTD TWD 4,000 76,118.27 68,959.86 0.40%
MAKALOT INDUSTRIAL CO LTD TWD 58,000 320,918.78 321,878.34 1.88%
TAIWAN SEMICONDUCTOR MANUFACTURING CO LTD USD 42,900 764,415.03 858,858.02 5.00%
TONG HSING ELECTRONIC INDUSTRIES LTD TWD 76,000 387,901.48 393,071.18 2.29%
1,549,353.56 1,642,767.40 9.57%
THAILAND
AIRPORTS OF THAILAND PCL THB 13,800 75,367.10 82,527.74 0.48%
BUMRUNGRAD HOSPITAL PCL THB 65,900 175,814.95 195,526.36 1.14%
CP ALL PCL THB 156,500 187,617.95 209,856.66 1.22%
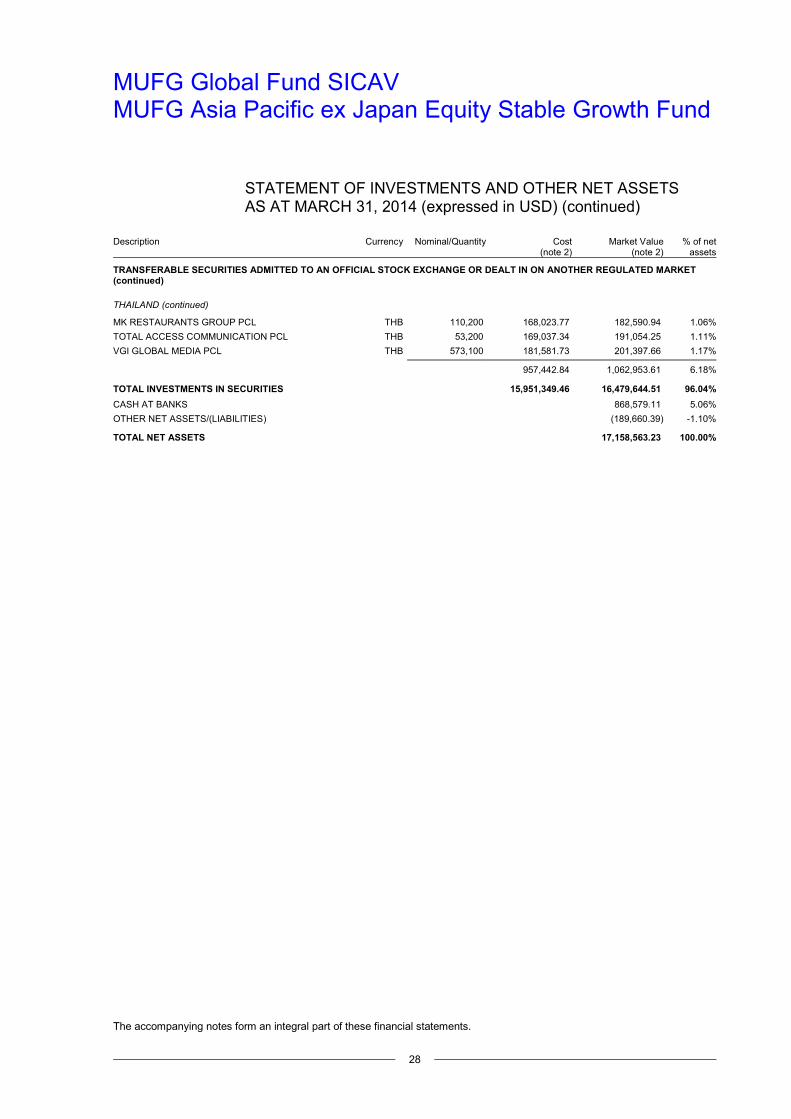
MUFG Global Fund SICAV MUFG Asia Pacific ex Japan Equity Stable Growth Fund
STATEMENT OF INVESTMENTS AND OTHER NET ASSETS AS AT MARCH 31, 2014 (expressed in USD) (continued)
The accompanying notes form an integral part of these financial statements.
28
Description Currency Nominal/Quantity Cost (note 2)
Market Value (note 2)
% of netassets
TRANSFERABLE SECURITIES ADMITTED TO AN OFFICIAL STOCK EXCHANGE OR DEALT IN ON ANOTHER REGULATED MARKET (continued)
THAILAND (continued)
MK RESTAURANTS GROUP PCL THB 110,200 168,023.77 182,590.94 1.06%
TOTAL ACCESS COMMUNICATION PCL THB 53,200 169,037.34 191,054.25 1.11%
VGI GLOBAL MEDIA PCL THB 573,100 181,581.73 201,397.66 1.17%
957,442.84 1,062,953.61 6.18%
TOTAL INVESTMENTS IN SECURITIES 15,951,349.46 16,479,644.51 96.04%
CASH AT BANKS 868,579.11 5.06%
OTHER NET ASSETS/(LIABILITIES) (189,660.39) -1.10%
TOTAL NET ASSETS
17,158,563.23 100.00%

MUFG Global Fund SICAV MUFG Asia Pacific ex Japan Equity Stable Growth Fund
GEOGRAPHICAL CLASSIFICATION OF INVESTMENTS AS AT MARCH 31, 2014
29
(in % of net assets)
AUSTRALIA 20.15%
HONG KONG 15.27%
CHINA 12.36%
TAIWAN 9.57%
MALAYSIA 6.23%
THAILAND 6.18%
INDONESIA 6.06%
SINGAPORE 5.64%
SOUTH KOREA 5.21%
INDIA 4.42%
CAYMAN ISLANDS 3.01%
PHILIPPINES 1.94%
96.04%
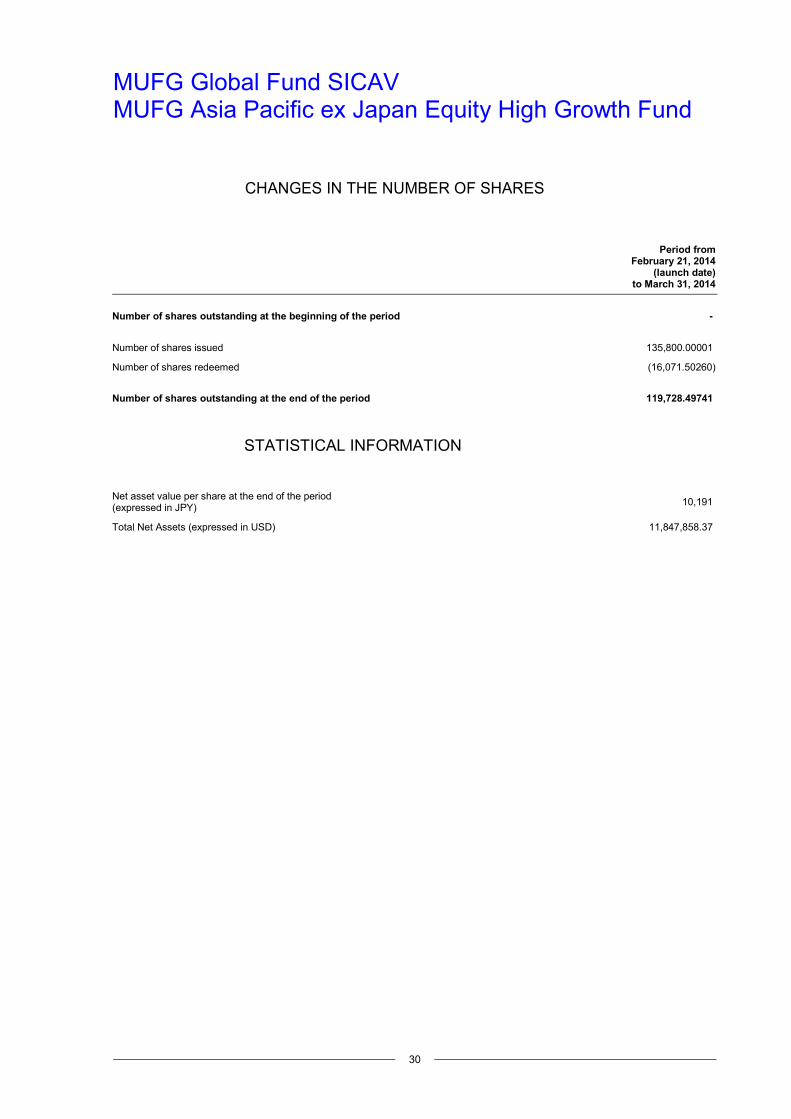
MUFG Global Fund SICAV MUFG Asia Pacific ex Japan Equity High Growth Fund
CHANGES IN THE NUMBER OF SHARES
30
Period fromFebruary 21, 2014
(launch date)to March 31, 2014
Number of shares outstanding at the beginning of the period -
Number of shares issued 135,800.00001
Number of shares redeemed (16,071.50260)
Number of shares outstanding at the end of the period 119,728.49741
STATISTICAL INFORMATION
Net asset value per share at the end of the period (expressed in JPY)
10,191
Total Net Assets (expressed in USD) 11,847,858.37

MUFG Global Fund SICAV MUFG Asia Pacific ex Japan Equity Income Growth Fund
CHANGES IN THE NUMBER OF SHARES
31
Period fromFebruary 21, 2014
(launch date)to March 31, 2014
Number of shares outstanding at the beginning of the period -
Number of shares issued 67,800.00001
Number of shares redeemed (9,026.65360)
Number of shares outstanding at the end of the period 58,773.34641
STATISTICAL INFORMATION
Net asset value per share at the end of the period (expressed in JPY)
10,123
Total Net Assets (expressed in USD) 5,777,370.28
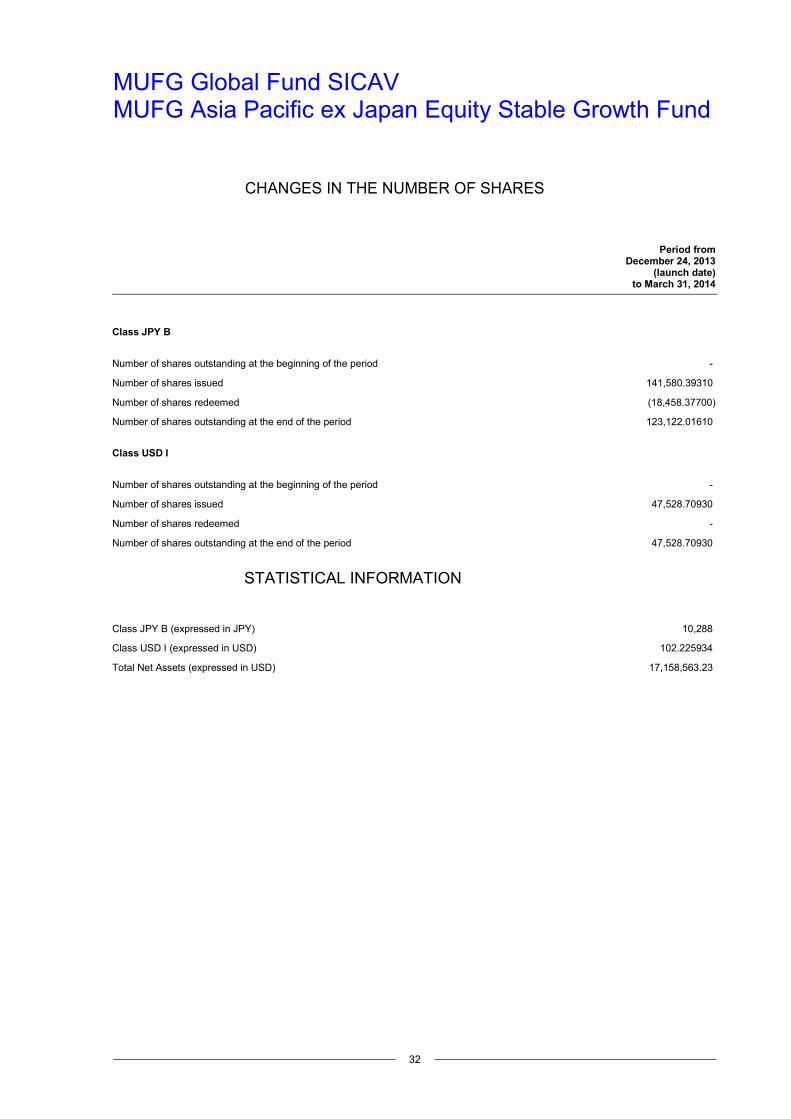
MUFG Global Fund SICAV MUFG Asia Pacific ex Japan Equity Stable Growth Fund
CHANGES IN THE NUMBER OF SHARES
32
Period fromDecember 24, 2013
(launch date)to March 31, 2014
Class JPY B
Number of shares outstanding at the beginning of the period -
Number of shares issued 141,580.39310
Number of shares redeemed (18,458.37700)
Number of shares outstanding at the end of the period 123,122.01610
Class USD I
Number of shares outstanding at the beginning of the period -
Number of shares issued 47,528.70930
Number of shares redeemed -
Number of shares outstanding at the end of the period 47,528.70930
STATISTICAL INFORMATION
Class JPY B (expressed in JPY) 10,288
Class USD I (expressed in USD) 102.225934
Total Net Assets (expressed in USD) 17,158,563.23

MUFG Global Fund SICAV
NOTES TO THE FINANCIAL STATEMENTS AS AT MARCH 31, 2014
33
NOTE 1 GENERAL
MUFG Global Fund SICAV (the “Fund”) is an open-ended investment fund and has been incorporated on November 20, 2013 under the Luxembourg law as a “société d’investissement à capital variable” for an unlimited period of time.
The Fund may offer a choice of several separate sub-funds investing in transferable securities and/or other liquid financial assets permitted by Part I of the law of December 17, 2010 as amended related to Undertakings for Collective Investments (in the following referred to as “Investment Fund Law”) transposing Directive 2009/65/EC of the European Parliament and of the Council of July 13, 2009 on the coordination of laws, regulations and administrative provisions relating to Undertakings for Collective Investments in Transferable Securities (the “UCITS”), as such has been and as such may be amended from time to time.
As at March 31, 2014, the following three sub-funds are being offered to investors:
- MUFG Asia Pacific ex Japan Equity High Growth Fund expressed in USD and launched on February 21, 2014;
- MUFG Asia Pacific ex Japan Equity Income Growth Fund, expressed in USD and launched on February 21, 2014;
- MUFG Asia Pacific ex Japan Equity Stable Growth Fund, expressed in USD and launched on December 24, 2013.
Class A and C shares are accessible to retail investors whereas Class B and I shares are only accessible to institutional investors and JPY Class B shares are only accessible to institutional investors who live in Japan. All share classes are accumulating share classes.
There is currently one share class (JPY B) issued for the MUFG Asia Pacific ex Japan Equity Income Growth Fund and the MUFG Asia Pacific ex Japan Equity High Growth Fund, and two share classes (JPY B and USD I) for the MUFG Asia Pacific ex Japan Equity Stable Growth Fund.
Investment objectives and policy:
The Fund’s investment objective is to provide investors with the opportunity of achieving long term capital growth through investment in assets within each of the sub-funds. The sub-fund’s assets are invested in conformity with each sub-fund’s investment objective and policy.
The sub-funds invest primarily in marketable equity securities of Asia and Pacific countries (ex Japan) and companies whose headquarters are not in Asia Pacific countries (ex Japan) that generate over half of their profits from Asia and Pacific countries (ex Japan), including equity-related securities such as ADRs and GDRs, exchange traded funds and stock index futures.
Secondarily, the sub-funds may invest in cash, cash equivalents and short-term fixed income securities. The sub-fund will invest less than 15% in interest-bearing securities on taxation of savings income in the form of interest payments.
NOTE 2 SUMMARY OF SIGNIFICANT ACCOUNTING POLICIES
Presentation of financial statements
The financial statements are prepared in accordance with Luxembourg legal and regulatory requirements relating to the preparation of the financial statements.
MUFG Global Fund SICAV
NOTES TO THE FINANCIAL STATEMENTS AS AT MARCH 31, 2014 (continued)
34
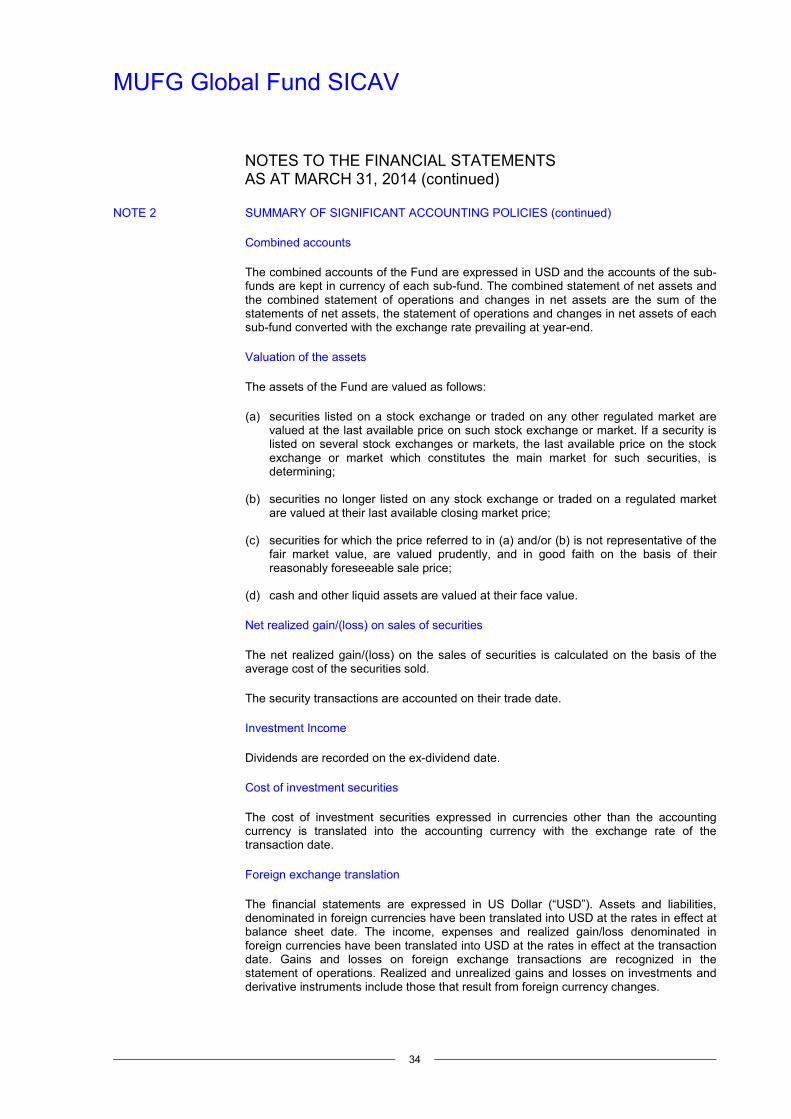
NOTE 2 SUMMARY OF SIGNIFICANT ACCOUNTING POLICIES (continued)
Combined accounts
The combined accounts of the Fund are expressed in USD and the accounts of the sub-funds are kept in currency of each sub-fund. The combined statement of net assets and the combined statement of operations and changes in net assets are the sum of the statements of net assets, the statement of operations and changes in net assets of each sub-fund converted with the exchange rate prevailing at year-end.
Valuation of the assets
The assets of the Fund are valued as follows:
(a) securities listed on a stock exchange or traded on any other regulated market are valued at the last available price on such stock exchange or market. If a security is listed on several stock exchanges or markets, the last available price on the stock exchange or market which constitutes the main market for such securities, is determining;
(b) securities no longer listed on any stock exchange or traded on a regulated market are valued at their last available closing market price;
(c) securities for which the price referred to in (a) and/or (b) is not representative of the
fair market value, are valued prudently, and in good faith on the basis of their reasonably foreseeable sale price;
(d) cash and other liquid assets are valued at their face value.
Net realized gain/(loss) on sales of securities
The net realized gain/(loss) on the sales of securities is calculated on the basis of the average cost of the securities sold.
The security transactions are accounted on their trade date.
Investment Income
Dividends are recorded on the ex-dividend date.
Cost of investment securities
The cost of investment securities expressed in currencies other than the accounting currency is translated into the accounting currency with the exchange rate of the transaction date.
Foreign exchange translation
The financial statements are expressed in US Dollar (“USD”). Assets and liabilities, denominated in foreign currencies have been translated into USD at the rates in effect at balance sheet date. The income, expenses and realized gain/loss denominated in foreign currencies have been translated into USD at the rates in effect at the transaction date. Gains and losses on foreign exchange transactions are recognized in the statement of operations. Realized and unrealized gains and losses on investments and derivative instruments include those that result from foreign currency changes.
MUFG Global Fund SICAV
NOTES TO THE FINANCIAL STATEMENTS AS AT MARCH 31, 2014 (continued)
35
NOTE 2 SUMMARY OF SIGNIFICANT ACCOUNTING POLICIES (continued)
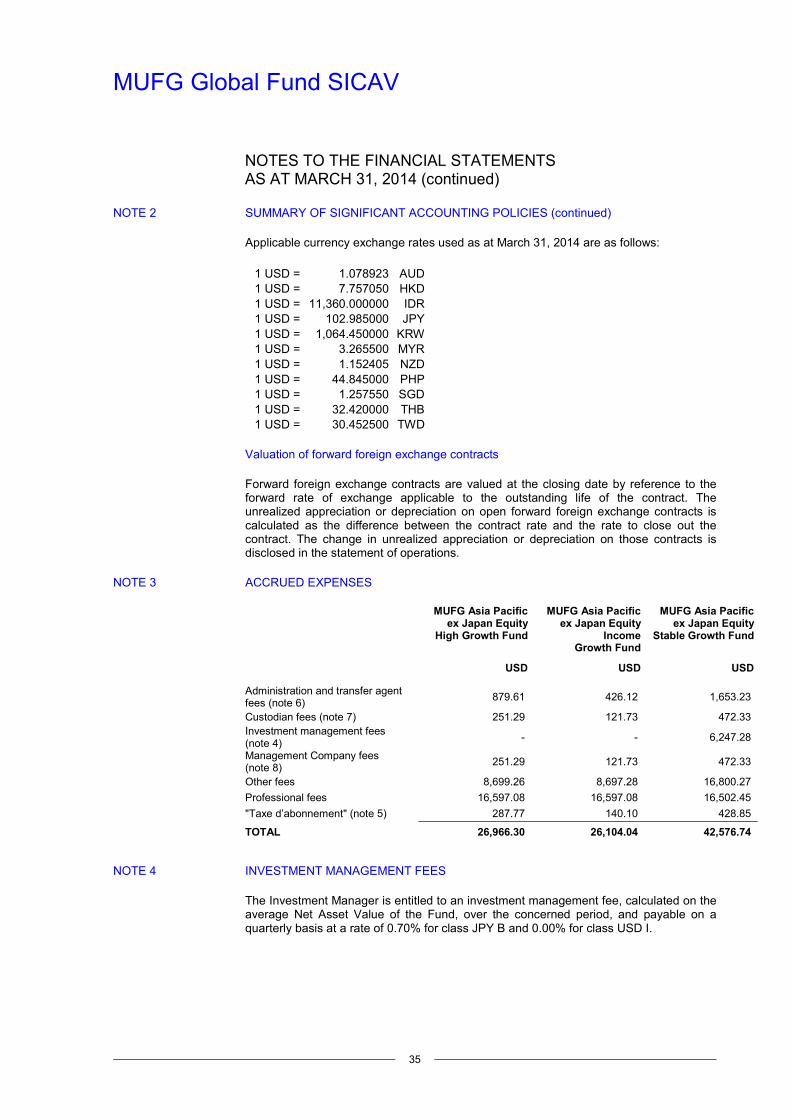
Applicable currency exchange rates used as at March 31, 2014 are as follows:
1 USD = 1.078923 AUD1 USD = 7.757050 HKD1 USD = 11,360.000000 IDR1 USD = 102.985000 JPY1 USD = 1,064.450000 KRW1 USD = 3.265500 MYR1 USD = 1.152405 NZD1 USD = 44.845000 PHP1 USD = 1.257550 SGD1 USD = 32.420000 THB1 USD = 30.452500 TWD
Valuation of forward foreign exchange contracts
Forward foreign exchange contracts are valued at the closing date by reference to the forward rate of exchange applicable to the outstanding life of the contract. The unrealized appreciation or depreciation on open forward foreign exchange contracts is calculated as the difference between the contract rate and the rate to close out the contract. The change in unrealized appreciation or depreciation on those contracts is disclosed in the statement of operations.
NOTE 3 ACCRUED EXPENSES
MUFG Asia Pacific ex Japan Equity
High Growth Fund
MUFG Asia Pacific ex Japan Equity
Income Growth Fund
MUFG Asia Pacific ex Japan Equity
Stable Growth Fund
USD USD USD
Administration and transfer agent fees (note 6)
879.61 426.12 1,653.23
Custodian fees (note 7) 251.29 121.73 472.33 Investment management fees (note 4)
- - 6,247.28
Management Company fees (note 8)
251.29 121.73 472.33
Other fees 8,699.26 8,697.28 16,800.27
Professional fees 16,597.08 16,597.08 16,502.45
"Taxe d’abonnement" (note 5) 287.77 140.10 428.85
TOTAL 26,966.30 26,104.04 42,576.74
NOTE 4 INVESTMENT MANAGEMENT FEES
The Investment Manager is entitled to an investment management fee, calculated on the average Net Asset Value of the Fund, over the concerned period, and payable on a quarterly basis at a rate of 0.70% for class JPY B and 0.00% for class USD I.
MUFG Global Fund SICAV
NOTES TO THE FINANCIAL STATEMENTS AS AT MARCH 31, 2014 (continued)
36
NOTE 5 “TAXE D’ABONNEMENT”
Under Luxembourg law, there are currently no Luxembourg taxes on income, withholding or capital gains by the Fund. The Fund is, however, subject to a “taxe d’abonnement” of 0.05% per year, calculated and payable quarterly, on the aggregate Net Asset Value of the outstanding shares of the Fund at the end of each quarter. This annual tax is however reduced to 0.01% on the aggregate Net Asset Value of the shares dedicated to institutional investors and for investments in money market instruments.
NOTE 6 ADMINISTRATION AND TRANSFER AGENT FEES
The fees to be paid to the Administrative and Transfer Agent are 0.07% (plus VAT when applicable) per annum of the average daily net asset value of the Fund during the relevant quarter.
NOTE 7 CUSTODIAN FEES
The fees to be paid to the Custodian are 0.02% (plus VAT when applicable) per annum of the average daily net asset value of the Fund during the relevant quarter.
NOTE 8 MANAGEMENT COMPANY FEES
The Management Company is entitled to a fee payable quarterly in arrears at an annual rate of 0.02% calculated on the basis of average daily net asset value of the Fund during the relevant quarter.
NOTE 9 NET ASSET VALUE CALCULATION / SUBSCRIPTION AND REPURCHASE
The Net Asset Value per share, the subscription and the redemption prices for shares of the Fund are determined on each Valuation Day. A “Valuation Day” is each day that is a bank business day where banks are open for business in Japan, Luxembourg, UK and the United States.
NOTE 10 TRANSACTION COSTS
The Fund incurred transaction costs (brokerage fees) in connection with the purchase and sale of transferable securities, money market instruments or other permissible assets. The transaction costs are included in the cost of investments and in the net realized gain/(loss) on investments.
MUFG Asia Pacific ex Japan Equity High Growth Fund USD 39,897.84
MUFG Asia Pacific ex Japan Equity Income Growth Fund USD 19,275.32
MUFG Asia Pacific ex Japan Equity Stable Growth Fund USD 48,971.14
NOTE 11 STATEMENT OF CHANGES IN PORTFOLIO
Upon request to be addressed to the registered office of the Fund, a copy of the statement of changes in portfolio for the period ended March 31, 2014 can be obtained free of charge.
NOTE 12 OTHER INCOME
Each share class has a set TER (Total Expense Ratio) cap rate excluding sub-custodian fee. The fees over the TER Cap rates are covered by Mitsubishi UFJ Trust and Banking Corporation, Japan and are booked against the “Other income” caption. The CAP TER rate are set respectively at 90bps and 20bps for the USD I and JPY B class of shares.

MUFG Global Fund SICAV
NOTES TO THE FINANCIAL STATEMENTS AS AT MARCH 31, 2014 (continued)
37
NOTE 13 SUBSEQUENT EVENTS
Mr. Jun KAWAKUBO has been appointed as Director of the Fund, with effect on May 2, 2014.
Mr. Hiroaki MATSUYAMA has resigned as Director of the Fund, with effect on April 28, 2014.