MTSS & The 4-Step Problem Solving...
64
MTSS & The 4-Step Problem Solving Process Judy Elliott, Ph.D. Former Chief Academic Officer Los Angeles Unified School District [email protected] Summit on School Climate and Culture August 8 th 2016
Transcript of MTSS & The 4-Step Problem Solving...

MTSS & The 4-Step Problem Solving
Process
Judy Elliott, Ph.D. Former Chief Academic Officer
Los Angeles Unified School District [email protected]
Summit on School Climate and Culture
August 8th 2016

Ø Explore the 4 - Step Problem Solving process as a critical backbone of MTSS

The single greatest determinant of learning is not socioeconomic factors or funding levels is instruction.
A bone-deep, institutional acknowledgement of this fact continues to elude us.
Schmoker, 2006

Critical Components of MTSS
Data Evalua)on
Problem Solving Process
Mul)ple Tiers of Instruc)on & Interven)on
Leadership
Capacity Building
Infrastructure
Communica)on & Collabora)on
MTSS is a framework to ensure successful educa5on outcomes for ALL students by using a data-‐based problem solving process to provide, and evaluate the effec5veness of mul5ple 5ers of integrated academic, behavior, and social-‐emo5onal instruc5on/interven5on supports matched to student need in alignment with educa5onal standards.

5
MTSS & the Problem-Solving Process Academic and Behavior Systems
Tier 3: Intensive, Individualized Interventions &
Supports. The most intense (increased time, narrowed focus, reduced group size) instruction and intervention based upon individual student need provided in
addition to and aligned with Tier 1 & 2 academic and behavior instruction and supports.
Tier 2: Targeted, Supplemental Interventions &
Supports. More targeted instruction/intervention and
supplemental support in addition to and aligned with the core academic and behavior curriculum.
Tier 1: Core, Universal Instruction & Supports. General academic and behavior instruction and support provided to all students in all settings.

Problem-Solving is the Engine That Drives Instruction and Intervention
It is the MOST
Critical Skill A Leader Can
Possess
K. Leithwood, 2007

Problem Solving Process: Levels of Implementation
Level of Implementa.on Problem Solving Team Example
Student Individual Teacher and/or Teacher Teams
Student is con)nually absent from class
Classroom Individual Teacher and/or Teacher Teams
A large number of students in one classroom failed the unit test
Grade/Department Level
Teacher Teams and/or Instruc)onal Leadership Team
A majority of students in grade 9 Algebra did not perform well on the mid-‐year assessment
School Level Instruc)onal Leadership Team
Low overall percentage of students mee)ng growth targets
District Level District Senior Leadership Team
Increase in expulsions across schools
7

Evaluate Did it work? • Response to Instruction & Intervention
Problem Analysis Why is the goal not being attained? • Validating Problem • Identify Variables that contribute to Problem • Hypotheses/Data Collection
Define the Problem. Identify the goal • What do we want students to know and be able to
do ?
Implement Plan What are we going to do about it? • Implement as Intended • Progress Monitor • Modify as Necessary
Problem Solving Process

Steps in the Problem-Solving Process 1. Define the Problem (What is the Goal?) • Determine the gap or difference
between the expectation and what is actually occurring in terms of student performance or behavior
2. Problem Analysis (Why is it occurring)? • Hypothesize possible root causes • Analyze supplemental data to
support or refute each hypothesis
• Validate whether your hypothesis is true based on the additional data
3. Implement Plan (What can be done to solve it?) • Select the intervention(s) or strategies
that will address the problem • Develop and implement the plan with
fidelity
4. Evaluate (Did it work?) • Collect and use school-wide, small
group, and individual student data to determine if the plan is working to address the problem
• Progress monitor and modify, if necessary
• Evaluate the response: good, questionable, poor 9

Steps in the Problem-Solving Process
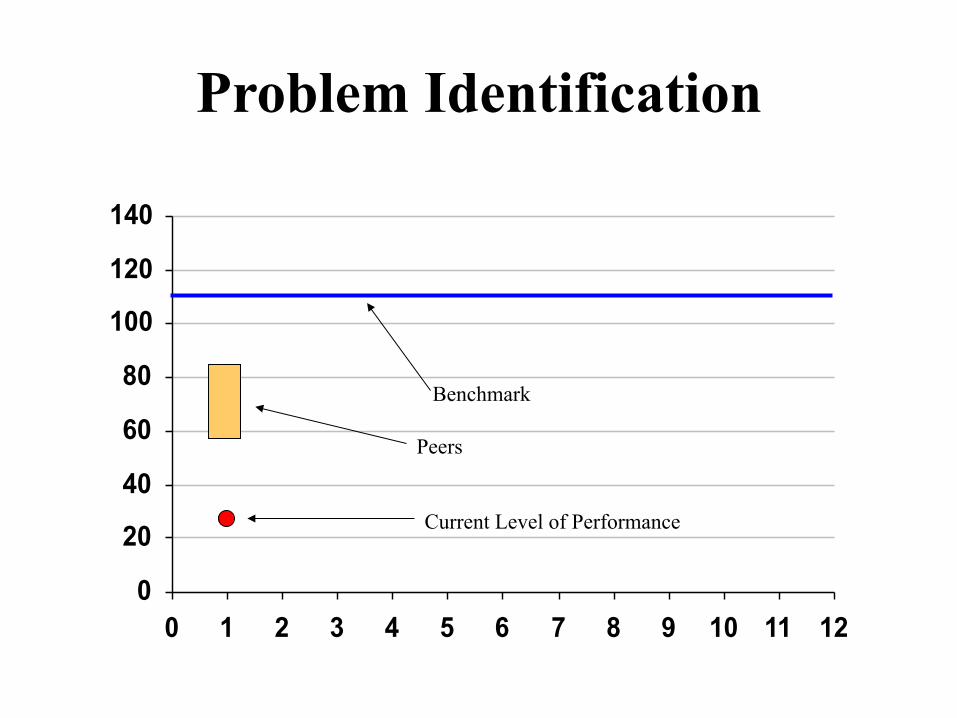
1. Goal Identification – Identify replacement behavior – Data- current level of performance – Data- benchmark level(s) – Data- peer performance – Data- GAP analysis
2. Analysis – Develop hypotheses (brainstorming) – Develop predictions/assessment

Problem Identification
0
20
40
60
80
100
120
140
0 1 2 3 4 5 6 7 8 9 10 11 12
Current Level of Performance
Benchmark
Peers
Problem Identification
0
20
40
60
80
100
120
140
0 1 2 3 4 5 6 7 8 9 10 11 12
Current Level of Performance
Benchmark
Peers

Problem Identification
0
20
40
60
80
100
120
140
0 1 2 3 4 5 6 7 8 9 10 11 12
Current Level of Performance
Benchmark
Peers

Step 2 Problem Analysis (Why is it occurring?)
- Develop root cause hypotheses - Using data validate or invalidate
hypotheses


Developing a Hypothesis involves… • Answering: Why isn’t the goal
being attained?
• Identifying possible root causes
• Analyzing and validating supplemental data to support or refute each hypothesis

Developing a Hypothesis
Developing informed statements about why the desired behavior(s) are not occurring.
Example:
The (desired behavior) is not occurring because…
39% of students are not passing Math I because…

Develop Hypothesis
I C E L
Instruction (strategies, pacing, etc.)
Curriculum
(order, materials, etc.) Environment
(schedule, group size, culture, etc.)
Learner

Testing Hypotheses using…
ICEL by RIOT Matrix


!
R" !eview! Review!of!historical!records!and!products!
"I" !nterview! Interviews!of!key!stakeholders!
O" !bserve! Observe!performance!in!real!time!functional!settings!
T" !est!
Test!through!careful!use!of!appropriately!matched!measurement!strategies/methods!
Test and Validate Hypotheses


Freshman office referrals are high because teachers are not directly teaching the skills on the school-wide behavior matrix.
Even though grade 9 scores on the ELA benchmark indicate some growth, students are not showing accelerated growth because classroom behaviors detract from consistent delivery of instruction.
The 10th grade benchmark scores are low because the pacing guides do not include all standard assessed for the benchmark.
Envi
ronm
ent
Inst
ruct
ion
Cur
ricul
um

Happy High School
67% 65% 67% 69%
89% 92%
0%
10%
20%
30%
40%
50%
60%
70%
80%
90%
100%
2010 2011 2012 2013 2014 2015 2016 2017 2018
School Gradua)on Trend and District Goals
School Gradua)on Rate
District Goal
Aimline
Linear (School Gradua)on Rate)

Happy High School
6th 7th 8th 9th 10th 11th Gradua)on
2010 Cohort 82% 76% 74% 52% 58% 64% 67% 2011 Cohort 84% 78% 79% 53% 57% 62% 65% 2012 Cohort 81% 72% 74% 50% 59% 67% 72% 2013 Cohort 84% 75% 76% 54% 56% 68% 72% 2014 Cohort 88% 78% 79% 56% 63% 69%
40%
50%
60%
70%
80%
90%
100%
Percent of Students On-‐Track by Gradua)on Cohort
2010 Cohort
2011 Cohort
2012 Cohort
2013 Cohort
2014 Cohort

Happy High School 9th Grade Data
Course Failures 39% (1 of more F’s)
61% (No F’s)
GPA 22% (Less than 2.0)
78% (2.0 or Greater)
A]endance 17%
(Less than 95%) 83%
(95% or Greater)

Happy High School Course Failure Rate
2009-‐2010 Failure Rate 2010-‐2011
Failure Rate 2011-‐2012
Failure Rate 2012-‐2013
Common Core Math I
45% 47% 37% 39%
Math Interven)on (Elec)ve)
27% 21% 23% 27%
English 9 14% 8% 12% 14%
World History 13% 9% 15% 13%

Problem Identification
39% of students become off-track in 9th grade due to course failures. The mathematics content area resulted in the greatest percent of course failures for 9th grade students.


+
39% of students become off-track in 9th grade due to course failures. The mathematics content area resulted in the greatest percent of course failures for 9th grade students.
The problem is occurring because _____________ .


+ Happy High School
39% of students become off-track in 9th grade due to course failures. The mathematics content area resulted in the greatest percent of course failures for 9th grade students.
Hypothesis
teacher and student
relationships do not
support or encourage participation or academic risks
excessive absenteeism during 1st period
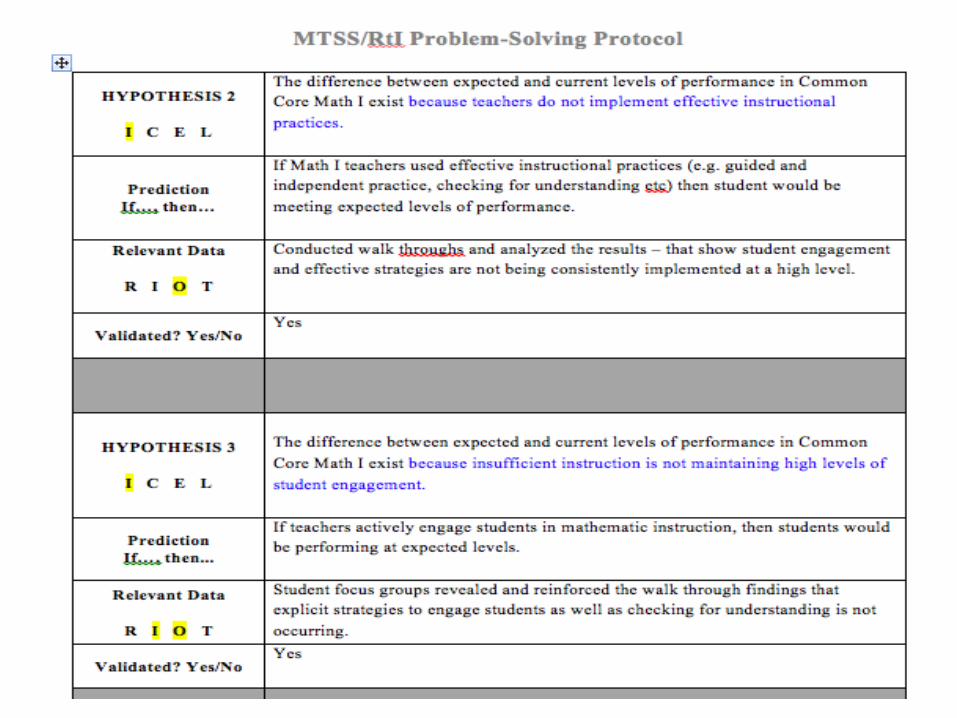
insufficient instruction is not maintaining high levels of student engagement
the grading policy is not
implemented consistently in all
classes
school-wide classroom behavior
expectations are not well defined and
taught
teachers do not implement high yield instructional
practices
The problem is occurring because _____________ .


+ Model: Happy High School OBSERVE: Conducted Walkthrough
0%
24%
13%
13%
6%
27%
0%
Instruc)on Component: Percent of Intervals Observed
Communicate Instruc)onal Purpose Explicit Instruc)on
Modeled Instruc)on
Guided Prac)ce with Teacher Support Guided Prac)ce with Peer Support Independent Prac)ce
Reflec)on, Integra)on and Extension

Student Survey Data: Produc)vity: The ILT collected survey data from all current students to be]er understand the barriers that impede produc)vity (work comple)on).


Step 3: Develop & Implement Plan (What can be done to solve it?)
• Select the intervention(s) or strategies that will
address the problem and meet the goal • Develop and implement the plan with fidelity
Fidelity = Sufficiency + Support

Interventions • What will be done?
• Who will do it?
• When will it be implemented and for how long?
• What data will be collected to monitor intervention on student performance
• How often will the data be reviewed?

Principles of Intervention Design
Interventions should be designed to adjust what is being taught and/or
how it is taught.

Principles of Intervention Design Intervention is… • Explicit- strategy/instruction to be used are specified
clearly (What, who, when, where, how long)
• Focused on instructional environment- actions taken to modify the environment not the individual
• Operationalized – target behavior that is observable and measureable, includes conditions and criteria for success (how know effective?)
• Interventions must be linked to Tier 1 focus, materials, performance criteria

Criteria for Interventions
• Evidence-based • Delivered with Integrity • Implemented for Sufficient Time • Evaluated Frequently • Integrated Across Tiers

Plan Development
Lots of different formats, but some critical elements needed

Plan Development Description of Intervention & Expected Outcomes Tier 1 2 3 Implementation Frequency (How Often): Amount of Time (Duration): When: Who: Support Who: How Often: Description/Type: Data Collection Type: Frequency: Review Dates: Expected Performance on Review Dates: Responsible Party: Review: Data: Decision: Positive Questionable Poor Next Steps


Step 4: Evaluate (Did it work?)
• Collect and use school-wide, small group, and individual student data to determine if the plan is working to address the problem/goal
• Progress monitor and modify, if necessary
• Evaluate the response to intervention: Good, Questionable, Poor

Evaluating the Effectiveness of Intervention
• Is the intervention evidence-based? • How “intense” is the intervention? • What can we “expect” the intervention to do? • Was the intervention implemented as
planned? • How effective is the intervention with
students from similar and different backgrounds?

Good, Questionable, Poor RtI

Decision Rules: What is a “Good” Response to Intervention?
• Positive Response – Gap is closing
– Can extrapolate point at which target student(s) will “come in range” of target--even if this is long range
– Level of “risk” lowers over time
• Questionable Response – Rate at which gap is widening slows considerably, but gap
is still widening
– Gap stops widening but closure does not occur
• Poor Response – Gap continues to widen with no change in rate.

Performance
Time
Positive Response to Intervention
Expected Trajectory
Observed Trajectory

Decision Rules: Linking RtI to Intervention Decisions
• Positive • Continue intervention with current goal
• Continue intervention with goal increased
• Fade intervention to determine if student(s) have acquired functional independence.

Decision Rules: What is a “Questionable” Response to Intervention?
• Positive Response – Gap is closing
– Can extrapolate point at which target student(s) will “come in range” of target--even if this is long range
• Questionable Response – Rate at which gap is widening slows considerably, but gap is
still widening
– Gap stops widening but closure does not occur
– Level of “risk” remains the same over time
• Poor Response – Gap continues to widen with no change in rate.

Performance
Time
Questionable Response to Intervention
Expected Trajectory
Observed Trajectory

Decision Rules: Linking RtI to Intervention Decisions
• Questionable – Was intervention implemented as intended?
• If no - employ strategies to increase implementation integrity
• If yes -
– Increase intensity of current intervention for a short period of time and assess impact. If rate improves, continue. If rate does not improve, return to problem solving.

Decision Rules: What is a “Poor” Response to Intervention?
• Positive Response – Gap is closing
– Can extrapolate point at which target student(s) will “come in range” of target--even if this is long range
• Questionable Response – Rate at which gap is widening slows considerably, but gap
is still widening
– Gap stops widening but closure does not occur
• Poor Response – Gap continues to widen with no change in rate.
– Level of “risk” worsens over time

Performance
Time
Poor Response to Intervention
Expected Trajectory
Observed Trajectory

Happy High School Evaluating Intervention Plan
– Was the H0 Confirmed? The difference between expected and current levels of performance in Common Core Math I exist because insufficient instruction is not maintaining high levels of student engagement
– Was intervention/instruction effective for students?
– Do you have clear direction for intervention revision?

Baseline Quarter 1 Quarter 2 Quarter 3 Quarter 4 Engaged 67% 71% 76% 81% 88%
Passing 61% 73% 77% 83% 87%
0%
10%
20%
30%
40%
50%
60%
70%
80%
90%
100% Percentage of Alg 1 Students Engaged/Passing
Engaged
Passing
Happy High School Step 4: Evaluate Response to Instruction

Step 4: Did it Work?

Why Problem Solving Matters…
Those individuals and organizations that are most effective do not experience fewer problems, less stressful situations, and greater fortune, they just deal with them differently.
Fullan

National Resources to Support District and School MTSS Implementation
• www.floridarti.usf.edu
• www.florida-rti.org
• www.nasdse.org
• www.rtinetwork.org • www.rti4success.org