mTOR Signaling Feedback Modulates Mammary Epithelial ... · mTOR Signaling Feedback Modulates...
15
Therapeutics, Targets, and Chemical Biology mTOR Signaling Feedback Modulates Mammary Epithelial Differentiation and Restrains Invasion Downstream of PTEN Loss Susmita Ghosh 1 , Lidenys Varela 1 , Akshay Sood 1 , Ben Ho Park 2 , and Tamara L. Lotan 1,2 Abstract Oncogenic signaling pathways are tightly regulated by negative feedback circuits and relief of these circuits represents a common mechanism of tumor drug resistance. Although the significance of these feedback pathways for signal transduction is evident, their relevance for cellular differentiation and morphogenesis in a genetically defined context is unclear. In this study, we used isogenic benign mammary organotypic cultures to interrogate the role of mTOR-mediated negative feedback in the specific setting of PTEN inactivation. We found that mTOR signaling promoted basal-like differentiation and repressed nuclear hormone receptor expression after short- term PTEN loss in murine cell cultures analyzed ex vivo. Unexpectedly, we found that PTEN inactivation inhibited growth factor-induced epithelial invasion and that downstream mTOR-mediated signaling feedback was both necessary and sufficient for this effect. Mechanistically, using isogenic MCF10A cells with and without somatic PTEN deletion, we showed that mTOR inhibition promoted EGF-mediated epithelial invasion by derepressing upstream EGF receptor, SRC tyrosine kinase, and phosphoinositide 3-kinase signaling. In addition to offering new signal transduction insights, these results bring to light a number of important and potentially clinically relevant cellular consequences of mTOR inhibition in the specific context of PTEN loss, including modulation of hormone and growth factor responsiveness and promotion of epithelial invasion. Our findings prompt future investigations of the possibility that mTOR inhibitor therapy may not only be ineffective but even deleterious in tumors with PTEN loss. Cancer Res; 73(16); 5218–31. Ó2013 AACR. Introduction PTEN is a tumor suppressor and lipid phosphatase that antagonizes oncogenic phosphoinositide-3-kinase (PI3K) activity. Increased net PI3K activity is a key event in breast tumorigenesis, occurring via activating PIK3CA mutations or with the loss of PTEN in as many as 75% of patients (1). The critical role of PTEN loss in promoting breast tumorigenesis is illustrated by Cowden syndrome, where germline PTEN inac- tivation is associated with an 85% lifetime incidence of breast carcinoma (2). One important result of PTEN loss is activation of AKT, which leads to phosphorylation and inactivation of the TSC1/2 tumor suppressor complex, and increased down- stream mTORC1/2 signaling. The cellular effects of PTEN loss have been well-studied in two-dimensional (2D) monolayer culture systems and include increased proliferation and inva- sion and reduced apoptosis and cell–cell adhesion (3). Importantly, the relevance of PTEN loss for epithelial dif- ferentiation and sensitivity to targeted therapeutics has only recently been elucidated. The association between PTEN loss and basal-like differentiation was initially reported for mam- mary carcinomas developing in PTEN þ/ mice, which com- monly express myoepithelial-type cytokeratins and are nega- tive for estrogen receptor (ER; ref. 4). These murine tumors recapitulate human PTEN-null breast carcinomas, which clus- ter in the basal-like category by expression profiling and are commonly hormone receptor negative (4) and tamoxifen- resistant (5). In addition to hormone independence, loss of PTEN is also associated with independence from HER signal- ing, both in vitro and in vivo. PTEN-null MCF10A cells are EGF independent (6) and PTEN loss is a common genomic change underlying trastuzumab resistance (7, 8). However, the molec- ular mechanisms underlying these characteristic features of PTEN deletion remain unclear. Recently, a number of studies have highlighted the impor- tance of potent negative feedback loops from PI3K/AKT/ mTOR signaling to upstream receptor tyrosine kinase (RTK) and hormone receptor signaling (9–16). As activated PI3K/ AKT/mTOR signaling is a hallmark of PTEN loss, it is possible that this feedback may underlie resistance of PTEN-null tumors to hormonal and HER-targeted therapies. Experiments in genetically heterogeneous systems have shown that treatment with rapamycin (a potent inhibitor of mTORC1 signaling) or mTOR kinase inhibitors (which inhibit mTORC1 and mTORC2) Authors' Affiliations: Departments of 1 Pathology and 2 Oncology, Johns Hopkins University, Baltimore, Maryland Note: Supplementary data for this article are available at Cancer Research Online (http://cancerres.aacrjournals.org/). Corresponding Author: Tamara Lotan, 855 N. Wolfe Street, Baltimore, MD 21205. Phone: 410-614-9196; Fax: 410-502-9911; E-mail: [email protected] doi: 10.1158/0008-5472.CAN-13-0429 Ó2013 American Association for Cancer Research. Cancer Research Cancer Res; 73(16) August 15, 2013 5218 on May 15, 2020. © 2013 American Association for Cancer Research. cancerres.aacrjournals.org Downloaded from Published OnlineFirst June 17, 2013; DOI: 10.1158/0008-5472.CAN-13-0429
Transcript of mTOR Signaling Feedback Modulates Mammary Epithelial ... · mTOR Signaling Feedback Modulates...
Therapeutics, Targets, and Chemical Biology
mTOR Signaling Feedback Modulates Mammary EpithelialDifferentiation and Restrains Invasion Downstream ofPTEN Loss
Susmita Ghosh1, Lidenys Varela1, Akshay Sood1, Ben Ho Park2, and Tamara L. Lotan1,2
AbstractOncogenic signaling pathways are tightly regulated by negative feedback circuits and relief of these circuits
represents a commonmechanismof tumor drug resistance. Although the significance of these feedback pathwaysfor signal transduction is evident, their relevance for cellular differentiation and morphogenesis in a geneticallydefined context is unclear. In this study, we used isogenic benign mammary organotypic cultures to interrogatethe role of mTOR-mediated negative feedback in the specific setting of PTEN inactivation. We found that mTORsignaling promoted basal-like differentiation and repressed nuclear hormone receptor expression after short-term PTEN loss in murine cell cultures analyzed ex vivo. Unexpectedly, we found that PTEN inactivation inhibitedgrowth factor-induced epithelial invasion and that downstream mTOR-mediated signaling feedback was bothnecessary and sufficient for this effect. Mechanistically, using isogenic MCF10A cells with and without somaticPTEN deletion, we showed that mTOR inhibition promoted EGF-mediated epithelial invasion by derepressingupstreamEGF receptor, SRC tyrosine kinase, and phosphoinositide 3-kinase signaling. In addition to offering newsignal transduction insights, these results bring to light a number of important and potentially clinically relevantcellular consequences of mTOR inhibition in the specific context of PTEN loss, includingmodulation of hormoneand growth factor responsiveness andpromotion of epithelial invasion. Ourfindings prompt future investigationsof the possibility that mTOR inhibitor therapy may not only be ineffective but even deleterious in tumors withPTEN loss. Cancer Res; 73(16); 5218–31. �2013 AACR.
IntroductionPTEN is a tumor suppressor and lipid phosphatase that
antagonizes oncogenic phosphoinositide-3-kinase (PI3K)activity. Increased net PI3K activity is a key event in breasttumorigenesis, occurring via activating PIK3CA mutations orwith the loss of PTEN in as many as 75% of patients (1). Thecritical role of PTEN loss in promoting breast tumorigenesis isillustrated by Cowden syndrome, where germline PTEN inac-tivation is associated with an 85% lifetime incidence of breastcarcinoma (2). One important result of PTEN loss is activationof AKT, which leads to phosphorylation and inactivation of theTSC1/2 tumor suppressor complex, and increased down-stream mTORC1/2 signaling. The cellular effects of PTEN losshave been well-studied in two-dimensional (2D) monolayerculture systems and include increased proliferation and inva-sion and reduced apoptosis and cell–cell adhesion (3).
Importantly, the relevance of PTEN loss for epithelial dif-ferentiation and sensitivity to targeted therapeutics has onlyrecently been elucidated. The association between PTEN lossand basal-like differentiation was initially reported for mam-mary carcinomas developing in PTENþ/� mice, which com-monly express myoepithelial-type cytokeratins and are nega-tive for estrogen receptor (ER; ref. 4). These murine tumorsrecapitulate human PTEN-null breast carcinomas, which clus-ter in the basal-like category by expression profiling and arecommonly hormone receptor negative (4) and tamoxifen-resistant (5). In addition to hormone independence, loss ofPTEN is also associated with independence from HER signal-ing, both in vitro and in vivo. PTEN-null MCF10A cells are EGFindependent (6) and PTEN loss is a common genomic changeunderlying trastuzumab resistance (7, 8). However, the molec-ular mechanisms underlying these characteristic features ofPTEN deletion remain unclear.
Recently, a number of studies have highlighted the impor-tance of potent negative feedback loops from PI3K/AKT/mTOR signaling to upstream receptor tyrosine kinase (RTK)and hormone receptor signaling (9–16). As activated PI3K/AKT/mTOR signaling is a hallmark of PTEN loss, it is possiblethat this feedbackmay underlie resistance ofPTEN-null tumorsto hormonal and HER-targeted therapies. Experiments ingenetically heterogeneous systems have shown that treatmentwith rapamycin (a potent inhibitor of mTORC1 signaling) ormTORkinase inhibitors (which inhibitmTORC1andmTORC2)
Authors' Affiliations: Departments of 1Pathology and 2Oncology, JohnsHopkins University, Baltimore, Maryland
Note: Supplementary data for this article are available at Cancer ResearchOnline (http://cancerres.aacrjournals.org/).
CorrespondingAuthor:Tamara Lotan, 855N.Wolfe Street, Baltimore,MD21205. Phone: 410-614-9196; Fax: 410-502-9911; E-mail:[email protected]
doi: 10.1158/0008-5472.CAN-13-0429
�2013 American Association for Cancer Research.
CancerResearch
Cancer Res; 73(16) August 15, 20135218
on May 15, 2020. © 2013 American Association for Cancer Research. cancerres.aacrjournals.org Downloaded from
Published OnlineFirst June 17, 2013; DOI: 10.1158/0008-5472.CAN-13-0429
releases negative feedback to upstream HER, insulin growthfactor receptor/insulin receptor (IGF/IR), and platelet-derivedgrowth factor receptor (PDGFR) signaling, resulting in potentdownstream activation of PI3K and mitogen-activated proteinkinase (MAPK; refs. 11, 12, 17, 18). Furthermore, work onprostate cancer has shown that reciprocal negative feedbackbetween PI3K/mTOR and androgen receptor (AR) signalingmediates hormonal resistance, although it remains unclearwhether a similar mechanism regulates estrogen signaling inbreast tissue (19, 20).As targeted cancer therapeutics become the norm, defining
the relevance of these negative feedback circuits in the contextof specific genetic aberrations is increasingly important. DoesPTEN loss, which promotes unfettered PI3K/AKT signaling,mitigates the effects ofmTOR-mediated feedback on upstreamRTK activity? A systematic comparison of the significance ofthis feedback pathway in isogenic PTEN-expressing and PTEN-null systems has not been conducted. A second importantquestion is whether these potent signaling feedback pathwayshave relevance for cell behavior. To date, most work haselucidated the significance of this feedback at the signalinglevel. Although single-agent rapalog therapies are generally noteffective and xenograft studies support the improved efficacyof combined RTK and mTOR inhibitor therapies (18, 21, 22), itremains unclear whether mTOR-mediated signaling feedbackmay be actually deleterious, modulating critical cell behaviorssuch as invasion or motility. In large part, this may be becausenearly all previous studies have focused on effects in 2Dmonolayer cell cultures. Accordingly, a recent study illustrateshow the cellular consequences of upregulated RTK signalingfollowing PI3K/mTOR suppression are best modeled usingsystems that recapitulate in vivo tissue architecture (23).Here, we interrogate the role of PTEN and downstream
PI3K/mTOR signaling in the regulation of mammary epithelialdifferentiation and cell behavior using three-dimensional (3D)organotypic cultures. Though the cells used in these studies arederived from benign tissues, an important advantage of thesystems used herein is that they are fully isogenic, allowing usto specifically isolate the role of PTEN in signaling feedback,independent of genetic background effects. We report thatfeedback from mTOR signaling downstream of PTEN lossmodulates tissue differentiation and hormone receptor expres-sion. Furthermore, in the context of PTEN loss, mTOR activa-tion plays an unanticipated role in restraining epithelial cellinvasion by inhibiting upstream tyrosine kinase signaling.Taken together, this work provides insight into the physiologicrelevance of mTOR-mediated feedback in the specific settingof PTEN-null mammary tissue.
Materials and MethodsMouse linesAnimal protocols were approved by the John Hopkins Uni-
versity Animal Care and Use Committee. Mice with induciblePTEN loss-of-function (R26CreER;PTENloxp/loxp) and themT/mGreporter (R26CreER;mT/mG) were generated as described(24–27). R26CreER and TSC1loxp/loxp mice (Jackson Labora-tory; ref. 28) were crossed to obtain R26CreER;TSC1loxp/loxp
mice [referred to as TSC1�/� following 4-hydroxytamoxifen
(4-OHT) treatment] and TSC1loxp/loxp (TSC1þ/þ following 4-OHT) or R26CreER;TSC1WT/loxp (TSC1þ/� following 4-OHT)littermate controls.
Mammary organoid cultureThe procedure of mammary organoid isolation has been
described elsewhere (29). Following isolation, organoids wereplated in a disk of growth factor-reduced Matrigel (BD Bio-sciences). Defined culturemedia includedDulbecco'sModifiedEagle Medium (Invitrogen), insulin, transferrin, and selenium(Sigma), penicillin/streptomycin (Invitrogen), and 2.5 nmol/Lfibroblast growth factor 2 (FGF2), TGFa, or EGF (Peprotech) aswell as 20 nmol/L 4-OHT (Sigma) for the first 18 hours. After18 hours of culture, media containing 4-OHT were removed,organoids were gently washed, and media lacking 4-OHT werereplaced for the duration of culture. Organoids were imagedby stereomicroscopic (Carl Zeiss) and differential interferencecontrast (DIC) imaging (Zeiss AxioObserver).
Time-lapse DIC imagingLive cell imaging was conducted as described (27). DIC
images were collected every 20 minutes for up to 100 hours.
Quantification of organoid morphogenesisOrganoid size was quantified at day 7 of culture by mea-
suring longest axis (Zeiss AxioVision) in 3 independent experi-ments (14–33 organoids/condition). Plasma membranes weredelineated on histologic sections using E-cadherin immuno-fluorescence and cell area measured for 10 representativeorganoids/condition in ImageJ (8–26 cells/organoid). Orga-noid budding was quantified in 5 independent experiments asthe proportion of organoids with more than 2 buds (100–300organoids/condition). Mean proportions were normalized towild-type for each replicate, as the percentage of branchedwild-type organoids varied (33%–88%) across experiments.The number of buds per organoid was visually counted for30 to 300 organoids in one representative experiment. Luminalfilling was defined as more than 50% cellular filling of internalluminal space on histologic sectioning and was assessed 3independent experiments (24–51 organoids/condition).
Cell cultureIsogenic MCF10A parental cells and two independent clones
with homozygous targeted recombination at the PTEN locus(PTEN�/� #1, PTEN�/� #2)were a gift of K. Bachman (UniversityofMaryland, Baltimore,MD; ref. 6). Conditions for 2Dmonolayerculture (6), 3D acinar culture in Matrigel (30), and 3D acinarculture in collagen–Matrigel mixtures (31) have been described.MCF10A-ER-SRC cells (32) were a gift of K. Struhl (HarvardUniversity, Cambridge, MA) and were maintained as described.
Quantification of morphogenesis in MCF10A aciniAcinar size was quantified at day 18 of culture inMatrigel by
measuring diameter (Zeiss AxioVision). Invasive protrusionswere quantified at day 3 of culture in collagen–Matrigel as theproportion of acini containing at least one invasive cyto-plasmic protrusion under phase-contrast imaging in 3 inde-pendent experiments (100–300 acini/condition).
mTOR Inhibits Mammary Invasion Downstream of PTEN Loss
www.aacrjournals.org Cancer Res; 73(16) August 15, 2013 5219
on May 15, 2020. © 2013 American Association for Cancer Research. cancerres.aacrjournals.org Downloaded from
Published OnlineFirst June 17, 2013; DOI: 10.1158/0008-5472.CAN-13-0429

Proliferation and apoptosis assaysOrganoids were pulsed with 10 mmol/L BrdUrd (BD Biosci-
ence) at day 4 or 7 of culture followed by fixation, processing,histologic sectioning, and immunohistochemistry to detectBrdUrd. BrdUrd immunohistochemistry was scored manuallyby counting the proportion of positively stained nuclei for atleast 10 organoids per condition in 3 independent experimentsthat were analyzed. Cleaved caspase-3 (CC3) immunohis-tochemistry was quantified at day 4 or 7 of culture as theproportion of positively stained cells for 3 independent experi-ments (10 organoids/condition). For MCF10A acini, immuno-fluorescence for CC3 was carried out at day 18 of culture andimaged by confocal microscopy as described below. The per-centage CC3-positive cells was assessed for 7 to 8 acini/genotype (50–500/cells each).
InhibitorsPharmacologic inhibitors were dissolved in dimethyl sulf-
oxide and added to culture media at day 0 upon plating atconcentrations spanning the IC50 values: rapamycin (200nmol/L; LC Laboratories), AZD0855 (500 nmol/L; LC Labora-tories); torin1 (500 nmol/L; a gift of D.M. Sabatini, Harvard;ref. 33), GDC0491 (1 mmol/L; LC Laboratories), BEZ235 (1mmol/L, LC Laboratories), lapatinib (5 mmol/L; LC Laborato-ries), erlotinib (250 nmol/L; LC Laboratories), dasatinib (100nmol/L; LC Laboratories), LY294002 (25 mmol/L; Sigma); mar-imastat (5 mmol/L; Sigma), and TAPI-1 (10 mmol/L; Millipore).
ImmunoblottingOrganoids, acini, and cell monolayers were immunoblotted
by SDS-PAGE as described (27) using primary antibodies fromCell Signaling Technologies: p-EGFR (Y1068), p-AKT(T308), p-AKT(S473), p-p70S6K, pSRC (Y416), pS6, S6, non p-SRC, EGFR,pan-AKT, p70S6K, b-actin, PTEN, and TSC1.
Immunohistochemistry/immunofluorescenceOrganoids were fixed in 10% neutral buffered formalin
(Fisher), embedded in 1% agarose, processed, paraffin-embed-ded, and sectioned by standard histologic methods. Immuno-histochemistry was conducted as described (27) using anti-bodies to PTEN and p-AKT(S473; Cell Signaling), BrdUrd(Fitzgerald Industries), CC-3 (Cell Signaling), and ER (LeicaBiosystems). For immunofluorescence of histologic organoidsections, slides were processed as described for immunohis-tochemistry, incubated with antibodies to K14 (Millipore), K8(TROMA-I, Developmental Studies Hybridoma Bank), and/orsmooth muscle actin (Sigma), or E-cadherin (Cell Signaling).Directly conjugated phalloidin (Invitrogen) was used to detectfilamentous actin (F-actin). mT/mG immunofluorescence wasdirectly detected in cryosections. Immunofluorescence ofMCF10A acinar cultures for laminin (Millipore) and GM130(BD Biosciences), was conducted as described (30) and con-focally imaged in serial 5 mm Z-sections (Zeiss LSM 510).
Immunohistochemistry/immunofluorescencequantification
CK14 expression was quantified as proportion of CK14-expressing luminal cells/organoid on histologic sections in 3independent experiments (6–14 organoids/condition). Mean
proportions were normalized to wild-type as the averagepercentage CK14-positive luminal cells in the wild-type orga-noids varied between replicates (3.8% to 15.8%). ER expressionwas quantified using H-score. The H-score is calculated as 1�
(percentage 1þ intensity cells)þ 2�(percentage 2þ cells)þ 3�
(percentage 3þ cells). Seven to 15 organoids were assessed/condition/experiment (30–200 cells/organoid). mT/mG imm-unofluorescence was quantified as the percentage of enhancedgreen fluorescence protein (EGFP)-expressing cells/organoidon cryosections assessing 20 organoids/timepoint from onerepresentative experiment.
RTK arrayPhospho-RTK–signaling arrays (Cell Signaling Technolo-
gies) were conducted according to the manufacturer's instruc-tions using cell lysates from 2D monolayers exposed to spec-ified drug for 18 hours. Arrays were immediately captured viadigital chemiluminescent imaging (Alpha Innotech).
Statistical analysisStatistical analysis was conducted throughout using Student
unpaired t test.
ResultsMurine mammary organoids undergo invasive budding in
response to FGF or HER ligands. In the murine mammary exvivo culture system, ductal fragments are isolated andembedded in laminin-rich ECM where they recapitulatenormal bilayered ductal organization. Although the orga-noids are initially cystic, 4 days following the addition ofexogenous growth factor, the luminal cells proliferate to fillthe interior space. By day 7, the luminal cells have invadedbeyond the surrounding of myoepithelial cell layer into theECM, recapitulating pubertal ductal morphogenesis and theearly stages of invasive breast cancer (29; SupplementaryFig. S1, Supplementary Movie S1, and Fig. 2D, top). Althoughboth FGF and HER ligands can independently induce inva-sive budding in this system (29), we found that FGF2 is moreeffective than TGFa or EGF and a small but consistentsynergistic response was seen with both ligands together(Supplementary Fig. S1).
As ADAM17 (ametalloproteinase that cleaves and activatesmembranous HER ligands) is required for ductal invasionduring puberty (33), we tested whether autocrine and/orparacrine HER signaling may regulate full response to FGFligands in vitro, as documented in other epithelial systems(34). We found that treatment of organoids with marimastator TAPI-1 (metalloproteinase inhibitors) markedly inhibitedbudding in response to FGF2 alone in a manner that could berescued with exogenous TGFa (Supplementary Fig. S1, datanot shown), suggesting that autocrine/paracrine HER signal-ing is required downstream of FGF2 addition for in vitroepithelial invasion in this system.
Short-term PTEN loss is efficiently induced in primarymammary organoid culture. To query the short-term effectsof PTEN loss-of-function on cellular differentiation and mor-phogenesis in this system, we isolated mammary organoids
Ghosh et al.
Cancer Res; 73(16) August 15, 2013 Cancer Research5220
on May 15, 2020. © 2013 American Association for Cancer Research. cancerres.aacrjournals.org Downloaded from
Published OnlineFirst June 17, 2013; DOI: 10.1158/0008-5472.CAN-13-0429
from R26CreER;PTENloxp/loxp mice. Using the mTmG reporter,we found that an 18-hour incubation with 4-OHT at day 0 ofculture (followed by washout) was sufficient to induce Creactivity in 60% of cells by day 3 of culture with minimal effectson morphogenesis (Supplementary Fig. S1). Accordingly, by
day 4 of culture, we observed efficient PTEN protein loss inR26CreER; PTENloxp/loxp organoids (referred to as PTEN�/�-after 4-OHT) compared with littermate PTENloxp/loxp controls(referred to as PTENþ/þ after 4-OHT), with concomitantincreases in downstream-activated AKT (Fig. 1A).
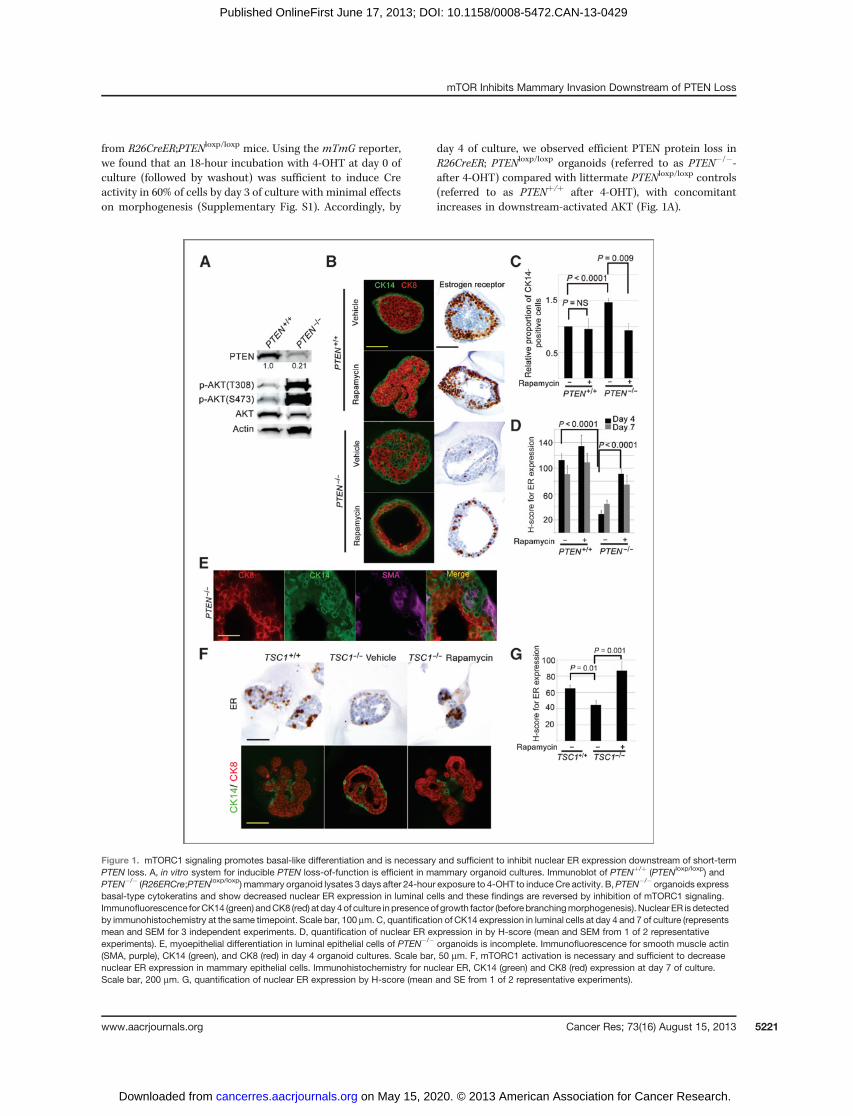
Figure 1. mTORC1 signaling promotes basal-like differentiation and is necessary and sufficient to inhibit nuclear ER expression downstream of short-termPTEN loss. A, in vitro system for inducible PTEN loss-of-function is efficient in mammary organoid cultures. Immunoblot of PTENþ/þ (PTENloxp/loxp) andPTEN�/� (R26ERCre;PTENloxp/loxp) mammary organoid lysates 3 days after 24-hour exposure to 4-OHT to induceCre activity. B,PTEN�/� organoids expressbasal-type cytokeratins and show decreased nuclear ER expression in luminal cells and these findings are reversed by inhibition of mTORC1 signaling.Immunofluorescence forCK14 (green) andCK8 (red) at day 4of culture in presenceof growth factor (before branchingmorphogenesis). Nuclear ER is detectedby immunohistochemistry at the same timepoint. Scale bar, 100 mm. C, quantification of CK14 expression in luminal cells at day 4 and 7 of culture (representsmean and SEM for 3 independent experiments. D, quantification of nuclear ER expression in by H-score (mean and SEM from 1 of 2 representativeexperiments). E, myoepithelial differentiation in luminal epithelial cells of PTEN�/� organoids is incomplete. Immunofluorescence for smooth muscle actin(SMA, purple), CK14 (green), and CK8 (red) in day 4 organoid cultures. Scale bar, 50 mm. F, mTORC1 activation is necessary and sufficient to decreasenuclear ER expression in mammary epithelial cells. Immunohistochemistry for nuclear ER, CK14 (green) and CK8 (red) expression at day 7 of culture.Scale bar, 200 mm. G, quantification of nuclear ER expression by H-score (mean and SE from 1 of 2 representative experiments).
mTOR Inhibits Mammary Invasion Downstream of PTEN Loss
www.aacrjournals.org Cancer Res; 73(16) August 15, 2013 5221
on May 15, 2020. © 2013 American Association for Cancer Research. cancerres.aacrjournals.org Downloaded from
Published OnlineFirst June 17, 2013; DOI: 10.1158/0008-5472.CAN-13-0429
mTORC1 signaling promotes basal-like differentiation andis necessary and sufficient to inhibit ER expression down-stream of short-term PTEN loss. It remains unclear whetherPTEN loss is directly responsible for basal-like differentiationin human PTEN-null tumors (4), and if so, which downstreamsignal transduction pathways are required. To address thisquestion, we assessed keratin and ER expression in our benignisogenic systemwith short-term PTEN loss. At day 4 of culture,PTENþ/þ organoids were solid bilayered structures, with asingle layer of CK14-myoepithelial cells surrounding CK8-positive luminal epithelial cells (29; Fig. 1B and C). In contrast,PTEN�/� organoids contained a mixture of CK8- and CK14-expressing cells in their lumens, with nearly a 50% increase inluminal CK14-positive cells. The increase in luminal CK14-positive cells could be due to increased proliferation oraberrant differentiation. Unlike CK14-positive myoepithelialcells in wild-type organoids, these CK14-positive cells inPTEN�/� organoids did not uniformly coexpress smoothmuscle actin, suggesting that they have undergone partial butincomplete myoepithelial differentiation (Fig. 1E). In addition,the location of these cells within the luminal compartment (asopposed to the periphery) suggested that they arose fromaberrant differentiation of luminally located cells, rather thandue to increased relative proliferation of the CK14-positivemyoepithelial compartment in the PTEN�/� organoids. Fin-ally, quantification of proliferation as measured by BrdUrd
incorporation revealed no significant difference between theratio of percentage proliferating CK14-positive cells and per-centage proliferating non–CK14-positive cells in the PTENþ/þ
and PTEN�/� organoids (1.46�0.50 vs. 1.20�0.30; P ¼ NS),despite accumulation of CK14-positive cells specifically in thePTEN�/� organoids.
To discern which signaling pathways activated downstreamof PTEN loss might mediate this basal-like differentiation, wetreated PTEN�/� organoids with mTOR inhibitors. We foundthat rapamycin (a potentmTORC1 inhibitor, which suppressesp-p70S6K and p-S6 levels, Fig. 3B) substantially decreased thenumber of luminal CK14-positive cells in PTEN-null organoids,with negligible effect on the number of CK14-positive cells inwild-type organoids (Fig. 1B and C).
Murine and human tumors with PTEN loss are also com-monly hormone receptor negative, however the signaling path-ways regulating this effect are unclear (4). We found that evenshort-term PTEN loss was sufficient to markedly decreasenuclear ER expression in the luminal cells of murine organoidsat day 4 and day 7 of culture (Fig. 1B and D). Importantly,mTORC1 activity was necessary for this effect, as treatment ofPTEN�/� organoids with rapamycin restored nuclear ER levels,without any significant effect on nuclear ER levels in PTENþ/þ
cells (Fig. 1B and D). Interestingly, treatment of PTEN�/�
organoids with GDC0941, which in contrast to rapamycininhibits PI3K and mTORC2 activity in addition to mTORC1
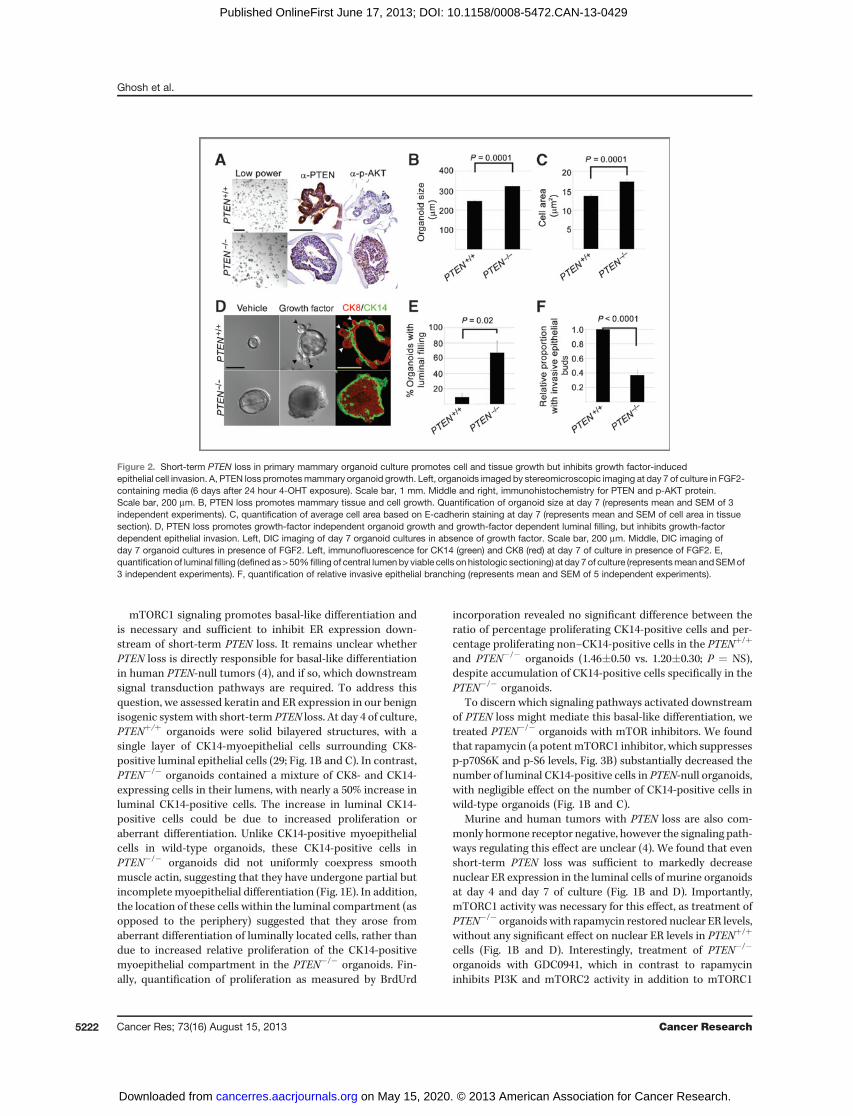
Figure 2. Short-term PTEN loss in primary mammary organoid culture promotes cell and tissue growth but inhibits growth factor-inducedepithelial cell invasion. A, PTEN loss promotesmammary organoid growth. Left, organoids imaged by stereomicroscopic imaging at day 7 of culture in FGF2-containing media (6 days after 24 hour 4-OHT exposure). Scale bar, 1 mm. Middle and right, immunohistochemistry for PTEN and p-AKT protein.Scale bar, 200 mm. B, PTEN loss promotes mammary tissue and cell growth. Quantification of organoid size at day 7 (represents mean and SEM of 3independent experiments). C, quantification of average cell area based on E-cadherin staining at day 7 (represents mean and SEM of cell area in tissuesection). D, PTEN loss promotes growth-factor independent organoid growth and growth-factor dependent luminal filling, but inhibits growth-factordependent epithelial invasion. Left, DIC imaging of day 7 organoid cultures in absence of growth factor. Scale bar, 200 mm. Middle, DIC imaging ofday 7 organoid cultures in presence of FGF2. Left, immunofluorescence for CK14 (green) and CK8 (red) at day 7 of culture in presence of FGF2. E,quantification of luminal filling (defined as>50% filling of central lumenby viable cells onhistologic sectioning) at day 7of culture (representsmean andSEMof3 independent experiments). F, quantification of relative invasive epithelial branching (represents mean and SEM of 5 independent experiments).
Ghosh et al.
Cancer Res; 73(16) August 15, 2013 Cancer Research5222
on May 15, 2020. © 2013 American Association for Cancer Research. cancerres.aacrjournals.org Downloaded from
Published OnlineFirst June 17, 2013; DOI: 10.1158/0008-5472.CAN-13-0429
(see Fig. 7), resulted only in a very modest and statisticallyinsignificant rescue of nuclear ER levels (26% increase inaverageH-score, P¼ 0.14, data not shown). Thus, in the contextof constitutively suppressed PI3K/mTORC2 activity, mTORC1inhibition is insufficient to rescue ER expression in PTEN�/�
cells.To query whether mTORC1 activation independent of PTEN
loss is sufficient to suppress nuclear ER expression, we gen-erated R26ERCre TSC1loxp/loxp organoids (hereafter referred toas TSC1�/�). TSC1�/� organoids have markedly increasedmTORC1 activity as evidenced by increased p-S6, and this canbe suppressed with rapamycin treatment (Fig. 3D). By day 7of culture after growth factor addition, TSC1�/� organoids
showed reduced nuclear ER expression compared with theirwild-type counterparts, an effect reversible by rapamycin (Fig.1F and G). In contrast to PTEN�/� organoids, the number ofluminal CK14-positive cells was not significantly increased inTSC1�/� organoids, suggesting that the changes in CK14 andER expression are independent and that mTORC1 activity isnot sufficient to increase basal-like keratin expression in thissystem (Fig. 1F). Thus, downstream of short-term PTEN loss,mTORC1 activity is necessary to promote basal-like differen-tiation and suppress ER expression in mammary organoidcultures. Furthermore, mTORC1 activation independent ofPTEN loss is sufficient to inhibit nuclear ER expression, butnot to promote basal-like differentiation.
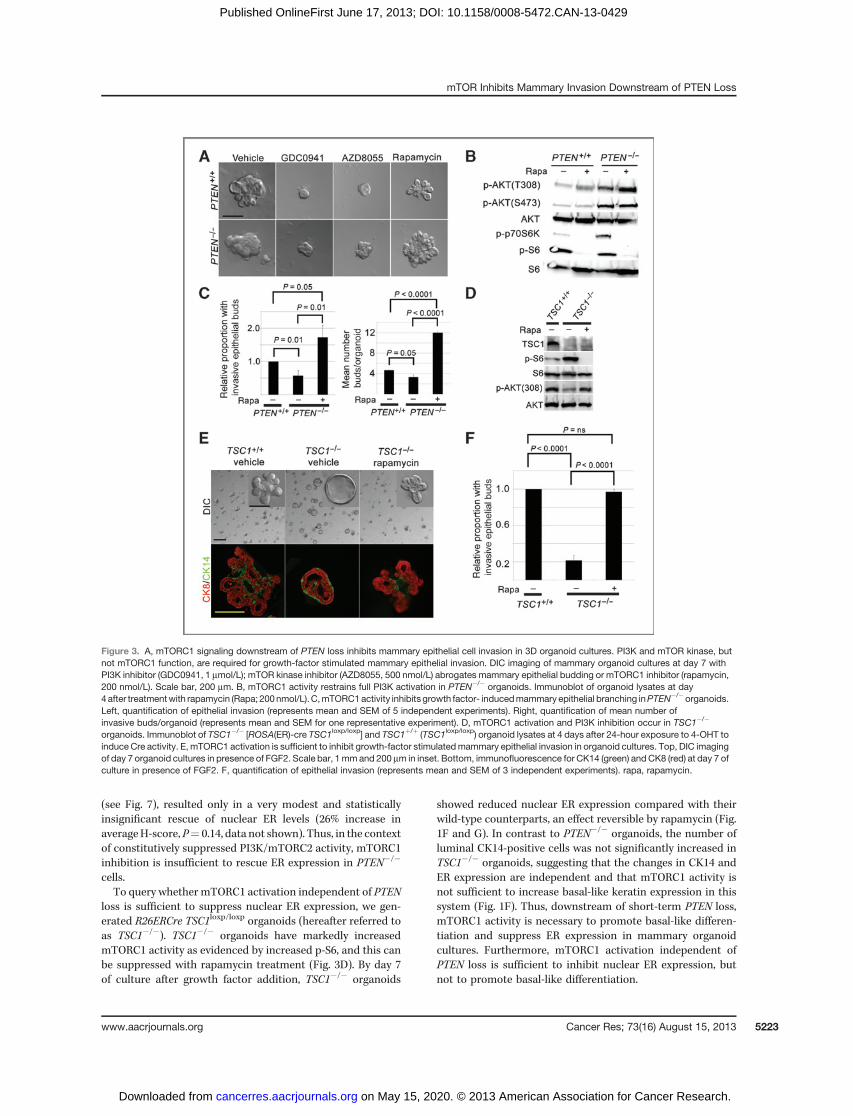
Figure 3. A, mTORC1 signaling downstream of PTEN loss inhibits mammary epithelial cell invasion in 3D organoid cultures. PI3K and mTOR kinase, butnot mTORC1 function, are required for growth-factor stimulated mammary epithelial invasion. DIC imaging of mammary organoid cultures at day 7 withPI3K inhibitor (GDC0941, 1 mmol/L); mTOR kinase inhibitor (AZD8055, 500 nmol/L) abrogates mammary epithelial budding or mTORC1 inhibitor (rapamycin,200 nmol/L). Scale bar, 200 mm. B, mTORC1 activity restrains full PI3K activation in PTEN�/� organoids. Immunoblot of organoid lysates at day4after treatmentwith rapamycin (Rapa; 200nmol/L). C,mTORC1activity inhibits growth factor- inducedmammary epithelial branching inPTEN�/�organoids.Left, quantification of epithelial invasion (represents mean and SEM of 5 independent experiments). Right, quantification of mean number ofinvasive buds/organoid (represents mean and SEM for one representative experiment). D, mTORC1 activation and PI3K inhibition occur in TSC1�/�
organoids. Immunoblot of TSC1�/� [ROSA(ER)-cre TSC1loxp/loxp] and TSC1þ/þ (TSC1loxp/loxp) organoid lysates at 4 days after 24-hour exposure to 4-OHT toinduce Cre activity. E, mTORC1 activation is sufficient to inhibit growth-factor stimulatedmammary epithelial invasion in organoid cultures. Top, DIC imagingof day 7 organoid cultures in presence of FGF2. Scale bar, 1mm and 200 mm in inset. Bottom, immunofluorescence for CK14 (green) andCK8 (red) at day 7 ofculture in presence of FGF2. F, quantification of epithelial invasion (represents mean and SEM of 3 independent experiments). rapa, rapamycin.
mTOR Inhibits Mammary Invasion Downstream of PTEN Loss
www.aacrjournals.org Cancer Res; 73(16) August 15, 2013 5223
on May 15, 2020. © 2013 American Association for Cancer Research. cancerres.aacrjournals.org Downloaded from
Published OnlineFirst June 17, 2013; DOI: 10.1158/0008-5472.CAN-13-0429
Because PTEN loss promotes independence from HERsignaling in human tumors and cell lines (6–8), we alsoexamined whether mammary organoids with short-termPTEN loss could survive in the absence of EGFR/HER2 sig-naling. Consistent with our finding that autocrine/paracrineHER signaling occurs in the organoid system in the presenceof FGF2, we found that treatment with lapatinib (a combinedEGFR/HER2 inhibitor) decreased viability of wild-type mam-mary organoids cultured in FGF2 (Supplementary Fig. S2).These data suggest that in addition to modulating epithelialinvasion in this system, at least minimal autocrine/paracrineEGFR/HER2 signaling is required for cell survival in wild-typeorganoids. Although marimastat blocks autocrine release ofHER ligands, it did not result in decreased organoid viability(Supplementary Fig. S1B), likely because it results in a lesscomplete block of this autocrine signaling compared withlapatinib. In contrast to wild-type organoids, PTEN�/� orga-noids showed no decrement in viability in the presence oflapatinib. This suggests that cell survival is no longer depen-dent onHER signaling in the context of PTEN loss, likely due toconstitutive activation of downstream intracellular survivalsignaling pathways. Importantly, rapamycin treatment didnot restore sensitivity to lapatinib (data not shown), suggest-ing that constitutive mTORC1 activation is not critical for cellsurvival in PTEN �/� organoids.
Short-term PTEN loss promotes cell and tissue growth andinhibits epithelial cell invasion of ECM. By day 7 of culture withgrowth factor, PTEN�/� mammary organoids lacked PTENprotein expression and showed increased AKT phosphoryla-tion (Fig. 2A). As expected, theywere also larger than theirwild-type counterparts (Fig. 2A and B), due in part to the increasedsize of individual luminal epithelial cells (Fig. 2C), an effectreversible with rapamycin (data not shown) and independentof growth factor (Fig. 2D). In contrast to wild-type organoids,which were predominantly cystic at this timepoint, the major-ity of PTEN�/� organoids showed persistent filling of theluminal space by CK8- and CK14-expressing cells (Fig. 2D andE). Most striking, fewer than half as many PTEN�/� organoidsresponded to growth factor by developing invasive CK8-pos-itive epithelial buds extending into the surrounding ECM (Fig.2D and F). Taken together, PTEN loss drives increased tissuesize and luminal filling within days in mammary organoids.Surprisingly, however, PTEN loss restrains growth factor-induced epithelial budding in the context of the organoidsystem.
mTORC1 signaling downstream of PTEN loss is necessary toinhibit mammary epithelial cell invasion in organoid cultures.Next, we examined which signal transduction pathways down-stream of PTEN loss might suppress growth factor-inducedmammary epithelial cell invasion. Both PI3K-mTORC1/2 inhi-bitors (GDC0941, Fig. 3A and LY294003, data not shown) andspecific mTOR kinase inhibitors that block mTORC1/2 signal-ing (AZD8055 or torin1; Fig. 3A and data not shown), allpotently inhibited epithelial budding in both genotypes. Thus,PI3K activation and mTOR kinase function are required forbudding in this system. Surprisingly, we observed that rapa-mycin did not suppress epithelial invasion in wild-type mam-mary organoids, indicating that while mTORC1 function is not
required, PI3K- and mTORC2-dependent invasion occurs inthis system. In fact, rapamycin treatment rescued epithelialbudding in PTEN�/� mammary organoids, increasing thepercentage of branched organoids and the number of buds/organoid even beyond wild-type controls (Fig. 3A and C). Incontrast, there were no consistent effects of rapamycin onbudding in PTENþ/þ organoids. mTORC1 inhibition was asso-ciated with an increase in PI3K activity [asmeasured by p-AKT(T308)], even in PTEN�/� organoids (Fig. 3B). Thus, these dataindicate that in PTEN-null mammary organoids, mTORC1activity simultaneously restrains full PI3K activation and sup-presses epithelial invasion.
Because luminal cell proliferation is required for epithelialinvasion in the organoid system (29), we next asked whetherthe increased budding in rapamycin-treated PTEN�/� orga-noids (and decreased budding in GDC0941- and AZD8055-treated organoids) could be due to changes occurring in netproliferation. Notably, both GDC0941 and AZD8055 dramati-cally decreased proliferation as measured by BrdUrd incorpo-ration on day 4 (Supplementary Fig. S3), making it difficult todiscern whether decreased cellular proliferation or impairedepithelial migration/invasion underlie the effects of theseinhibitors on budding. Despite the fact that it increasedepithelial branching in PTEN�/� organoids, we found thatrapamycin actually suppressed proliferation as measured byBrdUrd incorporation on day 4 and increased apoptosis asmeasured by CC3 expression on day 7 (Supplementary Fig. S3).Thus, rapamycin likely increases budding by modulating epi-thelial migration and invasion.
mTORC1 activation is sufficient to restrain growth factor-induced mammary epithelial invasion. To query whethermTORC1activationwas sufficient to inhibit epithelial invasion,we studied TSC1�/� organoids. Compared with their wild-typecounterparts, TSC1�/� organoids showed a depressed level ofPI3K activation measured by p-AKT (T308; Fig. 3D). Thiscorrelated with a dramatic decrease in invasive buds inresponse to growth factor (Fig. 3E and F). In contrast, rapa-mycin-treated TSC1�/� organoids showed full rescue of epi-thelial invasion, with numerous CK8-positive buds beyond themyoepithelial cell layer (Fig. 3E and F), whereas rapamycin-treatedwild-type organoids showed no significant effects (datanot shown). Thus, mTORC1 activation is both sufficient toinhibit growth factor-induced epithelial invasion in theabsence of PTEN loss and necessary to restrain invasion inthe context of PTEN loss.
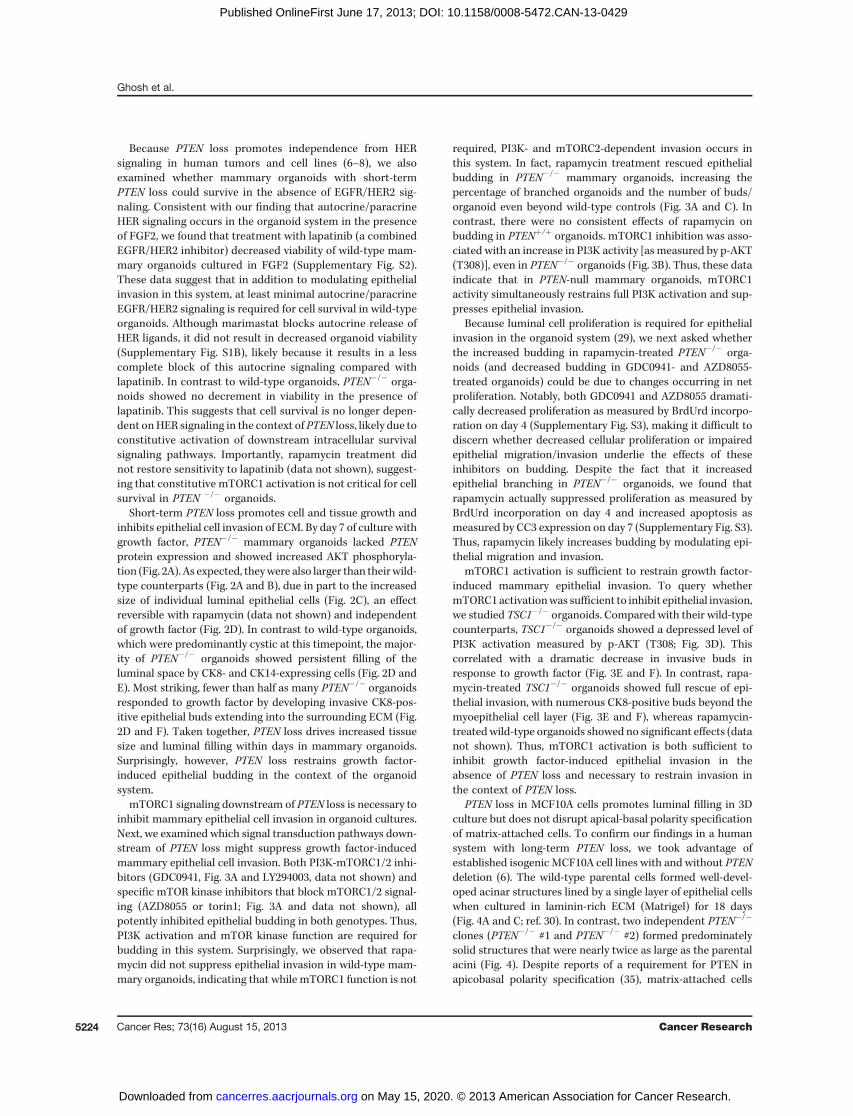
PTEN loss in MCF10A cells promotes luminal filling in 3Dculture but does not disrupt apical-basal polarity specificationof matrix-attached cells. To confirm our findings in a humansystem with long-term PTEN loss, we took advantage ofestablished isogenic MCF10A cell lines with and without PTENdeletion (6). The wild-type parental cells formed well-devel-oped acinar structures lined by a single layer of epithelial cellswhen cultured in laminin-rich ECM (Matrigel) for 18 days(Fig. 4A and C; ref. 30). In contrast, two independent PTEN�/�
clones (PTEN�/� #1 and PTEN�/� #2) formed predominatelysolid structures that were nearly twice as large as the parentalacini (Fig. 4). Despite reports of a requirement for PTEN inapicobasal polarity specification (35), matrix-attached cells
Ghosh et al.
Cancer Res; 73(16) August 15, 2013 Cancer Research5224
on May 15, 2020. © 2013 American Association for Cancer Research. cancerres.aacrjournals.org Downloaded from
Published OnlineFirst June 17, 2013; DOI: 10.1158/0008-5472.CAN-13-0429
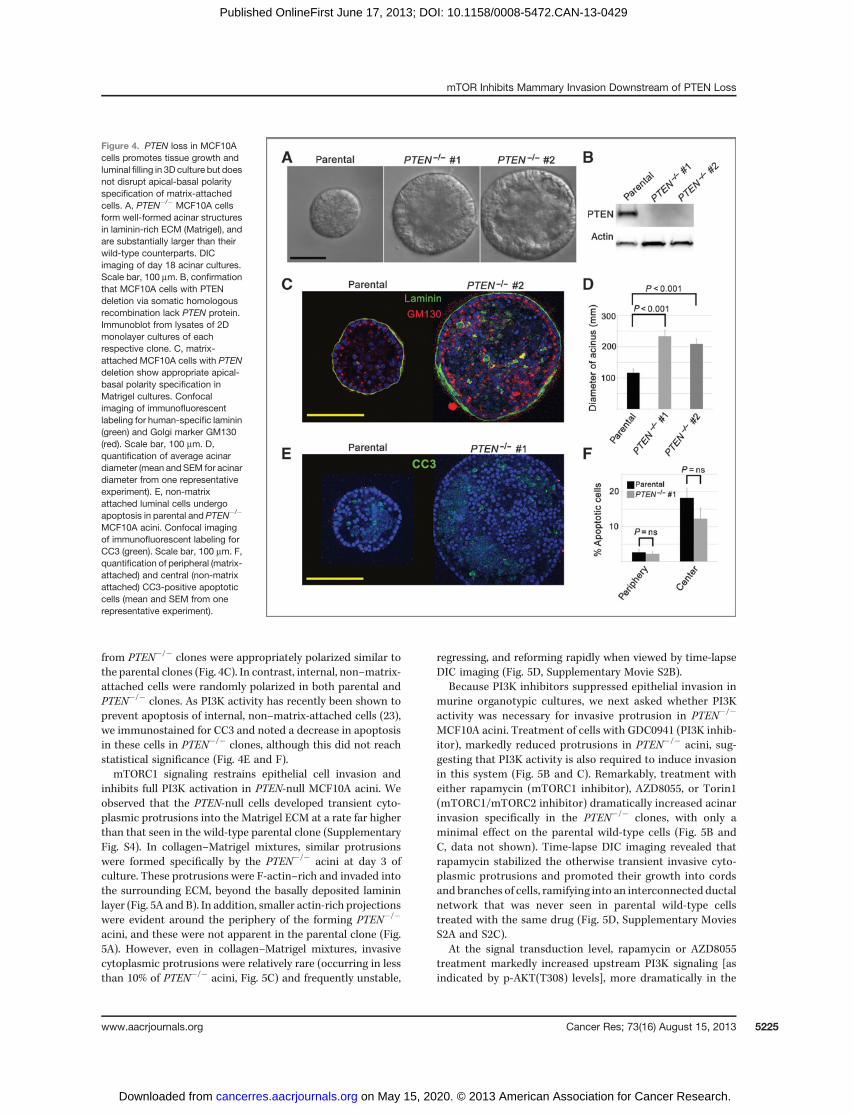
from PTEN�/� clones were appropriately polarized similar tothe parental clones (Fig. 4C). In contrast, internal, non–matrix-attached cells were randomly polarized in both parental andPTEN�/� clones. As PI3K activity has recently been shown toprevent apoptosis of internal, non–matrix-attached cells (23),we immunostained for CC3 and noted a decrease in apoptosisin these cells in PTEN�/� clones, although this did not reachstatistical significance (Fig. 4E and F).mTORC1 signaling restrains epithelial cell invasion and
inhibits full PI3K activation in PTEN-null MCF10A acini. Weobserved that the PTEN-null cells developed transient cyto-plasmic protrusions into the Matrigel ECM at a rate far higherthan that seen in the wild-type parental clone (SupplementaryFig. S4). In collagen–Matrigel mixtures, similar protrusionswere formed specifically by the PTEN�/� acini at day 3 ofculture. These protrusions were F-actin–rich and invaded intothe surrounding ECM, beyond the basally deposited lamininlayer (Fig. 5A and B). In addition, smaller actin-rich projectionswere evident around the periphery of the forming PTEN�/�
acini, and these were not apparent in the parental clone (Fig.5A). However, even in collagen–Matrigel mixtures, invasivecytoplasmic protrusions were relatively rare (occurring in lessthan 10% of PTEN�/� acini, Fig. 5C) and frequently unstable,
regressing, and reforming rapidly when viewed by time-lapseDIC imaging (Fig. 5D, Supplementary Movie S2B).
Because PI3K inhibitors suppressed epithelial invasion inmurine organotypic cultures, we next asked whether PI3Kactivity was necessary for invasive protrusion in PTEN�/�
MCF10A acini. Treatment of cells with GDC0941 (PI3K inhib-itor), markedly reduced protrusions in PTEN�/� acini, sug-gesting that PI3K activity is also required to induce invasionin this system (Fig. 5B and C). Remarkably, treatment witheither rapamycin (mTORC1 inhibitor), AZD8055, or Torin1(mTORC1/mTORC2 inhibitor) dramatically increased acinarinvasion specifically in the PTEN�/� clones, with only aminimal effect on the parental wild-type cells (Fig. 5B andC, data not shown). Time-lapse DIC imaging revealed thatrapamycin stabilized the otherwise transient invasive cyto-plasmic protrusions and promoted their growth into cordsand branches of cells, ramifying into an interconnected ductalnetwork that was never seen in parental wild-type cellstreated with the same drug (Fig. 5D, Supplementary MoviesS2A and S2C).
At the signal transduction level, rapamycin or AZD8055treatment markedly increased upstream PI3K signaling [asindicated by p-AKT(T308) levels], more dramatically in the
Figure 4. PTEN loss in MCF10Acells promotes tissue growth andluminal filling in 3D culture but doesnot disrupt apical-basal polarityspecification of matrix-attachedcells. A, PTEN�/� MCF10A cellsform well-formed acinar structuresin laminin-rich ECM (Matrigel), andare substantially larger than theirwild-type counterparts. DICimaging of day 18 acinar cultures.Scale bar, 100 mm. B, confirmationthat MCF10A cells with PTENdeletion via somatic homologousrecombination lack PTEN protein.Immunoblot from lysates of 2Dmonolayer cultures of eachrespective clone. C, matrix-attached MCF10A cells with PTENdeletion show appropriate apical-basal polarity specification inMatrigel cultures. Confocalimaging of immunofluorescentlabeling for human-specific laminin(green) and Golgi marker GM130(red). Scale bar, 100 mm. D,quantification of average acinardiameter (mean and SEM for acinardiameter from one representativeexperiment). E, non-matrixattached luminal cells undergoapoptosis in parental and PTEN�/�
MCF10A acini. Confocal imagingof immunofluorescent labeling forCC3 (green). Scale bar, 100 mm. F,quantification of peripheral (matrix-attached) and central (non-matrixattached) CC3-positive apoptoticcells (mean and SEM from onerepresentative experiment).
mTOR Inhibits Mammary Invasion Downstream of PTEN Loss
www.aacrjournals.org Cancer Res; 73(16) August 15, 2013 5225
on May 15, 2020. © 2013 American Association for Cancer Research. cancerres.aacrjournals.org Downloaded from
Published OnlineFirst June 17, 2013; DOI: 10.1158/0008-5472.CAN-13-0429
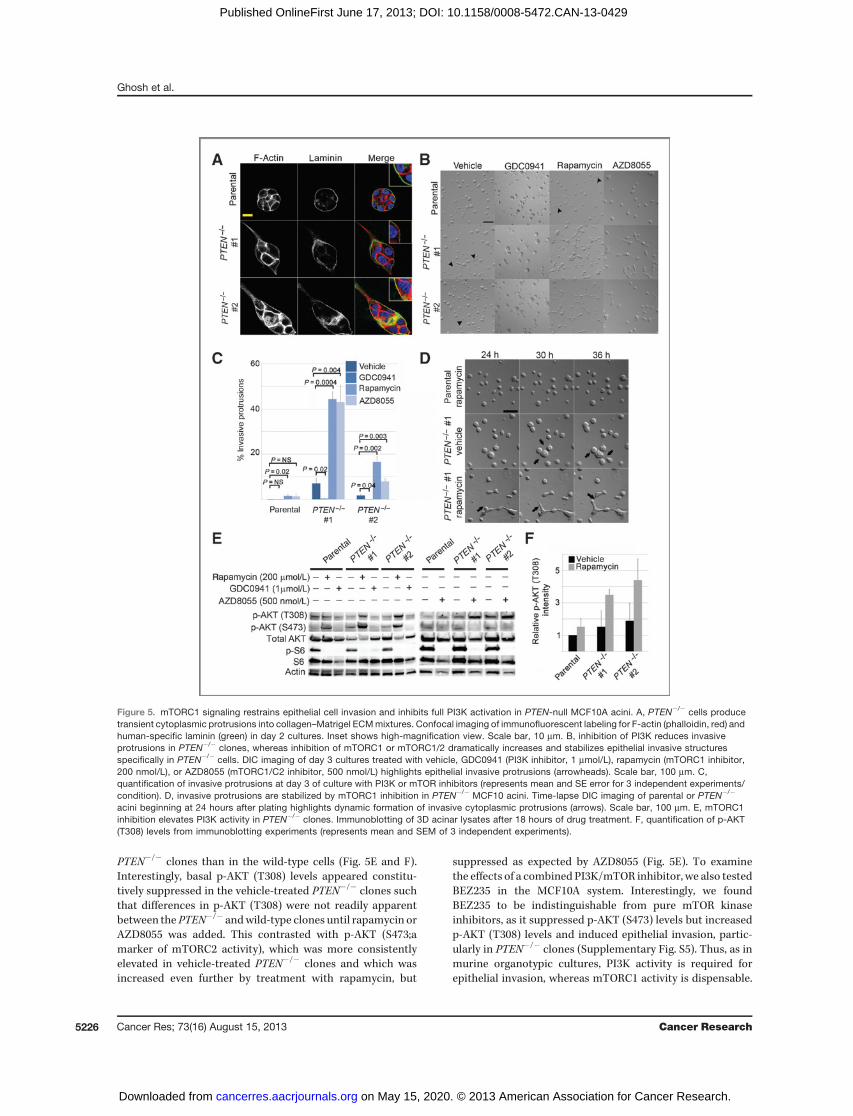
PTEN�/� clones than in the wild-type cells (Fig. 5E and F).Interestingly, basal p-AKT (T308) levels appeared constitu-tively suppressed in the vehicle-treated PTEN�/� clones suchthat differences in p-AKT (T308) were not readily apparentbetween the PTEN�/� andwild-type clones until rapamycin orAZD8055 was added. This contrasted with p-AKT (S473;amarker of mTORC2 activity), which was more consistentlyelevated in vehicle-treated PTEN�/� clones and which wasincreased even further by treatment with rapamycin, but
suppressed as expected by AZD8055 (Fig. 5E). To examinethe effects of a combined PI3K/mTOR inhibitor, we also testedBEZ235 in the MCF10A system. Interestingly, we foundBEZ235 to be indistinguishable from pure mTOR kinaseinhibitors, as it suppressed p-AKT (S473) levels but increasedp-AKT (T308) levels and induced epithelial invasion, partic-ularly in PTEN�/� clones (Supplementary Fig. S5). Thus, as inmurine organotypic cultures, PI3K activity is required forepithelial invasion, whereas mTORC1 activity is dispensable.
Figure 5. mTORC1 signaling restrains epithelial cell invasion and inhibits full PI3K activation in PTEN-null MCF10A acini. A, PTEN�/� cells producetransient cytoplasmic protrusions into collagen–Matrigel ECMmixtures. Confocal imaging of immunofluorescent labeling for F-actin (phalloidin, red) andhuman-specific laminin (green) in day 2 cultures. Inset shows high-magnification view. Scale bar, 10 mm. B, inhibition of PI3K reduces invasiveprotrusions in PTEN�/� clones, whereas inhibition of mTORC1 or mTORC1/2 dramatically increases and stabilizes epithelial invasive structuresspecifically in PTEN�/� cells. DIC imaging of day 3 cultures treated with vehicle, GDC0941 (PI3K inhibitor, 1 mmol/L), rapamycin (mTORC1 inhibitor,200 nmol/L), or AZD8055 (mTORC1/C2 inhibitor, 500 nmol/L) highlights epithelial invasive protrusions (arrowheads). Scale bar, 100 mm. C,quantification of invasive protrusions at day 3 of culture with PI3K or mTOR inhibitors (represents mean and SE error for 3 independent experiments/condition). D, invasive protrusions are stabilized by mTORC1 inhibition in PTEN�/� MCF10 acini. Time-lapse DIC imaging of parental or PTEN�/�
acini beginning at 24 hours after plating highlights dynamic formation of invasive cytoplasmic protrusions (arrows). Scale bar, 100 mm. E, mTORC1inhibition elevates PI3K activity in PTEN�/� clones. Immunoblotting of 3D acinar lysates after 18 hours of drug treatment. F, quantification of p-AKT(T308) levels from immunoblotting experiments (represents mean and SEM of 3 independent experiments).
Ghosh et al.
Cancer Res; 73(16) August 15, 2013 Cancer Research5226
on May 15, 2020. © 2013 American Association for Cancer Research. cancerres.aacrjournals.org Downloaded from
Published OnlineFirst June 17, 2013; DOI: 10.1158/0008-5472.CAN-13-0429
In both systems, mTORC1 inhibition relieves constitutivesuppression of PI3K activity in PTEN�/� cells and the resultantincrease in PI3K activity correlates with a striking increase inepithelial invasion in this setting.mTORC1 signaling downstream of PTEN loss feeds back to
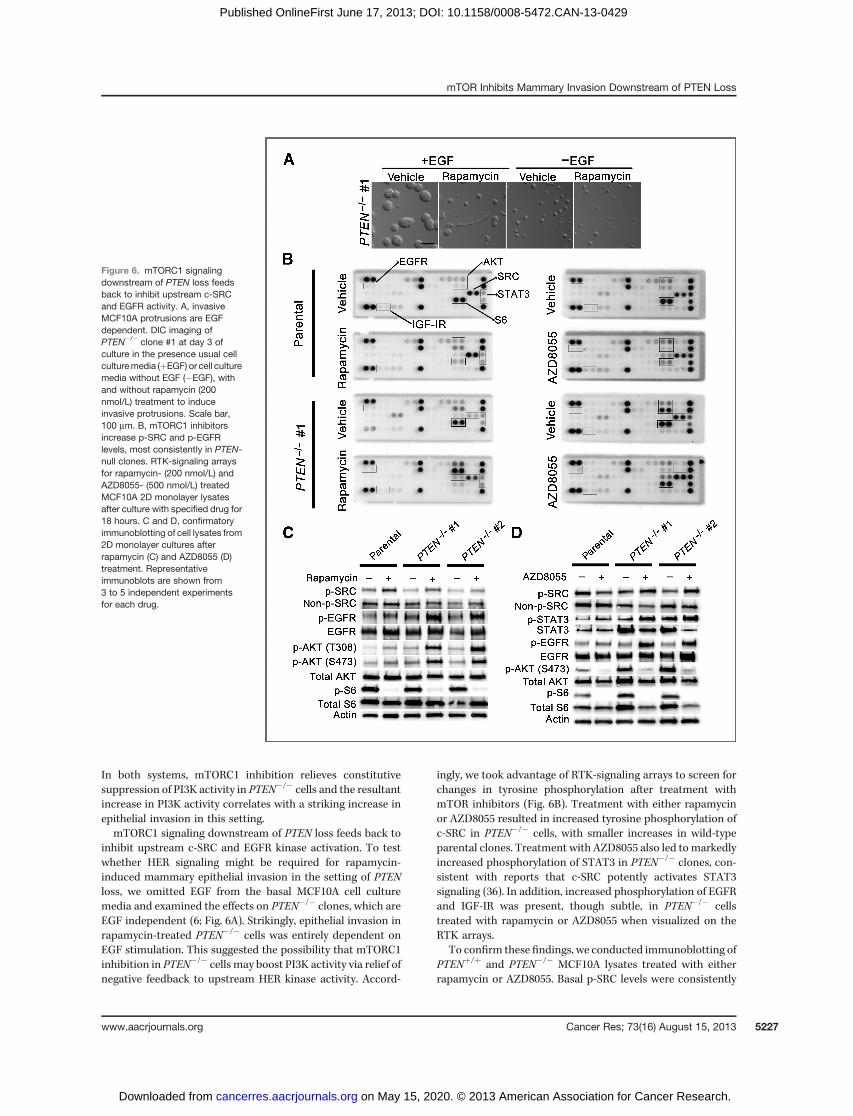
inhibit upstream c-SRC and EGFR kinase activation. To testwhether HER signaling might be required for rapamycin-induced mammary epithelial invasion in the setting of PTENloss, we omitted EGF from the basal MCF10A cell culturemedia and examined the effects on PTEN�/� clones, which areEGF independent (6; Fig. 6A). Strikingly, epithelial invasion inrapamycin-treated PTEN�/� cells was entirely dependent onEGF stimulation. This suggested the possibility that mTORC1inhibition in PTEN�/� cells may boost PI3K activity via relief ofnegative feedback to upstream HER kinase activity. Accord-
ingly, we took advantage of RTK-signaling arrays to screen forchanges in tyrosine phosphorylation after treatment withmTOR inhibitors (Fig. 6B). Treatment with either rapamycinor AZD8055 resulted in increased tyrosine phosphorylation ofc-SRC in PTEN�/� cells, with smaller increases in wild-typeparental clones. Treatment with AZD8055 also led tomarkedlyincreased phosphorylation of STAT3 in PTEN�/� clones, con-sistent with reports that c-SRC potently activates STAT3signaling (36). In addition, increased phosphorylation of EGFRand IGF-IR was present, though subtle, in PTEN�/� cellstreated with rapamycin or AZD8055 when visualized on theRTK arrays.
To confirm these findings, we conducted immunoblotting ofPTENþ/þ and PTEN�/� MCF10A lysates treated with eitherrapamycin or AZD8055. Basal p-SRC levels were consistently
Figure 6. mTORC1 signalingdownstream of PTEN loss feedsback to inhibit upstream c-SRCand EGFR activity. A, invasiveMCF10A protrusions are EGFdependent. DIC imaging ofPTEN�/� clone #1 at day 3 ofculture in the presence usual cellculturemedia (þEGF) or cell culturemedia without EGF (�EGF), withand without rapamycin (200nmol/L) treatment to induceinvasive protrusions. Scale bar,100 mm. B, mTORC1 inhibitorsincrease p-SRC and p-EGFRlevels, most consistently in PTEN-null clones. RTK-signaling arraysfor rapamycin- (200 nmol/L) andAZD8055- (500 nmol/L) treatedMCF10A 2D monolayer lysatesafter culture with specified drug for18 hours. C and D, confirmatoryimmunoblotting of cell lysates from2D monolayer cultures afterrapamycin (C) and AZD8055 (D)treatment. Representativeimmunoblots are shown from3 to 5 independent experimentsfor each drug.
mTOR Inhibits Mammary Invasion Downstream of PTEN Loss
www.aacrjournals.org Cancer Res; 73(16) August 15, 2013 5227
on May 15, 2020. © 2013 American Association for Cancer Research. cancerres.aacrjournals.org Downloaded from
Published OnlineFirst June 17, 2013; DOI: 10.1158/0008-5472.CAN-13-0429
mildly suppressed in PTEN�/� cells compared with parentalwild-type cells, (Fig. 6C and D) and treatment with eithermTOR inhibitor markedly upregulated SRC Y416 phosphory-lation consistently in the context of PTEN loss (Fig. 6C and D).In addition, treatment with either inhibitor increased EGFRautophosphorylation. Total levels of EGFR were inconsistentlyincreased following rapamycin treatment as well. Again, thisactivation was more prominent in PTEN�/� cells, although incontrast to SRC, basal EGFR activation was not appreciablydecreased with PTEN loss. No consistent changes were seen inphospho- or total HER2 or HER3 levels in response to mTORinhibitor treatment (data not shown). Taken together, thesedata indicate that mTOR inhibition in PTEN�/� cells activatesupstream c-SRC and EGFR signaling and is associated withincreased PI3K activity and acinar invasion.
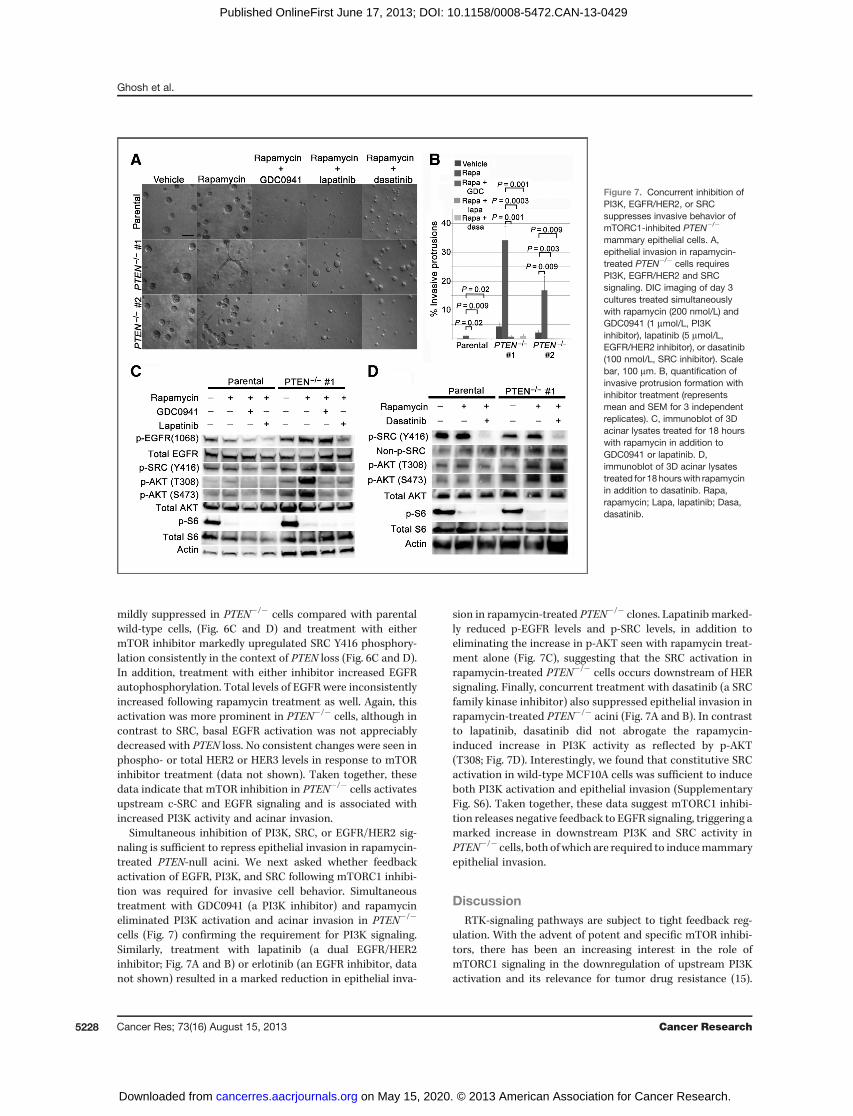
Simultaneous inhibition of PI3K, SRC, or EGFR/HER2 sig-naling is sufficient to repress epithelial invasion in rapamycin-treated PTEN-null acini. We next asked whether feedbackactivation of EGFR, PI3K, and SRC following mTORC1 inhibi-tion was required for invasive cell behavior. Simultaneoustreatment with GDC0941 (a PI3K inhibitor) and rapamycineliminated PI3K activation and acinar invasion in PTEN�/�
cells (Fig. 7) confirming the requirement for PI3K signaling.Similarly, treatment with lapatinib (a dual EGFR/HER2inhibitor; Fig. 7A and B) or erlotinib (an EGFR inhibitor, datanot shown) resulted in a marked reduction in epithelial inva-
sion in rapamycin-treated PTEN�/� clones. Lapatinib marked-ly reduced p-EGFR levels and p-SRC levels, in addition toeliminating the increase in p-AKT seen with rapamycin treat-ment alone (Fig. 7C), suggesting that the SRC activation inrapamycin-treated PTEN�/� cells occurs downstream of HERsignaling. Finally, concurrent treatment with dasatinib (a SRCfamily kinase inhibitor) also suppressed epithelial invasion inrapamycin-treated PTEN�/� acini (Fig. 7A and B). In contrastto lapatinib, dasatinib did not abrogate the rapamycin-induced increase in PI3K activity as reflected by p-AKT(T308; Fig. 7D). Interestingly, we found that constitutive SRCactivation in wild-type MCF10A cells was sufficient to induceboth PI3K activation and epithelial invasion (SupplementaryFig. S6). Taken together, these data suggest mTORC1 inhibi-tion releases negative feedback to EGFR signaling, triggering amarked increase in downstream PI3K and SRC activity inPTEN�/� cells, both ofwhich are required to inducemammaryepithelial invasion.
DiscussionRTK-signaling pathways are subject to tight feedback reg-
ulation. With the advent of potent and specific mTOR inhibi-tors, there has been an increasing interest in the role ofmTORC1 signaling in the downregulation of upstream PI3Kactivation and its relevance for tumor drug resistance (15).
Figure 7. Concurrent inhibition ofPI3K, EGFR/HER2, or SRCsuppresses invasive behavior ofmTORC1-inhibited PTEN�/�
mammary epithelial cells. A,epithelial invasion in rapamycin-treated PTEN�/� cells requiresPI3K, EGFR/HER2 and SRCsignaling. DIC imaging of day 3cultures treated simultaneouslywith rapamycin (200 nmol/L) andGDC0941 (1 mmol/L, PI3Kinhibitor), lapatinib (5 mmol/L,EGFR/HER2 inhibitor), or dasatinib(100 nmol/L, SRC inhibitor). Scalebar, 100 mm. B, quantification ofinvasive protrusion formation withinhibitor treatment (representsmean and SEM for 3 independentreplicates). C, immunoblot of 3Dacinar lysates treated for 18 hourswith rapamycin in addition toGDC0941 or lapatinib. D,immunoblot of 3D acinar lysatestreated for 18 hourswith rapamycinin addition to dasatinib. Rapa,rapamycin; Lapa, lapatinib; Dasa,dasatinib.
Ghosh et al.
Cancer Res; 73(16) August 15, 2013 Cancer Research5228
on May 15, 2020. © 2013 American Association for Cancer Research. cancerres.aacrjournals.org Downloaded from
Published OnlineFirst June 17, 2013; DOI: 10.1158/0008-5472.CAN-13-0429
Solid tumors have been largely resistant to rapalog mono-therapy, and many show increased PI3K and MAPK activityfollowing mTORC1 inhibition (12, 37). Early studies conductedpredominantly in MEFs pinpointed S6K activity downstreamofmTORC1 activation as responsible for this negative feedbackvia destabilization of IRS-docking proteins and inhibition ofIR/IGFR signaling (9, 10). In addition to this early work inmesenchymal cells, recent work in epithelial cancer cell lineshas also highlighted an important role for mTORC1-mediatedinhibition of HER signaling. Studies of combined PI3K/mTORinhibitors (BEZ235), PI3K inhibitors (XL147), AKT inhibitors(AKTi), and mTOR kinase inhibitors (AZD8055) in epithelialcancer cell lines have all shown resistance that coincides withincreased PI3K and MAPK activity and a correspondingincrease in HER levels and activity, although the mechanismsinvolved have not been entirely worked out (18, 21–23, 38).A common theme emerging from these data is that signaling
feedback allows cells to maintain a remarkably highly regu-lated signaling network, even in the presence of apparentlydysregulating mutations (16). Accordingly, targeted therapeu-tics aimed at suppressing a specific oncogenic signaling eventmay have the paradoxical effect of unmasking upstream RTKactivity. For example, oncogenic RAS desensitizes upstreamHER signaling and relief of this negative feedback via depletionof oncogenic RAS has the paradoxical effect of hyperactivatingEGFR and wild-type RAS (39). Similarly, BRAF(V600E)-activat-ing mutations suppress EGFR signaling (40, 41) and tumortypes that respond to this signaling (colon cancers) are resis-tant to a BRAF-mutant–specific inhibitor in contrast to mel-anomas, which express less EGFR (42). Thus understanding therole of signaling feedback in a specific genetic and cellularcontext is critical to the success of targeted therapeutics.Our study is the first to show that the effects of mTOR-
mediated feedback may be specifically modulated by PTENstatus in the mammary epithelium. In fact, because PTEN lossresults in net increased basal PI3K activity, the assumption hasbeen that this genetic alteration may obviate any effects ofsignaling feedback (43). Here, quite to the contrary, we haveshown thatmTORC1 activity plays a critical role in suppressingmaximal PI3K signaling specifically in the setting of PTEN loss.Indeed, in PTEN-null MCF10A cells, p-AKT (T308) levels werenot markedly elevated compared with wild-type cells untilrapamycin was added, in large part because mTORC1 inhibi-tionmore dramatically increasedp-AKT (T308) in thePTEN�/�
cells (Fig. 5F). These data suggest that even in the context oflong-term PTEN loss, mammary cells engage mTORC1-depen-dent homeostatic mechanisms to partially normalize PI3Kactivity.One such potential mechanism is mTORC1-mediated feed-
back regulation of upstream RTK activity. In this model,mTORC1 inhibition boosts upstream RTK signaling, leadingto increased PI3K recruitment, but in the wild-type setting,downstream PIP3 levels and AKT activation are largely held incheck by intact PTEN activity. In PTEN�/� cells treated withmTORC1 inhibitors, the combination of elevated RTK activityand PTEN loss leads to unfettered PI3K activity, culminating inmarked downstream AKT activation. Accordingly, in theMCF10A system, treatment of PTEN�/� cells with rapamycin
or anmTORkinase inhibitor resulted inmarked SRC andEGFRphosphorylation, and correlated tightly with increased down-stream effector activity, including p-AKT and p-STAT3. Fur-thermore, pharmacologic blockade of EGFR/HER2 signalingrestrained this rapamycin-induced EGFR/SRC/p-AKT activity.
However, in the context of PTEN loss, as in prior studies ofHER2-expressing cancer cells, the precise molecular mecha-nism by which mTORC1 inhibition augments upstream EGFRsignaling remains to be discovered. AKT inhibition has beenreported to increase basal HER levels in cancer cells (viaincreased FOXO transcription; 21–23). However, FOXO-medi-ated transcription is likely decreased after mTORC1 inhibitortreatment due to signaling feedback, which boosts AKT activ-ity. Thoughwe did observe a small (but not entirely consistent)increase in total EGFR in MCF10A cells following rapamycintreatment (Fig. 6), the increase in p-EGFR was much morerobust. In addition, HER2 and HER3 total levels and phos-phorylation were not affected by rapamycin treatment in theMCF10A system (Fig. 6, data not shown). We are the first toreport an increase in SRC activity with mTORC1 inhibitortreatment and intriguingly SRC phosphorylates and transacti-vates EGFR (44), raising the question ofwhether SRC activationmay itself provide a potential mechanism for increased EGFRphosphorylation in the setting of mTORC1 inhibition. Indeed,at least one prior study has shown that rapamycin treatmentincreases SRC phosphorylation and results in EGFR transacti-vation in the absence of growth factor (45). However, it seemsthat SRC is activated downstream of EGFR in the MCF10Asystem, as treatment with HER inhibitor lapatinib was suffi-cient to completely abolish SRC and PI3K activation in rapa-mycin-treated PTEN�/� cells. Similarly, although SRC is suf-ficient to activate PI3K signaling (as observed with inducible v-SRC expression, Supplementary Fig. S6), SRC inhibition withdasatinib did not abolish feedback activation of EGFR or PI3K(Fig. 7D, data not shown). Thus, in our model, mTORC1inhibition releases negative feedback to upstream EGFR phos-phorylation, resulting independently in increased downstreamSRC activation and PI3K activation.
Perhaps the most novel finding in the current study is thatmTORC1-mediated signaling feedback modulates cell beha-viors, specifically in the context ofPTEN loss. Until now, studiesof negative feedback regulation of oncogenic signaling path-ways have focused on the implications for signal transductionand proliferation in 2D cell line monolayers or xenografts(18, 21, 22). Here, in two independent 3D culture systems, wefound that mTORC1 feedback is critical for restraining growthfactor-induced mammary epithelial cell invasion in the settingof PTEN loss. It is important to note that the two benignmodelsystems we used herein are quite divergent in terms of speciesderivation, differentiation, and mode of cellular invasion used.It does seem that the murine organoid system requires auto-cine/paracrine HER signaling for invasive budding down-stream of FGF2 stimulation, providing an intriguing linkbetween the HER-mediated suppression of invasion seen inthe MCF10A system and the FGF2-dependent organoid sys-tem. However, many distinctions between the two systems dolikely underlie some of the important differences we observed,for example, PTEN loss by itself in the organoid system
mTOR Inhibits Mammary Invasion Downstream of PTEN Loss
www.aacrjournals.org Cancer Res; 73(16) August 15, 2013 5229
on May 15, 2020. © 2013 American Association for Cancer Research. cancerres.aacrjournals.org Downloaded from
Published OnlineFirst June 17, 2013; DOI: 10.1158/0008-5472.CAN-13-0429
suppresses invasion, whereas a modest increase in invasivepotential is seen in the MCF10A system. Despite these limita-tions, the similar effect of mTORC1-mediated feedback onPTEN�/� cell invasion in each is compelling: In the bilayeredmurine organotypic culture system, mTORC1 signaling wasboth necessary and sufficient to suppress nonprotrusive, col-lective luminal epithelial invasion in response to FGF2. Sim-ilarly, in the MCF10A system with PTEN loss, mTORC1 inhi-bition potently induced protrusive, single cell epithelial inva-sion into the surrounding ECM in response to EGF stimulation.Ultimately, the similarfindings in each systemare suggestive ofthe potentially highly conserved role of mTORC1-mediatedsignaling feedback in modulating cell behavior.
Just as mTORC1-mediated feedback to upstream HERsignaling regulates epithelial invasion in mammary epithe-lial cells, we found that mTORC1 also interfaces with hor-mone receptor signaling pathways. Somewhat surprisingly,we found that even short-term PTEN loss was sufficient todramatically decrease nuclear ER levels and increase basal-type keratin expression in murine organotypic cultures,potentially interrelated differentiation events dependent onmTORC1 activation. In addition, we found that in theabsence of PTEN loss, mTORC1 signaling upregulation viaTSC1 loss was necessary and sufficient to repress nuclearER levels. These findings are reminiscent of recent reportsthat PI3K/mTOR signaling can repress AR levels and sig-naling in PTEN-null murine and human prostate tissues (19,20). Given our findings in the MCF10A system, it is ofparticular interest that PI3K/mTOR may mediate this feed-back to AR in the prostate via downregulation of HER kinasesignaling (19).
Ultimately, additional studies of the role of mTORC1 sup-pression in modulating hormone and growth factor receptorresponsiveness in the specific setting of PTEN-null humantumorswill be necessary to substantiate ourfindings. Althoughrapalogs have long been known to be ineffective as mono-therapies in most settings, mTOR kinase inhibitors wereoriginally proposed as potentially effective alternatives assimultaneous suppression of mTORC2 partially inactivatesAKT, thus mitigating the effects of relief of PI3K signalingfeedback (15). Here, we have shown that rapamycin andmTOR
kinase inhibitors both relieve feedback to upstream tyrosinekinase activity resulting in downstream AKT activation, spe-cifically in the setting of PTEN loss. These signaling effects areconsistent with a recent cancer cell line study (18) and com-bined with our finding that this signaling correlates withincreased epithelial invasion, suggest the novel possibility thatmTOR kinase monotherapies may not only be ineffective, butpotentially even detrimental in tumors with aberrantly acti-vated PI3K signaling. Clearly, additional studies to directlyaddress this hypothesis in malignant systems with PTEN lossare necessary andmay further elucidate the importance of thiscritical signaling feedback pathway.
Disclosure of Potential Conflicts of InterestB.H. Park is a consultant/advisory board member in Horizon Discovery and
GlaxoSmithKline. No potential conflicts of interest were disclosed by the otherauthors.
Authors' ContributionsConception and design: S. Ghosh, T.L. LotanDevelopment of methodology: S. Ghosh, A. Sood, T.L. LotanAcquisition of data (provided animals, acquired and managed patients,provided facilities, etc.): S. Ghosh, L. Varela, A. SoodAnalysis and interpretation of data (e.g., statistical analysis, biostatistics,computational analysis): S. Ghosh, L. Varela, A. Sood, T.L. LotanWriting, review, and/or revision of themanuscript: S. Ghosh, B.H. Park, T.L.LotanAdministrative, technical, or material support (i.e., reporting or orga-nizing data, constructing databases): L. Varela, A. SoodStudy supervision: T.L. Lotan
AcknowledgmentsThe authors thankAndrewEwald for advice and helpful discussions regarding
the murine organoid system.
Grant SupportFunding for this research was provided in part by the Safeway Breast Cancer
Research Fund at Johns Hopkins (T.L. Lotan) and an HHMI Early CareerPhysician Scientist Award (T.L. Lotan). In addition, this research used coreresources provided by the National Cancer Institute (NCI) Cancer CenterSupport Grant (CCSG) grant (P30 CA006973).
The costs of publication of this article were defrayed in part by the payment ofpage charges. This article must therefore be hereby marked advertisement inaccordance with 18 U.S.C. Section 1734 solely to indicate this fact.
Received February 8, 2013; revised May 2, 2013; accepted June 3, 2013;published OnlineFirst June 17, 2013.
References1. Wickenden JA, Watson CJ. Key signalling nodes in mammary gland
development and cancer. Signalling downstream of PI3 kinase inmammary epithelium: a play in 3 akts. Breast Cancer Res 2010;12:202.
2. Tan MH, Mester JL, Ngeow J, Rybicki LA, Orloff MS, Eng C. Lifetimecancer risks in individuals with germline PTEN mutations. Clin CancerRes 2012;18:400–7.
3. Yamada KM, Araki M. Tumor suppressor PTEN: modulator of cellsignaling, growth, migration and apoptosis. J Cell Sci 2001;114:2375–82.
4. Saal LH, Gruvberger-Saal SK, Persson C, L€ovgren K, Jumppanen M,Staaf J, et al. Recurrent grossmutations of thePTEN tumor suppressorgene in breast cancers with deficient DSB repair. Nat Genet 2008;40:102–7.
5. Shoman N, Klassen S, McFadden A, Bickis MG, Torlakovic E, ChibbarR. Reduced PTEN expression predicts relapse in patients with breastcarcinoma treated by tamoxifen. Mod Pathol 2005;18:250–9.
6. Vitolo MI, Weiss MB, Szmacinski M, Tahir K, Waldman T, Park BH,et al. Deletion of PTEN promotes tumorigenic signaling, resis-tance to anoikis, and altered response to chemotherapeuticagents in human mammary epithelial cells. Cancer Res 2009;69:8275–83.
7. Nagata Y, Lan KH, Zhou X, Tan M, Esteva FJ, Sahin AA, et al. PTENactivation contributes to tumor inhibition by trastuzumab, and loss ofPTEN predicts trastuzumab resistance in patients. Cancer Cell 2004;6:117–27.
8. Berns K, Horlings HM, Hennessy BT, Madiredjo M, Hijmans EM,Beelen K, et al. A functional genetic approach identifies the PI3Kpathway as a major determinant of trastuzumab resistance in breastcancer. Cancer Cell 2007;12:395–402.
9. ShahOJ,Wang Z, Hunter T. Inappropriate activation of the TSC/Rheb/mTOR/S6K cassette induces IRS1/2 depletion, insulin resistance, andcell survival deficiencies. Curr Biol 2004;14:1650–6.
Ghosh et al.
Cancer Res; 73(16) August 15, 2013 Cancer Research5230
on May 15, 2020. © 2013 American Association for Cancer Research. cancerres.aacrjournals.org Downloaded from
Published OnlineFirst June 17, 2013; DOI: 10.1158/0008-5472.CAN-13-0429
10. Harrington LS, Findlay GM, Gray A, Tolkacheva T, Wigfield S, RebholzH, et al. The TSC1-2 tumor suppressor controls insulin-PI3K signalingvia regulation of IRS proteins. J Cell Biol 2004;166:213–23.
11. Zhang H, Bajraszewski N, Wu E, Wang H, Moseman AP, Dabora SL,et al. PDGFRs are critical for PI3K/Akt activation and negativelyregulated by mTOR. J Clin Invest 2007;117:730–8.
12. Carracedo A, Ma L, Teruya-Feldstein J, Rojo F, Salmena L, Alimonti A,et al. Inhibition of mTORC1 leads toMAPK pathway activation througha PI3K-dependent feedback loop in human cancer. J Clin Invest2008;118:3065–74.
13. Hsu PP, Kang SA, Rameseder J, Zhang Y, Ottina KA, Lim D, et al. ThemTOR-regulated phosphoproteome reveals a mechanism ofmTORC1-mediated inhibition of growth factor signaling. Science2011;332:1317–22.
14. Yu Y, Yoon SO, Poulogiannis G, Yang Q, Ma XM, Vill�en J, et al.Phosphoproteomic analysis identifiesGrb10 as anmTORC1substratethat negatively regulates insulin signaling. Science 2011;332:1322–6.
15. Guertin DA, Sabatini DM. Defining the role of mTOR in cancer. CancerCell 2007;12:9–22.
16. Chandarlapaty S. Negative feedback and adaptive resistance to thetargeted therapy of cancer. Cancer Discov 2012;2:311–9.
17. O'Reilly KE, Rojo F, She QB, Solit D, Mills GB, Smith D, et al. mTORinhibition induces upstream receptor tyrosine kinase signaling andactivates akt. Cancer Res 2006;66:1500–8.
18. Rodrik-Outmezguine VS,Chandarlapaty S, PaganoNC,PoulikakosPI,Scaltriti M,Moskatel E, et al. mTOR kinase inhibition causes feedback-dependent biphasic regulation of AKT signaling. Cancer Discov 2011;1:248–59.
19. Carver BS, Chapinski C, Wongvipat J, Hieronymus H, Chen Y, Chan-darlapaty S, et al. Reciprocal feedback regulation of PI3K and andro-gen receptor signaling in PTEN-deficient prostate cancer. Cancer Cell2011;19:575–86.
20. Mulholland DJ, Tran LM, Li Y, Cai H, Morim A, Wang S, et al. Cellautonomous role of PTEN in regulating castration-resistant prostatecancer growth. Cancer Cell 2011;19:792–804.
21. Serra V, Scaltriti M, Prudkin L, EichhornPJ, IbrahimYH,ChandarlapatyS, et al. PI3K inhibition results in enhancedHERsignaling and acquiredERK dependency in HER2-overexpressing breast cancer. Oncogene2011;30:2547–57.
22. Chandarlapaty S, Sawai A, Scaltriti M, Rodrik-Outmezguine V, Grbo-vic-Huezo O, Serra V, et al. AKT inhibition relieves feedback suppres-sion of receptor tyrosine kinase expression and activity. Cancer Cell2011;19:58–71.
23. Muranen T, Selfors LM,Worster DT, Iwanicki MP, Song L, Morales FC,et al. Inhibition of PI3K/mTOR leads to adaptive resistance in matrix-attached cancer cells. Cancer Cell 2012;21:227–39.
24. Badea TC, Wang Y, Nathans J. A noninvasive genetic/pharmacologicstrategy for visualizing cell morphology and clonal relationships in themouse. J Neurosci 2003;23:2314–22.
25. Lesche R, Groszer M, Gao J, Wang Y, Messing A, Sun H, et al. Cre/loxP-mediated inactivation of themurine pten tumor suppressor gene.Genesis 2002;32:148–9.
26. Muzumdar MD, Tasic B, Miyamichi K, Li L, Luo L. A global double-fluorescent cre reporter mouse. Genesis 2007;45:593–605.
27. Ghosh S, Lau H, Simons BW, Powell JD, Meyers DJ, De Marzo AM,et al. PI3K/mTOR signaling regulates prostatic branchingmorphogen-esis. Dev Biol 2011;360:329–42.
28. Kwiatkowski DJ, Zhang H, Bandura JL, Heiberger KM, Glogauer M, el-Hashemite N, et al. A mouse model of TSC1 reveals sex-dependentlethality from liver hemangiomas, and up-regulation of p70S6 kinaseactivity in Tsc1 null cells. Hum Mol Genet 2002;11:525–34.
29. Ewald AJ, Brenot A, Duong M, Chan BS, Werb Z. Collective epithelialmigration and cell rearrangements drive mammary branching mor-phogenesis. Dev Cell 2008;14:570–81.
30. Debnath J, Muthuswamy SK, Brugge JS. Morphogenesis and onco-genesis of MCF-10A mammary epithelial acini grown in three-dimen-sional basement membrane cultures. Methods 2003;30:256–68.
31. Zhan L, Xiang B, Muthuswamy SK. Controlled activation of ErbB1/ErbB2 heterodimers promote invasion of three-dimensional organizedepithelia in an ErbB1-dependent manner: implications for progressionof ErbB2-overexpressing tumors. Cancer Res 2006;66:5201–8.
32. Iliopoulos D, Hirsch HA, Struhl K. An epigenetic switch involving NF-kappaB, Lin28, let-7 MicroRNA, and IL6 links inflammation to celltransformation. Cell 2009;139:693–706.
33. SternlichtMD, SunnarborgSW,Kouros-MehrH, YuY, LeeDC,WerbZ.Mammary ductal morphogenesis requires paracrine activation of stro-mal EGFR via ADAM17-dependent shedding of epithelial amphiregu-lin. Development 2005;132:3923–33.
34. Maretzky T, Evers A, ZhouW, Swendeman SL,Wong PM, Rafii S, et al.Migration of growth factor-stimulated epithelial and endothelial cellsdepends on EGFR transactivation by ADAM17. Nat Commun 2011;2:229.
35. Martin-Belmonte F, Gassama A, Datta A, Yu W, Rescher U, Gerke V,et al. PTEN-mediated apical segregation of phosphoinositides con-trols epithelial morphogenesis through Cdc42. Cell 2007;128:383–97.
36. Silva CM. Role of STATs as downstream signal transducers in srcfamily kinase-mediated tumorigenesis. Oncogene 2004;23:8017–23.
37. Cloughesy TF, Yoshimoto K, Nghiemphu P, Brown K, Dang J, Zhu S,et al. Antitumor activity of rapamycin in a phase I trial for patients withrecurrent PTEN-deficient glioblastoma. PLoS Med 2008;5:e8.
38. Chakrabarty A, Sanchez V, Kuba MG, Rinehart C, Arteaga CL. Feed-back upregulation of HER3 (ErbB3) expression and activity attenuatesantitumor effect of PI3K inhibitors. Proc Natl Acad Sci U S A 2012;109:2718–23.
39. Young A, Lou D, McCormick F. Oncogenic and wild-type ras playdivergent roles in the regulation of mitogen-activated protein kinasesignaling. Cancer Discov 2012;31:112–23.
40. Prahallad A, Sun C, Huang S, Di Nicolantonio F, Salazar R, Zecchin D,et al. Unresponsiveness of colon cancer to BRAF(V600E) inhibitionthrough feedback activation of EGFR. Nature 2012;483:100–3.
41. Corcoran RB, Ebi H, Turke AB, Coffee EM, NishinoM, Cogdill AP, et al.EGFR-mediated re-activation of MAPK signaling contributes to insen-sitivity of BRAF mutant colorectal cancers to RAF inhibition withvemurafenib. Cancer Discov 2012;2:227–35.
42. Stites EC. The response of cancers to BRAF inhibition underscores theimportance of cancer systems biology. Sci Signal 2012;5:pe46.
43. Manning BD, Logsdon MN, Lipovsky AI, Abbott D, Kwiatkowski DJ,Cantley LC. Feedback inhibition of akt signaling limits the growth oftumors lacking Tsc2. Genes Dev 2005;19:1773–8.
44. Kim LC, Song L, Haura EB. Src kinases as therapeutic targets forcancer. Nat Rev Clin Oncol 2009;6:587–95.
45. Chaturvedi D, Gao X, Cohen MS, Taunton J, Patel TB. Rapamycininduces transactivation of the EGFR and increases cell survival.Oncogene 2009;28:1187–96.
mTOR Inhibits Mammary Invasion Downstream of PTEN Loss
www.aacrjournals.org Cancer Res; 73(16) August 15, 2013 5231
on May 15, 2020. © 2013 American Association for Cancer Research. cancerres.aacrjournals.org Downloaded from
Published OnlineFirst June 17, 2013; DOI: 10.1158/0008-5472.CAN-13-0429
2013;73:5218-5231. Published OnlineFirst June 17, 2013.Cancer Res Susmita Ghosh, Lidenys Varela, Akshay Sood, et al.
LossPTENDifferentiation and Restrains Invasion Downstream of mTOR Signaling Feedback Modulates Mammary Epithelial
Updated version
10.1158/0008-5472.CAN-13-0429doi:
Access the most recent version of this article at:
Material
Supplementary
http://cancerres.aacrjournals.org/content/suppl/2013/06/18/0008-5472.CAN-13-0429.DC1
Access the most recent supplemental material at:
Cited articles
http://cancerres.aacrjournals.org/content/73/16/5218.full#ref-list-1
This article cites 44 articles, 16 of which you can access for free at:
Citing articles
http://cancerres.aacrjournals.org/content/73/16/5218.full#related-urls
This article has been cited by 2 HighWire-hosted articles. Access the articles at:
E-mail alerts related to this article or journal.Sign up to receive free email-alerts
Subscriptions
Reprints and
To order reprints of this article or to subscribe to the journal, contact the AACR Publications Department at
Permissions
Rightslink site. Click on "Request Permissions" which will take you to the Copyright Clearance Center's (CCC)
.http://cancerres.aacrjournals.org/content/73/16/5218To request permission to re-use all or part of this article, use this link
on May 15, 2020. © 2013 American Association for Cancer Research. cancerres.aacrjournals.org Downloaded from
Published OnlineFirst June 17, 2013; DOI: 10.1158/0008-5472.CAN-13-0429