(MTH 250) Lecture 2 Calculus. Previous Lecture’s Summary Introduction. Purpose of Calculus. Axioms...
41
(MTH 250) Lecture 2 Calculus
-
Upload
elwin-hart -
Category
Documents
-
view
219 -
download
0
Transcript of (MTH 250) Lecture 2 Calculus. Previous Lecture’s Summary Introduction. Purpose of Calculus. Axioms...

(MTH 250)
Lecture 2
Calculus

Previous Lecture’s Summary
• Introduction.
• Purpose of Calculus.
• Axioms of Order.
• Absolute value.
• Archimedean Property.
• Axioms of Archimedean Field.
• Axiom of Completeness.
• Completeness of R.

Today's Lecture
• Functions
• Graph of functions
• Domain & range of functions
• Piecewise defined functions
• Increasing & decreasing functions
• Maxima & Minima
• Even & odd functions
• Translation, reflection and dilatation

FunctionsFunctions
• A function f from set A to set B is a rule of correspondence that assigns to each element x in set A exactly one element y in set B.
A B
• A is called the domain (or set of allowable inputs) of f• B is called the co-domain of f and contains • Range (or set of outputs) of f.
f
x y =f(x)
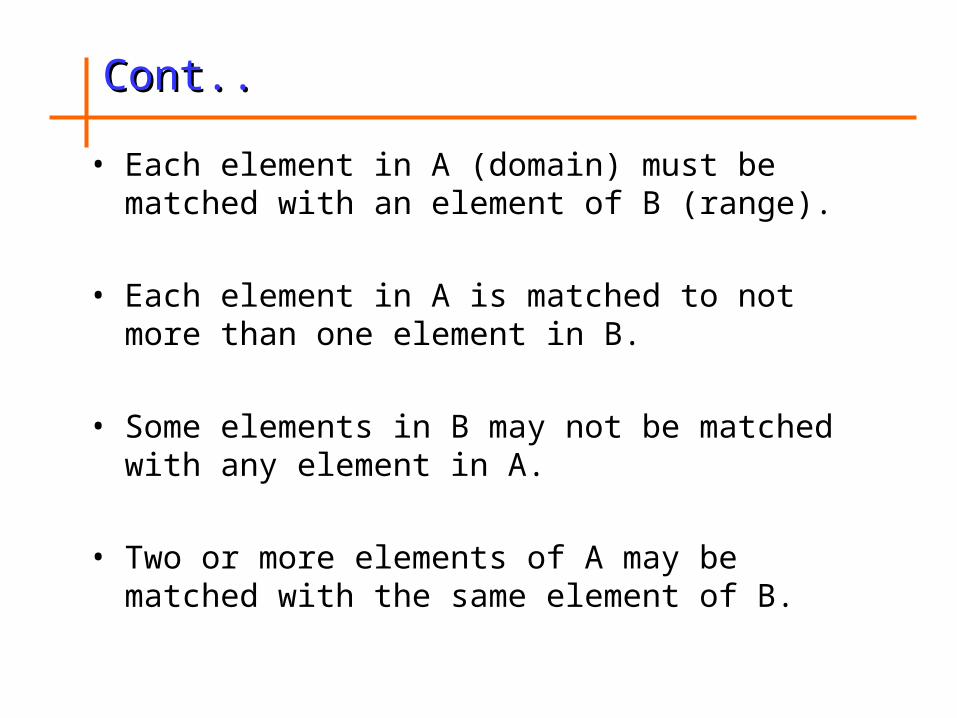
• Each element in A (domain) must be matched with an element of B (range).
• Each element in A is matched to not more than one element in B.
• Some elements in B may not be matched with any element in A.
• Two or more elements of A may be matched with the same element of B.
Cont..Cont..

ContCont.
• Functions
x
Domain
y1
y2
Range
f
y
Range
fx1
Domain
x2

• Not a function
Cont..Cont..
x
Domain
y1
y2
Range
f
y
Range
fx1
Domain
x2
Cont..Cont..
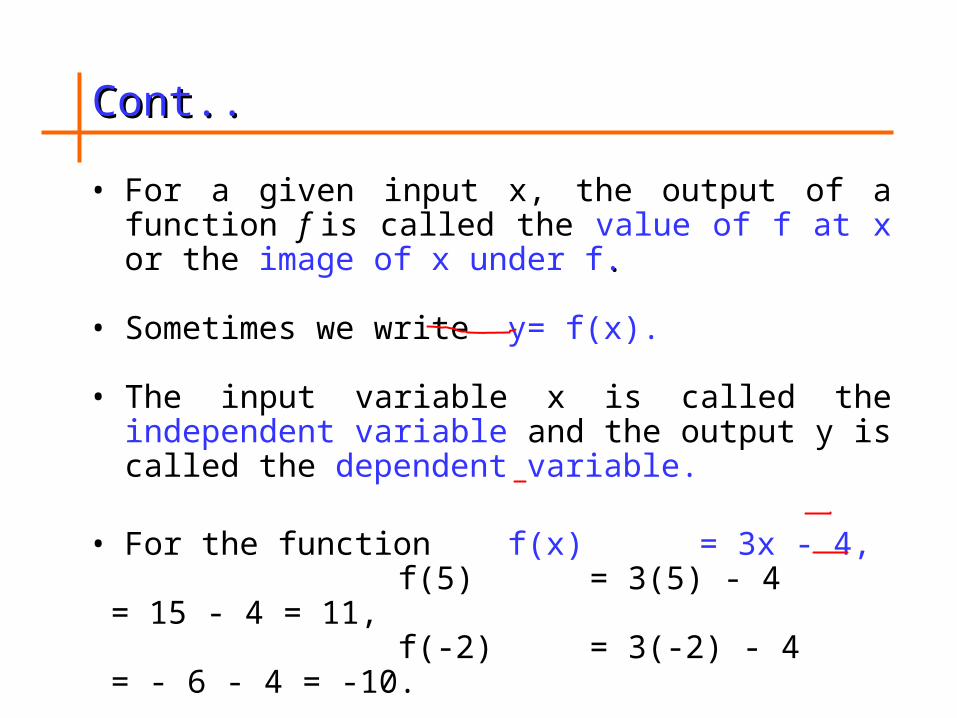
• For a given input x, the output of a function f is called the value of f at x or the image of x under f..
• Sometimes we write y= f(x).
• The input variable x is called the independent variable and the output y is called the dependent variable.
• For the function f(x) = 3x - 4, f(5) = 3(5) - 4 = 15 - 4 = 11, f(-2) = 3(-2) - 4 = - 6 - 4 = -10.
• We say, f of 5 is 11, and, f of -2 is -10.

Graph of Functions
• We call a function f as real-valued function of a real variable, if both independent and dependent variables are real numbers.
• The graph of a real-valued function f in the xy-plane is defined by the graph of equation y=f(x).
• The points on the graph of the function f(x) are of the form (x , f(x)) or (x , y) where y=f(x).

Cont.. Cont..
Graph of y = |x|
22
11
00
11
22
|x|x
Cont.. Cont..
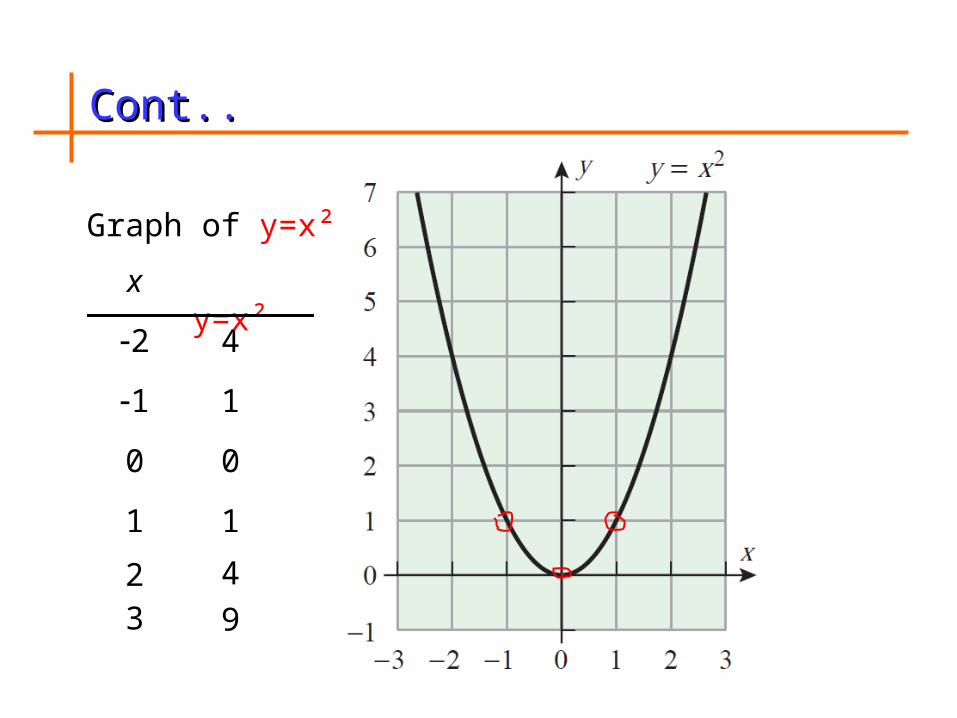
Graph of y=x²
4
93
11
00
11
42
y=x²x
2

Cont.. Cont..
Graph of
4
83
21
10
0.51
0.252
x
-4 -3 -2 -1 1 2 3 4 5
-30
-20
-10
10
20
30
x
yxy 2
2
xy 2
Cont.. Cont..
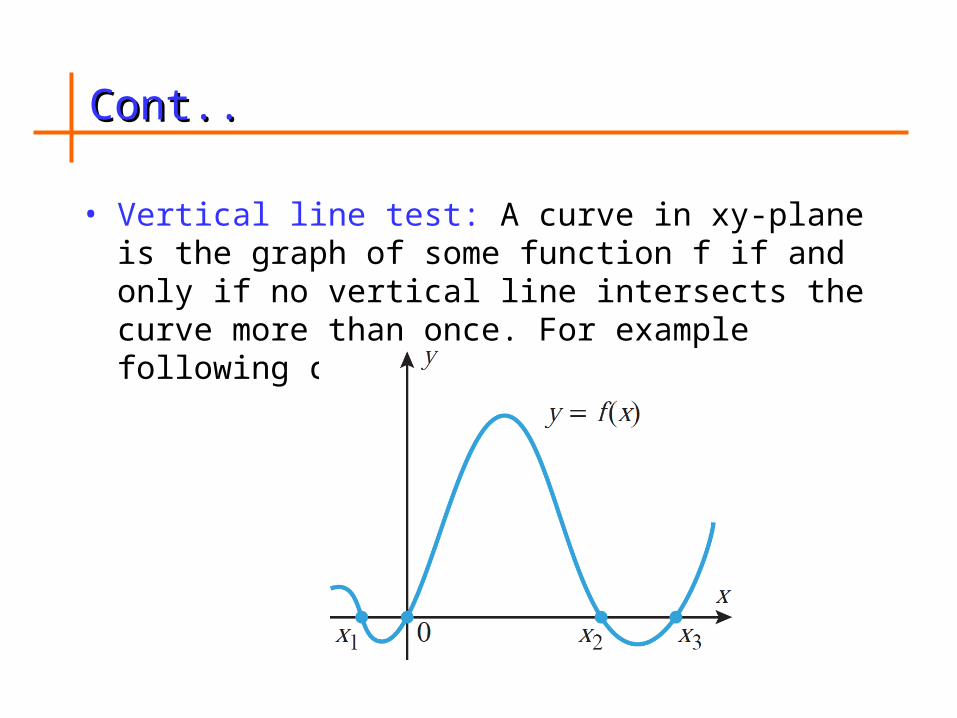
• Vertical line test: A curve in xy-plane is the graph of
some function f if and only if no vertical line intersects the curve more than once. For example following curve is a function

Domain & range of functionsDomain & range of functions
• Generally, the domain is implied to be the set of all real numbers that yield a real number functional value (in the range).
• Some restrictions to domain:
1. Denominator cannot equal zero.
2. Radicand must be greater than or equal to zero.
3. Practical problems may limit domain.

Cont..Cont..Finding the Range of a function:Draw a graph of the function for its given domain. The range is the set of values on the y-axis for which a horizontal line drawn through that point would cut the graph.

Cont..Cont..
f(x) = (x-2)2 +3, xR
The Range is f(x) ≥ 3 Range
Domain

Cont..Cont..
f(x) = 3 – 2x , xR
The Range is f(x) < 3.

Cont..Cont..

Piecewise defined functionsPiecewise defined functions
• A piecewise defined function is a function which assumes different values in different pieces (or parts).
• For example
01
012)( 2 xifx
xifxxf

Cont..Cont..

Cont..Cont..
f(x) = 3, for x 0
f(x)= 3+ x2, for 0< x 2
( ) 1 for 22
xf x x

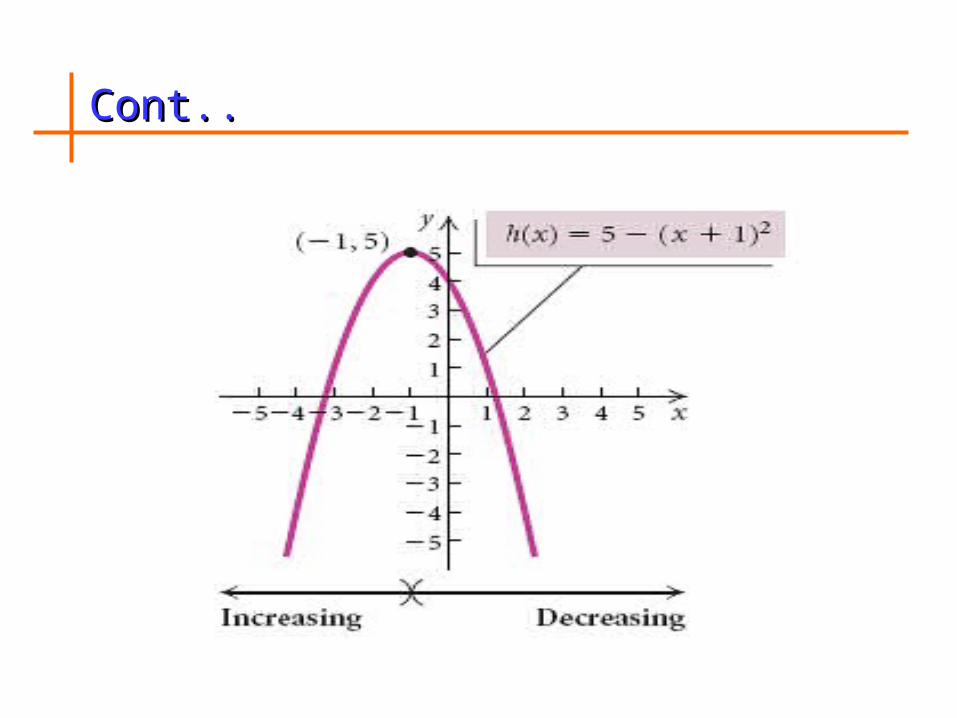
Increasing & Decreasing FunctionsIncreasing & Decreasing Functions
• Increasing: Graph goes “up” as you move from left to right.
• Decreasing: Graph goes “down” as you move from left to right.
• Constant: Graph remains horizontal as you move from left to right.
)()(, 2121 xfxfxx
)()(, 2121 xfxfxx
)()(, 2121 xfxfxx

Cont..Cont..
f(x) = 3, for x 0
f(x)= 3+ x2, for 0< x 2
( ) 1 for 22
xf x x
Cont..Cont..

Cont..Cont..
Exercise: Find the interval where y is increasing, decreasing or constant.

Maxima & minimaMaxima & minima
• Relative maximum is the point x where the function y= f(x) assume the maximum value over a given interval (has a peak)
• Relative minimum is the point x where the function y= f(x) assume its minimum value over a given interval (has a Valley)
• Global maximum is the point x where the function y= f(x) assume its overall maximum value through the domain.
• Global minimum is the point x where the function y= f(x) assume its overall minimum value through the domain.

Maxima & minimaMaxima & minima
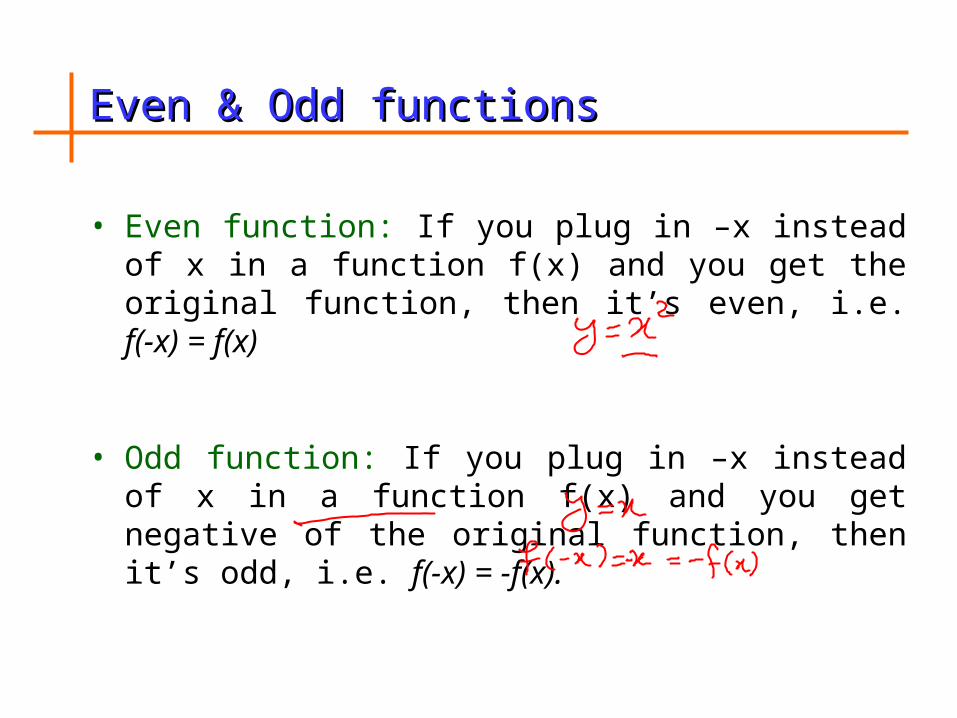
Even & Odd functionsEven & Odd functions
• Even function: If you plug in –x instead of x in a function f(x) and you get the original function, then it’s even, i.e. f(-x) = f(x)
• Odd function: If you plug in –x instead of x in a function f(x) and you get negative of the original function, then it’s odd, i.e. f(-x) = -f(x).
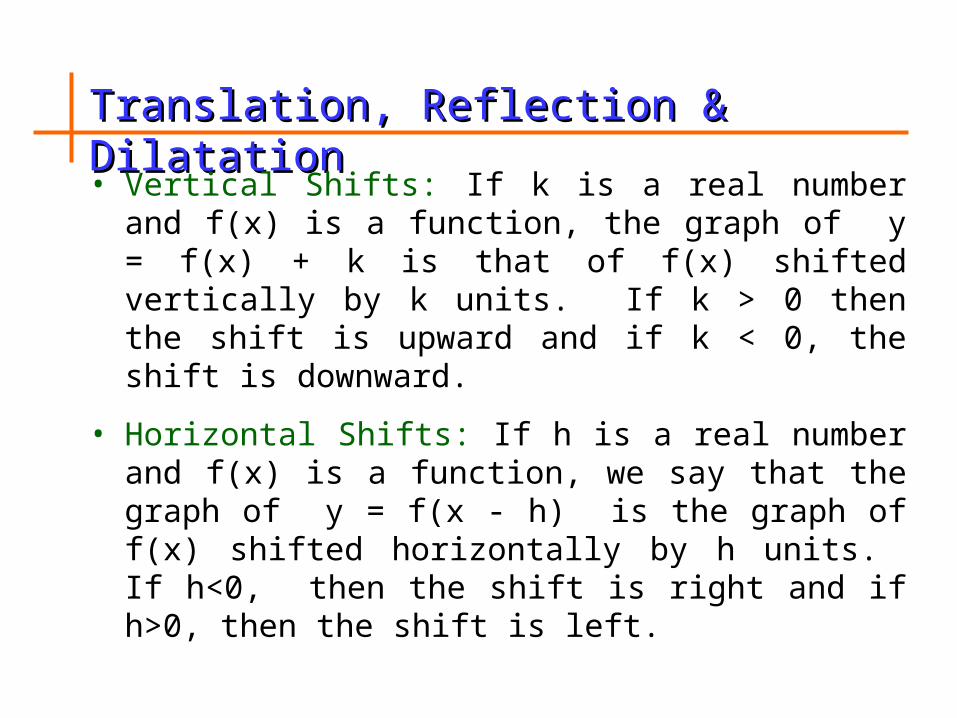
Translation, Reflection & DilatationTranslation, Reflection & Dilatation
• Vertical Shifts: If k is a real number and f(x) is a function, the graph of y = f(x) + k is that of f(x) shifted vertically by k units. If k > 0 then the shift is upward and if k < 0, the shift is downward.
• Horizontal Shifts: If h is a real number and f(x) is a function, we say that the graph of y = f(x - h) is the graph of f(x) shifted horizontally by h units. If h<0, then the shift is right and if h>0, then the shift is left.

Cont.. (vertical translations)Cont.. (vertical translations)
Graph y = |x|
22
11
00
11
22
|x|x

Cont.. (vertical translations)Cont.. (vertical translations)
Graph y = |x| - 1
122
011
-100
011122
|x| -1|x|x

Cont.. (vertical translations)Cont.. (vertical translations)
Graph y = |x| +2
422
311
200
311422
|x| +2|x|x

Cont.. (vertical translations)Cont.. (vertical translations)
y = 3x2
y = 3x2 – 3
y = 3x2 + 2

Cont.. (horizontal translations)Cont.. (horizontal translations)
y = 3x2
y = 3(x+2)2
y = 3(x-2)2
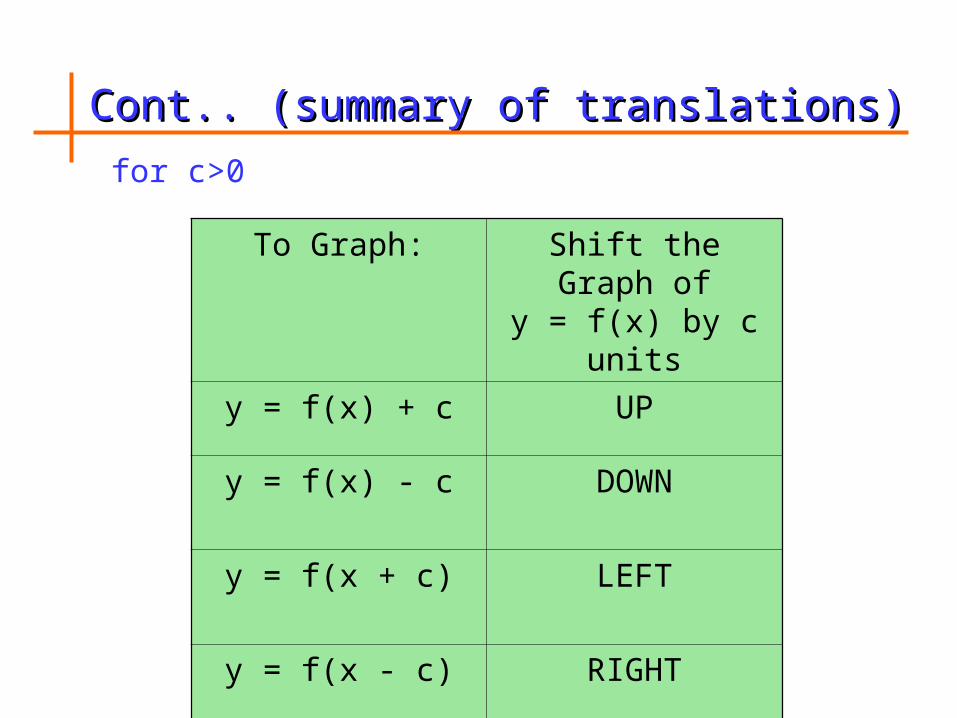
Cont.. (summary of translations)Cont.. (summary of translations)
for c>0
To Graph: Shift the Graph ofy = f(x) by c units
y = f(x) + c UP
y = f(x) - c DOWN
y = f(x + c) LEFT
y = f(x - c) RIGHT
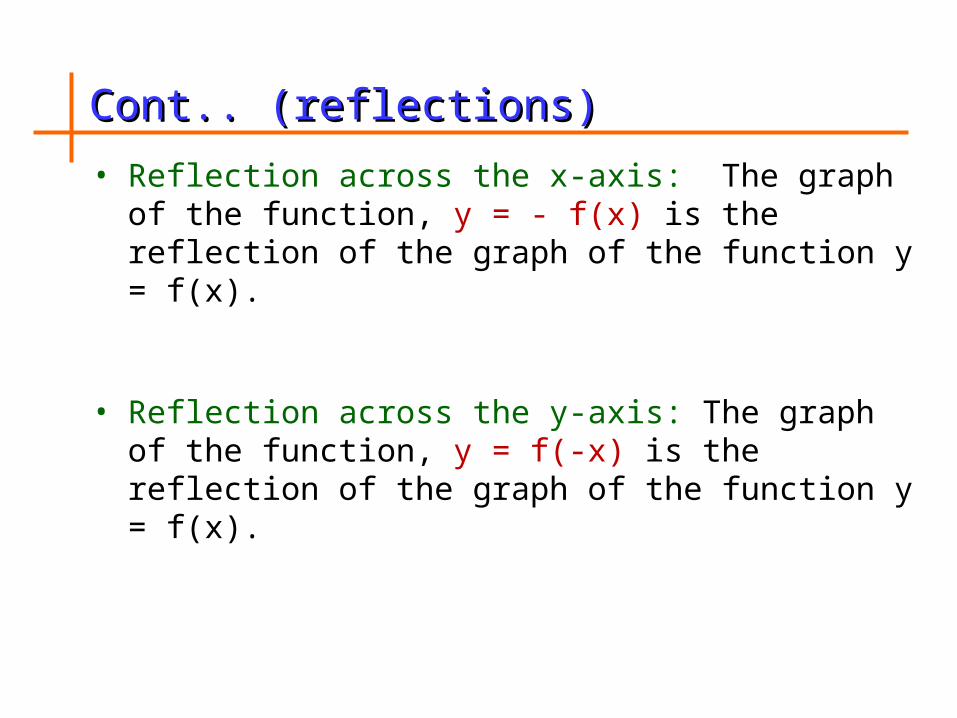
Cont.. (reflections)Cont.. (reflections)
• Reflection across the x-axis: The graph of the function, y = - f(x) is the reflection of the graph of the function y = f(x).
• Reflection across the y-axis: The graph of the function, y = f(-x) is the reflection of the graph of the function y = f(x).

Cont.. (reflections across x-axis)Cont.. (reflections across x-axis)
f(x) = x3
f(x) = -x3

Cont.. (reflections across y-axis)Cont.. (reflections across y-axis)
f(x) = x3
f(-x) = (-x)3 = -x3

Cont.. (stretching and shrinking)Cont.. (stretching and shrinking)
• Vertical Stretching and Shrinking: The graph of
y = af(x)
is obtained from the graph of y = f(x) by
1. stretching the graph of y = f ( x) by a when a > 1, or
2. shrinking the graph of y = f ( x) by a when 0 < a < 1.
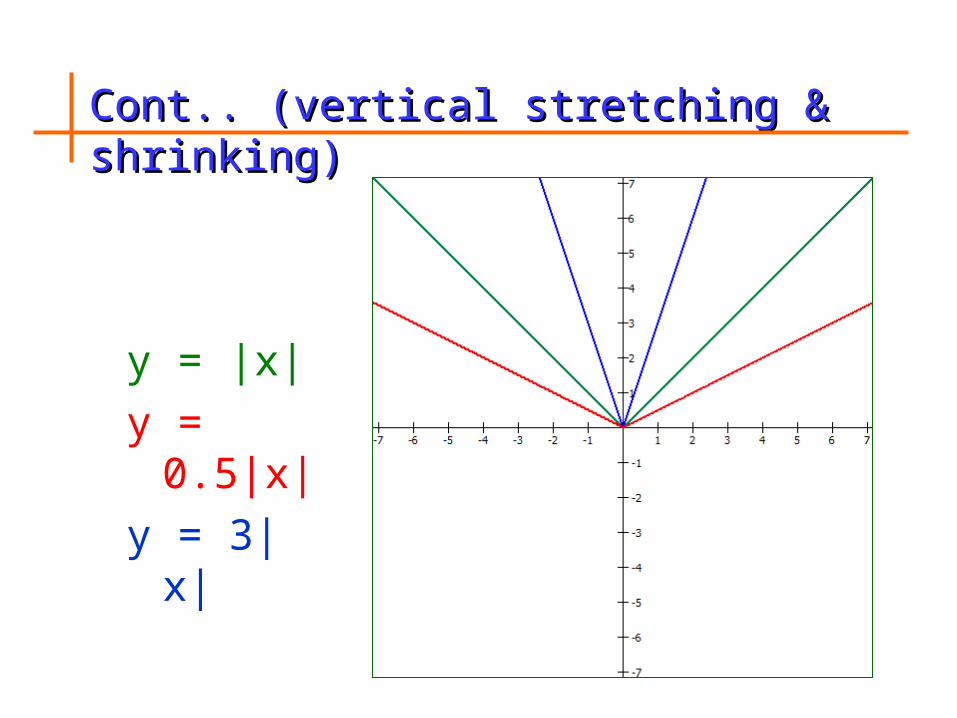
Cont.. (vertical stretching & shrinking)Cont.. (vertical stretching & shrinking)
y = |x|
y = 0.5|x|
y = 3|x|

Lecture Summary Lecture Summary
• Functions
• Graph of functions
• Domain & range of functions
• Piecewise defined functions
• Increasing & decreasing functions
• Maxima & Minima
• Even & odd functions
• Translation, reflection and dilatation