M.tech thesis
236
STUDY ON THE STRESS-STRAIN BEHAVIOUR OF HIGH STRENGTH GLASS FIBRE REINFORCED SELF-COMPACTING CONCRETE UNDER AXIAL COMPRESSION WITH & WITHOUT CONFINEMENT A DISSERTATION SUBMITTD IN PARTIAL FULFILLMENT OF THE REQUIREMENTS FOR THE AWARD OF THE DEGREE OF Master of Technology in Structural Engineering By B.VENKATARAJU (06014D2023) DEPARTMENT OF CIVIL ENGINEERING JNTUH COLLEGE OF ENGINEERING, KUKATPALLY HYDERABAD – 500085, AP, INDIA (AUTONOMOUS) MARCH – 2011
-
Upload
venkataraju-badanapuri -
Category
Education
-
view
813 -
download
8
Transcript of M.tech thesis
STUDY ON THE STRESS-STRAIN BEHAVIOUR OF HIGH STRENGTH GLASS FIBRE REINFORCED
SELF-COMPACTING CONCRETE UNDER AXIAL COMPRESSION WITH & WITHOUT
CONFINEMENT
A DISSERTATION SUBMITTD IN PARTIAL FULFILLMENT OF THE
REQUIREMENTS FOR THE AWARD OF THE DEGREE OF
Master of Technology in
Structural Engineering
By B.VENKATARAJU
(06014D2023)
DEPARTMENT OF CIVIL ENGINEERING JNTUH COLLEGE OF ENGINEERING, KUKATPALLY
HYDERABAD – 500085, AP, INDIA (AUTONOMOUS)
MARCH – 2011
STUDY ON THE STRESS-STRAIN BEHAVIOUR OF HIGH STRENGTH GLASS FIBRE REINFORCED
SELF-COMPACTING CONCRETE UNDER AXIAL COMPRESSION WITH & WITHOUT
CONFINEMENT
A DISSERTATION SUBMITTD IN PARTIAL FULFILLMENT OF THE
REQUIREMENTS FOR THE AWARD OF THE DEGREE OF
Master of Technology in
Structural Engineering
By B.VENKATARAJU
(06014D2023)
Under the guidance of
Dr.M.V.SESHAGIRI RAO
DEPARTMENT OF CIVIL ENGINEERING JNTUH COLLEGE OF ENGINEERING, KUKATPALLY
HYDERABAD – 500085, AP, INDIA (AUTONOMOUS)
MARCH – 2011
DEPARTMENT OF CIVIL ENGINEERING
JNTUH COLLEGE OF ENGINEERING, KUKATPALLY HYDERABAD– 500085, AP, INDIA.
CERTIFIACTE
This is to certify that the dissertation work entitled “Study On The Stress-
Strain Behaviour Of High Strength Glass Fibre Reinforced Self-Compacting
Concrete Under Axial Compression With & Without Confinement” that is
being submitted by B.VenkataRaju, HT No: 06014D2023 in partial fulfillment for
the award of M.Tech in “Structural Engineering” to the Department of Civil
Engineering, JNTUH College of Engineering, KUKATPALLY, Hyderabad, is a
record of bonafide work carried out by him under my guidance and supervision.
Signature of Head Project Guide
Dr. P.SRINIVASA RAO Dr.M.V.SESHAGIRI RAO,
Professor and Head of the Proffesor of Civil Engineering
Deparment of Civil Engineering Dept. of Civil Engineering
JNTUHCE, Hyderabad-85 JNTUHCE, Hyderabad-85
i
DECLARATION BY THE CANDIDATE
I, B.VenkataRaju, bearing HT. No: 06014D2023 hereby declare that the
report of the Post Graduate Thesis work entitled “Study On The Stress-Strain
Behaviour Of High Strength Glass Fibre Reinforced Self-Compacting
Concrete Under Axial Compression With & Without Confinement”, which is
being submitted to the JNTUH College of Engineering, Kukatpally, in partial
fulfillment of the requirements for the award of the Degree of Master of
Technology in Structural Engineering., Department of Civil Engineering, is a
bonafide report of the work carried out by me. The material contained in this
report has not been submitted to any university or Institution for the award of any
degree or diploma.
Place: JNTUHCE, Kukatpally, Hyderabad
Date:
ii
B.VENKATARAJU
H.T.No: 06014D2023
Ph: +919177263599
Ph: +919440904158
e-mail: [email protected]
Department of Civil Engineering,
JNTUHCE, Hyderabad.

Dedicated to DEAR and NEAR ONES
iii
ACKNOWLEDGEMENT
I sincerely thank my advisor Dr. M.V.SESHAGIRI RAO, Professor in Civil
Engineering for his guidance, suggestions, and continuous support throughout my Project. I
greatly appreciate all the support that he has been given to me, both on this thesis and during
the entire period in which I have been working for him.
My profound thanks to Dr. P.SRINIVASA RAO, Professor and Head of the
Department of the Civil Engineering, JNTU College of Engineering from for his valuable
suggestions and help is carryout this dissertation work. For the assistance and help he
provided as being my co-advisor here at JNT University and also during my Project work.
I express my sincere gratitude to Dr. N.V.RAMANA RAO, Principal & professor,
JNTUH College of Engineering for his constant encouragement during the project work. The
support and help provided by him good self during this work is invaluable.
I would like to thank Smt. P.SRI LAKSHMI, Assistant professor of Civil
Engineering, JNTUH College of Engineering, for sparing her valuable time in clarifying my
doubts during my project work.
I would like to thank M/s Grasim Industries Limited, manufactures of Ultra tech
cement for extended co-operation in free supply of cement for research purpose to conduct
this project work.
I also acknowledge the sincere and untiring efforts of Engr.Devaraj who assisted me
during all stages of my experiments and also helped me in preparing the experimental set-up
utilized in this study. Thanks are due to the laboratory personnel for their substantial
assistance in the experimental work
Finally, my special thanks to all my professors & friends, who rendered valuable help.
I had taken, which helped me complete my Master’s Degree in Technology.
(B.VENKATA RAJU) M.Tech (Structural Engineering) Department of Civil Engineering
JNTUHCE, Hyderabad-85
iv
ABSTRACT
A self-compacting concrete (SCC) is the one that can be placed in the form and can
go through obstructions by its own weight and without the need of vibration. Since its
first development in Japan in 1988, SCC has gained wider acceptance in Japan, Europe
and USA due to its inherent distinct advantages. Although there are visible signs of its
gradual acceptance in the Middle East through its limited use in construction, Saudi
Arabia has yet to explore the feasibility and applicability of SCC in new construction.
The contributing factors to this reluctance appear to be lack of any supportive evidence of
its suitability with local marginal aggregates and the harsh environmental conditions.
Concrete is a vital ingredient in infrastructure development with its versatile and
extensive applications. It is the most widely used construction material because of its
mouldability into any required structural form and shape due to its fluid behaviour at
early ages. However, there is a limit to the fluid behaviour of normal fresh concrete.
Thorough compaction, using vibration, is normally essential for achieving the required
strength and durability of concrete. Inadequate compaction of concrete results in large
number of voids, affecting performance and long-term durability of structures. Self-
compacting concrete (SCC) provides a solution to these problems. As the use of concrete
becomes more widespread the specifications of concrete like durability, quality, and
compactness of concrete becomes more important. Self -Compacting Concrete is recently
developed concept in which the ingredients of the concrete mix are proportioned in such a
way that it can flow under its own weight to completely fill the formwork and passes
through the congested reinforcement without segregation and self consolidate without any
mechanical vibration. Self – Compacting Concrete (SCC) is a very fluid concreter and a
homogeneous mixture that solves most of the problems related to ordinary concrete. This
specification helps the execution of construction components under high compression of
reinforcement.
In this work an attempt has been made to study Stress – Strain behaviour of Glass
fibre Self–Compacting Concrete under confined and unconfined states with different
percentages of confinement (in the form of hoops). Since the confinement provided by
lateral circular-hoop reinforcement, is a reaction to the lateral expansion of concrete,
lateral reinforcement becomes effective only after considerable deformation in the axial
v
direction. Complete Stress – Strain behaviour has been presented and an empirical
equation based on rational polynomial is proposed to predict the stress – strain behaviour
of such concrete under compression. The proposed empirical equation shows good
correlation with the experimental results. There is an improvement in the Compressive
Strength, Secant modulus and this is due to the addition of the glass – fibres to the Self-
Compacting concrete and also confinement in the form of hoops in Self-Compacting
Concrete mix.
Key words: Glass-fibre, Reinforced Self – Compacting Concrete, 6mm diameter Mild
steel, admixtures, Stress – Strain behaviour, A single Polynomial empirical equation.
vi
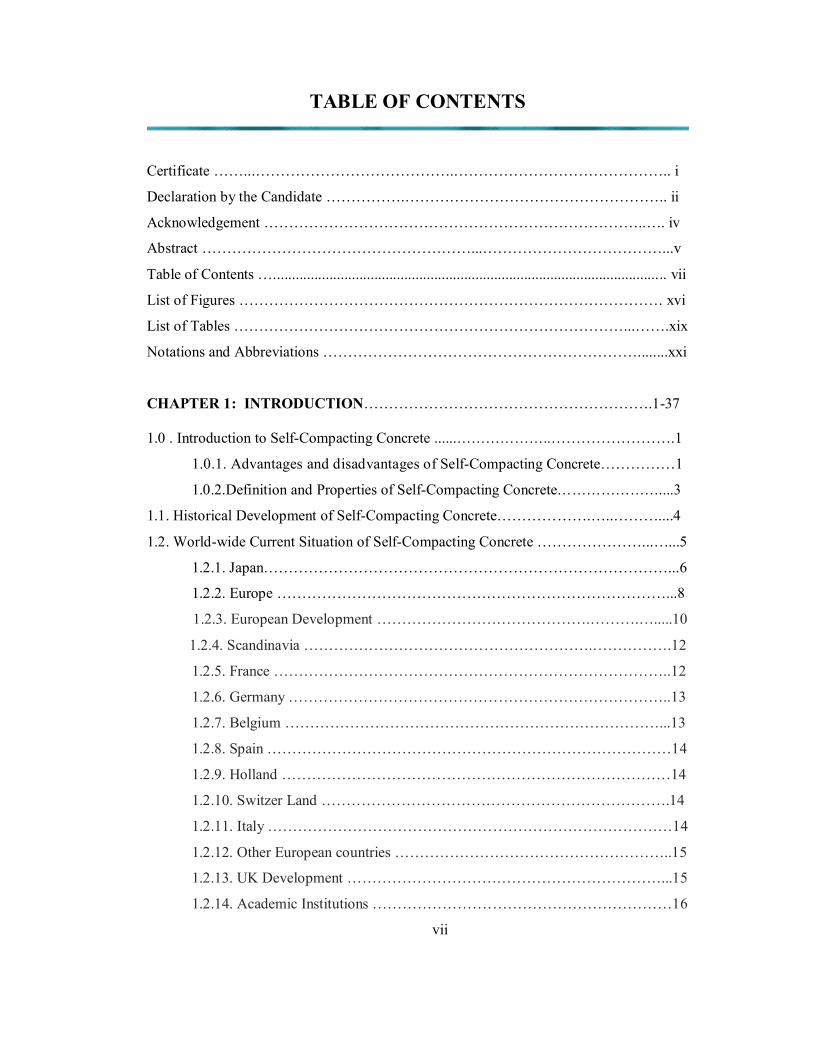
TABLE OF CONTENTS
Certificate ……...………………………………….…………………………………….. i
Declaration by the Candidate …………….…………………………………………….. ii
Acknowledgement …………………………………………………………………..…. iv
Abstract ………………………………………………...………………………………...v
Table of Contents …......................................................................................................... vii
List of Figures …………………………………………………………………………. xvi
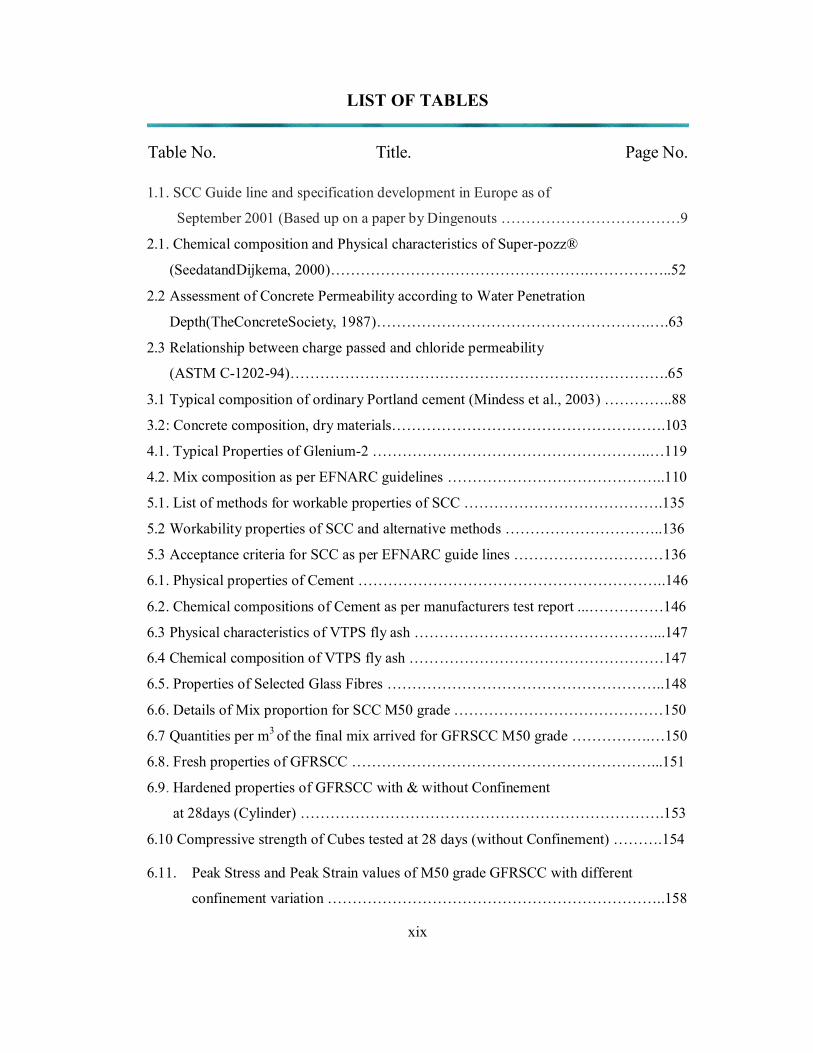
List of Tables ……………………………………………………………………...…….xix
Notations and Abbreviations ………………………………………………………........xxi
CHAPTER 1: INTRODUCTION………………………………………………….1-37
1.0 . Introduction to Self-Compacting Concrete ......………………..…………………….1
1.0.1. Advantages and disadvantages of Self-Compacting Concrete……………1
1.0.2.Definition and Properties of Self-Compacting Concrete…………………....3
1.1. Historical Development of Self-Compacting Concrete……………….…..………....4
1.2. World-wide Current Situation of Self-Compacting Concrete …………………...…...5
1.2.1. Japan………………………………………………………………………...6
1.2.2. Europe ……………………………………………………………………...8
1.2.3. European Development …………………………………….……….….....10
1.2.4. Scandinavia ………………………………………………….…………….12
1.2.5. France ……………………………………………………………………..12
1.2.6. Germany …………………………………………………………………..13
1.2.7. Belgium …………………………………………………………………...13
1.2.8. Spain ………………………………………………………………………14
1.2.9. Holland ……………………………………………………………………14
1.2.10. Switzer Land …………………………………………………………….14
1.2.11. Italy ………………………………………………………………………14
1.2.12. Other European countries ………………………………………………..15
1.2.13. UK Development ………………………………………………………...15
1.2.14. Academic Institutions ……………………………………………………16
vii
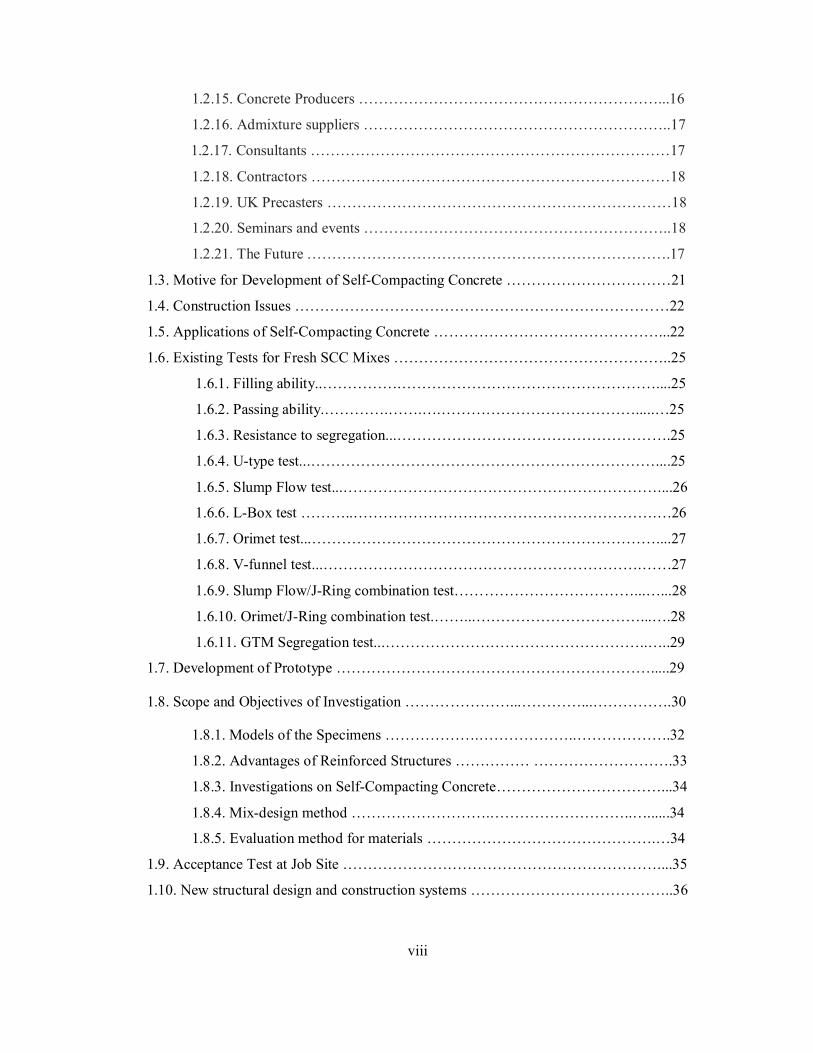
1.2.15. Concrete Producers ……………………………………………………...16
1.2.16. Admixture suppliers ……………………………………………………..17
1.2.17. Consultants ………………………………………………………………17
1.2.18. Contractors ………………………………………………………………18
1.2.19. UK Precasters ……………………………………………………………18
1.2.20. Seminars and events ……………………………………………………..18
1.2.21. The Future ……………………………………………………………….17
1.3. Motive for Development of Self-Compacting Concrete ……………………………21
1.4. Construction Issues …………………………………………………………………22
1.5. Applications of Self-Compacting Concrete ………………………………………...22
1.6. Existing Tests for Fresh SCC Mixes ………………………………………………..25
1.6.1. Filling ability..…………….……………………………………………....25
1.6.2. Passing ability.………….…….….………………………………….....…25
1.6.3. Resistance to segregation...……………………………………………….25
1.6.4. U-type test...……………………………………………………………....25
1.6.5. Slump Flow test...………………………………………………………....26
1.6.6. L-Box test ………..…………………………………………………….…26
1.6.7. Orimet test...……………………………………………………………....27
1.6.8. V-funnel test...……………………………………………………….……27
1.6.9. Slump Flow/J-Ring combination test………………………………...…...28
1.6.10. Orimet/J-Ring combination test.……...……………………………...….28
1.6.11. GTM Segregation test...……………………………………………..…..29
1.7. Development of Prototype ……………………………………………………….....29
1.8. Scope and Objectives of Investigation …………………...…………...…………….30
1.8.1. Models of the Specimens ……………….………………..……………….32
1.8.2. Advantages of Reinforced Structures …………… ……………………….33
1.8.3. Investigations on Self-Compacting Concrete……………………………...34
1.8.4. Mix-design method ……………………….………………………..…......34
1.8.5. Evaluation method for materials ……………………………………….…34
1.9. Acceptance Test at Job Site ………………………………………………………....35
1.10. New structural design and construction systems …………………………………..36
viii
CHAPTER 2: LITERATURE REVIEW…………………….................................38-86
2.0 General …………………………………...………………….……………………...38
2.1 Previous Research Work on Self-Compacting Concrete ……….…...………………38
2.1.1 Hajime Okamura ……………………………………..….………………39
2.1.2 Kazumasa Ozawa ……………………………………..…………………41
2.1.3 Subramanian and Chattopadhyay ………………………..………………41
2.1.4. Khayat et al ……………………………………………….……………..43
2.1.5. Dehn et al. ……………………….……………………….……………...44
2.1.6. Kuroiwa ………………………………………………….………………45
2.1.7 Ferraris et al………………………………………………...…………….46
2.1.8 Anirwan Senu Guptha et al[2006] ……………………………………….49
2.1.9. ACI committee report No.226 [1987]…………………………..……......49
2.1.10. Gibbs, [1999] ………………………………………………….…………50
2.1.11. Manu Santhanam,[2008] ……………………………………..……...50
2.1.12. Hemant Sood[3] Et Al, [2009] …………………………………..………50
2.1.13. Kazim Turk[3] Et Al, [2007] ……………………………………...……..50
2.1.14. Srinivasa Rao.P, [2008] ……………………………………………...…..51
2.2 Constituent Materials for SCC ………………………………………………………51
2.2.1. Powder (Mixture of Portland cement and Filler)………………………...51
2.2.1.1 Cement …………………………………………………………..51
2.2.1.2 Filler ……………………………………………………………..52
2.2.2 Aggregates …………………………………………………………………54
2.2.3 Admixtures ………………………………………………………………...56
2.2.4 Ranges of the quantities of the Constituent Materials for SCC …………...57
2.3 Hardened Properties of SCC ………………………………………………………...58
2.3.1 Compressive, Tensile, and Bond Strength ………………………………...58
2.3.2 Modulus of Elasticity ……………………………………………………...59
2.3.3 Shrinkage and Creep ………………………………………………………59 2.3.4. Durability…………………………………………………………………...60
2.3.5 Water Absorption and Initial Surface Absorption ………………………...63
2.3.6 Water Permeability ………………………………………………………..63
2.3.7 Rapid Chloride Permeability ………………………………………………64
ix
2.4. Influence of Admixtures on Concrete Properties …………………………………...65
2.5. Mineral Admixtures ………………………………………………………………...65
2.6 Blast Furnace Slag ………………………...……………………………………..…..65
2.7 Fly Ash …………………………………………...………………………………….67
2.8 Silica Fume …………………………………...………………………………….…..69
2.9 Chemical Admixtures ……………………………………………………………..…71
2.10 Superplasticizers ..…………………………………...……………………………...72
2.11 Viscosity Modifiers ..……………………………………………………………….75
2.12 Bonding between Aggregate and Cement Paste ………………….………………..78
2.13 Examples of Self-Compacting Concrete Applications ………………………….….80
2.14 Criteria………………………………………………………………………………..82
2.14.1 Guidelines in Japan…………………………………………………………82
2.14.2 Guidelines in Europe……………………………………………………......83
CHAPTER 3: SELF-COMPACTING CONCRETE COMPOSITION…..........87-103
3.0 Introduction….…………………………………………………....………………….87
3.1 Portland Cement ………………………………………………………..……………88
3.2 Aggregates ……………………………………………………………….…………..92
3.3 Blast Furnace Slag ………………………………………………………..………….92
3.4 Fly Ash ………………………………………………………………………………93
3.5 Silica Fume ……………………………………………………………….………….96
3.6 Superplasticizers …………………………………………………………..…………97
3.7 Viscosity-Modifying Admixtures ……………………………………...…...……….99
3.8 Fibres …………………...……………………………………………….………….100
3.8.1. The effect of fibres on workability………………………………………101
3.8.2. Maximum fibre content…………………………………………………..101
3.9 Concrete Mix and Tests ………………………………………………………...….102
CHAPTER 4: DESIGN OF A SUITABLE SCC MIX…….…………………104-121
4.0. Materials for Self-Compacting Concrete ………………………………………….104
4.0.1. Cement ………………………………..…………………………..……..104
4.0.2. Aggregates ………………………………………………..……………..104
x
4.0.2.1. Fine aggregate .......……………………………………….……104
4.0.2.2. Coarse aggregate ………………………………………………104
4.0.3. Admixtures ………………………………………………………….…...104
4.0.3.1. Mineral Admixtures ………………………………………..….104
4.0.3.2. Fly ash …………………………………………………………………106
4.0.3.2.1. Advantages of Fly ash ……………………………….106
4.0.3.2.2 Environmental Protection …………………………….107
4.0.3.2.3. Areas of usage of Fly ash ……………………………107
4.0.3.2.4. Chemical Admixtures ………………………………..108
4.0.4. Superplasticizer ………………………………………………………...109
4.0.4.1. Advantages of Superplasticizer ………………………………..109
4.0.4.2. Dosage ………………………………………………………..109
4.0.5. Viscosity modifying Agent (VMA) ………………………………….….109
4.0.5.1. Advantages ………………………………………………….…111
4.0.5.2. Dosage …………………………………………………………111
4.0.6. Water ……………………………………………………….……………111
4.1. Mix Design ……………………………………………………………….………..112
4.1.1. Mix Design Principles.…...……………………………..…..…..………..113
4.1.2. General requirements in the Mix Design ……………………………..…114
4.1.2.1. A high volume of paste ………………………….…….…..…..114
4.1.2.2. A high volume of fine particles (<80m) ………………..…..…114
4.1.2.3. A high dosage of super plasticizer ………………………….…114
4.1.2.4. The possible use of viscous agent (water retainer) ……….…...114
4.1.2.5. A low volume of core segregate ………………………….…...115
4.1.3. Mix Design ………………………………………………………..……..115
4.1.4. Various procedures for Mix Design …………………………………..…117
4.2. By EFNARC Guidelines …………………………………………………………..119
4.2.1. Guidelines to find reasons of Faulty mixes ……………………..……….119
4.2.2. Mix Design and Trial Proportion …………………………………..……120
CHAPTER 5: QUALITY ASPECTS OF SELF -COMPACTING
CONCRETE ……………………………………………………. 122-143
5.0. Test Methods ………………………………………………………………....……122 xi

5.0.1. Introduction …….……………………………………………..…………122
5.0.2. Slump Flow Test / and T50 cm test ……………………………………...123
5.0.2.1. Assessment of test ………………………………………….….123
5.0.2.2. Equipment ………………………………………………...…...123
5.0.2.3. Procedure …………………………………………………....…124
5.0.2.4. Interpretation of results ……………………………………......125
5.0.3. V funnel test ……………………………………………………………..125
5.0.3.1. Introduction ….…………… ………………………………......125
5.0.3.2. Assessment of test …..………………………… ……….…..…125
5.0.3.3. Equipment ………………………………………… ….……....126
5.0.3.4. Procedure of flow time ………………………………..…….....126
5.0.3.5. Procedure for flow time at T 5 minutes ……………..…………127
5.0.3.6. Interpretation of results …………………………….....……….127
5.0.4. L –Box test method ……………………………………………...………128
5.0.4.1. Introduction ………….……….………………...………..…….128
5.0.4.2. Assessment of test ………………………….……………..…...128
5.0.4.3. Equipments …………………………………..………………...129
5.0.4.4. Procedure …………………………….………..…………….…130
5.0.4.5. Interpretation of results ………………………...…………..….130
5.1. Case Studies Overseas ………………………………………………..……..……..130
5.1.1. Shark and Pengium Aquariums at the Oceanopole
MarineParkinBrest. …………………………………………...…..……..130
5.1.1.1 Main project description ……………………………….....…….130
5.1.1.2. Why SCC was used …………………………………..….…….131
5.1.1.3. Project requirements …………………………………..…...…..131
5.1.2.Basement for Research and Development building in Tokyo, Japan ….....131
5.1.2.1. Main project description ……………………………………...131
5.1.2.2. Why SCC was used ……………………………………………131
5.1.3. Pipe screen for a Tail Tunnel at the Meinrad Leinert
Square,Zurich, Switzerland...…………………………………………...131
5.1.3.1. Main project requirements ……………………………….....…131
5.1.3.2. Why SCC was used ……………………………………………132
xii
5.1.4. Modular hotel room units by old castle Precast
Rehoboth, MA (USA) ………………………………………………….132
5.1.4.1. Main project description………………………………...……...132
5.1.4.2. Why SCC was used ……………………………………….…...132
5.1.5. Case study in land ……………………………………………...…….….132
5.2. Requirements of Self-Compacting Concrete ...…………………………...……….133
5.2.1.Application area …………………………………………………..……………...133
5.2.2. Requirements ……………………………………………………..….…133
5.2.2.1. Filling Ability …………………………………………….……133
5.2.2.2. Passing Ability ………………………………………….……..134
5.2.2.3. Resistance to Segregation ………………………………...……134
5.3. Workability criteria for the fresh SCC ………………………………………….....136
5.4. Complexities Involved In Making SCC ………………………………………...…137
5.5. Limitations of SCC ……………………………………………………...………...138
5.6. Advantages of SCC ………………………………………………………………..138
5.6.1. Some Architectural Advantages of SCC Include ……………………....139
5.7. Economic Impact of Self-Compacting Concrete In Precast …………..…………...140
5.7.1. Applications ………………………………………………..……..…...142
5.8. Perfomance …………………………….…………………………………………..142
CHAPTER 6: EXPERIMENTAL PROCEDURES..……………………..........144-181
6.0. General……………………………………………………………………………..144
6.1. Introduction ………………………………………………………………………..144
6.2. Research Significance ……………………………………………………………..145
6.3. Experimental Program ……………………………………………………………..145
6.4. Materials Used …………………………………………………………..…………145
6.4.1. Cement …………………………………………………...…….………..145
6.4.2. Fine aggregate ………………………………………………….………..146
6.4.3. Coarse aggregate ………………………………………………..……….146
6.4.4. Mineral Admixtures ……………………………………………..………147
6.1.4.1. Fly ash …………………………………………………………147
xiii
6.4.5. Chemical Admixture ……………………………………………..……...147
6.4.6. Viscosity Modifying Agent ……………………………………….……..148
6.4.7. Glass Fibres ……………………………………………………….……..148
6.1.7.1. Effect of Glass fibre on Bleeding ………………………………...148
6.1.8. Water ……………………………………………………………….……149
6.5. Mix Proportion ………………………………………………………………..…...149
6.5.1. Trail Mixes ………………………………………………………….…...149
6.6. Development of Glass Fiber Reinforced Self Compacting Concrete(GFRSCC)….150
6.7. Workability…………………………………………………………………………151
6.8. Testing of SCC in Fresh State.………………………………………………….….151
6.9. Specimen Preparation …………………………………………………………...…151
6.10.Casting ...……………………………………………………………………….….152
6.11.Curing ………………………………………………………………………....…..152
6.12.Compressive Strength ………………………………………………...………..…152
6.13. Tests of GFRSCC With and Without Confinement in Hardened State …….……153
6.14. Failure mode of Test Specimen in Compression …………………………..…….154
6.15. Comparison with Conventional Concrete to GFRSCC ...………………………...156
6.15.1. Conventional Concrete ………………………………………………....156
6.15.2. Glass Fibre Reinforced Self Compacting Concrete (GFRSCC) ….........156
6.16. Development of Analytical Stress-Strain models for GFRSCC with & without
Confinement ……………………………………………………………………157
6.16.1. Effect of fiber on Ultimate strength and strain …………………………157
6.16.2. Relationship between Fiber Index, stress ratio and strain ratio ………...158
6.16.3. Ductility factor Vs Fiber Index ………………………………………...160
6.16.4. Non Dimensionalised stress – strain curve …………………………….161
6.16.5. Model caluculations for Normalised stress – Normalised Strain curve of
GFRSCC (0.798% Confinement)………………………………………162
6.17. Experimental Results ……………………………………………………………..165
6.17.1. Stress-Strain values of Cylinder without confinement (M50 grade
GFRSCC)…………………………………………………………….…165
6.17.2. Stress-Strain values of Cylinder with 0.798% confinement (M50 grade
GFRSCC)……………………………………………………….………168
xiv
6.17.3. Stress-Strain values of Cylinder with 1.062% confinement (M50 grade
GFRSCC)………………………………………………………….……171
6.17.4. Stress-Strain values of Cylinder with 1.327% confinement (M50 grade
GFRSCC)………………………………………………………….……174
6.17.5. Stress-Strain values of Cylinder with 1.591% confinement (M50 grade
GFRSCC)………………………………………………………….……177
CHAPTER 7: DISCUSSIONS OF THE TEST RESULTS...…..……………....182-188
7.0. Discussions ………………………………………………………………………...182
7.1. Characteristics of GFRSCC Mixes in Hardened State …………………………….183
7.1.1. Compressive Strength ……………………………………………...……183
7.1.2. Modulus of elasticity ……………….……………………………………183
7.1.3. Secant Modulus ………………………………………………………….183
7.1.4. Stress-Strain behaviour with & without confinement……………………184
7.1.5. Energy absorption capacity (Toughness) ………………………………..185
7.1.6. Ductility ………………………………………………………………….186
7.1.7. Analytical expressions.…………………………………………………...186
CHAPTER 8: CONCLUSIONS AND RECOMMENDATIONS……………..189-205
8.0. Conclusions ………………………………………………………………………..189
8.1 Recommendations for Future Research ………………………………………….192
BIBLIOGRAPHY ………………………………………………………………194
APPENDIX A …………………………………………………………………..200
VITA ……………………………………………………………………………205
xv

LIST OF FIGURES
Figure No. Title. Page No.
1.0 Excellent finish of a neat cement SCC…………………………………………………..2 1.1. Necessity of Self-Compacting Concrete (Ouchi and Hibino, 2000) ………………..21
1.2. Rational construction system proposed by Ozawa (Ouchi et al., 1996) ………..….22
1.3 Annual production of SCC in Japan Total production of ready-mixed concrete in
Japan in 19997 is 67,620×1,000 m ………………………………………………..…23
1.4 Anchorage 4A of Akashi-Kaikyo Bridge …………………………………………...24
1.5 U-type test (Ouchi and Hibino, 2000) ……………………………………………….26
1.6 V-funnel (Dietz and Ma, 2000) ……………………………………………………...27
1.7 Slump Flow/J-Ring combination test (Kosmatka et al., 2002) ……………………...28
1.8. Cylinder without any confinement …………………...……………………………..32
1.9. Cylinder with confinement ………………………………………………………….32
1.10 Rational acceptance test at job site for self-compacting concrete (Ouchi and
Hibino, 2000) .......……………………………………………..………………..36
1.11 Anchorage of Akashi-Kaikyo Bridge, Japan (Ouchi and Hibino, 2000) …………..37 2.1. Small pipes used as obstacles in formwork (Okamura, 1997) ...……………………39
2.2 Effect of super plasticizer on viscosity (Okamura, 1997)……………………………40
2.3 Compressive strength of SCC with and without HPMC (Subramanian and
Chattopadhyay, 2002) ……………………………………………………………..43
2.4 Pullout specimen (Dehn et al., 2000) ………………………………………………..45
2.5 Viscosity –Yield stress and the workability box (Ferraris et al., 1999) ……………..48
2.6 Rational mix-design method for self-compacting concrete (Ouchi et al., 1996) ……74
2.7 Anchorage of Akashi-Kaikyo Bridge, Japan (Ouchi and Hibino, 2000) ……………81
2.8 Sandwich structure applied to immersed tunnel in Kobe, Japan (Ozawa, 1989) ……82
3.1 Materials used in regular concrete and self-compacting concrete
by absolute volume (Kosmatka et al., 2002) …………………………...…………..88
3.2. Microstructural development in Portland cement pastes (Mindess et al., 2003) …...90
3.3 SEM micrograph of fly ash particles (Kosmatka et al., 2002) ………………………94
xvi
Figure No. Title. Page No.
3.4 Effect of microsilica in densifying the concrete mix - comparison between
conventional and microsilica concretes (St John, 1998) …………………………….97
3.5 Effect of superplasticizer on cement: (a) Cement and water; (b) Cement,
water, and superplasticizer (Ramachandran, 1984) ………………………...……….98
3.6 Dispersing action of water-reducing admixtures: (a) flocculated paste;
(b) dispersed paste (Mindess et al., 2003) …………………………………………...99
4.1. Mix design flow chart ……………………………..……………………………...114
5.1. Showing the apparatus of Slump Flow and slump flow in (a) & (b) respectively....123
5.2. Showing the apparatus of V-funnel test ……………...………………...………….126
5.3. L-Box Apparatus …………………………………………………………………..129
5.4. Showing the performance of Conventional Concrete & SCC in (a) and (b)
respectively …………………………………………………………………………143
6.1 Casted cylinder specimen tested UTM …………………………………………….155
6.2 Casted cube specimen under tested under Compression testing machine………….155
6.3. Cracks being visible on the test specimen ………………………………………....156
6.4. Typical Stress-Strain behaviour of (M50 grade GFRSCC) with and without
confinement at 28 days………………………………………………………....157
6.5. Stress ratio (fu/f') Vs Fiber Index…………………………………………………..159
6.6. Strain ratio (єu/є) Vs Fiber Index …………………………………………………159
6.7. Fiber Index Vs Ductility Factor …………………………………………………...160
6.8. Normalised Stress – Normalised Strain…………………………………………….161
6.9. Stress-Strain behaviour of GFRSCC without confinement………………………..167
6.10. Normalized Stress-Strain Curve of GFRSCC without Confinement……………..167
6.11. Stress-Strain behaviour of GFRSCC (0.798% Confinement)………………….....170
6.12. Normalized Stress-Strain Curve of GFRSCC (0.798% Confinement)………..….170
6.13. Stress-Strain behaviour of GFRSCC (1.062% Confinement) ………………..…..173
6.14. Normalized Stress-Strain Curve of GFRSCC (1.062% Confinement)………..….173
6.15. Stress-Strain behaviour of GFRSCC (1.327% Confinement) ……………..176
6.16. Normalized Stress-Strain Curve of GFRSCC (1.327% Confinement)…………...176
xvii
6.17 Stress-Strain behaviour of GFRSCC (1.591% Confinement) …………………….179
6.18. Normalized Stress-Strain Curve of GFRSCC (1.591% Confinement)………….. 179
6.19. % of Different confinements Vs % of Improvement of compressive Strength…..180
7.1. Typical Stress-strain behavior of GFRSCC with and without confinement ………182
7.2 Graphical representation of increase in strength, Specific Toughness
with different confinements …………………………………………..…………...187
7.3 Graphical representation of increase in strength, Energy Absorption
(% increase) with different confinements ………………………………………….188
7.4 Graphical representation of increase in strength, ductility
(% increase) with different confinements ………………………………………….188
xviii
LIST OF TABLES
Table No. Title. Page No. 1.1. SCC Guide line and specification development in Europe as of
September 2001 (Based up on a paper by Dingenouts ………………………………9
2.1. Chemical composition and Physical characteristics of Super-pozz®
(SeedatandDijkema, 2000)…………………………………………….……………..52
2.2 Assessment of Concrete Permeability according to Water Penetration
Depth(TheConcreteSociety, 1987)……………………………………………….….63
2.3 Relationship between charge passed and chloride permeability
(ASTM C-1202-94)………………………………………………………………….65 3.1 Typical composition of ordinary Portland cement (Mindess et al., 2003) …………..88
3.2: Concrete composition, dry materials……………………………………………….103
4.1. Typical Properties of Glenium-2 ………………………………………………..…119
4.2. Mix composition as per EFNARC guidelines ……………………………………..110
5.1. List of methods for workable properties of SCC ………………………………….135
5.2 Workability properties of SCC and alternative methods …………………………..136
5.3 Acceptance criteria for SCC as per EFNARC guide lines …………………………136
6.1. Physical properties of Cement ……………………………………………………..146
6.2. Chemical compositions of Cement as per manufacturers test report ...……………146
6.3 Physical characteristics of VTPS fly ash …………………………………………...147
6.4 Chemical composition of VTPS fly ash ……………………………………………147
6.5. Properties of Selected Glass Fibres ………………………………………………..148
6.6. Details of Mix proportion for SCC M50 grade ……………………………………150
6.7 Quantities per m3 of the final mix arrived for GFRSCC M50 grade …………….…150
6.8. Fresh properties of GFRSCC ……………………………………………………...151
6.9. Hardened properties of GFRSCC with & without Confinement
at 28days (Cylinder) ……………………………………………………………….153
6.10 Compressive strength of Cubes tested at 28 days (without Confinement) ……….154
6.11. Peak Stress and Peak Strain values of M50 grade GFRSCC with different
confinement variation …………………………………………………………..158
xix
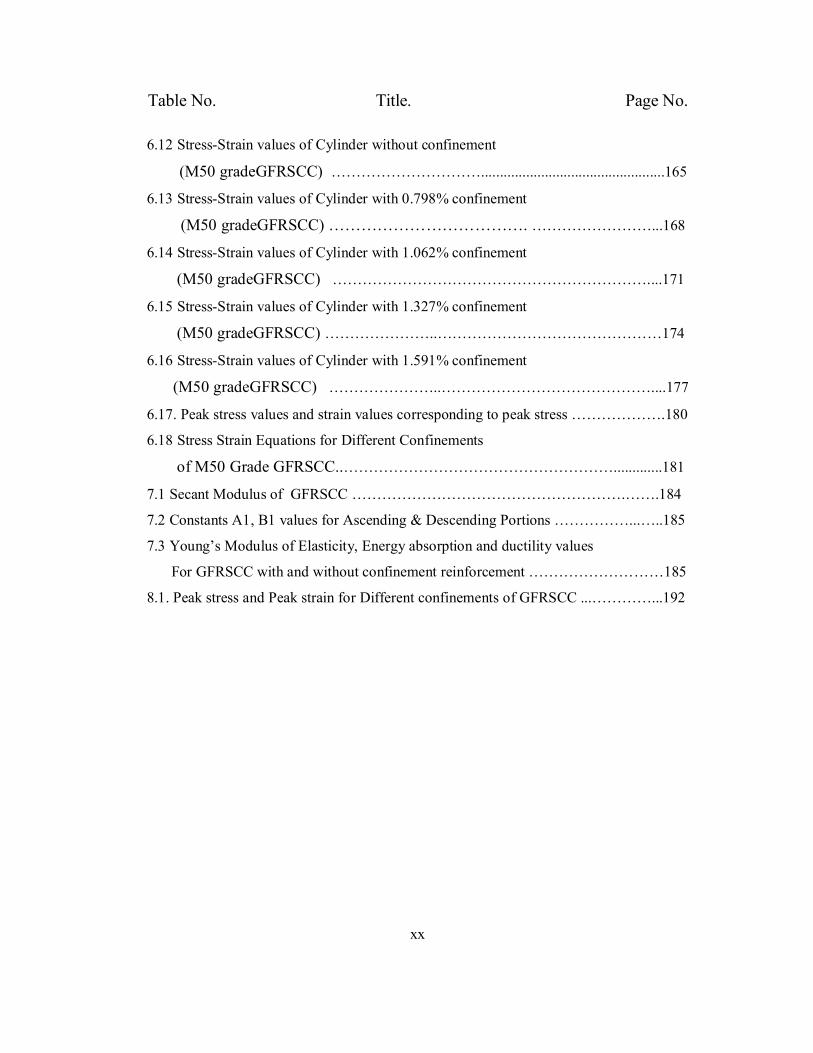
Table No. Title. Page No.
6.12 Stress-Strain values of Cylinder without confinement
(M50 gradeGFRSCC) ………………………….................................................165
6.13 Stress-Strain values of Cylinder with 0.798% confinement
(M50 gradeGFRSCC) ………………………………. ……………………...168
6.14 Stress-Strain values of Cylinder with 1.062% confinement
(M50 gradeGFRSCC) ………………………………………………………....171
6.15 Stress-Strain values of Cylinder with 1.327% confinement
(M50 gradeGFRSCC) …………………..………………………………………174
6.16 Stress-Strain values of Cylinder with 1.591% confinement
(M50 gradeGFRSCC) …………………..……………………………………....177
6.17. Peak stress values and strain values corresponding to peak stress ……………….180
6.18 Stress Strain Equations for Different Confinements
of M50 Grade GFRSCC..……………………………………………….............181
7.1 Secant Modulus of GFRSCC ……………………………………………….…….184
7.2 Constants A1, B1 values for Ascending & Descending Portions ……………...…..185
7.3 Young’s Modulus of Elasticity, Energy absorption and ductility values
For GFRSCC with and without confinement reinforcement ………………………185
8.1. Peak stress and Peak strain for Different confinements of GFRSCC ...…………...192
xx
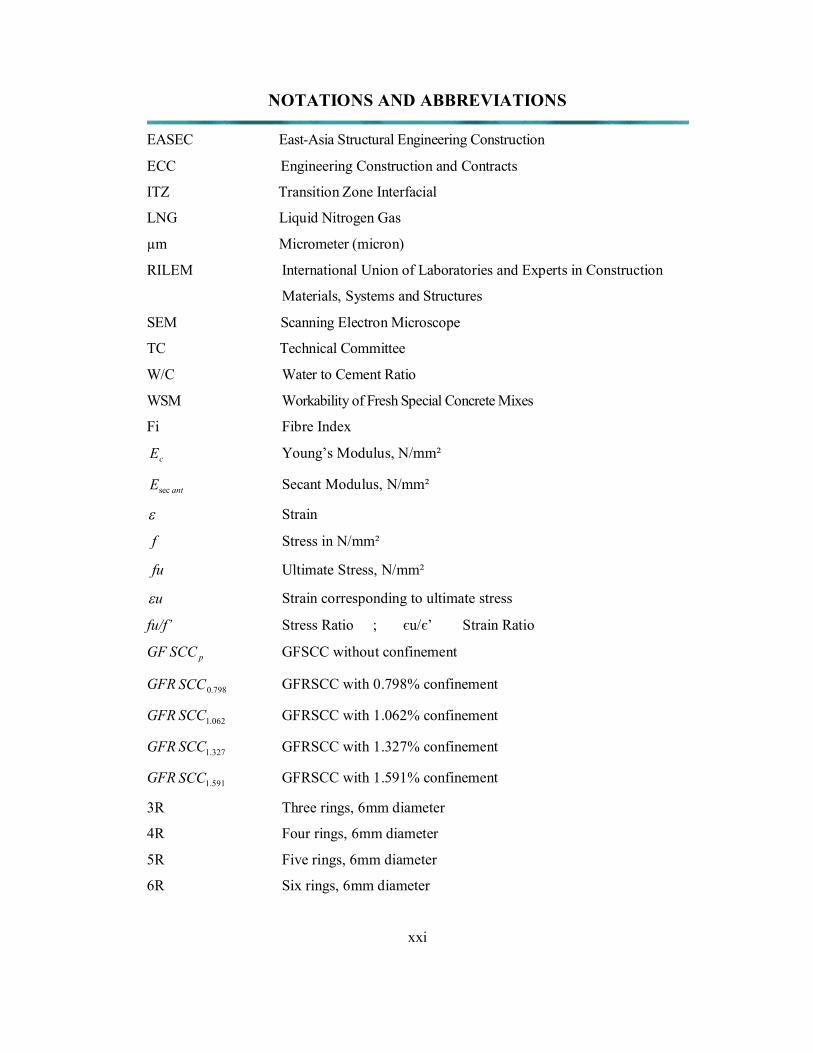
NOTATIONS AND ABBREVIATIONS
EASEC East-Asia Structural Engineering Construction
ECC Engineering Construction and Contracts
ITZ Transition Zone Interfacial
LNG Liquid Nitrogen Gas
µm Micrometer (micron)
RILEM International Union of Laboratories and Experts in Construction
Materials, Systems and Structures
SEM Scanning Electron Microscope
TC Technical Committee
W/C Water to Cement Ratio
WSM Workability of Fresh Special Concrete Mixes
Fi Fibre Index
cE Young’s Modulus, N/mm²
antEsec Secant Modulus, N/mm²
Strain
f Stress in N/mm²
fu Ultimate Stress, N/mm²
u Strain corresponding to ultimate stress
fu/f’ Stress Ratio ; єu/є’ Strain Ratio
GF pSCC GFSCC without confinement
GFR 798.0SCC GFRSCC with 0.798% confinement
GFR 062.1SCC GFRSCC with 1.062% confinement
GFR 327.1SCC GFRSCC with 1.327% confinement
GFR 591.1SCC GFRSCC with 1.591% confinement
3R Three rings, 6mm diameter
4R Four rings, 6mm diameter
5R Five rings, 6mm diameter
6R Six rings, 6mm diameter
xxi

CHAPTER 1
Introduction
CHAPTER 1 Introduction
1.0. Introduction to Self-Compacting Concrete Development of self-compacting concrete (SCC) is a desirable achievement in the
construction industry in order to overcome problems associated with cast-in-place
concrete. Self-compacting concrete is not affected by the skills of workers, the shape and
amount of reinforcing bars or the arrangement of a structure and, due to its high-fluidity
and resistance to segregation it can be pumped longer distances (Bartos, 2000). The
concept of self-compacting concrete was proposed in 1986 by professor Hajime Okamura
(1997), but the prototype was first developed in 1988 in Japan, by professor Ozawa
(1989) at the University of Tokyo. Self-compacting concrete was developed at that time
to improve the durability of concrete structures. Since then, various investigations have
been carried out and SCC has been used in practical structures in Japan, mainly by large
construction companies. Investigations for establishing a rational mix-design method and
self-compactability testing methods have been carried out from the viewpoint of making
it a standard concrete. Self-compacting concrete is cast so that no additional inner or outer
vibration is necessary for the compaction. It flows like “honey” and has a very smooth
surface level after placing. With regard to its composition, self-compacting concrete
consists of the same components as conventionally vibrated concrete, which are cement,
aggregates, and water, with the addition of chemical and mineral admixtures in different
proportions (see Chapter 3). Usually, the chemical admixtures used are high-range water
reducers (superplasticizers) and viscosity-modifying agents, which change the rheological
properties of concrete. Mineral admixtures are used as an extra fine material, besides
cement, and in some cases, they replace cement. In this study, the cement content was
partially replaced with mineral admixtures, e.g. fly ash, slag cement, and silica fume,
admixtures that improve the flowing and strengthening characteristics of the concrete.
1.0.1 Advantages and disadvantages of Self-Compacting Concrete
Compared to NVC, SCC possesses enhanced qualities, and its use improves
productivity and working conditions (De Schutter et al., 2008; The Concrete Society and
BRE, 2005).
1
Because compaction is eliminated, the internal segregation between solid
particles and the surrounding liquid is avoided which results in less porous transition
zones between paste and aggregate and a more even colour of the concrete (RILEM TC
174 SCC, 2000). Improved strength, durability and finish of SCC can therefore be
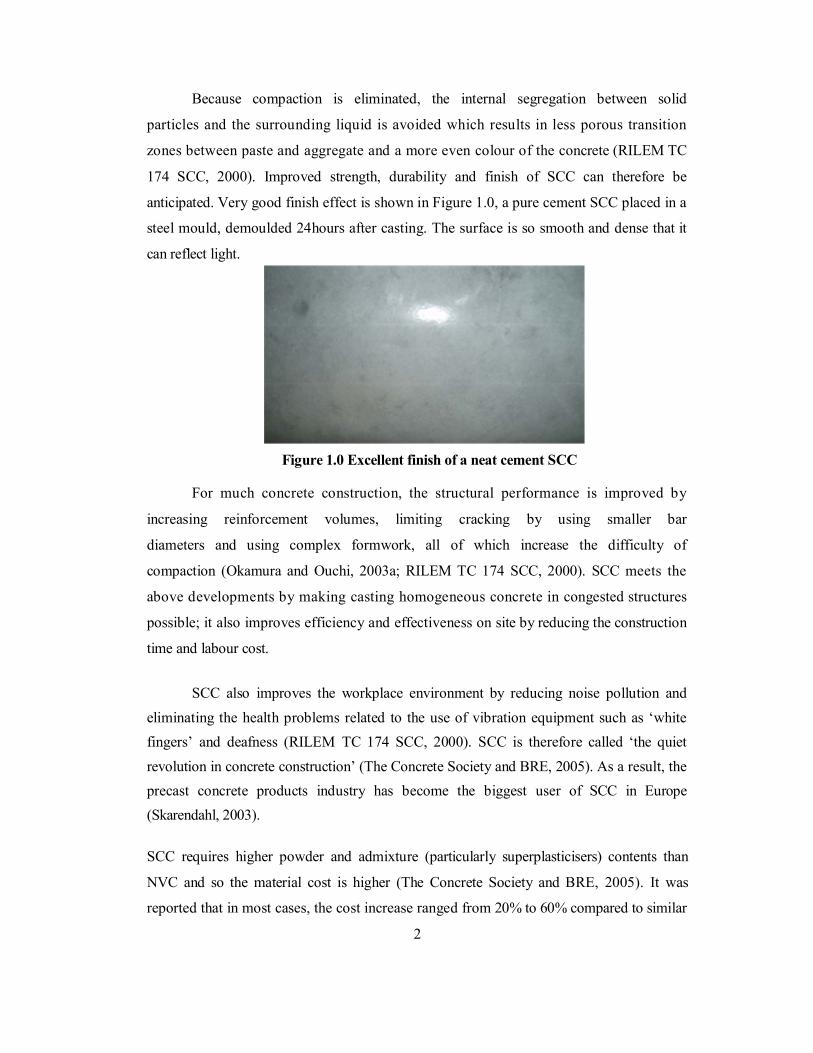
anticipated. Very good finish effect is shown in Figure 1.0, a pure cement SCC placed in a
steel mould, demoulded 24hours after casting. The surface is so smooth and dense that it
can reflect light.
Figure 1.0 Excellent finish of a neat cement SCC
For much concrete construction, the structural performance is improved by
increasing reinforcement volumes, limiting cracking by using smaller bar
diameters and using complex formwork, all of which increase the difficulty of
compaction (Okamura and Ouchi, 2003a; RILEM TC 174 SCC, 2000). SCC meets the
above developments by making casting homogeneous concrete in congested structures
possible; it also improves efficiency and effectiveness on site by reducing the construction
time and labour cost.
SCC also improves the workplace environment by reducing noise pollution and eliminating the health problems related to the use of vibration equipment such as ‘white fingers’ and deafness (RILEM TC 174 SCC, 2000). SCC is therefore called ‘the quiet revolution in concrete construction’ (The Concrete Society and BRE, 2005). As a result, the precast concrete products industry has become the biggest user of SCC in Europe (Skarendahl, 2003).
SCC requires higher powder and admixture (particularly superplasticisers) contents than
NVC and so the material cost is higher (The Concrete Society and BRE, 2005). It was
reported that in most cases, the cost increase ranged from 20% to 60% compared to similar
2
grade NVC (Nehdi et al., 2004; Ozawa, 2001). However, in very large structures, increased
material cost by using SCC was outweighed by savings in labour costs and construction
time (Billberg, 1999). The benefits of SCC were fully displayed in a composite
sandwich system, which involves casting SCC and NVC in layers within the same
structural elements (Okamura and Ouchi, 2003a; Ouchi, 2001; Ozawa, 2001).
The increased content of powder and admixture also leads to higher sensitivity (i.e.
reduced robustness) of SCC to material variation than that of NVC; thus greater care with
quality control is required (Walraven, 1998).
1.0.2 Definition and Properties of Self-Compacting Concrete
It is important at this stage to define SCC and its characteristics. Literally, self-
compacting characteristics are related to the fresh properties. The definitions of SCC given
in the literature vary, a most common one is that‘ a concrete that is able to flow under its
own weight and completely fill the form work, whilemaintaining homogeneity even in
the presence of congested reinforcement, and then consolidating without the need for
vibrating compaction’ (The Concrete Society and BRE, 2005).
SCC has three essential fresh properties: filling ability, passing ability and
segregation resistance Testing-SCC, 2005; The Concrete Society and BRE,
2005). Filling ability is the characteristic of SCC to flow under its own weight
and to completely fill the formwork. Passing ability is the characteristic of SCC
to flow through and around obstacles such as reinforcement and narrow spaces
without blocking. Segregation resistance is the characteristic of SCC to remain
homogeneous during and after transporting and placing. It is passing ability that
distinguishes SCC from other high consistence concrete (Domone, 2000).
Additional properties, such as robustness and consistence retention, are also
important in applications of SCC. Robustness refers to the ability of SCC to retain its
fresh property when the quality and quantity of constituent materials and the
environmental conditions change. Consistence retention refers to the period of duration of
the fresh properties.
3
A number of commonly used tests are subsequently described for evaluating the fresh
properties. There is no difference in test methods for hardened properties (strength,
stiffness, and durability etc.) between SCC and NVC. Both fresh and hardened properties are
key to the successful application of SCC. SCC therefore can be designed by fresh or
hardened requirements.
1.1 Historical Development of Self-Compacting Concrete Self-compacting concrete, in principle, is not new. Special applications such as
underwater concreting have always required concrete, which could be placed without the
need for compaction (Bartos, 2000). In such circumstances vibration was simply
impossible. Early self-compacting concretes relied on very high contents of cement paste
and, once superplasticizers became available, they were added in the concrete mixes. The
mixes required specialized and well-controlled placing methods in order to avoid
segregation, and the high contents of cement paste made them prone to shrinkage. The
overall costs were very high and applications remained very limited.
The introduction of “modern” self-leveling concrete or self-compacting concrete
(SCC) is associated with the drive towards better quality concrete pursued in Japan
around 1983, where the lack of uniform and complete compaction had been identified as
the primary factor responsible for poor performance of concrete structures (Dehn et al.,
2000). Due to the fact that there were no practical means by which full compaction of
concrete on a site was ever to be fully guaranteed, the focus therefore turned onto the
elimination of the need to compact, by vibration or any other means. This led to the
development of the first practicable SCC by researchers Okamura and Ozawa, around
1986, at the University of Tokyo and the large Japanese contractors (e.g. Kajima Co.,
Maeda Co., Taisei Group Co., etc.) quickly took up the idea. The contractors used their
large in-house research and development facilities to develop their own SCC
technologies. Each company developed their own mix designs and trained their own staff
to act as technicians for testing on sites their SCC mixes. A very important aspect was
that each of the large contractors also developed their own testing devices and test
methods (Bartos, 2000). In the early 1990’s there was only a limited public knowledge
about SCC, mainly in the Japanese language. The fundamental and practical know-how
was kept secret by the large corporations to maintain commercial advantage.
4
The SCCs were used under trade names, such as the NVC (Non-vibrated concrete) of
Kajima Co., SQC (Super quality concrete) of Maeda Co. or the Biocrete (Taisei Co.).
Simultaneously with the Japanese developments in the SCC area, research and
development continued in mix-design and placing of underwater concrete where new
admixtures were producing SCC mixes with performance matching that of the Japanese
SCC concrete (e.g. University of Paisley / Scotland, University of Sherbrooke / Canada)
(Ferraris, 1999).
1.2. World-wide Current Situation of Self-Compacting Concrete
Self-compacting concrete has already been used in several countries. In Japan,
major construction projects included the use of SCC in the late ’90s. Today, in Japan,
efforts are being made to free SCC of the “special concrete” label and integrate it into
day-to-day concrete industry production (Okamura, 1997). Currently, the percentage of
self-compacting concrete in annual product of ready-mixed concrete (RMC), as well as
precast concrete (PC), in Japan is around 1.2% and 0.5% of concrete products.
In the United States, the precast industry is also leading SCC technology
implementation through the Precast/Prestressed Concrete Institute (PCI) which has done
some research on the use of SCC in precast/prestressed concretes starting with 1999
(Bartos, 2000). It is estimated that the daily production of SCC in the precast/prestressed
industry in the United States will be 128000 m3 in the first quarter of 2011 (around 1% of
the annual ready-mix concrete). Furthermore, several state departments of transportation
in the United States (23 according to a recent survey) (Bartos, 2000)are already involved
in the study of SCC. With such a high level of interest from the construction industry, as
well as manufacturers of this new concrete, the use of SCC should grow at a tremendous
rate in the next few years in the United States. However, even if it is made from the same
constituents the industry has used for years, the whole process, from mix design to
placing practices, including quality control procedures, needs to be reviewed and adapted
in order for this new technology to be applied properly.
Research regarding the self-compacting concrete was also carried out in Canada,
few years after the concept was introduced in Japan. Institute for Research in
Construction, Canadian Precast/Prestressed Concrete Institute, CONMET-ICON, and
ISIS are some of the bodies which studied various aspects of the new technology.
5
The introduction of the SCC in Europe is largely connected with the activities of
the international association RILEM, France, particularly of its Technical Committee
TC145-WSM on “Workability of Fresh Special Concrete Mixes” (Dhir and Dyer, 1999).
The TC145-WSM was founded in 1992 and immediately attracted expert memberships
from all over the world.
The aim was to look at the production stage of a number of “special” concretes
and identify workability parameters and other characteristics of the mixes in their fresh
state that governed the reliable and economical achievement of the “special” or “high-
performance” parameters the concretes offered. As the importance of the SCC became
widely recognized, other European countries, Germany, Sweden, UK, Denmark,
Netherlands, Norway, Finland, etc., have decided to keep up with the developments in
this area. For example, in Sweden, the SCC market share was at five percent in RMC and
PC in 2010, and was expected to double in 2012. Housing and tunneling, as well as
bridge construction for the Swedish National Road Administration were the main areas of
use for SCC. In the Netherlands and Germany, the precast industry is mainly driving the
development of SCC, with an expected eight percent of market share in 2012 in
Netherlands.
Today, self-compacting concrete is being studied worldwide, with papers
presented at almost every concrete-related conference, but until now - year 2003 - there is
no universally adopted standardized test method for evaluation of self-compactability of
this concrete. Currently, the use of self-compacting concrete is being rapidly adopted in
many countries. The use of self-compacting concrete should overcome concrete
placement problems associated with the concrete construction industry. However, there
still is a need for conducting more research and development work for the measurement
and standardization of the methods for the evaluation of the self-compacting
characteristics of SCC.
1.2.1. Japan
SCC was first developed in Japan in 1988 in order to achieve more durable
concrete structures by improving the quality achieved in the construction process and the
placed material. The removal of the need for compaction of the concrete reduced the
potential for durability defects due to inadequate compaction (e.g. honeycombing).
6
The use of SCC was also found to offer economic, social and environmental
benefits over traditional vibrated concrete construction. These benefits included faster
construction and the elimination of noise due to vibration. One of the main drivers for the
development of the technology was the reduction in the number of skilled site operatives
that the Japanese construction industry was experiencing in the 1980s. The use of SCC
meant that less skilled labour was required for the placing and finishing of the concrete.
SCC was developed from the existing technology used for high workability and
underwater concretes, where additional cohesiveness is required. The first research
publications that looked into the principles required for SCC were from Japan around
1989 to 1991. These studies concentrated upon high-performance and super-workable
concretes and their fresh properties such as filling capacity, flowability and resistance to
segregation.
The first significant publication in which ‘modern’ SCC was identified is thought
to be a paper from the University of Tokyo by Ozawa et al. in 1992. The term ‘self-
compacting concrete’ is not used within the paper, although a high-performance concrete
was produced which possessed all the essential properties of a self-compacting concrete
mix.
In the following few years many research papers were published on concretes
such as super-workable, self-consolidating, highly-workable, self-placeable and highly-
fluidised concretes, all of which had similar properties to what we now know as SCC.
These were mainly papers on work into the mix design of what would become ‘SCC’ and
its associated fresh properties. In 1993, research papers were beginning to be published of
case studies on the use of these early forms of ‘SCC’ in actual applications. One of the
first published references utilising the term ‘self-compacting’ was in Japan in 1995.
After the development of this prototype SCC, intensive research began in many
places in Japan, especially within the research institutes of large construction companies,
and as a result, SCC has now been used in many practical applications.
The first significant international workshop dedicated to the material was held at
Kochi University of Technology, Japan in August 1998. The majority of these papers
7

focused upon the development of SCC in different countries, including research and
development into mix design models, mix constituents and rheology.
In April 1997, the Japanese Society of Civil Engineers (JSCE) set up a research
subcommittee with the aim of establishing recommendations for the practical application
of SCC. This was subsequently published in English in August 1999.
The 2nd International Symposium on SCC was organized by the University of
Tokyo in October 2001. A total of 74 papers plus two keynote and four invited speakers
from 20 countries were included. Since the 1st International Workshop had concentrated
mainly upon mix design and rheology, the 2nd International Symposium concentrated
more on the long-term durability and life-cycle cost of SCC.
A conference was recently held in Japan in October 2002 on Concrete Structures
in the 21st Century, which contained six papers on SCC, including four from Japan.
These papers illustrated that the basic technology of the material in Japan is relatively
well understood and that the majority of current efforts in research and development are
concentrated on taking this knowledge further into new applications such as composite
structures and sheet piling
1.2.2. Europe
In the second half of the 1990s, interest and use of SCC spread from Japan to
other countries, including Europe. Some of the first research work to be published from
Europe was at an International RILEM (International Union of Testing and Research
Laboratories of Materials and Structures) Conference in London in 1996. Papers were
presented on the design of SCC by University College London, and a mix-design model
by the Swedish Cement and Concrete Research Institute (CBI).
A Technical Committee (TC 174-SCC) was set up by RILEM in 1997 with the
objective of gathering, analysing and presenting a review of the technology of SCC, as
well as looking for unified views on testing and evaluation. Seventeen full members and
three corresponding members covering ten countries on four continents took part in the
work and a state-of-the-art report was published in 2000.
8
Sweden was the first country in Europe to begin development of SCC, and in 1993
the CBI organised a seminar in Sweden for contractors and producers, leading to a project
aimed at studying SCC for housing. As part of this project, large numbers of half-scale
house walls were cast using SCCs which were made with different filler materials. The
work from this project contributed to the first European project on SCC which began in
January 1997 and was completed in 2000. The main goal of this Brite-EuRam project
(BRPR-CT96-0366) was to develop a new vibration-free production system to lower the
overall cost of in-situ-cast concrete construction. The first part concerned the
development of SCC with or without steel fibres and the second part dealt with full-scale
experiments in civil engineering and housing. This project included partners from several
European countries, including the UK.
Parallel to this Brite-EuRam project, CBI continued work together with the
Swedish National Roads Authority (SNRA) into SCC for bridge casting. Laboratory
investigations, pre-qualifying tests, half-scale trials and finally full-scale trials were all
completed. The first of three bridges wholly cast in SCC was completed in January 1998
and is thought to be the first bridge cast with this material outside of Japan. This work
also showed that the hardened properties of SCC are superior to conventional concrete,
including compressive strength, frost resistance, permeability and reinforcement bond
strength. This is thought to be mainly due to both the increased cementitious content
generally used and the denser interfacial transition zone between the aggregate and the
paste of SCCs.
Studies also showed that total bridge building costs can be reduced by as much as
5–15% when using SCC compared with conventional concrete. An earlier report on the
same work was also published by the SNRA. This report concluded that as well as
reducing overall bridge costs, using SCC has the potential to reduce the energy
consumption and emission of greenhouse gases by 20–30% due to the reduced resources
required in the construction process and the enhanced durability of the resultant concrete.
However, it does not take into account the likely increased cement content used to make
the SCC and the additional energy required for its production.
9
The first major event dedicated to SCC in Europe was the 1st International RILEM
Symposium on SCC in Stockholm in 1999. The papers included 23 from Asia, 38 from
Europe, five from North America and one from Australia. The symposium attracted 340
participants from 35 countries, which is a ratio of 5 to 1 of participants to papers,
indicating the increasing interest in the material in Europe.
1.2.3. European Development
Development and use of SCC began to quickly spread from Sweden to other
Scandinavian countries at the end of the 1990s. The concrete industry in countries such as
France and the Netherlands have also recently been developing and using the material,
with countries such as Germany and the UK progressing closely behind. All of these
countries have now used SCC in both in situ and precast applications. Countries such as
Greece and the Eastern European countries are still mainly conducting research and
development or are at the initial site trial stage.
Two European-wide research projects are currently under way in the field of SCC.
1. Following the completion of the European-wide SCC Brite- EuRam project in
2000, it was clear that the remaining fundamental obstacle to the material’s wider
use in Europe was the absence of suitable test methods to identify its three key
properties (i.e. passing ability, filling ability and resistance to segregation). The
EU therefore agreed to support an additional three-year project from 2001 to 2004
through its Growth programme (Growth Project GRD2- 2000-30024) to develop
test methods for SCC and to prepare the way for European standardisation. The
project involves twelve European partners and is led by the University of Paisley,
Scotland.
2. A RILEM committee was also formed in September 2000 to focus on assembling
relevant existing knowledge on various aspects on the casting of SCC. The
committee aims to build further on the work of RILEM TC 174-SCC mentioned
in the previous section and the objective is to find links between the fundamental
basic mechanisms of SCC and the current practical experience regarding SCC.
The knowledge will be further developed through technical discussions and a
workshop and will result in a report on the existing available knowledge on the
casting of SCC.
10
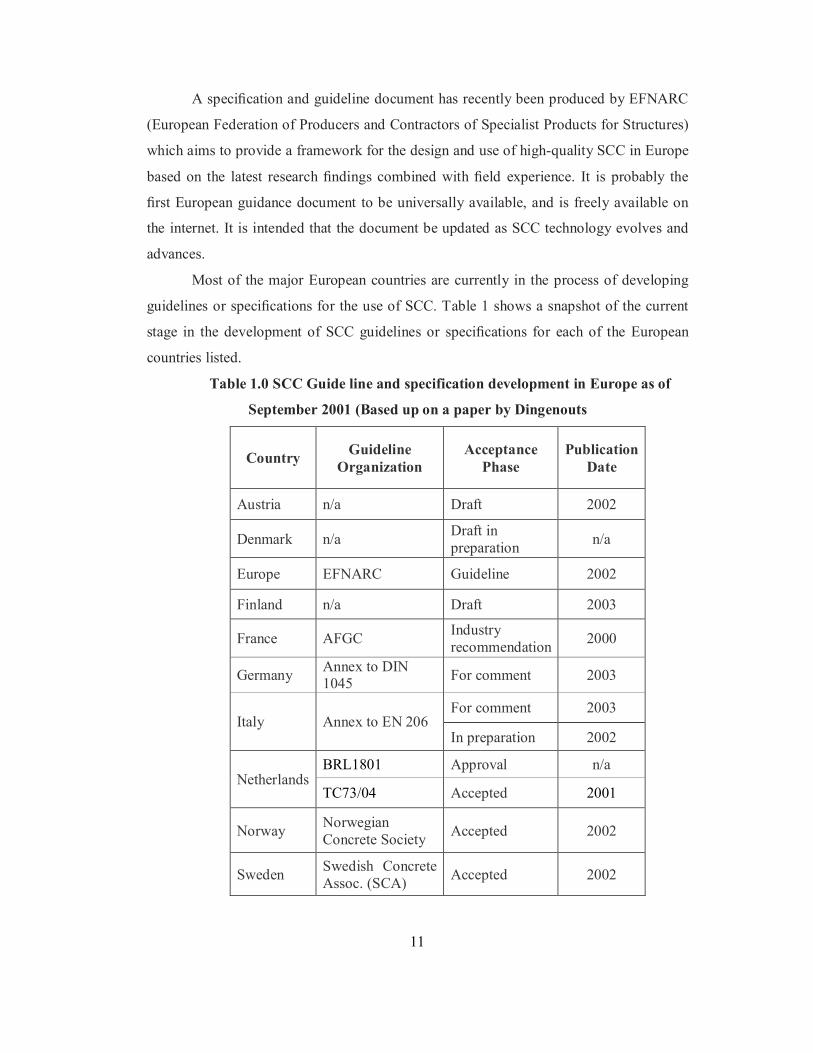
A specification and guideline document has recently been produced by EFNARC
(European Federation of Producers and Contractors of Specialist Products for Structures)
which aims to provide a framework for the design and use of high-quality SCC in Europe
based on the latest research findings combined with field experience. It is probably the
first European guidance document to be universally available, and is freely available on
the internet. It is intended that the document be updated as SCC technology evolves and
advances.
Most of the major European countries are currently in the process of developing
guidelines or specifications for the use of SCC. Table 1 shows a snapshot of the current
stage in the development of SCC guidelines or specifications for each of the European
countries listed.
Table 1.0 SCC Guide line and specification development in Europe as of
September 2001 (Based up on a paper by Dingenouts
Country Guideline Organization
Acceptance Phase
Publication Date
Austria n/a Draft 2002
Denmark n/a Draft in preparation n/a
Europe EFNARC Guideline 2002
Finland n/a Draft 2003
France AFGC Industry recommendation 2000
Germany Annex to DIN 1045 For comment 2003
For comment 2003 Italy Annex to EN 206
In preparation 2002
BRL1801 Approval n/a Netherlands
TC73/04 Accepted 2001
Norway Norwegian Concrete Society Accepted 2002
Sweden Swedish Concrete Assoc. (SCA) Accepted 2002
11
1.2.4. Scandinavia
As described earlier, Sweden was at the forefront of the development of SCC
outside Japan and it is estimated that SCC now accounts for approximately 7–10% of the
Swedish ready-mix market, up from approximately 3% in 2000. Currently, the CBI, four
universities and the government in Sweden are all conducting research into SCC.
SCC is often used in Sweden today by contractors such as NCC on a commercial
basis. NCC and other Swedish contractors are also conducting research into SCC, both
internally and with other companies and universities/institutes. The Swedish Concrete
Association (SCA) has also recently published recommendations for the use of SCC.
The volume of SCC produced in Norway has increased from approximately 0·5%
(or 12 000 m3) of total concrete volume in 2000 to approximately 1·2% (or 29 500 m3) in
2001. A Norwegian guideline for the production and use of the material was issued in late
2001 and an English translation has recently been completed.
SCC is used in Finland only to a limited degree, although companies such as
Lohja Rudus and Parma Betonila each have experience from approximately 10–20
construction sites. There is also a national project on the practical aspects of SCC led by
the Technical University of Helsinki (HUT) and VTT which began in 2001 and will finish
in 2003. No SCC standardisation as yet exists. Universities in Denmark, such as the DTU
(Technical University of Denmark), have also recently undertaken research into SCC, as
well as holding training courses on SCC.
The first project investigating SCC in Iceland was from 1996 to 1999 and was a
collaboration between the Icelandic Building Research Institute (IBRI) and an Icelandic
ready-mix concrete company, Steypusto¨ UNKNOWN SYMBOL 240 FONT¼Times
New Roman in H. F., which showed that it was possible to cast SCC in Iceland with
Icelandic materials. IBRI continue to conduct research into SCC and they are hosting the
3rd International Symposium on SCC in August 2003.
1.2.5. France France is quite active in the research and development of SCC. A national
research project on SCC called BAP (Be´tons auto-plac¸ants) is currently ongoing. French
recommendations for the use of the material were established in July 2000 and are used as
reference on construction sites.
12
The Lafarge Group have conducted a large amount of research and development
at their Laboratoire Central de Recherches (LCR) at L’Isle d’Abeau, near Lyon. Their
progress in the development of SCC is approximately two years ahead of the position in
the UK. They have spent approximately £2 million on researching and developing the
material internationally and currently produce approximately 50,000 m3/annum of SCC,
with this volume increasing almost exponentially at present.
The Lafarge Group wanted to validate the assumption that using SCC generates an
overall cost saving. They therefore worked with a contractor to simultaneously construct
two identical apartment buildings in Nanterre, France. Conventional concrete methods
were used for one building and for the second building the construction process was
adapted to utilize SCC materials and processes. The building constructed using SCC
materials and processes was completed 2·5 months before the conventionally constructed
building and with an overall project cost saving of 21·4%.
1.2.6.. Germany In Germany, SCC requires technical approval before it can be used on site. The
current DIN standards do not allow this type of concrete to be used because the
consistency and the fines content do not comply with the standard. Therefore, the DIBt
(German Institute of Technical Approvals in Berlin) requires suitability tests from a third-
party laboratory, usually universities, who then issue an official approval. Many
contractors have obtained approvals and are constructing with SCC.
At least six different universities and research establishments in Germany are also
conducting research into SCC. The University of Stuttgart is also involved with the
current European-wide SCC test methods project (Growth GRD2-2000- 30024).
1.2.7. Belgium A Belgian national contact group on SCC exists chaired by Professor De Schutter
of the University of Ghent. This group of universities, contractors, suppliers and other
interested parties meet several times a year to discuss SCC development in Belgium.
Several national research projects on SCC are also currently under way, funded
mainly by the National Fund for Scientific Research, Flanders, and other interested
parties. These projects are investigating the transport of potentially aggressive media in
SCC, the spalling behaviour of SCC and the integration of SCC into the building industry.
13

1.2.8. Spain
SCC production is just beginning in Spain, but the first structures have already
been constructed in Malaga, Valencia and Madrid. The current problem is that SCC is not
included in the basic Spanish regulations for concrete, and so care has to taken and its use
fully justified. Instituto Eduardo Torroja de Ciencias de la Construccio´n (CSIC) is
leading the standardisation group for SCC in the Spanish National Standardisation
Agency (AENOR). The target is to issue some Spanish standards on SCC by the end of
2002. They are also collaborating with other Spanish research groups such as UPC
(Universitat Polite`cnica de Catalunya) in Barcelona
1.2.9. Holland
The precast concrete industry in the Netherlands first became interested in SCC in
1998. A project was begun to develop SCC precast applications by the Belton Group, an
association of 24 precasters, which is a subsidiary of BFBN (Association of the Dutch
Concrete and Precasting Industry). Although the Belton project was formally completed
in December 1999, intensive collaboration in SCC is still continuing. In 2002 a total
volume of 2,50,000 m3of precast SCC is expected to be produced and approximately 30
companies have been certified for the production of SCC pre-cast elements.
Guidelines for ready-mix SCC are finished and are expected to be approved by the
end of 2002, at which point the certification of ready-mix plants can begin. Currently,
ready-mix SCC is being used, but mainly for demonstration projects. 1.2.10. Switzerland
SCC currently accounts for approximately 1% of the ready-mix concrete market
in Switzerland and the material has largely been developed by trial and error. The use of
SCC is currently not limited by Swiss standards because the standards apply to
performance and not the composition of concrete. Research into SCC has been conducted
at the Swiss Federal Institute of Technology (ETH) in Zurich and at the EMPA (Swiss
Federal Institute for Materials Testing and Research) in Du¨bendorf.
1.2.11. Italy
In Italy the majority of SCC applications are in the precast market, although SCC
has been used for in situ applications. The Italian Standards Institute has just completed a
14
document on SCC, which is now being considered as a Standard (as an annex to EN 206-
1). The Italian Ready-Mixed Concrete Producers Association is also preparing guidelines
on SCC. 1.2.12. Other European countries
Other countries in Europe such as the Czech Republic and Greece are also
beginning to research and construct with SCC. A bridge abutment and an experimental
tunnel lining have both been cast with SCC in Prague and a trial was held for the use of
SCC in the 2·5 km cable-stayed bridge over the Corinthian Gulf in Greece.
1.2.13. UK Development
Until about four years ago, interest in SCC in the UK was largely confined to
research studies at Paisley University and University College London (UCL). There has,
however, been a rapid increase in interest from UK industry in the last three years. Two
of the first site applications were in 2000 for the Midsummer Place shopping centre
extension in Milton Keynes and the Millennium Point project in Birmingham.
The Concrete Society in the UK formed a working party early in 1999 consisting
of 18 experts from universities, suppliers, producers, designers and contractors with the
aim to maintain a watching brief on the impact and uptake of SCC in the UK. They have
recently produced both an information sheet and Part 1 of a Current Practice Sheet. The
Part 1 report deals with materials, properties, production and placing of SCC. At the time
of writing, Part 2, which will cover production, placing and optimisation of the
construction process, was 90% complete.
A three-year research project into SCC in the UK is also currently being
conducted by the Building Research Establishment’s (BRE) Centre for Concrete
Construction. This work is funded by the UK Department of Trade and Industry’s (DTI’s)
Construction Industry Directorate. The aim of the project is to encourage the wider use of
SCC by the UK construction industry, and to demonstrate the economic, social and
environmental advantages it offers over traditional vibrated concrete construction. The
work involves consulting with UK industry on its perceptions of SCC, researching the
production of SCC mixes suited to industry needs and disseminating this and additional
information through demonstration events and the publication of case studies and
guidance material.
15
1.2.14. Academic institutions
The leading academic institution in the UK with regard to SCC is the Advanced
Concrete and Masonry Centre at the University of Paisley. This team is led by Professor
Bartos and also includes John Gibbs and Dr Mohammed Sonebi. They were key members
of the original Brite-EuRam project (BRPR-CT96- 0366) mentioned in the previous
section and are leading the current European-wide project on test methods. In addition,
Professor Bartos is Chairman and John Gibbs the Secretary of the Concrete Society
Working Party on SCC. Paisley University also began an 18-month Government-funded
research project in December 2001 aimed at reducing the cost of SCC and encouraging its
use in general construction.
As mentioned earlier, the other academic institution in the UK with a history of
research into SCC is University College London (UCL). The work into SCC is being
coordinated by Dr Peter Domone, who is also a member of the Concrete Society Working
Party on SCC. UCL is also involved with the European-wide project on the testing of
SCC.
Dundee University’s Concrete Technology Unit has also recently begun a three-
year research project investigating the formwork pressures generated by SCCs and other
specialist concretes. This project will determine if the current CIRIA formwork pressure
recommendations are applicable to current new materials and types of concrete such as
SCC, and if not, safe design pressures will be established.
1.2.15. Concrete producers
RMC Ready-mix Ltd is the UK’s leading supplier of ready-mixed concrete. The
company has been undertaking development work on SCC since 1998 with the aim of
producing mix design criteria for materials local to any of their 325 batching plants
throughout the UK. It was originally thought that the material would be a niche product,
but RMC is now concentrating upon developing more economical mixes to enable the
material to be more universally used. This development is targeted at customer needs in
terms of the application, strength requirement and other technical factors that may be
specified.
16
Lafarge Aggregates Ltd have been conducting research and development into SCC in
France for several years, and it is now available at each of their plants in the UK. Lafarge
produce their own family of admixtures especially for the production of SCC, called
Agilia. These products are fully developed and are all currently available and Lafarge see
the next step as getting these existing products accepted and used by the market.
Tarmac Topmix Ltd first began researching and developing SCC in 1998 and first
started using it at their precast factory at Tallington in 1999. The first ready-mixed SCC
was supplied in 2000 and the eventual aim is to make it available at all plants in the
country.
1.2.16. Admixture suppliers
Sika Ltd launched Sika ViscoCrete in the UK in 1998, which was the first
admixture on the UK market specifically for producing SCC. Six different types are
available and it can be used with either retarders or accelerators. Other admixture
manufactures have now followed this lead. MBT and Grace.
Construction Products both produce admixtures for the UK SCC market,
including superplasticisers, viscosity-modifying admixtures and specialist admixtures for
precast applications. The ready-mix companies RMC and Lafarge produce their own
admixtures for SCC. 1.2.17. Consultants
Consultants in the UK do not generally undertake any concrete research or
development directly, but do sometimes sponsor or collaborate in research projects at
universities and research organisations. Mott MacDonald have an established track record
with the development of specifications and guidance notes for SCC and are a member of
the Concrete Society Working Party on SCC. They have also worked closely with ready-
mix suppliers and contractors to use the material on a variety of projects throughout the
UK. However, many UK consultants are cautious when specifying SCC due to the lack of
existing guidance, standards and test methods and the lack of an established track record
for the material.
17
1.2.18. Contractors
Contractors in the UK generally rely upon the ready-mix supplier for any
expertise in SCC mix design. However, knowledge and appreciation of the material
among contractors is slowly increasing as the use of SCC becomes more widespread.
John Doyle Construction are probably the leading contractor in the UK in the use
of SCC and are involved in several research and development projects such as the
European SCC test methods project and the project on formwork pressures at Dundee
University. They have used the material several times in the UK in actual applications
such as column encasement and basements, although its use is still job-specific. Site trials
are always conducted before SCC is used in the intended structure.
Other contractors have used SCC in the UK but its use is still job-specific, often to
solve a problem during construction such as congested reinforcement.
1.2.19. UK precasters
Aarsleff Piling’s Balderton premises claim to be the UK’s first user of SCC in
precast pile production. An SCC mix was developed in partnership with RMC with a
compressive strength of 26–28 MPa at only 16 hours. At nine days the 50 MPa mark had
been passed and the piles could be driven. Aarsleff have also won a £4·25 million
contract to supply and install approximately 3000 precast concrete piles for the Channel
Tunnel Rail Link. SCC was used for these piles and casting began in June 2002 with
installation beginning the following month.
Tarmac Precast Concrete Ltd are also now using SCC at their three UK precast
plants. SCC currently accounts for approximately 65% of bespoke production at their
Tallington plant and their long-term objective is to convert fully to SCC when economics
and practicalities allow Current contracts are for prison units, double-T beams and
columns. Trent Concrete Ltd in Nottingham has been experimenting with SCC for the last
two years and production using the material first began in August 2002. 1.2.20. Seminars and events
The SCI (Society of Chemical Industry) held a seminar on SCC in January 2001 in
London. Approximately 60 delegates attended and the speakers were the main
18

practitioners of SCC in the UK from the areas of research (Professor P. Bartos), design
(Dr N. Henderson), ready-mix (R. Gaimster) and contracting (P. Goring). This meeting
was one of the first events in the UK to begin to introduce the material to members of the
construction industry who had no experience or knowledge of SCC.
A demonstration and international workshop on SCC, lasting a total of two and a
half days, was held at the Advanced Concrete and Masonry Centre at Paisley University
in May/ June, 2001. The event was attended by 70 delegates from eleven countries and
helped raise the awareness and knowledge of the material in Scotland and the rest of the
UK.Four demonstration events on SCC around the UK have also recently been held by
BRE’s Centre for Concrete Construction as part of their DTI-funded project on SCC,
which combined practical demonstrations with presentations by industry experts on SCC.
The events were aimed at people in the industry with little or no knowledge of the
material, with more than 140 people attending the four events
1.2.21. The Future
From its origins in Japan in the late 1980s, research, development and use of SCC
has spread steadily throughout the world. Approximately 7–10% of the Swedish ready-
mix market is now SCC and research is being conducted in virtually every country in
Europe. National working groups on the material now exist in some form in most
countries in Europe, with the majority of them working towards producing some form of
guidance on the use of SCC.
Large amounts of research and development are now also being conducted in
Canada and the USA at places such as the University of Sherbrooke and the University´
Laval. The first North American conference on SCC was held in November 2002 by
Northwestern University. American concrete organisations such as the American
Concrete Institute (ACI), American Society for Testing and Materials (ASTM) and PCI
(Precast/Prestressed Concrete Institute) have all recently formed committees to produce
guidelines, standards and specifications for SCC.
The material is slowly gaining acceptance in this huge market and already it is
estimated that approximately 4,000–5,000 m3 is used per day in precast applications in
19

North America. Nearly 1,00,000 m3 of ready-mixed SCC has also so far been used in
North America.
Countries such as Argentina, Australia and New Zealand are also all now
beginning to conduct research and development work into SCC, with more countries sure
to follow. A third International Symposium on SCC is being held in Iceland in August
2003, where much of the research and development work presently under way will be
presented.
The main barrier to the increased use of SCC in the UK and Europe seems to be
the lack of experience of the process, and the lack of published guidance, codes and
specifications. This situation will improve, however, as experience and knowledge
increases and each country begins to produce its own guidance and specifications.
Precasters are currently the overwhelming users of SCC in the UK, in Europe and
in the USA. This is partly due to them owning and operating the on-site batching plant,
and so they are able to take full advantage of all the potential benefits of SCC. They can
also minimise or control the potential disadvantages of the material (such as inconsistency
of supply and site acceptance). In the countries where SCC has been adopted relatively
quickly, such as Japan and Sweden, the ready-mix concrete producers are owned or
operated by the contractors, therefore the increased material costs can be directly offset
by savings in the construction process, in a similar way to precast production.
Although SCC is not expected to ever completely replace conventionally vibrated
concrete, the use of the material in both the precast and ready-mix markets in the UK,
Europe and the rest of the world is expected to continue to increase. The main drivers for
this increase in use are expected to include
1. An increase in the experience of both producers, contractors, designers and
clients.
2. An increase in available guidance on the production, design and use of SCC.
3. A decrease in the unit cost of the material as technology and experience
improves.
4. The demand from clients for a higher-quality finished product.
5. The decrease in skilled labour available in many countries for both the
placing and finishing of concrete.
20

1.3 Motive for Development of Self-Compacting Concrete The motive for development of self-compacting concrete was the social problem
on durability of concrete structures that arose around 1983 in Japan. Due to a gradual
reduction in the number of skilled workers in Japan's construction industry, a similar
reduction in the quality of construction work took place. As a result of this fact, one
solution for the achievement of durable concrete structures independent of the quality of
construction work was the employment of self-compacting concrete, which could be
compacted into every corner of a formwork, purely by means of its own weight (Figure
1.1). Studies to develop self-compacting concrete, including a fundamental study on the
workability of concrete, were carried out by researchers Ozawa and Maekawa (Bartos,
2000) at the University of Tokyo.
Figure 1.1 Necessity of Self-Compacting Concrete (Ouchi and Hibino, 2000).
During their studies, they found that the main cause of the poor durability
performances of Japanese concrete in structures was the inadequate consolidation of the
concrete in the casting operations. By developing concrete that self-consolidates, they
eliminated the main cause for the poor durability performance of the concrete. By 1988,
the concept was developed and ready for the first real-scale tests and at the same time the
first prototype of self-compacting concrete was completed using materials already on the
market. The prototype performed satisfactorily with regard to drying and hardening
shrinkage, heat of hydration, denseness after hardening, and other properties and was
named “High Performance Concrete.”
At almost the same time, “High Performance Concrete” was defined as a concrete
with high durability due to low water-cement ratio by professor Aitcin (Ouchi et al.,
21
Skill of workers
Self-Compacting Concrete
Durable concrete structures
Decreasing in the future
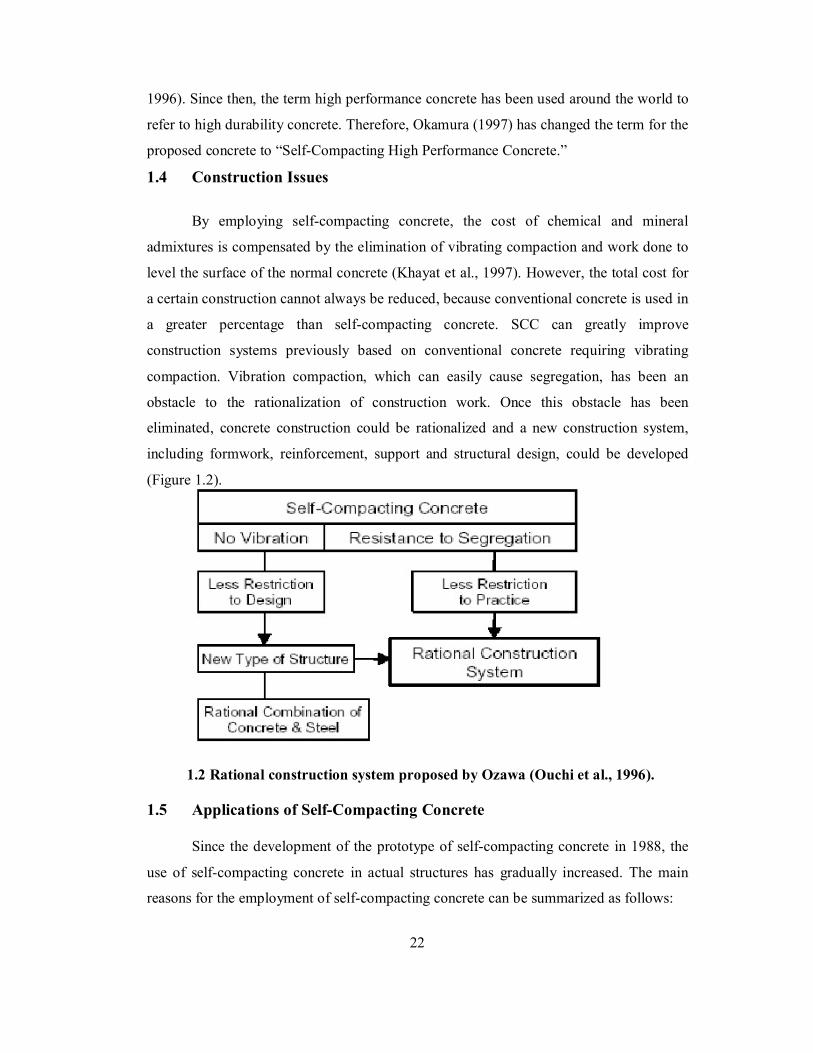
1996). Since then, the term high performance concrete has been used around the world to
refer to high durability concrete. Therefore, Okamura (1997) has changed the term for the
proposed concrete to “Self-Compacting High Performance Concrete.”
1.4 Construction Issues
By employing self-compacting concrete, the cost of chemical and mineral
admixtures is compensated by the elimination of vibrating compaction and work done to
level the surface of the normal concrete (Khayat et al., 1997). However, the total cost for
a certain construction cannot always be reduced, because conventional concrete is used in
a greater percentage than self-compacting concrete. SCC can greatly improve
construction systems previously based on conventional concrete requiring vibrating
compaction. Vibration compaction, which can easily cause segregation, has been an
obstacle to the rationalization of construction work. Once this obstacle has been
eliminated, concrete construction could be rationalized and a new construction system,
including formwork, reinforcement, support and structural design, could be developed
(Figure 1.2).
1.2 Rational construction system proposed by Ozawa (Ouchi et al., 1996).
1.5 Applications of Self-Compacting Concrete
Since the development of the prototype of self-compacting concrete in 1988, the
use of self-compacting concrete in actual structures has gradually increased. The main
reasons for the employment of self-compacting concrete can be summarized as follows:
22
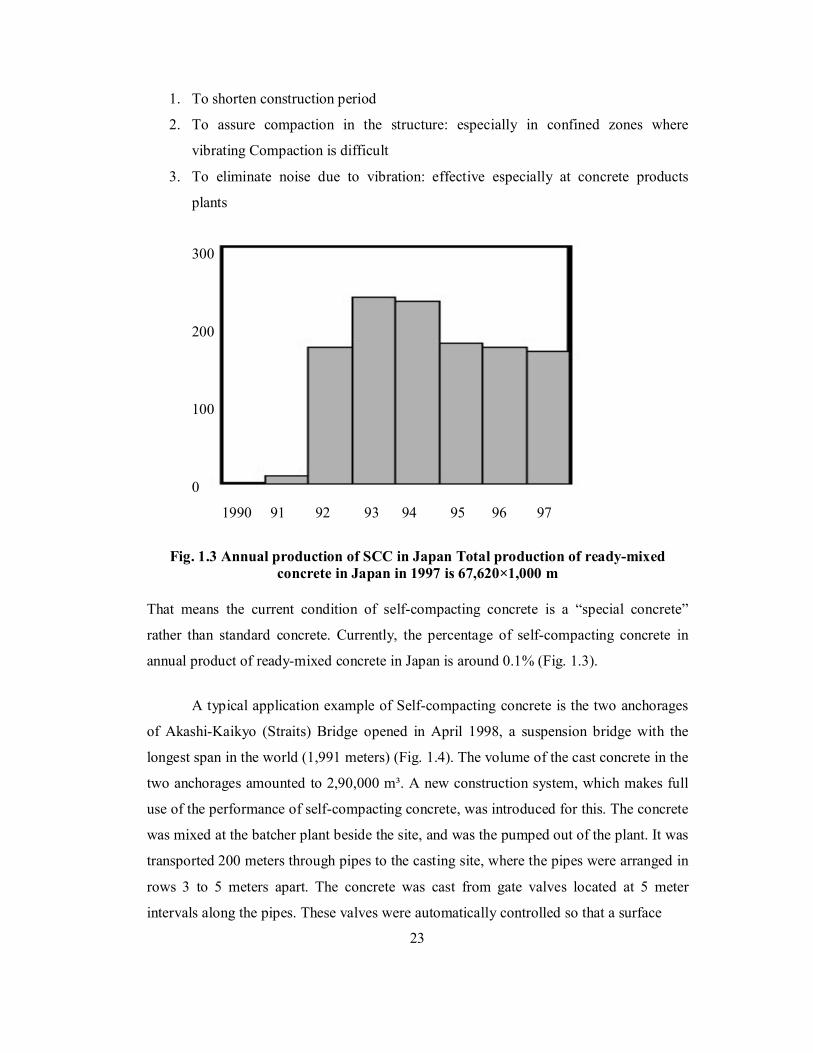
1. To shorten construction period
2. To assure compaction in the structure: especially in confined zones where
vibrating Compaction is difficult
3. To eliminate noise due to vibration: effective especially at concrete products
plants
300
200
100
0
1990 91 92 93 94 95 96 97
Fig. 1.3 Annual production of SCC in Japan Total production of ready-mixed
concrete in Japan in 1997 is 67,620×1,000 m That means the current condition of self-compacting concrete is a “special concrete”
rather than standard concrete. Currently, the percentage of self-compacting concrete in
annual product of ready-mixed concrete in Japan is around 0.1% (Fig. 1.3).
A typical application example of Self-compacting concrete is the two anchorages
of Akashi-Kaikyo (Straits) Bridge opened in April 1998, a suspension bridge with the
longest span in the world (1,991 meters) (Fig. 1.4). The volume of the cast concrete in the
two anchorages amounted to 2,90,000 m³. A new construction system, which makes full
use of the performance of self-compacting concrete, was introduced for this. The concrete
was mixed at the batcher plant beside the site, and was the pumped out of the plant. It was
transported 200 meters through pipes to the casting site, where the pipes were arranged in
rows 3 to 5 meters apart. The concrete was cast from gate valves located at 5 meter
intervals along the pipes. These valves were automatically controlled so that a surface
23
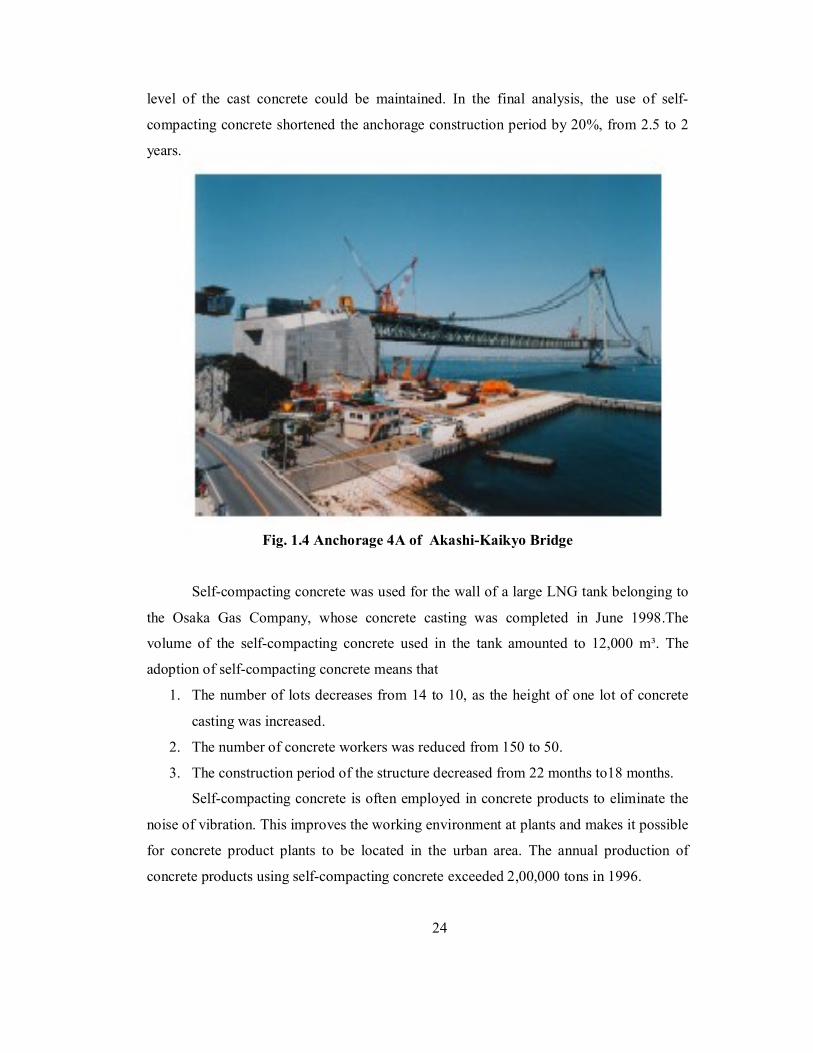
level of the cast concrete could be maintained. In the final analysis, the use of self-
compacting concrete shortened the anchorage construction period by 20%, from 2.5 to 2
years.
Fig. 1.4 Anchorage 4A of Akashi-Kaikyo Bridge
Self-compacting concrete was used for the wall of a large LNG tank belonging to
the Osaka Gas Company, whose concrete casting was completed in June 1998.The
volume of the self-compacting concrete used in the tank amounted to 12,000 m³. The
adoption of self-compacting concrete means that
1. The number of lots decreases from 14 to 10, as the height of one lot of concrete
casting was increased.
2. The number of concrete workers was reduced from 150 to 50.
3. The construction period of the structure decreased from 22 months to18 months.
Self-compacting concrete is often employed in concrete products to eliminate the
noise of vibration. This improves the working environment at plants and makes it possible
for concrete product plants to be located in the urban area. The annual production of
concrete products using self-compacting concrete exceeded 2,00,000 tons in 1996.
24

1.6 Existing Tests for Fresh SCC Mixes
Fresh SCC must possess at required levels the following key properties:
1.6.1. Filling ability: This is the ability of the SCC to flow into all spaces within the
formwork under its own weight.
1.6.2. Passing ability: This is the ability of the SCC to flow through tight openings such
as spaces between steel reinforcing bars, under its own weight.
1.6.3. Resistance to segregation: The SCC must meet the required levels of properties
A & B whilst its composition remains uniform throughout the process of transport and
placing. Many tests have been used in successful applications of SCC. However, in all the
projects the SCC was produced and placed by an experienced contractor whose staff has
been trained and acquired experience with interpretation of a different group of tests. In
other cases, the construction was preceded by full-scale trials in which a number, often
excessive, of specific tests was used (Ouchi et al., 1996). The same tests were later used
on the site itself.
Below is a brief summary of the more common tests currently used for assessment
of fresh SCC.
1.6.4 U-type test:
Of the many testing methods used for evaluating self-compactability, the U-type
test (Figure 1.5) proposed by the Taisei group is the most appropriate, due to the small
amount of concrete used, compared to others (Ferraris, 1999). In this test, the degree of
compactability can be indicated by the height that the concrete reaches after flowing
through obstacles. Concrete with the filling height of over 300 mm can be judged as self-
compacting. Some companies consider the concrete self-compacting if the filling height is
more than 85% of the maximum height possible.
25

>300mm
Figure 1.5 U-type test (Ouchi and Hibino, 2000).
1.6.5. Slump Flow test:
The basic equipment used is the same as for the conventional Slump test. The test
method differs from the conventional one by the fact that the concrete sample placed into
the mold is not rodded and when the slump cone is removed the sample collapses
(Ferraris, 1999). The diameter of the spread of the sample is measured, i.e. a horizontal
distance is determined as opposed to the vertical distance in the conventional Slump test.
The Slump Flow test can give an indication as to the consistency, filling ability and
workability of SCC. The SCC is assumed of having a good filling ability and consistency
if the diameter of the spread reaches values between 650mm to 800mm.
1.6.6. L-Box test:
This method uses a test apparatus comprising of a vertical section and a horizontal
trough into which the concrete is allowed to flow on the release of a trap door from the
vertical section passing through reinforcing bars placed at the intersection of the two
areas of the apparatus (Dietz and Ma, 2000). The time that it takes the concrete to flow a
distance of 200mm (T-20) and 400mm (T-40) into the horizontal section is measured, as
is the height of the concrete at both ends of the apparatus (H1 & H2). The L-Box test can
give an indication as to the filling ability and passing ability.
26
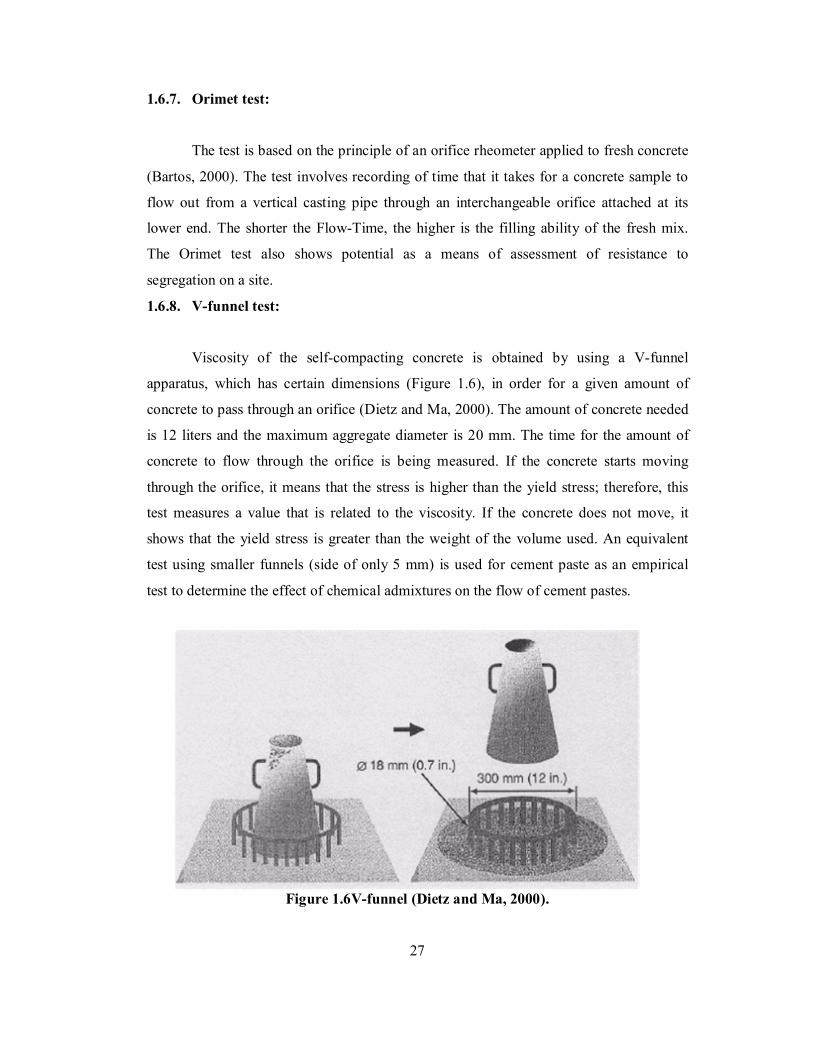
1.6.7. Orimet test:
The test is based on the principle of an orifice rheometer applied to fresh concrete
(Bartos, 2000). The test involves recording of time that it takes for a concrete sample to
flow out from a vertical casting pipe through an interchangeable orifice attached at its
lower end. The shorter the Flow-Time, the higher is the filling ability of the fresh mix.
The Orimet test also shows potential as a means of assessment of resistance to
segregation on a site.
1.6.8. V-funnel test:
Viscosity of the self-compacting concrete is obtained by using a V-funnel
apparatus, which has certain dimensions (Figure 1.6), in order for a given amount of
concrete to pass through an orifice (Dietz and Ma, 2000). The amount of concrete needed
is 12 liters and the maximum aggregate diameter is 20 mm. The time for the amount of
concrete to flow through the orifice is being measured. If the concrete starts moving
through the orifice, it means that the stress is higher than the yield stress; therefore, this
test measures a value that is related to the viscosity. If the concrete does not move, it
shows that the yield stress is greater than the weight of the volume used. An equivalent
test using smaller funnels (side of only 5 mm) is used for cement paste as an empirical
test to determine the effect of chemical admixtures on the flow of cement pastes.
Figure 1.6V-funnel (Dietz and Ma, 2000).
27
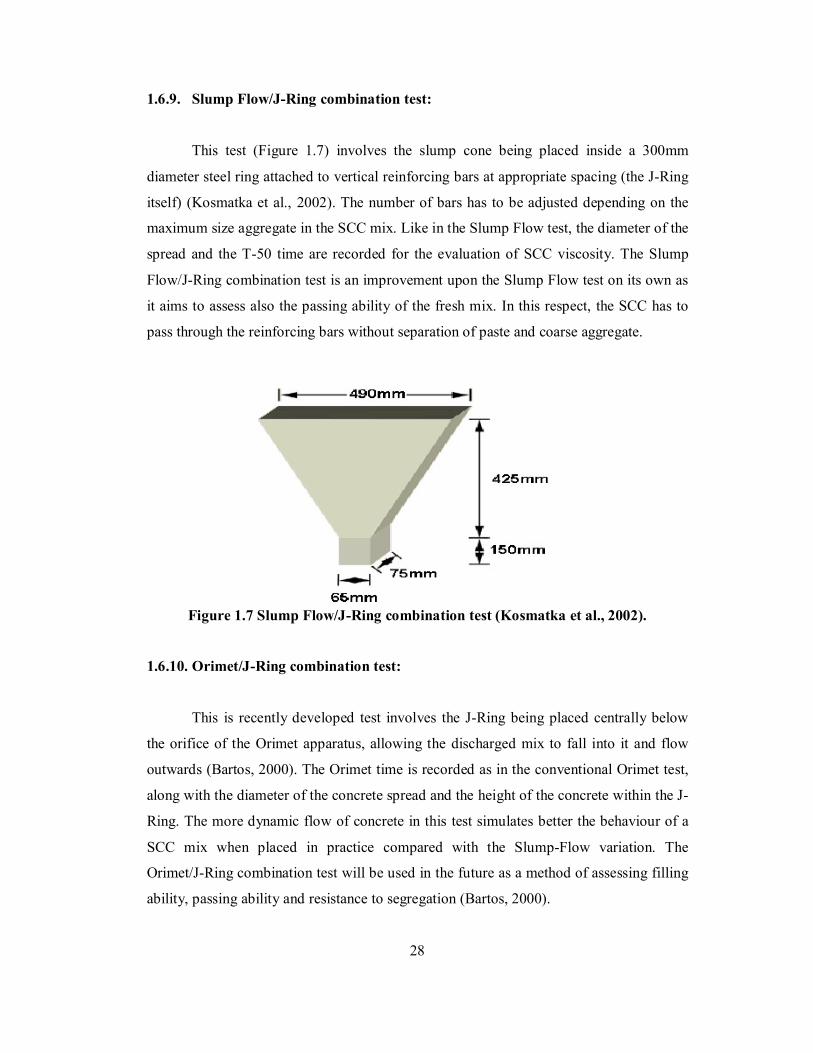
1.6.9. Slump Flow/J-Ring combination test:
This test (Figure 1.7) involves the slump cone being placed inside a 300mm
diameter steel ring attached to vertical reinforcing bars at appropriate spacing (the J-Ring
itself) (Kosmatka et al., 2002). The number of bars has to be adjusted depending on the
maximum size aggregate in the SCC mix. Like in the Slump Flow test, the diameter of the
spread and the T-50 time are recorded for the evaluation of SCC viscosity. The Slump
Flow/J-Ring combination test is an improvement upon the Slump Flow test on its own as
it aims to assess also the passing ability of the fresh mix. In this respect, the SCC has to
pass through the reinforcing bars without separation of paste and coarse aggregate.
Figure 1.7 Slump Flow/J-Ring combination test (Kosmatka et al., 2002).
1.6.10. Orimet/J-Ring combination test:
This is recently developed test involves the J-Ring being placed centrally below
the orifice of the Orimet apparatus, allowing the discharged mix to fall into it and flow
outwards (Bartos, 2000). The Orimet time is recorded as in the conventional Orimet test,
along with the diameter of the concrete spread and the height of the concrete within the J-
Ring. The more dynamic flow of concrete in this test simulates better the behaviour of a
SCC mix when placed in practice compared with the Slump-Flow variation. The
Orimet/J-Ring combination test will be used in the future as a method of assessing filling
ability, passing ability and resistance to segregation (Bartos, 2000).
28
1.6.11. GTM Segregation test:
This is a very recent test measuring the separation of aggregate in a sample after a
period of time and wet sieving. The test has a potential for detection of tendency to
segregate (Dehn et al., 2000). It completes the tests (Slump-Flow, L-Box, etc.) carried out
to estimate the filling ability in free or shut-in environment (i.e. with some "wall-effect")
by specifying the segregation resistance. This test can be used in laboratory when
developing a concrete mix, as well as on site, when carrying out suitability tests on the
delivered concrete.
1.7. Development of Prototype
The prototype of Self-compacting Concrete was first developed in 1988 using
materials already on the market. The prototype performed satisfactorily with regard to
drying and hardening shrinkage, heat of hydration, denseness after hardening, and other
properties. This concrete was named “High Performance Concrete”.
At almost the same time, Professor Aitcin defined “High Performance Concrete”
as a concrete with high durability due to low water-cement ratio. Since then, the term
high performance concrete has been used around the world to refer to high durability
concrete. Therefore, Okamura has changed the term for the proposed concrete to “Self-
Compacting High Performance Concrete”.
Self-compacting concrete (SCC) has been described as “The most revolutionary
development in concrete construction for several decades”. Originally developed to offset
a growing shortage of skilled labour, It has proved beneficial economically because of a
number of factors as noted below.
1. Faster construction,
2. Reduction in site manpower,
3. Easier placing,
4. Uniform and complete consolidation,
5. Better surface finishes,
6. Improved durability,
7. Increased bond strength,
29
8. Greater freedom in design,
9. Reduced noise levels, due to absence of vibration, and
10. Safe working environment.
All the engineering components undergo multi-axial Stress-Strain condition either
from particular geometry of the body or multi axial nature of the load itself. Many of
these components are prone to fatigue failure and hence much effort is spent in
understanding the response of the materials.
1.8 Scope and Objectives of Investigation Poor quality of vibration of concrete, in congested locations, has often been a
shortcoming of traditional concrete. In such situations, SCC, which follows under its own
weight and does not require any external vibration for compaction has revolutionized
concrete placement. SCC does not show segregation and bleeding. Self-compacted
ability is largely affected by the characteristics of materials and mix proportion.
In the present study, it was to achieve required properties of Self-compacting
concrete with available materials in the laboratory. Coarse aggregate with nominal size
12.5mm (70%) & 20mm (30%) was used. Also, Viscosity Modifying Admixtures (VMA)
was used to increase the suspension power of aggregates and also to eliminate possible
segregation. Fine powdered materials like fly ash is also used to eliminate possible
segregation.
In the present study, confinement in the form of hoops of 6mm diameter was used.
The mechanical properties and Stress-Strain behaviour were studied for GFRSCC with
and without confinement under compression.
A single polynomial empirical equation in the form of 21
CBDAf
is used
for both ascending and descending portion of the curve. A, B are the constants and
determined using the boundary conditions and verifying whether the experimental data is
related with the mathematically calculated data.
where, f is the stress at any level and ε is the strain at any level. To express in
Non-dimensional stress-strain curves the following form is proposed.
30
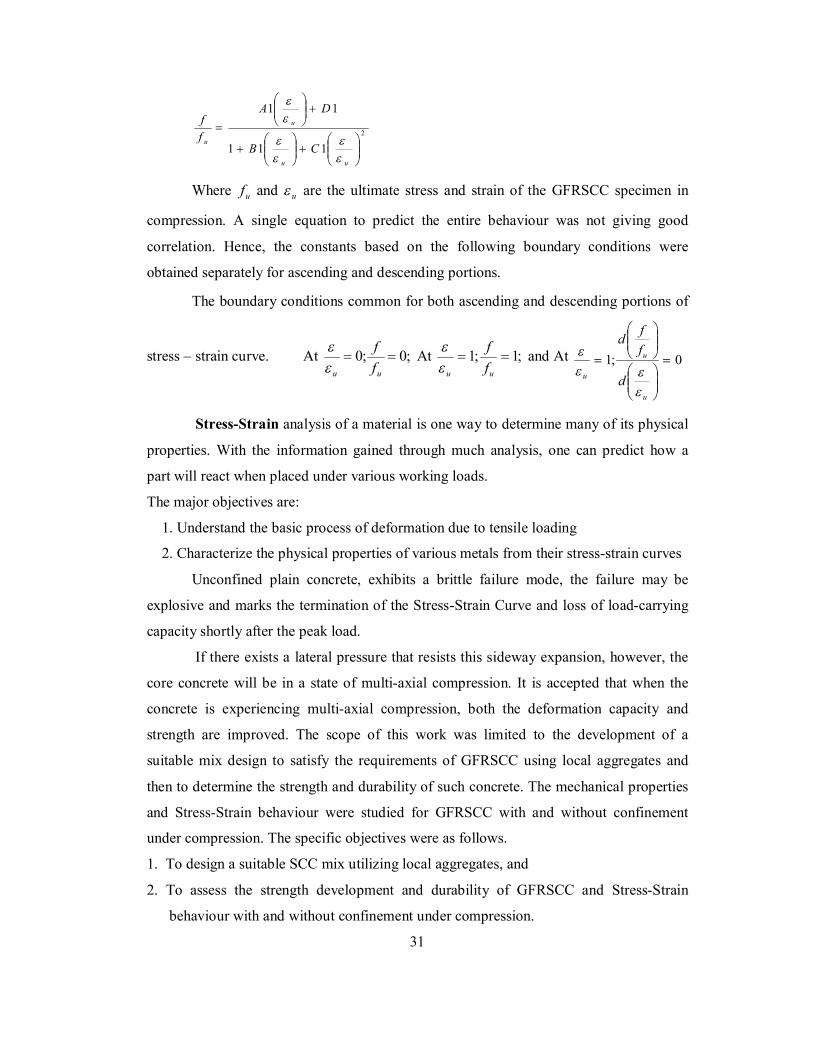
2
111
11
uu
u
uCB
DA
ff
Where uf and u are the ultimate stress and strain of the GFRSCC specimen in
compression. A single equation to predict the entire behaviour was not giving good
correlation. Hence, the constants based on the following boundary conditions were
obtained separately for ascending and descending portions.
The boundary conditions common for both ascending and descending portions of
stress – strain curve. At ;0;0 uu ff
At ;1;1
uu ff
and At 0;1
u
u
u d
ffd
Stress-Strain analysis of a material is one way to determine many of its physical
properties. With the information gained through much analysis, one can predict how a
part will react when placed under various working loads.
The major objectives are:
1. Understand the basic process of deformation due to tensile loading
2. Characterize the physical properties of various metals from their stress-strain curves
Unconfined plain concrete, exhibits a brittle failure mode, the failure may be
explosive and marks the termination of the Stress-Strain Curve and loss of load-carrying
capacity shortly after the peak load.
If there exists a lateral pressure that resists this sideway expansion, however, the
core concrete will be in a state of multi-axial compression. It is accepted that when the
concrete is experiencing multi-axial compression, both the deformation capacity and
strength are improved. The scope of this work was limited to the development of a
suitable mix design to satisfy the requirements of GFRSCC using local aggregates and
then to determine the strength and durability of such concrete. The mechanical properties
and Stress-Strain behaviour were studied for GFRSCC with and without confinement
under compression. The specific objectives were as follows.
1. To design a suitable SCC mix utilizing local aggregates, and
2. To assess the strength development and durability of GFRSCC and Stress-Strain
behaviour with and without confinement under compression.
31
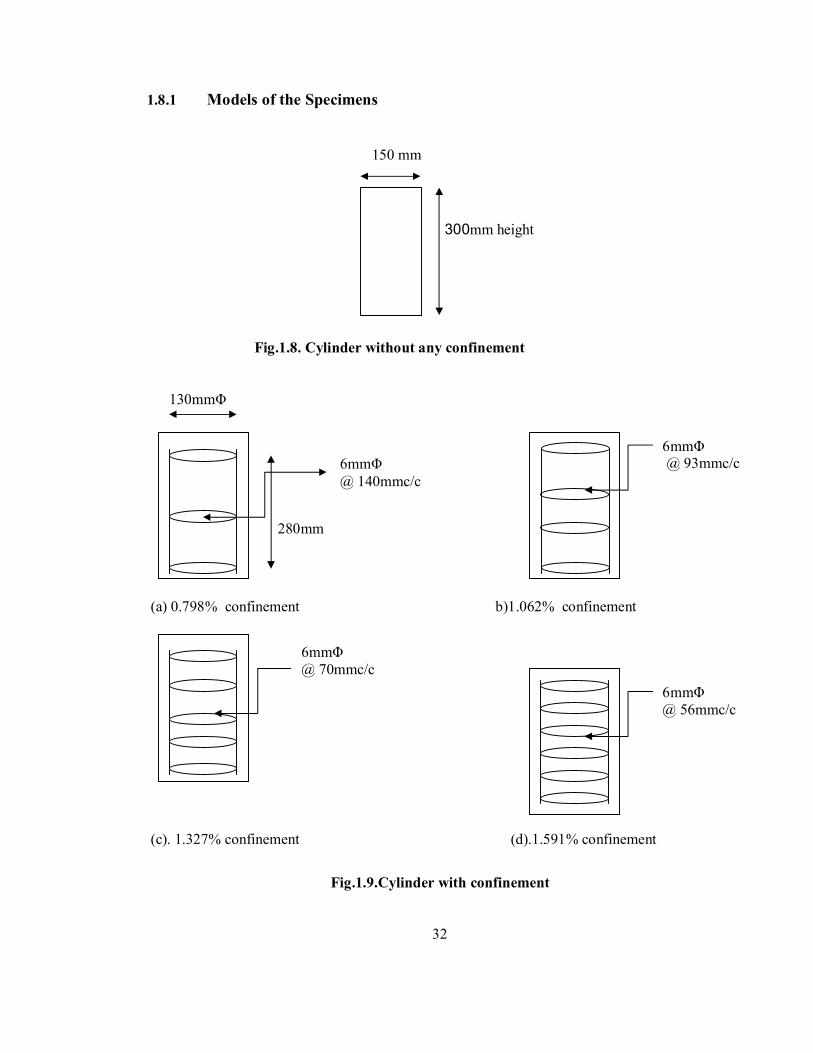
1.8.1 Models of the Specimens
150 mm 300mm height
Fig.1.8. Cylinder without any confinement
130mmΦ
280mm
(a) 0.798% confinement b)1.062% confinement
(c). 1.327% confinement (d).1.591% confinement
Fig.1.9.Cylinder with confinement
32
6mmΦ @ 140mmc/c
6mmΦ @ 93mmc/c
6mmΦ @ 70mmc/c
6mmΦ @ 56mmc/c
Steel as a confining material is used in Concrete and the properties of concrete
was studied. The concrete bond strength should be sufficient to prevent bond failure. The
effectiveness of bond is affected by the position of the embedded bars and the quality of
concrete as cast. An adequate concrete cover is necessary in order to properly transfer
bond stresses between steel and concrete. The main reasons for taking steel as a
reinforcing material is
1 Its thermal coefficient of expansion is similar to that of Concrete.
2 It develops good bond with concrete.
3 It is cheaply and easily available in the market.
4 It is economical comparing to all the aspects.
1.8.2 Advantages of Reinforced Structures
1 The combination of steel and concrete is economical because compressive
forces are borne by concrete and tensile forces by steel.
2 The combination of steel land concrete provides a monolithic character
and provides much rigidity to the structure.
3 They require less cost of maintenance because these are not attacked by
termites.
4 They are durable and fire resisting.
5 They are almost impermeable to moisture.
6 Due to the plastic properties of RCC, the RCC structures can be
constructed of any desired shape.
Glass-Fiber Reinforced Concrete (GFRC) is composed of concrete, reinforced
with glass fibers to produce a thin light weight, yet strong material. Though concrete has
been used through out the ages, GFRC is still a relatively new invention. High
compressive strengths. Ability to reproduce fine surface details, low maintenance
requirements, low coefficients of thermal GFRC the ideal choice for Civil Engineers.
Considering the advantages of SCC and GFRSCC an attempt has been made to
combine these two and Stress-Strain behavior is studied.
33
1.8.3. Investigations on Self-Compacting Concrete
Various investigations have been carried out in order to make self-compacting
concrete a standard one. The items to be solved are summarized as follows:
1. Self-compactability testing method
2. Mix-design method including evaluation method for materials
3. Construction method including acceptance test at jobsite
4. New construction system to make full use of the performance of SCC
The investigations were carried out at each university, large construction company
and material maker. Committee activities were also carried out. As the result,
Architectural Institute of Japan and Japan Society of Civil Engineers established
“Recommendations for Mix Design and Construction Practice of Highly Fluidity
Concrete” in 1997 and “Recommendation for Construction of Self-Compacting Concrete”
in 1998 respectively. The national ready-mixed concrete industry association, Japan,
established “Manual for Manufacturing of Self-Compacting Concrete” in 1998.
1.8.4. Mix-design method
Self-compactability can be largely affected by the characteristics of materials and
the mix- proportion. A rational mix-design method for self-compacting concrete using a
variety of materials is necessary. Okamura and Ozawa have proposed a simple mix-
proportioning system assuming general supply from ready-mixed concrete plants. The
coarse and fine aggregate contents are fixed so that self-compactability can be achieved
easily by adjusting the water- powder ratio and superplasticizer dosage only.
1.8.5. Evaluation method for materials
Investigations on establishing evaluation method of materials, especially powder
materials and superplasticizer have been carried out from the viewpoint of establishing a
rational mix- proportioning method that is, especially adjusting method for water-powder
ratio and superplasticizer dosage and of developing suitable material for self-compacting
concrete.
34
Ouchi et. al proposed evaluation method for the effect of superplasticizer and water
independent of each other on the flowability of mortar by using flow and funnel tests.
Some general construction companies employ a segregation-inhibiting agent so
that the self- compactablity can be kept constant independent of the variation of unit
water content, especially due to the variation of surface water content in the sand. There
are various agents proposed and available in Japan. The evaluation method for the effect
was also proposed.
1.9. Acceptance Test at Job Site
Since the degree of compaction in a structure mainly depends on the self-
compactability of concrete and poor self-compactability cannot be compensated by the
construction work, self-compactability must be checked for the whole amount of concrete
just before casting at the job site. However, conventional testing methods for self-
compactability require sampling and this can be extremely laborious if the self-
compactability acceptance test is to be carried out for the whole amount of the concrete.
A suitable acceptance test method for self-compactability has been developed by Ouchi
et. al (2000), in two steps. In the first step, testing apparatus is installed between agitator
truck and pump at the job site, and the whole amount of the concrete is poured into the
apparatus. In the second step, if the concrete flows through the apparatus, the concrete is
considered as self-compactable for the structure. If the concrete is stopped by the
apparatus, the concrete is considered as having insufficient self-compactability and the
mix-proportion has to be adjusted. This apparatus was successfully used at the
construction site of the Osaka Gas LNG tank, and saved a considerable amount of
acceptance test work (Figure 1.10).
35
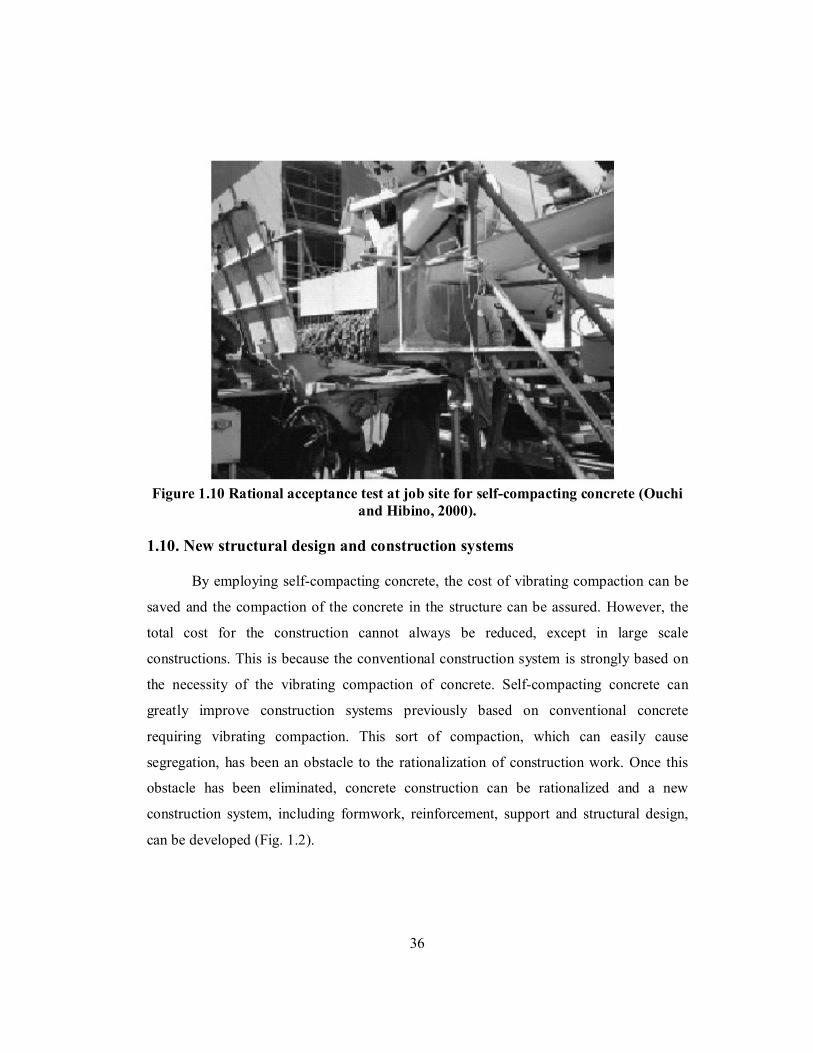
Figure 1.10 Rational acceptance test at job site for self-compacting concrete (Ouchi and Hibino, 2000).
1.10. New structural design and construction systems
By employing self-compacting concrete, the cost of vibrating compaction can be
saved and the compaction of the concrete in the structure can be assured. However, the
total cost for the construction cannot always be reduced, except in large scale
constructions. This is because the conventional construction system is strongly based on
the necessity of the vibrating compaction of concrete. Self-compacting concrete can
greatly improve construction systems previously based on conventional concrete
requiring vibrating compaction. This sort of compaction, which can easily cause
segregation, has been an obstacle to the rationalization of construction work. Once this
obstacle has been eliminated, concrete construction can be rationalized and a new
construction system, including formwork, reinforcement, support and structural design,
can be developed (Fig. 1.2).
36
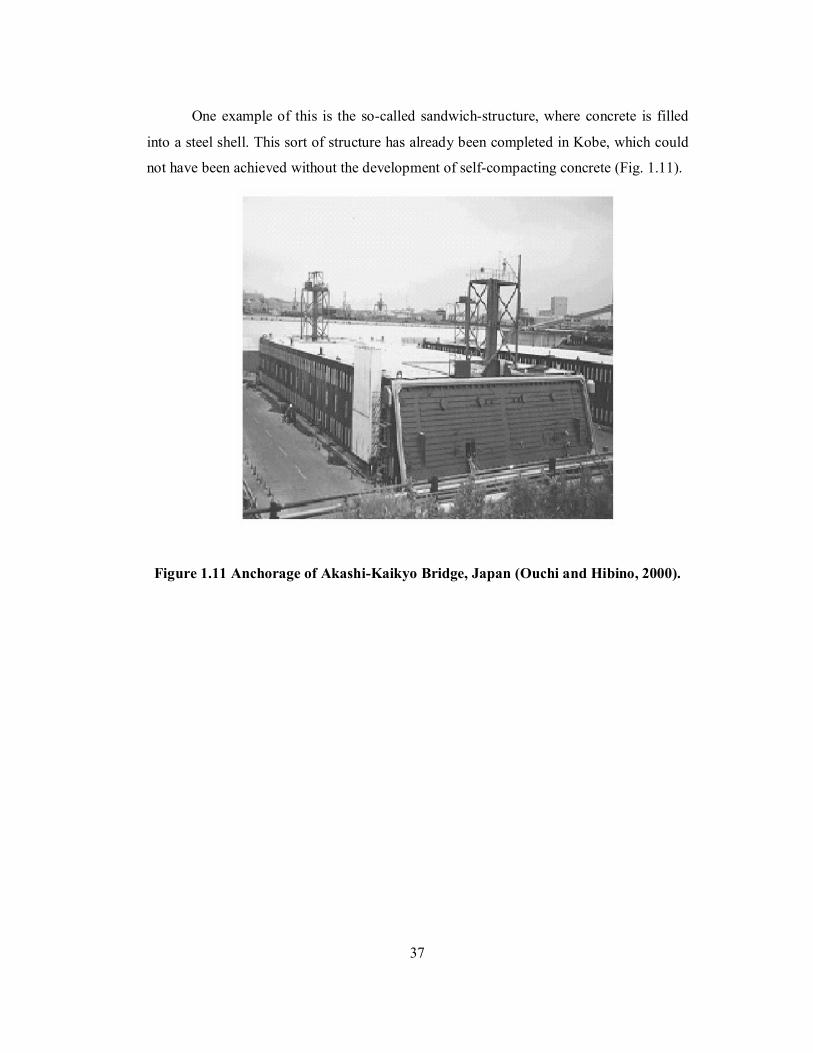
One example of this is the so-called sandwich-structure, where concrete is filled
into a steel shell. This sort of structure has already been completed in Kobe, which could
not have been achieved without the development of self-compacting concrete (Fig. 1.11).
Figure 1.11 Anchorage of Akashi-Kaikyo Bridge, Japan (Ouchi and Hibino, 2000).
37

CHAPTER 2
Literature Review
CHAPTER 2 Literature Review
2.0 General
Present-day self-compacting concrete can be classified as an advanced
construction material. As the name suggests, it does not require to be vibrated to achieve
full compaction. This offers many benefits and advantages over conventional concrete.
These include an improved quality of concrete and reduction of on-site repairs, faster
construction times, lower overall costs, facilitation of introduction of automation into
concrete construction. An important improvement of health and safety is also achieved
through elimination of handling of vibrators and a substantial reduction of environmental
noise loading on and around a site. The composition of SCC mixes includes substantial
proportions of fine-grained inorganic materials and this gives possibilities for utilization
of mineral admixtures, which are currently waste products with no practical applications
and are costly to dispose of (St John, 1998).
2.1 Previous Research Work on Self-Compacting Concrete
Self-compacting concrete extends the possibility of use of various mineral by-
products in its manufacturing and with the densification of the matrix, mechanical
behavior, as measured by compressive, tensile and shear strength, is increased. On the
other hand, the use superplasticizers or high range water reducers, improves the
stiffening, unwanted air entrainment, and flowing ability of the concrete. Practically, all
types of structural constructions are possible with this concrete. The use of SCC not only
shortens the construction period but also ensures quality and durability of concrete. This
non-vibrated concrete allows faster placement and less finishing time, leading to
improved productivity.
In the following, a summary of the articles and papers found in the literature,
about the self-compacting concrete and some of the projects carried out with this type of
concrete, is presented.
38
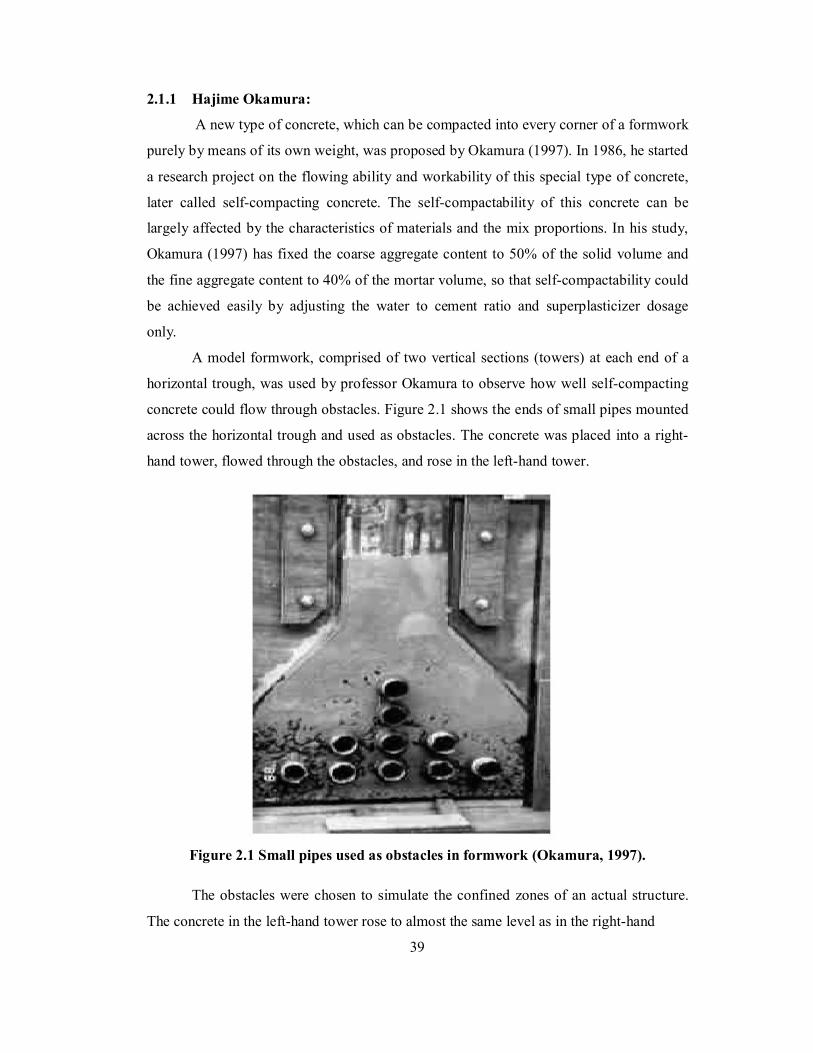
2.1.1 Hajime Okamura:
A new type of concrete, which can be compacted into every corner of a formwork
purely by means of its own weight, was proposed by Okamura (1997). In 1986, he started
a research project on the flowing ability and workability of this special type of concrete,
later called self-compacting concrete. The self-compactability of this concrete can be
largely affected by the characteristics of materials and the mix proportions. In his study,
Okamura (1997) has fixed the coarse aggregate content to 50% of the solid volume and
the fine aggregate content to 40% of the mortar volume, so that self-compactability could
be achieved easily by adjusting the water to cement ratio and superplasticizer dosage
only.
A model formwork, comprised of two vertical sections (towers) at each end of a
horizontal trough, was used by professor Okamura to observe how well self-compacting
concrete could flow through obstacles. Figure 2.1 shows the ends of small pipes mounted
across the horizontal trough and used as obstacles. The concrete was placed into a right-
hand tower, flowed through the obstacles, and rose in the left-hand tower.
Figure 2.1 Small pipes used as obstacles in formwork (Okamura, 1997).
The obstacles were chosen to simulate the confined zones of an actual structure.
The concrete in the left-hand tower rose to almost the same level as in the right-hand
39
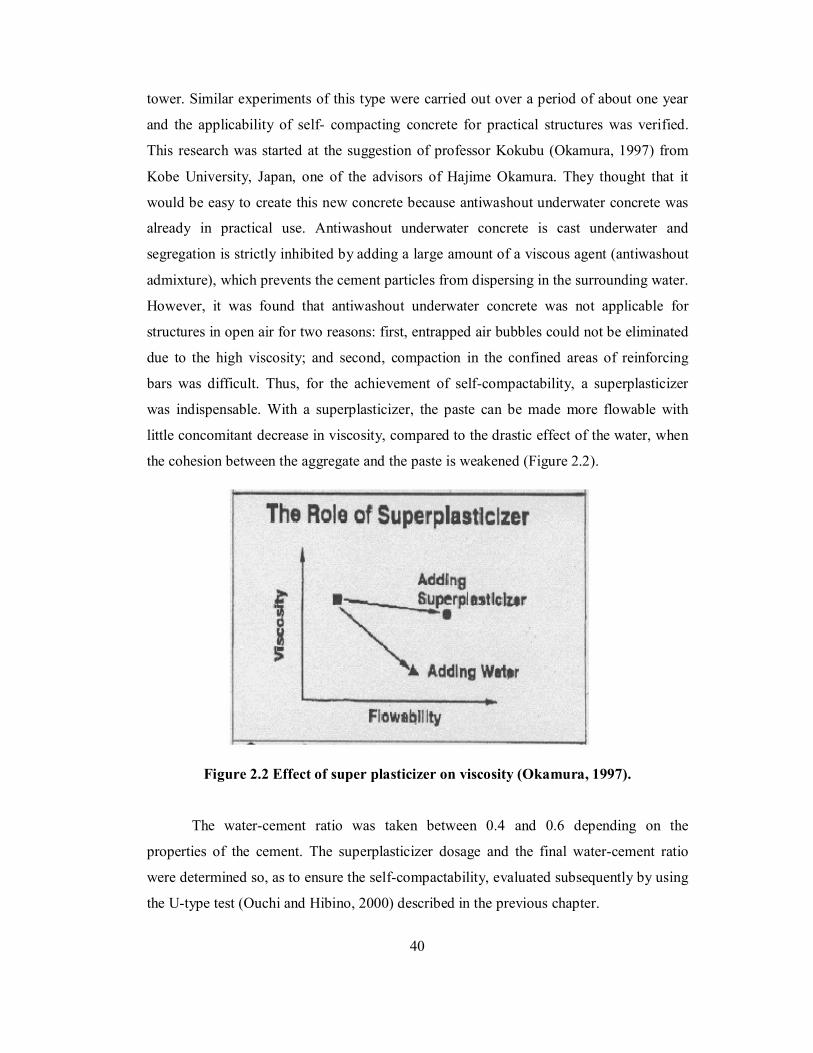
tower. Similar experiments of this type were carried out over a period of about one year
and the applicability of self- compacting concrete for practical structures was verified.
This research was started at the suggestion of professor Kokubu (Okamura, 1997) from
Kobe University, Japan, one of the advisors of Hajime Okamura. They thought that it
would be easy to create this new concrete because antiwashout underwater concrete was
already in practical use. Antiwashout underwater concrete is cast underwater and
segregation is strictly inhibited by adding a large amount of a viscous agent (antiwashout
admixture), which prevents the cement particles from dispersing in the surrounding water.
However, it was found that antiwashout underwater concrete was not applicable for
structures in open air for two reasons: first, entrapped air bubbles could not be eliminated
due to the high viscosity; and second, compaction in the confined areas of reinforcing
bars was difficult. Thus, for the achievement of self-compactability, a superplasticizer
was indispensable. With a superplasticizer, the paste can be made more flowable with
little concomitant decrease in viscosity, compared to the drastic effect of the water, when
the cohesion between the aggregate and the paste is weakened (Figure 2.2).
Figure 2.2 Effect of super plasticizer on viscosity (Okamura, 1997).
The water-cement ratio was taken between 0.4 and 0.6 depending on the
properties of the cement. The superplasticizer dosage and the final water-cement ratio
were determined so, as to ensure the self-compactability, evaluated subsequently by using
the U-type test (Ouchi and Hibino, 2000) described in the previous chapter.
40

2.1.2 Kazumasa Ozawa:
After Okamura began his research in 1986, other researchers in Japan have started
to investigate self-compacting concrete, looking to improve its characteristics. One of
those was Ozawa (1989) who has done some research independently from Okamura, and
in the summer of 1988, he succeeded in developing self-compacting concrete for the first
time. The year after that, an open experiment on the new type of concrete was held at the
University of Tokyo, in front of more than 100 researchers and engineers. As a result,
intensive research has begun in many places, especially in the research institutes of large
construction companies and at the University of Tokyo.
Ozawa (1989) completed the first prototype of self-compacting concrete using
materials already on the market. By using different types of superplasticizers, he studied
the workability of concrete and developed a concrete which was very workable. It was
suitable for rapid placement and had a very good permeability. The viscosity of the
concrete was measured using the V- funnel test (see Chapter 1 cluase 1.6.8-p25).
Other experiments carried out by Ozawa (1989) focused on the influence of
mineral admixtures, like fly ash and blast furnace slag, on the flowing ability and
segregation resistance of self-compacting concrete. He found out that the flowing ability
of the concrete improved remarkably when Portland cement was partially replaced with
fly ash and blast furnace slag. After trying different proportions of admixtures, he
concluded that 10-20% of fly ash and 25- 45% of slag cement, by mass, showed the best
flowing ability and strength characteristics.
2.1.3 Subramanian and Chattopadhyay:
Subramanian and Chattopadhyay (2002) are research and development engineers
at the ECC Division of Larsen & Toubro Ltd (L&T), Chennai, India. They have over 10
years of experience on development of self-compacting concrete, underwater concrete
with antiwashout admixtures and proportioning of special concrete mixtures. Their
research was concentrated on several trials carried out to arrive at an approximate mix
proportion of self-compacting concrete, which would give the procedure for the selection
of a viscosity modifying agent, a compatible superplasticizer and the determination of
their dosages. The Portland cement was partially replaced with fly ash and blast furnace
slag, in the same percentages as Ozawa (1989) has done before and the maximum coarse
aggregate size did not exceed 25mm.
41
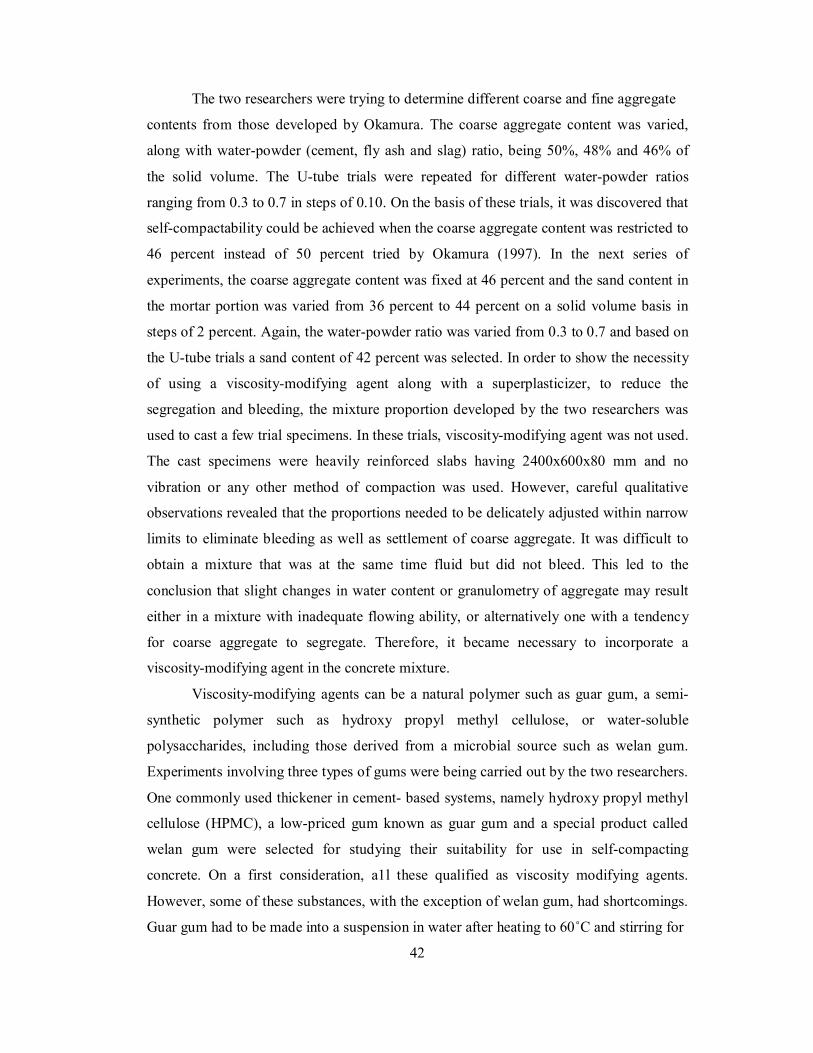
The two researchers were trying to determine different coarse and fine aggregate
contents from those developed by Okamura. The coarse aggregate content was varied,
along with water-powder (cement, fly ash and slag) ratio, being 50%, 48% and 46% of
the solid volume. The U-tube trials were repeated for different water-powder ratios
ranging from 0.3 to 0.7 in steps of 0.10. On the basis of these trials, it was discovered that
self-compactability could be achieved when the coarse aggregate content was restricted to
46 percent instead of 50 percent tried by Okamura (1997). In the next series of
experiments, the coarse aggregate content was fixed at 46 percent and the sand content in
the mortar portion was varied from 36 percent to 44 percent on a solid volume basis in
steps of 2 percent. Again, the water-powder ratio was varied from 0.3 to 0.7 and based on
the U-tube trials a sand content of 42 percent was selected. In order to show the necessity
of using a viscosity-modifying agent along with a superplasticizer, to reduce the
segregation and bleeding, the mixture proportion developed by the two researchers was
used to cast a few trial specimens. In these trials, viscosity-modifying agent was not used.
The cast specimens were heavily reinforced slabs having 2400x600x80 mm and no
vibration or any other method of compaction was used. However, careful qualitative
observations revealed that the proportions needed to be delicately adjusted within narrow
limits to eliminate bleeding as well as settlement of coarse aggregate. It was difficult to
obtain a mixture that was at the same time fluid but did not bleed. This led to the
conclusion that slight changes in water content or granulometry of aggregate may result
either in a mixture with inadequate flowing ability, or alternatively one with a tendency
for coarse aggregate to segregate. Therefore, it became necessary to incorporate a
viscosity-modifying agent in the concrete mixture.
Viscosity-modifying agents can be a natural polymer such as guar gum, a semi-
synthetic polymer such as hydroxy propyl methyl cellulose, or water-soluble
polysaccharides, including those derived from a microbial source such as welan gum.
Experiments involving three types of gums were being carried out by the two researchers.
One commonly used thickener in cement- based systems, namely hydroxy propyl methyl
cellulose (HPMC), a low-priced gum known as guar gum and a special product called
welan gum were selected for studying their suitability for use in self-compacting
concrete. On a first consideration, a1l these qualified as viscosity modifying agents.
However, some of these substances, with the exception of welan gum, had shortcomings.
Guar gum had to be made into a suspension in water after heating to 60˚C and stirring for
42
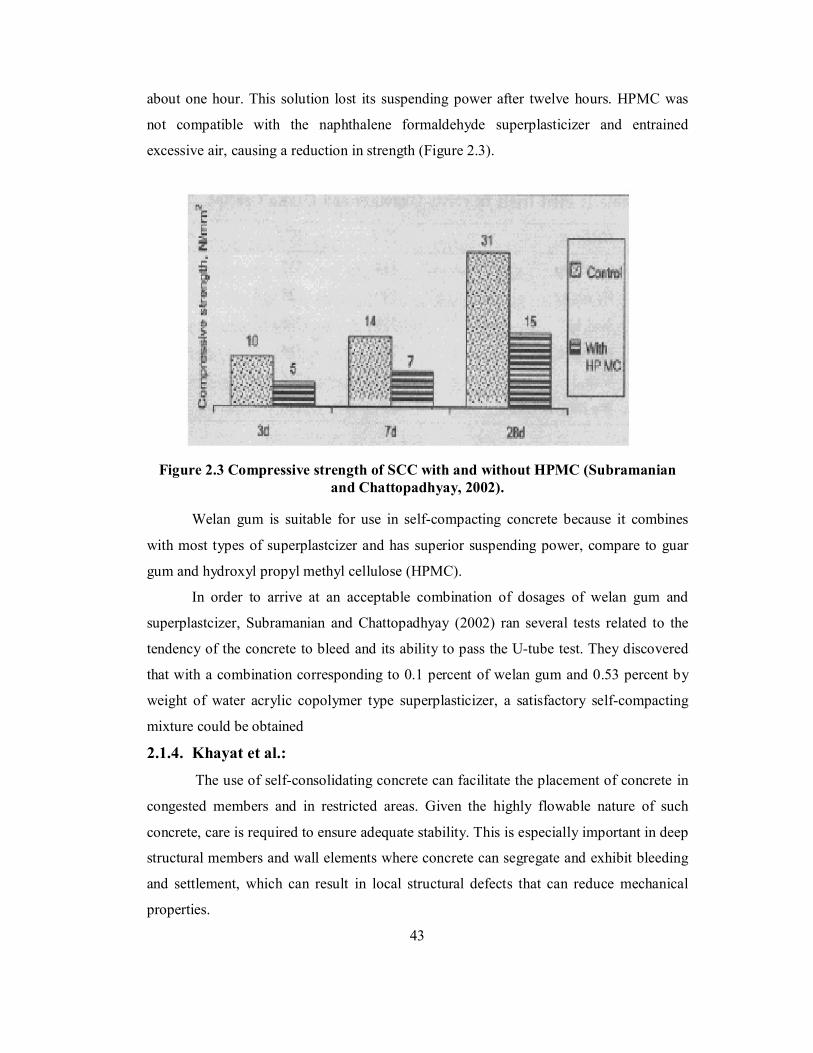
about one hour. This solution lost its suspending power after twelve hours. HPMC was
not compatible with the naphthalene formaldehyde superplasticizer and entrained
excessive air, causing a reduction in strength (Figure 2.3).
Figure 2.3 Compressive strength of SCC with and without HPMC (Subramanian
and Chattopadhyay, 2002).
Welan gum is suitable for use in self-compacting concrete because it combines
with most types of superplastcizer and has superior suspending power, compare to guar
gum and hydroxyl propyl methyl cellulose (HPMC).
In order to arrive at an acceptable combination of dosages of welan gum and
superplastcizer, Subramanian and Chattopadhyay (2002) ran several tests related to the
tendency of the concrete to bleed and its ability to pass the U-tube test. They discovered
that with a combination corresponding to 0.1 percent of welan gum and 0.53 percent by
weight of water acrylic copolymer type superplasticizer, a satisfactory self-compacting
mixture could be obtained
2.1.4. Khayat et al.: The use of self-consolidating concrete can facilitate the placement of concrete in
congested members and in restricted areas. Given the highly flowable nature of such
concrete, care is required to ensure adequate stability. This is especially important in deep
structural members and wall elements where concrete can segregate and exhibit bleeding
and settlement, which can result in local structural defects that can reduce mechanical
properties.
43

The objective of Khayat’s (1997) et al. research was to evaluate the uniformity of
in situ mechanical properties of self-consolidating concrete used to cast experimental wall
elements Eight optimized SCC mixtures with slump flow values greater than 630 mm and
conventional concrete with a slump of 165 mm were investigated. The self-compacting
concrete mixtures incorporated various combinations of cementitious materials and
chemical admixtures. The water-cementitious materials ratios ranged from 0.37 to 0.42.
Experimental walls measuring 95 cm in length, 20 cm in width, and 150 cm in height
were cast. After casting, no consolidation was used for the SCC mixtures, while the
medium fluidity conventional concrete received thorough internal vibration. Several cores
were obtained in order to evaluate the uniformity of compressive strength and modulus of
elasticity along the height of each wall. Khayat (1997) et al. found out that all cores from
both types of concrete exhibited little variation in compressive strength and modulus of
elasticity in relation to height of the wall, indicating a high degree of strength uniformity.
However, compressive strength and modulus of elasticity were greater for SCC samples
than those obtained from the medium fluidity conventional concrete.
2.1.5. Dehn et al.: Dehn (2000) et al. have focused their research work on the time development of
SCC compressive and splitting tensile strength and the bond behavior between the
reinforcing bars and the self-compacting concrete compared to normal concrete.
In order to ensure a good production of SCC, a mix design should be performed,
so that the predefined properties of the fresh and hardened concrete would be reached for
sure. All the components should be coordinated so that bleeding and segregation would
be prevented. Because of these aspects, their mix design was based on experience from
Japan, Netherlands, France, and Sweden. Due to the fact that the load bearing capacity of
a reinforced concrete structure is considerably influenced by the bond behavior between
the reinforcing bars and the concrete, the following items were taken into account:
1. Anchorage of the reinforcing bars
2. Crack width control
3. Lapped reinforcing bars
For this reason, investigations on the bond behavior between the re-bars and the
SCC were necessary, especially considering the time development of the bond strength.
These investigations showed, that the main parameters which influence the bond behavior
44
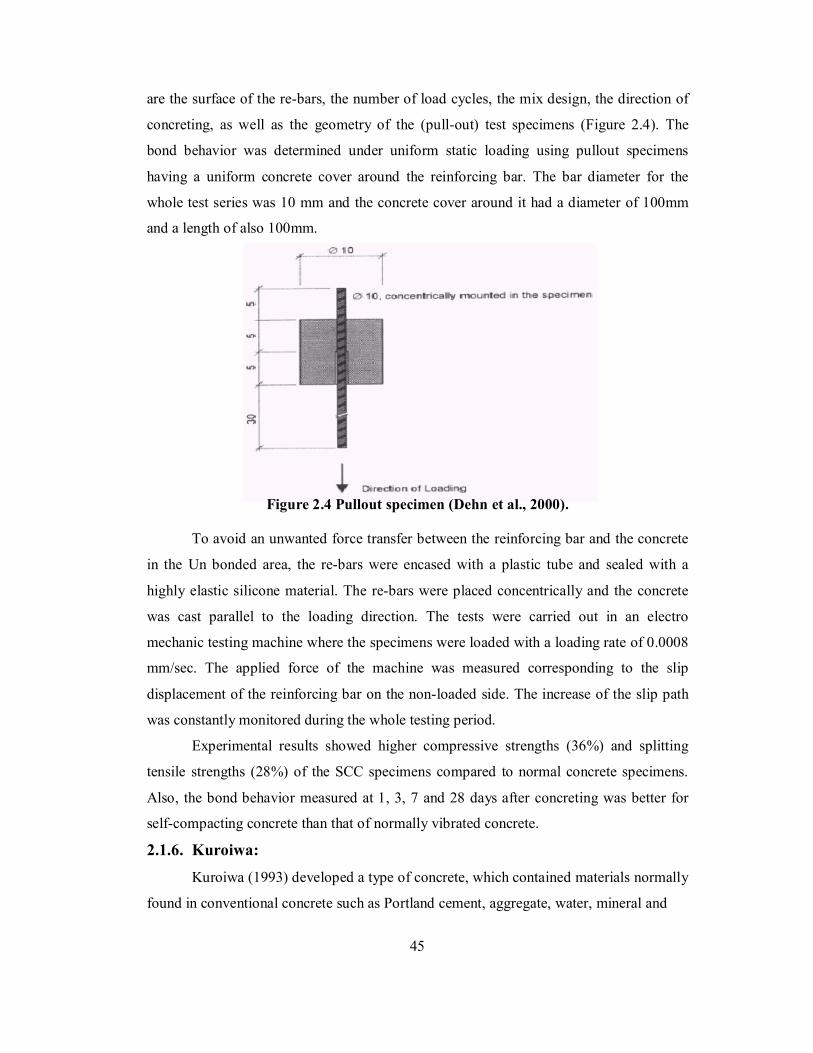
are the surface of the re-bars, the number of load cycles, the mix design, the direction of
concreting, as well as the geometry of the (pull-out) test specimens (Figure 2.4). The
bond behavior was determined under uniform static loading using pullout specimens
having a uniform concrete cover around the reinforcing bar. The bar diameter for the
whole test series was 10 mm and the concrete cover around it had a diameter of 100mm
and a length of also 100mm.
Figure 2.4 Pullout specimen (Dehn et al., 2000).
To avoid an unwanted force transfer between the reinforcing bar and the concrete
in the Un bonded area, the re-bars were encased with a plastic tube and sealed with a
highly elastic silicone material. The re-bars were placed concentrically and the concrete
was cast parallel to the loading direction. The tests were carried out in an electro
mechanic testing machine where the specimens were loaded with a loading rate of 0.0008
mm/sec. The applied force of the machine was measured corresponding to the slip
displacement of the reinforcing bar on the non-loaded side. The increase of the slip path
was constantly monitored during the whole testing period.
Experimental results showed higher compressive strengths (36%) and splitting
tensile strengths (28%) of the SCC specimens compared to normal concrete specimens.
Also, the bond behavior measured at 1, 3, 7 and 28 days after concreting was better for
self-compacting concrete than that of normally vibrated concrete.
2.1.6. Kuroiwa: Kuroiwa (1993) developed a type of concrete, which contained materials normally
found in conventional concrete such as Portland cement, aggregate, water, mineral and
45
chemical admixtures. The chemical admixtures were added in order to improve the
deformability and the viscosity of the concrete. The newly developed type of concrete
was called super-workable concrete and showed excellent deformability and resistance to
segregation. It could also fill completely heavily reinforced formworks without any use of
vibrators. After the laboratory tests it was found out that the super-workable concrete had
superior properties in the fresh state and excellent durability after hardening. Because of
its properties, it was considered that it would be suitable for projects involving heavily
reinforced areas and was employed in the construction of a 20-story building. The
concrete was placed in the center-core from basement to the third floor. The building had
a design of a hybrid structure, in which the reinforced concrete core was surrounded by a
steel mantle. The greatest diameter used for the reinforcing bars was 50mm and the forms
were very congested. Ready mixed concrete plants situated near the construction site
produced approximately 2,000m³ of super-workable concrete, which was placed
successfully.
2.1.7 Ferraris et al.: The slump test is widely used to evaluate the workability of concrete, but in the
case of self-compacting concrete, it has serious drawbacks. Other flow characteristics
such as viscosity or filling capacity are needed to define the flow in self-compacting
concretes. The research objectives of Ferraris (1999) et al. were to test flow
characteristics of SCC using two concrete rheometers and the widely recognized V-flow
and U-flow tests, and to determine the correlation between the two rheometers and the
tests.
The main property that defines the self-compacting concrete is high workability in
attaining consolidation and specified hardened properties. Workability is defined either
qualitatively as the ease of placement or quantitatively by rheological parameters. The
most commonly used test to determine workability in practice is the slump cone test.
Either the vertical slump distance or the horizontal spread of the concrete can be
measured. The most common rheological parameters used to qualify workability are the
yield stress and plastic viscosity as defined by the Bingham equation.
The knowledge of the two parameters, yield stress and plastic viscosity, allows a
quantitative description of the workability. The Bingham equation is a linear relationship
46
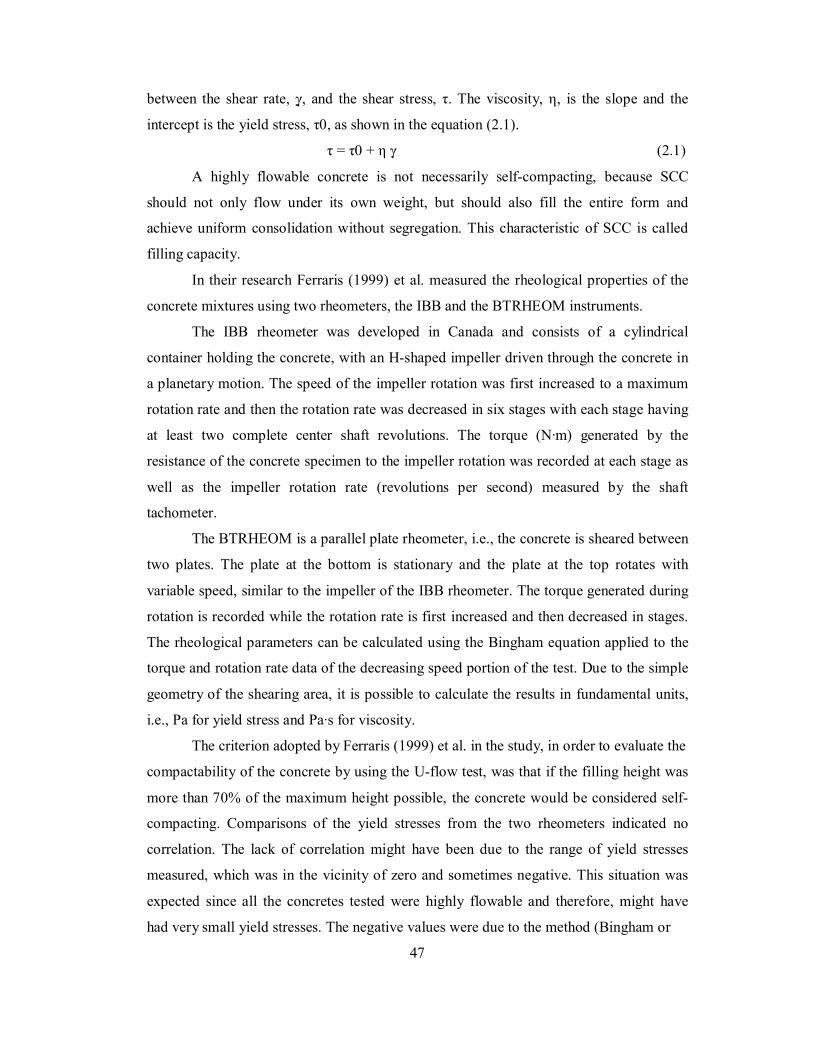
between the shear rate, γ, and the shear stress, τ. The viscosity, η, is the slope and the
intercept is the yield stress, τ0, as shown in the equation (2.1).
τ = τ0 + η γ (2.1)
A highly flowable concrete is not necessarily self-compacting, because SCC
should not only flow under its own weight, but should also fill the entire form and
achieve uniform consolidation without segregation. This characteristic of SCC is called
filling capacity.
In their research Ferraris (1999) et al. measured the rheological properties of the
concrete mixtures using two rheometers, the IBB and the BTRHEOM instruments.
The IBB rheometer was developed in Canada and consists of a cylindrical
container holding the concrete, with an H-shaped impeller driven through the concrete in
a planetary motion. The speed of the impeller rotation was first increased to a maximum
rotation rate and then the rotation rate was decreased in six stages with each stage having
at least two complete center shaft revolutions. The torque (N·m) generated by the
resistance of the concrete specimen to the impeller rotation was recorded at each stage as
well as the impeller rotation rate (revolutions per second) measured by the shaft
tachometer.
The BTRHEOM is a parallel plate rheometer, i.e., the concrete is sheared between
two plates. The plate at the bottom is stationary and the plate at the top rotates with
variable speed, similar to the impeller of the IBB rheometer. The torque generated during
rotation is recorded while the rotation rate is first increased and then decreased in stages.
The rheological parameters can be calculated using the Bingham equation applied to the
torque and rotation rate data of the decreasing speed portion of the test. Due to the simple
geometry of the shearing area, it is possible to calculate the results in fundamental units,
i.e., Pa for yield stress and Pa·s for viscosity.
The criterion adopted by Ferraris (1999) et al. in the study, in order to evaluate the
compactability of the concrete by using the U-flow test, was that if the filling height was
more than 70% of the maximum height possible, the concrete would be considered self-
compacting. Comparisons of the yield stresses from the two rheometers indicated no
correlation. The lack of correlation might have been due to the range of yield stresses
measured, which was in the vicinity of zero and sometimes negative. This situation was
expected since all the concretes tested were highly flowable and therefore, might have
had very small yield stresses. The negative values were due to the method (Bingham or
47
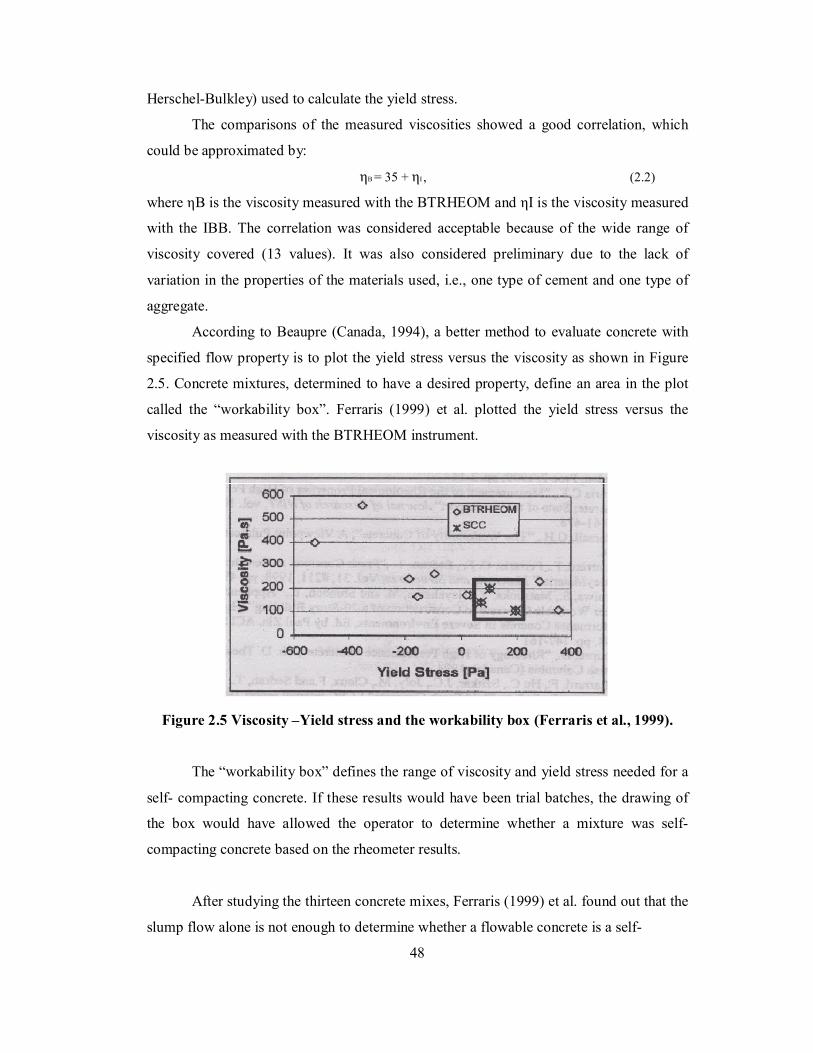
Herschel-Bulkley) used to calculate the yield stress.
The comparisons of the measured viscosities showed a good correlation, which
could be approximated by:
ηB = 35 + ηI , (2.2)
where ηB is the viscosity measured with the BTRHEOM and ηI is the viscosity measured
with the IBB. The correlation was considered acceptable because of the wide range of
viscosity covered (13 values). It was also considered preliminary due to the lack of
variation in the properties of the materials used, i.e., one type of cement and one type of
aggregate.
According to Beaupre (Canada, 1994), a better method to evaluate concrete with
specified flow property is to plot the yield stress versus the viscosity as shown in Figure
2.5. Concrete mixtures, determined to have a desired property, define an area in the plot
called the “workability box”. Ferraris (1999) et al. plotted the yield stress versus the
viscosity as measured with the BTRHEOM instrument.
Figure 2.5 Viscosity –Yield stress and the workability box (Ferraris et al., 1999).
The “workability box” defines the range of viscosity and yield stress needed for a
self- compacting concrete. If these results would have been trial batches, the drawing of
the box would have allowed the operator to determine whether a mixture was self-
compacting concrete based on the rheometer results.
After studying the thirteen concrete mixes, Ferraris (1999) et al. found out that the
slump flow alone is not enough to determine whether a flowable concrete is a self-
48
compacting concrete. Due to the fact, that the values measured with the two types of
rheometers correlate relatively well on viscosity but not on yield stress, further
measurements are needed to determine if the correlation holds for other types of
aggregate and cementitious materials. Also, based on the data acquired, the viscosity and
the yield stress did not correlate with the V-funnel or the U-flow tests.
2.1.8 Anirwan Senu Guptha et al [2006]
The authors on the topic “Application based mix proportioning for self
compacting concrete” in their investigation attempted to arrive at optimum mix
proportions for various consistency class of SCC with locally available materials.
Adequate passing ability for all mixes was ensured by keeping the proportion of coarse
aggregates low as the aggregates had high degree of flakiness and elongation. Based on
the investigation they concluded that,
1. Six different consistency classes of SCC as per EFNARC-2005 were produced in
the laboratory using local available materials. All mixes satisfied the criteria set
forth by EFNARC, and showed good passing ability and segregation resistance.
2. Higher powder contents were needed to design SCC high flow combined with
stability. The high powder content mixtures also resulted in the highest
compressive strengths.
3. A good correlation was found in the initial V-Funnel flow time and the T-60 from
slump flow test.
2.1.9. ACI committee report No.226 [1987]
Has discussed the effects of Fly ash. The effect on the workability depends on the
fineness of Fly ash. The fineness and roundness of particles improve cohesion and
workability. Due to workability, there will be reduction in susceptibility of segregation
and bleeding which reduces temperature developed during curing in fresh concrete and
reduces permeability in the hardened concrete. This reduction reduces the damage of steel
corrosion, alkaline sulphite attack. The reports also discussed the specification for
material testing, quality assurance for Fly ash concrete and making use of good
proportion of Fly ash.
49
2.1.10. Gibbs,[1999] States that the following practical rules of thumb for the proportioning of self-
compacting concrete mixture exits. Coarse aggregate content should be limited to 71-81
N/mm3 (about 50% of the total volume)
1. 50% of the total volume.
2. Paste not less than 40% of the volume of the mixture.
3. Low sand content in the mortar (40-50% by volume).
4. Water/powder ratio not more than 0.5 (powder solids 0.0035 in 0.09mm).
2.1.11. Manu Santhanam,[2008] In his article “Compatability issues between Cements and Water-reducing
Chemical admixtures”, describes the current level of knowledge world wide about the
issues of incompatibility cement and water-reducing chemical admixtures. Their
mechanism of action in concrete, test methods to evaluate the effectiveness of
plasticizers. Specific issues of incompatibility namely, loss of workability, alteration of
setting behaviour,reduced rates of strength gain, and change in long term behaviour and
role of the chemistry(of cement and admixture),the presence of other mineral and
chemical admixtures, and the proportioning of concrete are explained in detail.
2.1.12. Hemant Sood[3] Et Al, [2009] In their experimental investigation “Incorporating European Standards for Testing
Self Compacting Concrete in Indian Conditions”, explained SCC using Fly ash and Rice
husk ash as mineral admixtures and testing rheological properties as per European
standards. He concluded that addition of Fly ash in SCC increases filling and passing
ability of concrete and improves overall workability, which is the prime important
characteristics of SCC.Utilisation of Fly ash and Rice husk as cement replacement avoids
the environmental and ecological damages caused by quarrying and exploitation of raw
materials like limestone for making cement.
2.1.13. Kazim Turk[3] Et Al, [2007]
In their experimental study “Capillarity water absorption of Concrete under
different Curing Conditions”, explains the influence of puzzolonic materials and curing
regimes on the mechanical properties and the Capillarity water absorption(sorptivity)
50

Characteristics of Self Compacting concrete (SCC).He concluded that the Compressive
and tensile strengths of Self Compacting concrete were higher than those of PC concrete
for all testing ages and for all curing conditions and also proper curing and using
puzzolonic admixture such as Fly ash as cement component enhanced the resistivity of
concretes under water absorption significantly..
2.1.14. Srinivasa Rao.P, [2008]
In his paper “Strength properties of Glass Fibre Self Compacting concrete”
studied the properties of GFSCC using alkali-resistant glass fibres in various proportions
and compared the properties for controlled mixes of grade M30 and M35. He concluded
that there is an improvement in the compressive strength for both grades of GFSCC and is
observed to be 15% over Self-Compacted Concrete.
2.2. Constituent Materials of SCC
The constituent materials used for the production of SCC are the same as those for
conventionally vibrated normal concrete except that SCC contains lesser aggregate and
greater powder (cement and filler particles smaller than 0.125 mm). Fly ash, glass filler,
limestone powder, silica fume, etc are used as the filler materials. To improve the self-
compactibility, without segregation, a superplasticizer along with a stabilizer is added.
2.2.1. Powder (Mixture of Portland cement and Filler)
The term 'powder' used in SCC refers to a blended mix of cement and filler
particles smaller than 0.125 mm. The filler increases the paste volume required to achieve
the desirable workability of SCC. The addition of filler in an appropriate quantity
enhances both workability and durability without sacrificing early strength (Mata, 2004).
2.2.1.1 Cement
Cement used for SCC should not contain C3A content higher than 10% to avoid
the problems of poor workability retention (EFNARC, 2002). Selection of the type of
cement depends on the overall requirements for concrete, such as strength and durability.
51
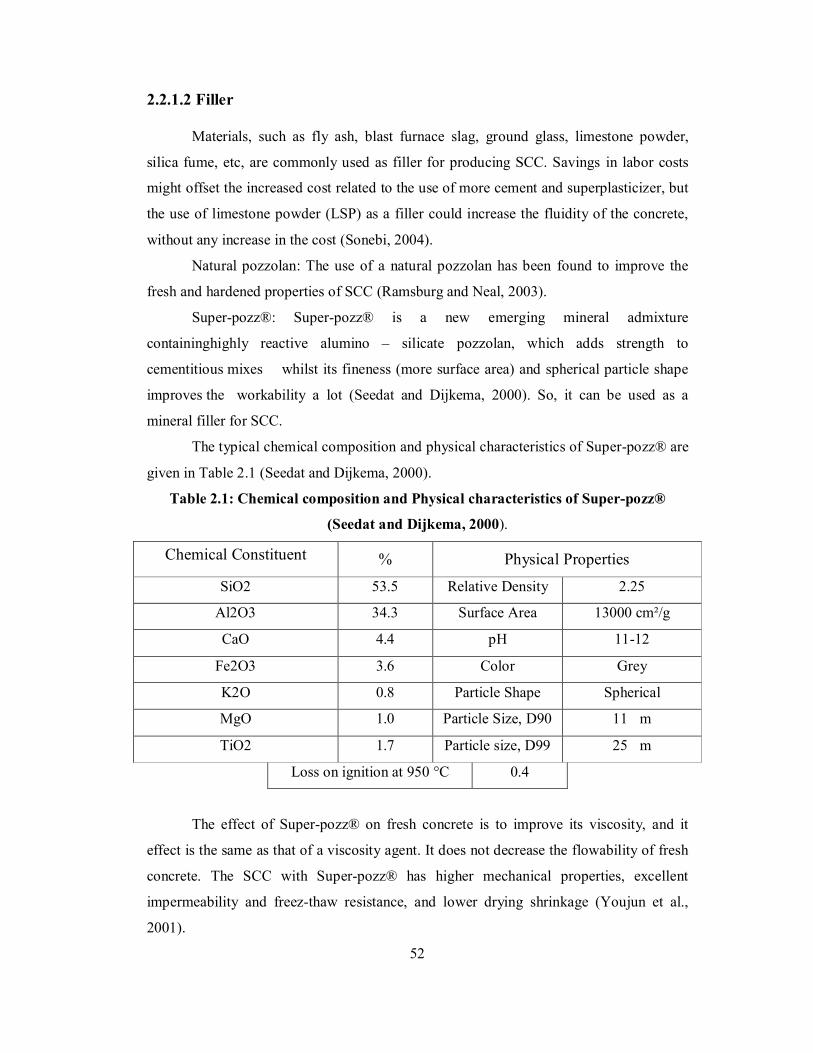
2.2.1.2 Filler
Materials, such as fly ash, blast furnace slag, ground glass, limestone powder,
silica fume, etc, are commonly used as filler for producing SCC. Savings in labor costs
might offset the increased cost related to the use of more cement and superplasticizer, but
the use of limestone powder (LSP) as a filler could increase the fluidity of the concrete,
without any increase in the cost (Sonebi, 2004).
Natural pozzolan: The use of a natural pozzolan has been found to improve the
fresh and hardened properties of SCC (Ramsburg and Neal, 2003).
Super-pozz®: Super-pozz® is a new emerging mineral admixture
containinghighly reactive alumino – silicate pozzolan, which adds strength to
cementitious mixes whilst its fineness (more surface area) and spherical particle shape
improves the workability a lot (Seedat and Dijkema, 2000). So, it can be used as a
mineral filler for SCC.
The typical chemical composition and physical characteristics of Super-pozz® are
given in Table 2.1 (Seedat and Dijkema, 2000).
Table 2.1: Chemical composition and Physical characteristics of Super-pozz®
(Seedat and Dijkema, 2000).
Chemical Constituent % Physical Properties
SiO2 53.5 Relative Density 2.25
Al2O3 34.3 Surface Area 13000 cm²/g
CaO 4.4 pH 11-12
Fe2O3 3.6 Color Grey
K2O 0.8 Particle Shape Spherical
MgO 1.0 Particle Size, D90 11 µm
TiO2 1.7 Particle size, D99 25 µm
Loss on ignition at 950 °C 0.4
The effect of Super-pozz® on fresh concrete is to improve its viscosity, and it
effect is the same as that of a viscosity agent. It does not decrease the flowability of fresh
concrete. The SCC with Super-pozz® has higher mechanical properties, excellent
impermeability and freez-thaw resistance, and lower drying shrinkage (Youjun et al.,
2001).
52
Due to its particle shape and size, Super-pozz® provides a reduced water demand
and/or a reduced admixture dosage for a given workability, even up to 20% replacement
level. Due to its ability to reduce water and/or admixture, Super-pozz® can either be used
as a high range water reducer to improve compressive strength or as a super workability
aid to improve flow (Seedat and Dijkema, 2000).
Due to the fineness, spherical shape and the highly reactive nature of Super-
pozz®, many technical benefits can be associated with its use. Super-pozz® can be
ideally used in the following applications.
1. High Performance concrete,
2. Spray Concrete, i.e. shortcreting and guniting applications,
3. Repair Mortars,
4. Specialist grout mixes,
5. Cement modified Pre-Mixed base materials, and
6. Self Leveling Floor Screeds.
Due to lower water demand required, Super-pozz® can be ideally used to:
1. Decrease the water/binder ratio,
2. Reduce the high doses of superplasticizer normally required, and
3. Or a combination of the above
Class F fly ash: Class F fly ash is a finely divided ash left after hard coal is burnt for
power. If cement is replaced by fly ash, the paste volume of the concrete will increase,
bleeding will decrease and, due to the increase of paste volume, the shrinkage may
increase. Class F fly ash is generally used to replace Portland cement in the range of 15%
to 25% of the total cementitious material in conventional mixtures. According to Khayat
et al. (2003) a 40% Class F fly ash in a SCC mixture resulted in good workability, with
acceptable strength development and frost durability.
Bouzoubaa and Lachemi (2001) have conducted a study on SCC incorporating
high volumes of class F fly ash as filler in the range of 40 to 60% by mass of powder, the
water/powder ratio in the range of 0.35 to 0.45, sulfonated naphthalene- formaldehyde
superplasticizer in the range of 0 to 3.8 l/m³, and keeping the powder content constant at
400 kg/m³. They reported that it is possible to design a SCC incorporating high volumes
of class F fly ash as a filler. They achieved a slump flow in the range of 500 to 700 mm, a
53
flow time ranging from 3 to 7 sec, a segregation index the range of 500 to 700 mm, a flow
time ranging from 3 to 7 sec, a segregation index ranging from 1.9 to 14%, and
compressive strengths from 15 to 31 MPa, and from 26 to 48 MPa, at 7 and 28 days,
respectively.
Limestone: Bosiljkov (2003) has carried out a study on SCC with poorly graded
aggregate and high volume of limestone as filler (in the range of 47 to 49% of the mass of
powder), a high paste content of (in the range of 891 to 906 kg/m³ of mix, i.e. 41.3 to
42.8 % by the volume of mix) due to the poorly graded coarse aggregates, the lower
water/powder ratio (in the range of 0.22 to 0.25 by mass), a constant optimum dosage of
superplasticizer (0.6% by mass of powder), and a viscosity agent (30 to 35% by the mass
of water). The results obtained indicated that finer and better-graded limestone dust
significantly increases the deformability of the paste and it also appeared that the addition
of filler improved the 28-day compressive strength of concrete mixes besides the required
self-compacting properties.
Silica-fume: Silica-fume, also known as condensed silica fume or microsilica
(ACI 116R), is a very fine, non-crystalline silica produced in electric arc furnaces as a by-
product of the production of elemental silicon or silico-alloys. It is basically a “Super-
pozzolan” with a very high durability and excellent strength, but creates a high water
demand, thus requiring the use of HRWR. Silica-fume is generally used in quantities of
3% to 10% of the total cementitious materials in concretes with accelerated curing.
Slag: Slag is a by-product of the iron industry, generally used to replace Portland
cement in the range of 40% to 60% of the total cementitious material in conventional
concrete mixtures. According to Lachemi et al. (2003) a 50% to 70% slag, as cement
replacement, with different viscosity modifying admixtures (VMA) for various SCC
mixtures produced good results. Mixtures containing slag as a partial replacement of
portland cement generally have lower early strengths and higher ultimate strengths than
otherwise comparable mixtures containing only Portland cement
2.2.2 Aggregates
The maximum size and grading of the aggregates depends on the particular
application. Maximum size of aggregate is usually limited to 20 mm. The coarse
54
aggregate content in SCC is kept either equal to or less than that of the fine aggregate
content. Bui et al., (2002) proposed a rheological model for SCC relating the rheology of
the paste to the average aggregate spacing and average aggregate diameter to consider the
effect of most of the factors related to aggregate properties and content. According to Bui
et al. (2002) and other researchers, a higher aggregate spacing requires a lower flow and
higher viscosity of the paste to achieve satisfactory deformability and segregation
resistance of SCC. Better results were also obtained with the same spacing and a smaller
aggregate diameter. For SCC mixtures, a coarse aggregate size of 5 mm to 14 mm and
quantities varying from 790 kg/m³ to 860 kg/m³ have been used with satisfactory results
(Khayat et al., 2004).
The sand ratio (i.e. fine aggregate volume/total aggregate volume) is an important
parameter for SCC and the rheological properties improved with an increase in the sand
ratio (Su et al., 2002).
According to Okamura (1977), if the coarse aggregate content in a SCC mixture
exceeds a certain limit, blockage would occur independently of the viscosity of the
mortar. Superplasticizer and water content are then determined to ensure desired self-
compacting characteristics. Yugi et al (1993) reported that reducing the volume of coarse
aggregates in a SCC mixture is more effective than decreasing the sand-to-paste ratio to
increase the passing ability through congested reinforcement.
The aggregate packing factor (i.e. the ratio of mass of aggregates of tightly packed
state in SCC to that of loosely packed state in air) determines the aggregate content, and
influences the strength, flowability and self-compacting ability (Su et al., 2001).
The moisture content of aggregates should be closely monitored and must be
taken into account in order to produce SCC of constant quality (EFNARC, 2000).
The coarse aggregate should not contain clay seams that may produce excessive
creep and shrinkage. Therefore, aggregates must be clean for incorporation in the mix
(Gerwick, 1993).
55
2.2.3 Admixtures Superplasticizer: Superplasticizer (SP) is an essential component of SCC to
provide the necessary workability. The superplasticizer to be selected should have:
1. High dispersing effect for low water/powder ratio (less than 1 by volume),
2. Maintenance of the dispersing effect for at least two hours after mixing, and
3. Less sensitivity to temperature changes (Okamura and Ouchi, 2003; Ouchi et al.,
2001).
The main purpose of using a super plasticizer is to produce flowing concrete with
very high slump that is to be used in heavily reinforced structures and in places where
adequate consolidation by vibration cannot be readily achieved. The other major
application is the production of high-strength concrete at w/c's ranging from 0.3 to 0.4.
The ability of a superplasticizer to increase the slump of concrete depends on such factors
as the type, dosage, and time of addition, w/c and the nature or amount of cement. It has
been found that for most types of cement, a superplasticizer improves the workability of
concrete.
Some of the benefits/features of a super plasticizer are:
1. Specified strength can be achieved at high workability,
2. Faster placing with reduced labor and equipment costs, and
3. Low permeable concrete leading to enhanced durability.
Some of the benefits of a high-range water reducer are:
1. Higher strength can be achieved at "normal" workability without the need for
additional cement,
2. Reduction in water content typically reduces bleeding,
3. Produces cohesive and workable concrete at high slump, and
4. Reduction in striking times.
Some of the applications of a superplasticizer are:
1. Incorporating the admixture during batching or on delivery at site increases
workability to a flowing or self-leveling state,
2. Heavily reinforced sections,
3. Deep sections where normal consolidation is difficult,
56
4. High quality formwork finishes,
5. Pumped concrete (long pipelines), and
6. Compatible with all types of Portland cements, including sulfate-resisting cements
and blends.
Stabilizer: Other types of admixtures may be incorporated as necessary, such as
VMA for stability, air-entraining admixture (AEA) to improve freeze-thaw resistance,
retarders for control of setting, etc. Lachemi et al. (2004) have carried out a study on the
performance of new VMAs in enhancing the rheological properties and consistency of
SCC. They found that the combined use of proper dosages of VMA and SP contribute to
securing high-performance cement pastes that is highly fluid yet cohesive enough to
reduce water dilution and enhance water retention.
2.2.4 Ranges of the quantities of the Constituent Materials for SCC
Typical ranges of proportions and quantities of the constituent materials for
producing SCC are given below:
1. Water content: 170 to 176 kg/m³ (Su et al., 2001). It should not exceed 200 kg/m³
(EFNARC, 2002).
2. Cement content: 350 to 450 kg/m³ (EFNARC, 2002),
3. Total powder content (i.e., cement + filler): 400 to 600 kg/m³ (EFNARC, 2002),
4. Dosage of superplasticizer: 1.8% of the total powder content (by mass) (Su et al.,
2001). However, the recommended dosage varies from product to product,
5. Water/powder ratio: 0.80 to 1.10 (by volume) (EFNARC, 2002). A water/powder
ratio in the range of 0.30 to 0.38 (by mass) for tropical Middle East conditions
(Munn, 2003; Kapoor et al., 2003),
6. Coarse aggregate content : 28 to 35% by volume of the mix, i.e., 700 to 900 kg/m³
of concrete (EFNARC, 2002),
7. The sand content balances the volume of other constituents. The sand content
should be greater than 50% of the total aggregate content (Munn, 2003; Kapoor et
al., 2003). Sand ratio (i.e. volume ratio of fine aggregate to total aggregate) is an
important parameter in SCC and the rheological properties increase with an
increase in sand ratio. Sand ratio should be taken in the range of 50 to 57% (Su et
al., 2001), and
8. The aggregate packing factor: 1.12 to 1.16 (Su et al., 2001).
57

2.3 Hardened Properties of SCC 2.3.1 Compressive, Tensile, and Bond Strength
SCC with a compressive strength around 60 N/mm² can easily be achieved. The
strength could be further improved by using fly ash as filler (Kapoor et al., 2003). The
characteristic compressive and tensile strengths have been reported to be around 60
N/mm² and 5 N/mm², respectively (Brameshuber and Uebachs, 2002). Patel et al. (2004)
reported 28-days compressive strength values ranging from 31 to 52 N/mm².
According to Nehdi et al. (2004) the 91-days compressive strength was in the
range of 28 and 47 N/mm². Xie et al. (2002) have reported a compressive strength of up
to 80 N/mm² with a low permeability, good freeze-thaw resistance, and low drying
shrinkage (Xie et al., 2002).
SCC mixes with a high volume of cement – limestone filler paste can develop
higher or lower 28-day compressive strength, compared to those of vibrated concrete with
the same water/cementitious material ratio and cement content, but without filler. It
appears that the strength characteristics of the SCC are related to the fineness and grading
of the limestone filler used (Bosiljkov, 2003).
SCC with water/cementitious material ratios ranging from 0.35 to 0.45, a mass
proportion of fine and coarse aggregates of 50:50 with cement replacement of 40%, 50%
and 60% by Class F fly ash and cementitious materials content of 400 kg/m³ being kept
constant, obtained good results for compressive strength ranging from 26 to 48 N/mm²,
which shows that an economical SCC could be successfully developed by incorporating
high volumes of Class F fly ash (Bouzoubaa and Lachemi, 2001). According to Kumar et
al., (2004) SCC containing more than 50% fly ash of the total powdered material
produced compressive strengths ranging from 20 to 30 N/mm² at the ages of 3 and 7 days.
The bond behavior of SCC was found to be better than that of normally vibrated
concrete (Dehn et al., 2000). The higher bond strength was attributed to the superior
interlocking of aggregates due to the uniform distribution of aggregates over the full cross
section and higher volume of cement-binder matrix (Kapoor et al., 2003).
58
2.3.2 Modulus of Elasticity
Modulus of elasticity of SCC and that of a normally vibrated concrete, produced
from the same raw materials, have been found to be almost identical. Although there is a
higher paste matrix share in SCC, the elasticity remains unchanged due to the denser
packing of the particles (Brameshuber and Uebachs, 2002).
The modulus of elasticity of concrete increases with an increase in the quantity of
aggregate of high rigidity whereas it decreases with increasing cement paste content and
porosity. A relatively small modulus of elasticity can be expected, because of the high
content of ultra fines and additives as dominating factors and, accordingly, minor
occurrence of coarse and stiff aggregates at SCC (Holschemacher and Klug, 2002).
According to Holschemacher and Klug (2002), the modulus of elasticity of SCC can be
up to 20% lower compared with normal vibrated concrete having same compressive
strength and made of same aggregates. Leemann and Hoffmann (2005) reported an
average modulus of elasticity of SCC to be 16% lower than that of normal vibrated
conventional concrete for an identical compressive strength.
Results available indicate that the relationships between the static modulus of
elasticity (E) and compressive strength (fc') were similar for SCC and normally vibrated
concrete. A relationship in the form of E = k.0.5fc, where k is a constant, has been widely
reported, and all values of this constant were close to the one recommended by ACI 318-
02 for structural calculations for normal weight traditional vibrated concrete (Guidelines
on SCC, 2000). Average 28-days modulus of elasticity of SCC has been reported to be 30
GPa corresponding to average 28-days cube strength of 55.41 N/mm² (Dehn et al., 2000).
2.3.3 Shrinkage and Creep
Shrinkage and creep of the SCC mixtures have not been found to be greater than
those of traditional vibrated concrete (Guidelines on SCC, 2000; Persson and Terrasi,
2002). Ramsburg et al. (2003) have reported the shrinkage of SCC as follows: 0.03% for
mixes with cement tested at 14 days, 0.03% to 0.04% for mixes with slag cement tested at
28 days, and 0.04 to 0.045% for mixes with calcined shale cement tested at 28 days.
Shrinkage and creep of SCC coincided well with the corresponding properties of normal
concrete when the strength was held constant (Persson, 2001). According to Kapoor et al
(2003), the drying shrinkage of SCC is similar to that of conventional concrete.
59
The shrinkage and creep rates of SCC have been found to be approximately 30%
higher at an identical compressive strength; this is because of the high amount of paste
(Leemann and Hoffmann, 2005). Since SCC is rich in powder content and poor in the
coarse aggregate fraction, addition of fiber will be effective in counteracting drying
shrinkage (Corrinaldesi and Moriconi, 2004).
The 90 days drying shrinkage value as reported by Xie et al (2002) was 383 x
10ˉ6 mm/mm. They suggested that SCC with UPFA (Ultra Pulverized Fly Ash) has
higher mechanical properties, excellent impermeability and freezing resistance, and lower
drying shrinkage.
In a study on SCC incorporating high volumes of class F fly ash, conducted by
Bouzoubaa and Lachemi (2001), 112-days drying shrinkage was found in the range of
493 to 591 × 10ˉ6 and 224-days drying shrinkage was in the range of 504 to 595 × 10ˉ6
(Bouzoubaa and Lachemi, 2001).
In another study on SCC incorporating high volumes of class F fly ash, conducted
by Patel et al (2004) 112-days drying shrinkage was found to be in the range of 330 to
667 × 10ˉ6 (Patel et al., 2004).
2.3.4. Durability
Durability is a general analysis of the service life and the performance of
concrete in an aggressive environment. Physical damage to concrete includes
wetting/drying, freeze/thaw or heating/cooling cycles. Chemical damage
consists of sulphate attack, acid attack, chloride attack and alkali-silica reaction
(ASR) in which water acts as a carrier. All are greatly related to the resistance of
the cover layer to transport mechanisms such as permeation, absorption and
diffusion of gas and liquid. Thus oxygen permeability, water sorptivity and
chloride conductivity have often been defined as three durability indexes due to
the simple and inexpensive test methods (Alexander and Magee, 1999).
A brief summary of water transport in concrete and other durability aspects of
SCC are demonstrated as follows.
60

Sorption is the water movement driven by capillary action in short-term
exposure in partially dry concrete. The rate of water uptake by a porous material is defined
as sorptivity. It has been considered as an important criterion to assess the durability of
concrete (Ho and Chirgwin, 1996). The pore system of the paste and the interfacial
zone has a great influence on sorptivity. The interfacial zone is porous but it is the
hardened paste, the only continuous phase in concrete, that controls the ingress and
transportation of water (Sabir et al., 1998). Sorptivity of SCC was only 30~40% of those
of NVC with the same strength grade C40 (Zhu and Bartos, 2003).
Diffusion is the water movement driven by a concentration gradient in long-
term exposure. For example, the durability of concrete in the sea is largely
determined by the diffusivity of the chloride solution entering and moving
through the matrix. Chloride diffusivity depends on the tortuosity of the pores
instead of the total porosity. Since fly ash particles made concrete dense,
concrete incorporating fly ash was reported to have a lower chloride diffusivity
(Zhu and Bartos, 2003). On the other hand, Tang et al (1999) reported a higher
chloride diffusivity than NVC because of the poor dispersion of powders. It is
interesting to note that the diffusivity of SCC with VMA is higher than NVC
and powder-type SCC (Zhu and Bartos, 2003). This confirms that the powders
used in SCC improve packing density leading to a denser structure. Diffusion
and capillary action are the primary mechanisms of ingress of water. Diffusion
was a very slow process and it accounted for about 30% of the overall water
intake whereas sorption accounts for about 70% (Neithalath, 2006).
Capillary porosity has a very important influence on hardened properties and is
useful for predicting the durability (Yaman et al., 2002). The capillary transport especially
near concrete surface is the dominant invasion mechanism. An increase in the porosity
of the cover concrete leads to more water and more dissolved chemical flowing
through the surface, and thus, more durability problems. The relationships between water
absorption and some durability such as the resistance of concrete to carbonation and
chloride (De Schutter and Audenaert, 2004), freezing/thawing cycling and wet/dry
cycles (Martys and Ferraris, 1997) were investigated. Capillary suction was influenced
by the moisture state of the specimen, the ambient conditions, curing conditions and
testing procedures (Hall, 1989).
61

Permeability is a process in which water is transported under a hydrostatic
pressure differential. The main influences on permeation include the paste
volume, the pore structure and the interfacial zone between the mortar and
aggregates. The overall porosity of SCC was lower than that of NVC of
equivalent strength because of the higher powder content, lower W/P ratio and
improved microstructure (Tragardh, 1999; Zhu et al., 2004; Zhu and Bartos, 2003). Zhu
and Bartos reported that the oxygen permeability for SCC was only 30~40% of that of
NVC with the same strength grade C40.
Other investigations on durability between SCC and NVC include:
1. SCC with limestone powder exhibited better internal frost resistance than NVC with the same W/C ratio and air content but there was little difference between SCC and NVC for salt (NaCl) and sulphate resistance (Persson, 2003).
2. The tests (Al-Tamimi and Sonebi, 2003) of SCC with 47% carboniferous limestone
powder (less than 100 µm) and a W/P ratio of 0.36, and a neat cement NVC with the
same strength (W/P ratio of 0.46), immersed in a sulphuric and hydrochloric acid
solution, showed that at 18 weeks, the mass loss due to sulphate attack of SCC was only half
that of NVC in a sulphuric acid solution; but in a hydrochloric acid solution, SCC incurred
about2.2% more mass loss than NVC. The author concluded that SCC performed better
than NVC in a sulphuric solution but was more susceptible to hydrochloric
acid attack. This difference between SCC and NVC might be due to the
difference in constituent materials: the higher cement content in NVC
contributed more calcium hydroxide than in SCC; the lower W/P ratio used
and the incorporation of limestone, which is finer than cement, both led to a
denser matrix of SCC than NVC.
3. SCC exhibited lower resistance to freeze-thaw than NVC (Zhu and Bartos,2003).
4. Few fire tests have been done on SCC. Cylinders with different mix proportions of
strength up to 104 MPa of SCC were tested; slight spalling occurred for SCC; the degree
of spalling also depended on the type of additions used (Vanwalleghem et al., 2003).
SCC was more susceptible to spalling than NVC with the same strength grade (Bostrom,
2003; Noumowe et al., 2006). This may be attributed to the denser microstructure of SCC.
62

2.3.4 Water Absorption and Initial Surface Absorption Kapoor et al. (2003) have reported a water absorption value of 1% for SCC
against 2% for normal vibrated concrete, obtained through the water absorption test
conducted as per BS 1881: Part 122. An initial surface absorption value of 0.01 ml/m²/sec
has been reported by Kapoor et al. (2003) for SCC against 0.02 ml/m²/sec for normal
vibrated concrete, obtained through ISAT conducted as per BS 1881: Part 208.
2.3.5 Water Permeability
SCC with high strength and low permeability can easily be produced (Ouchi et al.,
2001). Zhu and Bartos have found the permeability of SCC significantly lower as
compared to that of normally vibrated concretes of the same strength grade. Kapoor et al.
(2003) have reported a water permeability value of 5 mm for SCC against 10 mm for
normal vibrated concrete, obtained through the water penetration test conducted as per
DIN 1048.
The water permeability test, which is most commonly used to evaluate the
permeability of concrete, is the one specified by DIN 1048. This test is useful in
evaluating the relative performance of concrete made with varying mix proportions and
incorporating admixtures. The Concrete Society (1987) provided some indication of
typical and specified results for various concrete, as shown in Table 2.2.
Table 2.2: Assessment of Concrete Permeability according to Water Penetration Depth (The Concrete Society, 1987).
Depth of penetration, mm Permeability
Less than 30 Low
30 to 60 Moderate
More than 60 High
It is known that most specifications control the durability of concrete almost
exclusively by specifying certain requirements for concrete composition, strength and
permeability. Hilsdorf (1995) stated that this approach frequently yields unsatisfactory
results and there is a need to develop performance criteria that would allow more reliable
estimates of the potential durability of a given concrete mix and of the probable durability
63
of a concrete structure. It is generally accepted that the concrete’s resistance to
penetration of aggressive media governs concrete durability; therefore, a criterion that is
based upon such resistance should be a more reliable approach (Hilsdorf, 1995).
Permeability tests, particularly those involving water penetration and chloride
permeability, are increasingly used to test concrete to evaluate its conformance with the
specifications, particularly for concrete exposed to aggressive conditions.
2.3.6 Rapid Chloride Permeability
Rapid chloride permeability of concrete is determined using a standard test
method for electrical indication of concrete’s ability to resist chloride ion penetration,
covered by ASTM C 1202. The rapid chloride permeability test evaluates the
performance of various cementitious materials based on the accelerated diffusion of
chloride ions under the application of an external electric field. The chloride ion
penetrability of different SCC mixes, as reported by Ramsburg et al, (2003) are as
follows: 2,000 to 4,000 coulombs (categorized as “moderate”) for mixes with cement,
1,000 to 2,000 coulombs (categorized as “low”); for mixes with slag cement, and 100 to
1,000 coulombs (categorized as “very low”); for mixes with calcined shale cement.
Kapoor et al. (2003) have reported a rapid chloride permeability value of 620 coulombs
for SCC against 1970 coulombs for normal vibrated concrete, obtained through the rapid
chloride permeability test conducted as per ASTM C-1202-94.
According to Plante and Bilodean (1989), the incorporation of supplementary
cementing materials in concrete contributes to the reduction in the porosity of the system,
which, in turn, results into a reduction in the chloride ion permeability of concrete.
Patel et al. (2004) reported the rapid chloride permeability in the range of 772 and,
1379 Coulombs with percentage of fly ash in the range of 30% and 60%. According to
Nehdi et al. (2004) the 91 days rapid chloride penetration value was in the range of 400
and 900 Coulombs. Table 2.3 shows guidelines to evaluate the chloride ion permeability
based on the charge passed.
64
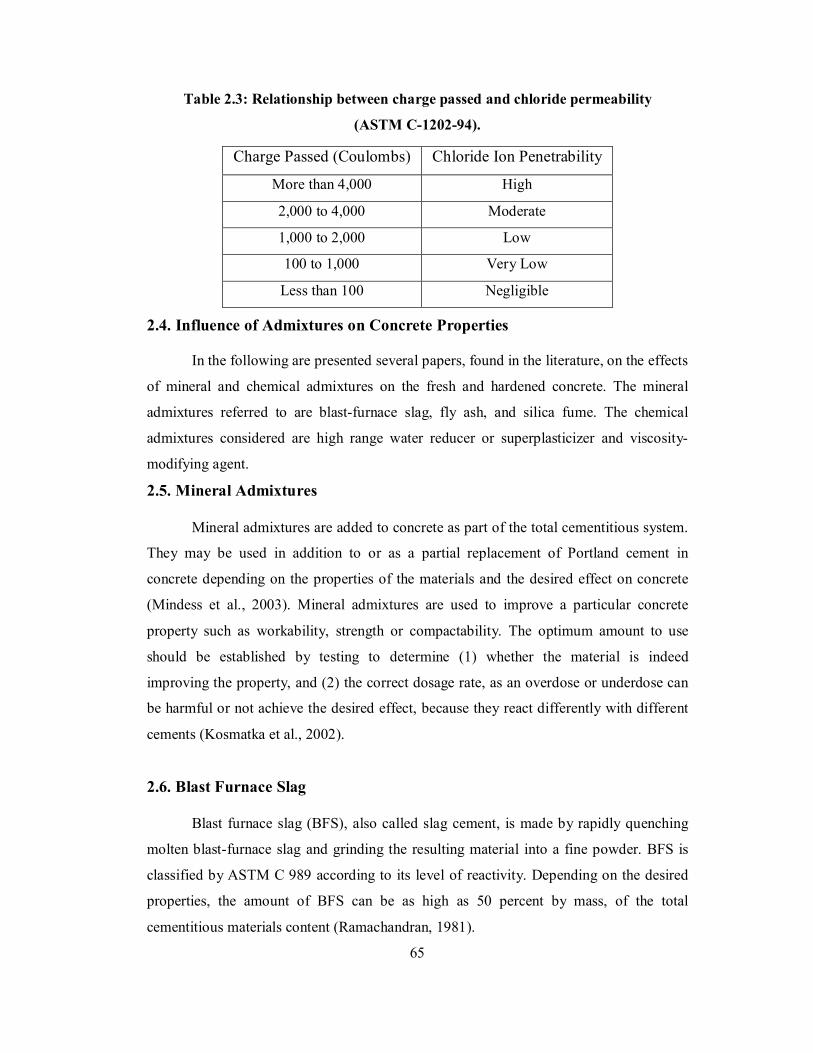
Table 2.3: Relationship between charge passed and chloride permeability
(ASTM C-1202-94).
2.4. Influence of Admixtures on Concrete Properties
In the following are presented several papers, found in the literature, on the effects
of mineral and chemical admixtures on the fresh and hardened concrete. The mineral
admixtures referred to are blast-furnace slag, fly ash, and silica fume. The chemical
admixtures considered are high range water reducer or superplasticizer and viscosity-
modifying agent.
2.5. Mineral Admixtures
Mineral admixtures are added to concrete as part of the total cementitious system.
They may be used in addition to or as a partial replacement of Portland cement in
concrete depending on the properties of the materials and the desired effect on concrete
(Mindess et al., 2003). Mineral admixtures are used to improve a particular concrete
property such as workability, strength or compactability. The optimum amount to use
should be established by testing to determine (1) whether the material is indeed
improving the property, and (2) the correct dosage rate, as an overdose or underdose can
be harmful or not achieve the desired effect, because they react differently with different
cements (Kosmatka et al., 2002).
2.6. Blast Furnace Slag
Blast furnace slag (BFS), also called slag cement, is made by rapidly quenching
molten blast-furnace slag and grinding the resulting material into a fine powder. BFS is
classified by ASTM C 989 according to its level of reactivity. Depending on the desired
properties, the amount of BFS can be as high as 50 percent by mass, of the total
cementitious materials content (Ramachandran, 1981).
65
Charge Passed (Coulombs) Chloride Ion Penetrability
More than 4,000 High
2,000 to 4,000 Moderate
1,000 to 2,000 Low
100 to 1,000 Very Low
Less than 100 Negligible

In his research, Russell (1997) found out that the use of slag cement lowers
concrete permeability, thereby reducing the rate of chloride ion diffusion. Proper
proportioning of slag cement can eliminate the need to use low alkali or sulfate-resistant
Portland cements. Russell’sresults showed that BFS can be used to enhance the strength
gain at later ages than 28 days, it replaces 20 to 30 percent by mass of the Portland
cement.
Sobolev (1999) studied the effect of adding up to 50% by mass granulated blast-
furnace slag in the cementitious material that resulted in the increasing of chemical and
thermal resistance. The very low permeability of the concrete obtained, provided high
resistance to chemical attack and to freezing and thawing cycles. There was no visible
destruction of blast- furnace slag concrete samples after 140 cycles of freezing and
thawing at -50ºC, and they also demonstrated high resistance to elevated temperatures.
Ozyildirim (2001) studied three concrete mixtures placed in the jointed plain
concrete paving project in Newport News, Virginia. The main goal was to reduce the
shrinkage and improve the flexural strength of the concrete. Two of the mixtures that he
used contained ground-granulated blast furnace slag and the third contained Class F fly
ash. The content of blast-furnace slag in the two mixtures was 30% by mass of the total
cementitious material and the maximum water-cement ratio was 0.50.
Flexural strengths at 28 days were similar for fly ash and blast-furnace slag
concretes, but after 60 days they were greater for those which contained slag. The
shrinkage values of concretes containing slag cement were slightly greater than the values
of concretes with fly ash. For freezing and thawing tests the acceptance criteria at 300
cycles were a weight loss of 7 percent and less, a durability factor of 60 and more, and a
surface rating (ASTM C 672) of 3 or less. Blast-furnace slag concretes complied with
those requirements, but the fly ash concretes had slightly higher weight loss than
required.
Hale (2000) et al. investigated the effects of the cement replacement with 25% by
mass blast-furnace slag on fresh and hardened concrete properties. As a result,
compressive strengths were increased by approximately 25 percent at 28 days as
compared to normal Portland cement mixtures. The use of 25 percent blast-furnace slag
led to minor to moderate reductions in slump and slightly lower air contents as compared
to conventional mixtures.
66
Klieger and Isberner (1967) have conducted a comprehensive study on the
properties of pastes and concretes made with Portland blast-furnace slag cements (ASTM
Type IS). Five commercial IS brands were included in these tests, in addition to a number
of Portland cements. These IS type cements were made by intergrinding a mixture of
Portland cement clinker and granulated blast-furnace slag or by making an intimate and
uniform blend of Portland cement and fine granulated blast-furnace slag. The amount of
slag used in the mixtures was between 20% and 350% by mass of the total cementitious
material.
The compressive strengths of concretes made with type IS cements were generally
lower at early ages than the strengths of concretes made with Type I cement. However, at
3 months, one year, and 3 years, the strengths were generally equal to or greater than
those of the Type I cement. Also, at the same compressive strength, values of splitting
tensile strength were essentially equal for both types of cement.
2.7. Fly Ash Gebler and Klieger (1983) studied concretes containing fly ash in order to
determine its effect on the air-void stability. 10% to 20% by mass of fly ash was used in
the total amount of cementitious material. The tests undertaken indicated that air contents
of concrete containing Class C fly ash appeared to be more stable than those of concrete
containing Class F fly ash. This occurred primarily because Class C fly ashes have lower
organic matter content and carb on content values. The studies revealed that the higher
the organic matter content of a fly ash, the higher would be the air-entraining admixture
requirement for concrete in which the admixture is used. Practically, all concretes
containing fly ash required more air-entraining admixture than concretes without fly ash
and the concretes containing Class C fly ash tended to lose less air than concretes with
Class F fly ash.
Naik and Singh (1997) conducted tests on concretes containing between 15% and
25% by mass Class F and Class C fly ashes, to evaluate time of setting, bleeding,
compressive strength, drying shrinkage, and abrasion resistance. The effects of moisture
and temperature during curing were also examined. The results of the research showed
that concretes containing Class C fly ash and were moist cured at 73°F (23°C) developed
higher early age (1 to 14 days) compressive strengths than concretes with Class F fly ash.
The long-term (90 days and greater) compressive strength of concretes containing fly ash
was not significantly influenced by the class of fly ash.
67
The air-cured concretes containing Class F fly ash did not develop strengths
equivalent to air-cured normal concretes and air-cured concretes containing Class C fly
ash developed relatively greater compressive strengths than air-cured concretes
containing Class F fly ash. For concretes containing either class of fly ash, compressive
strengths at 7 days increased with an increase in curing temperature. Concretes with fly
ash showed less bleeding than conventional ones. Further, concretes with Class C fly ash
showed less bleeding than concretes with Class F fly ash. Also, drying shrinkage results
for concretes containing fly ash were essentially the same as for conventional concretes ,
regardless of initial curing temperature. Drying shrinkage results for concretes with Class
F fly ash were, on the average, slightly less than for concretes with Class C fly ash. The
abrasion resistance of the concretes was essentially dependent on their compressive
strength and time of setting for most of the concretes containing the two types of fly ash
was retarded.
Dietz and Ma (2000) in their research, showed a possible application of lignite fly
ash (LFA) for the production of Self-Compacting Concrete (SCC). The lignite fly ash has
not only some characteristics of potential hydraulic materials, it can also improve the
rheological properties of the fresh concrete because of its fineness, which is a primary
advantage for SCC. Self-compacting concrete with lignite fly ash shows a good flowing
ability and high self- compactability.
Lignite Fly Ashes (LFA) are fine residues of ground lignite burned in the power
plant industry. In comparison with fly ashes from coal, LFA contains obviously more free
lime and sulfate. The chemical and mineralogical composition of the LFA shows wide
variations and because of that, fly ash with a free lime content of approximately 22% was
chosen for the project. The choice of this type of ash was due to its availability and its
constant quality. Two differently lignite fly ashes were used. One LFA, which was
untreated showed a high free lime content and was called Untreated Lignite Fly Ash (U-
LFA). The other fly ash, which was treated with water, was called Treated Lignite Fly
Ash (T-LFA). In the latter case, the free lime has changed into calcium hydroxide.
Cementitious material consisted of 75% cement and 25% fly ash, by mass. It was
discovered that, if the cement is replaced from 10% to 25% by U-LFA or T- LFA, the
water requirement is reduced. This is favorable for the workability of the fresh concrete.
The reduced water requirement indicated that the grains of the cement - LFA mixture are
68
more densely compacted. The volume between the particles, which should be filled with
water, became smaller due to the denser packing. Furthermore, the spherical LFA
particles favorably affected the workability of the mixture. It was seen that the U-LFA set
very quickly. The setting and hardening of the cement-U-LFA paste was clearly
shortened by U-LFA. The higher the U-LFA proportion was, the faster the paste hardened
and, because of this, U-LFA was replaced by T-LFA, which shortened the setting times
only slightly.
The slump flow and funnel tests showed values within the ranges of other tests
previously undertaken. The compressive strengths of hardened concrete specimens
decreased with the increasing proportion of U-LFA over 25%, while they remained
approximately constant when T-LFA was used in percentages that exceeded 25%. After
28 days, compressive strengths between 50 MPa and 60 MPa and splitting tensile
strengths between 4 and 5 MPa were obtained for self-compacting concretes, with w/c
ratios ranging from 0.3 to 0.46.
2.8 Silica Fume
In their study, Khaloo and Houseinian (1999) investigated the influence of silica
fume on compressive strength and durability of concrete. The percentage of silica fume
was between 1% and 15% and the water-cement ratios ranged from 0.3 to 0.6. The coarse
and fine aggregates consisted of river gravel and sand with maximum size of 25 mm and
5 mm, respectively.
The test results indicated that 5 to 10 percent by mass replacement of silica fume
for cement provided the highest strength for short and long terms. Compressive strength
of silica fume concrete at 28 days compared to conventional concrete increased by 20 to
40 percent, for all the variables considered. After 300 cycles, all of the concrete
specimens passed ASTM C 666 for freezing and thawing durability test.
Khayat (1997) et al. evaluated the influence of silica fume blended with cement on
some properties of fresh and hardened concrete. The properties studied were bleeding,
slump loss, time of setting, compressive strength. A total of 26 commonly used concrete
mixtures in the Canadian construction industry were developed. Half of the mixtures were
air-entrained and had water- cement ratios ranging from 0.3 to 0.6. The remaining half
contained non air-entrained mixtures and the water-cement ratios varied between 0.45 and
0.7.
69
Studies undertaken revealed that the addition of small percentages of silica fume,
usually under 10%, and proper amount of high range water-reducing admixture
(superplasticizer) could decrease the viscosity of the paste, thus reducing the water
demand and the risk of bleeding. The small particles of silica fume can displace some of
the water present among flocculated cement particles and fill some of the voids between
the coarser particles, which otherwise can be occupied by some of the mix water. This
causes some gain in workability and densification of the fresh paste. Concrete mixtures
made with blended silica fume cement exhibited substantially less bleeding than those
made with type I Portland cement. In addition, mixtures made with blended silica fume
cement showed 15 to 20 mm greater loss of slump than concretes without silica fume.
In general, concrete mixtures made with type I Portland cement and blended silica
fume cement exhibited similar initial times of setting that were within one hour apart.
When 15% of silica fume was added with a high dosage of superplasticizer, initial and
final times of setting were delayed by approximately 1 and 2 hours, respectively.
Regarding the compressive strength, Khayat (1997) et al. found out that after three days
of curing, no effect of cement type was observed on the development of compressive
strength for concretes. However, starting with the seventh day, mixtures containing
blended silica fume cement exhibited greater strength than those made with type I
Portland cement. After 28 days, in non air-entrained concretes, the use of blended silica
fume cement resulted in approximately 20% strength gain compared with mixtures
containing only Portland cement. Similar results were obtained in air-entrained concrete.
Ray and Chattopadhyay (1999) carried out studies on the effects of 4, 8, 12, 16%
of silica fume by weight of cement on compressive strength and resistance against
chemicals (acids and sulfates) of concretes. For testing of resistance against acids and
sulfates 50 mm cubic samples were oven dried at 105ºC and immersed in 2% HNO3, 2%
H2SO4, and 5% Na2SO4 solutions for 45 days. The weight and strength losses were noted
with reference to a set of undisturbed samples cured in water. Conventional concrete
exhibited slight bleeding, but this phenomenon was completely eliminated when silica
fume has been added in the mixture. Also, the values of air content decreased with the
increase in silica fume content. They dropped from 5.5% for normal concrete to 3.5% for
16% of silica fume replacement. Concretes with a content of 8% silica fume showed
70
the highest compressive strength values after 28 days (45 MPa), followed by concretes
having 4, 12, and 16%. Addition of silica fume at all percentages improved the flexural
strength, with a significant rise for a 4% content (8.5 MPa).
As regarding the resistance against acids and sulfates, test results showed that
immersion in H2SO4 has caused maximum loss in weight and strength, followed by
HNO3 and Na2SO4. The maximum strength loss of 24% has occurred for mixtures
without any silica fume, whereas the minimum loss of 12% occurred for mixtures
containing 4% of silica fume.
The influence of silica fume on workability and compressive strength of concretes
were the major research objectives for Duval and Kadri (1998). Concretes that have been
investigates had low water-cement ratios (0.25 to 0.40). The type I Portland cement was
replaced by 10-30% by mass silica fume and superplasticizer was added. It was found
that silica fume increased best the compressive strength (25%) and the workability of
concretes when its content was between 4 and 8 percent. Duval and Kadri also found out
that if silica fume exceeds 15% of the cementitious material, both compressive and tensile
strengths are reduced.
2.9. Chemical Admixtures
Chemical admixtures represent those ingredients which can be added to the
concrete mixture immediately before or during mixing. The use of chemical admixtures
such as water reducers, retarders, high-range water reducers or superplasticizers (SP), and
viscosity-modifying admixtures is necessary in order to improve some fundamental
characteristics of fresh and hardened concrete. They make more efficient use of the large
amount of cementitious material in high strength and self-compacting concretes and help
to obtain the lowest practical water to cementing materials ratio.
Chemical admixtures efficiency must be evaluated by comparing strengths of trial
batches. Also, compatibility between cement and supplementary cementing materials, as
well as water reducers, must be investigated by trial batches. From these, it will be
possible to determine the workability, setting time, bleeding, and amount of water
reduction for given admixture dosage rates and times of addition. Due to the fact that this
71
research dealt only with superplasticizers and viscosity modifiers, papers found in the
literature about these types of chemical admixtures would be presented in the following.
2.10. Superplasticizers
A study of four commercially available superplasticizers used in type I Portland
cement concrete mixes was done by Whiting (1979). They represented both melamine-
and naphthalene- based formaldehyde condensation products. Hardened concrete
specimens were prepared and tested for compressive strength development, drying
shrinkage, freeze-thaw resistance, and resistance to deicing scaling. From his research,
Whiting found out that high range water reducers were capable of lowering the net water
content of concrete mixtures from 10% to 20% when used in dosages recommended by
the manufacturers.
Also it was found out that one- and three-day compressive strengths could be
substantially increased through use of high range water reducers. Compressive strengths
over 70 MPa were obtained after 28 days of curing. The drying shrinkage was slightly
reduced in the attempt to lower the net water content of the concrete mixtures. Freeze-
thaw durability and resistance to deicer scaling of air-entrained concretes containing
superplasticizer were equal to or slightly better than air-entrained normal concretes
prepared with equal slump and cement content.
Ozkul and Dogan (1999) studied the effect of a N-vinyl copolymer
superplasticizer on the properties of fresh and hardened concretes. Workability of
concrete was measured by slump flow test and in situ tests were undertaken to find out
the pumping ability of superplasticized concrete. The coarse aggregate was crushed stone
with the maximum size of 25 mm. By using this chemical admixture, which was a little
bit different from the conventional ones, the ability of water reduction was increased
along with the retention of high workability for a longer time.
In situ test results obtained by Ozkul and Dogan (1999) demonstrated that the
superplasticized concrete could be pumped easily from a height of about 13 m and the
filling capacity was greater than 85%. The pumping pressure was the same as for normal
pumpable concrete and no segregation was observed. For mixtures with water-cement
72
ratios between 0.3 and 0.45, the slump diameters were between 500 mm and 740 mm and
the compressive strength varied between 53 MPa and 68 MPa at 28 days of age.
In their work, Roncero (1999) et al. evaluated the influence of two
superplasticizers (a conventional melamine based product and a new-generation comb-
type polymer) on the shrinkage of concrete exposed to wet and dry conditions. Tests of
cylinders with embedded extensometers have been used to measure deformations over a
period of more than 250 days after casting. In general, it was observed that the
incorporation of superplasticizers increased the drying shrinkage of concretes when
compared to conventional concretes, whereas it did not have any significant influence on
the swelling and autogenous shrinkage under wet conditions. The melamine-based
product led to slightly higher shrinkage than the comb-type polymer.
Kasami (1978) et al. have investigated the pumpability of superplasticized
concrete under field conditions. In their experiment, about 2,000 m³ of normal and
lightweight aggregate concrete, involving 14 mixes with and without superplasticizers
were pumped horizontally. The pumping distance was 109 m and line diameter 125 mm.
The dosage of the naphthalene-based superplasticizer was in the range of 0.03% to 0.04%
by weight of cement and concrete mixing was done in ready-mix agitator-type trucks.
After the addition of the superplasticizer, the mixer was rapidly agitated for one minute.
Following this process, the concrete was pumped at rates of 10, 20, 30, 40, 50, and 60
m3/h. Pump pressure and line pressure were measured at each pumping rate. The tests
data indicated that pumping pressure and line pressure loss for normal weight concrete
were reduced by about 30%, whereas those for lightweight concrete were reduced by no
more than 10%.
The effect of superplasticizer on the balance between flowability and viscosity of
paste in self-compacting concrete was investigated by Ouchi (1996) et al. From
experimental results, the ratio of V-funnel speed to flow area of cement paste with a fixed
amount of superplasticizer was found to be almost constant, independent of the water-
cement ratio. A higher amount of superplasticizer resulted in a lower ratio of V-funnel
speed to flow area. The ratio was proposed as an index for the effect of superplasticizer
73
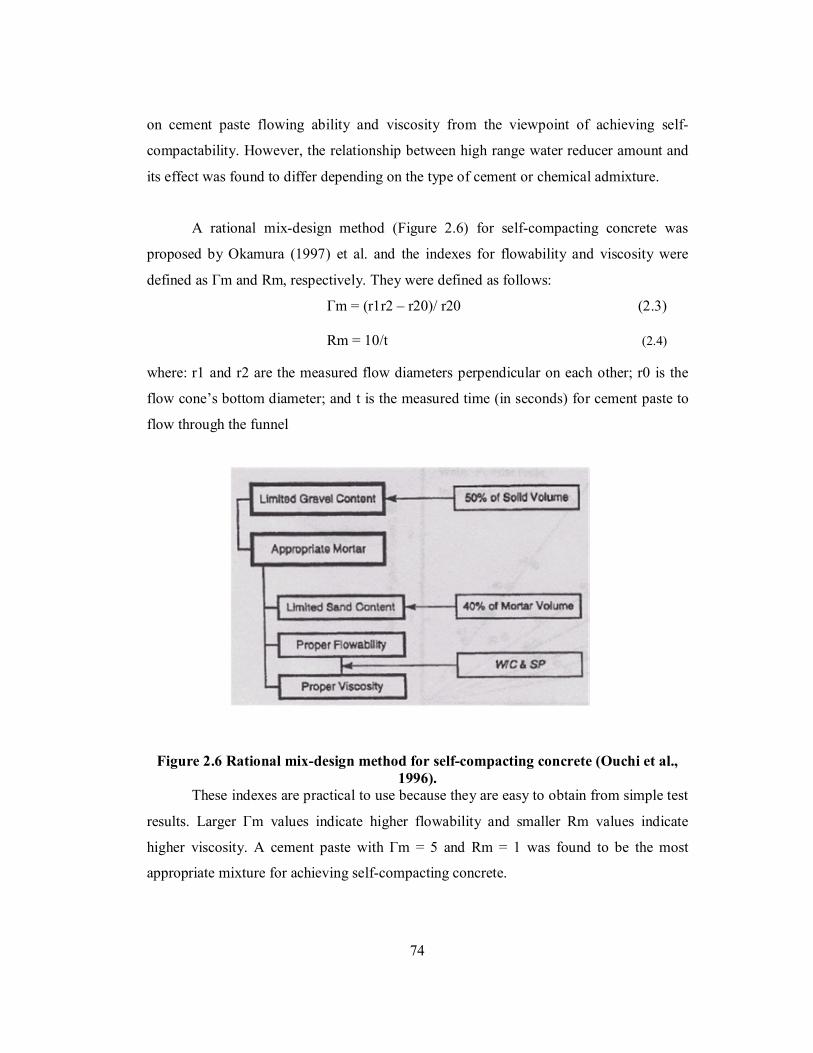
on cement paste flowing ability and viscosity from the viewpoint of achieving self-
compactability. However, the relationship between high range water reducer amount and
its effect was found to differ depending on the type of cement or chemical admixture.
A rational mix-design method (Figure 2.6) for self-compacting concrete was
proposed by Okamura (1997) et al. and the indexes for flowability and viscosity were
defined as Γm and Rm, respectively. They were defined as follows:
Γm = (r1r2 – r20)/ r20 (2.3) Rm = 10/t (2.4)
where: r1 and r2 are the measured flow diameters perpendicular on each other; r0 is the
flow cone’s bottom diameter; and t is the measured time (in seconds) for cement paste to
flow through the funnel
Figure 2.6 Rational mix-design method for self-compacting concrete (Ouchi et al., 1996).
These indexes are practical to use because they are easy to obtain from simple test
results. Larger Γm values indicate higher flowability and smaller Rm values indicate
higher viscosity. A cement paste with Γm = 5 and Rm = 1 was found to be the most
appropriate mixture for achieving self-compacting concrete.
74
2.11. Viscosity Modifiers
The viscosity modifiers or viscosity modifying admixtures (VMA) were
developed in order to improve the rheological properties of cement paste in concretes
(Khayat and Guizani, 1997). These admixtures enhance the viscosity of water and
eliminate as much as possible the bleeding and segregation phenomena in the fresh
concrete. Because not all types of viscosity modifiers have showed satisfactory results,
research has concentrated on only two types: welan gum and antiwashout admixtures.
In their research, Takada (1999) et al. investigated the influence of welan gum, a
kind of natural polysaccharide-based viscosity agent, on the water-cementitious material
ratio. It was found that the viscosity modifier raised the value of the ratio due to its
characteristics to make the mixture viscous. Welan gum increased the viscosity of the free
water in the fresh concrete by the ability of its polymers’ characteristics to associate each
other in water. The tests results showed that a slump flow value of 650 ± 30 mm and a V-
funnel time of 11 ± 2 sec were achieved by using 0.01 to 0.02 percent viscosity agent and
0.025 to 0.035 percent superplasticizer from the total cementitious material. The values
were considered adequate for a workable self-compacting concrete.
.
Khayat (1997) et al. evaluated the properties of welan gum in achieving self-
compacting concrete for use in congested members and confined areas. The viscosity-
modifying admixture (welan gum) was used to ensure adequate stability for concrete cast
in deep structural members and wall elements in order to avoid segregation and bleeding
which can result in local structural defects that can affect its mechanical properties. All
the SCC mixtures had high filling capacities ranging between approximately 60 and 70
percent, indicating excellent deformability without blockage among closely spaced
obstacles. No external bleeding was observed on the top surface of any of the cast wall
elements and the settlement values of the self-compacting mixtures measured on 150 cm
walls ranged between 1.4 and 2.9 mm. This corresponds to 0.1 and 0.2 percent of the wall
heights and is less than that for normal concrete, which was around 0.4 percent.
In order to verify the properties of self-compacting concrete, Dehn (2000) et al.
studied the interaction between the superplasticizer and viscosity-modifying agent and the
75
bonding between the reinforcing bars and self-compacting concrete. They found out that
the polymer in the viscosity modifier (welan gum) and the polymer in the superplasticizer
restrain each other and this phenomena results in a higher segregation resistance and
some larger dosage of SP for a particular deformability. It was also seen that depending
on the mix design and chemical admixtures dosages the bond behavior in self-compacting
concrete was better than the bond in conventional concrete.
Trial mixes with varying dosages of viscosity-modifying admixture (VMA) and
high range water reducing admixture (HRWR) to achieve a wide range of flow behavior
were investigated by Ferraris (1999) et al. In these mixes, the VMA was incorporated in
order to enhance the yield value and viscosity of the fluid concrete, hence reducing
bleeding, segregation, and settlement. The enhanced cohesiveness could ensure better
suspension of solid particles in the fresh concrete and therefore good deformability and
filling capacity was achieved during casting. The HRWR used was a carboxylated
copolymer-based mixture and the VMA was a modified cellulose product. Even though
the dosages of chemical admixtures have been varied, the slump flow tests undertaken,
were not enough to determine whether a flowable concrete was self-compacting or not.
Subramanian and Chattopadhyay (2002) carried out several trials to achieve an
approximate mix proportion of self-compacting concrete. At the initial stages of
development, mixtures were formulated without incorporating any viscosity-modifying
agents. After several trials, it was apparent that these admixtures imparted exceptional
stability to the mixture. The viscosity-modifying agent was then required, because slight
variations in the amount of water or in the proportions of aggregate and sand would have
made the concrete unstable, that is, water or slurry might have separated from the
remaining material. However, not all VMAs were suitable for concrete applications, due
to the fact that some of them restricted the choice of superplasticizer. The welan gum that
was used, a well-known viscosity-modifying agent, was found incompatible with
melamine formaldehyde condensate-based type of superplasticizer, but after a few trials,
a naphthalene formaldehyde condensate and an acrylic polymer superplasticizers were
found to be suitable for application in self-compacting concrete. Another two types of
viscosity-modifiers, a hydroxy propyl methyl cellulose (HPMC) and guar gum, were also
76
selected for being used along with the concrete, but they failed to react properly with the
HRWR admixture. The guar gum had to be made into a suspension in water after heating
it to 60˚C and stirring for about one hour, but it lost its suspending power after 12 hours.
The HPMC entrained excessive air, causing a reduction in strength. Subramanian and
Chattopadhyay (2002) found out that with a combination corresponding to 0.012 percent
of welan gum and 0.036 percent acrylic polymer superplasticizer by weight of
cementitious material, a satisfactory self- compacting mixture could be obtained.
Investigations regarding the effects of viscosity-modifying admixture (VMA)
concentration, placement height, and mode of consolidation on enhancing the stability of
mixtures were done by Khayat and Guizani (1997). In a first phase, bleeding and
settlement were determined using 70 cm high columns cast with concrete containing
0.035 and 0.07 percent viscosity modifiers dosages. The water-cement ratios were
between 0.50 and 0.70 and the slump values from 140 to 200 mm. In the second phase,
bleeding, settlement, and segregation were evaluated for concretes with 200 mm slump,
cast in 50, 70, and 110 cm high columns. This time the mixtures had a water-cement ratio
of 0.50 and the same amounts of VMA, which was chosen to be welan gum. The
superplasticizer used was a liquid sulfonated naphthalene.
The studies showed that the addition of welan gum affected the aqueous phase of
the cement paste where chains of the water-soluble polymer could imbibe some of the
free water in the system, thus enhancing the viscosity of the cement paste. As a result,
less free water can be available for bleeding. The enhanced viscosity of the cement paste
can also improve the capacity of the paste to suspend solid particles, process that reduces
the sedimentation. Mixtures containing a viscosity modifier exhibited a shear thinning
behavior whereas the apparent viscosity decreased with the increase in shear rate. The
mixtures incorporated 0.035 and 0.07 percent of viscosity-modifying admixture and
between 0.022 and 0.035 superplasticizer, by mass of cementitious materials. All
mixtures incorporating VMA exhibited lower rates of increase in bleeding and settlement
than those without VMA, regardless of water-cement ratios.
Also, concretes containing 0.035 and 0.07 percent viscosity-modifying admixture
had approximately 30 and 50 percent lower segregation coefficients than conventional
77
ones, regardless of the height of casting. As seen from the above investigations, it is
important to enhance the stability of fluid concrete used to facilitate the casting in
congested or restricted areas. The enhanced cohesiveness of such concrete can reduce
structural defects resulting from increased porosity under aggregate and embedded
reinforcement. This can lead to improved tensile strength, impermeability, and bond
strength with reinforcement, especially in deep structural sections, which can contribute
to the reduction in congestion.
2.12. Bonding between Aggregate and Cement Paste
Physical strength and integrity of the bond achieved at the aggregate-paste
interface variously depends upon the character of the aggregate particle surface and the
nature of the immediately adjacent hydrated cement, so practically the nature of the
interface is controlled by the properties of both the aggregate and the cement paste (Dhir
and Dyer, 1999). Aggregates used in concrete have varying degrees of porosity, shape
and surface roughness as well as the possibility of adherent dust and dirt (Barksdale,
1991). The interfacial region of paste surrounding the aggregate has been shown to be
different from that of the bulk paste and has been called interfacial transition zone (ITZ).
Subramanian (1999) has shown that the parameters of concrete could be altered
for the better by choosing proper materials or by modifying the physical interfaces
between the materials. He found that in a 25-50 µm thick zone surrounding the aggregate,
a duplex layer of calcium hydroxide - Ca(OH)2 – and a porous shell, having properties
different from the bulk cement paste, were present. These factors encourage the
deposition of oriented crystals of calcium hydroxide, giving rise to weak planes along
which microcracks occur. Some methods found to improve the aggregate paste interface
were to reduce the water-cement ratio, to add small amounts of microsilica, and to coat
the aggregate faces with a reactive layer. By precoating the aggregate particles with
cement-microsilica slurry, the bond strength increased, visible through a compressive
strength increase, and the porosity at the transition zone was practically eliminated.
Regarding the aggregate in high-strength concretes, Kosmatka (2002) et al.
indicated that careful attention must be given to aggregate size, shape, surface texture,
78
mineralogy, and cleanness. In high-strength concretes, the strength of the aggregate itself
and the bond with the cement paste became very important factors. Tests have shown that
crushed-stone aggregates produce higher compressive strength in concrete than gravel
aggregate using the same size aggregate and the same cementing materials content. It has
been assumed that the increase in strength was due to a superior aggregate-paste bond
when using rough, angular, crushed material. In addition, coarse aggregates used in high-
strength concrete should be clean, that is, free from detrimental coatings of dust and clay,
since they might affect the quantity of fines and consequently the water demand and
aggregate-paste bond of a concrete mix.
Bijen and Rooij (1999) discovered that the composition of the interfacial
transition zone (ITZ) is weak and porous and influences the bulk properties of concrete,
such as strength, bonding between aggregate and cement paste, and transportability for
water and ions in the pore water. Because of its thickness (around 50 µm) and porosity, a
large fraction of the cement matrix belongs to it, fact which affects the bonding between
aggregate and the cement paste.
An investigation into the reasons for the existence of the interfacial transition zone
has revealed that a phenomenon called syneresis is responsible for the formation of a
water-rich layer around the aggregate, which weakens the aggregate-paste bond.
Syneresis takes place when a system undergoes rapid flocculation and the result is a loose
flock in which most particles tend to be linked to two or three other particles. The
structure of these flocks is tenuous and contains a substantial amount of entrapped water.
The formation of a great number of contacts leads to a contraction of the dispersed phase,
and when its volume decreases the water is spontaneously expelled from the flocks. Bijen
and Rooij (1999) have also discovered that the addition of fly ash and silica fume in
concrete decreased the thickness of the interfacial transition zone due to the pozzolanic
reaction mechanisms.
Detwiler (1988) et al. examined the orientation of calcium hydroxide crystals in
the interfacial zone and discovered that the crystals of calcium hydroxide in this zone
strictly oriented. They have seen that the axes of the crystals were perpendicular to the
79
aggregate surface and the degree of such orientation grew currently with time, without
being dependent on the sizes and types of the aggregate particles.
Research regarding the influence of the surface condition of aggregate on the
cement- aggregate bond and compressive strength of concrete was carried out by Perry
and Gillott (1977). They utilized ground glass balls with diameters of 15 mm and various
degrees of roughness as aggregate particles. The research have demonstrated that the
gradually increased roughness degree of the aggregate particles constrained the process of
formation and propagation of microcracks at the interfacial transition zone, and thus
promoted improvement of the compressive strength and cement-aggregate bond of the
concrete.
However, it was seen that, in general, the strength of concrete made with
aggregate carefully selected was governed by the strength either of the cement paste or of
the bond between the paste and the aggregate particles.
2.13 Examples of Self-Compacting Concrete Applications
Since the development of the prototype of self-compacting concrete in 1988, the
use of this type of concrete in actual structures has gradually increased. Due to its special
properties, self-compacting concrete has been chosen to partially replace the conventional
concrete in a few construction projects of major importance, in Japan and Canada. The
following are some examples of construction applications, which used self-compacting
concrete.
The Bankers Hall project, which was one of the largest commercial office projects
in Calgary, Western Canada, involved the placement of self-compacting concrete in two
mat foundations with congested reinforcement (Nmai and Violetta, 1996). The amount of
concrete used was approximately 9,000 m³ and the mixture was proportioned so that it
would have very good flowing characteristics in order to satisfy the pumping and
placement requirements, because of the intricate reinforcement.
A very important application of self-compacting concrete was the two anchorages
of Akashi-Kaikyo (Straits) Bridge opened in April 1998 in Japan (Ouchi and Hibino,
2000), a suspension bridge with the longest span in the world, approx. 1,991 meters
80

(Figure 2.7). The volume of the cast concrete in the two anchorages was around 2,90,000
m³. A new construction system, which made full use of the performance of self-
compacting concrete, was introduced for this. The concrete was mixed at the batching
plant beside the site and was pumped out of the plant. It was transported 200 meters
through pipes to the casting site, where the pipes were arranged in rows of 3 to 5 meters
apart. The concrete was cast from gate valves located at 5- meter intervals along the
pipes. These valves were automatically controlled so that a surface level of the cast
concrete could be maintained. In the final analysis, the use of self-compacting concrete
shortened the anchorage construction period by 20%, from 2.5 to 2 years.
Figure 2.7 Anchorage of Akashi-Kaikyo Bridge, Japan (Ouchi and Hibino, 2000).
Self-compacting concrete was also used with success for the wall of a large Liquid
Nitrogen Gas (LNG) tank belonging to the Osaka Gas Company, Japan, whose concrete
casting was completed in June 1998 (Ouchi and Hibino, 2000). In this case, the volume of
the concrete used in the tank amounted 12,000 m3 and was transported from the batching
plant using ready- mixed trucks.
A new developed construction system used for casting concrete is the so-called
sandwich structure, where concrete is filled into a steel shell (Ozawa, 1989). This sort of
structure has already been completed in Kobe, Japan, which could not have been achieved
without the development of self-compacting concrete (Figure 2.8).
81
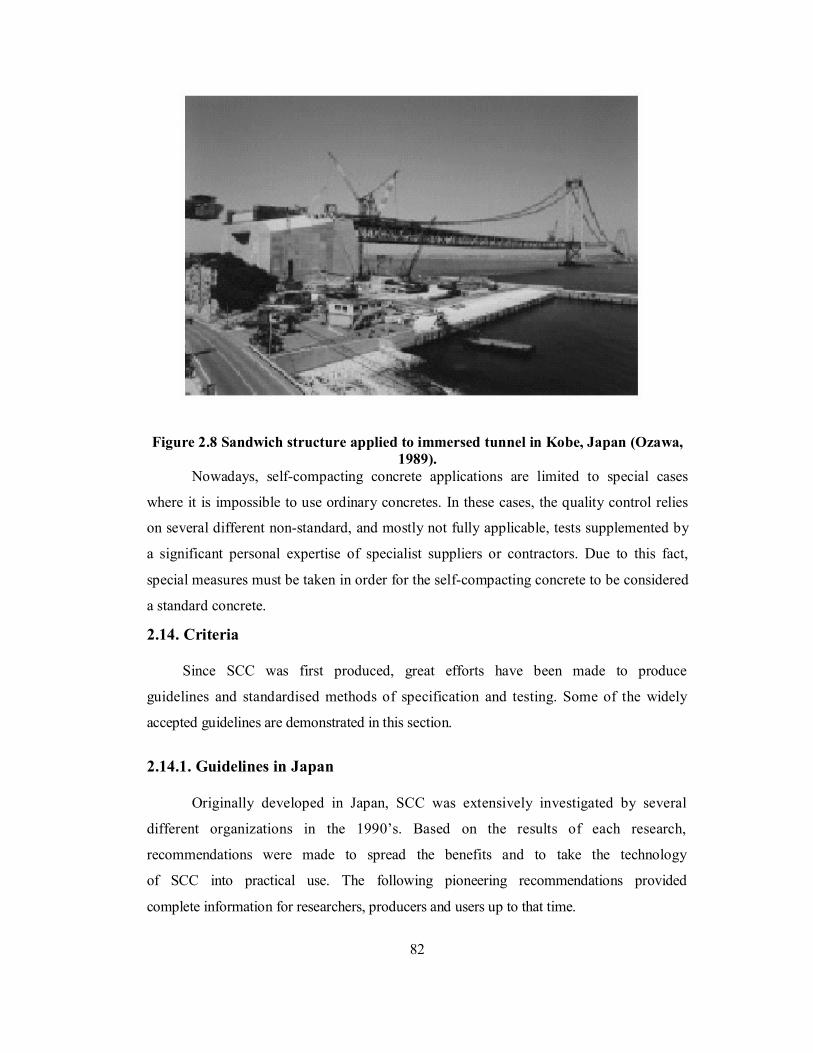
Figure 2.8 Sandwich structure applied to immersed tunnel in Kobe, Japan (Ozawa, 1989).
Nowadays, self-compacting concrete applications are limited to special cases
where it is impossible to use ordinary concretes. In these cases, the quality control relies
on several different non-standard, and mostly not fully applicable, tests supplemented by
a significant personal expertise of specialist suppliers or contractors. Due to this fact,
special measures must be taken in order for the self-compacting concrete to be considered
a standard concrete.
2.14. Criteria
Since SCC was first produced, great efforts have been made to produce
guidelines and standardised methods of specification and testing. Some of the widely
accepted guidelines are demonstrated in this section.
2.14.1. Guidelines in Japan
Originally developed in Japan, SCC was extensively investigated by several
different organizations in the 1990’s. Based on the results of each research,
recommendations were made to spread the benefits and to take the technology
of SCC into practical use. The following pioneering recommendations provided
complete information for researchers, producers and users up to that time.
82
1. ‘Recommendations for mix design and construction practice of high consistence
concrete’ by the Architectural Institute of Japan in 1997.
2. ‘Recommendation for construction of self-compacting concrete’ by the Japan Society of Civil Engineers in 1998.
3. ‘Manual for manufacturing of self-compacting concrete’ by the Ready-mixed Concrete Industry Association of Japan in 1998.
These defined SCC’s characteristics and many technical terms, listed applicable
materials, provided typical methods to design and judge acceptable performance, and also
covered the requirements of production and quality control on site. They classified SCC
into three types (powder, viscosity and combined), ranked its characteristics according
to reinforcement conditions, related SCC performance with Bingham parameters
and emphasized the importance of surface moisture of aggregate on the production.
They established a solid base for further research and developments.
However, different organizations produced different recommendations, and there
were no national standards for SCC test methods.
Similarly, subsequent research on SCC that has been carried out in individual
organizations in North America and Canada has not produced any co-ordinated or national
recommendations.
2.14.2 Guidelines in Europe
SCC has been growing rapidly across Europe since mid 1990’s. As a result,
many guidelines were proposed in European countries.
The first edition of European guidelines was produced in 2002:
“Specification and Guidelines for Self-Compacting Concrete by the European Federation of Producers and Contractors of Specialist Products for Structures” by EFNARA in February 2002.
83
These were based on the latest research results and abundant practical
experience. It defined SCC’s key properties (filling ability, passing ability and segregation
resistance) more clearly and specified the requirements for constituent materials and
practical applications of SCC.
It stated that besides fly ash, silica fume and GGBS, finely crushed stone,
ground glass and pigments all can be used in SCC, which encouraged studies on
more types of powders in SCC. Steel or polymer fibres could also be used
which extends SCC to wider applications. The guidelines provided typical test
combinations and acceptance criteria for SCC with a maximum aggregate size
up to 20 mm and slump flow in the range of 650~800 mm, which is more
flowable than that in Japan. Compared with those in Japan, SCCs in Europe are
higher in fine aggregate content and lower in powder content. Some tests
developed in the early stages of SCC development, e.g. U-box test and the
filling box test were described. The sieve stability test for segregation and a
value of 5~15% were recommended. They also recommended tolerances, for
example, ±50 mm for slump flow but this was based on experience not on
precise data. It did not specify mix design methods, but took an example based
on Japanese’s general purpose method and provided typical ranges of mix
proportions of SCC.
These guidelines were updated in 2005:
The European guidelines for SCC (The SCC European Project Group, 2005) and
provided state of the art information for producers, designers, users, specifiers and
purchasers.
Based on increasing amounts of research and experience, these guidelines
properly defined SCC, classified its various properties, proposed test methods
and the potential for standards, provided information of constituent materials
and overall properties, and recommended acceptance values for various
applications. It therefore has been gradually accepted by many countries beyond
Europe. The recommended classes of SCC are summarised in Table 2.4 (Testing-SCC,
2005; The Concrete Society and BRE, 2005).
84

Table 2.4 European classes on SCC (Testing-SCC, 2005;
The Concrete Society and BRE, 2005)
The deformation capacity of SCC is divided into three classes based on slump
flow, SF1, SF2 and SF3 which are for low, good and high filling ability respectively.
1. SF1 is the minimum requirement for SCC. Mixes of slump flow less than
600 mm may require minor vibration in practical applications.
2. Mixes of SF2 are suitable for most practical applications. A case study
indicates that nearly half of the applications of SCCs fell in class SF1 and
35% in SF2 (Domone, 2006b).
3. Mixes SF3 usually flow very easily, rapidly and for long distances which
may be required in casting of very complex shapes or heavily reinforced
concrete elements. Particular attention must be paid to the passing ability
and segregation resistance of the concrete in this range to ensure its
homogeneity.
85
Property Class SF1 550~650 SF2 660~750 SF3
Slump flow (mm) 760~850
VS1/VF1 ≤ 2 ≤ 8
Filling ability
VS2/VF2 T500 (s)
> 2 V-funnel time
(s) 9~25
PA1 ≥ 0.80 (2 bars)
Sj ≤ 15 (59 mm
bar spacing) Passing
ability
PA2
blocking ratio of L- box ≥ 0.80
(3 bars)
Step height in the J-ring (mm) Sj ≤ 15
(41 mm bar
spacing) SR1 ≤ 20 Segregation
resistance SR2 Sieve segregation
(%) ≤ 15
The deformation velocity of SCC is classified two grades:
1. T500 from the slump flow test ≤ 2 seconds or V-funnel time (tv) ≤ 8
seconds which indicates high deformation velocity;
2. T500 more than 2 seconds or tv in the range of 9~25 seconds indicating low or moderate deformation velocity.
The typical range of T500 and tv are 2~5 seconds and 5~12 seconds
respectively. It hould be noted that no segregation is the prerequisite to the
measurements of T500 and tv.
Passing ability of SCC can be classified by the blocking ratio of L-box (BR). The
minimum value of BR is recommended as 0.80. Mixes with BR ≥ 0.80 with 2 bars have
adequate passing ability for general-purpose applications with light or no reinforcement.
Mixes with BR ≥0.80 with 3 bars are suitable for placing into formwork with more closely
spaced, denser reinforcement.
The passing ability also can be classified by the step height of the J-ring (SJ):
1. SJ of 1~10 mm indicating low risk of blocking. SCC is suitable for dense reinforcement structures. No blocking was reported if SJ is less than10 mm for a SCC with V-funnel time of 4~7 seconds and slump flow of 750~800 mm (Wustholz, 2003).
2. SJ in the range of 10~20 mm indicating moderate to high risk of blocking. SCC is suitable for structures with widely spaced or no reinforcement and few obstacles.
The typical range of SJ and BR are 3~20 mm and 0.85~0.95 respectively.
Segregation index (SI) of SCC has two classes: mixes with SI ≤15 have good resistance
to static segregation; mixes with SI ≤20 show adequate resistance to static segregation. The
typical range of SI is 10~20%. The mixes of SI less than 5% may be too viscous to be self-
compacted.
86
CHAPTER 3
Self-Compacting Concrete Composition
CHAPTER 3 Self-Compacting Concrete Composition
3.0 Introduction
Self-compacting concrete (SCC) is a fluid mixture, which is suitable for placing in
difficult conditions and in structures with congested reinforcement, without vibration
(Bartos, 2000). In principle, a self-compacting or self-consolidating concrete must:
1. Have a fluidity that allows self-compaction without external energy,
2. Remain homogeneous in a form during and after the placing process, and
3. Flow easily through reinforcement
The technology of SCC is based on adding or partially replacing Portland cement
with amounts of fine material such as fly ash, blast furnace slag, and silica fume without
modifying the water content compared to common concrete. This process changes the
rheological behavior of the concrete (Johansen and Hammer, 2002).
Generally, SCC has to have a proper flowability and viscosity, so that the coarse
aggregate can float in the mortar without segregating. To achieve a balance between
flowability and stability, the total content of particles finer than the 150 µm has to be
high, usually about 520 to 560 kg/m³ (880 to 950 lb/yd³) (Kosmatka et al., 2002). Self-
compacting concrete is very sensitive to fluctuation in water content; therefore, stabilizers
or viscosity-modifying agents such as polysaccharides are used. Figure 3.1 shows an
example of mix proportions used in SCC as compared to a regular concrete mix.
In Japan, self-compacting concretes are divided into three different types
according to the composition of the mortar:
1. Powder type
2. Viscosity-modifying agent (stabilizer) type
3. Combination type
87
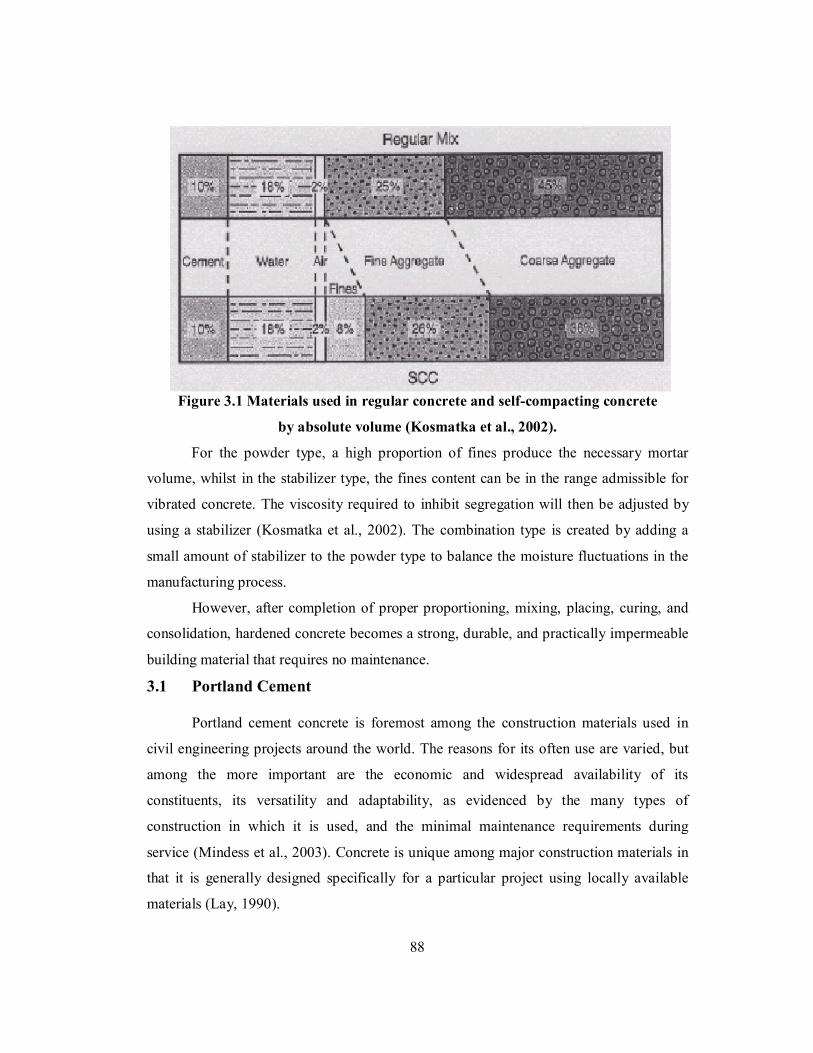
Figure 3.1 Materials used in regular concrete and self-compacting concrete
by absolute volume (Kosmatka et al., 2002).
For the powder type, a high proportion of fines produce the necessary mortar
volume, whilst in the stabilizer type, the fines content can be in the range admissible for
vibrated concrete. The viscosity required to inhibit segregation will then be adjusted by
using a stabilizer (Kosmatka et al., 2002). The combination type is created by adding a
small amount of stabilizer to the powder type to balance the moisture fluctuations in the
manufacturing process.
However, after completion of proper proportioning, mixing, placing, curing, and
consolidation, hardened concrete becomes a strong, durable, and practically impermeable
building material that requires no maintenance.
3.1 Portland Cement
Portland cement concrete is foremost among the construction materials used in
civil engineering projects around the world. The reasons for its often use are varied, but
among the more important are the economic and widespread availability of its
constituents, its versatility and adaptability, as evidenced by the many types of
construction in which it is used, and the minimal maintenance requirements during
service (Mindess et al., 2003). Concrete is unique among major construction materials in
that it is generally designed specifically for a particular project using locally available
materials (Lay, 1990).
88
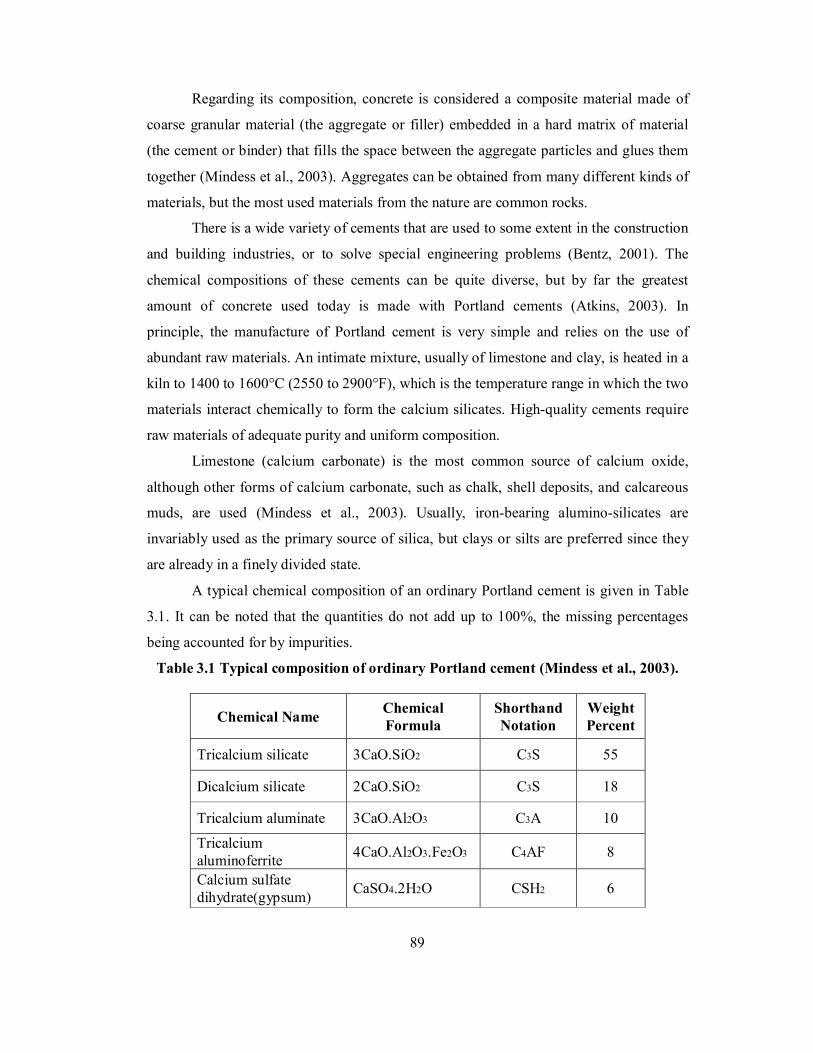
Regarding its composition, concrete is considered a composite material made of
coarse granular material (the aggregate or filler) embedded in a hard matrix of material
(the cement or binder) that fills the space between the aggregate particles and glues them
together (Mindess et al., 2003). Aggregates can be obtained from many different kinds of
materials, but the most used materials from the nature are common rocks.
There is a wide variety of cements that are used to some extent in the construction
and building industries, or to solve special engineering problems (Bentz, 2001). The
chemical compositions of these cements can be quite diverse, but by far the greatest
amount of concrete used today is made with Portland cements (Atkins, 2003). In
principle, the manufacture of Portland cement is very simple and relies on the use of
abundant raw materials. An intimate mixture, usually of limestone and clay, is heated in a
kiln to 1400 to 1600°C (2550 to 2900°F), which is the temperature range in which the two
materials interact chemically to form the calcium silicates. High-quality cements require
raw materials of adequate purity and uniform composition.
Limestone (calcium carbonate) is the most common source of calcium oxide,
although other forms of calcium carbonate, such as chalk, shell deposits, and calcareous
muds, are used (Mindess et al., 2003). Usually, iron-bearing alumino-silicates are
invariably used as the primary source of silica, but clays or silts are preferred since they
are already in a finely divided state.
A typical chemical composition of an ordinary Portland cement is given in Table
3.1. It can be noted that the quantities do not add up to 100%, the missing percentages
being accounted for by impurities.
Table 3.1 Typical composition of ordinary Portland cement (Mindess et al., 2003).
Chemical Name Chemical Formula
Shorthand Notation
Weight Percent
Tricalcium silicate 3CaO.SiO2 C3S 55
Dicalcium silicate 2CaO.SiO2 C3S 18
Tricalcium aluminate 3CaO.Al2O3 C3A 10
Tricalcium aluminoferrite 4CaO.Al2O3.Fe2O3 C4AF 8
Calcium sulfate dihydrate(gypsum) CaSO4.2H2O CSH2 6
89
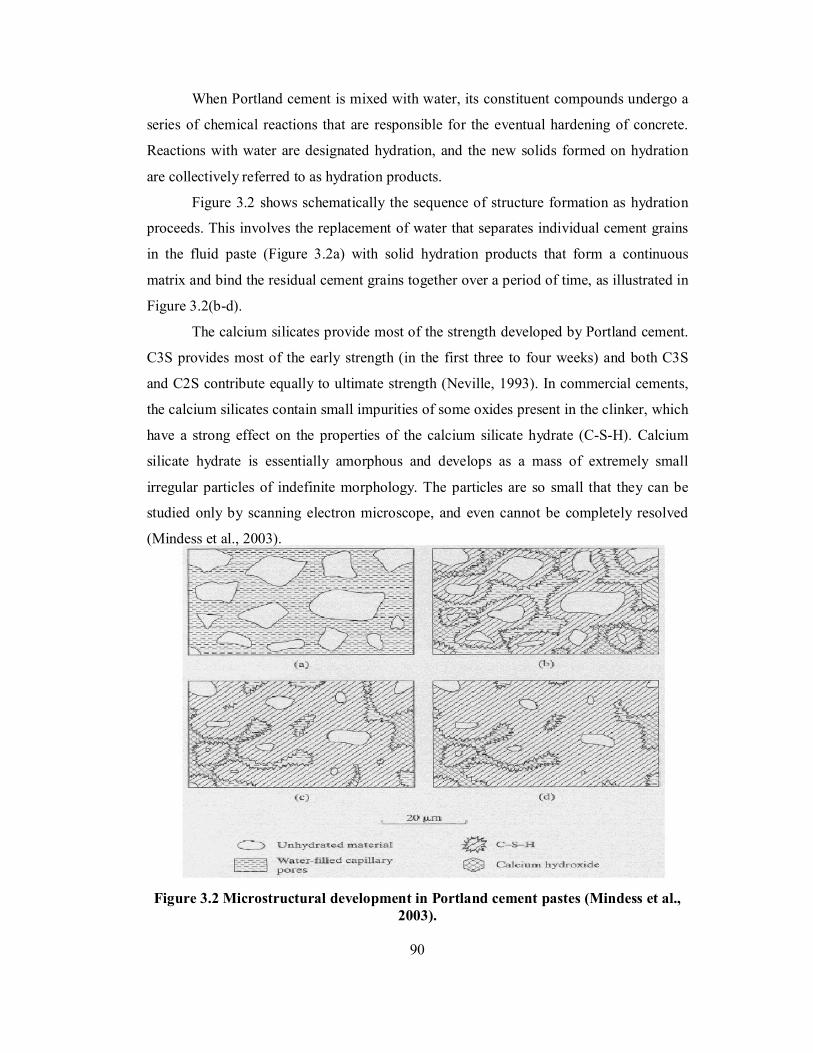
When Portland cement is mixed with water, its constituent compounds undergo a
series of chemical reactions that are responsible for the eventual hardening of concrete.
Reactions with water are designated hydration, and the new solids formed on hydration
are collectively referred to as hydration products.
Figure 3.2 shows schematically the sequence of structure formation as hydration
proceeds. This involves the replacement of water that separates individual cement grains
in the fluid paste (Figure 3.2a) with solid hydration products that form a continuous
matrix and bind the residual cement grains together over a period of time, as illustrated in
Figure 3.2(b-d).
The calcium silicates provide most of the strength developed by Portland cement.
C3S provides most of the early strength (in the first three to four weeks) and both C3S
and C2S contribute equally to ultimate strength (Neville, 1993). In commercial cements,
the calcium silicates contain small impurities of some oxides present in the clinker, which
have a strong effect on the properties of the calcium silicate hydrate (C-S-H). Calcium
silicate hydrate is essentially amorphous and develops as a mass of extremely small
irregular particles of indefinite morphology. The particles are so small that they can be
studied only by scanning electron microscope, and even cannot be completely resolved
(Mindess et al., 2003).
Figure 3.2 Microstructural development in Portland cement pastes (Mindess et al., 2003).
90
The hydration reactions of the two calcium silicates are very similar, differing
only in the amount of calcium hydroxide formed as seen in the following equations
(Mindess et al., 2003).
2C3S + 11H → C3S2H8 + 3CH (3.1) Tricalcium water calcium calcium
Silicate silicate hydroxide Hydrate 2C2S + 9H → C3S2H8 + CH (3.2) Dicalcium water calcium calcium
Silicate silicate hydroxide Hydrate
Calcium Silicat Hydrate or C3S2H8 is called calcium silicate hydrate and is the
principal hydration product. The formula C3S2H8 is only approximate because the
composition of this hydrate is actually variable over quite a wide range.
In Portland cement, the hydration of tricalcium aluminate - C3A - involves
reactions with sulfate ions that are supplied by the dissolution of gypsum, which is added
to temper the strong initial reaction of C3A with water that can lead to flash set. The
primary initial reaction of C3A is as follows:
C3A + 3C
S H2 + 26H → C3A
S 3H32 (3.3) Tricalcium gypsum water ettringite aluminate
Where
S is equivalent to SO3 and ettringite is a stable hydration product only while there
is an ample supply of sulfate available.
The ferrite phase – C4AF - forms similar hydration products to C3A, with or
without gypsum, but the reactions are slower and involve less heat. C4AF seldom
hydrates rapidly enough to cause flash set and gypsum retards C4AF hydration even more
drastically than it does C3A. Usually, changes in the composition of the ferrite phase
affect only the rate of hydration and when the iron content is raised, hydration becomes
slower.
91
3.2 Aggregates
Generally, aggregates occupy 70% to 80% of the volume of concrete and have an
important influence on its properties. They are granular materials, derived for the most
part from natural rock (crushed stone, or natural gravels) and sands, although synthetic
materials such as slags and expanded clay or shale are used to some extent, mostly in
lightweight concretes (Mindess et al., 2003). In addition to their use as economical filler,
aggregates generally provide concrete with better dimensional stability and wear
resistance. Although aggregate strength can play sometimes an important role, for
example in high-strength concretes, for most applications the strength of concrete and
mix design are essentially independent of the composition of aggregates. However, in
other instances, a certain kind of rock may be required to attain certain concrete
properties, e.g., high density or low coefficient of thermal expansion (Neville, 1993).
In order to obtain a good concrete quality, aggregates should be hard and strong,
free of undesirable impurities, and chemically stable (Garber and Hoel, 1988). Soft and
porous rock can limit strength and wear resistance, and sometimes it may also break
down during mixing and adversely affect workability by increasing the amount of fines.
Rocks that tend to fracture easily along specific planes can also limit strength and wear
resistance (Neville, 1993). Aggregates should also be free of impurities like silt, clay, dirt,
or organic matter. If these materials coat the surfaces of the aggregate, they will isolate
the aggregate particles from the surrounding concrete, causing a reduction in strength.
Silt, clay and other fine materials will increase the water requirements of the concrete,
and the organic matter may interfere with the cement hydration.
3.3 Blast Furnace Slag
Slags are by-products from metallurgical processes, either from production of
metals from ore or refinement of impure metals. They are derived from lime-based
inorganic fluxes used to extract impurities from metals, which solidify on cooling (St
John, 1998). The slags used in concrete come from the blast furnace production of iron
from ore and not from metals, and are rich in lime, silica, and alumina.
Reactivities can vary widely from slag to slag and there is not a reliable
quantitative relationship between slag composition and its reactivity (Kosmatka et al.,
92
2002). ASTM C 989 classifies slag by its increasing level of reactivity as Grade 80,100,
or 120. Blast furnace slag reacts slowly with water, so that it may take several months for
a pure slag concrete to reach the equivalent 28-day strength of a concrete made with
Portland cement. This is thought to be due to the presence of impervious coatings of
amorphous silica and alumina that form around slag particles early in the hydration
process (St John, 1998). Slag needs to be activated by alkaline compounds, which can be
either soluble sodium salts, like NaOH, Na2CO3, or NaSiO3, or calcium hydroxide
Ca(OH)2, but they are most commonly activated by Portland cement, where Ca(OH)2
formed during hydration is the principal activator. Although only 10-20% of cement is
needed for activation, slag-cement blends usually contain much more cement. The slag,
which is ground to less than 45 microns, has a surface area fineness of about 40.77 to
61.16 m²/N and its relative density is in the range of 2.85 to 2.95.
Ground granulated blast-furnace slag, when used in general purpose concrete in
North America, commonly constitutes between 30% and 45% by mass of the cementing
material in the mix (Mindess et al., 2003), even though some slag concretes have a slag
component of 70% or more of the cementitious material. It usually decreases water
demand by 1% to 10%, depending on dosage, and due to its smooth surface
characteristics and fineness, it increases pumpability, workability and reduces bleeding of
cast concrete. The use of slag will generally retard the setting time of concrete, fact,
which is advantageous during hot weather, because it allows more time to place and
finish the concrete, but has a negative effect on the early strength of it. However, the 28-
days strength is sometimes improved but, because of the slow pozzolanic reaction,
continuous wet curing and favorable temperatures may need to be provided for longer
periods than normally required. Because additional calcium silicate hydrate forms when
slag is added to the fresh concrete, its permeability will be reduced and the durability will
be increased. Ground slag also improves the resistance of concrete to sulfate attack and
significantly reduces alkali-silica reactivity.
3.4. Fly Ash
Fly ash is one of the most extensively used by-product materials in the
construction field resembling Portland cement (Pfeifer, 1969). It is an inorganic,
noncombustible, finely divided residue collected or precipitated from the exhaust gases of
93
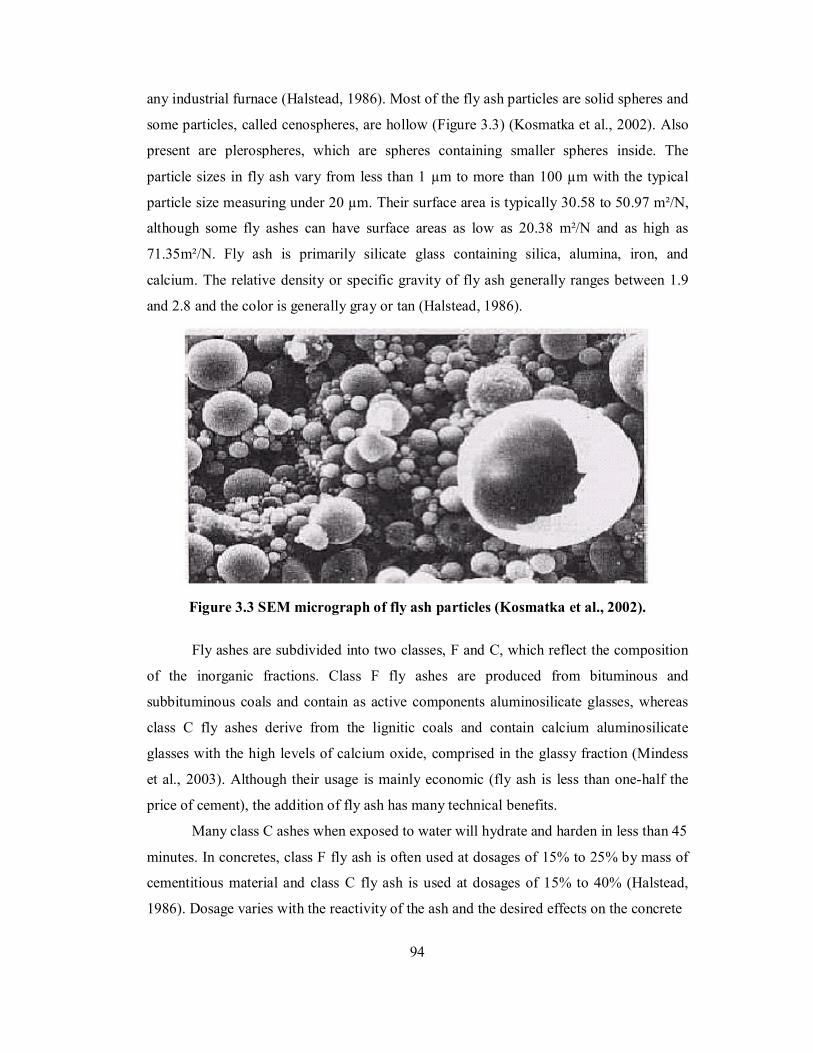
any industrial furnace (Halstead, 1986). Most of the fly ash particles are solid spheres and
some particles, called cenospheres, are hollow (Figure 3.3) (Kosmatka et al., 2002). Also
present are plerospheres, which are spheres containing smaller spheres inside. The
particle sizes in fly ash vary from less than 1 µm to more than 100 µm with the typical
particle size measuring under 20 µm. Their surface area is typically 30.58 to 50.97 m²/N,
although some fly ashes can have surface areas as low as 20.38 m²/N and as high as
71.35m²/N. Fly ash is primarily silicate glass containing silica, alumina, iron, and
calcium. The relative density or specific gravity of fly ash generally ranges between 1.9
and 2.8 and the color is generally gray or tan (Halstead, 1986).
Figure 3.3 SEM micrograph of fly ash particles (Kosmatka et al., 2002).
Fly ashes are subdivided into two classes, F and C, which reflect the composition
of the inorganic fractions. Class F fly ashes are produced from bituminous and
subbituminous coals and contain as active components aluminosilicate glasses, whereas
class C fly ashes derive from the lignitic coals and contain calcium aluminosilicate
glasses with the high levels of calcium oxide, comprised in the glassy fraction (Mindess
et al., 2003). Although their usage is mainly economic (fly ash is less than one-half the
price of cement), the addition of fly ash has many technical benefits.
Many class C ashes when exposed to water will hydrate and harden in less than 45
minutes. In concretes, class F fly ash is often used at dosages of 15% to 25% by mass of
cementitious material and class C fly ash is used at dosages of 15% to 40% (Halstead,
1986). Dosage varies with the reactivity of the ash and the desired effects on the concrete
94

(Mindess et al., 2003). Because of their spherical morphology, when using fly ash
admixtures as replacement for cement, workability and long-term strengths are achieved
in concretes. In such cases, they act like small balls to reduce interparticle friction. Fly
ashes are also used in concrete mixes in order to reduce the heat of hydration,
permeability, and bleeding. The durability is improved by providing a better sulfate
resistance, control of the alkali-silica reaction, decreased chloride diffusion, and reduction
of leaching from the reduction in calcium hydroxide (which is the most soluble of the
hydration products) and changes in pore structure. However, there are some
disadvantages related to the use of fly ash regarding the reduced air-entraining ability and
early strength due to the influence of residual carbon from the ash (Gebler and Klieger,
1986).
Fly ashes exhibit pozzolanic activity. The American Society for Testing and
Materials (ASTM) defines a pozzolan as "a siliceous or siliceous and aluminous material
which in itself possesses little or no cementitious value but which will, in finely divided
form and in the presence of moisture, chemically react with calcium hydroxide at
ordinary temperature to form compounds possessing cementitious properties." Fly ashes
contain metastable aluminosilicates that will react with calcium ions, in the presence of
moisture, to form calcium silicate hydrates.
More than 2000 years ago, Roman builders recognized that certain volcanic ashes
were capable of forming effective cements when combined with lime. The Romans
widely exploited this pozzolanic property of volcanic ashes, and many structures from the
Roman period are still intact. The modern recognition that fly ash is pozzolanic has led to
its use as a constituent of contemporary Portland cement concrete. Typical characteristics
of good quality fly ash are as follows:
1. fineness (Blaine’s): 32.62 m2/N (Min.)
2. Lime Reactivity: 4.5 N/mm2 (Min.)
3. Loss on ignition: 5% (Max.)
95

3.5 Silica Fume
Silicon, ferrosilicon and other silicon alloys are produced by reducing quartz, with
coal and iron or other ores, at very high temperatures (2000°C) in electric arc furnaces (St
John, 1998). Some silicon gas or fume is produced in the process, which reaches the top
of the furnace with other combustion gases, where it becomes oxidized to silica in contact
with the air and then condenses as < 0.1 µm to 1 µm spherical particles of amorphous
silica. This material is usually known as silica fume. It is also referred to as microsilica or
more properly, condensed silica fume (csf). Silica fume is an ultra fine powder, with
individual particle sizes between 50 and 100 times finer than cement, comprising solid
spherical glassy particles of amorphous silica (85-96 percent SiO2). However, the
spherical particles are usually agglomerated so that the effective particle size is much
coarser. Silica fume used in concrete derives from the manufacture of ferrosilicon alloys
and is modified by densification, micropelletization or slurrification, to facilitate
transportation and handling (St John, 1998). Condensed silica fume has a surface area of
about 2038 m²/N and a relative density generally in the range of 2.20 to 2.5 (Kosmatka et
al., 2002).
The pozzolanic reactions take place when silica fume is added to the concrete
mixture, and the amorphous silica, which is the major component of the pozzolan, reacts
with calcium hydroxide formed from the hydration of the calcium silicates with the
resulting product being a calcium silicate hydrate (C-S-H) (Mindess et al., 2003). Usually,
after microsilica is being added to the concrete mix, the matrix of microsilica concrete
becomes very dense (St John, 1998). This denseness effect has been attributed to the
extreme fineness of microsilica, due to the fact that 50,000 to 100,000 microspheres exist
for every cement grain, allowing microsilica hydration products to infill the water spaces
usually left within the cement hydrates, as showed in Figure 3.4. Silica fume is used in
amounts between 5% and 10% by mass of the total cementitious material, in applications
where high degree of impermeability and high compressive strength are needed in
concrete. In some situations, the water demand of concrete containing silica fume
increases with increasing amounts of silica fume, unless a water reducer or plasticizer is
used Some lean mixes may not experience an increase in water demand when only a
small amount(less than 5%) of silica fume is present.
96
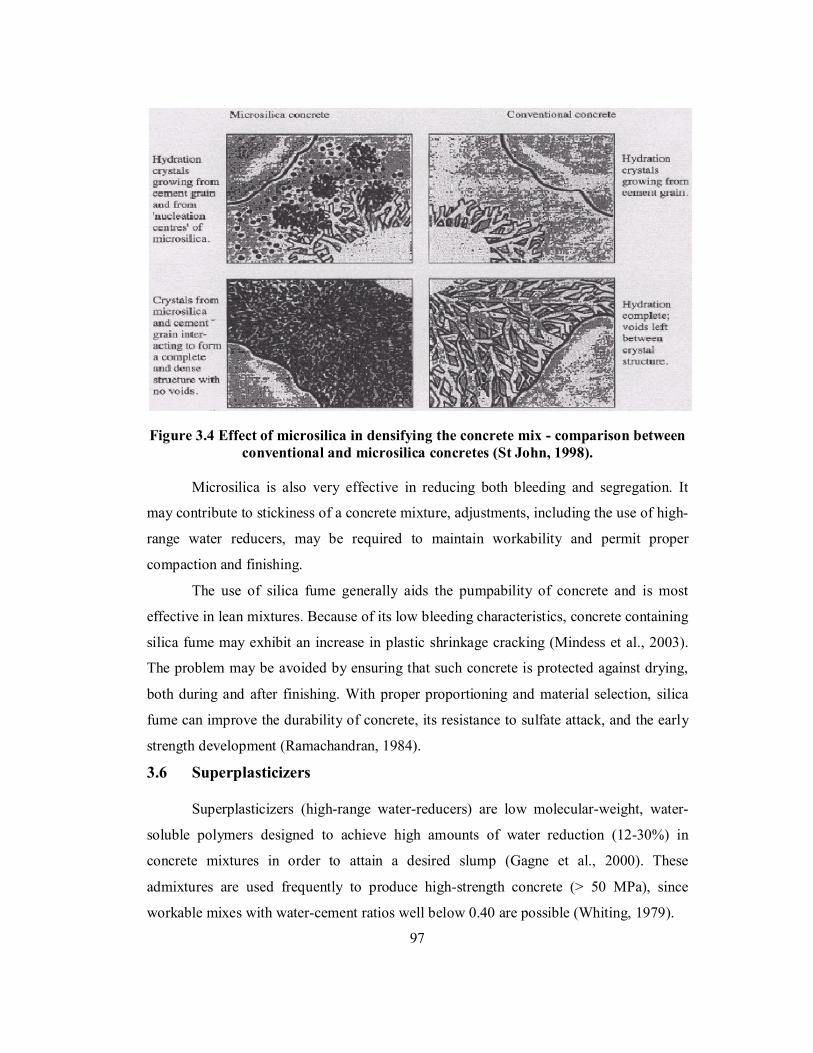
Figure 3.4 Effect of microsilica in densifying the concrete mix - comparison between conventional and microsilica concretes (St John, 1998).
Microsilica is also very effective in reducing both bleeding and segregation. It
may contribute to stickiness of a concrete mixture, adjustments, including the use of high-
range water reducers, may be required to maintain workability and permit proper
compaction and finishing.
The use of silica fume generally aids the pumpability of concrete and is most
effective in lean mixtures. Because of its low bleeding characteristics, concrete containing
silica fume may exhibit an increase in plastic shrinkage cracking (Mindess et al., 2003).
The problem may be avoided by ensuring that such concrete is protected against drying,
both during and after finishing. With proper proportioning and material selection, silica
fume can improve the durability of concrete, its resistance to sulfate attack, and the early
strength development (Ramachandran, 1984).
3.6 Superplasticizers
Superplasticizers (high-range water-reducers) are low molecular-weight, water-
soluble polymers designed to achieve high amounts of water reduction (12-30%) in
concrete mixtures in order to attain a desired slump (Gagne et al., 2000). These
admixtures are used frequently to produce high-strength concrete (> 50 MPa), since
workable mixes with water-cement ratios well below 0.40 are possible (Whiting, 1979).
97

They also can be used without water reduction to produce concretes with very
high slumps, in the range of 150 to 250 mm. At these high slumps, concrete flows like a
liquid (Figure 3.5) and can fill forms efficiently, requiring very little vibration. These
highly workable mixtures are called flowing concretes and require slumps to be in excess
of 190 mm.
Figure 3.5 Effect of superplasticizer on cement: (a) Cement and water; (b) Cement, water, and superplasticizer (Ramachandran, 1984).
Water-reducing admixtures are negatively charged organic molecules that adsorb
primarily at the solid-water interface, whereas solid particles carry residual charges on
their surfaces, which may be positive, negative, or both (Russell, 1983). In cement paste,
opposing charges on adjacent particles of cement can exert considerable electrostatic
attractions, causing the particles to flocculate (Figure 3.6a). A considerable amount of
water is tied up in these agglomerates and adsorbed on the solid surfaces, leaving less
water available to reduce the viscosity of the paste and hence that of the concrete.
Molecules of the water-reducing admixtures interact to neutralize these surface charges
and cause all surfaces to carry uniform charges of like sign (Mindess et al., 2003).
Particles now repel each other, rather than attract, and remain fully dispersed in the paste
(Figure 3.6b), thus, most of the water is available to reduce the viscosity of the paste and
of the concrete. Because superplasticizers have air-detraining properties, an air-
entraining agent must be added to the concrete to get a stable air void system before a
superplasticizer is added (Gagne et al., 1996).
98
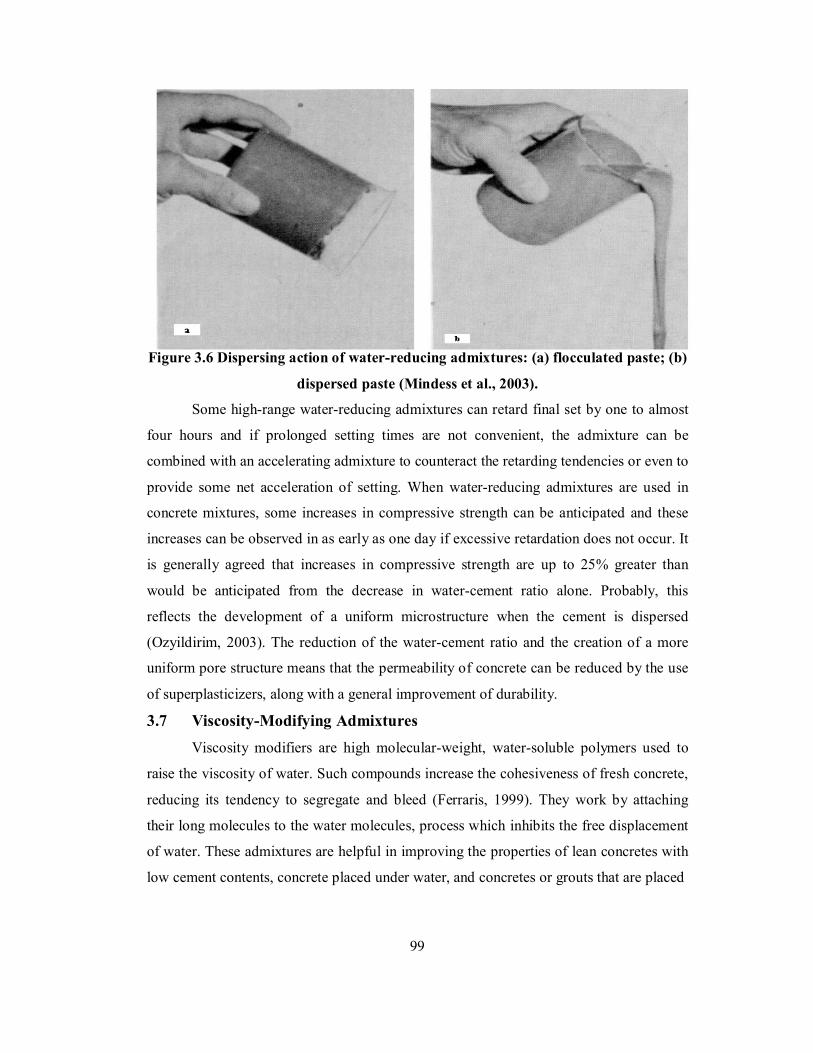
Figure 3.6 Dispersing action of water-reducing admixtures: (a) flocculated paste; (b)
dispersed paste (Mindess et al., 2003).
Some high-range water-reducing admixtures can retard final set by one to almost
four hours and if prolonged setting times are not convenient, the admixture can be
combined with an accelerating admixture to counteract the retarding tendencies or even to
provide some net acceleration of setting. When water-reducing admixtures are used in
concrete mixtures, some increases in compressive strength can be anticipated and these
increases can be observed in as early as one day if excessive retardation does not occur. It
is generally agreed that increases in compressive strength are up to 25% greater than
would be anticipated from the decrease in water-cement ratio alone. Probably, this
reflects the development of a uniform microstructure when the cement is dispersed
(Ozyildirim, 2003). The reduction of the water-cement ratio and the creation of a more
uniform pore structure means that the permeability of concrete can be reduced by the use
of superplasticizers, along with a general improvement of durability.
3.7 Viscosity-Modifying Admixtures
Viscosity modifiers are high molecular-weight, water-soluble polymers used to
raise the viscosity of water. Such compounds increase the cohesiveness of fresh concrete,
reducing its tendency to segregate and bleed (Ferraris, 1999). They work by attaching
their long molecules to the water molecules, process which inhibits the free displacement
of water. These admixtures are helpful in improving the properties of lean concretes with
low cement contents, concrete placed under water, and concretes or grouts that are placed
99
by pumping. In the latter case, they reduce pumping pressures through improved
lubricating properties, as well as reducing segregation tendencies. When compounds in
this category are used to improve the cohesiveness of concrete being placed underwater,
they are classified as antiwashout admixtures. Viscosity-modifying admixtures are added
in concretes used in places with extreme congestions due to reinforcement configurations
or unusual geometry forms, where fluid but cohesive concrete is required in order to resist
bleeding and segregation (Dodson, 1990).
The materials commonly used are polyethylene oxides, cellulose ethers, natural
gums, and polyacrylamides or polyvinyl alcohol. Other materials used are finely divided
solids such as clays and lime, but they tend to reduce the strength of the concrete and for
this reason is primarily used in grouts when strength is not of major importance. 3.8. Fibres
SCC spreads homogenously due to its own weight, without any additional
compaction energy and does not entrap air. The main characteristics of SCC in the fresh
state are filling ability, passing ability and segregation resistance. Fibres have been
produced in a wide range of materials, shapes and characteristics. They improve the
performance (strength and toughness) of brittle cement based materials by bridging
cracks, transmitting stress across a crack and counteracting the crack growth. The steel
fibre is the most common fibre type in the building industry; other fibre types like plastic,
glass and carbon fibres contribute with a smaller part to the market. Dependent on the
type and the content of the fibres the workability of concrete can be significantly affected.
With fibres concrete becomes more ductile, less material has environmental benefits and
more slender structures require less reinforcement. Fibres improve the abrasion and
impact resistance; applications with fibres can be economical and bar reinforcement can
be replaced. The production process can be facilitated with SCC. SCFRC can be
combined with prestressing strands, used for remote casting, to enhance the fire
resistance, to obtain smaller crack widths and to improve the durability.
Composing SCFRC with defined performance in the fresh and the hardened state
is a complex task; several design tools are described in this paper. SCFRC can be
optimized for various purposes to apply the highest possible fibre content, to obtain the
best performance cost ratio, to design the granular skeleton for the highest packing
density and/or to produce concrete with the lowest possible costs.
100
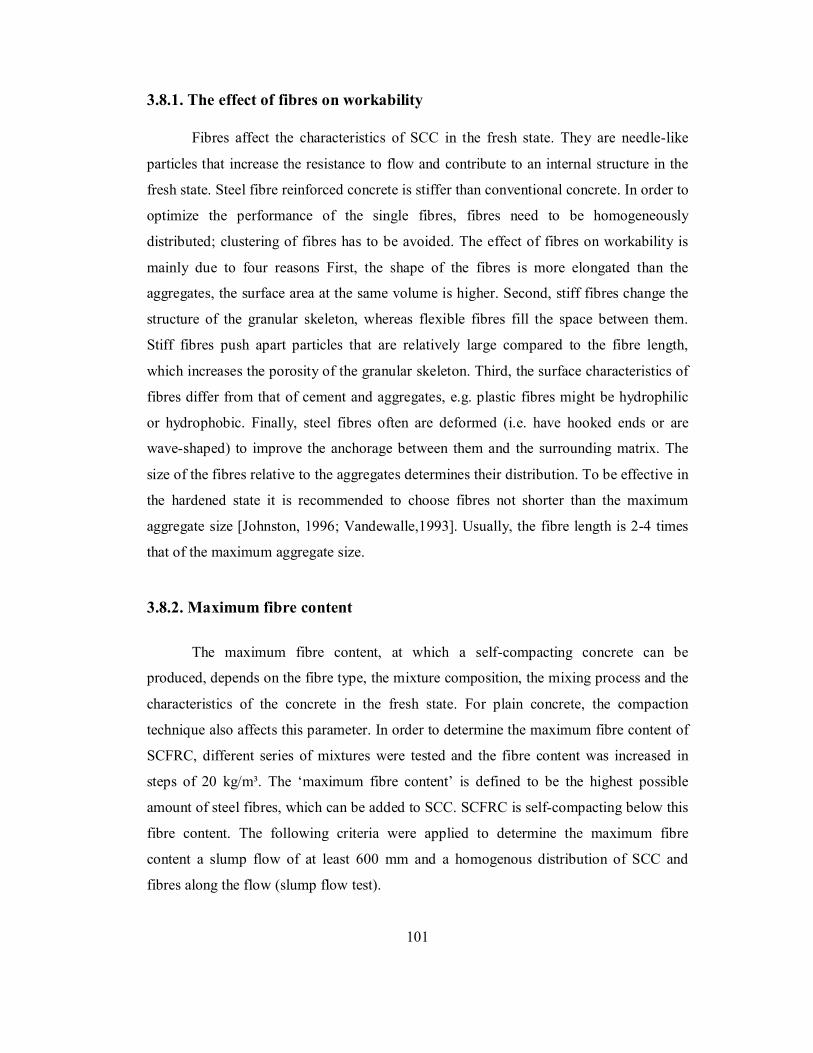
3.8.1. The effect of fibres on workability Fibres affect the characteristics of SCC in the fresh state. They are needle-like
particles that increase the resistance to flow and contribute to an internal structure in the
fresh state. Steel fibre reinforced concrete is stiffer than conventional concrete. In order to
optimize the performance of the single fibres, fibres need to be homogeneously
distributed; clustering of fibres has to be avoided. The effect of fibres on workability is
mainly due to four reasons First, the shape of the fibres is more elongated than the
aggregates, the surface area at the same volume is higher. Second, stiff fibres change the
structure of the granular skeleton, whereas flexible fibres fill the space between them.
Stiff fibres push apart particles that are relatively large compared to the fibre length,
which increases the porosity of the granular skeleton. Third, the surface characteristics of
fibres differ from that of cement and aggregates, e.g. plastic fibres might be hydrophilic
or hydrophobic. Finally, steel fibres often are deformed (i.e. have hooked ends or are
wave-shaped) to improve the anchorage between them and the surrounding matrix. The
size of the fibres relative to the aggregates determines their distribution. To be effective in
the hardened state it is recommended to choose fibres not shorter than the maximum
aggregate size [Johnston, 1996; Vandewalle,1993]. Usually, the fibre length is 2-4 times
that of the maximum aggregate size.
3.8.2. Maximum fibre content
The maximum fibre content, at which a self-compacting concrete can be
produced, depends on the fibre type, the mixture composition, the mixing process and the
characteristics of the concrete in the fresh state. For plain concrete, the compaction
technique also affects this parameter. In order to determine the maximum fibre content of
SCFRC, different series of mixtures were tested and the fibre content was increased in
steps of 20 kg/m³. The ‘maximum fibre content’ is defined to be the highest possible
amount of steel fibres, which can be added to SCC. SCFRC is self-compacting below this
fibre content. The following criteria were applied to determine the maximum fibre
content a slump flow of at least 600 mm and a homogenous distribution of SCC and
fibres along the flow (slump flow test).
101

Three observations of the slump flow indicated that the maximum fibre content
was surpassed. Fibre types having a large surface area decrease the flowability of SCC.
The fibres are homogenously distributed but the contour of the flownout concrete is not
round. This flow pattern often corresponds with a flow diameter smaller than 600 mm.
Long fibres and/or large aggregates tend to cluster along the flow; the flow diameter is
barely affected.
3.9. Concrete Mix and Tests
The concrete plant made different mixes, all with 0.8 volume-percent 60 mm steel
fibers. Segregation was a challenge and the best mix, shown in Table 3.2 was used at the
building site. The mix design of fiber reinforced concrete (FRSCC) was done using the
particle matrix model, (1). The concrete was delivered with a slump flow of 725 mm. A
blend of normal and rapid cement made the concrete sticky and less prone to segregation.
Condensed Silica Fume (CSF) was necessary to decrease the segregation of the SCC at
the building site, and a test program with 5.0 %, 7.5 % and 10 % CSF of cement weight
was carried out.
The mix with 7.5 % CSF was used in the delivery to SIBO Village. The addition
of a copolymer based superplasticizing agent was normally done at the ready-mix plant,
and it was observed that the slump flow measure increased by 20 to 30 mm during the
transport to site. However it was sometimes necessary to add copolymer at the building
site as well. The type of copolymer was also tested and there was an effect of segregation
of steel fibers. Glenium 27 from Degussa gave a high slump flow without the segregation
of the steel fibers.
The main reason for using an Air Entraining Agent was to increase the matrix plus
air volume. Preliminary tests revealed that to make FRSCC the matrix volume had to be
40-50 l/m³ higher than for ordinary SCC. Dispersed fine air bubbles made the concrete
flow better without segregation. Air bubbles have only one fourth of the effect of
increasing the cement paste, but cost less and decrease the water content, (2). Five percent
air (50 liters) corresponds to a paste volume of 12 to 15 l/m³. Further crushed fine sand (0
– 0.5 mm), with 15% filler was used to increase the matrix volume as well as the fine
sand content.
102
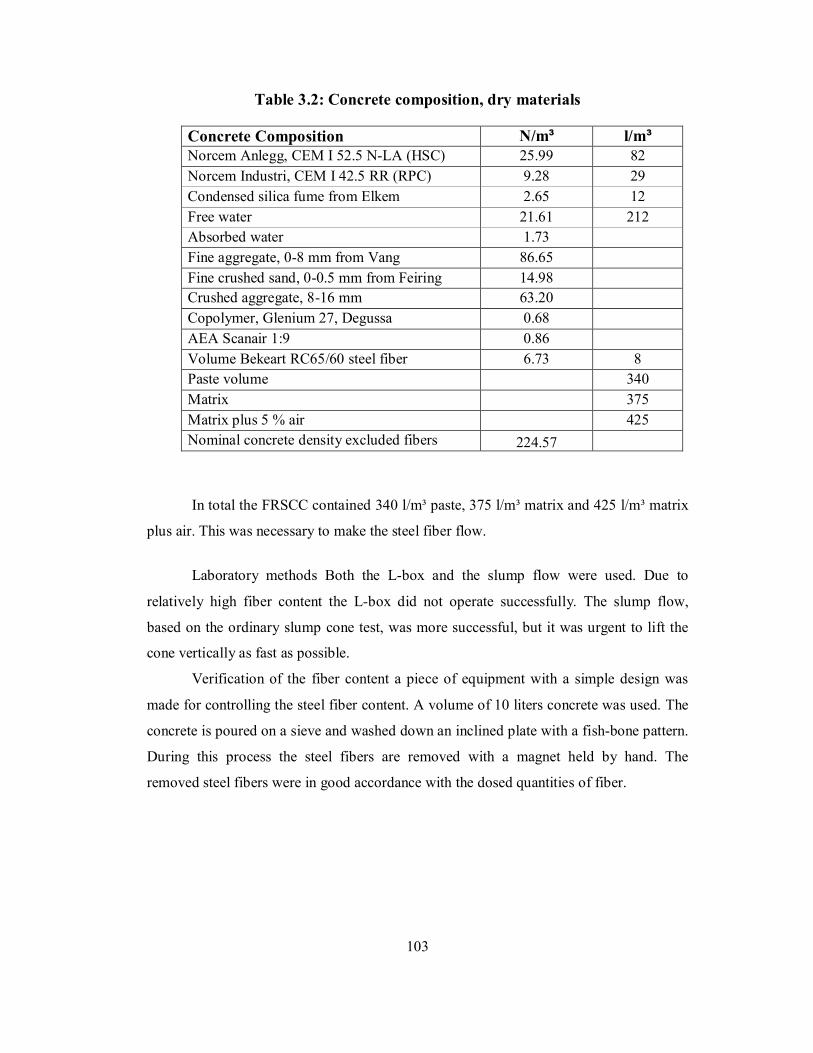
Table 3.2: Concrete composition, dry materials
Concrete Composition N/m³ l/m³ Norcem Anlegg, CEM I 52.5 N-LA (HSC) 25.99 82 Norcem Industri, CEM I 42.5 RR (RPC) 9.28 29 Condensed silica fume from Elkem 2.65 12 Free water 21.61 212 Absorbed water 1.73 Fine aggregate, 0-8 mm from Vang 86.65 Fine crushed sand, 0-0.5 mm from Feiring 14.98 Crushed aggregate, 8-16 mm 63.20 Copolymer, Glenium 27, Degussa 0.68 AEA Scanair 1:9 0.86 Volume Bekeart RC65/60 steel fiber 6.73 8 Paste volume 340 Matrix 375 Matrix plus 5 % air 425 Nominal concrete density excluded fibers 224.57
In total the FRSCC contained 340 l/m³ paste, 375 l/m³ matrix and 425 l/m³ matrix
plus air. This was necessary to make the steel fiber flow.
Laboratory methods Both the L-box and the slump flow were used. Due to
relatively high fiber content the L-box did not operate successfully. The slump flow,
based on the ordinary slump cone test, was more successful, but it was urgent to lift the
cone vertically as fast as possible.
Verification of the fiber content a piece of equipment with a simple design was
made for controlling the steel fiber content. A volume of 10 liters concrete was used. The
concrete is poured on a sieve and washed down an inclined plate with a fish-bone pattern.
During this process the steel fibers are removed with a magnet held by hand. The
removed steel fibers were in good accordance with the dosed quantities of fiber.
103
CHAPTER 4
Design of a Suitable SCC Mix
CHAPTER 4 Design of a Suitable SCC Mix
4.0 Materials for Self-Compacting Concrete:
4.0.1. Cement Ordinary Portland cement, 43 or 53 Grade can be used care is taken that it is
freshly produced and from a single producer.
4.0.2. Aggregates:
4.0.2.1. Fine aggregate: Fine aggregates can be natural or manufactured. The grading must be uniform
through out the work. The moisture content or absorption characteristics must be closely
monitored, as quality of SCC will be sensitive to such changes. Particles smaller than
0.125mm are considered as Fines, which contribute to the fine content.
4.0.2.2. Coarse aggregate:
Aggregate of size 10-12mm is desirable for structures having congested
reinforcement. Wherever possible aggregates of size higher than 20mm could also be
used. Well-graded cubical or rounded aggregates are desirable. Aggregates should be of
uniform quality with respect to shape and grading.
4.0.3. Admixtures: Admixtures are defined as, other than cement, aggregate and water which is added
to the concrete before or after mixing it.
4.0.3.1. Mineral Admixtures:
1. Ground Granulated Blast Furnace Slag (GGBS): GGBS, which is both
cementitious, and puzzolonic material may be added to improve rheological
properties.
104
2. Silica Fume: Silica fume may be added to improve the mechanical properties of
SCC.
3. Stone Powder: Finely crushed limestone, dolomite or granite may be added to
increase the powder content. The fraction should be less than 125 micron.
4. Fibres: Fibres may be used to enhance the properties of SCC in the same way as
for normal concrete.
Plain concrete possesses a very low tensile strength, limited ductility and little
resistance to cracking. Internal micro cracks are inherently present in the concrete and its
poor tensile strength is due to the propagation of such micro-cracks, eventually leading to
the brittle fracture of the concrete.
In the past, attempts have been made to impart improvement in tensile properties
of concrete members by way of using conventional reinforced steel bars and also by
applying restraining techniques. Although both these techniques provide tensile strength
to the concrete members, they however, do not increase the inherent tensile strength of
concrete itself.
It has been recognized that the addition of small, closely spaced and uniformly
dispersed fibers to concrete would act as crack arrester and would substantially improve
its static and dynamic properties.
Fiber reinforced concrete can be defined as a composite material consisting of
mixtures of cement, mortar or concrete and discontinuous, discrete, uniformly dispersed
suitable fibres.
Glass fibre is a recent introduction in making fibre concrete. It has very high
tensile strength 1020 to 4080N/mm2
105
4.0.3.2. Fly ash:
Fly ash is a by-product of the combustion of pulverized coal in thermal power
plants. The dust-collection system removes the fly ash, as a fine particulate residue, from
the combustion gases before they are discharged into the atmosphere.
Fly ash particles are typically spherical, ranging in diameter from <1 µm up to 150
µm. The type of dust collection equipment used largely determines the range of particle
sizes in any given fly ash.
Fly ashes exhibit pozzolanic activity. The American Society for Testing and
Materials (ASTM) defines a pozzolan as "a siliceous or siliceous and aluminous material
which in itself possesses little or no cementitious value but which will, in finely divided
form and in the presence of moisture, chemically react with calcium hydroxide at
ordinary temperature to form compounds possessing cementitious properties." Fly ashes
contain metastable aluminosilicates that will react with calcium ions, in the presence of
moisture, to form calcium silicate hydrates.
More than 2000 years ago, Roman builders recognized that certain volcanic ashes
were capable of forming effective cements when combined with lime. The Romans
widely exploited this pozzolanic property of volcanic ashes, and many structures from the
Roman period are still intact. The modern recognition that fly ash is pozzolanic has led to
its use as a constituent of contemporary Portland cement concrete.
Typical characteristics of good quality fly ash are as follows:
1. fineness (Blaine’s): 32.62 m2/N (Min.)
2. Lime Reactivity: 4.5 N/mm2 (Min.)
3. Loss on ignition: 5% (Max.)
4.0.3.2.1. Advantages of Fly ash:
Cement production requires huge amounts of energy. Partial replacement of
cement with fly ash is economical. In the case of mass concreting and large-scale works,
it is proved to be most economical. It is practically revealed that up to 40 to 50% cement
is replaced and the desired strengths are achieved.
106
1. It reduces the water requirement and improves paste flow behavior.
2. Improves workability
3. Increases cohesion, pumpability, finish ability and flow properties
4. Reduces heat of hydration, Segregation and bleeding
5. Cracking
6. Enhances durability
7. High resistance against chemical attack by sulphates, soil and sea water
8. Improves serviceability of concrete
9. Less shrinkage and creep
10. Improves resistance against freezing and thawing.
4.0.3.2.2 Environmental Protection:
Fly ash poses threat to the environment when proper attention is unpaid. A large
quantity of fly ash is generated from thermal power plants and some other industries. It is
dumped in yards and poses problems in and around.
By the use of fly ash in concrete, a serene, salubrious and cogenial atmosphere is
maintained. It will eliminate air pollution of ambient air, reduces greenhouse effect and
control dust nuisance.
1. Cost of fly ash is very less
2. Replaces cement to some extent
3. Utilization of a waste product
4. Reduces pollution
5. Saves energy in producing cement
4.0.3.2.3. Areas of usage of Fly ash:
It is a waste product of thermal power plants. It is suitable to use in concrete
because of its inherent properties. It is having pozzolonic and cementations properties.
Fly ash is widely used to provide
1. Mass concrete
2. Structural concrete
107
3. High strength concrete
4. Light weight concrete
It is an appropriate quantity may be added to improve the quality and durability of SCC.
4.0.3.2.4. Chemical Admixtures:
A ‘Chemical admixture’ is any chemical additive to the concrete mixture that
enhances the properties of the concrete in the fresh or hardened state. ACI-116R [2000]
defines the term admixture as ‘a material other than water, aggregates, hydraulic cement,
used as an ingredient of concrete or mortar, and added to the batch immediately before or
during its mixing’.
A number of types of Chemical admixtures are used for concrete. The general
purpose chemicals include those that reduce water demand for a given workability(‘water
reducers’),those entraining air in the concrete for providing resistance to freezing and
thawing action(‘air entrainers’),and those chemicals that control the setting time and
strength gain rate of concrete(‘accelerators’ and ‘retarders’).Apart from these chemicals,
there are others for special purposes-namely, Viscosity Modifying Agents, Shrinkage
Reducing Chemicals, Corrosion inhibiting admixtures, and alkali-silica reaction
mitigating admixtures.
A ‘water reducing chemical’, as the name implies, is used to reduce the water
content of a concrete mixture while maintaining a constant workability. The resultant
effect of the reduced water content is the increased strength and durability of concrete.
However, water reducers may also be employed to ‘plasticize’ the concrete,i.e.make
concrete flowable.In this case, the water content(or water to cement ratio)is held constant,
and the addition of the admixtures makes the concrete flow better, while the compressive
strength(which is a function of water to cement ratio),is not affected. Another use of
water reducers is to low the amount of cement (since water is proportionally reduced)
without affecting both strength and workability. This makes the concrete cheaper and
environmentally friendly, as less cement is consumed.
108

Water reducers are classified broadly into two categories: Normal and High
Range Water Reducers. The normal water reducers are also called ‘plasticizers’, while the
high range water reducers are called ‘superplasticizers’. While the normal water reducers
can reduce the water demand by 5-10%, the high range water reducers can cause a
reduction of 15-40%.
4.0.4. Superplasticizer:
In present days Superplasticizers are powerful enough to keep a concrete mix
highly workable for more than one hour with much less water.
4.0.4.1. Advantages of Superplasticizer: 1. Improved workability enables easy placing and compaction
2. Increases strength at faster rate
3. Improves quality of concrete and make durable
4. Highly cohesive concrete production thereby less segregation and bleeding
5. Enhances resistance to freezing and thawing
6. Produces high workability concrete requiring little or no vibration during
placing
7. Produces high strength, high grade concrete, by substantial reduction in water
resulting in low permeability and high early strength.
4.0.4.2. Dosage:
The optimum dosage is best determined by site trails with the concrete mix
which enables the effects of workability, strength gain or cement reduction to be
measured. As a guide the rate of addition is generally in the range of 1 to 4 lit per cubic
meter of concrete
4.0.5. Viscosity modifying Agent (VMA):
Today’s concrete has to fulfill a wide range of requirements in both the fresh and
hardened state. Concrete can be pumped both vertically and horizontally over a long
distance even with high flow, self-compacting properties.
109
The more advanced the concrete becomes (self-compacting concrete, high
performance concrete, underwater concrete, pumpable concrete, etc.) the more sensitive it
gets to material variations and fluctuations during production and placing. Production
sites are often faced with problems caused by variations in the moisture content or
grading of the aggregates and with fluctuations in the fine content of the sand. Viscosity
Modifying Admixtures can be used to produce concrete with better robustness against the
impact of variations in the concrete constituents and in site conditions, making it easier to
control and friendlier for the producer and the user.
If the test results between different batches or loads vary considerably, the cause
can be the variation of:
1. Cement characteristics,
2. Addition characteristics,
3. Grading of aggregates,
4. Moisture content of aggregates,
5. Temperature,
6. Mixing procedure, time of testing
The use of a viscosity-modifying agent can suppress some of these variations to a
certain extent.
The inclusion of VMA ensured the homogeneity and the reduction of the
tendency of highly fluid mix to segregate Gelinium-2 VMA is used for this work. The use
of a VMA gives more possibilities of controlling segregation when the amount of powder
is limited.
GLENIUM-2 is a premier ready-to-use, liquid, organic, viscosity-modifying
admixture (VMA) specially developed for producing concrete with enhanced viscosity
and controlled rheological properties. Concrete containing GLENIUM-2 admixture
exhibits superior stability and controlled bleeding characteristics, thus increasing
resistance to segregation and facilitating placement.
Reaching the right balance between fluidity and resistance to segregation
apparently opposing properties – is essential for this type of mix. This balance is lacking
when the fluidity of the concrete is obtained by adding water. Although a superplasticiser
110
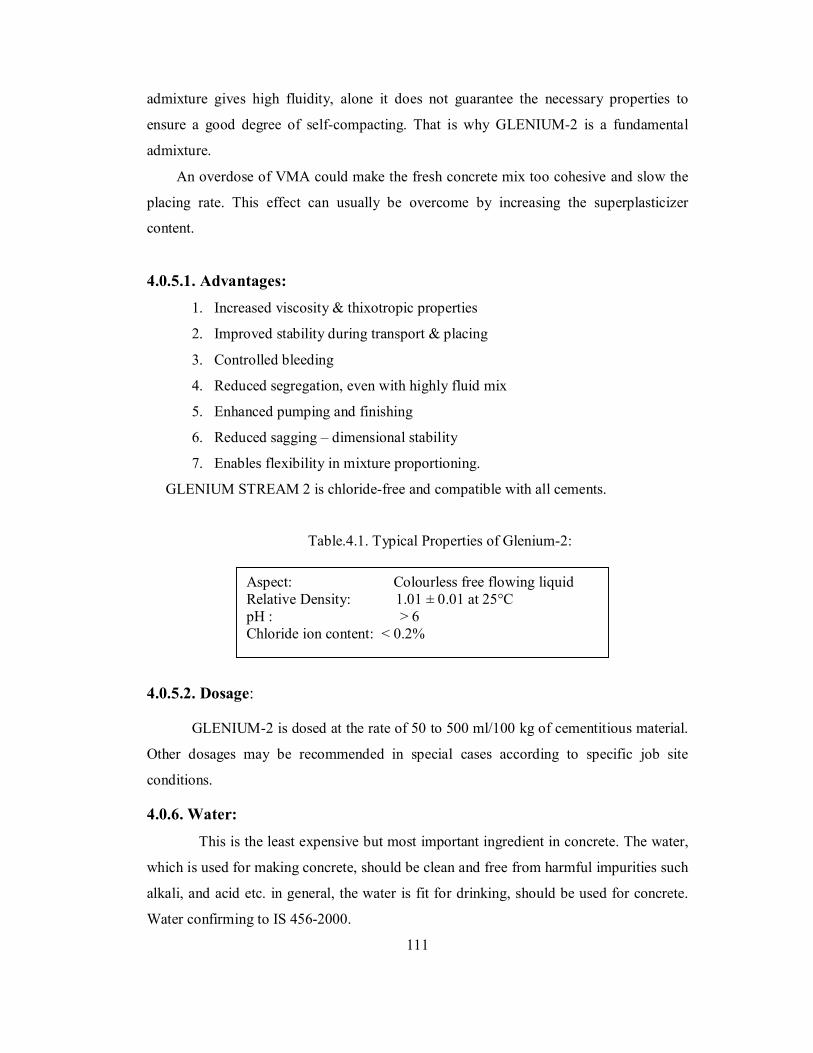
admixture gives high fluidity, alone it does not guarantee the necessary properties to
ensure a good degree of self-compacting. That is why GLENIUM-2 is a fundamental
admixture.
An overdose of VMA could make the fresh concrete mix too cohesive and slow the
placing rate. This effect can usually be overcome by increasing the superplasticizer
content.
4.0.5.1. Advantages: 1. Increased viscosity & thixotropic properties
2. Improved stability during transport & placing
3. Controlled bleeding
4. Reduced segregation, even with highly fluid mix
5. Enhanced pumping and finishing
6. Reduced sagging – dimensional stability
7. Enables flexibility in mixture proportioning.
GLENIUM STREAM 2 is chloride-free and compatible with all cements.
Table.4.1. Typical Properties of Glenium-2:
4.0.5.2. Dosage:
GLENIUM-2 is dosed at the rate of 50 to 500 ml/100 kg of cementitious material.
Other dosages may be recommended in special cases according to specific job site
conditions.
4.0.6. Water: This is the least expensive but most important ingredient in concrete. The water,
which is used for making concrete, should be clean and free from harmful impurities such
alkali, and acid etc. in general, the water is fit for drinking, should be used for concrete.
Water confirming to IS 456-2000.
111
Aspect: Colourless free flowing liquid Relative Density: 1.01 ± 0.01 at 25°C pH : > 6 Chloride ion content: < 0.2%
4.1. Mix Design:
SCC looks very different from conventional concrete while mixing. Concrete
producers must “retrain their eyes” for this very fluid mixture as it turns corners and fills
forms. Traditionally, concrete with the fluidity of SCC has had a very high water-to-
cement ratio, which would lower compressive strengths and compromise durability.
Properly designed SCC can save time and labour without sacrificing performance.
Two important properties specific to SCC in its plastic state are its flowability and
stability. The high flowability of SCC is generally attained by using high-range water-
reducing (HRWR) admixtures and not by adding extra mixing water. The stability or
resistance to segregation of the plastic concrete mixture is attained by increasing the total
quantity of fines in the concrete and/or by using admixtures that modify the viscosity of
the mixture. Increased fines contents can be achieved by increasing the content of
cementitious materials or by incorporating mineral fines.
Admixtures that affect the viscosity of the mixture are especially helpful when
the grading of available aggregate sources cannot be optimized for cohesive mixtures or
with large source variations. A well distributed aggregate grading helps to achieve SCC
with reduced cementitious materials content and/or reduced admixture dosage. While
SCC mixtures have been successfully produced with 1 ½ inch (38 mm) aggregate, it is
easier to design and control with smaller-sized aggregate. Control of aggregate moisture
content is also critical in producing a good mixture. SCC mixtures typically have a higher
paste volume, less coarse aggregate, and higher sand-to-coarse aggregate ratio than
typical concrete mixtures.
SCC mixtures can be designed to provide the required hardened concrete properties
for an application, similar to regular concrete. If the SCC mixture is designed to have
higher paste content or fines compared to conventional concrete, an increase in shrinkage
may occur.
112

4.1.1. Mix Design Principles:
To achieve the required combination of properties in fresh SCC mixes:
1. The fluidity and viscosity of the paste is adjusted and balanced by careful
selection and proportioning of the cement and additions, by limiting the
water/powder ratio and then by adding a superplasticiser and (optionally) a
viscosity-modifying admixture. Correctly controlling these components of SCC,
their compatibility and interaction is the key in achieving good filling ability,
passing ability and resistance to segregation.
2. In order to control temperature rise and thermal shrinkage cracking as well as
strength, the fine powder content may contain a significant proportion of type l or
ll additions to keep the cement content at an acceptable level.
3. The paste is the vehicle for the transport of the aggregate; therefore the volume of
the paste must be greater than the void volume in the aggregate so that all
individual aggregate particles are fully coated and lubricated by a layer of paste.
This increases fluidity and reduces aggregate friction.
4. The coarse to fine aggregate ratio in the mix is reduced so that individual coarse
aggregate particles are fully surrounded by a layer of mortar. This reduces
aggregate interlock and bridging when the concrete passes through narrow
openings or gaps between reinforcement and increases the passing ability of the
SCC.
These mix design principles result in concrete that, compared to traditional
vibrated concrete, normally contains:
1. Lower coarse aggregate content
2. Increased paste content
3. Low water/powder ratio
4. Increased superplasticiser
5. Sometimes a viscosity modifying admixture.
113
4.1.2. General requirements in the Mix Design:
4.1.2.1. A high volume of paste:
The friction between the aggregates limits the spreading and the filling ability of
SCC. This is why SCC contains high volume of paste (cement+ additions+ efficient
water+ air), typically 330 to 440lit/m3, the role of which is to maintain aggregate
separation.
4.1.2.2. A high volume of fine particles (<80m):
In order to ensure sufficient workability while limiting the risk of segregation or
bleeding, SCC contains a large amount of fine particles (around 500kg/m3). Nevertheless,
in order to avoid excessive heat generation, the Portland cement is generally partially
replaced by mineral admixtures like lime stone filler or fly ash (cement should not be
used as filler). The nature and the amount of filler added are chosen in order to comply
with the strength and durability requirements.
4.1.2.3. A high dosage of superplasticizer:
Super plasticizers are introduced in SCC to obtain the fluidity. Nevertheless, a
high dosage near the saturation amount can increase the proneness of concrete to
segregate.
4.1.2.4. The possible use of viscous agent (water retainer):
These products are generally cellulose derivative, polysaccharides or colloidal
suspensions. These products have the same role as the fine particles, minimizing bleeding
and coarse aggregate by thickening the paste and retaining the water in the skeleton. The
introduction of such properties in SCC seems to be justified in case of SCC with high
water to binder ratio (for example: house building). On the other hand they may be less
useful for high performance SCC (strength higher than 50Mpa) with low water to binder
ratio.
114
For intermediate SCC the introduction of viscosity agent has to be studied for each case.
Viscosity agents are assumed to make SCC less sensitive to variations in water content of
aggregates occurring in concrete plants. Because of small quantities of viscosity agents
required, it may be difficult to achieve accuracy of dosage.
4.1.2.5. A low volume of core segregate:
It is possible to use natural rounded, semi-crushed aggregates to produce SCC.
Nevertheless as the coarse aggregate plays an important role on the passing ability of
SCC in congested areas, the volume has to be limited. On the other hand the use of coarse
aggregate allows optimizing the packing density of the skeleton of the concrete and
reduction of the paste volume needed for the target workability. Generally speaking, the
maximum aggregate size, Dmax, is between 10 and 20mm. The passing ability decreases
when Dmax increases which leads to a decrease of the coarse aggregate content. The
choice of higher Dmax is thus possible but is only justified with reinforcement content
admixtures added to SCC can have a retarding effect on strength and temperature
development in the fresh concrete and this will have to be borne in mind in the
construction process.
4.1.3. Mix Design: Laboratory trials should be used to verify properties of the initial mix composition
with respect to the specified characteristics and classes. If necessary, adjustments to the
mix composition should then be made. Once all requirements are fulfilled, the mix should
be tested at full scale in the concrete plant and if necessary at site to verify both the fresh
and hardened properties.
The mix design is generally based on the approach outlined below:
1. Evaluate the water demand and optimize the flow and stability of the paste.
2. Determine the proportion of sand and the dose of admixture to give the required
robustness.
3. Test the sensitivity for small variations in quantities( the robustness)
4. Add an appropriate amount of coarse aggregate.
5. Produce the fresh SCC in the laboratory mixer, perform the required tests.
115
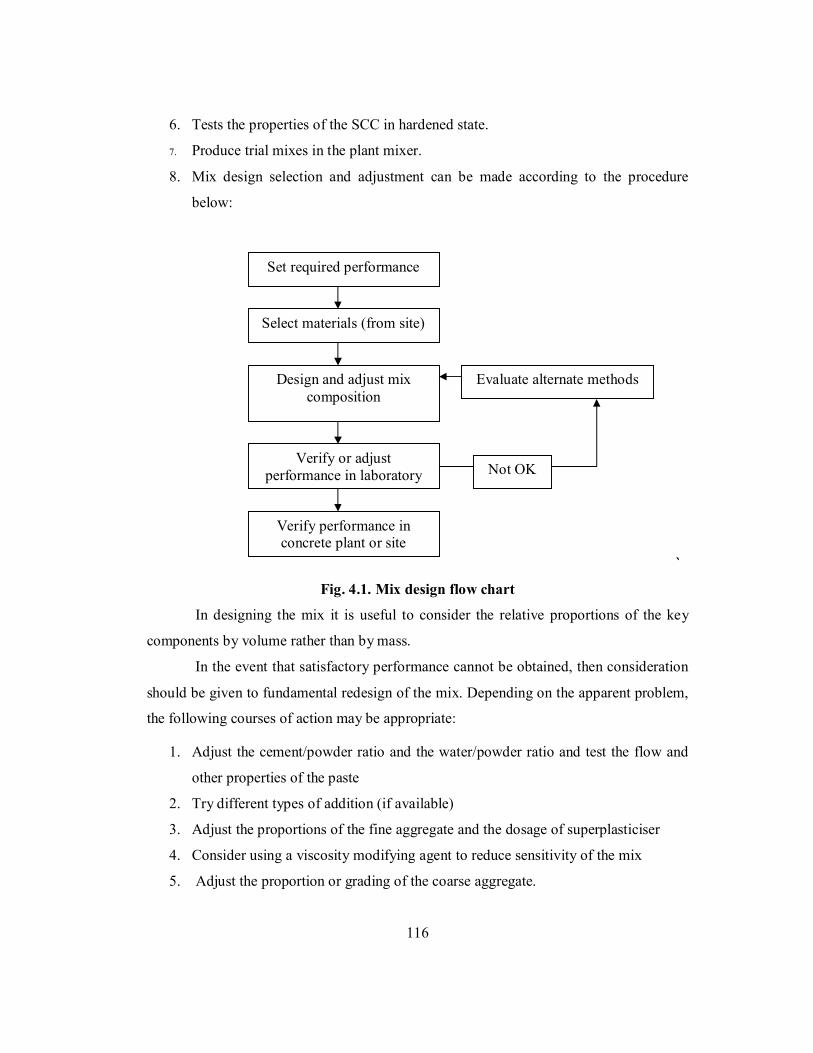
6. Tests the properties of the SCC in hardened state.
7. Produce trial mixes in the plant mixer.
8. Mix design selection and adjustment can be made according to the procedure
below:
`
Fig. 4.1. Mix design flow chart
In designing the mix it is useful to consider the relative proportions of the key
components by volume rather than by mass.
In the event that satisfactory performance cannot be obtained, then consideration
should be given to fundamental redesign of the mix. Depending on the apparent problem,
the following courses of action may be appropriate:
1. Adjust the cement/powder ratio and the water/powder ratio and test the flow and
other properties of the paste
2. Try different types of addition (if available)
3. Adjust the proportions of the fine aggregate and the dosage of superplasticiser
4. Consider using a viscosity modifying agent to reduce sensitivity of the mix
5. Adjust the proportion or grading of the coarse aggregate.
116
Set required performance
Select materials (from site)
Design and adjust mix composition
Verify or adjust performance in laboratory
Verify performance in concrete plant or site
Evaluate alternate methods
Not OK

6. The use of alternate types of super plasticizer (and or VMA), which may be more
compatible with local materials.
4.1.4. Various procedures for Mix Design: There is no standard method for SCC mix design and many academic
institutions, admixture, ready-mixed, precast and contracting companies have developed
their own mix proportioning methods.
There are many procedures available in literature for proportioning Portland
cement Concrete. Mix designs often use volume as a key parameter because of the
importance of the need to over fill the voids between the aggregates particles. Some
methods try to fit available constituents to an optimized grading envelope. Another
method is to evaluate and optimize the flow and stability of first the paste and then the
mortar fractions before the coarse aggregate is added and the whole SCC mix tested.
The bureau of Indian standards recommended a set of procedure for design of
concrete mix mainly based on the work done in national laboratories. The mix design
procedures are covered in IS 10262-1982.The method can be applied for both medium
strength and high strength concrete. The Step-by-step procedure of Mix Design is as
follows:
1. Determine the mean target strength ft from the specified characteristic
compressive strength at 28-day fck and the level of quality control.
ft = fck + 1.65 x S
Where S is the standard deviation obtained from the Table of approximate
contents given after the design mix.
2. Obtain the water cement ratio for the desired mean target using the emperical
relationship between compressive strength and water cement ratio so chosen is
checked against the limiting water cement ratio. The water cement ratio so chosen
is checked against the limiting water cement ratio for the requirements of
durability given in table and adopts the lower of the two values.
117
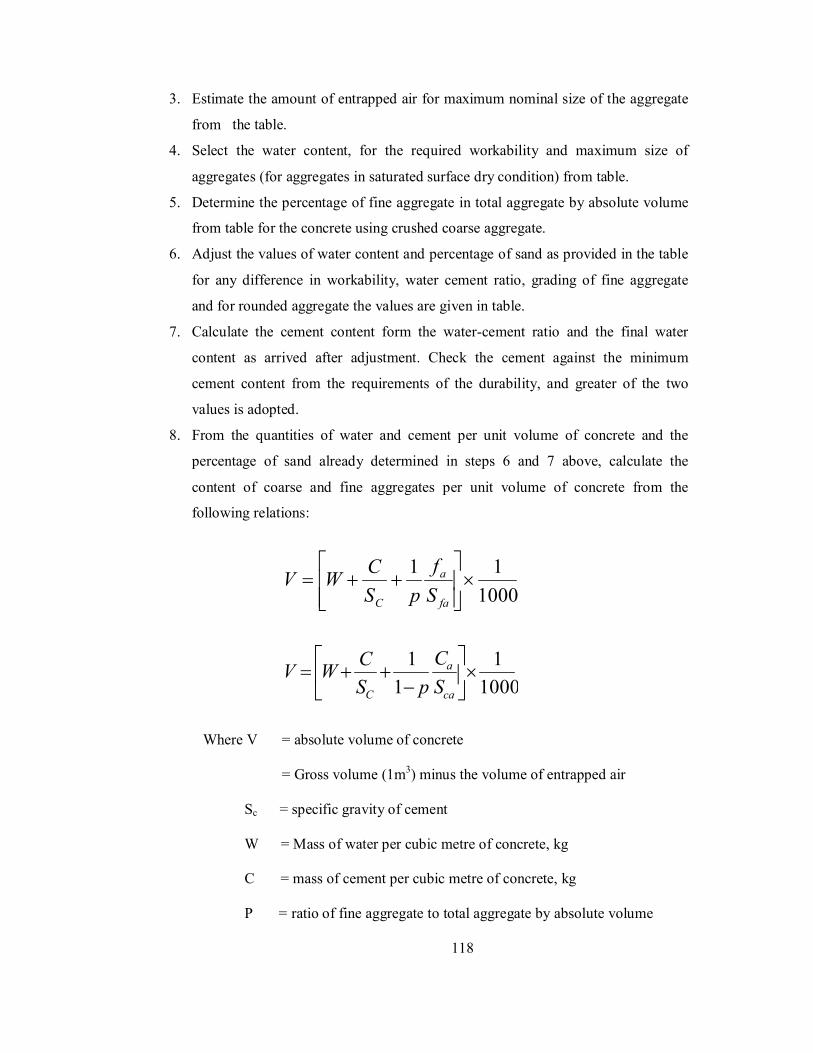
3. Estimate the amount of entrapped air for maximum nominal size of the aggregate
from the table.
4. Select the water content, for the required workability and maximum size of
aggregates (for aggregates in saturated surface dry condition) from table.
5. Determine the percentage of fine aggregate in total aggregate by absolute volume
from table for the concrete using crushed coarse aggregate.
6. Adjust the values of water content and percentage of sand as provided in the table
for any difference in workability, water cement ratio, grading of fine aggregate
and for rounded aggregate the values are given in table.
7. Calculate the cement content form the water-cement ratio and the final water
content as arrived after adjustment. Check the cement against the minimum
cement content from the requirements of the durability, and greater of the two
values is adopted.
8. From the quantities of water and cement per unit volume of concrete and the
percentage of sand already determined in steps 6 and 7 above, calculate the
content of coarse and fine aggregates per unit volume of concrete from the
following relations:
100011
fa
a
C Sf
pSCWV
10001
11
ca
a
C SC
pSCWV
Where V = absolute volume of concrete
= Gross volume (1m3) minus the volume of entrapped air
Sc = specific gravity of cement
W = Mass of water per cubic metre of concrete, kg
C = mass of cement per cubic metre of concrete, kg
P = ratio of fine aggregate to total aggregate by absolute volume
118

fa, Ca = total masses of fine and coarse aggregates, per cubic meter of
concrete, respectively, kg, and
Sfa, Sca = specific gravities of saturated surface dry fine and coarse
aggregates, respectively
9. Determine the concrete mix proportions for the first trial mix.
10. Prepare the concrete mix using the calculated proportions, cast the cubes and test
them wet after 28-days moist curing and check for the strength.
11. Prepare trial mixes with suitable adjustments till the final mix proportions are
arrived at.
4.2. By EFNARC Guidelines:
Table 4.2. Mix composition as per EFNARC guidelines:
Constituent Typical range by mass
(kg/m3)
Typical range by volume
(liters/m3)
Powder 380-600
Paste 300-380
Water 150-210 150-210
Coarse aggregate 750-1000 270-360
Fine aggregate (sand)
Content balances the volume
of the other constituents
typically 48-55% of the total
aggregate weight
Water/powder ratio by
volume 0.85-1.1
4.2.1. Guidelines to find reasons of Faulty mixes: If the test results between different batches or loads vary considerably, the cause can
be the variation of:
1. Cement characteristics,
2. Addition characteristics,
3. Grading of aggregates,
119
4. Moisture content of aggregates,
5. Temperature,
6. Mixing procedure, time of testing
The use of a viscosity-modifying agent can suppress some of these variations to a
certain extent.
4.2.2. Mix Design and Trial Proportion:
The ingredients for self-compacting concrete are similar to conventional
concrete. It consists of cement, coarse and fine aggregates, and water, mineral and
chemical admixtures. Similar to conventional concrete, self-compacting concrete can also
be affected by the physical characteristics of materials and mixture proportioning. A
rational mix design method for self-compacting concrete using a variety of materials is
necessary. The coarse and fine aggregate contents are fixed so that self-compacting
ability can be achieved easily by adjusting the water-powder ratio, super plasticizer
dosage and VMA dosage only. In the mix proportioning of conventional concrete, the
water-cement ratio is fixed at first from the viewpoint of obtaining the required strength.
With self-compacting concrete, however the water-powder ratio has to be decided taking
into account self-compactability because self-compactability is very sensitive to this ratio.
In most cases, the required strength does not govern the water-cement ratio because the
water-powder ratio is small enough for obtaining the required strength for ordinary
structure unless most of the powder materials in use are not reactive
The mortar or paste in self-compacting concrete requires high viscosity as
well as high deformability. This can be achieved by the employment of super plasticizer,
which results in a low water-powder ratio for high deformability and VMA for high
viscosity. The characteristics of powder, super plasticizer and VMA largely affect the
mortar property and so the proper water-powder ratio, super plasticizer dosage and VMA
dosage cannot be fixed without trial mixing at this stage. Therefore, once the mix
proportion is decided, self-compactability has to be tested by slump flow, L-Box and V-
Funnel test.
120
In this investigation Gelinium-2 as VMA along with Glenium B233 as super
plasticizer is used.
As an engineered concrete, SCC offers characteristics that engineer’s value.
Improved constructability to produce homogeneous and uniform concrete allows for
higher reliability in design assumptions. Engineering properties and their inter-
relationships remain unchanged from those of conventional concrete and any differences
are adequately addressed by conservatism in the design codes. The principles of concrete
durability with respect to reduced permeability, resistance to freezing and thawing and
sulphate attack, alkali-aggregate reactions, thermal stresses and corrosion protection of
reinforcement also apply similarly to SCC. SCC's superior rheology allows for the design
and construction of complex shapes with congested reinforcement, and its non-
segregating qualities are important for deep-section or long-span applications. The
fluidity of SCC can be engineered in terms of its viscosity- both the rate and degree of
flow- to allow for a wider variety of placement and construction means and methods.
121
CHAPTER 5
Quality Aspects of Self-Compacting Concrete
CHAPTER 5 Quality Aspects of Self-Compacting Concrete
5.0. Test Methods 5.0.1. Introduction
It is important to appreciate that none of the test methods for SCC has yet been
standardized, and the tests described are not yet perfected or definitive .The test method
presented here are descriptions rather than fully procedures. They are mainly adhoc
method, which have been devised specifically for SCC
In considering these tests, there are a number of points, which should be taken into
account:
1. One principal difficulty in devising such tests is to asses three distinct,
properties of fresh SCC – its filling ability (flow ability), its passing ability
(free from blocking at reinforcement), and resistance to segregation (stability).
No single test so far devised can measure all three properties.
2. There is no clear relation between test results and performance on site.
3. There is little precise data, therefore no clear guidance on compliance limits.
4. Duplicate tests are advised.
5. The test methods and values are stated for maximum aggregate size of up to
20mm, difference test values and / or different equipment dimensions may be
appropriate for other aggregate size.
6. Different test values may be appropriate for different reinforcement densities.
7. Similarly, different test values may be appropriate for being placed in vertical
and horizontal elements.
8. In performing the test, concrete should be sampled in accordance with
EN 12350-1.It is wise to remix the concrete first with a scoop, unless the
procedure indicates otherwise.
122
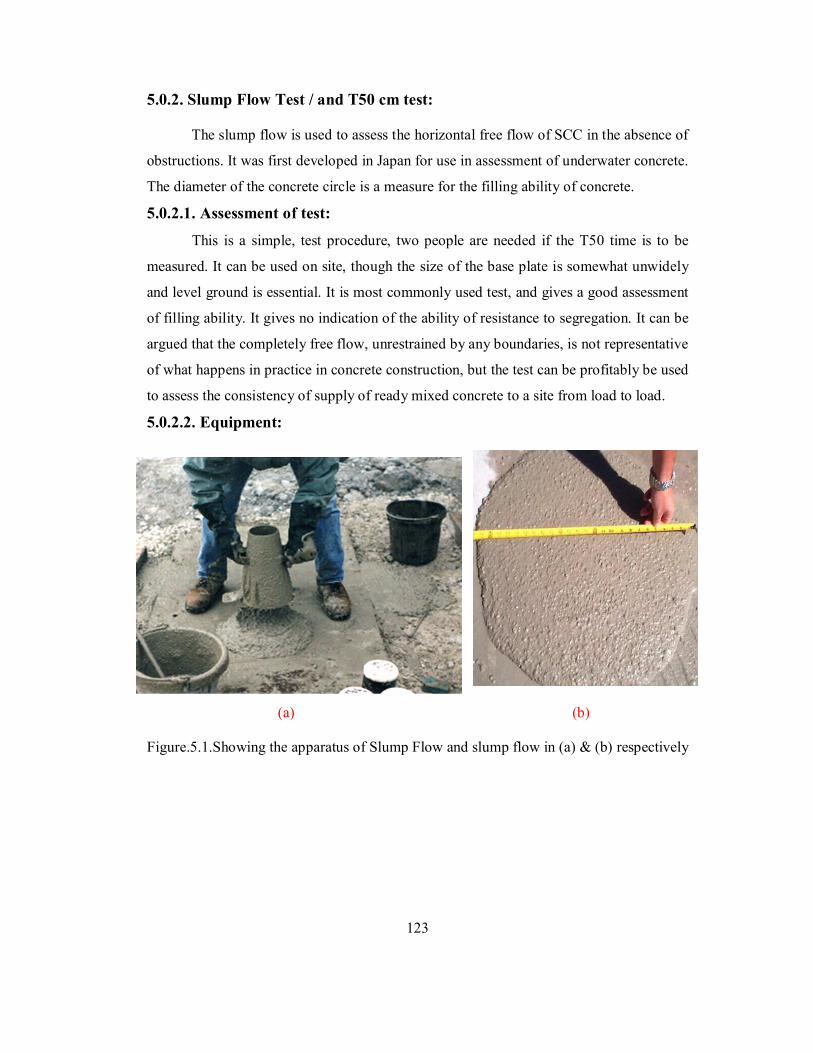
5.0.2. Slump Flow Test / and T50 cm test: The slump flow is used to assess the horizontal free flow of SCC in the absence of
obstructions. It was first developed in Japan for use in assessment of underwater concrete.
The diameter of the concrete circle is a measure for the filling ability of concrete.
5.0.2.1. Assessment of test: This is a simple, test procedure, two people are needed if the T50 time is to be
measured. It can be used on site, though the size of the base plate is somewhat unwidely
and level ground is essential. It is most commonly used test, and gives a good assessment
of filling ability. It gives no indication of the ability of resistance to segregation. It can be
argued that the completely free flow, unrestrained by any boundaries, is not representative
of what happens in practice in concrete construction, but the test can be profitably be used
to assess the consistency of supply of ready mixed concrete to a site from load to load.
5.0.2.2. Equipment:
(a) (b) Figure.5.1.Showing the apparatus of Slump Flow and slump flow in (a) & (b) respectively
123
1. Mould the shape of a truncated cone with the internal dimensions 200 mm
diameter at the base 100 mm diameter at the top and a height of 300 mm.
2. Base plate of a stiff non absorbing material, at least 700 mm square,
marked with a circle marking the central location for the slump cone, and a
further concentric circle if 500 mm diameter.
3. Trowel
4. Scoop
5. Ruler
6. Stopwatch (optional)
5.0.2.3. Procedure:
1. About 6 liters of concrete is needed to perform the test, sampled normally.
2. Moisten the base plate and inside slump cone.
3. Place base plate on level stable ground and slump cone centrally on the
base plate and hold down firmly.
4. Fill the cone with the scoop. Do not tamp, simply strike off the concrete
level with the top of the cone with the trowel.
5. Remove any surplus concrete from around the base of the cone.
6. Raise the cone vertically and allow the concrete to flow out freely.
7. Simultaneously, start the stopwatch and record the time taken for the
concrete to reach the 500mm spread circle. (this is the T50 time).
8. Measure the final diameter of the concrete in two perpendicular directions.
9. Calculate the average of the two measured diameters.(this is the slump
flow in mm)
10. Note any border of mortar or cement paste without coarse aggregate at the
edge of the pool of concrete.
124
5.0.2.4. Interpretation of results:
The higher the slump flow (SF) value, the greater is the ability to fill the
formwork under its own weight. A value at least 650 m is required for SCC. There is no
generally accepted advice on what are reasonable tolerances about a specified value,
though ± 50mm, as with the related flow table test might be appropriate.
The T50 time is a secondary indication of flow. A lower time indicates greater
flow ability. The Brite Eu Ram research suggested that a time of 3-7 seconds is
acceptable for civil engineering applications, and 2-5 seconds for housing applications.
In the case of several segregations most coarse aggregate will remain in the
center of the pool of the concrete and mortar and cement paste at the concrete periphery.
In case of minor segregation a border of mortar without coarse aggregate can occur at the
edge of the pool of concrete. If none of these phenomena appear it is no assurance that
segregation will not occur since this is a time related aspect that can occur after a longer
period.
5.0.3. V funnel test: 5.0.3.1. Introduction:
The test was developed in Japan and used by Ozawa et al. the equipment consists
of a V-shaped funnel, shown in figure.5.2
The described V funnel test is used to determine the filling ability (flow ability)
of the concrete with a maximum aggregate size of 20 mm. the funnel is filled with about
12 liter of concrete and the time taken for it to flow through the apparatus measured.
After this the funnel can be refilled concrete and left for 5 minutes to settle. If
the concrete shows segregation then the flow time will increase significantly.
5.0.3.2 . Assessment of test: Though the test is designed to measure flowability, the result is effected by
concrete properties other than flow – the inverted cone shape will cause any liability of
the concrete to block to be reflected in the result – if, for example there is too much
Coarse aggregate. High flow time can also be associated with low deformability due to a
high paste viscosity, and with high inter particle friction.
125

While the apparatus is simple, the effect of the angle of the funnel and the wall effect
on the flow of concrete are not clear.
5.0.3.3 Equipment:
Fig.5.2 showing the apparatus of V-funnel test
1. V – funnel 2. Bucket 12 liter 3. Trowel 4. Scoop 5. Stopwatch
5.0.3.4 . Procedure of flow time:
1. About 12 liter of concrete is needed to perform the test, sampled normally.
2. Set the v-funnel on firm ground
3. Moisten the inside surfaces of the funnel
4. Keep the trap door open to allow any surplus water to drain
5. Close the trap door and place the bucket underneath
6. Fill the concrete completely without compacting or lapping; simply strike off the
concrete level with the top with a trowel.
7. Open the trap door within 10 seconds after filing and allow the concrete to flow
out under gravity.
126
8. Simultaneously, start the stop watch and record the time.
9. Start the stopwatch when the trap door is opened, and record the time for the
discharge to complete (the flow time). This is taken to be when light is seen from
above through the orifice section.
10. The whole test has to be performed within 5 minutes.
5.0.3.5. Procedure for flow time at T 5 minutes:
1. Do not clean or moisten the inside surface of the funnel again.
2. Close the trap door refill the V-funnel immediately after measuring the flow
time.
3. Place a bucket underneath
4. Fill the apparatus completely with concrete without compacting or tapping,
simply strike off the concrete level with the top with the trowel.
5. Open the trap door 5 minutes after the second fill of the funnel and allow the
concrete of flow out under gravity.
6. Simultaneously start the stopwatch when the trap door is opened and record
the time for the discharge to complete (the flow time at T5 minutes). This is
taken to the consideration when light is seen from above through the funnel.
5.0.3.6. Interpretation of results: This test measures the ease of flow of the concrete; shorter flow times indicate
greater flowability. For SCC a flow time of 10 seconds is considered appropriate. The
inverted cone shape restricts flow. And prolonged flow times may give some indication of
the susceptibility of the mix to blocking.
After 5 minutes of setting, segregation of concrete will show a less continuous
flow with an increase in flow time.
127
5.0.4. L –Box test method: 5. 0.4.1. Introduction This test, based on a Japanese design for underwater concrete, has been
described by Peterson. These assess the flow of the concrete, and also the extent to which
it is subject to blocking by reinforcement. The apparatus is shown in figure.5.3
The apparatus consists of a rectangular section box in the shape of an ‘L’, with
a vertical and horizontal section, separated by a movable gate, in front of which vertical
length of reinforcement bar are fitted.
The vertical section is filled with concrete, and then the gate lifted to let the
concrete flow into the horizontal section. When the flow has stopped, the height of the
concrete at the end of the horizontal section is expressed as a proportion of that remaining
in the vertical section (H2/H1 in the diagram). It indicates the slope of the concrete when
at rest.
This is an indication passing ability, or the degree to which the passage of
concrete through the bars is restricted.
The horizontal section of the box can be marked at 200 mm and 400 mm from the
gate and the times taken to reach these points measured. These are known as the T20 and
T40 times and are an indication for the filling ability.
The section of the bar can be of different diameters and spaced at different
intervals in accordance with normal reinforcement considerations, 3 times the maximum
aggregate size might be appropriate.
The bar can be principally set at any spacing to impose a more or less severe test of
the passing ability of the concrete.
5.0.4.2. Assessment of test:
This is a widely used test, suitable for laboratory, and perhaps site use, it assesses
filling and passing ability of SCC. And serious lack of stability (segregation) can detect
visually. Segregation may also be detected by subsequently sawing and inspecting section
of the concrete in the horizontal section.
128

Unfortunately there is no agreement on material, dimensions, or reinforcing bar
arrangement, so it is difficult to compare test results-there is no evidence of what effects
the wall of the apparatus and the consequent ‘wall effect’ might have on concrete flow,
but this arrangement does, to some extent, replicate what happens to concrete on site
when it is confined within formwork.
Two operators are required if times are measured, and a degree of operator error is
inevitable.
5.0.4.3. Equipments:
Fig.5.3. L-Box Apparatus
1. L box of a stiff non absorbing material
2. Trowel
3. Scoop
4. Stopwatch
129

5.0.4.4. Procedure
1. About 14 liter of concrete is needed to perform the test, sampled normally.
2. Set the apparatus level on firm ground, ensure that the sliding gate can open
freely and then close it.
3. Moisten the inside surface of the apparatus, remove any surplus water fill the
vertical section of the apparatus with concrete sample.
4. Leave it to stand for 1 minute.
5. Lift the sliding gate and allow the concrete to flow out into the horizontal
section. Simultaneously, start the stopwatch and record the time taken for the
concrete to reach the 200mm and 400mm marks.
6. When the concrete stops flowing, the distance “H1” and “H2” are measured.
7. Calculate H1/H2, the blocking ratio.
8. The whole test has to be performed within 5 minutes.
5.0.4.5. Interpretation of results:
If the concrete flows as freely as water, at rest it will be horizontal, so H1/H2
=1.Therefore the nearer this test value, the blocking ratio, is to unity, the better the flow
of the concrete. The EU research team suggested a minimum acceptable value of 0.8.
T20 and T40 times can give some indication of ease of flow, but no suitable values have
been generally agrees. Obvious blocking of coarse aggregate behind the reinforcing bars
can be detected visually.
5.1. Case Studies Overseas:
Here some of the applications of SCC around the World are described. 5.1.1. Shark and Pengium Aquariums at the Oceanopole Marine Park in
Brest. 5.1.1.1 Main project description: An extension of marine park ocean polis near Brest of Brittany, building of two
giant aquariums with very large openings on the fair-faced concrete walls.
130
5.1.1.2. Why SCC was used: Very dense net work of reinforcing bars. Better placing of concrete was desired.
Surface with very regular aspect and colour were required. No segregation at the bottom
of the walls.
5.1.1.3 Project requirements:
Concrete with high flow characteristics to completely fill the formwork,
especially around the large formworks.
5.1.2. Basement for Research and Development building in Tokyo, Japan.
5.1.2.1. Main project description: Erection of new R & D building in Tokyo, Japan. For the complex basement new
concrete technology were necessary.
5.1.2.2. Why SCC was used: HSC was required for this structure to improve the earthquake resistance for the
construction and complex design with extreme reinforcement easy pumping and placing
was required.
5.1.3. Pipe screen for a Tail Tunnel at the Meinrad Leinert Square, Zurich,
Switzerland.
5.1.3.1. Main project requirements: A pipe screen had to be installed to give additional support to the very thin ground
cover over the new rail tunnel at the Meinard Lienert Square in the center of Zurich. Ten
concrete pipes of 1.55m diameter (was thickness 150mm) were pipe jacketed 138 to 150
meters in to the soil from as access trench to form the pipe screen in advance of tunnel
boring. The soil from inside the pipes was removed and the soil around the pipes injected
to consolidate it. Reinforcing steel cages were into the pipes and they were concreted
section by section with SCC.
131

5.1.3.2. Why SCC was used:
The decision was made to use the SCC, because the concrete had to be pumped at
least 50m then placed with no possibility of additional vibration, ensuring that complete
pipe was filed without segregation and bleeding. Constant watertight quality had to be
maintained.
5.1.4. Modular hotel room units by old castle Precast Rehoboth, MA (USA):
5.1.4.1. Main project description:
The project concerned of modular building system incorporating a 5cm insulator
layer sandwiched between a 3.75 cm structural concrete layer separated by fiber connect
rods.
5.1.4.2. Why SCC was used:
The design configuration made it very difficult to pour standard super plasticizer
concrete, even a wet mix with a lot of vibration resulted in a lot of poorly compacted
concrete.
SCC has already been successfully applied in large number of bridge projects. A
bridge in Texas (Loetta bridge) has utilized ‘U’ – shaped HPC deck girders. The concrete
was poured from the top on web; allow traveling down the web, soffit and travel up to the
second web till the concrete reaches the top. No vibrators were used.
5.1.5. Case study in land:
SCC was first recently used, for the first time in India, at Kaiga nuclear power
plant project for connecting the heavily reinforced columns.
132
5.2. Requirements of Self-Compacting Concrete:
5.2.1. Application area:
SCC may be used in pre-cast applications or for concrete placed on site. It can be
manufactured in a site batching plant or in a ready mix concrete plant and delivered to site
by truck. It can then be placed either by pumping or pouring into horizontal or vertical
structures. In designing the mix, the size and the form of the structure, the dimension and
density of reinforcement and cover should be taken in consideration. These aspects will
all influence the specific requirements for the SCC. Due to the following characteristics
of SCC it may be difficult to cast to a fall unless contained in a form. SCC has made it
possible to cast concrete structures of a quality that was not possible with the existing
concrete technology.
5.2.2. Requirements:
Self-compacted concrete is defined as a category of high performance concrete that
has excellent deformability in the fresh state and high resistance to segregation and can be
placed and compacted under its self weight without applying vibration.
SCC can be designed to fulfill the requirements of EN 206 regarding density,
strength development, final strength and durability. Due to the high content of powder,
SCC may show more plastic shrinkage or creep than ordinary concrete mixes. These
aspects should therefore be considered during designing and specifying SCC. Special care
should also be taken to begin curing the concrete as early as possible. The workability of
SCC is higher than the highest class of consistence described within EN 206 and can be
characterized by the following properties:
5.2.2.1. Filling Ability: The property of self-compacted concrete to fill all corners of a formwork under its
own weight is known as filling ability. Slump flow test is used to assess this
characteristic.
133
5.2.2.2. Passing Ability: Ability to overcome obstacles under its own weight without hindrance. Obstacles
are e.g. reinforcement and small openings etc. L-Box test and U-Box test will assess this
characteristic.
5.2.2.3. Resistance to Segregation: The property of self-compacted concrete to flow without segregation of the
aggregates i.e. to remain homogenous in composition during transporting and placing. V-
funnel test for T5 is used to assess this characteristic.
To meet the concrete requirements, three types of SCC are available:
1. The powder type SCC is characterized by the large amounts of powder (all
material < 0.15 mm), which is usually in the range of 56.06 to 66.26 N/m3. This
provides the plastic viscosity and hence the segregation resistance. The yield point
is determined by the addition of superplasticizer.
2. In the viscosity type SCC the powder content is lower (35.68 to 45.87 N/m3). A
VMA and the yield point mainly control the segregation resistance by the addition
of superplasticizer.
3. In the combination type of SCC the powder content is between 45.87 to 55.06
N/m3
but in addition the rheology is also controlled by a VMA as well as an
appropriate dosage of the superplasticizer.
A concrete mix can only be classified as Self-compacting Concrete if the
requirements for all three characteristics are fulfilled.
Many different test methods have been developed in attempts to characterize the
properties of SCC.So far no single method or combination of methods has achieved
universal approval and most of them have their adherents. Similarly no single method has
been found which characterizes all the relevant workability aspects so each mix design
should be tested by more than one test method
134
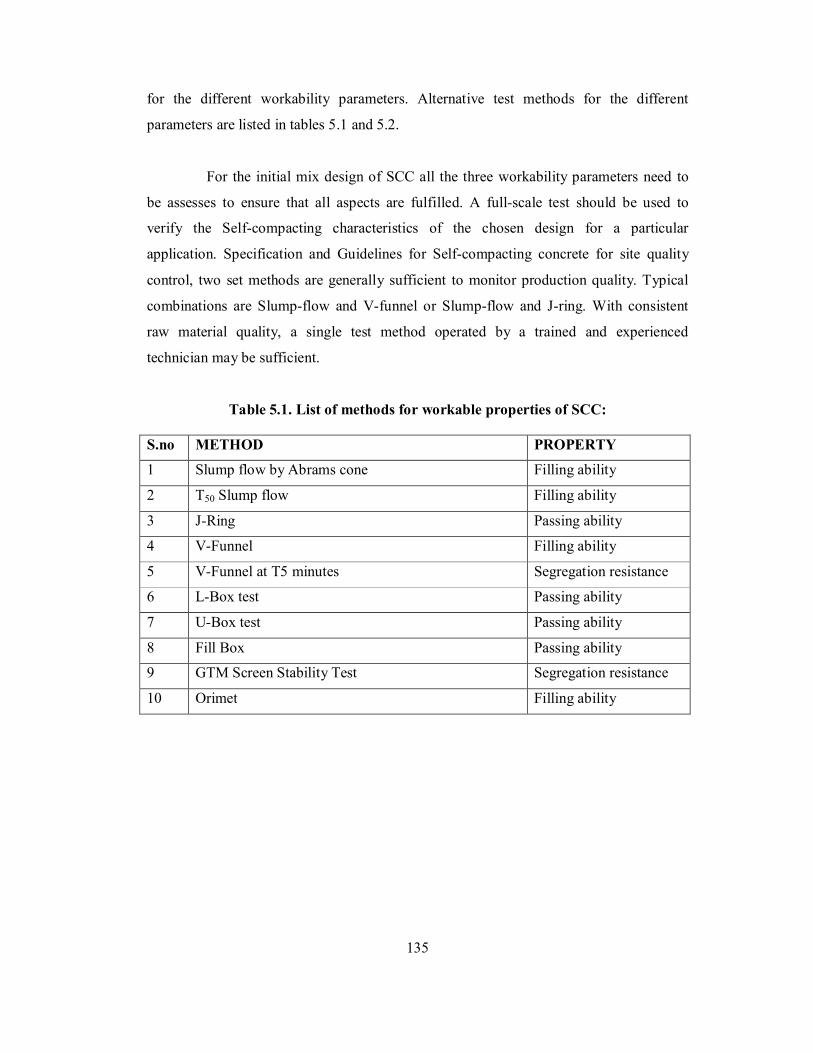
for the different workability parameters. Alternative test methods for the different
parameters are listed in tables 5.1 and 5.2.
For the initial mix design of SCC all the three workability parameters need to
be assesses to ensure that all aspects are fulfilled. A full-scale test should be used to
verify the Self-compacting characteristics of the chosen design for a particular
application. Specification and Guidelines for Self-compacting concrete for site quality
control, two set methods are generally sufficient to monitor production quality. Typical
combinations are Slump-flow and V-funnel or Slump-flow and J-ring. With consistent
raw material quality, a single test method operated by a trained and experienced
technician may be sufficient.
Table 5.1. List of methods for workable properties of SCC: S.no METHOD PROPERTY 1 Slump flow by Abrams cone Filling ability
2 T50 Slump flow Filling ability
3 J-Ring Passing ability
4 V-Funnel Filling ability
5 V-Funnel at T5 minutes Segregation resistance
6 L-Box test Passing ability
7 U-Box test Passing ability
8 Fill Box Passing ability
9 GTM Screen Stability Test Segregation resistance
10 Orimet Filling ability
135
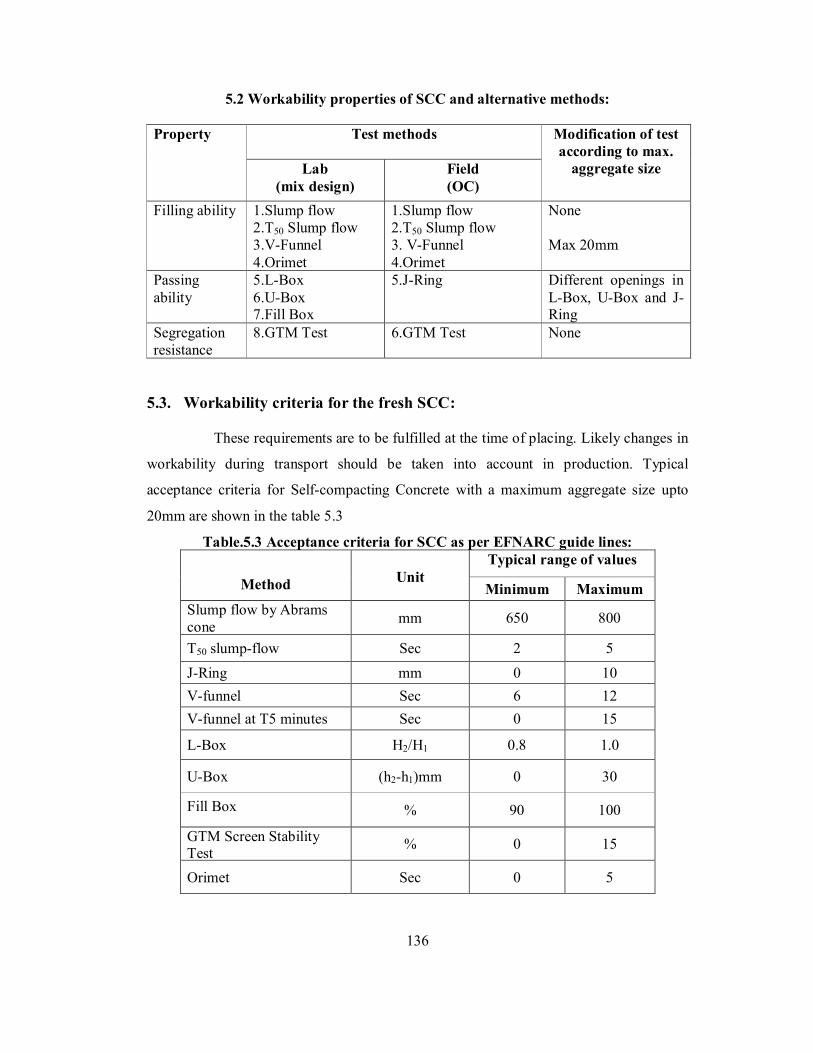
5.2 Workability properties of SCC and alternative methods:
Test methods Property
Lab (mix design)
Field (OC)
Modification of test according to max.
aggregate size
Filling ability 1.Slump flow 2.T50 Slump flow 3.V-Funnel 4.Orimet
1.Slump flow 2.T50 Slump flow 3. V-Funnel 4.Orimet
None Max 20mm
Passing ability
5.L-Box 6.U-Box 7.Fill Box
5.J-Ring Different openings in L-Box, U-Box and J-Ring
Segregation resistance
8.GTM Test 6.GTM Test None
5.3. Workability criteria for the fresh SCC: These requirements are to be fulfilled at the time of placing. Likely changes in
workability during transport should be taken into account in production. Typical
acceptance criteria for Self-compacting Concrete with a maximum aggregate size upto
20mm are shown in the table 5.3
Table.5.3 Acceptance criteria for SCC as per EFNARC guide lines: Typical range of values
Method
Unit Minimum Maximum
Slump flow by Abrams cone mm 650 800
T50 slump-flow Sec 2 5 J-Ring mm 0 10 V-funnel Sec 6 12 V-funnel at T5 minutes Sec 0 15
L-Box H2/H1 0.8 1.0
U-Box (h2-h1)mm 0 30
Fill Box % 90 100
GTM Screen Stability Test % 0 15
Orimet Sec 0 5
136
These typical requirements shown against each test method are based on current
knowledge and practice. However future developments may lead to different
requirements being adopted. Values outside these ranges may be acceptable if the
producer can demonstrate satisfactory performance in the specific conditions,e.g.,large
spaces between reinforcement, layer thickness less than 500mm,short distance of flow
from point of discharge, very few obstructions to pass in the form work,etc. Special care
should always be taken to ensure no segregation of the mix is likely as, at present, there is
not a simple and reliable test that gives information about segregation resistance of SCC
in all practical situations.
5.4. Complexities Involved In Making SCC:
Normal strength concrete itself is a complex material. High strength concrete with
lower water/binder ratio adds to the complexity. Making SCC particularly of high
strength adds further to the complexity.
Generally SCC is used in situations where high strength say over 40 Mpa to
100Mpa or more is required. In order to produce such a high strength concrete, it is
required to lower the water/binder ratio. Use of binder material will reduce the
workability to an unacceptable level for self-compacting requirements. To restore this
workability or even to increase the workability, a high dosage of Super plasticizer is
added. Two major problems arise in that case. Firstly, all the super plasticizers available
in the market are not suitable at high dosage. Therefore care should be taken in not
causing any adverse side effect such as excessive retardation. And also slump should
retain for longer time. The super plasticizers based on Naphthalene or Melamine is
generally not suitable for Self Compacting Concrete requiring very high strength
concrete.
Initial trial for finding the compatibility between Super plasticizer and cement,at
very low water-binder ratio is also required to be ascertained.
In case if large binder paste volume is used in order to obtain high strength and
self-compacting properties, there arises a problem that it would lead to higher heat of
hydration, greater shrinkage and Creep.
137
EFNARC specification and Guidelines recommend the paste volume to be more
than 40% of the volume of the mix. But the other authorities have recommended that the
paste volume not to be more than 35% for concrete to be considered as high performing.
This results in further complexities. Though the higher paste volume may result in higher
shrinkage and creep in SCC the mechanical properties such as strength, elastic modulus,
creep and shrinkage of SCC and Conventional Concrete did not show significant
difference, when the strength was kept constant.
5.5. Limitations of SCC:
1. Apparent lack of reliable test standard that can qualify the physical properties of
SCC.
2. Higher material cost not only for admixtures but also for increased quality control
testing needed for concrete and aggregate.
3. Mixing time and finishing times will likely be longer.
4. Because of SCC high fluidity, grout leakage could be the problem in forms that do
not completely seal.
Since SCC is inherently self-leveling form that is not level could conceivably
cause problems.
5.6. Advantages of SCC:
1. Industrialized production of concrete.
2. Significant reduction in the cost of cast in situ concrete construction by
eliminating compaction needed during the concreting, labour and equipment wear
and tear cost related to compaction.
3. Reduction in the construction time by accelerating the construction process.
4. Promote the development of more rational concreting production.
5. Improve the quality, durability and reliability of concrete structures.
6. Improve the working environment at construction sites by reducing noise
pollution
7. Easily placed in thin walled elements with limited access.
8. ‘White fingure syndrome’ a serious injury from vibration equipment is prevented
138
9. SCC can be placed at a faster rate with no mechanical vibration and less
screenings, resulting in savings in placement costs.
10. Improved and more uniform architectural surface finish with little to no remedial
surface work.
11. Ease of filling restricted sections and hard-to-reach areas. Opportunities to create
structural and architectural shapes and surface finishes not achievable with
conventional concrete.
12. Improved consolidation around reinforcement and bond with reinforcement.
13. Improved pumpability.
14. Improved uniformity of in-place concrete by eliminating variable operator-related
effort of consolidation.
15. Labor savings.
16. Shorter construction periods and resulting cost savings.
17. Reduction or elimination of vibrator noise, potentially increasing construction a
hours in urban areas.
18. Minimizes movement of ready mixed trucks and pumps during placement.
19. Increased jobsite safety by eliminating the need for consolidation.
5.6.1. Some Architectural Advantages of SCC Include:
1. Improved constructability
2. Virtually flawless finish
3. Homogenous and uniform concrete
4. Better reinforcement bonding
5. Flows easily into complex shapes and through congested reinforcement
6. Superior strength and durability
7. Allows for innovative architectural Features.
139
5.7. Economic Impact of Self-Compacting Concrete in Precast
The economic impact of SCC in precast / prestress applications can be assessed in
three categories: concrete mixture proportions and raw materials, production costs, and
finished product improvements.
Due to the larger quantities of Portland cement or supplementary cementitious
materials used in SCC, the cost of the raw materials is usually greater. Cementitious
material may be required more to increase the fines content to achieve stability that is
needed on the basis of strength alone. In addition to cement, the cost of admixtures, such
as HRWR and possibly a Viscosity Modified Admixture (VMA), will also increase the
cost of SCC. Many precast concrete producers have switched from more angular coarse
aggregates to more rounded aggregates. Typically, precast concrete producers will pay an
additional 8-12% on average for raw materials in a SCC mixture relative to the raw
materials cost of traditional concrete mixtures.
Chemical admixtures can increase the cost of the SCC mixture, but are necessary
to achieve the desired concrete properties. Such is the case with VMA’s, which are added
to improve the stability and help prevent segregation during placement. The extra cost
would be around 2% of the cost of the mixture, but can yield savings by minimizing the
need to increase the cement content in the SCC mixture, allow a broader variety of
aggregates to be used and minimize the impact of moisture content in the aggregates.
The SCC mixture cost can also be reduced by the use of pozzolanic materials such
as fly ash, which is typically one-third to one-half the cost of cement. Fly ash can also
help improve the flowability and stability of the SCC mixture.
The extra cost of the SCC mixture is compensated by production cost efficiencies
such as reduction in placing time, vibrator use and maintenance, form maintenance, and
improvement worker safety. Placing time is the time it takes to transfer the concrete from
the transportation unit to the form and consolidate it. Improved productivity by reducing
time, labor or equipment may easily compensate for additional material costs.
140

A case study for tracking the time required for placing double-tee beds in a precast
plant reported a reduction of 20% compared to a conventional mixture, with a 32%
reduction of labor involved in the process . Regardless of the applications, an average
reduction in labor during the placing process is estimated to be about 30% using SCC.
The service life of vibration equipment and forms will increase with the use of
SCC. A reduction in vibration operations will not only reduce maintenance and
investment cost, but also improves the operating conditions at the plant by reducing noise
levels. Reducing the exposure of workers and eliminating requirements for hearing
protection may reduce insurance and safety costs. Due to the elimination of vibration to
consolidate the mixtures, the forms use in the precast operations will receive less wear
and tear, decreasing the regular maintenance costs and the costs of investing in new
forms.
Patching operations and finished product improvements may be critical for certain
precast concrete producers, especially for architectural panels. Properly proportioned
SCC has been proven to reduce the number of “bug holes,” honeycombing and other
surface imperfection on the finished concrete surface and others however, have noted that
poorly proportioned SCC can result in-significant segregation and very poor surface
finish.
Bug holes are small imperfections located on the surface created by air trapped
between the form and the concrete. Effective vibration can minimize the amount of bug
holes, but never eliminate them entirely. Bug holes are also affected by admixtures and
release agents. With a properly proportioned SCC mixture, the concrete can freely fill all
the spaces of the form under its own weight minimizing or even eliminate the trapped air.
A key economic factor for using SCC in prestressed girders is the finishing of the
product. Several state transportation agencies, such as NCDOT, require all the products to
have a smooth finish with minimal bug holes for both sides of the girders.
If the quantity and size of bug holes can be minimized, the amount of work and
cost related to finishing the girders will be significantly reduced. Finishing and retouching
of the girders can represent a significant part of labor costs in the precast concrete
operations
141
Honeycombing is an imperfection caused by insufficient or inadequate vibration.
Although the occurrence of honeycombing is relatively low in a well-controlled precast
plant, it also represents an increase in the cost due to retouching and finishing.
Honeycombing can be reduced with a properly proportioned SCC mixture. The use of
SCC can reduce patching expenses and manpower needed for patching finished precast
elements. In many examples of structural, architectural, and utility products, producers in
the United States have reported a decreased patching labor cost from 25-75%.
5.7.1. Applications:
1. Architectural Concrete
2. Columns
3. Residential structures
4. Beams
5. Civil Projects
6. Tanks
7. Pumped Concrete
8. Footers
The cost of the materials required for SCC is about 10-15% higher. By taking into
consideration that the cost of compaction, finishing etc, the overall cost when compared
to Conventional Concrete is low.
5.8. Performance:
SCC gives architects more design flexibility. SCC's unique characteristics give
architects much more flexibility for vertical and horizontal applications. SCC's
flowability allows for more complex and aesthetic concrete design features. Unlimited
opportunities exist with innovative options for color and texture of exposed surfaces.
Perhaps most importantly, SCC produces exposed surfaces that are virtually defect free,
allowing concrete's beauty to shine.
142
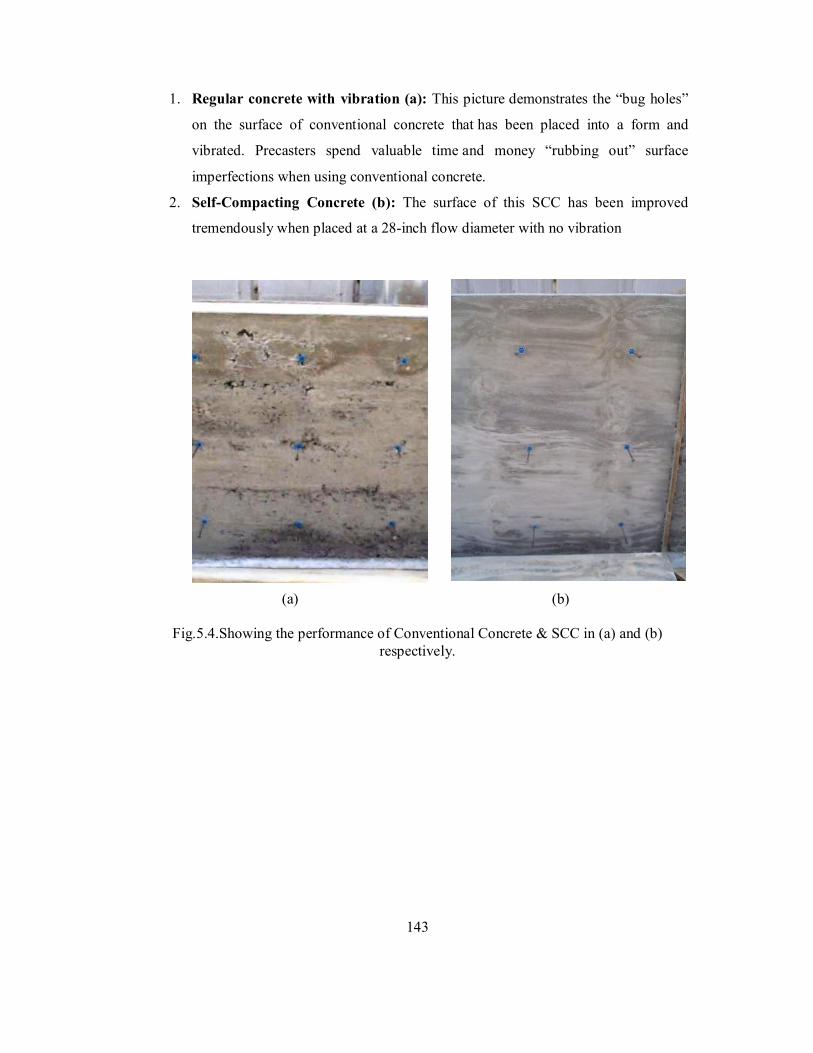
1. Regular concrete with vibration (a): This picture demonstrates the “bug holes”
on the surface of conventional concrete that has been placed into a form and
vibrated. Precasters spend valuable time and money “rubbing out” surface
imperfections when using conventional concrete.
2. Self-Compacting Concrete (b): The surface of this SCC has been improved
tremendously when placed at a 28-inch flow diameter with no vibration
(a) (b)
Fig.5.4.Showing the performance of Conventional Concrete & SCC in (a) and (b) respectively.
143

CHAPTER 6
Experimental Procedures
CHAPTER 6 Experimental Procedures
6.0. General
The development of Self-Compacting Concrete (SCC) marks an important
milestone in improving the product quality and efficiency of the building industry. SCC
improves the efficiency at the construction sites, enhances the working conditions and the
quality and appearance of concrete. Use of glass fibers in SCC bridge the cracks and
enhance the performance of concrete by not only avoiding the propagation of cracks but
also contribute to increased energy absorption compared with plain concrete. Glass Fiber
Reinforced Self- Compacting Concrete (GFRSCC) combines the benefits of SCC in the
fresh state and shows an improved performance in the hardened state compared with
conventional vibrated concrete. In the present work, the stress-strain curve for GFRSCC
has been suggested and an analytical stress-strain model was developed based on the
experimental results.
6.1. Introduction Self Compacting Concrete (SCC) facilitates and ensures proper filling and
good structural performance in restricted areas and heavily reinforced structural
members. Developed by Professor Hajime Okamura in Japan during the 1980s, it has
gained wide acceptance in today’s concrete works. SCC can be considered as an
engineered composite material, tailor made to achieve performance related properties to
suit specific applications. The mechanical properties of the brittle SCC under axial
loading may be improved by introducing randomly oriented short discrete fibers, which
prevent or control initiation and propagation or coalescence of cracks. Glass Fiber
Reinforced Self Compacting Concrete (GFRSCC) is one such composite, developed with
an idea of modifying the other wise inferior properties of Self Compacting Concrete
(SCC) alone. The properties of fibers that are usually of interest are fiber concentration,
fiber geometry, fiber orientation and fiber distribution. Glass fibers have very good
applications in changing the behavior of the material by bridging of fibers across the
cracks. In other words, ductility is provided with fiber reinforced cementitious
1 4 4
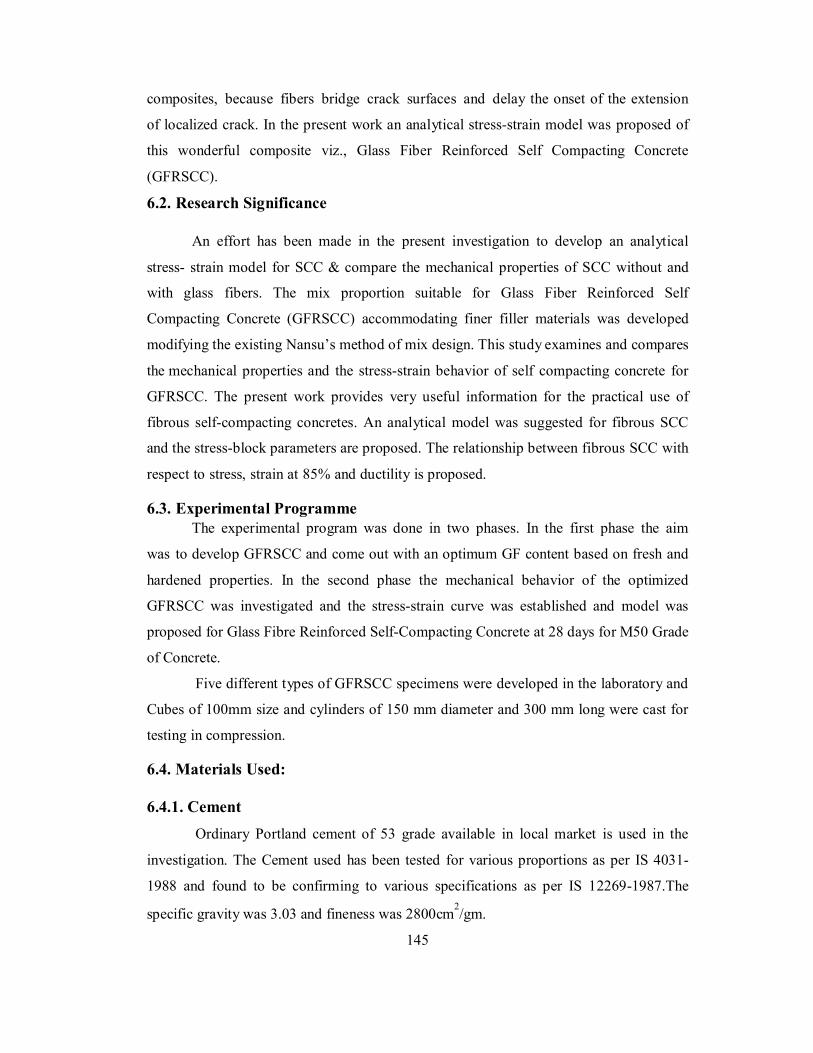
composites, because fibers bridge crack surfaces and delay the onset of the extension
of localized crack. In the present work an analytical stress-strain model was proposed of
this wonderful composite viz., Glass Fiber Reinforced Self Compacting Concrete
(GFRSCC).
6.2. Research Significance
An effort has been made in the present investigation to develop an analytical
stress- strain model for SCC & compare the mechanical properties of SCC without and
with glass fibers. The mix proportion suitable for Glass Fiber Reinforced Self
Compacting Concrete (GFRSCC) accommodating finer filler materials was developed
modifying the existing Nansu’s method of mix design. This study examines and compares
the mechanical properties and the stress-strain behavior of self compacting concrete for
GFRSCC. The present work provides very useful information for the practical use of
fibrous self-compacting concretes. An analytical model was suggested for fibrous SCC
and the stress-block parameters are proposed. The relationship between fibrous SCC with
respect to stress, strain at 85% and ductility is proposed.
6.3. Experimental Programme The experimental program was done in two phases. In the first phase the aim
was to develop GFRSCC and come out with an optimum GF content based on fresh and
hardened properties. In the second phase the mechanical behavior of the optimized
GFRSCC was investigated and the stress-strain curve was established and model was
proposed for Glass Fibre Reinforced Self-Compacting Concrete at 28 days for M50 Grade
of Concrete.
Five different types of GFRSCC specimens were developed in the laboratory and
Cubes of 100mm size and cylinders of 150 mm diameter and 300 mm long were cast for
testing in compression.
6.4. Materials Used: 6.4.1. Cement
Ordinary Portland cement of 53 grade available in local market is used in the
investigation. The Cement used has been tested for various proportions as per IS 4031-
1988 and found to be confirming to various specifications as per IS 12269-1987.The
specific gravity was 3.03 and fineness was 2800cm2/gm.
145
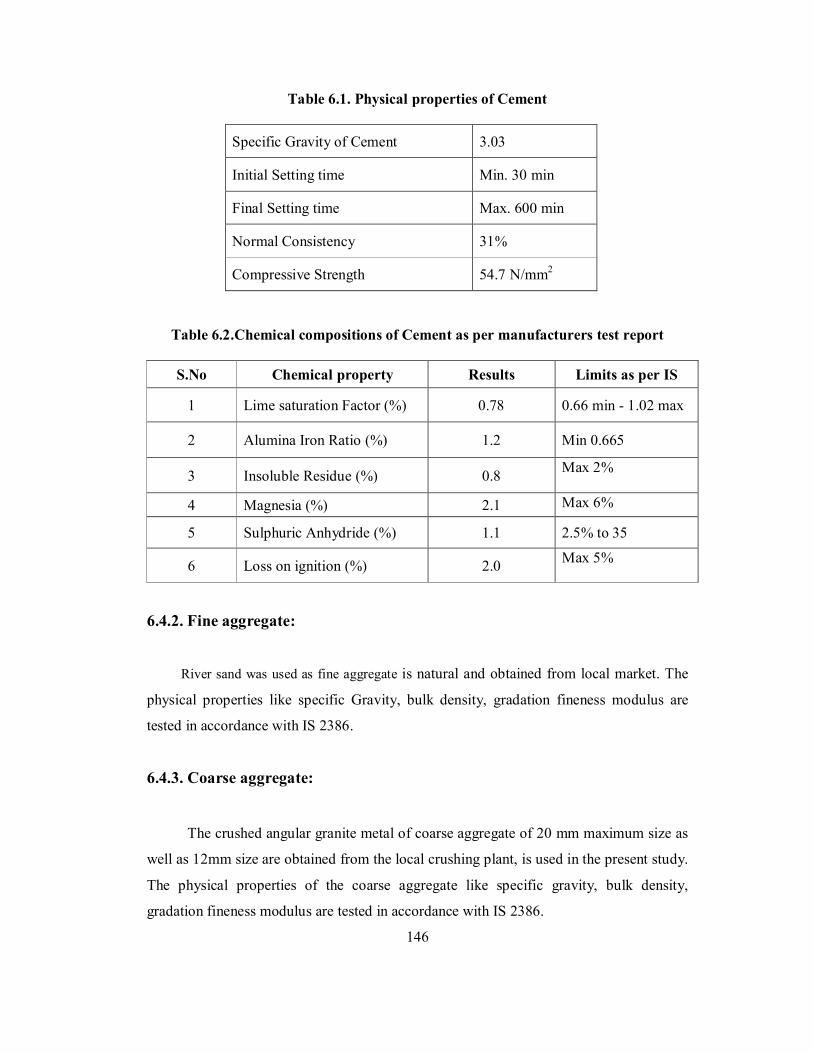
Table 6.1. Physical properties of Cement
Specific Gravity of Cement 3.03
Initial Setting time Min. 30 min
Final Setting time Max. 600 min
Normal Consistency 31%
Compressive Strength 54.7 N/mm2
Table 6.2.Chemical compositions of Cement as per manufacturers test report
S.No Chemical property Results Limits as per IS
1 Lime saturation Factor (%) 0.78 0.66 min - 1.02 max
2 Alumina Iron Ratio (%) 1.2 Min 0.665
3 Insoluble Residue (%) 0.8 Max 2%
4 Magnesia (%) 2.1 Max 6%
5 Sulphuric Anhydride (%) 1.1 2.5% to 35
6 Loss on ignition (%) 2.0 Max 5%
6.4.2. Fine aggregate:
River sand was used as fine aggregate is natural and obtained from local market. The
physical properties like specific Gravity, bulk density, gradation fineness modulus are
tested in accordance with IS 2386.
6.4.3. Coarse aggregate:
The crushed angular granite metal of coarse aggregate of 20 mm maximum size as
well as 12mm size are obtained from the local crushing plant, is used in the present study.
The physical properties of the coarse aggregate like specific gravity, bulk density,
gradation fineness modulus are tested in accordance with IS 2386.
146
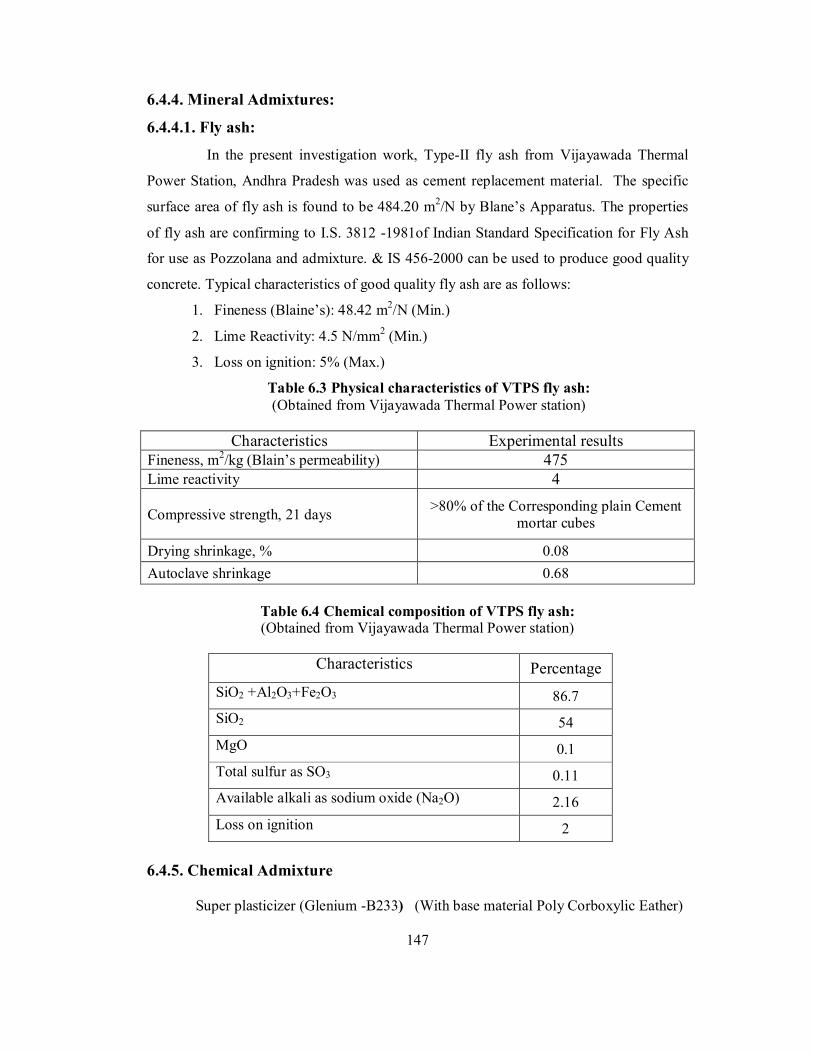
6.4.4. Mineral Admixtures:
6.4.4.1. Fly ash:
In the present investigation work, Type-II fly ash from Vijayawada Thermal
Power Station, Andhra Pradesh was used as cement replacement material. The specific
surface area of fly ash is found to be 484.20 m2/N by Blane’s Apparatus. The properties
of fly ash are confirming to I.S. 3812 -1981of Indian Standard Specification for Fly Ash
for use as Pozzolana and admixture. & IS 456-2000 can be used to produce good quality
concrete. Typical characteristics of good quality fly ash are as follows:
1. Fineness (Blaine’s): 48.42 m2/N (Min.)
2. Lime Reactivity: 4.5 N/mm2 (Min.)
3. Loss on ignition: 5% (Max.)
Table 6.3 Physical characteristics of VTPS fly ash: (Obtained from Vijayawada Thermal Power station)
Characteristics Experimental results
Fineness, m2/kg (Blain’s permeability) 475 Lime reactivity 4
Compressive strength, 21 days >80% of the Corresponding plain Cement mortar cubes
Drying shrinkage, % 0.08 Autoclave shrinkage 0.68
Table 6.4 Chemical composition of VTPS fly ash: (Obtained from Vijayawada Thermal Power station)
Characteristics Percentage
SiO2 +Al2O3+Fe2O3 86.7 SiO2 54 MgO 0.1 Total sulfur as SO3 0.11 Available alkali as sodium oxide (Na2O) 2.16 Loss on ignition 2
6.4.5. Chemical Admixture
Super plasticizer (Glenium -B233) (With base material Poly Corboxylic Eather)
147
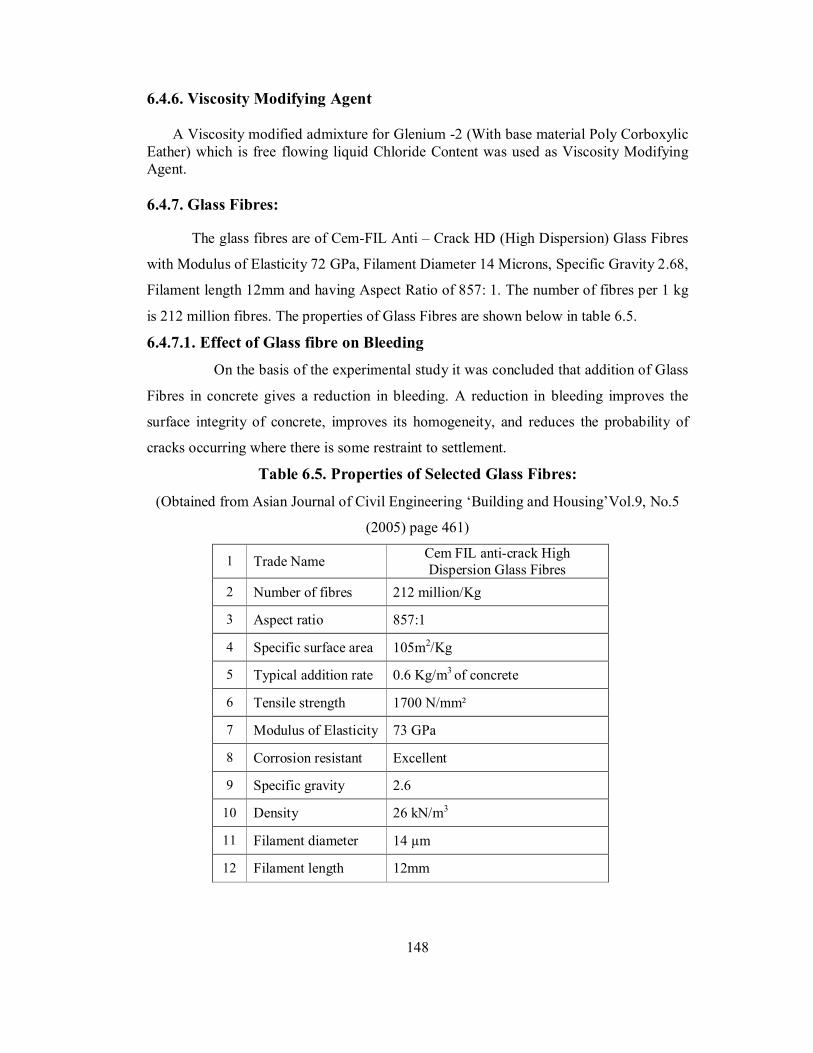
6.4.6. Viscosity Modifying Agent A Viscosity modified admixture for Glenium -2 (With base material Poly Corboxylic Eather) which is free flowing liquid Chloride Content was used as Viscosity Modifying Agent. 6.4.7. Glass Fibres:
The glass fibres are of Cem-FIL Anti – Crack HD (High Dispersion) Glass Fibres
with Modulus of Elasticity 72 GPa, Filament Diameter 14 Microns, Specific Gravity 2.68,
Filament length 12mm and having Aspect Ratio of 857: 1. The number of fibres per 1 kg
is 212 million fibres. The properties of Glass Fibres are shown below in table 6.5.
6.4.7.1. Effect of Glass fibre on Bleeding On the basis of the experimental study it was concluded that addition of Glass
Fibres in concrete gives a reduction in bleeding. A reduction in bleeding improves the
surface integrity of concrete, improves its homogeneity, and reduces the probability of
cracks occurring where there is some restraint to settlement.
Table 6.5. Properties of Selected Glass Fibres:
(Obtained from Asian Journal of Civil Engineering ‘Building and Housing’Vol.9, No.5
(2005) page 461)
1 Trade Name Cem FIL anti-crack High Dispersion Glass Fibres
2 Number of fibres 212 million/Kg
3 Aspect ratio 857:1
4 Specific surface area 105m2/Kg
5 Typical addition rate 0.6 Kg/m3 of concrete
6 Tensile strength 1700 N/mm²
7 Modulus of Elasticity 73 GPa
8 Corrosion resistant Excellent
9 Specific gravity 2.6
10 Density 26 kN/m3
11 Filament diameter 14 µm
12 Filament length 12mm
148
6.4.8. Water: Confirming to IS 456-2000. 6.5. Mix Proportion: M50 grade SCC mix was designed based on Indian Standard Recommended Method of
Concrete Mix Design (IS 10262-1982), and was further modified by fine tuning the relative
proportions of fine and coarse aggregate, filler material like fly ash, glass fiber along with
super plasticizers and viscosity modifying agents.
6.5.1. Trail Mixes:
Aim is to arrive the Mix Proportion for M50 Grade Self Compacting Concrete
Hence Mix I to Mix IV in the Trail Mixes for evaluating the Self Compatibility of
Concrete .
In Mix I, all the materials quantities used which are obtained to BIS Method of
Mix designing without any modifications. During Mix Proportions, it is found that the
water Content is not sufficient to produce SCC. Therefore it is failed in V- Funnel T5 Test
and this Mix is not fit for SCC.
In Mix II, the water content incremented to Increase the flow ability of concrete
Mix, According to this changing powder content is increased in the Mix Design and
considering the Dosage of Super Plasticizer of 80 to 90 % of cementatious material..
Here it is observed that the Mix passed and the values are within allowable limits but in V
Funnel T5 Test, Segregation occurred and the Mix is not fit for SCC.
In Mix III , the material quantities are same as used in the above Mix, but the
quantity of super plasticizer is decreased and VMA dosage is slightly increased
accordingly resulting in the blocking g of coarse aggregate due to rapid settlement of
coarse aggregate. Hence in the Mix III the segregation of concrete showed a less
contentious flow so this Mix is not fit for SCC.
In Mix IV, the material quantities are same as used in the above Mix including the
quantity of super plasticizer, only reducing the dosage of VMA is changed. Here the Mix
passed and the values are within limits. Thus the Mix is considered as the final Mix.
149
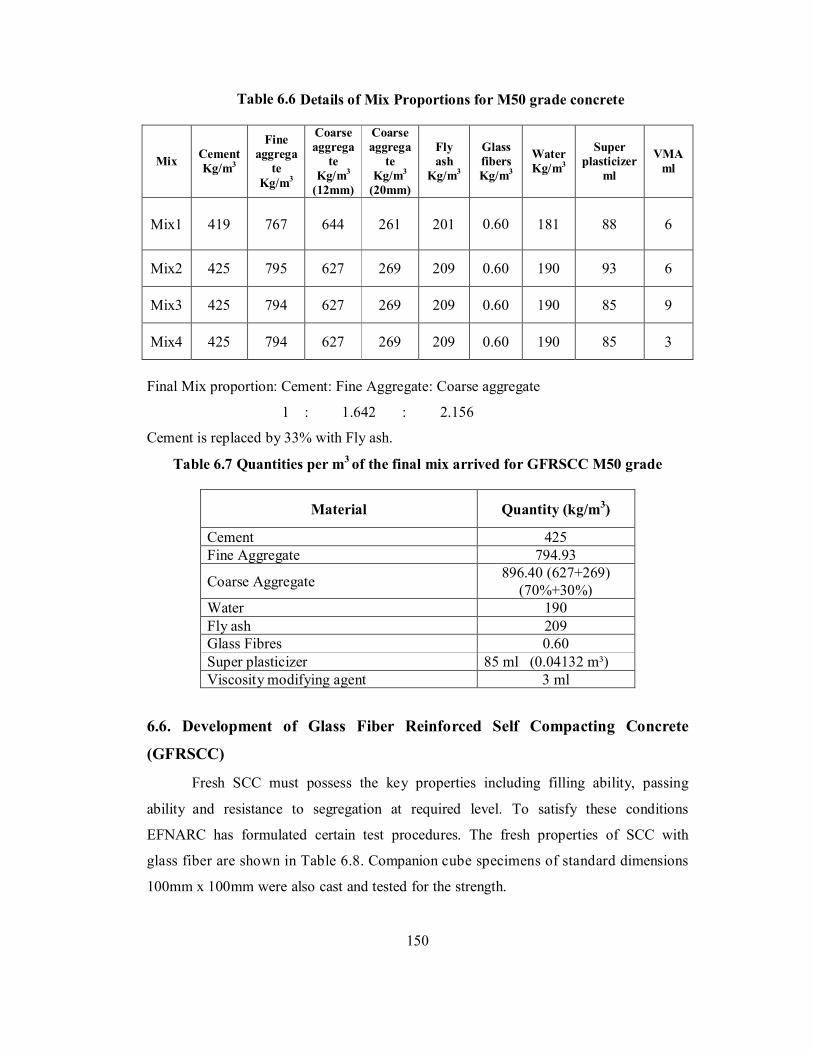
Table 6.6 Details of Mix Proportions for M50 grade concrete
Mix Cement Kg/m3
Fine aggrega
te Kg/m3
Coarse aggrega
te Kg/m3
(12mm)
Coarse aggrega
te Kg/m3
(20mm)
Fly ash
Kg/m3
Glass fibers Kg/m3
Water Kg/m3
Super plasticizer
ml
VMA ml
Mix1 419 767 644 261 201
0.60
181 88 6
Mix2 425 795 627 269 209 0.60 190 93 6
Mix3 425 794 627 269 209 0.60 190 85 9
Mix4 425 794 627 269 209 0.60 190 85 3
Final Mix proportion: Cement: Fine Aggregate: Coarse aggregate
1 : 1.642 : 2.156
Cement is replaced by 33% with Fly ash.
Table 6.7 Quantities per m3 of the final mix arrived for GFRSCC M50 grade
Material Quantity (kg/m3)
Cement 425 Fine Aggregate 794.93
Coarse Aggregate 896.40 (627+269) (70%+30%)
Water 190 Fly ash 209 Glass Fibres 0.60 Super plasticizer 85 ml (0.04132 m³) Viscosity modifying agent 3 ml
6.6. Development of Glass Fiber Reinforced Self Compacting Concrete
(GFRSCC)
Fresh SCC must possess the key properties including filling ability, passing
ability and resistance to segregation at required level. To satisfy these conditions
EFNARC has formulated certain test procedures. The fresh properties of SCC with
glass fiber are shown in Table 6.8. Companion cube specimens of standard dimensions
100mm x 100mm were also cast and tested for the strength.
150
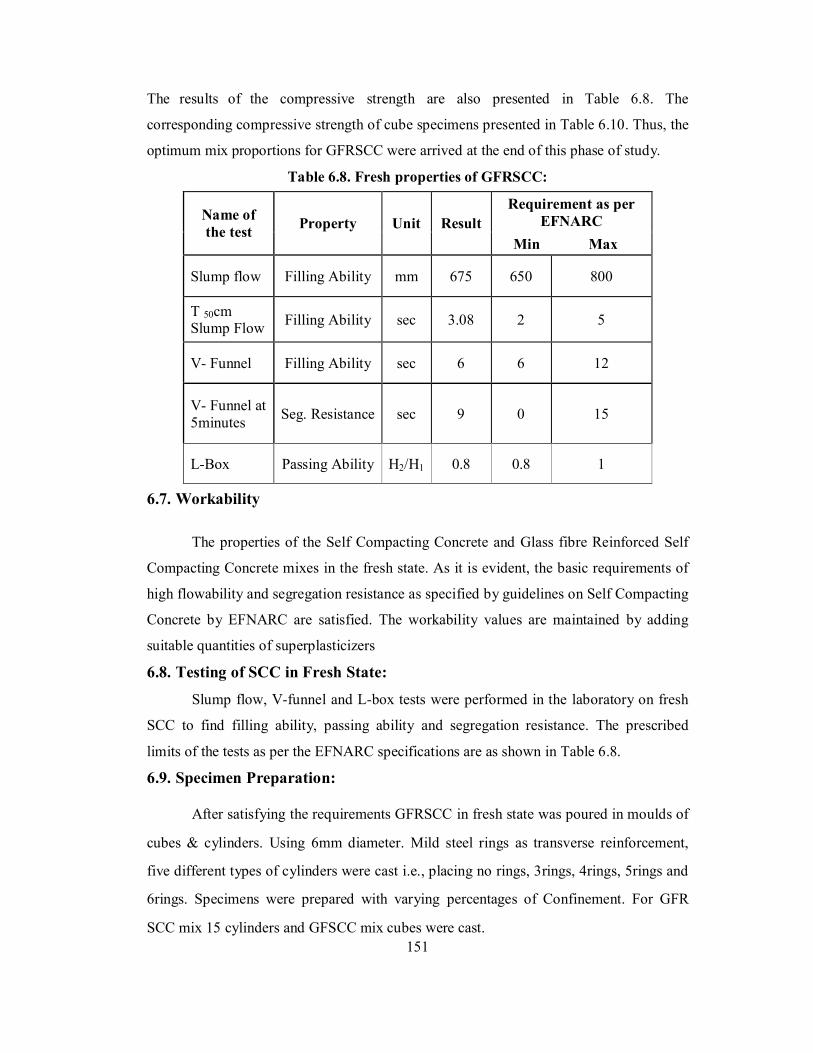
The results of the compressive strength are also presented in Table 6.8. The
corresponding compressive strength of cube specimens presented in Table 6.10. Thus, the
optimum mix proportions for GFRSCC were arrived at the end of this phase of study.
Table 6.8. Fresh properties of GFRSCC:
6.7. Workability
The properties of the Self Compacting Concrete and Glass fibre Reinforced Self
Compacting Concrete mixes in the fresh state. As it is evident, the basic requirements of
high flowability and segregation resistance as specified by guidelines on Self Compacting
Concrete by EFNARC are satisfied. The workability values are maintained by adding
suitable quantities of superplasticizers
6.8. Testing of SCC in Fresh State:
Slump flow, V-funnel and L-box tests were performed in the laboratory on fresh
SCC to find filling ability, passing ability and segregation resistance. The prescribed
limits of the tests as per the EFNARC specifications are as shown in Table 6.8.
6.9. Specimen Preparation:
After satisfying the requirements GFRSCC in fresh state was poured in moulds of
cubes & cylinders. Using 6mm diameter. Mild steel rings as transverse reinforcement,
five different types of cylinders were cast i.e., placing no rings, 3rings, 4rings, 5rings and
6rings. Specimens were prepared with varying percentages of Confinement. For GFR
SCC mix 15 cylinders and GFSCC mix cubes were cast. 151
Requirement as per EFNARC Name of
the test Property Unit Result Min Max
Slump flow Filling Ability mm 675 650 800
T 50cm Slump Flow Filling Ability sec 3.08 2 5
V- Funnel Filling Ability sec 6 6 12
V- Funnel at 5minutes Seg. Resistance sec 9 0 15
L-Box Passing Ability H2/H1 0.8 0.8 1
After the concrete has set in moulds the cylindrical specimens which were to be
tested in axial compression were capped with a thin layer of stiff neat Portland cement
paste. After 24 hours of casting the specimens were de-moulded and placed in water for
curing. After 28 days of curing the specimens were taken out from water and allowed the
surfaces for drying.
15 Specimens namely
GF SCC Plain (without any confinement) : 3 specimens
GFR SCC with 0.798% Confinement : 3 specimens
GFR SCC with 1.062% Confinement : 3 specimens
GFR SCC with 1.327% Confinement : 3 specimens
GFR SCC with 1.591% Confinement : 3 specimens
6.10. Casting: Standard cast iron Cylindrical moulds of dimensions 150 mm x 300 mm and
Cubes of dimensions 100mm x 100mm x 100mm were used to cast the specimens for
compression test. The side plates of the mould where sufficiently stiff to eliminate
spreading and warping. Before the concrete was placed in the mould, all the joints were
checked thoroughly for any leakage.
A thin film of grease was applied to cover the joints between the halves of the
mould at the bottom surface of the mould and its base plate in order to ensure that no
water escapes.
6.11. Curing: After casting, the moulded specimens are stored in the laboratory at room
temperature for 24 hours. After these periods the specimens are removed from the moulds
and immediately submerged in clean, fresh water of curing tank and specimens are cured
for 28 days in the present investigation work. As per IS 9013:1978 Specifications.
6.12. Compressive Strength: Of the various strengths of concrete the determination of compressive strength has
received a large amount of attention because the concrete is primarily meant to withstand
compressive stresses. Generally cubes are used to determine the compressive strength.
The cubes are usually of 100 x 100 x 100mm (or) 150 x 150 x 150 mm size.
152
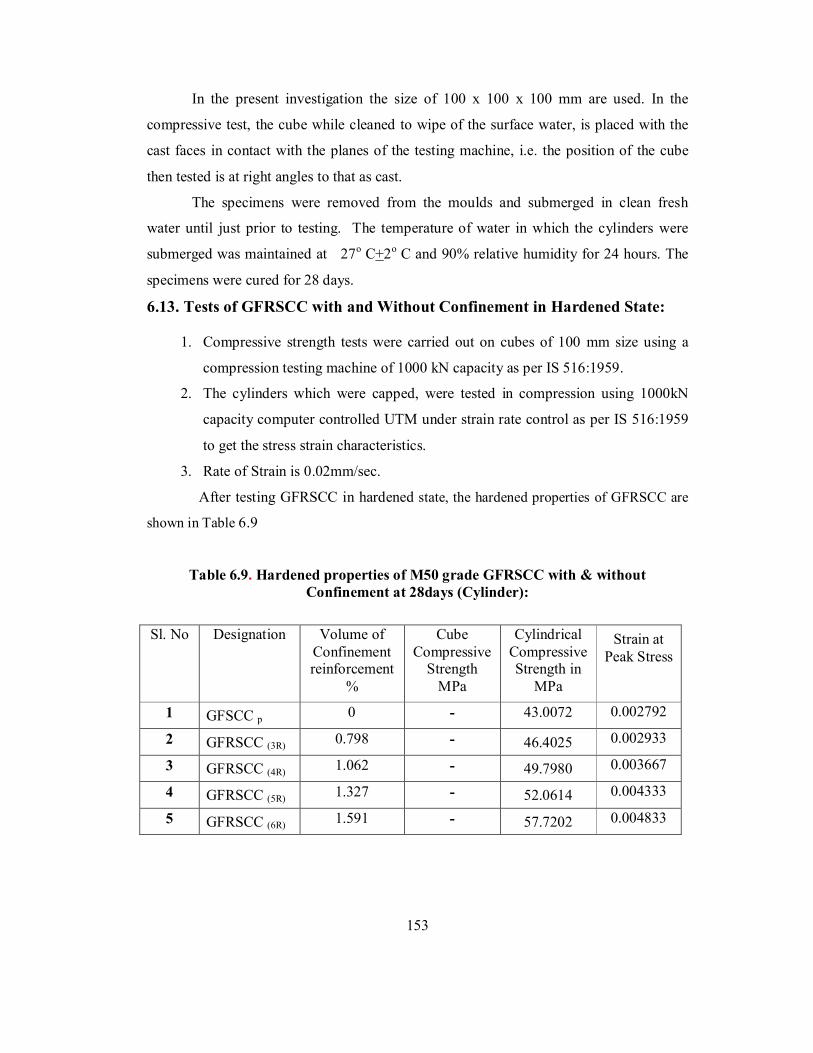
In the present investigation the size of 100 x 100 x 100 mm are used. In the
compressive test, the cube while cleaned to wipe of the surface water, is placed with the
cast faces in contact with the planes of the testing machine, i.e. the position of the cube
then tested is at right angles to that as cast.
The specimens were removed from the moulds and submerged in clean fresh
water until just prior to testing. The temperature of water in which the cylinders were
submerged was maintained at 27o C+2o C and 90% relative humidity for 24 hours. The
specimens were cured for 28 days.
6.13. Tests of GFRSCC with and Without Confinement in Hardened State:
1. Compressive strength tests were carried out on cubes of 100 mm size using a
compression testing machine of 1000 kN capacity as per IS 516:1959.
2. The cylinders which were capped, were tested in compression using 1000kN
capacity computer controlled UTM under strain rate control as per IS 516:1959
to get the stress strain characteristics.
3. Rate of Strain is 0.02mm/sec.
After testing GFRSCC in hardened state, the hardened properties of GFRSCC are
shown in Table 6.9
Table 6.9. Hardened properties of M50 grade GFRSCC with & without Confinement at 28days (Cylinder):
Sl. No Designation Volume of Confinement reinforcement
%
Cube Compressive
Strength MPa
Cylindrical Compressive Strength in
MPa
Strain at Peak Stress
1 GFSCC p 0 - 43.0072 0.002792
2 GFRSCC (3R) 0.798 - 46.4025 0.002933
3 GFRSCC (4R) 1.062 - 49.7980 0.003667
4 GFRSCC (5R) 1.327 - 52.0614 0.004333
5 GFRSCC (6R) 1.591 - 57.7202 0.004833
153

Table 6.10 Compressive strength of Cubes tested at 28 days (without Confinement):
Target strength 50 N/mm2
Sl. No
Designation
Compressive
Strength of Cubes in N/mm2
1 GFSCCP 61.17 2 GFSCCP 53.77 3 GFSCCP 52.96 4 GFSCCP 55.81 5 GFSCCP 52.86 6 GFSCCP 51.34 7 GFSCCP 55.80 8 GFSCCP 55.92 9 GFSCCP 55.10
10 GFSCCP 55.96 11 GFSCCP 58.25 12 GFSCCP 57.79 13 GFSCCP 58.69 14 GFSCCP 64.03
Compressive strength of Cubes of all the 14 Specimens is more than 50 N/mm2,
which is more than the required strength.
6.14. Failure mode of Test Specimen in Compression: Compression Tests will be carried out on hardened test cylinders, the cylindrical
test specimens have a length equal to twice the diameter they are of 150mm in diameter
and 300mm long. Compression test develops a rather more complex system of stress. Due
to compression load, the cube or cylinder under goes lateral expansion owing to the
position’s ratio effect. The steel platens do not undergo lateral expansion to the some
extent that of concrete. With the result that the steel restrains the expansion tendency of
concrete in the lateral direction.
154

This induces a tangential force between the end surfaces of the concrete specimen and the
adjacent steel platens of the testing machine. Cracks are developed on the surface of test
specimen when it attains peak load in compression. On Central portion of test specimen
it observed that cracks are identified. This shows that failure of test specimen occurred
due to insufficient cover to confined steel specimen.
Fig 6.1 Casted cylinder specimen Fig. 6.2 Casted cube specimen under
tested UTM tested under Compression testing Machine
155
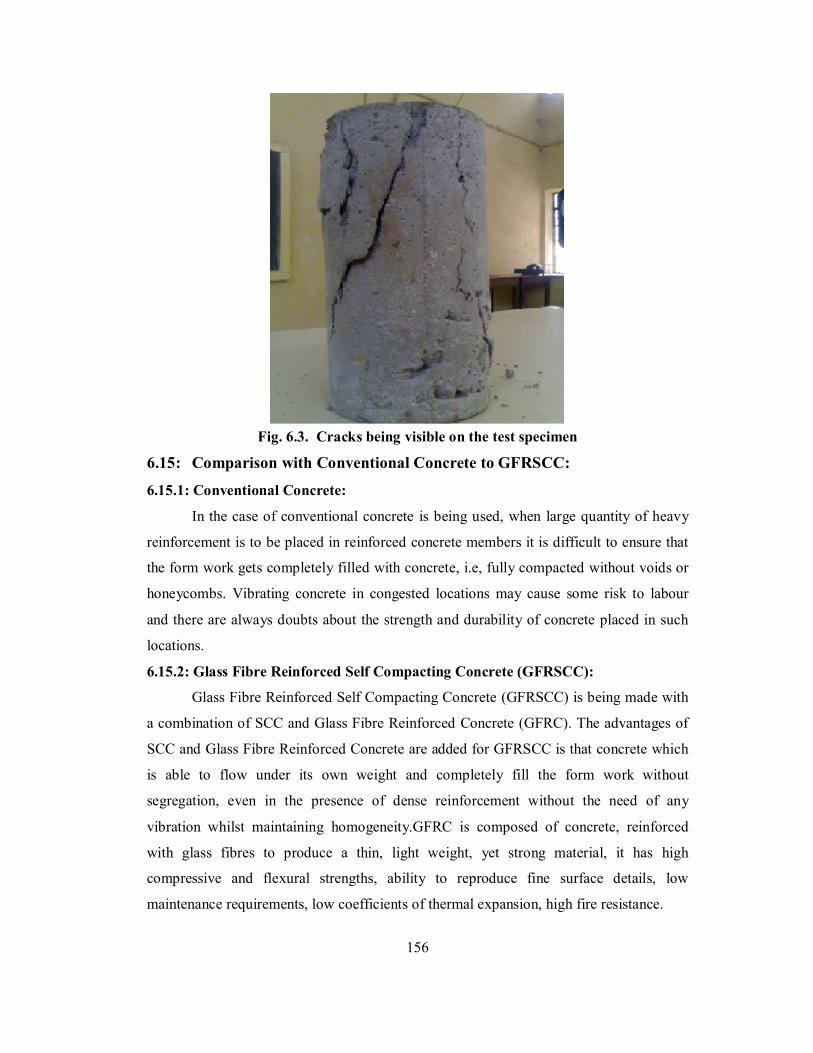
Fig. 6.3. Cracks being visible on the test specimen
6.15: Comparison with Conventional Concrete to GFRSCC:
6.15.1: Conventional Concrete:
In the case of conventional concrete is being used, when large quantity of heavy
reinforcement is to be placed in reinforced concrete members it is difficult to ensure that
the form work gets completely filled with concrete, i.e, fully compacted without voids or
honeycombs. Vibrating concrete in congested locations may cause some risk to labour
and there are always doubts about the strength and durability of concrete placed in such
locations.
6.15.2: Glass Fibre Reinforced Self Compacting Concrete (GFRSCC):
Glass Fibre Reinforced Self Compacting Concrete (GFRSCC) is being made with
a combination of SCC and Glass Fibre Reinforced Concrete (GFRC). The advantages of
SCC and Glass Fibre Reinforced Concrete are added for GFRSCC is that concrete which
is able to flow under its own weight and completely fill the form work without
segregation, even in the presence of dense reinforcement without the need of any
vibration whilst maintaining homogeneity.GFRC is composed of concrete, reinforced
with glass fibres to produce a thin, light weight, yet strong material, it has high
compressive and flexural strengths, ability to reproduce fine surface details, low
maintenance requirements, low coefficients of thermal expansion, high fire resistance.
156
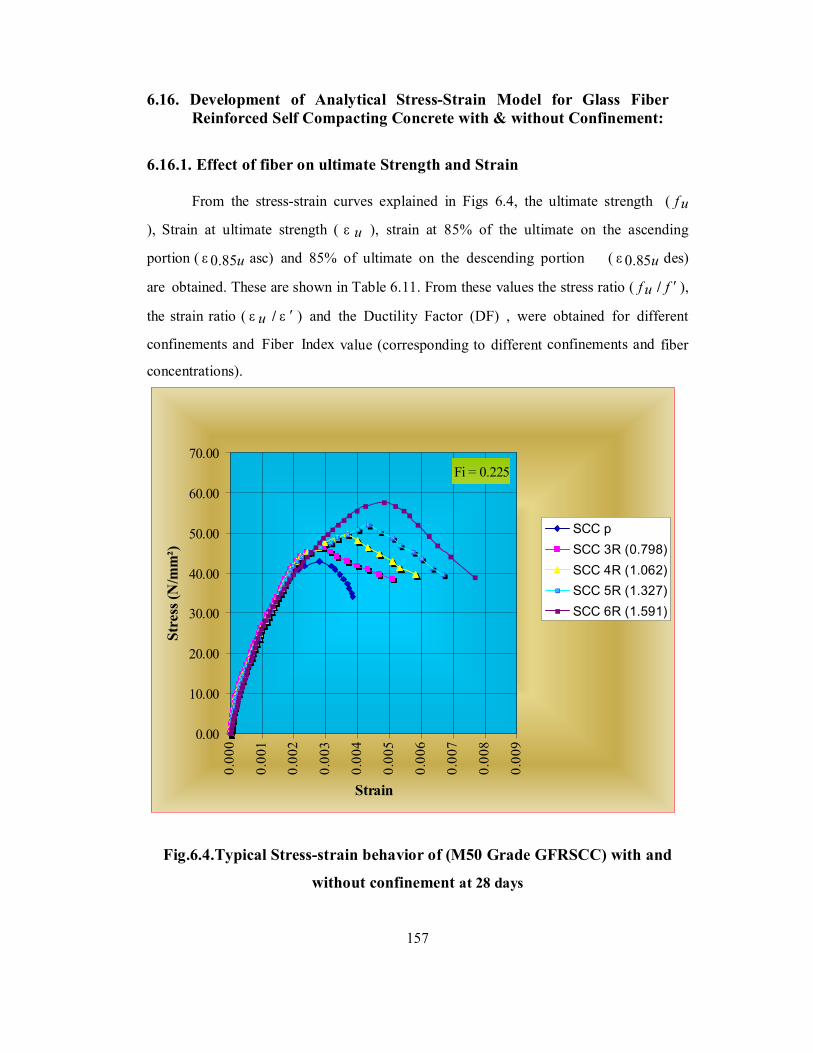
6.16. Development of Analytical Stress-Strain Model for Glass Fiber Reinforced Self Compacting Concrete with & without Confinement:
6.16.1. Effect of fiber on ultimate Strength and Strain
From the stress-strain curves explained in Figs 6.4, the ultimate strength ( f u
), Strain at ultimate strength ( ε u ), strain at 85% of the ultimate on the ascending
portion ( ε 0.85u asc) and 85% of ultimate on the descending portion ( ε 0.85u des)
are obtained. These are shown in Table 6.11. From these values the stress ratio ( f u / f ′ ),
the strain ratio ( ε u / ε ′ ) and the Ductility Factor (DF) , were obtained for different
confinements and Fiber Index value (corresponding to different confinements and fiber
concentrations).
Fig.6.4.Typical Stress-strain behavior of (M50 Grade GFRSCC) with and
without confinement at 28 days
157
Fi = 0.225
0.00
10.00
20.00
30.00
40.00
50.00
60.00
70.00
0.00
0
0.00
1
0.00
2
0.00
3
0.00
4
0.00
5
0.00
6
0.00
7
0.00
8
0.00
9
Strain
Stre
ss (N
/mm
²)
SCC pSCC 3R (0.798)SCC 4R (1.062)SCC 5R (1.327)SCC 6R (1.591)
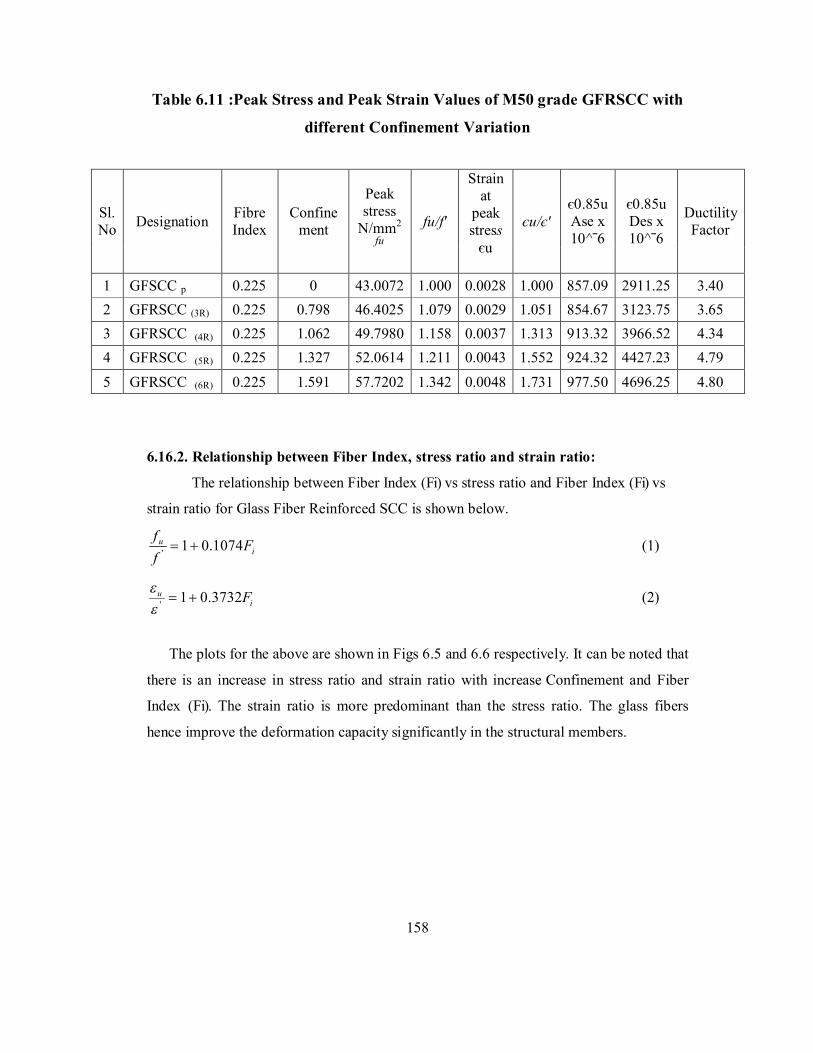
Table 6.11 :Peak Stress and Peak Strain Values of M50 grade GFRSCC with
different Confinement Variation
6.16.2. Relationship between Fiber Index, stress ratio and strain ratio:
The relationship between Fiber Index (Fi) vs stress ratio and Fiber Index (Fi) vs
strain ratio for Glass Fiber Reinforced SCC is shown below.
iu F
ff
1074.01' (1)
iu F3732.01' (2)
The plots for the above are shown in Figs 6.5 and 6.6 respectively. It can be noted that
there is an increase in stress ratio and strain ratio with increase Confinement and Fiber
Index (Fi). The strain ratio is more predominant than the stress ratio. The glass fibers
hence improve the deformation capacity significantly in the structural members.
158
Sl. No Designation Fibre
Index Confine
ment
Peak stress
N/mm2
fu
fu/f'
Strain at
peak stress
єu
єu/є' є0.85u Ase x 10^ˉ6
є0.85u Des x 10^ˉ6
Ductility Factor
1 GFSCC p 0.225 0 43.0072 1.000 0.0028 1.000 857.09 2911.25 3.40 2 GFRSCC (3R) 0.225 0.798 46.4025 1.079 0.0029 1.051 854.67 3123.75 3.65 3 GFRSCC (4R) 0.225 1.062 49.7980 1.158 0.0037 1.313 913.32 3966.52 4.34 4 GFRSCC (5R) 0.225 1.327 52.0614 1.211 0.0043 1.552 924.32 4427.23 4.79 5 GFRSCC (6R) 0.225 1.591 57.7202 1.342 0.0048 1.731 977.50 4696.25 4.80
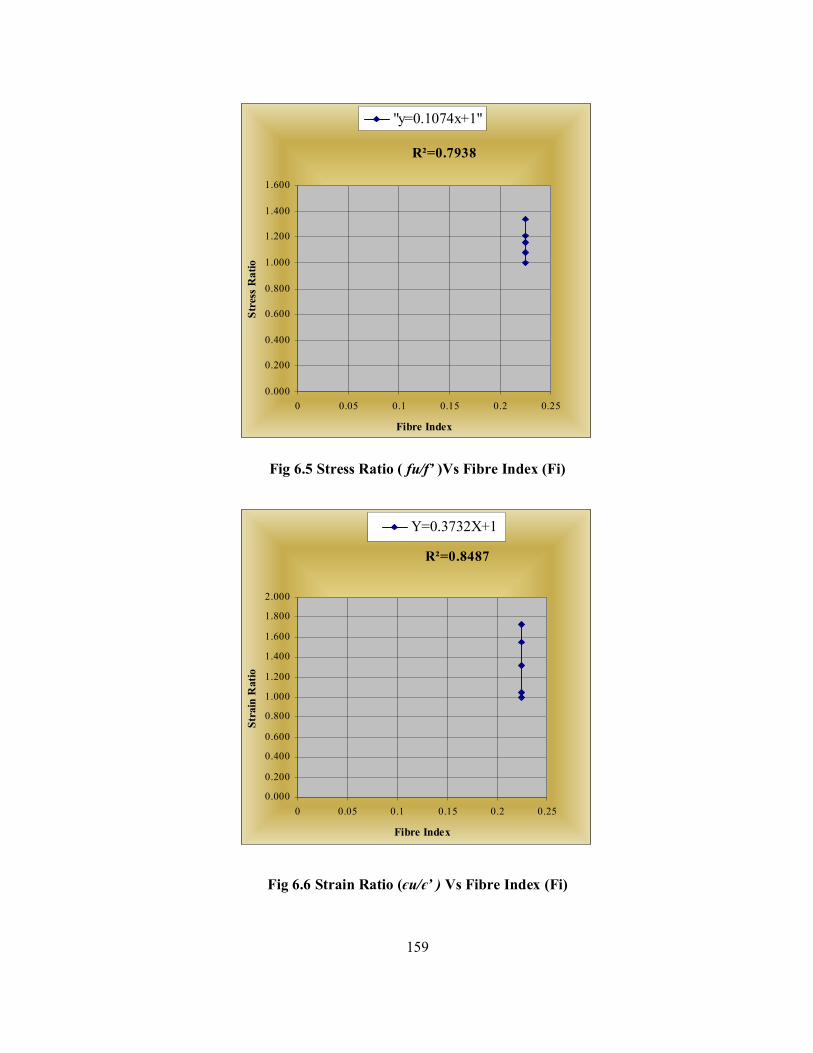
Fig 6.5 Stress Ratio ( fu/f’ )Vs Fibre Index (Fi)
Fig 6.6 Strain Ratio (єu/є’ ) Vs Fibre Index (Fi)
159
R²=0.7938
0.000
0.200
0.400
0.600
0.800
1.000
1.200
1.400
1.600
0 0.05 0.1 0.15 0.2 0.25
Fibre Index
Stre
ss R
atio
"y=0.1074x+1"
R²=0.8487
0.000
0.200
0.400
0.600
0.800
1.000
1.200
1.400
1.600
1.800
2.000
0 0.05 0.1 0.15 0.2 0.25
Fibre Index
Stra
in R
atio
Y=0.3732X+1
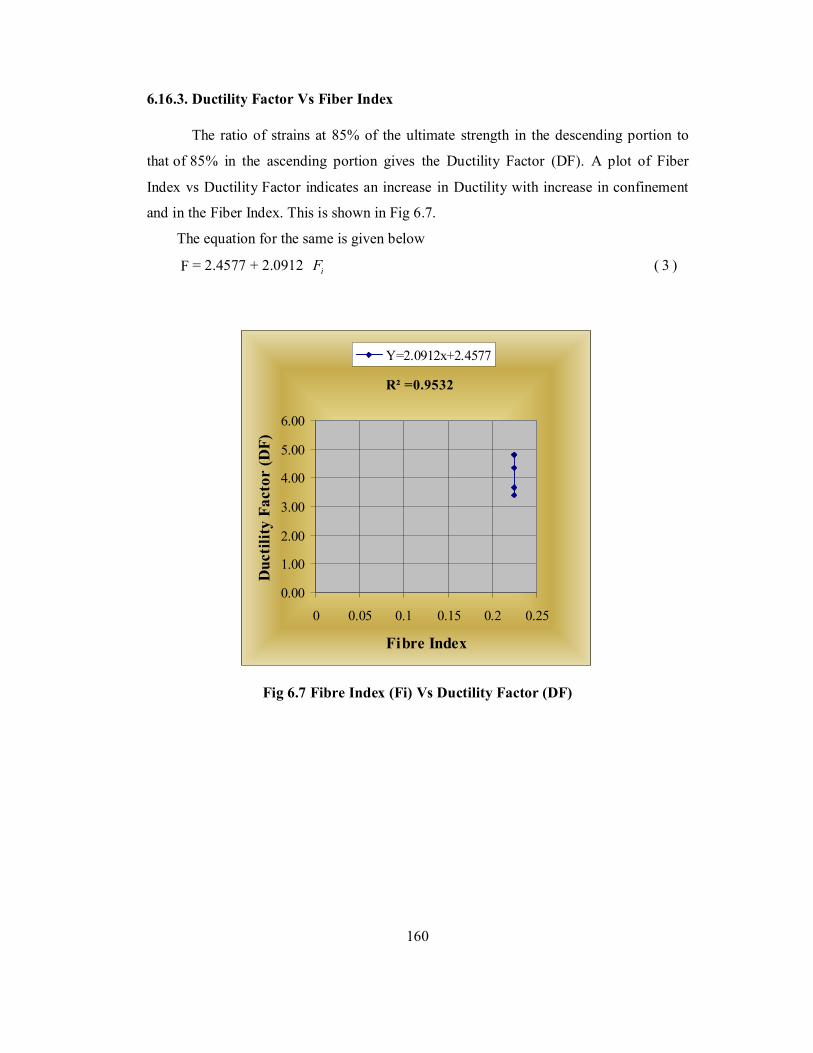
6.16.3. Ductility Factor Vs Fiber Index
The ratio of strains at 85% of the ultimate strength in the descending portion to
that of 85% in the ascending portion gives the Ductility Factor (DF). A plot of Fiber
Index vs Ductility Factor indicates an increase in Ductility with increase in confinement
and in the Fiber Index. This is shown in Fig 6.7.
The equation for the same is given below
F = 2.4577 + 2.0912 iF ( 3 )
Fig 6.7 Fibre Index (Fi) Vs Ductility Factor (DF)
160
R² =0.9532
0.00
1.00
2.00
3.00
4.00
5.00
6.00
0 0.05 0.1 0.15 0.2 0.25
Fibre Index
Duc
tility
Fac
tor
(DF)
Y=2.0912x+2.4577
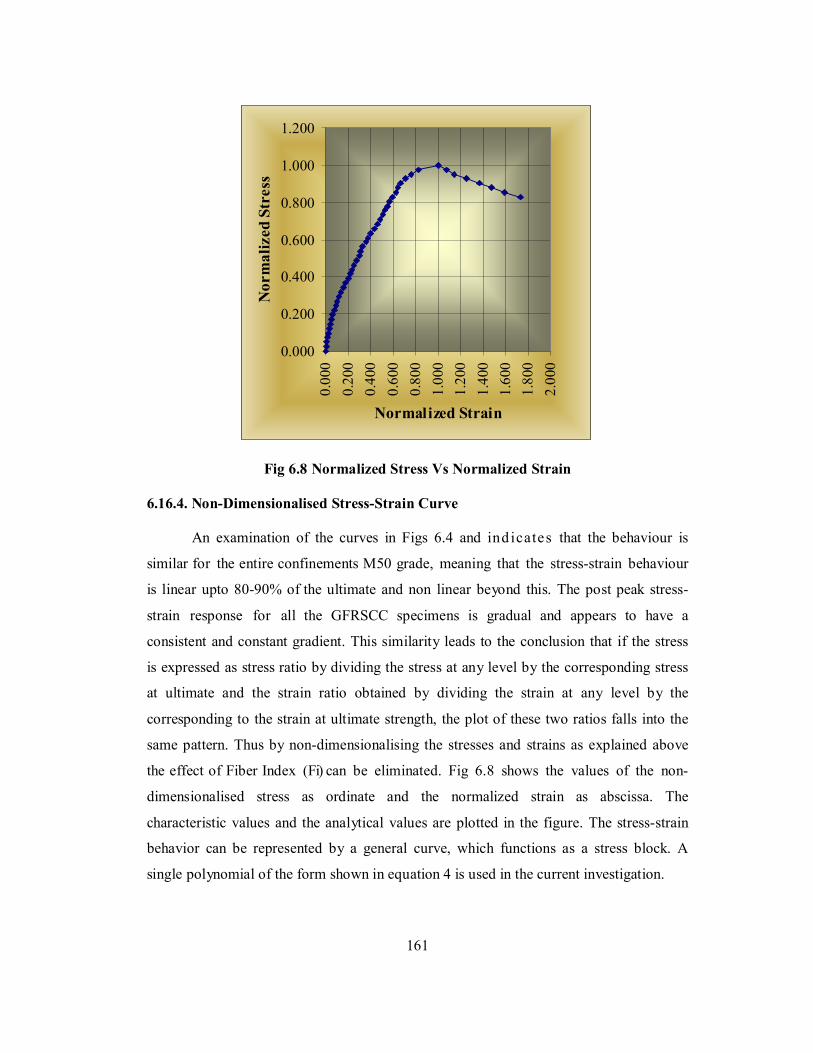
Fig 6.8 Normalized Stress Vs Normalized Strain
6.16.4. Non-Dimensionalised Stress-Strain Curve
An examination of the curves in Figs 6.4 and ind icates that the behaviour is
similar for the entire confinements M50 grade, meaning that the stress-strain behaviour
is linear upto 80-90% of the ultimate and non linear beyond this. The post peak stress-
strain response for all the GFRSCC specimens is gradual and appears to have a
consistent and constant gradient. This similarity leads to the conclusion that if the stress
is expressed as stress ratio by dividing the stress at any level by the corresponding stress
at ultimate and the strain ratio obtained by dividing the strain at any level by the
corresponding to the strain at ultimate strength, the plot of these two ratios falls into the
same pattern. Thus by non-dimensionalising the stresses and strains as explained above
the effect of Fiber Index (Fi) can be eliminated. Fig 6.8 shows the values of the non-
dimensionalised stress as ordinate and the normalized strain as abscissa. The
characteristic values and the analytical values are plotted in the figure. The stress-strain
behavior can be represented by a general curve, which functions as a stress block. A
single polynomial of the form shown in equation 4 is used in the current investigation.
161
0.000
0.200
0.400
0.600
0.800
1.000
1.200
0.00
00.
200
0.40
00.
600
0.80
01.
000
1.20
01.
400
1.60
01.
800
2.00
0
Normalized Strain
Nor
mal
ized
Str
ess
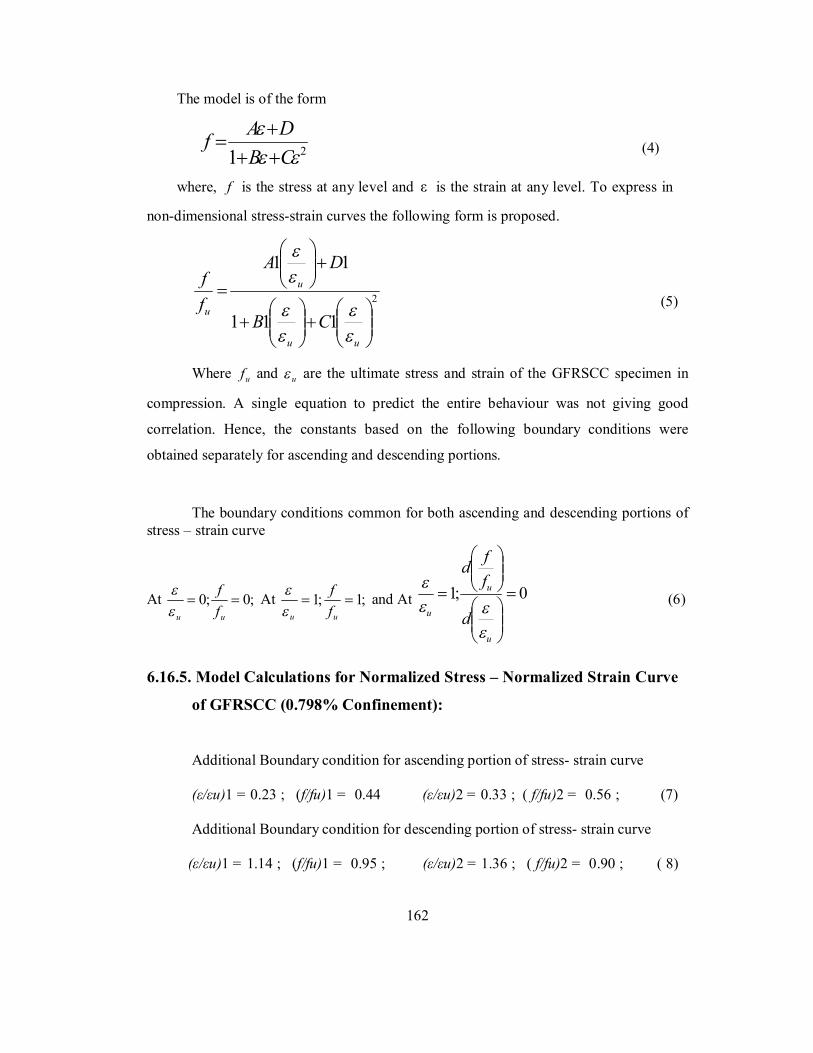
The model is of the form
21
CBDAf
(4)
where, f is the stress at any level and ε is the strain at any level. To express in
non-dimensional stress-strain curves the following form is proposed.
2
111
11
uu
u
uCB
DA
ff
(5)
Where uf and u are the ultimate stress and strain of the GFRSCC specimen in
compression. A single equation to predict the entire behaviour was not giving good
correlation. Hence, the constants based on the following boundary conditions were
obtained separately for ascending and descending portions.
The boundary conditions common for both ascending and descending portions of stress – strain curve
At ;0;0 uu ff
At ;1;1
uu ff
and At 0;1
u
u
u d
ffd
(6)
6.16.5. Model Calculations for Normalized Stress – Normalized Strain Curve
of GFRSCC (0.798% Confinement):
Additional Boundary condition for ascending portion of stress- strain curve
(ε/εu)1 = 0.23 ; (f/fu)1 = 0.44 (ε/εu)2 = 0.33 ; ( f/fu)2 = 0.56 ; (7)
Additional Boundary condition for descending portion of stress- strain curve
(ε/εu)1 = 1.14 ; (f/fu)1 = 0.95 ; (ε/εu)2 = 1.36 ; ( f/fu)2 = 0.90 ; ( 8)
162
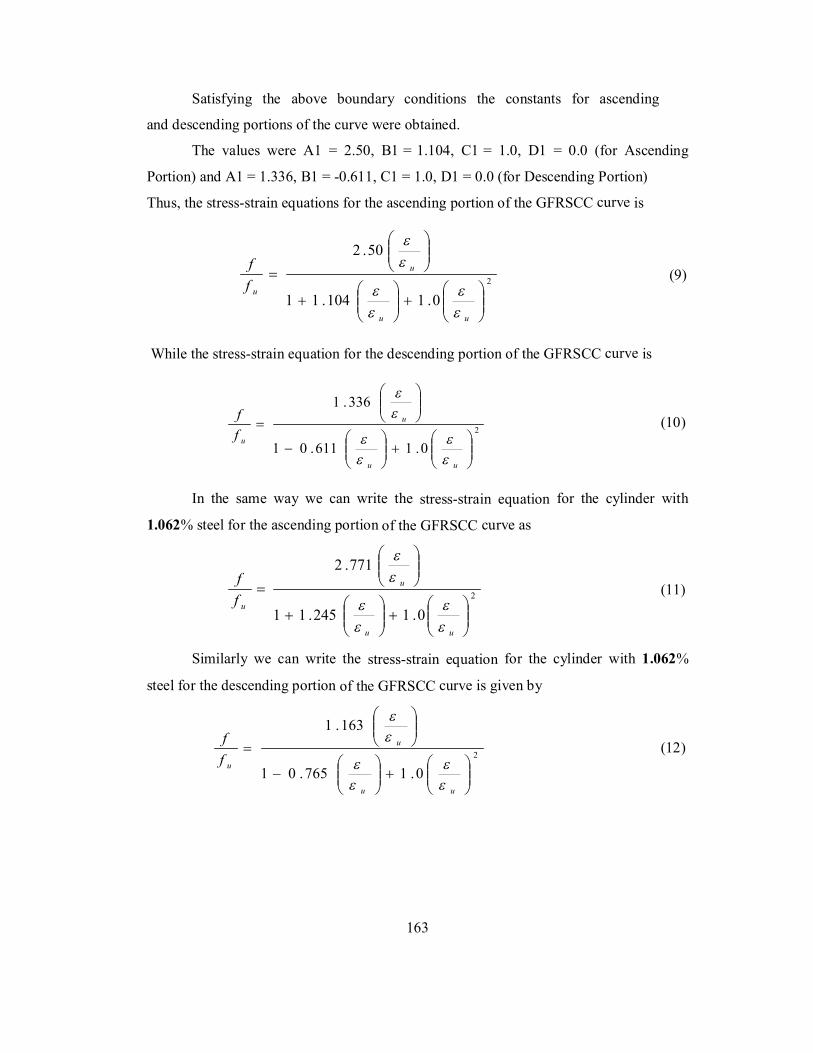
Satisfying the above boundary conditions the constants for ascending
and descending portions of the curve were obtained.
The values were A1 = 2.50, B1 = 1.104, C1 = 1.0, D1 = 0.0 (for Ascending
Portion) and A1 = 1.336, B1 = -0.611, C1 = 1.0, D1 = 0.0 (for Descending Portion)
Thus, the stress-strain equations for the ascending portion of the GFRSCC curve is
2
0.1104.11
50.2
uu
u
uff
(9)
While the stress-strain equation for the descending portion of the GFRSCC curve is
2
0.1611.01
336.1
uu
u
uff
(10)
In the same way we can write the stress-strain equation for the cylinder with
1.062% steel for the ascending portion of the GFRSCC curve as
2
0.1245.11
771.2
uu
u
uff
(11)
Similarly we can write the stress-strain equation for the cylinder with 1.062%
steel for the descending portion of the GFRSCC curve is given by
2
0.1765.01
163.1
uu
u
uff
(12)
163
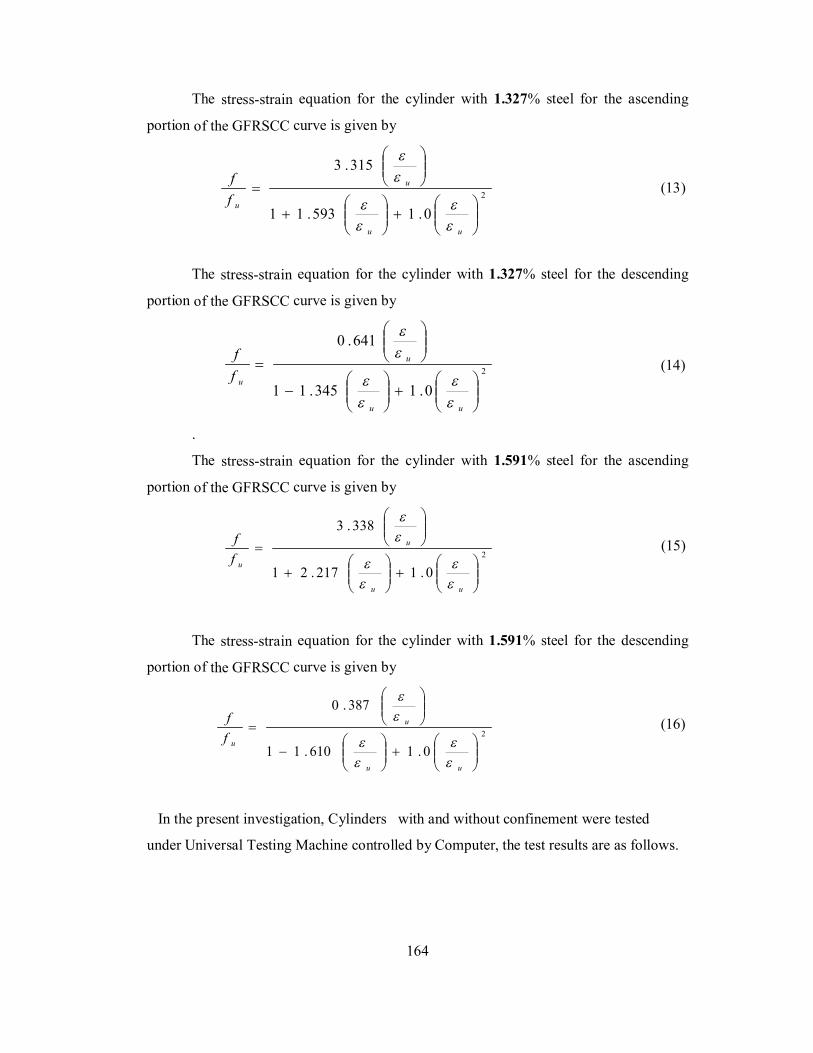
The stress-strain equation for the cylinder with 1.327% steel for the ascending
portion of the GFRSCC curve is given by
2
0.1593.11
315.3
uu
u
uff
(13)
The stress-strain equation for the cylinder with 1.327% steel for the descending
portion of the GFRSCC curve is given by
2
0.1345.11
641.0
uu
u
uff
(14)
.
The stress-strain equation for the cylinder with 1.591% steel for the ascending
portion of the GFRSCC curve is given by
2
0.1217.21
338.3
uu
u
uff
(15)
The stress-strain equation for the cylinder with 1.591% steel for the descending
portion of the GFRSCC curve is given by
2
0.1610.11
387.0
uu
u
uff
(16)
In the present investigation, Cylinders with and without confinement were tested
under Universal Testing Machine controlled by Computer, the test results are as follows.
164
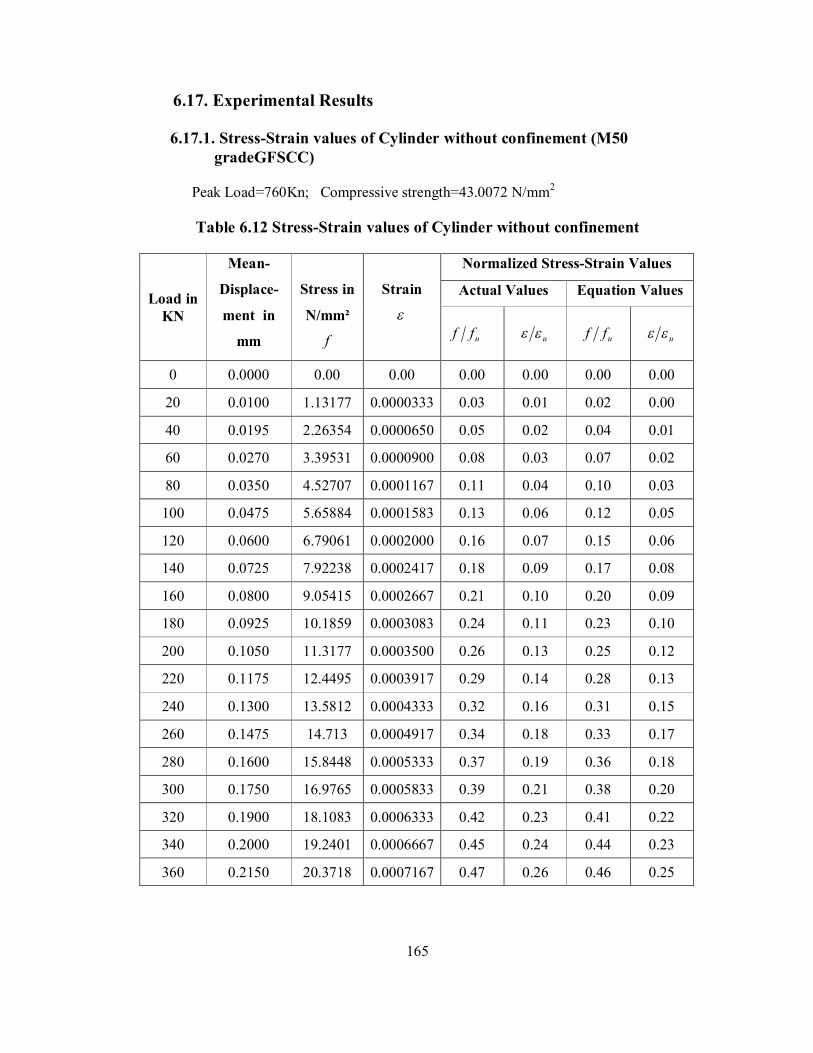
6.17. Experimental Results 6.17.1. Stress-Strain values of Cylinder without confinement (M50
gradeGFSCC)
Peak Load=760Kn; Compressive strength=43.0072 N/mm2
Table 6.12 Stress-Strain values of Cylinder without confinement
Normalized Stress-Strain Values
Actual Values Equation Values Load in KN
Mean-
Displace-
ment in
mm
Stress in
N/mm²
f
Strain
uff u uff u
0 0.0000 0.00 0.00 0.00 0.00 0.00 0.00
20 0.0100 1.13177 0.0000333 0.03 0.01 0.02 0.00
40 0.0195 2.26354 0.0000650 0.05 0.02 0.04 0.01
60 0.0270 3.39531 0.0000900 0.08 0.03 0.07 0.02
80 0.0350 4.52707 0.0001167 0.11 0.04 0.10 0.03
100 0.0475 5.65884 0.0001583 0.13 0.06 0.12 0.05
120 0.0600 6.79061 0.0002000 0.16 0.07 0.15 0.06
140 0.0725 7.92238 0.0002417 0.18 0.09 0.17 0.08
160 0.0800 9.05415 0.0002667 0.21 0.10 0.20 0.09
180 0.0925 10.1859 0.0003083 0.24 0.11 0.23 0.10
200 0.1050 11.3177 0.0003500 0.26 0.13 0.25 0.12
220 0.1175 12.4495 0.0003917 0.29 0.14 0.28 0.13
240 0.1300 13.5812 0.0004333 0.32 0.16 0.31 0.15
260 0.1475 14.713 0.0004917 0.34 0.18 0.33 0.17
280 0.1600 15.8448 0.0005333 0.37 0.19 0.36 0.18
300 0.1750 16.9765 0.0005833 0.39 0.21 0.38 0.20
320 0.1900 18.1083 0.0006333 0.42 0.23 0.41 0.22
340 0.2000 19.2401 0.0006667 0.45 0.24 0.44 0.23
360 0.2150 20.3718 0.0007167 0.47 0.26 0.46 0.25
165
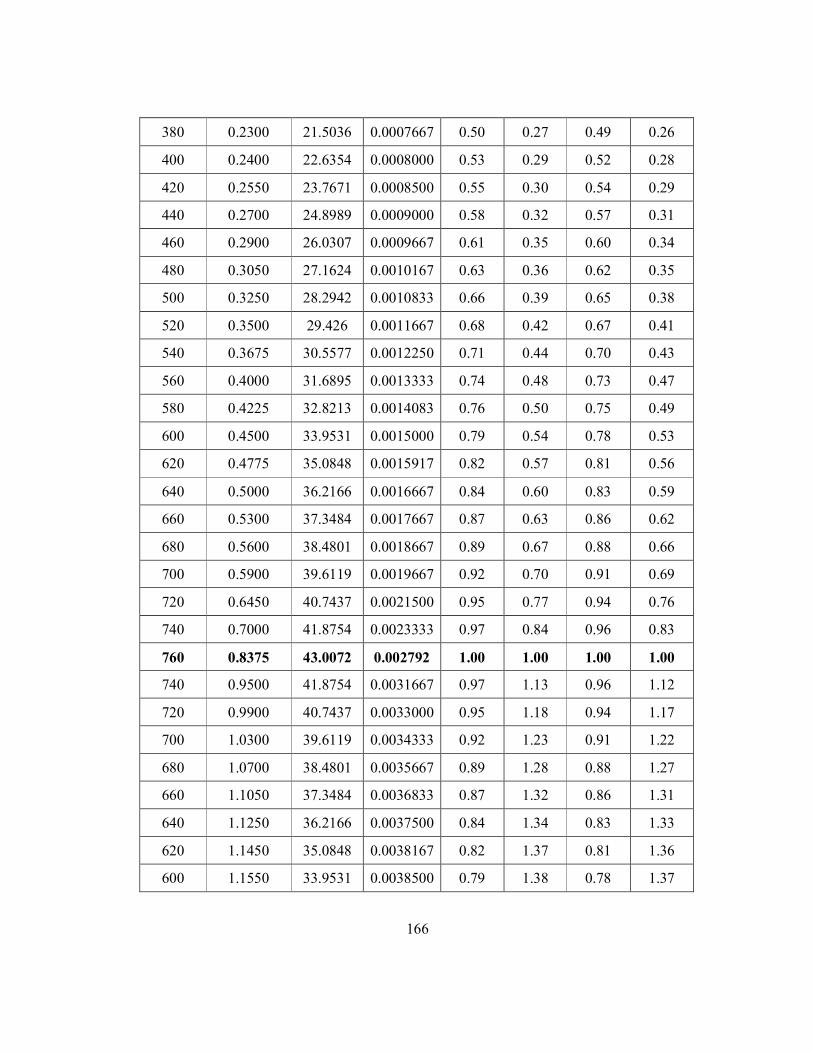
380 0.2300 21.5036 0.0007667 0.50 0.27 0.49 0.26
400 0.2400 22.6354 0.0008000 0.53 0.29 0.52 0.28
420 0.2550 23.7671 0.0008500 0.55 0.30 0.54 0.29
440 0.2700 24.8989 0.0009000 0.58 0.32 0.57 0.31
460 0.2900 26.0307 0.0009667 0.61 0.35 0.60 0.34
480 0.3050 27.1624 0.0010167 0.63 0.36 0.62 0.35
500 0.3250 28.2942 0.0010833 0.66 0.39 0.65 0.38
520 0.3500 29.426 0.0011667 0.68 0.42 0.67 0.41
540 0.3675 30.5577 0.0012250 0.71 0.44 0.70 0.43
560 0.4000 31.6895 0.0013333 0.74 0.48 0.73 0.47
580 0.4225 32.8213 0.0014083 0.76 0.50 0.75 0.49
600 0.4500 33.9531 0.0015000 0.79 0.54 0.78 0.53
620 0.4775 35.0848 0.0015917 0.82 0.57 0.81 0.56
640 0.5000 36.2166 0.0016667 0.84 0.60 0.83 0.59
660 0.5300 37.3484 0.0017667 0.87 0.63 0.86 0.62
680 0.5600 38.4801 0.0018667 0.89 0.67 0.88 0.66
700 0.5900 39.6119 0.0019667 0.92 0.70 0.91 0.69
720 0.6450 40.7437 0.0021500 0.95 0.77 0.94 0.76
740 0.7000 41.8754 0.0023333 0.97 0.84 0.96 0.83
760 0.8375 43.0072 0.002792 1.00 1.00 1.00 1.00
740 0.9500 41.8754 0.0031667 0.97 1.13 0.96 1.12
720 0.9900 40.7437 0.0033000 0.95 1.18 0.94 1.17
700 1.0300 39.6119 0.0034333 0.92 1.23 0.91 1.22
680 1.0700 38.4801 0.0035667 0.89 1.28 0.88 1.27
660 1.1050 37.3484 0.0036833 0.87 1.32 0.86 1.31
640 1.1250 36.2166 0.0037500 0.84 1.34 0.83 1.33
620 1.1450 35.0848 0.0038167 0.82 1.37 0.81 1.36
600 1.1550 33.9531 0.0038500 0.79 1.38 0.78 1.37
166

Fig: 6.9. Stress-Strain behaviour of GFRSCC without confinement
Fig: 6.10 Normalized Stress- Normalized Strain Curve of GFRSCC without
confinement
167
0.000
0.200
0.400
0.600
0.800
1.000
1.200
0.00
0
0.20
0
0.40
0
0.60
0
0.80
0
1.00
0
1.20
0
1.40
0
1.60
0
Normalized Strain
Nor
mal
ized
Str
ess
0.005.00
10.0015.0020.0025.0030.0035.0040.0045.0050.00
0.00
00
0.00
05
0.00
10
0.00
15
0.00
20
0.00
25
0.00
30
0.00
35
0.00
40
0.00
45
Strain
Stre
ss (N
/mm
²)
Fi = 0.225
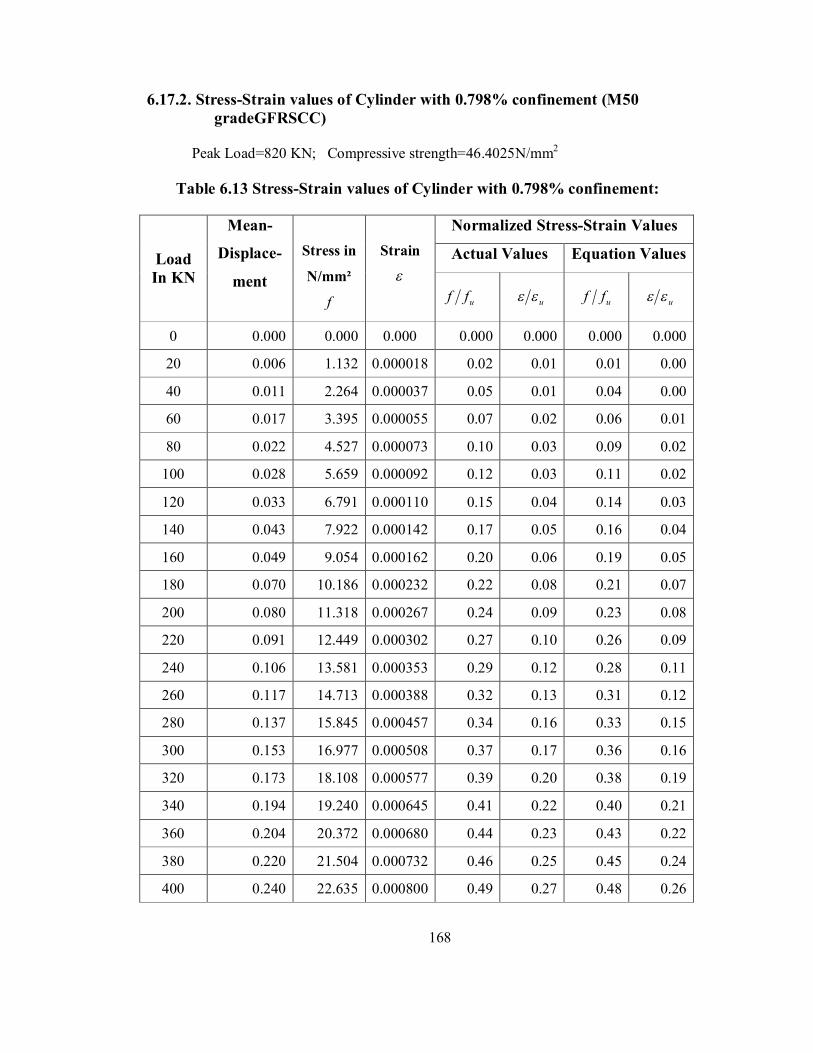
6.17.2. Stress-Strain values of Cylinder with 0.798% confinement (M50 gradeGFRSCC)
Peak Load=820 KN; Compressive strength=46.4025N/mm2
Table 6.13 Stress-Strain values of Cylinder with 0.798% confinement:
Normalized Stress-Strain Values
Actual Values Equation Values Load In KN
Mean-
Displace-
ment
Stress in
N/mm²
f
Strain
uff u uff u
0 0.000 0.000 0.000 0.000 0.000 0.000 0.000
20 0.006 1.132 0.000018 0.02 0.01 0.01 0.00
40 0.011 2.264 0.000037 0.05 0.01 0.04 0.00
60 0.017 3.395 0.000055 0.07 0.02 0.06 0.01
80 0.022 4.527 0.000073 0.10 0.03 0.09 0.02
100 0.028 5.659 0.000092 0.12 0.03 0.11 0.02
120 0.033 6.791 0.000110 0.15 0.04 0.14 0.03
140 0.043 7.922 0.000142 0.17 0.05 0.16 0.04
160 0.049 9.054 0.000162 0.20 0.06 0.19 0.05
180 0.070 10.186 0.000232 0.22 0.08 0.21 0.07
200 0.080 11.318 0.000267 0.24 0.09 0.23 0.08
220 0.091 12.449 0.000302 0.27 0.10 0.26 0.09
240 0.106 13.581 0.000353 0.29 0.12 0.28 0.11
260 0.117 14.713 0.000388 0.32 0.13 0.31 0.12
280 0.137 15.845 0.000457 0.34 0.16 0.33 0.15
300 0.153 16.977 0.000508 0.37 0.17 0.36 0.16
320 0.173 18.108 0.000577 0.39 0.20 0.38 0.19
340 0.194 19.240 0.000645 0.41 0.22 0.40 0.21
360 0.204 20.372 0.000680 0.44 0.23 0.43 0.22
380 0.220 21.504 0.000732 0.46 0.25 0.45 0.24
400 0.240 22.635 0.000800 0.49 0.27 0.48 0.26
168
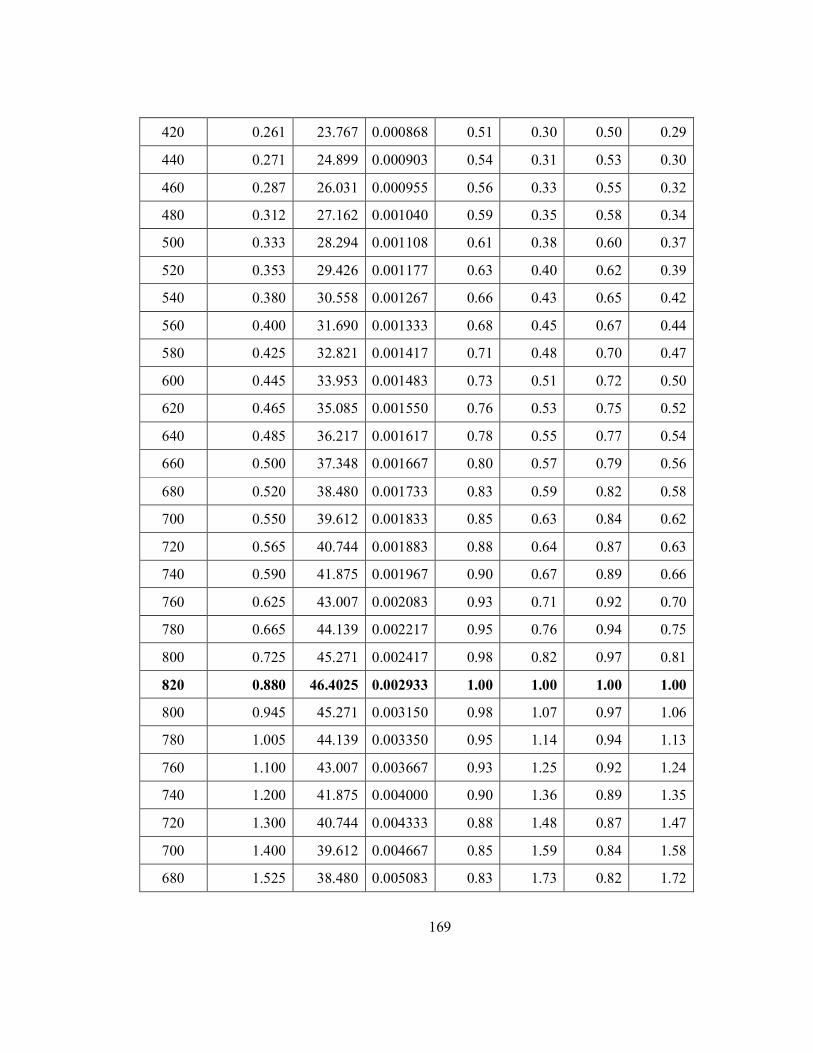
420 0.261 23.767 0.000868 0.51 0.30 0.50 0.29
440 0.271 24.899 0.000903 0.54 0.31 0.53 0.30
460 0.287 26.031 0.000955 0.56 0.33 0.55 0.32
480 0.312 27.162 0.001040 0.59 0.35 0.58 0.34
500 0.333 28.294 0.001108 0.61 0.38 0.60 0.37
520 0.353 29.426 0.001177 0.63 0.40 0.62 0.39
540 0.380 30.558 0.001267 0.66 0.43 0.65 0.42
560 0.400 31.690 0.001333 0.68 0.45 0.67 0.44
580 0.425 32.821 0.001417 0.71 0.48 0.70 0.47
600 0.445 33.953 0.001483 0.73 0.51 0.72 0.50
620 0.465 35.085 0.001550 0.76 0.53 0.75 0.52
640 0.485 36.217 0.001617 0.78 0.55 0.77 0.54
660 0.500 37.348 0.001667 0.80 0.57 0.79 0.56
680 0.520 38.480 0.001733 0.83 0.59 0.82 0.58
700 0.550 39.612 0.001833 0.85 0.63 0.84 0.62
720 0.565 40.744 0.001883 0.88 0.64 0.87 0.63
740 0.590 41.875 0.001967 0.90 0.67 0.89 0.66
760 0.625 43.007 0.002083 0.93 0.71 0.92 0.70
780 0.665 44.139 0.002217 0.95 0.76 0.94 0.75
800 0.725 45.271 0.002417 0.98 0.82 0.97 0.81
820 0.880 46.4025 0.002933 1.00 1.00 1.00 1.00
800 0.945 45.271 0.003150 0.98 1.07 0.97 1.06
780 1.005 44.139 0.003350 0.95 1.14 0.94 1.13
760 1.100 43.007 0.003667 0.93 1.25 0.92 1.24
740 1.200 41.875 0.004000 0.90 1.36 0.89 1.35
720 1.300 40.744 0.004333 0.88 1.48 0.87 1.47
700 1.400 39.612 0.004667 0.85 1.59 0.84 1.58
680 1.525 38.480 0.005083 0.83 1.73 0.82 1.72
169

..
Fig: 6.11. Stress-Strain behaviour of GFRSCC (0.798% Confinement)
Fig: 6.12. Normalized Stress- Normalized Strain Curve of GFRSCC (0.798% Confinement)
170
0.000
0.200
0.400
0.600
0.800
1.000
1.200
0.00
00.
200
0.40
00.
600
0.80
01.
000
1.20
01.
400
1.60
01.
800
2.00
0
Normalized Strain
Nor
mal
ized
Str
ess
0.005.00
10.0015.0020.0025.0030.0035.0040.0045.0050.00
0.00
00
0.00
10
0.00
20
0.00
30
0.00
40
0.00
50
0.00
60
Strain
Stre
ss (N
/mm
²)
Fi = 0.225
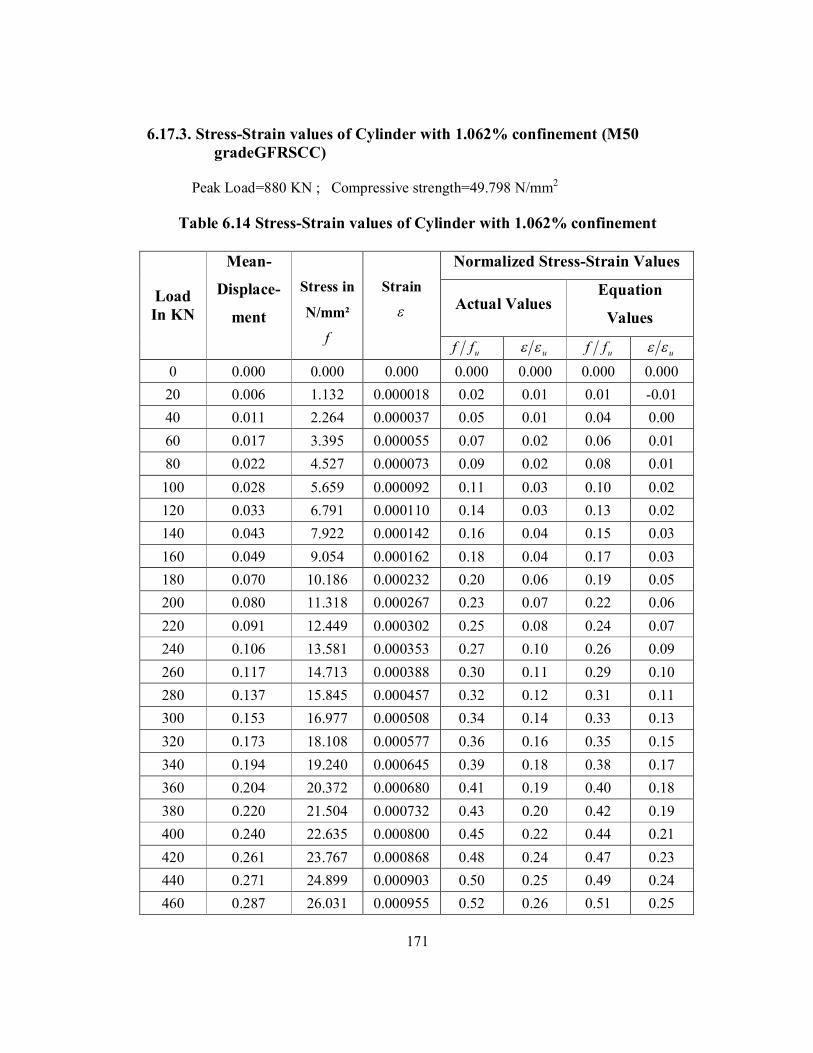
6.17.3. Stress-Strain values of Cylinder with 1.062% confinement (M50 gradeGFRSCC)
Peak Load=880 KN ; Compressive strength=49.798 N/mm2
Table 6.14 Stress-Strain values of Cylinder with 1.062% confinement
Normalized Stress-Strain Values
Actual Values Equation
Values Load In KN
Mean-
Displace-
ment
Stress in
N/mm²
f
Strain
uff u uff u 0 0.000 0.000 0.000 0.000 0.000 0.000 0.000
20 0.006 1.132 0.000018 0.02 0.01 0.01 -0.01 40 0.011 2.264 0.000037 0.05 0.01 0.04 0.00 60 0.017 3.395 0.000055 0.07 0.02 0.06 0.01 80 0.022 4.527 0.000073 0.09 0.02 0.08 0.01 100 0.028 5.659 0.000092 0.11 0.03 0.10 0.02 120 0.033 6.791 0.000110 0.14 0.03 0.13 0.02 140 0.043 7.922 0.000142 0.16 0.04 0.15 0.03 160 0.049 9.054 0.000162 0.18 0.04 0.17 0.03 180 0.070 10.186 0.000232 0.20 0.06 0.19 0.05 200 0.080 11.318 0.000267 0.23 0.07 0.22 0.06 220 0.091 12.449 0.000302 0.25 0.08 0.24 0.07 240 0.106 13.581 0.000353 0.27 0.10 0.26 0.09 260 0.117 14.713 0.000388 0.30 0.11 0.29 0.10 280 0.137 15.845 0.000457 0.32 0.12 0.31 0.11 300 0.153 16.977 0.000508 0.34 0.14 0.33 0.13 320 0.173 18.108 0.000577 0.36 0.16 0.35 0.15 340 0.194 19.240 0.000645 0.39 0.18 0.38 0.17 360 0.204 20.372 0.000680 0.41 0.19 0.40 0.18 380 0.220 21.504 0.000732 0.43 0.20 0.42 0.19 400 0.240 22.635 0.000800 0.45 0.22 0.44 0.21 420 0.261 23.767 0.000868 0.48 0.24 0.47 0.23 440 0.271 24.899 0.000903 0.50 0.25 0.49 0.24 460 0.287 26.031 0.000955 0.52 0.26 0.51 0.25
171
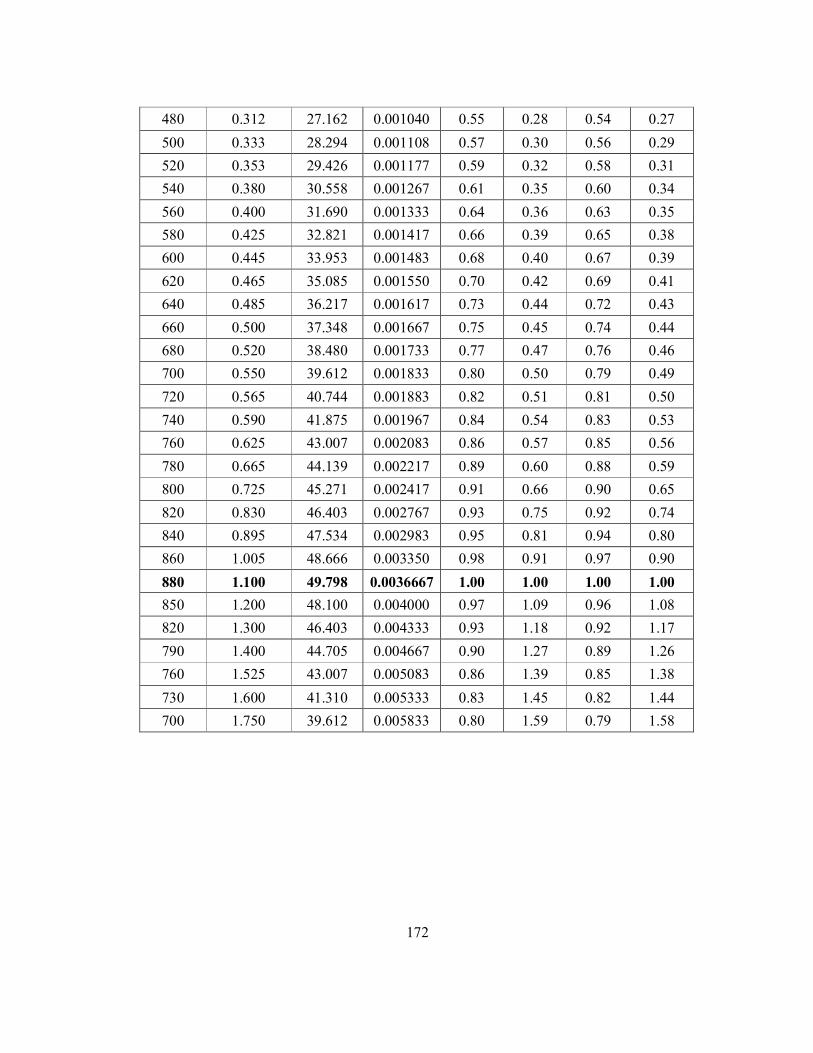
480 0.312 27.162 0.001040 0.55 0.28 0.54 0.27 500 0.333 28.294 0.001108 0.57 0.30 0.56 0.29 520 0.353 29.426 0.001177 0.59 0.32 0.58 0.31 540 0.380 30.558 0.001267 0.61 0.35 0.60 0.34 560 0.400 31.690 0.001333 0.64 0.36 0.63 0.35 580 0.425 32.821 0.001417 0.66 0.39 0.65 0.38 600 0.445 33.953 0.001483 0.68 0.40 0.67 0.39 620 0.465 35.085 0.001550 0.70 0.42 0.69 0.41 640 0.485 36.217 0.001617 0.73 0.44 0.72 0.43 660 0.500 37.348 0.001667 0.75 0.45 0.74 0.44 680 0.520 38.480 0.001733 0.77 0.47 0.76 0.46 700 0.550 39.612 0.001833 0.80 0.50 0.79 0.49 720 0.565 40.744 0.001883 0.82 0.51 0.81 0.50 740 0.590 41.875 0.001967 0.84 0.54 0.83 0.53 760 0.625 43.007 0.002083 0.86 0.57 0.85 0.56 780 0.665 44.139 0.002217 0.89 0.60 0.88 0.59 800 0.725 45.271 0.002417 0.91 0.66 0.90 0.65 820 0.830 46.403 0.002767 0.93 0.75 0.92 0.74 840 0.895 47.534 0.002983 0.95 0.81 0.94 0.80 860 1.005 48.666 0.003350 0.98 0.91 0.97 0.90 880 1.100 49.798 0.0036667 1.00 1.00 1.00 1.00 850 1.200 48.100 0.004000 0.97 1.09 0.96 1.08 820 1.300 46.403 0.004333 0.93 1.18 0.92 1.17 790 1.400 44.705 0.004667 0.90 1.27 0.89 1.26 760 1.525 43.007 0.005083 0.86 1.39 0.85 1.38 730 1.600 41.310 0.005333 0.83 1.45 0.82 1.44 700 1.750 39.612 0.005833 0.80 1.59 0.79 1.58
172
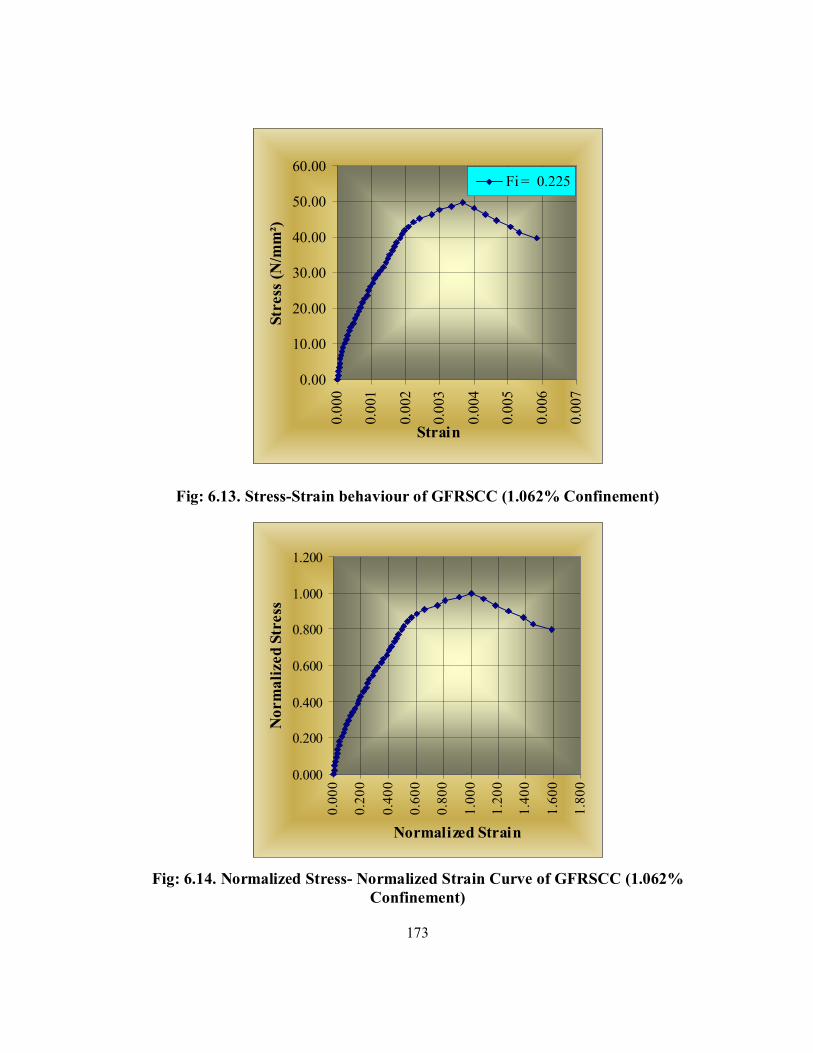
Fig: 6.13. Stress-Strain behaviour of GFRSCC (1.062% Confinement)
Fig: 6.14. Normalized Stress- Normalized Strain Curve of GFRSCC (1.062% Confinement)
173
0.000
0.200
0.400
0.600
0.800
1.000
1.200
0.00
0
0.20
0
0.40
0
0.60
0
0.80
0
1.00
0
1.20
0
1.40
0
1.60
0
1.80
0
Normalized Strain
Nor
mal
ized
Str
ess
0.00
10.00
20.00
30.00
40.00
50.00
60.00
0.00
0
0.00
1
0.00
2
0.00
3
0.00
4
0.00
5
0.00
6
0.00
7
Strain
Stre
ss (N
/mm
²)
Fi = 0.225
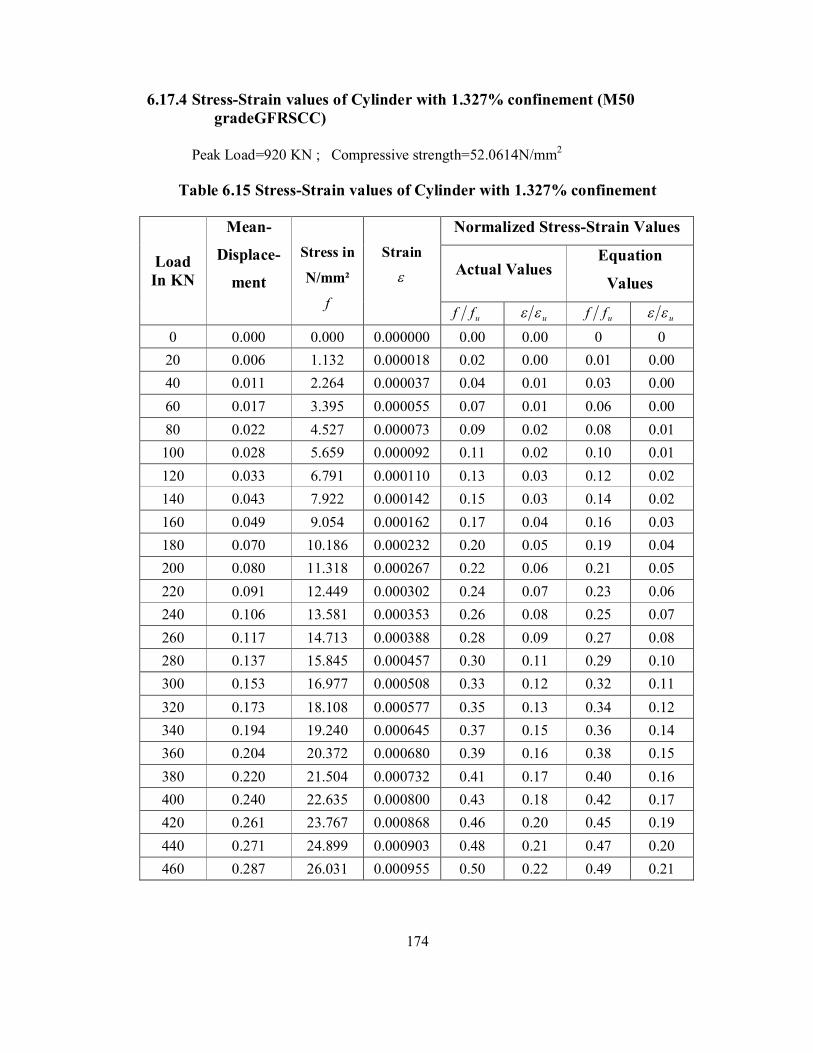
6.17.4 Stress-Strain values of Cylinder with 1.327% confinement (M50 gradeGFRSCC)
Peak Load=920 KN ; Compressive strength=52.0614N/mm2
Table 6.15 Stress-Strain values of Cylinder with 1.327% confinement
Normalized Stress-Strain Values
Actual Values Equation
Values Load In KN
Mean-
Displace-
ment
Stress in
N/mm²
f
Strain
uff u uff u 0 0.000 0.000 0.000000 0.00 0.00 0 0
20 0.006 1.132 0.000018 0.02 0.00 0.01 0.00 40 0.011 2.264 0.000037 0.04 0.01 0.03 0.00 60 0.017 3.395 0.000055 0.07 0.01 0.06 0.00 80 0.022 4.527 0.000073 0.09 0.02 0.08 0.01 100 0.028 5.659 0.000092 0.11 0.02 0.10 0.01 120 0.033 6.791 0.000110 0.13 0.03 0.12 0.02 140 0.043 7.922 0.000142 0.15 0.03 0.14 0.02 160 0.049 9.054 0.000162 0.17 0.04 0.16 0.03 180 0.070 10.186 0.000232 0.20 0.05 0.19 0.04 200 0.080 11.318 0.000267 0.22 0.06 0.21 0.05 220 0.091 12.449 0.000302 0.24 0.07 0.23 0.06 240 0.106 13.581 0.000353 0.26 0.08 0.25 0.07 260 0.117 14.713 0.000388 0.28 0.09 0.27 0.08 280 0.137 15.845 0.000457 0.30 0.11 0.29 0.10 300 0.153 16.977 0.000508 0.33 0.12 0.32 0.11 320 0.173 18.108 0.000577 0.35 0.13 0.34 0.12 340 0.194 19.240 0.000645 0.37 0.15 0.36 0.14 360 0.204 20.372 0.000680 0.39 0.16 0.38 0.15 380 0.220 21.504 0.000732 0.41 0.17 0.40 0.16 400 0.240 22.635 0.000800 0.43 0.18 0.42 0.17 420 0.261 23.767 0.000868 0.46 0.20 0.45 0.19 440 0.271 24.899 0.000903 0.48 0.21 0.47 0.20 460 0.287 26.031 0.000955 0.50 0.22 0.49 0.21
174
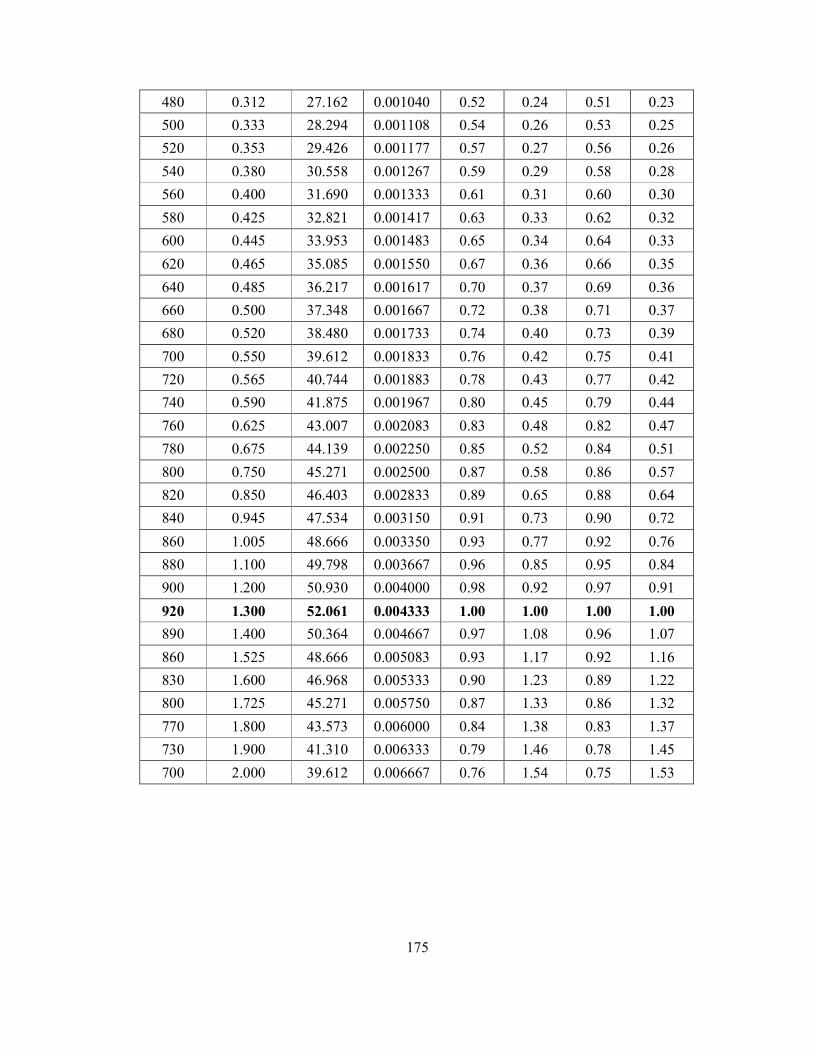
480 0.312 27.162 0.001040 0.52 0.24 0.51 0.23 500 0.333 28.294 0.001108 0.54 0.26 0.53 0.25 520 0.353 29.426 0.001177 0.57 0.27 0.56 0.26 540 0.380 30.558 0.001267 0.59 0.29 0.58 0.28 560 0.400 31.690 0.001333 0.61 0.31 0.60 0.30 580 0.425 32.821 0.001417 0.63 0.33 0.62 0.32 600 0.445 33.953 0.001483 0.65 0.34 0.64 0.33 620 0.465 35.085 0.001550 0.67 0.36 0.66 0.35 640 0.485 36.217 0.001617 0.70 0.37 0.69 0.36 660 0.500 37.348 0.001667 0.72 0.38 0.71 0.37 680 0.520 38.480 0.001733 0.74 0.40 0.73 0.39 700 0.550 39.612 0.001833 0.76 0.42 0.75 0.41 720 0.565 40.744 0.001883 0.78 0.43 0.77 0.42 740 0.590 41.875 0.001967 0.80 0.45 0.79 0.44 760 0.625 43.007 0.002083 0.83 0.48 0.82 0.47 780 0.675 44.139 0.002250 0.85 0.52 0.84 0.51 800 0.750 45.271 0.002500 0.87 0.58 0.86 0.57 820 0.850 46.403 0.002833 0.89 0.65 0.88 0.64 840 0.945 47.534 0.003150 0.91 0.73 0.90 0.72 860 1.005 48.666 0.003350 0.93 0.77 0.92 0.76 880 1.100 49.798 0.003667 0.96 0.85 0.95 0.84 900 1.200 50.930 0.004000 0.98 0.92 0.97 0.91 920 1.300 52.061 0.004333 1.00 1.00 1.00 1.00 890 1.400 50.364 0.004667 0.97 1.08 0.96 1.07 860 1.525 48.666 0.005083 0.93 1.17 0.92 1.16 830 1.600 46.968 0.005333 0.90 1.23 0.89 1.22 800 1.725 45.271 0.005750 0.87 1.33 0.86 1.32 770 1.800 43.573 0.006000 0.84 1.38 0.83 1.37 730 1.900 41.310 0.006333 0.79 1.46 0.78 1.45 700 2.000 39.612 0.006667 0.76 1.54 0.75 1.53
175
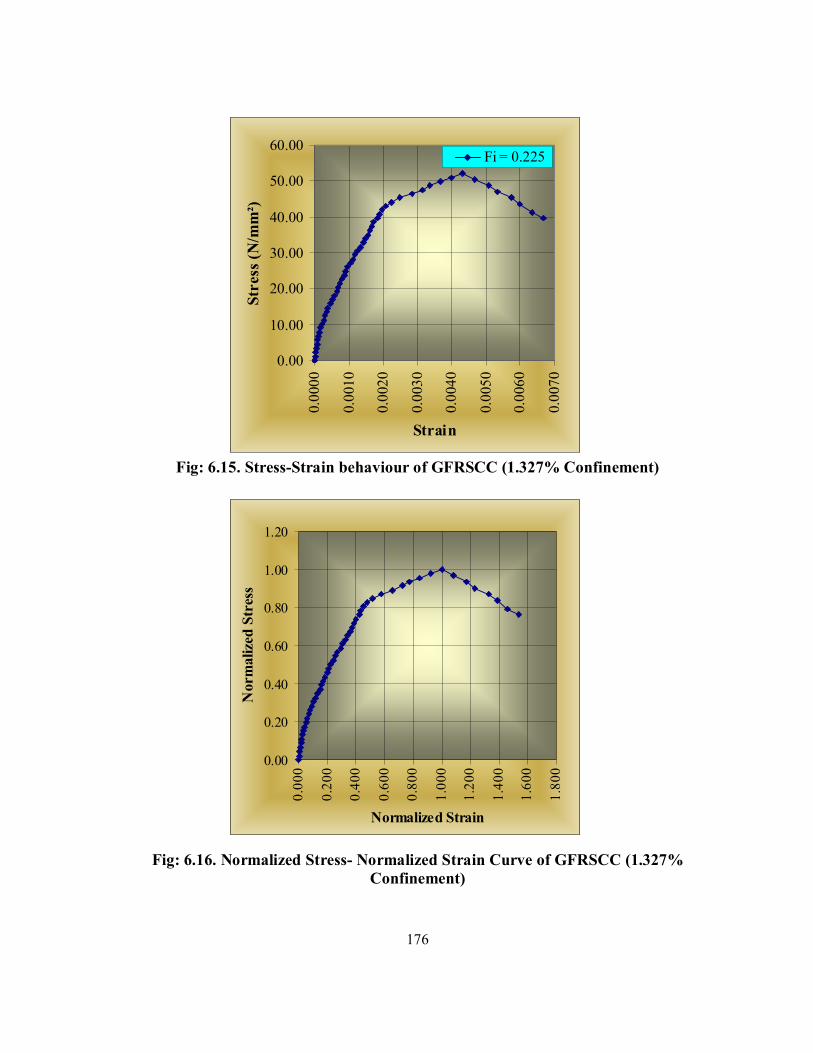
Fig: 6.15. Stress-Strain behaviour of GFRSCC (1.327% Confinement)
Fig: 6.16. Normalized Stress- Normalized Strain Curve of GFRSCC (1.327% Confinement)
176
0.00
0.20
0.40
0.60
0.80
1.00
1.20
0.00
0
0.20
0
0.40
0
0.60
0
0.80
0
1.00
0
1.20
0
1.40
0
1.60
0
1.80
0
Normalized Strain
Nor
mal
ized
Str
ess
0.00
10.00
20.00
30.00
40.00
50.00
60.00
0.00
00
0.00
10
0.00
20
0.00
30
0.00
40
0.00
50
0.00
60
0.00
70
Strain
Stre
ss (N
/mm
²)
Fi = 0.225
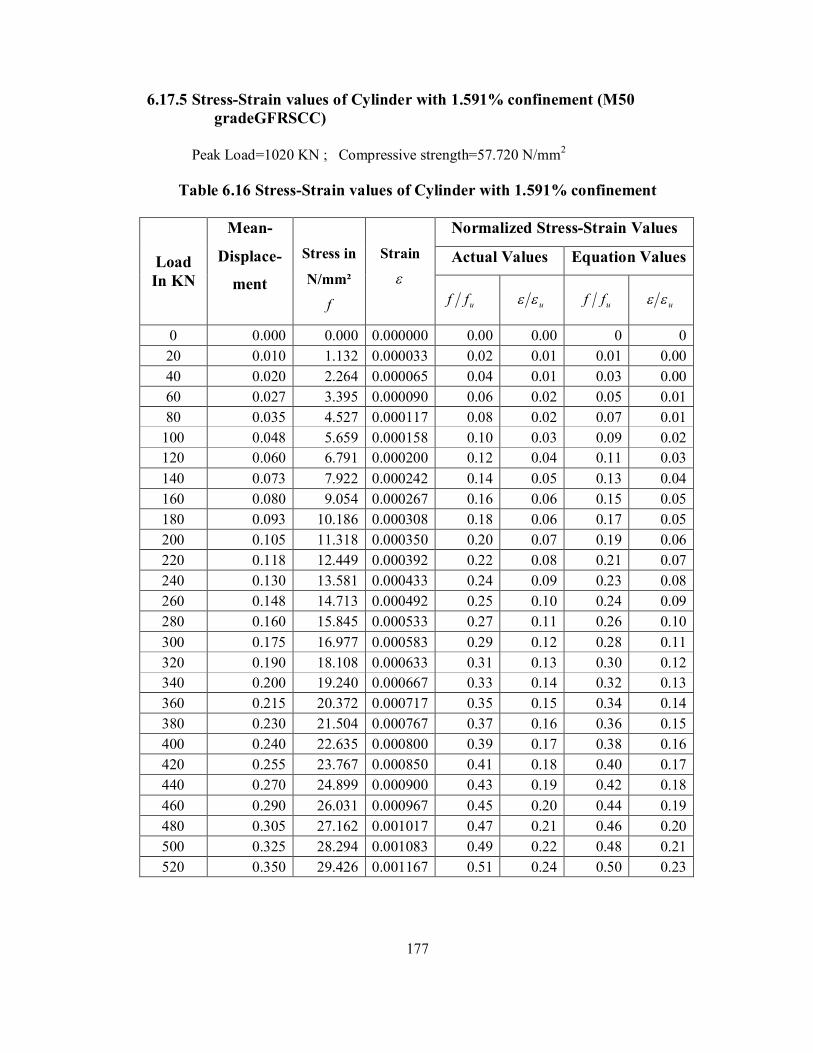
6.17.5 Stress-Strain values of Cylinder with 1.591% confinement (M50 gradeGFRSCC)
Peak Load=1020 KN ; Compressive strength=57.720 N/mm2
Table 6.16 Stress-Strain values of Cylinder with 1.591% confinement
Normalized Stress-Strain Values
Actual Values Equation Values Load In KN
Mean-
Displace-
ment
Stress in
N/mm²
f
Strain
uff u uff u
0 0.000 0.000 0.000000 0.00 0.00 0 0 20 0.010 1.132 0.000033 0.02 0.01 0.01 0.00 40 0.020 2.264 0.000065 0.04 0.01 0.03 0.00 60 0.027 3.395 0.000090 0.06 0.02 0.05 0.01 80 0.035 4.527 0.000117 0.08 0.02 0.07 0.01
100 0.048 5.659 0.000158 0.10 0.03 0.09 0.02 120 0.060 6.791 0.000200 0.12 0.04 0.11 0.03 140 0.073 7.922 0.000242 0.14 0.05 0.13 0.04 160 0.080 9.054 0.000267 0.16 0.06 0.15 0.05 180 0.093 10.186 0.000308 0.18 0.06 0.17 0.05 200 0.105 11.318 0.000350 0.20 0.07 0.19 0.06 220 0.118 12.449 0.000392 0.22 0.08 0.21 0.07 240 0.130 13.581 0.000433 0.24 0.09 0.23 0.08 260 0.148 14.713 0.000492 0.25 0.10 0.24 0.09 280 0.160 15.845 0.000533 0.27 0.11 0.26 0.10 300 0.175 16.977 0.000583 0.29 0.12 0.28 0.11 320 0.190 18.108 0.000633 0.31 0.13 0.30 0.12 340 0.200 19.240 0.000667 0.33 0.14 0.32 0.13 360 0.215 20.372 0.000717 0.35 0.15 0.34 0.14 380 0.230 21.504 0.000767 0.37 0.16 0.36 0.15 400 0.240 22.635 0.000800 0.39 0.17 0.38 0.16 420 0.255 23.767 0.000850 0.41 0.18 0.40 0.17 440 0.270 24.899 0.000900 0.43 0.19 0.42 0.18 460 0.290 26.031 0.000967 0.45 0.20 0.44 0.19 480 0.305 27.162 0.001017 0.47 0.21 0.46 0.20 500 0.325 28.294 0.001083 0.49 0.22 0.48 0.21 520 0.350 29.426 0.001167 0.51 0.24 0.50 0.23
177
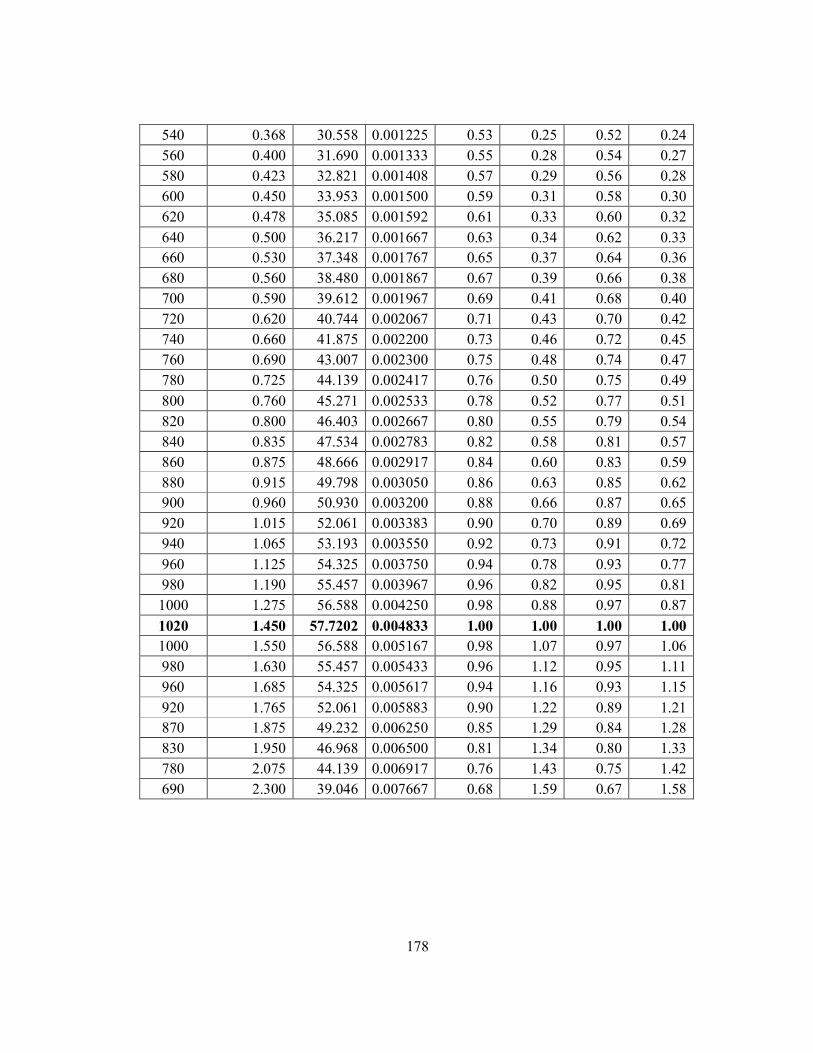
540 0.368 30.558 0.001225 0.53 0.25 0.52 0.24 560 0.400 31.690 0.001333 0.55 0.28 0.54 0.27 580 0.423 32.821 0.001408 0.57 0.29 0.56 0.28 600 0.450 33.953 0.001500 0.59 0.31 0.58 0.30 620 0.478 35.085 0.001592 0.61 0.33 0.60 0.32 640 0.500 36.217 0.001667 0.63 0.34 0.62 0.33 660 0.530 37.348 0.001767 0.65 0.37 0.64 0.36 680 0.560 38.480 0.001867 0.67 0.39 0.66 0.38 700 0.590 39.612 0.001967 0.69 0.41 0.68 0.40 720 0.620 40.744 0.002067 0.71 0.43 0.70 0.42 740 0.660 41.875 0.002200 0.73 0.46 0.72 0.45 760 0.690 43.007 0.002300 0.75 0.48 0.74 0.47 780 0.725 44.139 0.002417 0.76 0.50 0.75 0.49 800 0.760 45.271 0.002533 0.78 0.52 0.77 0.51 820 0.800 46.403 0.002667 0.80 0.55 0.79 0.54 840 0.835 47.534 0.002783 0.82 0.58 0.81 0.57 860 0.875 48.666 0.002917 0.84 0.60 0.83 0.59 880 0.915 49.798 0.003050 0.86 0.63 0.85 0.62 900 0.960 50.930 0.003200 0.88 0.66 0.87 0.65 920 1.015 52.061 0.003383 0.90 0.70 0.89 0.69 940 1.065 53.193 0.003550 0.92 0.73 0.91 0.72 960 1.125 54.325 0.003750 0.94 0.78 0.93 0.77 980 1.190 55.457 0.003967 0.96 0.82 0.95 0.81 1000 1.275 56.588 0.004250 0.98 0.88 0.97 0.87 1020 1.450 57.7202 0.004833 1.00 1.00 1.00 1.00 1000 1.550 56.588 0.005167 0.98 1.07 0.97 1.06 980 1.630 55.457 0.005433 0.96 1.12 0.95 1.11 960 1.685 54.325 0.005617 0.94 1.16 0.93 1.15 920 1.765 52.061 0.005883 0.90 1.22 0.89 1.21 870 1.875 49.232 0.006250 0.85 1.29 0.84 1.28 830 1.950 46.968 0.006500 0.81 1.34 0.80 1.33 780 2.075 44.139 0.006917 0.76 1.43 0.75 1.42 690 2.300 39.046 0.007667 0.68 1.59 0.67 1.58
178
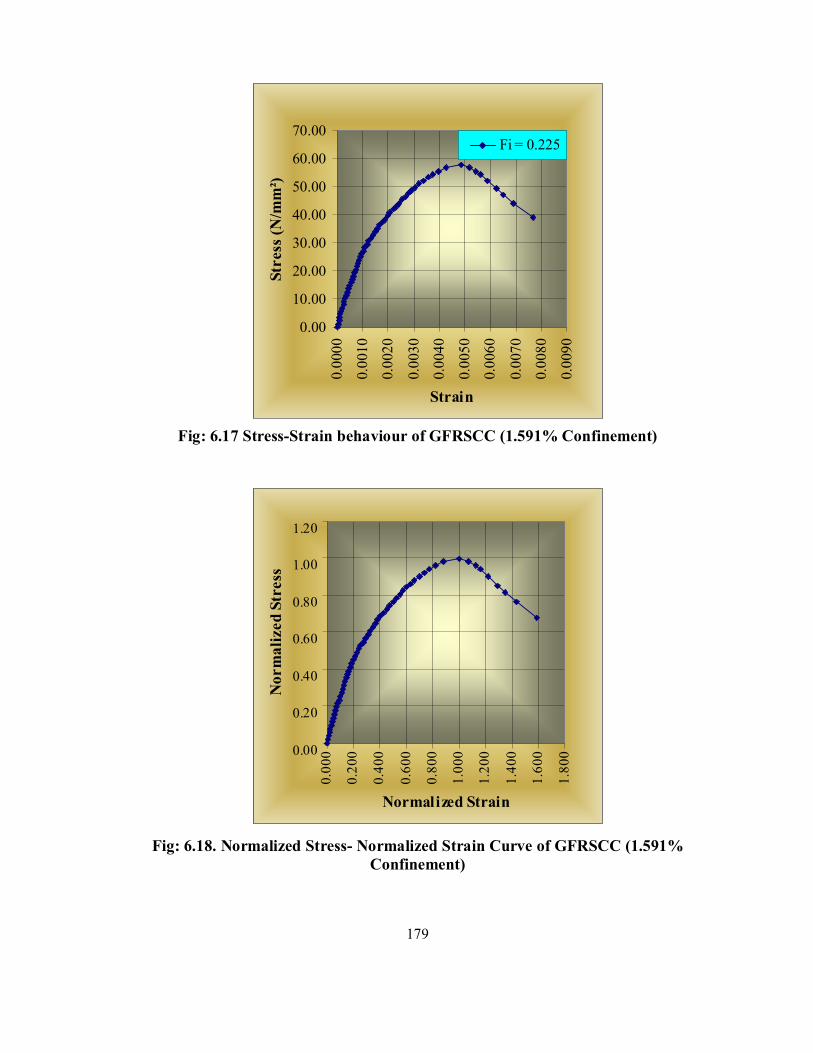
Fig: 6.17 Stress-Strain behaviour of GFRSCC (1.591% Confinement)
Fig: 6.18. Normalized Stress- Normalized Strain Curve of GFRSCC (1.591% Confinement)
179
0.00
0.20
0.40
0.60
0.80
1.00
1.20
0.00
0
0.20
0
0.40
0
0.60
0
0.80
0
1.00
0
1.20
0
1.40
0
1.60
0
1.80
0
Normalized Strain
Nor
mal
ized
Str
ess
0.00
10.00
20.00
30.00
40.00
50.00
60.00
70.00
0.00
00
0.00
10
0.00
20
0.00
30
0.00
40
0.00
50
0.00
60
0.00
70
0.00
80
0.00
90
Strain
Stre
ss (N
/mm
²)
Fi = 0.225

Table 6.17. Peak stress and strain values corresponding to peak Stress with different confinements of M50 grade
Sl. No Designation Confinement Peak stress N/mm2
Improvement in
compressive strength (%)
Strain at peak stress
1 GFSCC p 0 43.0072 7.52 0.00279
2 GFRSCC (3R) 0.798 46.4025 16.00 0.00293
3 GFRSCC (4R) 1.062 49.798 24.50 0.00367
4 GFRSCC (5R) 1.327 52.0614 30.15 0.00433
5 GFRSCC (6R) 1.591 57.7202 44.30 0.00483
Fig 6.19 % of Different Confinements Vs % of Improvement of Compressive Strength
180
0
5
10
15
20
25
30
35
40
45
50
0 0.5 1 1.5 2
% of Confinement
% o
f Im
prov
men
t of C
ompr
essi
ve S
tren
gth
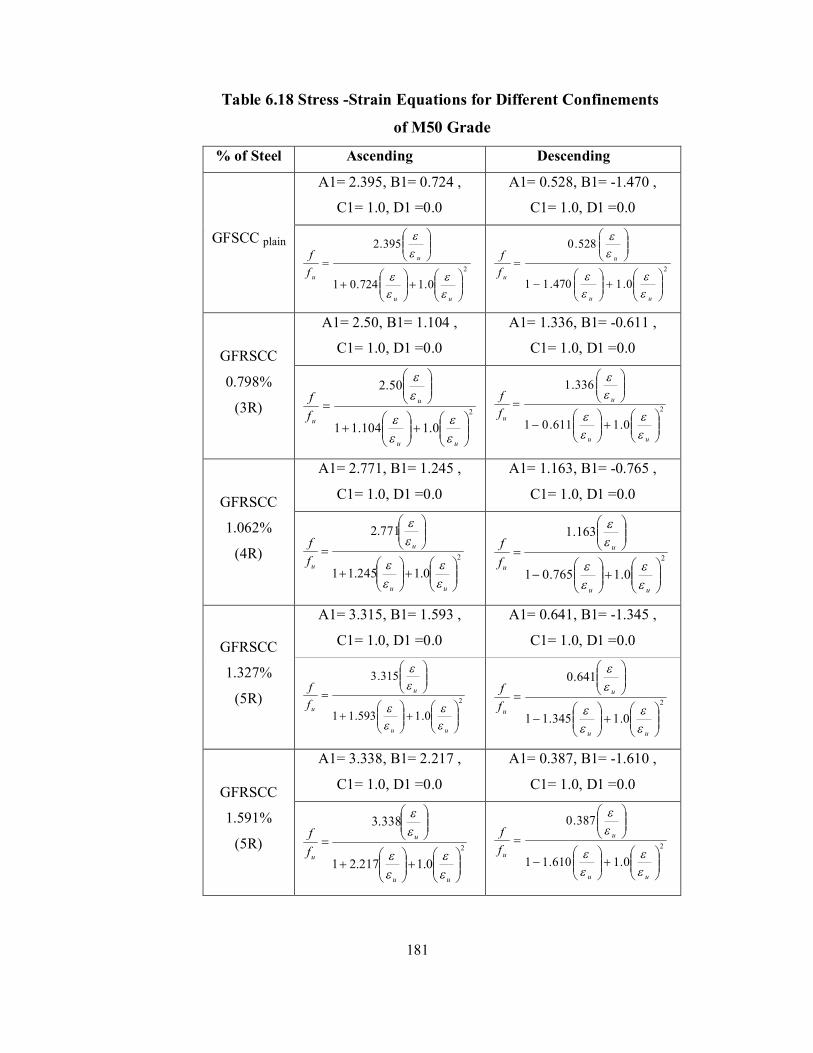
Table 6.18 Stress -Strain Equations for Different Confinements
of M50 Grade
% of Steel Ascending Descending
A1= 2.395, B1= 0.724 ,
C1= 1.0, D1 =0.0
A1= 0.528, B1= -1.470 ,
C1= 1.0, D1 =0.0
GFSCC plain
2
0.1724.01
395.2
uu
u
uff
2
0.1470.11
528.0
uu
u
uff
A1= 2.50, B1= 1.104 ,
C1= 1.0, D1 =0.0
A1= 1.336, B1= -0.611 ,
C1= 1.0, D1 =0.0 GFRSCC
0.798%
(3R) 2
0.1104.11
50.2
uu
u
uff
2
0.1611.01
336.1
uu
u
uff
A1= 2.771, B1= 1.245 ,
C1= 1.0, D1 =0.0
A1= 1.163, B1= -0.765 ,
C1= 1.0, D1 =0.0 GFRSCC
1.062%
(4R) 2
0.1245.11
771.2
uu
u
uff
2
0.1765.01
163.1
uu
u
uff
A1= 3.315, B1= 1.593 ,
C1= 1.0, D1 =0.0
A1= 0.641, B1= -1.345 ,
C1= 1.0, D1 =0.0 GFRSCC
1.327%
(5R) 2
0.1593.11
315.3
uu
u
uff
2
0.1345.11
641.0
uu
u
uff
A1= 3.338, B1= 2.217 ,
C1= 1.0, D1 =0.0
A1= 0.387, B1= -1.610 ,
C1= 1.0, D1 =0.0 GFRSCC
1.591%
(5R) 2
0.1217.21
338.3
uu
u
uff
2
0.1610.11
387.0
uu
u
uff
181

CHAPTER 7
Discussions of the Test Results
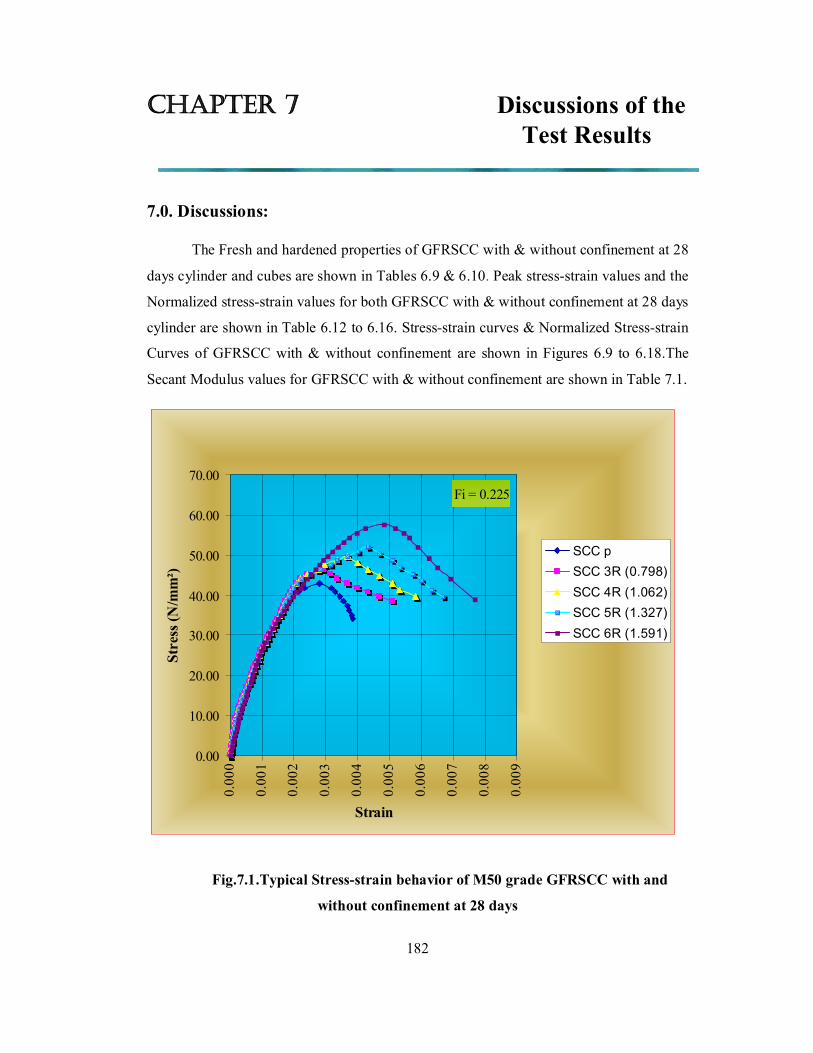
CHAPTER 7 Discussions of the Test Results
7.0. Discussions:
The Fresh and hardened properties of GFRSCC with & without confinement at 28
days cylinder and cubes are shown in Tables 6.9 & 6.10. Peak stress-strain values and the
Normalized stress-strain values for both GFRSCC with & without confinement at 28 days
cylinder are shown in Table 6.12 to 6.16. Stress-strain curves & Normalized Stress-strain
Curves of GFRSCC with & without confinement are shown in Figures 6.9 to 6.18.The
Secant Modulus values for GFRSCC with & without confinement are shown in Table 7.1.
Fig.7.1.Typical Stress-strain behavior of M50 grade GFRSCC with and
without confinement at 28 days
182
Fi = 0.225
0.00
10.00
20.00
30.00
40.00
50.00
60.00
70.00
0.00
0
0.00
1
0.00
2
0.00
3
0.00
4
0.00
5
0.00
6
0.00
7
0.00
8
0.00
9
Strain
Stre
ss (N
/mm
²)
SCC pSCC 3R (0.798)SCC 4R (1.062)SCC 5R (1.327)SCC 6R (1.591)
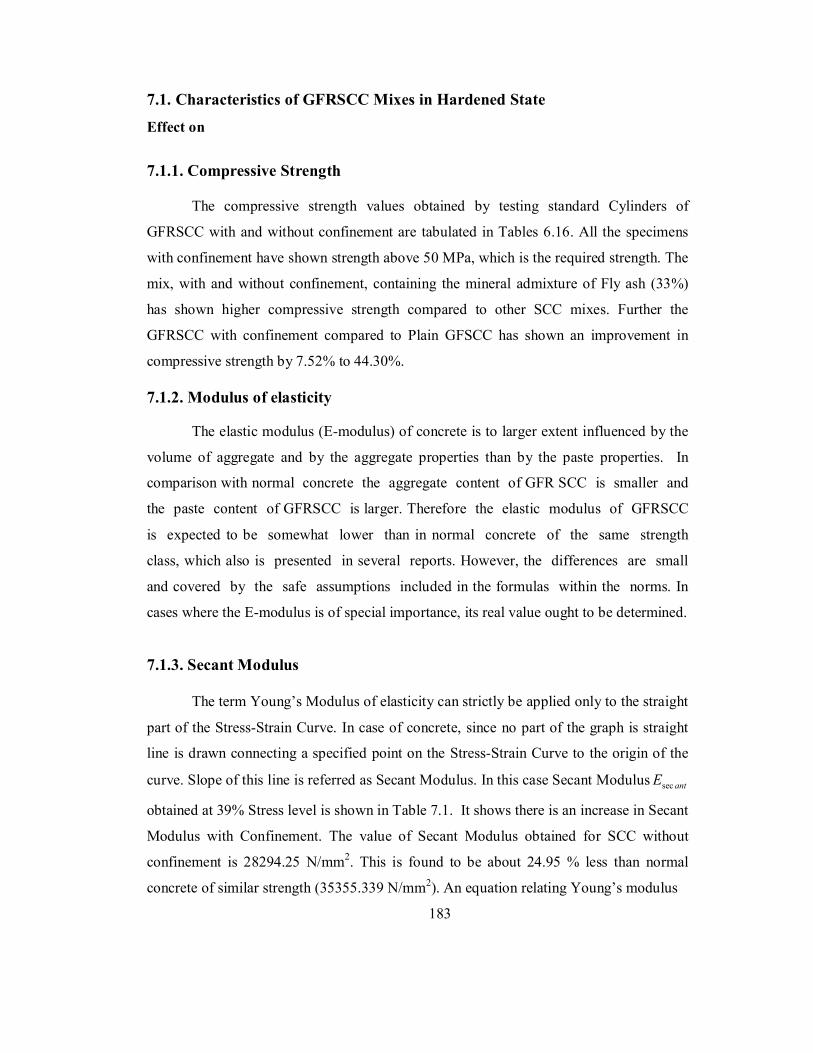
7.1. Characteristics of GFRSCC Mixes in Hardened State
Effect on
7.1.1. Compressive Strength
The compressive strength values obtained by testing standard Cylinders of
GFRSCC with and without confinement are tabulated in Tables 6.16. All the specimens
with confinement have shown strength above 50 MPa, which is the required strength. The
mix, with and without confinement, containing the mineral admixture of Fly ash (33%)
has shown higher compressive strength compared to other SCC mixes. Further the
GFRSCC with confinement compared to Plain GFSCC has shown an improvement in
compressive strength by 7.52% to 44.30%.
7.1.2. Modulus of elasticity The elastic modulus (E-modulus) of concrete is to larger extent influenced by the
volume of aggregate and by the aggregate properties than by the paste properties. In
comparison with normal concrete the aggregate content of GFR SCC is smaller and
the paste content of GFRSCC is larger. Therefore the elastic modulus of GFRSCC
is expected to be somewhat lower than in normal concrete of the same strength
class, which also is presented in several reports. However, the differences are small
and covered by the safe assumptions included in the formulas within the norms. In
cases where the E-modulus is of special importance, its real value ought to be determined.
7.1.3. Secant Modulus
The term Young’s Modulus of elasticity can strictly be applied only to the straight
part of the Stress-Strain Curve. In case of concrete, since no part of the graph is straight
line is drawn connecting a specified point on the Stress-Strain Curve to the origin of the
curve. Slope of this line is referred as Secant Modulus. In this case Secant Modulus antEsec
obtained at 39% Stress level is shown in Table 7.1. It shows there is an increase in Secant
Modulus with Confinement. The value of Secant Modulus obtained for SCC without
confinement is 28294.25 N/mm2. This is found to be about 24.95 % less than normal
concrete of similar strength (35355.339 N/mm2). An equation relating Young’s modulus
183
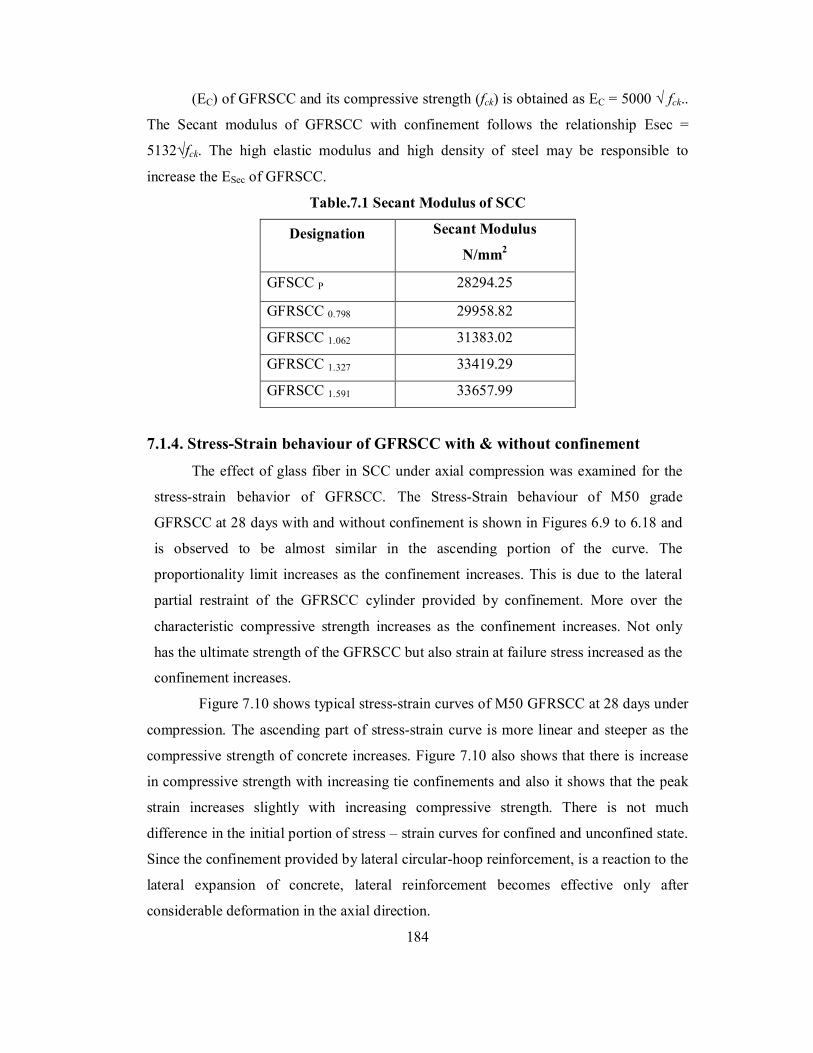
(EC) of GFRSCC and its compressive strength (fck) is obtained as EC = 5000 √ fck..
The Secant modulus of GFRSCC with confinement follows the relationship Esec =
5132√fck. The high elastic modulus and high density of steel may be responsible to
increase the ESec of GFRSCC.
Table.7.1 Secant Modulus of SCC
Designation Secant Modulus
N/mm2
GFSCC P 28294.25
GFRSCC 0.798 29958.82
GFRSCC 1.062 31383.02
GFRSCC 1.327 33419.29
GFRSCC 1.591 33657.99
7.1.4. Stress-Strain behaviour of GFRSCC with & without confinement The effect of glass fiber in SCC under axial compression was examined for the
stress-strain behavior of GFRSCC. The Stress-Strain behaviour of M50 grade
GFRSCC at 28 days with and without confinement is shown in Figures 6.9 to 6.18 and
is observed to be almost similar in the ascending portion of the curve. The
proportionality limit increases as the confinement increases. This is due to the lateral
partial restraint of the GFRSCC cylinder provided by confinement. More over the
characteristic compressive strength increases as the confinement increases. Not only
has the ultimate strength of the GFRSCC but also strain at failure stress increased as the
confinement increases.
Figure 7.10 shows typical stress-strain curves of M50 GFRSCC at 28 days under
compression. The ascending part of stress-strain curve is more linear and steeper as the
compressive strength of concrete increases. Figure 7.10 also shows that there is increase
in compressive strength with increasing tie confinements and also it shows that the peak
strain increases slightly with increasing compressive strength. There is not much
difference in the initial portion of stress – strain curves for confined and unconfined state.
Since the confinement provided by lateral circular-hoop reinforcement, is a reaction to the
lateral expansion of concrete, lateral reinforcement becomes effective only after
considerable deformation in the axial direction.
184
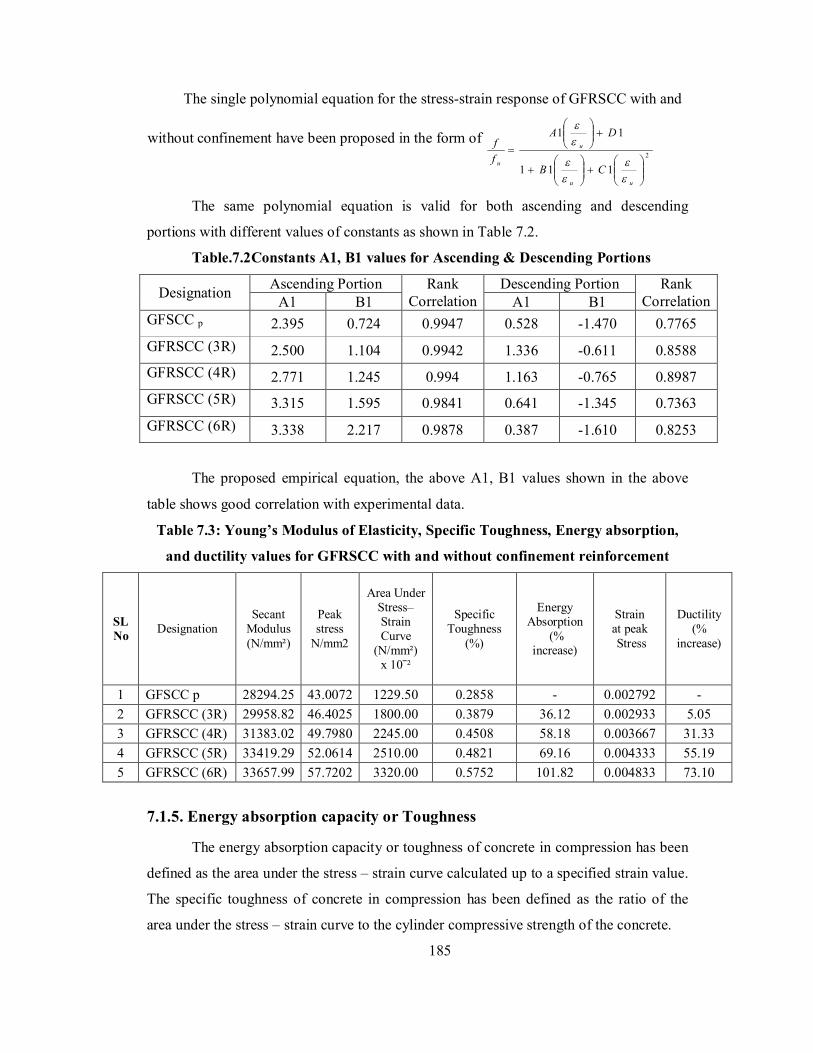
The single polynomial equation for the stress-strain response of GFRSCC with and
without confinement have been proposed in the form of 2
111
11
uu
u
uCB
DA
ff
The same polynomial equation is valid for both ascending and descending
portions with different values of constants as shown in Table 7.2.
Table.7.2Constants A1, B1 values for Ascending & Descending Portions
Ascending Portion Descending Portion Designation A1 B1 Rank
Correlation A1 B1 Rank
Correlation GFSCC p 2.395 0.724 0.9947 0.528 -1.470 0.7765 GFRSCC (3R) 2.500 1.104 0.9942 1.336 -0.611 0.8588 GFRSCC (4R) 2.771 1.245 0.994 1.163 -0.765 0.8987 GFRSCC (5R) 3.315 1.595 0.9841 0.641 -1.345 0.7363 GFRSCC (6R) 3.338 2.217 0.9878 0.387 -1.610 0.8253
The proposed empirical equation, the above A1, B1 values shown in the above
table shows good correlation with experimental data.
Table 7.3: Young’s Modulus of Elasticity, Specific Toughness, Energy absorption,
and ductility values for GFRSCC with and without confinement reinforcement
7.1.5. Energy absorption capacity or Toughness
The energy absorption capacity or toughness of concrete in compression has been
defined as the area under the stress – strain curve calculated up to a specified strain value.
The specific toughness of concrete in compression has been defined as the ratio of the
area under the stress – strain curve to the cylinder compressive strength of the concrete.
185
SL No Designation
Secant Modulus (N/mm²)
Peak stress
N/mm2
Area Under Stress– Strain Curve
(N/mm²) x 10ˉ²
Specific Toughness
(%)
Energy Absorption
(% increase)
Strain at peak Stress
Ductility (%
increase)
1 GFSCC p 28294.25 43.0072 1229.50 0.2858 - 0.002792 - 2 GFRSCC (3R) 29958.82 46.4025 1800.00 0.3879 36.12 0.002933 5.05 3 GFRSCC (4R) 31383.02 49.7980 2245.00 0.4508 58.18 0.003667 31.33 4 GFRSCC (5R) 33419.29 52.0614 2510.00 0.4821 69.16 0.004333 55.19 5 GFRSCC (6R) 33657.99 57.7202 3320.00 0.5752 101.82 0.004833 73.10
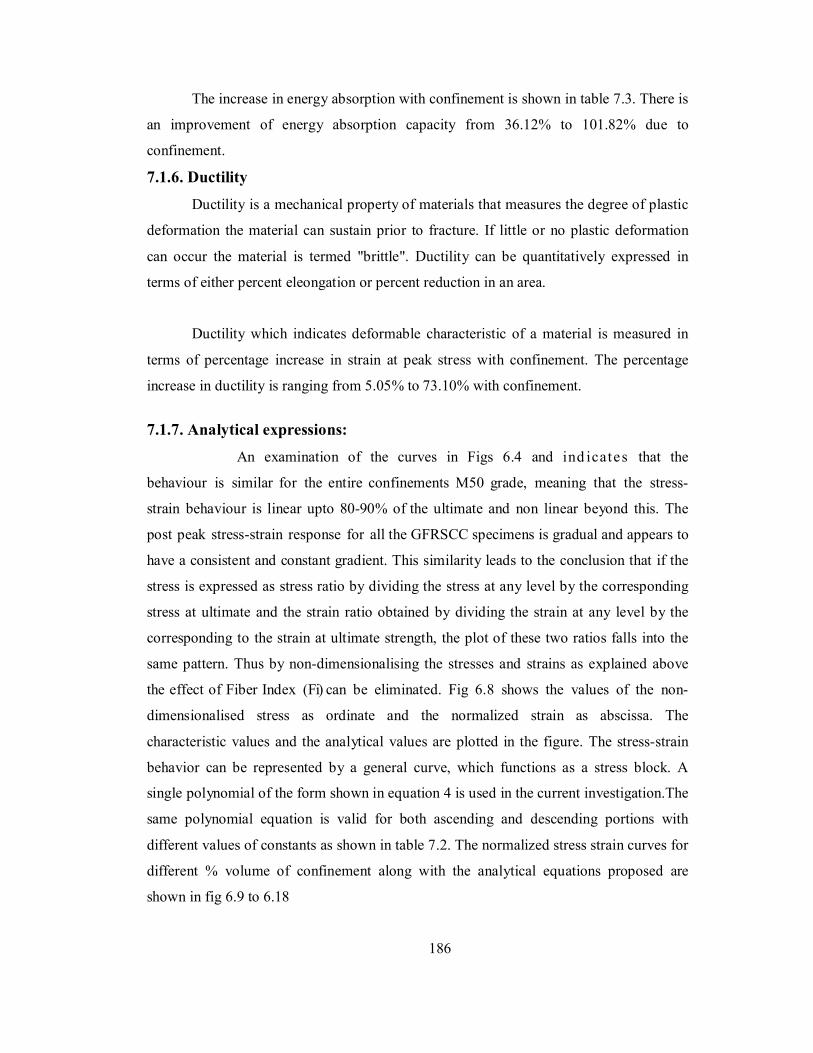
The increase in energy absorption with confinement is shown in table 7.3. There is
an improvement of energy absorption capacity from 36.12% to 101.82% due to
confinement.
7.1.6. Ductility
Ductility is a mechanical property of materials that measures the degree of plastic
deformation the material can sustain prior to fracture. If little or no plastic deformation
can occur the material is termed "brittle". Ductility can be quantitatively expressed in
terms of either percent eleongation or percent reduction in an area.
Ductility which indicates deformable characteristic of a material is measured in
terms of percentage increase in strain at peak stress with confinement. The percentage
increase in ductility is ranging from 5.05% to 73.10% with confinement.
7.1.7. Analytical expressions:
An examination of the curves in Figs 6.4 and ind icates that the
behaviour is similar for the entire confinements M50 grade, meaning that the stress-
strain behaviour is linear upto 80-90% of the ultimate and non linear beyond this. The
post peak stress-strain response for all the GFRSCC specimens is gradual and appears to
have a consistent and constant gradient. This similarity leads to the conclusion that if the
stress is expressed as stress ratio by dividing the stress at any level by the corresponding
stress at ultimate and the strain ratio obtained by dividing the strain at any level by the
corresponding to the strain at ultimate strength, the plot of these two ratios falls into the
same pattern. Thus by non-dimensionalising the stresses and strains as explained above
the effect of Fiber Index (Fi) can be eliminated. Fig 6.8 shows the values of the non-
dimensionalised stress as ordinate and the normalized strain as abscissa. The
characteristic values and the analytical values are plotted in the figure. The stress-strain
behavior can be represented by a general curve, which functions as a stress block. A
single polynomial of the form shown in equation 4 is used in the current investigation.The
same polynomial equation is valid for both ascending and descending portions with
different values of constants as shown in table 7.2. The normalized stress strain curves for
different % volume of confinement along with the analytical equations proposed are
shown in fig 6.9 to 6.18
186
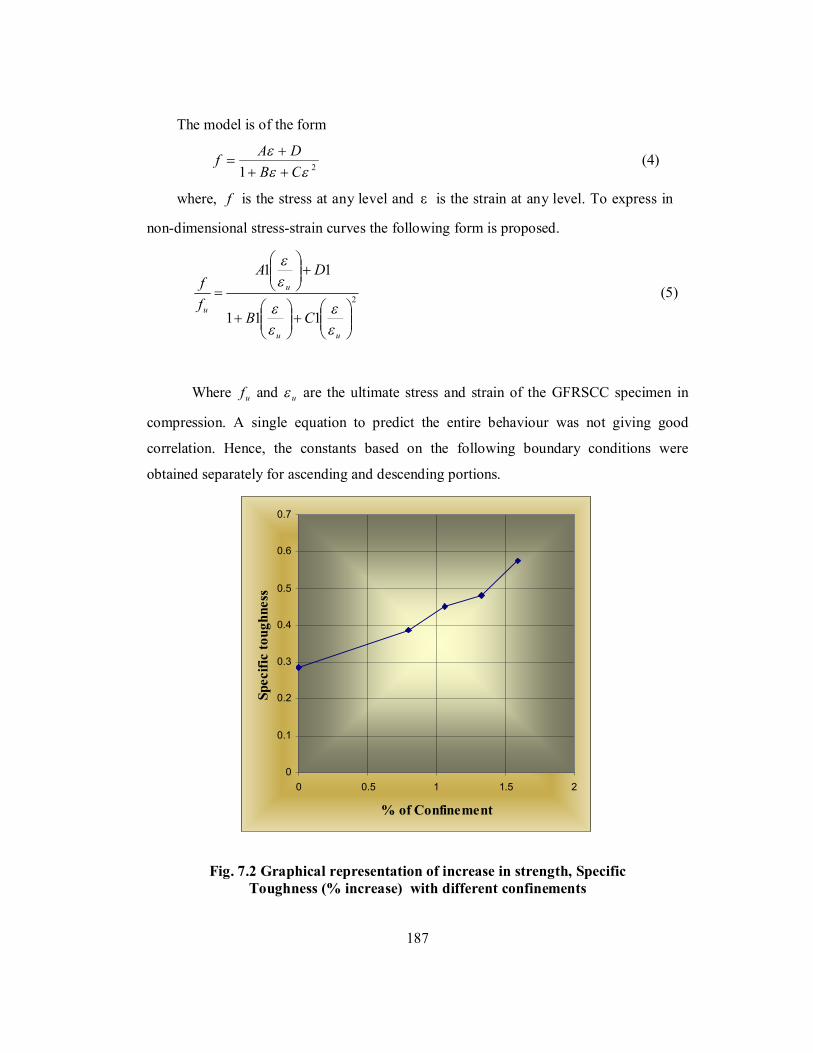
The model is of the form
21
CBDAf
(4)
where, f is the stress at any level and ε is the strain at any level. To express in
non-dimensional stress-strain curves the following form is proposed.
2
111
11
uu
u
uCB
DA
ff
(5)
Where uf and u are the ultimate stress and strain of the GFRSCC specimen in
compression. A single equation to predict the entire behaviour was not giving good
correlation. Hence, the constants based on the following boundary conditions were
obtained separately for ascending and descending portions.
Fig. 7.2 Graphical representation of increase in strength, Specific Toughness (% increase) with different confinements
187
0
0.1
0.2
0.3
0.4
0.5
0.6
0.7
0 0.5 1 1.5 2
% of Confinement
Spec
ific
toug
hnes
s

Fig. 7.3 Graphical representation of increase in strength, Energy Absorption (% increase) with different confinements
Fig. 7.4 Graphical representation of increase in strength, ductility (% increase) with different confinements
188
0
20
40
60
80
100
120
0 0.5 1 1.5 2
% of Confinement
Ener
gy A
bsor
ptio
n (%
incr
ease
)
0
10
20
30
40
50
60
70
80
0 0.5 1 1.5 2
% Confinement
Duc
tility
(%in
crea
se)

CHAPTER 8
Conclusions and Recommendations
CHAPTER 8 Conclusions and Recommendations
8.0. Conclusions
Taking into account the findings from this study, The GFRSCC mix developed
and satisfied the requirements of Self-compacting concrete specified by EFNARC
guidelines. The properties like Modulus of Elasticity (Ec), Energy absorption capacity,
Ductility and Stress-Strain behaviour were studied and the following conclusions can be
drawn:
It has been verified, by using the slump flow and U-tube tests, that self-
compacting concrete (SCC) achieved consistency and self-compactability under its own
weight, without any external vibration or compaction. Also, because of the special
admixtures used, SCC has achieved a density between 2400 and 2500 kg/m³, which was
greater than that of normal concrete, 2370-2321 kg/m³.
Self-compacting concrete can be obtained in such a way, by adding chemical and
mineral admixtures, so that its compressive strengths are higher than those of normal
vibrated concrete. An average increase in compressive strength of 60% has been obtained
for SCC.
Also, due to the use of chemical and mineral admixtures, self-compacting
concrete has shown smaller interface microcracks than normal concrete, fact which led to
a better bonding between aggregate and cement paste and to an increase in compressive
strengths. A measure of the better bonding was the greater percentage of the fractured
aggregate in SCC (20-25%) compared to the 10% for normal concrete
In addition, self-compacting concrete has two big advantages. One relates to the
construction time, which in most of the cases is shorter than the time when normal
concrete is used, due to the fact that no time is wasted with the compaction through
vibration. The second advantage is related to the placing. As long as SCC does not
require compaction, it can be considered environmentally friendly, because if no vibration
is applied no noise is made.
189
'
In the high strength concrete which is more brittler than ordinary concrete, using
confinement reinforcement, ductility is increased to a great extent. When confinement
reinforcement spacing is decreased to half, ductility improved twice. As a result, by
decreasing confinement reinforcement spacing, the compressive strength of high strength
concrete can be improved. Decreasing confinement reinforcement spacing has increased
the compressive strength of confined concrete to a maximum of 19%.
Based on experimental study on Glass Fiber Reinforced Self Compacting
Concrete (GFRSCC) the following conclusions can be drawn.
1. Self Compacting Concretes satisfying the specifications laid by EFNARC could
be developed for non fibrous and fibrous concretes. There is a marginal increase in
compressive strength of self compacting concrete with glass fiber additions.
2. Glass Fiber inclusion in Self Compacting Concrete improved the peak strain and
strain at 85% of the ultimate strength in descending portion. The improvements in
strains are pronounced than improvement in strength.
3. The ultimate compressive strength varied linearly with Fiber Index and can be
expressed by a relationship that includes the Fiber Index. The prediction equation for
ultimate strength is
fu=f {(1.0+0.1074Fi)}
4 .The strain at peak stress varies linearly with Fiber Index and can be expressed by a
relationship that includes Fiber Index. The equation obtained by regression
analysis is
εu = ε’ {(1.0+0.1074Fi)}
190
5. The ductility factor (DF) of standard concrete given by the ratio of the strain at
85% of the peak stress on the descending portion of the stress strain curve has
improved with specific surface factor.
DF = 2.4577 + 2.0912 Fi
6. The experimental values compared well with analytical model developed. A non-
dimensionalised stress–strain equation proposed in this investigation can be used to
predict the behaviour of Glass Fiber Reinforced Self Compacting
Concrete(GFRSCC). The stress block parameters presented in this paper can be
used to determine the ultimate moment and corresponding curvature of GFRSCC.
7. Confinement of concrete has increased the strengths at 28 days from 7.52% to 44.30%
in compression.
8. The value of secant modulus (Ec) obtained for M50 grade SCC without confinement is
24.95% less than normal concrete of similar strength.
9. The value of secant modulus (Ec) obtained for M50 grade GFRSCC with confinement
is 2.64% more than ordinary concrete and follows the relationship Ec = 5132√ fck,
10. It observed that the peak stress and corresponding strain at peak stress increases with
the increase in the percentage of confinement.
11.The energy absorption was increased by 101.82% when the percentage of
confinement is 1.591%.
191
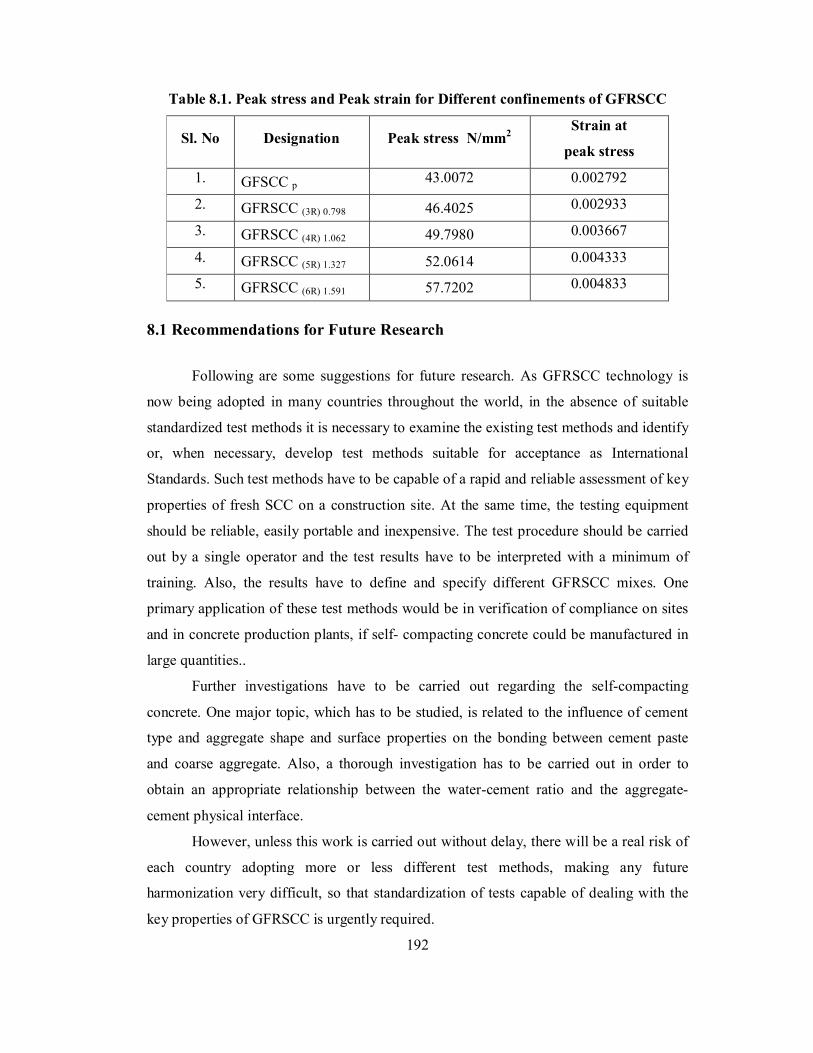
Table 8.1. Peak stress and Peak strain for Different confinements of GFRSCC
Sl. No Designation Peak stress N/mm2 Strain at
peak stress
1. GFSCC p 43.0072 0.002792
2. GFRSCC (3R) 0.798 46.4025 0.002933
3. GFRSCC (4R) 1.062 49.7980 0.003667
4. GFRSCC (5R) 1.327 52.0614 0.004333
5. GFRSCC (6R) 1.591 57.7202 0.004833
8.1 Recommendations for Future Research
Following are some suggestions for future research. As GFRSCC technology is
now being adopted in many countries throughout the world, in the absence of suitable
standardized test methods it is necessary to examine the existing test methods and identify
or, when necessary, develop test methods suitable for acceptance as International
Standards. Such test methods have to be capable of a rapid and reliable assessment of key
properties of fresh SCC on a construction site. At the same time, the testing equipment
should be reliable, easily portable and inexpensive. The test procedure should be carried
out by a single operator and the test results have to be interpreted with a minimum of
training. Also, the results have to define and specify different GFRSCC mixes. One
primary application of these test methods would be in verification of compliance on sites
and in concrete production plants, if self- compacting concrete could be manufactured in
large quantities..
Further investigations have to be carried out regarding the self-compacting
concrete. One major topic, which has to be studied, is related to the influence of cement
type and aggregate shape and surface properties on the bonding between cement paste
and coarse aggregate. Also, a thorough investigation has to be carried out in order to
obtain an appropriate relationship between the water-cement ratio and the aggregate-
cement physical interface.
However, unless this work is carried out without delay, there will be a real risk of
each country adopting more or less different test methods, making any future
harmonization very difficult, so that standardization of tests capable of dealing with the
key properties of GFRSCC is urgently required.
192

1. Though GFRSCC enhances all concrete properties by minimizing voids etc, the
long-term behavior of concrete like Creep and Durability has to be studied.
2. The durability properties of GFRSCC can be evaluated by varying mix
proportions, like aggregate content, cement content, superplasticizer content,
maximum aggregate size and the use of different types and quantity of filler.
3. Comparative study related to normal conventional vibrated concrete can be
studied using the mix design adopted in this research.
4. Long-term study on durability of GFRSCC considering rebar corrosion
monitoring in addition to other durable properties of concrete.
5. The same work can be performed with different combinations of mineral and
chemical admixtures.
6. There is a wide scope to further investigations the effect of GFRSCC under long-
term loading.
7. Sufficiently low water powder ratio of 0.24 can be used for getting high
compressive strength self compacting concrete
8. The mechanical properties of self compacting concrete mixes are better, despite
addition of 40-50% fly ash by weight of cement.
9. A reduction in bleeding is observed by addition of glass fibre in the glass fibre self
compacting concrete mixes.
10. A reduction in bleeding improves the surface integrity of concrete, improves
its homogeneity, and reduces the probability of cracks.
11. The variation in compressive strength of glass fibre self compacting concrete
mixes are observed to be 15 % to 20 % when compared with self Compacting
concrete mixes 12. All the cracks observed in glass fibre self compacting concrete mixes on impact
specimens are brittle failure cracks.
193
BIBLIOGRAPHY
1. Hemant Sood, Khitoliya. R.K. and Pathak.”Incorporating European Standards for
testing Self Compacting Concrete in Indian conditions”. International Journal of
Recent Trends in Engineering, Vol.1, No.6, May 2009.pp:41-45
2. Hayakawa,.Matsuaka.M.J,and Shindoh,T.”Development and application of Super
workable concrete”. RELIM International workshop on Special Concretes:
Workability and mixing, Paisley, 1993.
3. Kazim Turk, Sinan Caliskan and Salih Yazicioglu.”Capillary water absorption of
Self Compacting Concrete under different Curing conditions”Indian Journal of
Engineering & Material Sciences, Vol.14, October 2007.pp: 365-372.
4. Kayat.K.H.”Workability, testing and performances of Self-Compacting
Concrete”. ACI Materials Journal, May-June 1999, pp.346-353.
5. ASTM C 39 (1997). “Standard test method for compressive strength measurement
in concrete”, Annual Book of ASTM Standards, Vol. 4.05, American Society for
Testing and Materials, Philadelphia.
6. ASTM C642 (1996). “Standard test method for specific gravity, absorption, and
voids in hardened concrete”, Annual Book of ASTM Standards, Vol. 4.02,
American Society for Testing and Materials, Philadelphia.
7. Bouzoubaa, N., and Lachemi, M., (2001). "Self-compacting concrete
incorporating high volumes of class F fly ash: preliminary results", Cement and
Concrete Research, Vol. 31, pp 413-420.
8. Brameshuber, W. and Uebachs, S., (2002). “Self-Compacting Concrete –
Application in Germany”, 6th International Symposium on High Strength/High
Performance Concrete, Leipzig, June, pp. 1503-1514.
194
9. Corinaldesi, V., and Moriconi, G., (2004). "Durable fiber reinforced self-
compacting concrete", Cement and Concrete Research, Vol. 34, pp.249-254.
10. EFNARC, “Specifications and Guidelines for Self-Compacting Concrete”,
EFNARC, UK (www.efnarc.org), February 2002, pp. 1-32.
11. . Kumar P., Haq M. Ajazul and Kaushik, S.K. (2004). Early age strength of SCC
with large volumes of fly ash, Indian Concrete Journal, Vol. 78, No. 6, p 25-29.
12. Leemann, A., and Hoffmann, C., (2005). "Properties of self compacting and
conventional concrete-differences and similarities". Magazine of Concrete
Research, Vol. 57, No. 6, August , pp. 315-319.
13. Munn, C., (2003). “Self Compacting Concrete (SCC): Admixtures, Mix Design
Consideration and Testing of Concrete” A Technical Paper Presented in the
Meeting of the ACI, Saudi Arabia Chapter, Eastern Province, October.
14. Nagamoto, N., and Ozawa, K., (1997). “Mixture proportions of self-compacting
high performance concrete”, ACI International, SP-172, pp. 623-636.
15. Okamura, H. and Ouchi, M., (1999). "Self-compacting concrete-development,
present and future", Proceedings of the First International RILEM symposium on
Self-Compacting Concrete, pp. 3-14.
16. Okamura, H. and Ouchi, M., (2003). “Self-compacting concrete”, Journal of
Advanced Concrete Technology, Vol. 1, No. 1, April, pp. 5-15.
17. Okamura, H. and Ozawa, K., (1995). “Mix design for self-compacting concrete”,
Concrete Library of JSCE, 25, pp. 107-120.
18. Su N., Hsu K C., and Chai H W., (2001). "A simple mix design method for self-
compacting concrete", Cement and Concrete Research, Vol. 31, pp. 1799-1807.
195
19. Avram, C., I. Facaoaru, O. Mirsu, I. Filimon, and I. Tertea, “Concrete Strength
and Strains”, Elsevier Scientific Publishing Company, pp.105-133, 249-251
(1981).
20. Bartos, J. M., “Measurement of Key Properties of Fresh Self-compacting
Concrete”, CEN/PNR Workshop, Paris (2000).
21. Dehn, F., K. Holschemacher, and D. Weisse, “Self-Compacting Concrete - Time
Development of the Material Properties and the Bond Behavior”, LACER No. 5,
pp.115-123 (2000).
22. Dodson, V., “Concrete Admixtures”, VNR Structural Engineering Series (1990).
23. Duval, R. and E. H. Kadri, “Influence of Silica Fume on the Workability and the
Compressive Strength of High-Performance Concretes”, Cement and Concrete
Research Journal, Vol. 28, Issue 4, pp.533-547 (1998).
24. Gagne, R., A. Boisvert, and M. Pigeon, “Effect of Superplasticizer on Mechanical
Properties of High - Strength Concretes with and without Silica Fume”, ACI
Materials Journal, Vol. 93, No. 2, pp.111-120 (1996).
25. Gebler, S.H. and P. Klieger, “Effect of Fly Ash on Some of the Physical
Properties of Concrete”, Portland Cement Association, R & D Bulletin 089.01T
(1986).
26. Khaloo, A. R. and M. R. Houseinian, “Evaluation of properties of silica fume for
use in
27. concrete”, International Conference on Concretes, Dundee, Scotland (1999).
28. Khayat, K.H. and Z. Guizani, “Use of Viscosity-Modifying Admixture to Enhance
Stability of Fluid Concrete”, ACI Materials Journal, pp.332-340 (1997).
29. Malhotra, V. M. and G.G. Carette, “Silica fume concrete properties, applications,
196
30. Limitations”, Concrete International, Vol. 5, No. 51, pp.40-46 (1983).
31. Maiti S.C and Raj K Agarwal,”Concrete and its Quality”. Indian Concrete
Journal, September 2009.pp: 23-27.
32. Manu Santhanam‘‘Compatibility issues between Cements and Water-Reducing
Chemical Admixtures’’, Proceedings of the RILEM-Indian Concrete Institute
Workshop on Innovations in Construction Materials and Structures,20th
September 2008.pp :69-83
33. Srinivasa Rao.P, SeshadriSekhar.J.”Strength properties of Glass Fiber SCC”.
Indian Concrete Journal, Vol.88, February 2008 pp: 61-65.
34. Subramanian S, Chattopadyaya D. Experiments for mix proportioning of Self-Compacting Concrete, Indian Concrete Journal, January 2002,pp 13-20.
35. Suresh Babu.T, Seshagiri Rao.M.V and Rama Seshu.D.”Mechanical properties
and Stress-Strain Behaviour of Self Compacting Concrete with and without Glass
Fibres”, Asian Journal of Civil engineering (Building and Housing) Vol.9, No.5
(2008), pp: 457-472
36. Vengala J, Sudarshan M.S. and R V Ranganath.”Experimental Study for obtaining
Self-Compacting Concrete” Indian Concrete Journal,Vol 77,no.8,August 2003,
pp 1261-1266.
37. Hajime Okamura & Masahiro Ouchi, Self-Compacting to achieve durable
concrete structures, Journal of Advanced Concrete Technology, Vol.1, No.1,
April 2003, PP 5-15.
38. H.J.H.Brouwers and H.J. Radix, Theoretical and experimental study of Self-
Compacting Concrete, Cement and Concrete Research, 9 June 2005, PP 2116 -
2136.
197
39. P.Rathish Kumar and M.L.V. Prasad, Fresh and Hardened Properties of Fiber
Reinforced Self Compacting Concrete, 2nd national conference NUCONE-
2007, Ahmedabad Nov 29th - December 1st. PP 179-183.
40. İlker Bekir Topçu and Mehmet Canbaz, “Effect of different fibers on the
mechanical properties of concrete containing fly ash” Construction and Building
Materials, Volume 21, Issue 7, July 2007, Pages 1486-1491.
41. P.Rathish Kumar and M.L.V.Prasad, “Development of Sustainable Fiber
Reinforced Self- Compacting Concrete using Recycled Aggregate”, at The Third
North American Conference On The Design And Use of Self- Consolidating
Concrete SCC 2008: Challenges and Barriers to Application Organized by the
Center for Advanced Cement-Based Materials, Northwestern University
McCormick School of Engineering and Applied Science, Evanston, illinios, USA
during Nov 10-12, 2008.
42. Mustafa Sahmaran and I. Ozgur Yaman, Hybrid fiber reinforced self-
compacting concrete with a high-volume coarse fly ash, Elsevier Science
Publishers, 30 June 2005, PP 109-126.
43. Nansu et.al, A simple mix design method for self-compacting concrete,
Cement and Concrete Research, 6 June 2001, PP 1799 – 1807.
44. Indian Standard Code IS: 2386, Method of test for Aggregates for Concrete,
reprinted 1997.
45. Indian Standard Code IS:383, Method of sampling of Aggregates for concrete.
46. Specifications and Guidelines for Self-Compacting Concrete, February 2002,
EFNARC, Association House, 99 West Street, Farnham, UK.
198
47. IS: 516–1956 (Reaffirmed 1999), Indian Standard Methods of Tests for
Strength of Concrete.
48. P.Rathish Kumar etal, “Strength Studies on Glass Fiber Reinforced Recycled
Aggregate Concrete”, Asian Journal of Civil Engineering (Building and Housing)
Vol.8, No.6, December 2007, Pages 679-690.
49. P.Rathish Kumar etal, “Mechanical Charcteristics of Fiber Reinforced Self
Compacting Mortars”, Vol 9, No 6, Dec 2008, Asian Journal of Civil
Engineering (Building and Housing), Teheran.
50. P.Rathish Kumar and Rao C.B.K., “Constitutive Behaviour of High
Performance Ferrocement under Axial Compression”, International Journal of
Magazine of Concrete Research, Scheduled for publication in volume 58,
issue 10, pp. 647––656, Dec 2006.
51. “Self Compacting Concrete” Discussion Forum. Indian Concrete Journal, October
2004
52. www.efnarc.org:European Specifications and guidelines for Production & Use of SCC, February and May 2005.
53. EFNARC guidelines for Viscosity Modifying Agents. 54. www.basf-cc.co.in. (Gelenium). 55. www.wocbookstore.com.. 56. Indian Code of Practice for Plain & Reinforced Concrete IS 456-2000. 57. Indian Code of Practice for Steel IS 800-1984. 58. M.S.Shetty, Concrete Technology, S.Chand Company ltd-2005,pp :573-576. 59. Softwares used : MS Excel
199
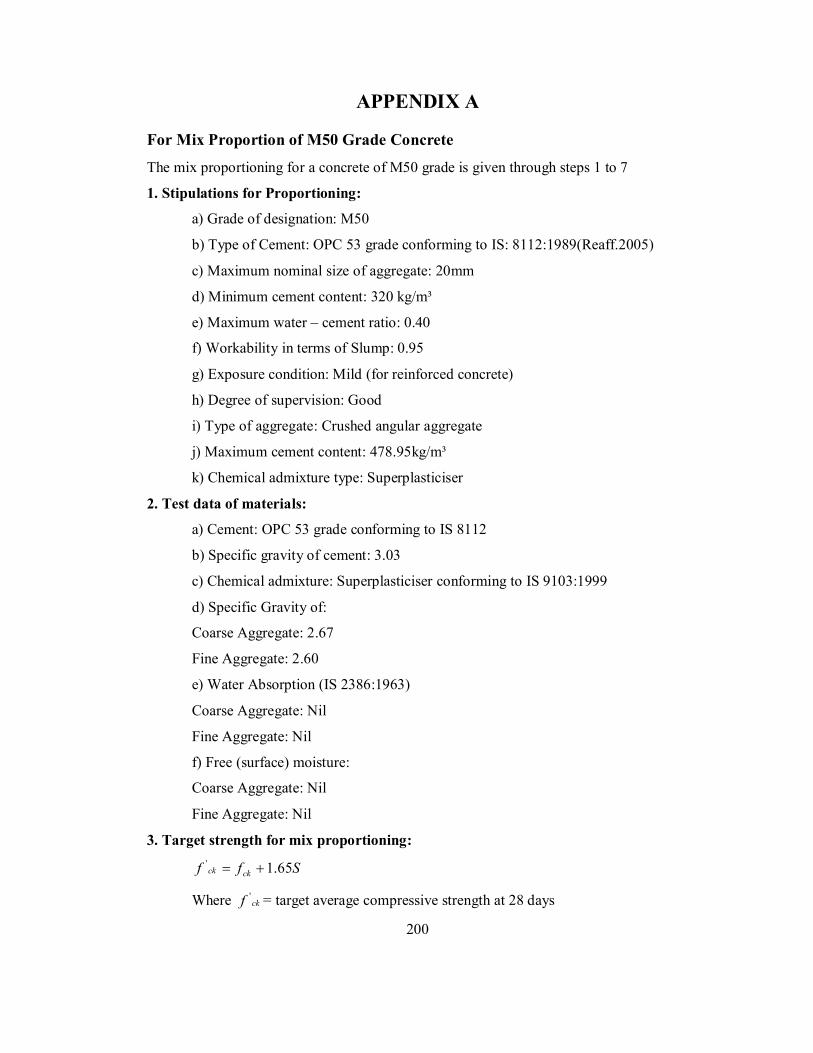
APPENDIX A
For Mix Proportion of M50 Grade Concrete
The mix proportioning for a concrete of M50 grade is given through steps 1 to 7
1. Stipulations for Proportioning:
a) Grade of designation: M50
b) Type of Cement: OPC 53 grade conforming to IS: 8112:1989(Reaff.2005)
c) Maximum nominal size of aggregate: 20mm
d) Minimum cement content: 320 kg/m³
e) Maximum water – cement ratio: 0.40
f) Workability in terms of Slump: 0.95
g) Exposure condition: Mild (for reinforced concrete)
h) Degree of supervision: Good
i) Type of aggregate: Crushed angular aggregate
j) Maximum cement content: 478.95kg/m³
k) Chemical admixture type: Superplasticiser
2. Test data of materials:
a) Cement: OPC 53 grade conforming to IS 8112
b) Specific gravity of cement: 3.03
c) Chemical admixture: Superplasticiser conforming to IS 9103:1999
d) Specific Gravity of:
Coarse Aggregate: 2.67
Fine Aggregate: 2.60
e) Water Absorption (IS 2386:1963)
Coarse Aggregate: Nil
Fine Aggregate: Nil
f) Free (surface) moisture:
Coarse Aggregate: Nil
Fine Aggregate: Nil
3. Target strength for mix proportioning:
Sff ckck 65.1'
Where ckf ' = target average compressive strength at 28 days
200
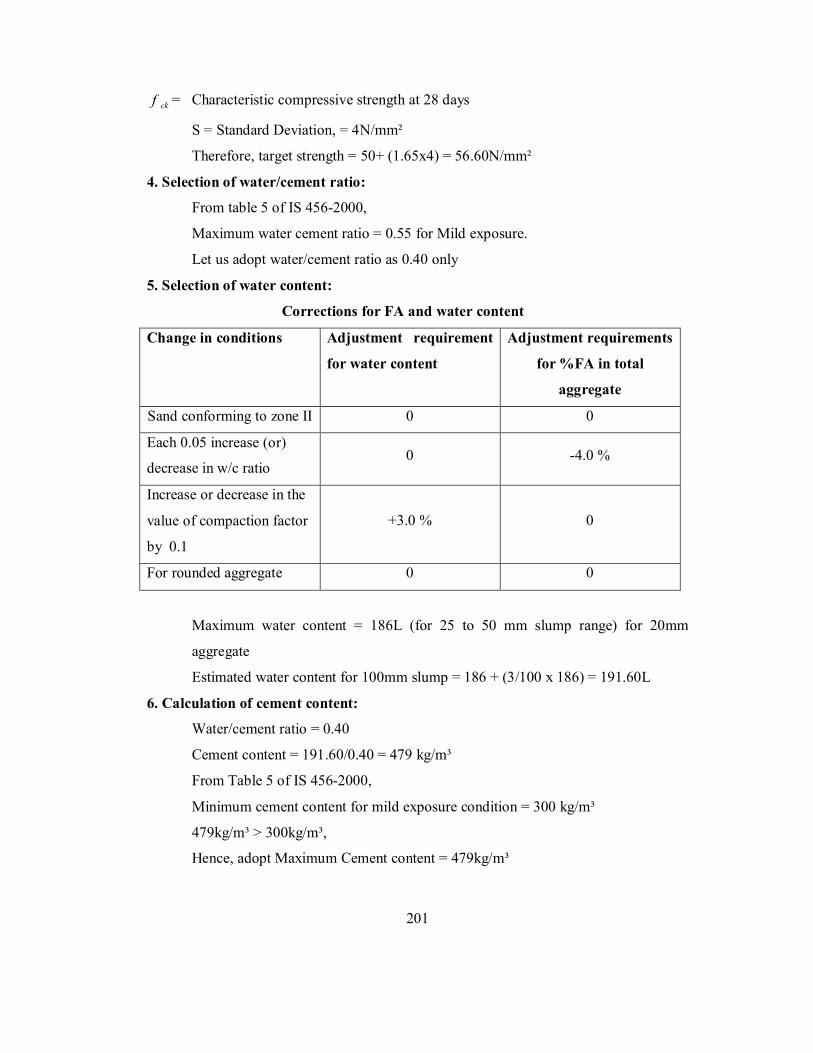
ckf = Characteristic compressive strength at 28 days
S = Standard Deviation, = 4N/mm²
Therefore, target strength = 50+ (1.65x4) = 56.60N/mm²
4. Selection of water/cement ratio:
From table 5 of IS 456-2000,
Maximum water cement ratio = 0.55 for Mild exposure.
Let us adopt water/cement ratio as 0.40 only
5. Selection of water content:
Corrections for FA and water content
Change in conditions Adjustment requirement
for water content
Adjustment requirements
for %FA in total
aggregate
Sand conforming to zone II 0 0
Each 0.05 increase (or)
decrease in w/c ratio 0 -4.0 %
Increase or decrease in the
value of compaction factor
by 0.1
+3.0 % 0
For rounded aggregate 0 0
Maximum water content = 186L (for 25 to 50 mm slump range) for 20mm
aggregate
Estimated water content for 100mm slump = 186 + (3/100 x 186) = 191.60L
6. Calculation of cement content:
Water/cement ratio = 0.40
Cement content = 191.60/0.40 = 479 kg/m³
From Table 5 of IS 456-2000,
Minimum cement content for mild exposure condition = 300 kg/m³
479kg/m³ > 300kg/m³,
Hence, adopt Maximum Cement content = 479kg/m³
201
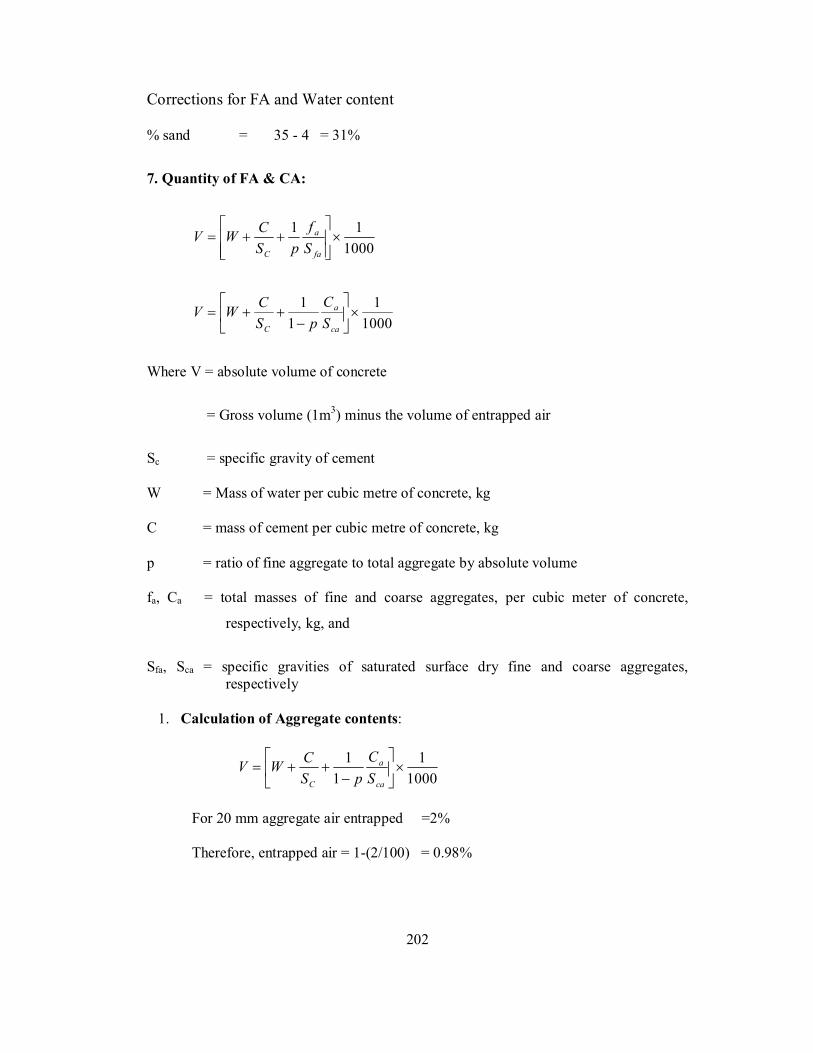
Corrections for FA and Water content
% sand = 35 - 4 = 31%
7. Quantity of FA & CA:
1000
11
fa
a
C Sf
pSCWV
1000
11
1
ca
a
C SC
pSCWV
Where V = absolute volume of concrete
= Gross volume (1m3) minus the volume of entrapped air
Sc = specific gravity of cement
W = Mass of water per cubic metre of concrete, kg
C = mass of cement per cubic metre of concrete, kg
p = ratio of fine aggregate to total aggregate by absolute volume
fa, Ca = total masses of fine and coarse aggregates, per cubic meter of concrete,
respectively, kg, and
Sfa, Sca = specific gravities of saturated surface dry fine and coarse aggregates, respectively
1. Calculation of Aggregate contents:
1000
11
1
ca
a
C SC
pSCWV
For 20 mm aggregate air entrapped =2%
Therefore, entrapped air = 1-(2/100) = 0.98%
202
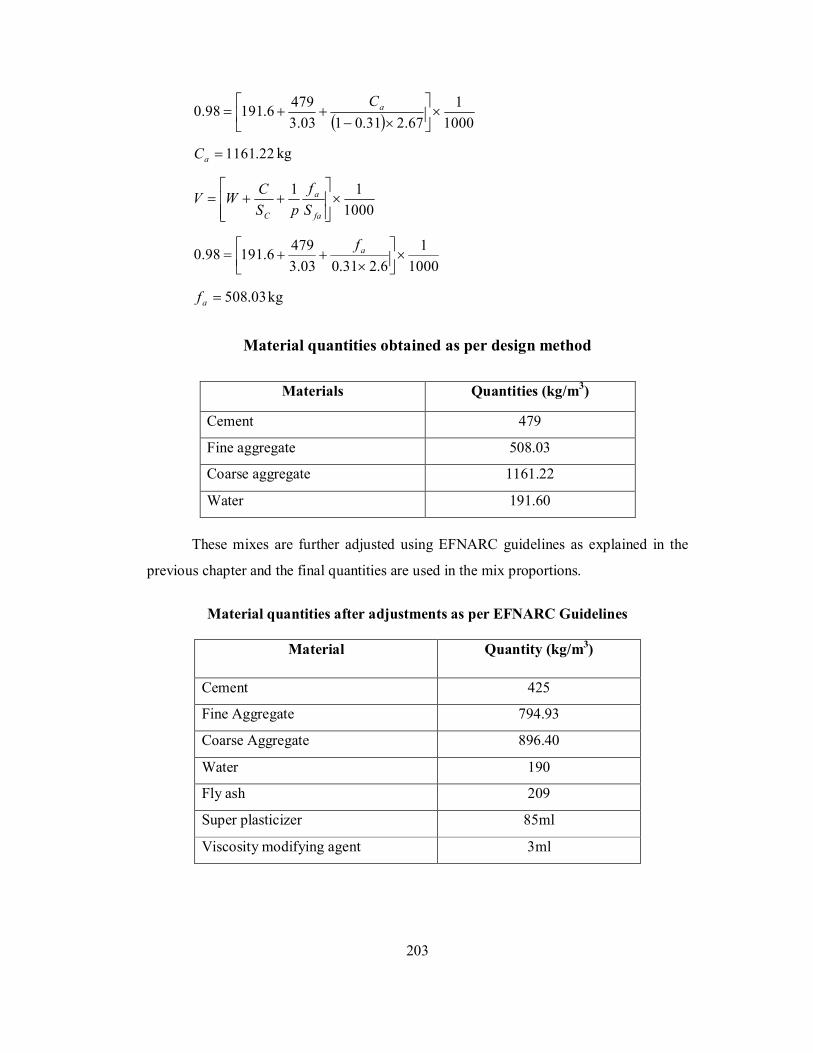
10001
67.231.0103.34796.19198.0
aC
22.1161aC kg
100011
fa
a
C Sf
pSCWV
1000
16.231.003.3
4796.19198.0
af
03.508af kg
Material quantities obtained as per design method
Materials Quantities (kg/m3)
Cement 479
Fine aggregate 508.03
Coarse aggregate 1161.22
Water 191.60
These mixes are further adjusted using EFNARC guidelines as explained in the
previous chapter and the final quantities are used in the mix proportions.
Material quantities after adjustments as per EFNARC Guidelines
Material Quantity (kg/m3)
Cement 425
Fine Aggregate 794.93
Coarse Aggregate 896.40
Water 190
Fly ash 209
Super plasticizer 85ml
Viscosity modifying agent 3ml
203
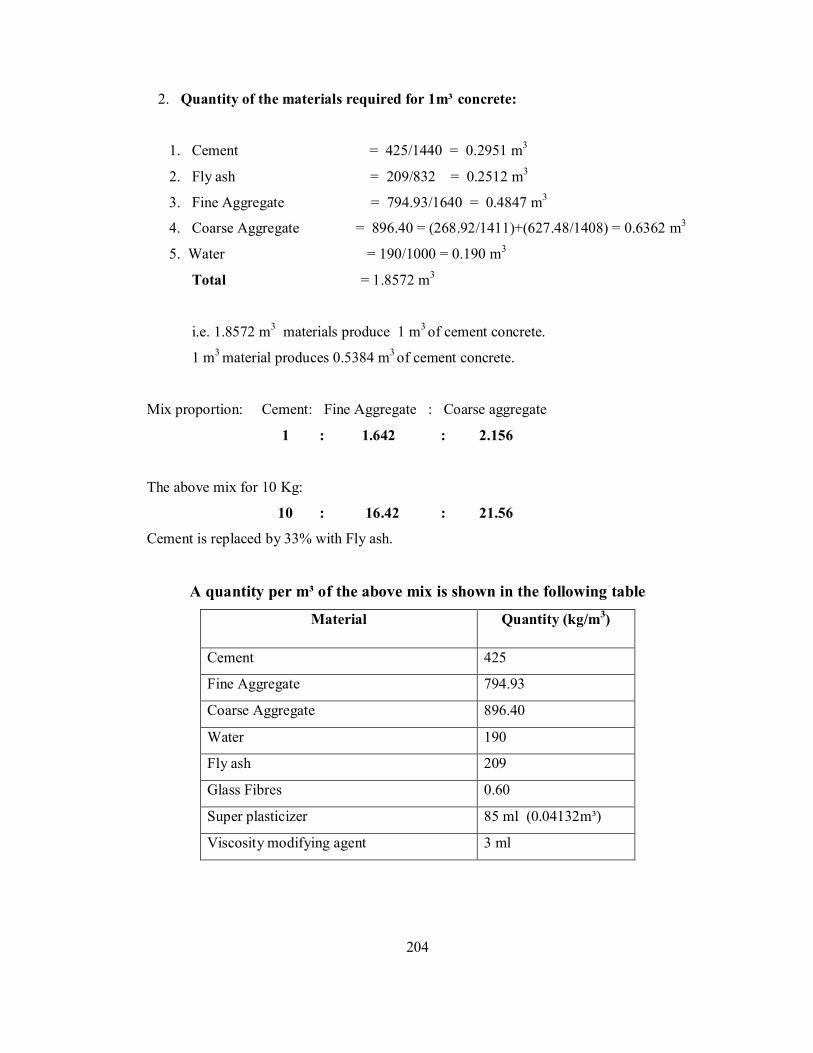
2. Quantity of the materials required for 1m³ concrete:
1. Cement = 425/1440 = 0.2951 m3
2. Fly ash = 209/832 = 0.2512 m3
3. Fine Aggregate = 794.93/1640 = 0.4847 m3
4. Coarse Aggregate = 896.40 = (268.92/1411)+(627.48/1408) = 0.6362 m3
5. Water = 190/1000 = 0.190 m3
Total = 1.8572 m3
i.e. 1.8572 m3 materials produce 1 m3 of cement concrete.
1 m3 material produces 0.5384 m3 of cement concrete.
Mix proportion: Cement: Fine Aggregate : Coarse aggregate
1 : 1.642 : 2.156
The above mix for 10 Kg:
10 : 16.42 : 21.56
Cement is replaced by 33% with Fly ash.
A quantity per m³ of the above mix is shown in the following table
Material Quantity (kg/m3)
Cement 425
Fine Aggregate 794.93
Coarse Aggregate 896.40
Water 190
Fly ash 209
Glass Fibres 0.60
Super plasticizer 85 ml (0.04132m³)
Viscosity modifying agent 3 ml
204
VITA
Badanapuri VenkataRaju was born on July 01, 1966 in Golagamudi village of
Vnkatachalam mandal, SPSR Nellore District, Andhra Pradesh, and graduated from
“Andhra University of Waltair” in 1992. He attended the Andhra University College of
Engineering at Waltair between 1987 and 1991 and received his bachelor of Degree in
Civil Engineering with a specialization in Multi-storey Structures and Pre-stressed
concrete Structures in January 1992, and he then joined in the Andhra Pradesh state
Irrigation & CAD department as Assistant Executive Engineer and rendered 20years of
service. He is member of the Institution of Engineers (INDIA) since 2003. Presently he is
working as Executive Engineer, in Telugu Ganga Project; Gudur of SPSR Nellore
District. He then came to Hyderabad April 2006, to pursue higher education at JNTUH
College of Engineering, Kukatpally Hyderabad – 500085, Andhra Pradesh, India. He
started his Master of Technology, in the Department of Civil Engineering with the
specialization in Structural Engineering and successfully completed his degree
requirements in July 2009.
205