mtDNA Variation in Aboriginal Australian and Papua New Guinean ...
21
Am. J. Hum. Genet. 65:808–828, 1999 808 Peopling of Sahul: mtDNA Variation in Aboriginal Australian and Papua New Guinean Populations Alan J. Redd 1,* and Mark Stoneking 1, 2 1 Department of Anthropology, The Pennsylvania State University, University Park, Pennsylvania and 2 Max Planck Institute for Evolutionary Anthropology, Leipzig, Germany Abstract We examined genetic affinities of Aboriginal Australian and New Guinean populations by using nucleotide var- iation in the two hypervariable segments of the mtDNA control region (CR). A total of 318 individuals from highland Papua New Guinea (PNG), coastal PNG, and Aboriginal Australian populations were typed with a panel of 29 sequence-specific oligonucleotide (SSO) probes. The SSO-probe panel included five new probes that were used to type an additional 1,037 individuals from several Asian populations. The SSO-type data guided the selection of 78 individuals from Australia and east Indonesia for CR sequencing. A gene tree of these CR sequences, combined with published sequences from worldwide populations, contains two previously iden- tified highland PNG clusters that do not include any Aboriginal Australians; the highland PNG clusters have coalescent time estimates of ∼80,000 and 122,000 years ago, suggesting ancient isolation and genetic drift. SSO- type data indicate that 84% of the sample of PNG high- lander mtDNA belong to these two clusters. In contrast, the Aboriginal Australian sequences are intermingled throughout the tree and cluster with sequences from multiple populations. Phylogenetic and multidimen- sional-scaling analyses of CR sequences and SSO types split PNG highland and Aboriginal Australian popula- tions and link Aboriginal Australian populations with populations from the subcontinent of India. These mtDNA results do not support a close relationship be- tween Aboriginal Australian and PNG populations but instead suggest multiple migrations in the peopling of Sahul. Received November 24, 1998; accepted for publication July 7, 1999; electronically published August 9, 1999. Address for correspondence and reprints: Dr. Alan J. Redd, Labo- ratory of Molecular Systematics and Evolution, Department of Ecol- ogy and Evolutionary Biology, Biological Sciences West 239, University of Arizona, Tucson, AZ 85721. E-mail: [email protected] * Present affiliation: Laboratory of Molecular Systematics and Ev- olution, Department of Ecology and Evolutionary Biology, University of Arizona, Tucson. q 1999 by The American Society of Human Genetics. All rights reserved. 0002-9297/1999/6503-0028$02.00 Introduction Estimates of the dates and the process of human colo- nization of Sahul, the single Pleistocene landmass joining Australia, New Guinea, and Tasmania, suggest that this event was ancient and rapid. Radiocarbon dating from dozens of sites (Jones 1995; O’Connell and Allen 1998) and luminescence dating from fewer sites (e.g., Groube et al. 1986) both indicate that humans occupied the far reaches of Sahul by ∼35,000–40,000 years ago. How- ever, there is growing evidence that humans reached Sa- hul much earlier. Luminescence dating from two sites in northern Australia suggests that human colonization of Sahul occurred as much as 53,000–60,000 years ago (Roberts et al. 1990; Roberts and Jones 1994). Paleov- egetation change in Australia provides evidence that hu- man immigrants arrived ∼60,000–65,000 years ago (Johnson et al. 1999; Miller et al. 1999). Furthermore, a human skeleton from Lake Mungo recently was dated, yielding an age of 62,000 years 5 6,000 years (Thorne et al. 1999). After initial colonization, the pace of move- ment of people into all regions of Sahul may have been quicker than has been estimated on the basis of the ar- cheological record. For example, Birdsell’s (1957) sim- ulations of rates of population growth and movement into an unoccupied niche suggest that humans could have dispersed throughout Sahul in as little as 2,000 years. Because Australia and New Guinea, and Australia and Tasmania, remained joined by land shelves during the Pleistocene until sea levels rose—∼8,000 and 12,000 years ago, respectively (White and O’Connell 1982; Jones 1995)—early populations of Sahul could have shared genes for ∼30,000–57,000 years after initial settlement. Given this common history in Sahul, the predominant view is that modern Aboriginal Australian and New Gui- nean highland populations are the descendants of the earliest migration into this region. This common-origin hypothesis specifies New Guinean highlanders because portions of coastal New Guinea were later colonized by Austronesian speakers—who apparently bypassed Aus- tralia and did not penetrate the highlands—∼5,000 years ago (Bellwood 1989).
Transcript of mtDNA Variation in Aboriginal Australian and Papua New Guinean ...
Am. J. Hum. Genet. 65:808–828, 1999
808
Peopling of Sahul: mtDNA Variation in Aboriginal Australian and PapuaNew Guinean PopulationsAlan J. Redd1,* and Mark Stoneking1, 2
1Department of Anthropology, The Pennsylvania State University, University Park, Pennsylvania and 2Max Planck Institute for EvolutionaryAnthropology, Leipzig, Germany
Abstract
We examined genetic affinities of Aboriginal Australianand New Guinean populations by using nucleotide var-iation in the two hypervariable segments of the mtDNAcontrol region (CR). A total of 318 individuals fromhighland Papua New Guinea (PNG), coastal PNG, andAboriginal Australian populations were typed with apanel of 29 sequence-specific oligonucleotide (SSO)probes. The SSO-probe panel included five new probesthat were used to type an additional 1,037 individualsfrom several Asian populations. The SSO-type dataguided the selection of 78 individuals from Australia andeast Indonesia for CR sequencing. A gene tree of theseCR sequences, combined with published sequences fromworldwide populations, contains two previously iden-tified highland PNG clusters that do not include anyAboriginal Australians; the highland PNG clusters havecoalescent time estimates of ∼80,000 and 122,000 yearsago, suggesting ancient isolation and genetic drift. SSO-type data indicate that 84% of the sample of PNG high-lander mtDNA belong to these two clusters. In contrast,the Aboriginal Australian sequences are intermingledthroughout the tree and cluster with sequences frommultiple populations. Phylogenetic and multidimen-sional-scaling analyses of CR sequences and SSO typessplit PNG highland and Aboriginal Australian popula-tions and link Aboriginal Australian populations withpopulations from the subcontinent of India. ThesemtDNA results do not support a close relationship be-tween Aboriginal Australian and PNG populations butinstead suggest multiple migrations in the peopling ofSahul.
Received November 24, 1998; accepted for publication July 7, 1999;electronically published August 9, 1999.
Address for correspondence and reprints: Dr. Alan J. Redd, Labo-ratory of Molecular Systematics and Evolution, Department of Ecol-ogy and Evolutionary Biology, Biological Sciences West 239, Universityof Arizona, Tucson, AZ 85721. E-mail: [email protected]
* Present affiliation: Laboratory of Molecular Systematics and Ev-olution, Department of Ecology and Evolutionary Biology, Universityof Arizona, Tucson.
q 1999 by The American Society of Human Genetics. All rights reserved.0002-9297/1999/6503-0028$02.00
Introduction
Estimates of the dates and the process of human colo-nization of Sahul, the single Pleistocene landmass joiningAustralia, New Guinea, and Tasmania, suggest that thisevent was ancient and rapid. Radiocarbon dating fromdozens of sites (Jones 1995; O’Connell and Allen 1998)and luminescence dating from fewer sites (e.g., Groubeet al. 1986) both indicate that humans occupied the farreaches of Sahul by ∼35,000–40,000 years ago. How-ever, there is growing evidence that humans reached Sa-hul much earlier. Luminescence dating from two sites innorthern Australia suggests that human colonization ofSahul occurred as much as 53,000–60,000 years ago(Roberts et al. 1990; Roberts and Jones 1994). Paleov-egetation change in Australia provides evidence that hu-man immigrants arrived ∼60,000–65,000 years ago(Johnson et al. 1999; Miller et al. 1999). Furthermore,a human skeleton from Lake Mungo recently was dated,yielding an age of 62,000 years 5 6,000 years (Thorneet al. 1999). After initial colonization, the pace of move-ment of people into all regions of Sahul may have beenquicker than has been estimated on the basis of the ar-cheological record. For example, Birdsell’s (1957) sim-ulations of rates of population growth and movementinto an unoccupied niche suggest that humans couldhave dispersed throughout Sahul in as little as 2,000years. Because Australia and New Guinea, and Australiaand Tasmania, remained joined by land shelves duringthe Pleistocene until sea levels rose—∼8,000 and 12,000years ago, respectively (White and O’Connell 1982;Jones 1995)—early populations of Sahul could haveshared genes for ∼30,000–57,000 years after initialsettlement.
Given this common history in Sahul, the predominantview is that modern Aboriginal Australian and New Gui-nean highland populations are the descendants of theearliest migration into this region. This common-originhypothesis specifies New Guinean highlanders becauseportions of coastal New Guinea were later colonized byAustronesian speakers—who apparently bypassed Aus-tralia and did not penetrate the highlands—∼5,000 yearsago (Bellwood 1989).

Redd and Stoneking: Australian and PNG mtDNA Diversity 809
However, various lines of evidence bearing on the hy-pothesis of a common origin shared by Aboriginal Aus-tralians and New Guineans do not present a clear pic-ture. For example, two previous studies of mtDNA dataare equivocal with respect to the common-origin hy-pothesis. A phylogenetic analysis based on mtDNA re-striction-enzyme data did not show any association be-tween people from Papua New Guinea (PNG) andAboriginal Australians in a tree that included African,Asian, and European individuals (Stoneking et al. 1990).Stoneking and colleagues suggested that there have beenmajor population movements in PNG over the last10,000 years that have altered the genetic relationshipbetween Australian and PNG populations. In contrast,recent studies by van Holst Pellekaan et al. (1997, 1998)of mtDNA control region (CR) sequence variation inhypervariable segment 1 (HVS-I) of two AboriginalAustralian populations (Riverine and Desert regions)showed that the Aboriginal Australian populations aregenetically least distant from PNG highlanders, whencompared with a limited number of mtDNA from Af-rican and Asian populations.
MtDNA-sequence data are rich and they are wellsuited for tracking the relative influence of histories ofpopulation fission and/or gene flow. In addition, modelshave been developed explicitly for understanding dem-ographic histories that can be inferred from mtDNA-sequence data. Although a single gene in the evolution-ary history of populations, mtDNA reveals distinct ma-ternal histories that are unclouded by the loss of phy-logenetic signal via recombination. Although the Ychromosome also shares these attributes, mtDNA dataare expected to show less influence from recent historicmale-mediated admixture.
In this study, we examined the genetic relationship ofAboriginal Australian and PNG highland populationsby using two mtDNA data sets. First, sequence-specificoligonucleotide (SSO) typing (Stoneking et al. 1991) ofHVS-I and HVS-II of the CR was performed in samplesof 1,355 individuals from Aboriginal Australian, PNG,and several Asian populations. Second, CR-sequencedata from HVS-I and HVS-II were collected from sam-ples of Aboriginal Australians and east Indonesians andwere compared with previously published PNG se-quences (Stoneking et al. 1992). Several analyses (phy-logenetic, multidimensional scaling [MDS], intermatch,and genetic structure) of these mtDNA data did notsuggest a common genetic origin of extant AboriginalAustralian and PNG highland populations. Instead, Ab-original Australians showed close affinities with popu-lations from the subcontinent of India, whereas PNGhighlanders showed more-ancient divergence from allpopulations with hints of ancient ties to Africanpopulations.
Samples and Methods
Samples
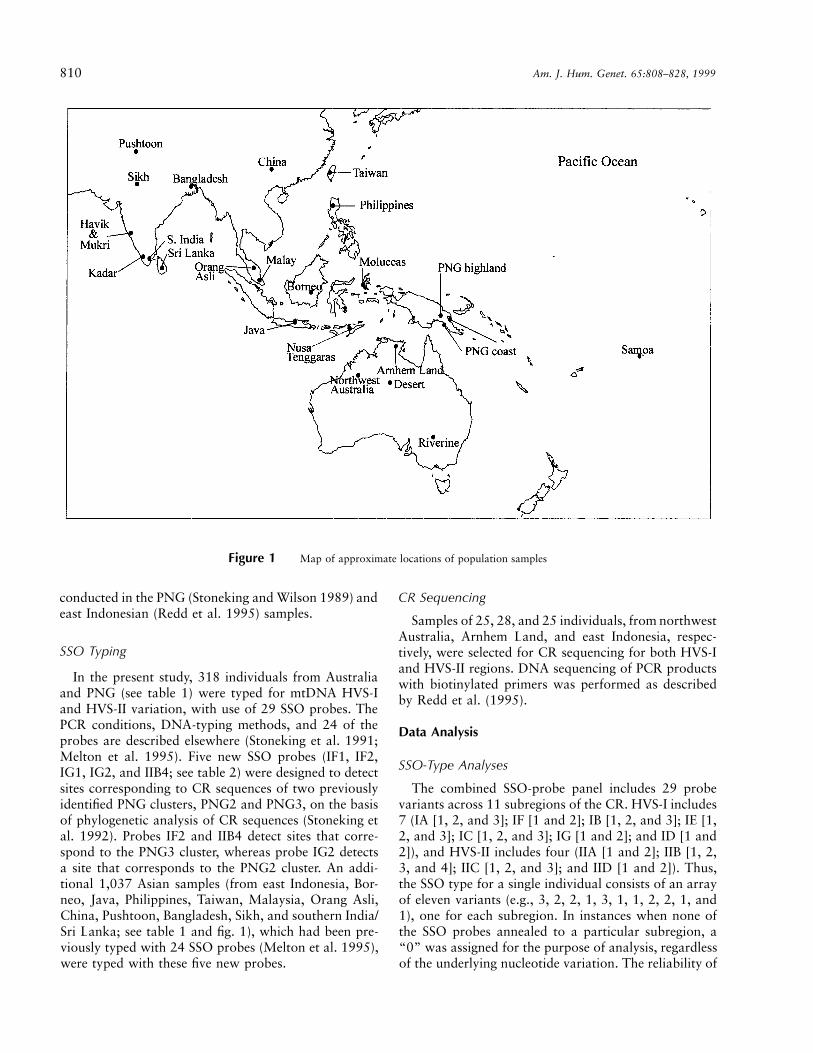
Figure 1 shows the locations of the population sam-ples in this study, as well as of those gathered from theliterature. All samples in this study were obtained andhandled in accordance with the guidelines of the Officeof Regulatory Compliance of the Pennsylvania StateUniversity.
Australia.—Samples were obtained from two areas,northwest Australia and Arnhem Land. Purified DNAsamples from 105 individuals from northwest Australia(Great Sandy Desert and Kimberley regions) derive fromfive locations: Balgo, Christmas Creek, Derby, Looma,and Turkey Creek. Samples from 95 individuals fromArnhem Land were provided in the form of blood stainson cloth, from which DNA was extracted with theIsoQuick (MicroProbe) kit, following the manufac-turer’s directions. One CR sequence from an AboriginalAustralian was previously published (Vigilant et al.1991).
PNG.—Purified DNA from 119 samples from severalPNG regions, including the eastern highlands, southernhighlands, north coast, south coast, and offshore islands,have been described elsewhere (Stoneking et al. 1990).PNG sequences from 63 individuals were previouslypublished (Vigilant et al. 1991; Stoneking et al. 1992;Redd et al. 1995).
East Indonesia.—DNA samples from 146 individualsfrom two islands in the Moluccas (Hiri and Ternate) andfour islands in the Nusa Tenggaras (Alor, Flores, Roti,and Timor) were described elsewhere by Redd et al.(1995). East Indonesian CR sequences from 38 individ-uals were previously published (Stoneking et al. 1992;Redd et al. 1995).
Additional CR sequences examined in this paper in-clude 248 Africans (Vigilant et al. 1991; Graven et al.1995), 23 Asians (Vigilant et al. 1991), 102 southernIndians (Mountain et al. 1995), 115 Europeans (Vigilantet al. 1991; Piercy et al. 1993), and 25 Polynesians (Vig-ilant et al. 1991; Redd et al. 1995), as well as fourchimpanzee sequences (Foran et al. 1988; Kocher andWilson 1991).
9-bp Deletion
A 9-bp deletion in the COII/tRNALys intergenic regionof the mtDNA is a useful marker in studies of the dis-persal of Austronesian speakers and is closely associatedwith the evolutionary history of Polynesians (Melton etal. 1995; Redd et al. 1995; Sykes et al. 1995). The 200Australian samples were screened for the presence orabsence of the 9-bp deletion, with use of published meth-ods (Redd et al. 1995). Similar typings were previously
810 Am. J. Hum. Genet. 65:808–828, 1999
Figure 1 Map of approximate locations of population samples
conducted in the PNG (Stoneking and Wilson 1989) andeast Indonesian (Redd et al. 1995) samples.
SSO Typing
In the present study, 318 individuals from Australiaand PNG (see table 1) were typed for mtDNA HVS-Iand HVS-II variation, with use of 29 SSO probes. ThePCR conditions, DNA-typing methods, and 24 of theprobes are described elsewhere (Stoneking et al. 1991;Melton et al. 1995). Five new SSO probes (IF1, IF2,IG1, IG2, and IIB4; see table 2) were designed to detectsites corresponding to CR sequences of two previouslyidentified PNG clusters, PNG2 and PNG3, on the basisof phylogenetic analysis of CR sequences (Stoneking etal. 1992). Probes IF2 and IIB4 detect sites that corre-spond to the PNG3 cluster, whereas probe IG2 detectsa site that corresponds to the PNG2 cluster. An addi-tional 1,037 Asian samples (from east Indonesia, Bor-neo, Java, Philippines, Taiwan, Malaysia, Orang Asli,China, Pushtoon, Bangladesh, Sikh, and southern India/Sri Lanka; see table 1 and fig. 1), which had been pre-viously typed with 24 SSO probes (Melton et al. 1995),were typed with these five new probes.
CR Sequencing
Samples of 25, 28, and 25 individuals, from northwestAustralia, Arnhem Land, and east Indonesia, respec-tively, were selected for CR sequencing for both HVS-Iand HVS-II regions. DNA sequencing of PCR productswith biotinylated primers was performed as describedby Redd et al. (1995).
Data Analysis
SSO-Type Analyses
The combined SSO-probe panel includes 29 probevariants across 11 subregions of the CR. HVS-I includes7 (IA [1, 2, and 3]; IF [1 and 2]; IB [1, 2, and 3]; IE [1,2, and 3]; IC [1, 2, and 3]; IG [1 and 2]; and ID [1 and2]), and HVS-II includes four (IIA [1 and 2]; IIB [1, 2,3, and 4]; IIC [1, 2, and 3]; and IID [1 and 2]). Thus,the SSO type for a single individual consists of an arrayof eleven variants (e.g., 3, 2, 2, 1, 3, 1, 1, 2, 2, 1, and1), one for each subregion. In instances when none ofthe SSO probes annealed to a particular subregion, a“0” was assigned for the purpose of analysis, regardlessof the underlying nucleotide variation. The reliability of

Redd and Stoneking: Australian and PNG mtDNA Diversity 811
Table 1
Populations and Individuals Examined for mtDNA Variation
PopulationNo. of
Individuals
9-bpDeletiona
(%)29 SSOb
ProbesCRc
Sequences
Australia:Arnhem Land 95 0 95 28Northwest Australia 105 0 105 25
PNG:Highland 70 0 70 30Coastal 48 42 48 33
East Indonesia:Moluccas 49 16 49 17Nusa Tenggaras 94 24 94 46Polynesia 25 100 0 25
Asia:Java 98 26 98 0Borneo 95 24 95 0Philippines 176 40 176 0Taiwan 82 42 82 0Malay 81 26 81 0Orang Asli 30 37 30 0China 103 22 103 0Pushtoon 76 0 76 0Bangladesh 31 0 31 0Sikh 47 0 47 0Southern Indian 75 8 75 0
Totals 1,380 1,355 204
a Sources for data are as follows: Australia, this study; PNG, Sto-neking and Wilson (1989); east Indonesia and Polynesia, Redd et al.(1995); and Asia, Melton et al. (1995).
b Sources for data are as follows: Australia and PNG (this study,29 probes), east Indonesia, Asia (this study, 5 probes; Melton et al.1995, 24 probes).
c Sources for data are as follows: Australia, this study; east Indo-nesia, this study, Stoneking et al. (1992), and Redd et al. (1995);Polynesia, Redd et al. (1995) and Vigilant et al. (1991); and PNG,Vigilant et al. (1991); Stoneking et al. (1992) and Redd et al. (1995).
these SSO data was checked by comparison with 179CR sequences from Australia, PNG, and east lndonesia;99.78% of the SSO-typing results were concordant withthe DNA-sequence results. Unbiased estimates of hap-lotype diversity and the associated variance were cal-culated with the ARLEQUIN package (ARLEQUIN).
A genetic-distance matrix was calculated betweenunique SSO types, on the basis of the number of mu-tational steps between pairs of SSO types, with the un-derlying molecular information. The distance from the0 variant to all other variants was set to one mutationalstep. The genetic-distance matrix between all SSO typesand their frequency in each population were used tocalculate a variety of statistics and population distanceswith ARLEQUIN. Population pairwise FST distanceswere computed for all pairs of populations, and theirsignificance was tested with a nonparametric permuta-tion test that involves permuting haplotypes betweenpopulations and recalculating the distances (ARLE-QUIN). In addition, an exact test of population differ-
entiation was carried out with the construction of con-tingency tables consisting of the number of populationsby the number of haplotypes, and the exploration of allpossible states of the table was done with a Markovchain (Raymond and Rousset 1995). A matrix of Slat-kin-linearized FST values (Slatkin 1995; ARLEQUIN)was used for construction of a population tree with theneighbor-joining (NJ) method (Saitou and Nei 1987), asimplemented in MEGA (Kumar et al. 1993). The matrixof Slatkin-linearized FST values was used as input for anMDS analysis (Kruskal 1964) with maximum-likelihoodestimation (MULTISCALE).
Sequence Analysis
CR sequences from 692 individuals with 754 nucle-otides of the combined HVS-I (positions 16,024–16,400) and HVS-II (positions 31–407) were alignedmanually with the human-reference sequence (Andersonet al. 1981). Observed insertion polymorphisms wereremoved. To minimize the impact of missing data on theanalysis, sequences that were missing 15% of the siteswere excluded, as well as some sequences ( ) thatn = 8were missing sites in polymorphic regions. The final sam-ple of 430 individuals consists of CR sequences from 44Africans (six !Kung, 10 Biaka Pygmies, three Mbuti Pyg-mies, 11 Yorubans, eight Mandenka, and six AfricanAmericans), 107 Europeans (93 British and Welch and14 northern Europeans), 81 southern Indians (42 Havik,34 Mukri, and five Kadar), 19 Asians (14 Chinese, oneFilipino, one Japanese, one Taiwanese, one Vietnamese,and one Amerindian), 54 Aboriginal Australians (28from Arnhem Land, 25 from northwest Australia, andone from Western Australia), 46 PNG (31 from PNGcoast and 15 from PNG highland), 59 east Indonesians(16 Moluccans and 43 Nusa Tenggarans), and 20 Pol-ynesians (19 American Samoans and one Tongan). Thissample of 430 sequences shares 561 nucleotide sites.
A gene tree was produced, with the NJ method (Saitouand Nei 1987), from a matrix of the proportion of nu-cleotide differences with use of the MEBoot program(provided by K. Tamura). A p-distance was selected be-cause it has a low coefficient of variance, and the suc-cessful performance of a genetic distance is greatly in-fluenced by variance (Tajima and Takezaki 1994). Thegene-tree topology was nearly identical under differentmeasures of genetic distances. The NJ tree was furthersearched to find the minimum evolution (ME) tree(Rzhetsky and Nei 1992, 1993). The reliability of theinterior branches of the ME tree was tested with theconfidence probability (CP) test (Rzhetsky and Nei1992, 1993), with use of 1,000 replicates. Furthermore,the clusters in the ME tree were examined with the boot-strap test (Felsenstein 1985), with use of 500 replicates.
To account for bias introduced by rate variation

812 Am. J. Hum. Genet. 65:808–828, 1999
Table 2
Additional SSO Probes
Nucleotide Positiona
and Marker Polymorphic Sitesb
HybridizationTemperature
(7C) Probe Sequence (5′–3′) Strandc
16,138–16,155:IF1 16144 T, 16148 C 50 AATACTTGACCACCTGTA LIF2 16144 C, 16148 T 50 AATACTCGACTACCTGTA L
16,344–16,361:IG1 16357, T 50 CGAGAAGGGATTTGACTG HIG2 16357, C 55 CAGTCAAATCCCTCCTCG L
141–158:IIB4 143, A 50 CTACCTCATCCTATTATT L
NOTE.—Probes added to those of Stoneking et al. (1991) and Melton et al. (1995).a Nt positions flanked by the SSO probes, as appear in the human reference (Anderson et al. 1981).b Nt position and state on the L strand, detected by the SSO probe.c “H” = heavy strand and “L” = light strand (Anderson et al. 1981).
among sites in the CR, we estimated the gamma param-eter, a, by counting the number of substitutions for eachsite (Kocher and Wilson 1991; Tamura and Nei 1993;Wakeley 1993) for the NJ tree topology, with GMAES(Takezaki N).
The height of the branch points of phylogenetic clus-ters of interest were obtained by the construction of alinearized tree under the assumption of a molecular clock(Takezaki et al. 1995), with use of the LINTRE package(Takezaki N). LINTRE includes a two-cluster test thatinvolves examining the statistical equality of the averagesubstitution rates for two clusters of interest. For thetwo-cluster test, we first constructed a NJ tree of thephylogenetic cluster and included an outgroup(s) usingthe Tamura-Nei model of substitution (Tamura and Nei1993) and a gamma-parameter estimate. Rate constancywas then forced on the NJ topologies (Takezaki et al.1995), thus providing estimates of the height of the nodeand their standard errors (SE), which were used to es-timate the coalescence times of phylogenetic clusters.The gamma-corrected Tamura-Nei distance was selectedbecause it is, biologically, the most realistic and it in-creases linearly with time.
The average-nucleotide diversity within and betweenpopulations (dX and dXY, respectively; Nei and Jin 1989)was computed with the SENDBS program (Takezaki N).We constructed a population tree from dXY by using amatrix of the proportion of nucleotide differences. Wealso used SENDBS to compute Felsenstein’s (1985) boot-strap probabilities of the NJ tree, using 1,000 replicates.We computed estimates of population divergence withSENDBS by using net divergence, dA (Nei and Jin 1989),under the Tamura-Nei model of substitution (Tamuraand Nei 1993) with a gamma correction. The matrix ofdXY distances (Tamura and Nei model with a gammacorrection) was used as input for MDS analysis (Kruskal1964) using maximum-likelihood estimation with theMULTISCALE program.
Pairwise-difference distributions were used to examinedemographic history and population separations (Rog-ers and Harpending 1992; Harpending et al. 1993). Mis-match and intermatch distributions were constructedwith the MISMATCH and IWAVE programs, respec-tively. Harpending’s raggedness statistic, r, and Tajima’sneutrality statistic, D, can be used to differentiate be-tween expanding and constant population size (Tajima1989; Harpending 1994; Aris-Brosou and Excoffier1996); both statistics were calculated with the ARLE-QUIN package. Estimates of one of the parameters, t,from the Rogers and Harpending (1992) model of sud-den population growth, were used to characterize mis-match distributions; t was computed with the MIS-MATCH package (Rogers 1995). Estimates of pastpopulation expansions and separations are measured as
units of mutational time, in which m is the totalt = 2mtmutation rate over all sites in the sample and t is timein generations (Rogers 1995).
Estimation of 95% confidence intervals (CI) of thetimes of population expansion and the coalescence ofphylogenetic clusters were computed according to Reddet al. (1995) with their formula (1). This method incor-porates the variance in the estimates of the mutationrate and t (or genetic distance). We estimated the SE oft by simulating population expansions, using the esti-mates of t, sample size, and initial population size. Wecalculated 95% CI ( ), assuming a substitution5 2 # SErate of /site/year (Horai et al. 1995;288.85 # 10 5 0.9Bonatto et al. 1997).
Results
9-bp Deletion
The 9-bp deletion was absent in the 200 AboriginalAustralians tested (table 1). The frequency of the dele-tion is !1% in the 656 Aboriginal Australians typed for

Redd and Stoneking: Australian and PNG mtDNA Diversity 813
Table 3
mtDNA SSO-Type Diversity and New Variant Frequencies
PopulationNo. of
IndividualsNo. of
Unique TypesDiversitya
(h5SE)IF2b
(in %)IIB4b
(in %)IG2b
(in %)
Australia:Arnhem Land 95 51 .970 5 .009 0 0 2.1Northwest Australia 105 51 .981 5 .004 0 1.0 1.9
PNG:Highlands 70 33 .948 5 .014 4.0 15.7 35.7Coastal 48 24 .943 5 .017 22.9 8.3 14.6
East Indonesia:c
Moluccas 49 29 .967 5 .013 6.1 0 8.2Nusa Tenggaras 94 54 .974 5 .008 5.3 0 3.2
Asia:c
Java 98 68 .981 5 .007 0 0 1.0Borneo 95 61 .979 5 .007 0 1.1 1.1Philippines 176 73 .955 5 .008 0 0 .6Taiwan 82 39 .967 5 .008 0 0 0Malay 81 53 .979 5 .007 0 0 2.5Orang Asli 30 15 .924 5 .028 0 0 0China 103 73 .992 5 .003 0 0 1.9Pushtoon 76 56 .990 5 .004 0 0 0Bangladesh 31 30 .998 5 .009 0 0 0Sikh 47 35 .981 5 .010 0 4.3 0Southern Indian 75 66 .996 5 .003 0 1.3 1.3
a See Nei (1987) page 180.b New SSO probes (see table 2).c Previously typed with 24 SSO probes (Melton et al. 1995).
this marker (Hertzberg et al. 1989; Stoneking and Wil-son 1989; Betty et al. 1996; van Holst Pellekaan et al.1997), including those typed in this study.
SSO Types
Table 3 shows the haplotype diversity of the SSO types(unique arrays of 11 variants) per population and thefrequencies of the new SSO-probe variants. The SSOprobes detected high levels of variation within popula-tions; the haplotype-diversity values ranged from 0.92to 0.99. All of the new probe variants (IF2, IIB4, andIG2) were found in individuals from the PNG coast andthe PNG highlands but they were significantly more fre-quent in the PNG highlands ( ; x2 test). The IF2P ! .01variant was restricted to individuals from PNG(23%–40%) and east Indonesia (5%–6%). The IIB4 var-iant was detected in individuals from PNG (8%–16%)and it was present at very low frequencies in northwestAustralian (1%) and Asian populations (! 1% onaverage). The IG2 variant was present in moderatefrequencies in individuals from PNG (15%–36%)lower frequencies in individuals from east Indonesia(3%–8%), and was rare in Aboriginal Australians (2%)and Asians (! 1% on average).
A total of 504 SSO types were detected among the1,355 individuals. Frequencies of sharing among theSSO types was >5% in at least one population in only35 SSO types, and was >5% in at least two populationsin seven SSO types. Twenty-two SSO types were shared
among PNG highland, Aboriginal Australian, east In-donesian, and southern Indian populations: one type (infour individuals) was shared by Aboriginal Australiansand PNG highlanders; two types (in 26 individuals) wereshared by PNG highlanders and east Indonesians; fourtypes (in 19 individuals) were shared by Aboriginal Aus-tralians and east Indonesians; nine types (in 37 individ-uals) were shared by Aboriginal Australians and south-ern Indians; and four types (in 23 individuals) wereshared by east Indonesians and southern Indians. In ad-dition, one type (in seven individuals) was shared amongAboriginal Australian, east Indonesian, and southernIndian populations; and one type (in seven individuals)was shared among all four populations.
PNG Clusters Inferred from SSO Type Data
After examination of the SSO types, samples fromPNG populations were assigned to one of the clusters(PNG1, PNG2, and PNG3) that were defined previouslyfrom phylogenetic analysis (Stoneking et al. 1992).Characteristics of the PNG clusters and populations aregiven in table 4. Several patterns are apparent, consistentwith results from previous analyses of PNG mtDNArestriction-enzyme typing (Stoneking et al. 1990) andCR sequencing (Stoneking et al. 1992). PNG1 types (9-bp deletion lineage; Redd et al. 1995) are found in pop-ulations from coastal regions only, whereas PNG2 andPNG3 types are more frequent in populations from thehighland areas but are also present in populations from
814 Am. J. Hum. Genet. 65:808–828, 1999
Table 4
Characteristics of PNG Clusters per Populations, as Defined bySSO-Type Data
CharacteristicPNG1Cluster
PNG2Cluster
PNG3Cluster
PNGOther Total
No. of Individuals 21 33 48 16 118No. of Types 10 11 17 14 52Residence (in %):
Highland .0 37.1 47.1 15.7 70Coastal 43.8 14.6 31.3 10.4 48
Language (in %):a
NAN 5.9 31.8 48.2 14.1 85AN 53.3 20.0 16.7 10.0 30
9-bp deletion (in %):Nondeleted .0 34.0 49.5 16.5 97Deleted 100.0 .0 .0 .0 21
Geography (in %)b:EH .0 58.6 31.0 10.3 29SH .0 22.0 58.5 19.5 41NC 11.8 17.6 58.8 11.8 17SC 57.9 10.5 15.8 15.8 19IS 66.7 16.7 16.7 .0 12
Population (in %):Aboriginal Australian .0 .5 .0 200East Indonesian 25.9 4.2 4.2 143
NOTE.—PNG phylogenetic clusters (PNG 1–3) are as defined byphylogenetic analysis (Stoneking et al. 1992) and inferred from SSO-type data.
a “NAN” = non-Austronesian and AN = Austronesian. Languageaffiliation not known for three samples.
b “EH” = eastern Highlands, “SH” = southern Highlands, “NC” =north coast, “SC” = south coast, and “IS” = offshore islands (Stonekinget al. 1990).
the coast. Specific trends are also apparent when resi-dence (highland versus coast) and language (Austrone-sian [AN] vs. Non-Austronesian [NAN] speakers) arecompared, with respect to the PNG clusters. PNG2 andPNG3 are significantly more frequent among popula-tions from the highlands ( ; x2 test) and NANP ! .01speakers ( ; x2 test) compared with the PNGP ! .01coastal populations and AN speakers, respectively. Inaddition, the frequencies of the PNG clusters vary bygeographic region. PNG1 sequences are found most fre-quently among island and south coast regions, althoughsample sizes preclude reliable x2 tests. PNG2 and PNG3,which together account for 84% of the highland sample,differ significantly in frequency within the highlands,with PNG2 most frequent in populations from the east-ern highlands ( ; x2 test) and PNG3 most frequentP ! .01in populations from the southern highlands ( ; x2P ! .01test). Table 4 also shows SSO types from east Indonesiaand Australia that were assigned to the PNG clusters.A single individual from Australia has an SSO type thatbelongs to PNG2, whereas there are many SSO typesfrom east Indonesia that belong to PNG1 (26%) andfewer that belong to PNG2 (4%) or PNG3 (4%).
CR Sequences
The SSO-type data from the populations guided theselection of a representative sample (with considerationgiven to the range and frequency of types) of mtDNAfrom Australian and east Indonesian populations for CRsequencing. (The composition of the 15 CR sequencesfrom the PNG highlands is also representative [PNG2 =33%, PNG3 = 47%, and PNG other = 20%] of the 70PNG highland individuals shown in table 4.) The sampleof individuals selected for CR sequencing also includedsix mtDNA with shared SSO types between populations:one between Aboriginal Australian and PNG highlandpopulations; two between east Indonesian and PNGhighland populations; two between Aboriginal Austra-lian and east Indonesian populations; and one amongAboriginal Australian, PNG highland, and east Indo-nesian populations. Furthermore, the sample includedone Aboriginal Australian who had the IIB4 site.
Sequence data were obtained for 78 individuals, in-cluding 25 from northwest Australia, 28 from ArnhemLand, 8 from the Moluccas, and 17 from the Nusa Teng-garas. Comparisons of these sequences with previouslypublished sequences from PNG and east Indonesia (Vig-ilant et al. 1991; Stoneking et al. 1992; Redd et al. 1995),excluding mtDNA with the 9-bp deletion, revealed 100unique sequence types (fig. 2Aand2B). Of the 145 var-iable sites, nearly twice as many ( ) occur in HVS-n = 91I compared with HVS-II ( ). Transitions alone oc-n = 54curred at 127 sites, transversions alone at 12 sites, andboth transitions and transversions at 6 sites. Sequence-type sharing within populations was observed for fivesequences (types 101, 102, 106, 247, and 275;fig. 2Aand B ). However, type sharing between populations wasnot observed among the sequences infigure 2. This is insharp contrast to mtDNA with the 9-bp deletion, inwhich identical CR sequences are shared across popu-lations from Polynesia, the PNG coast, east Indonesia,and Asia (Redd et al. 1995).
Phylogenetic Results
Gene Tree
Figure 3 shows an ME tree, made on the basis of 597sites for 308 unique sequences, constructed from a ma-trix of the proportion of nucleotide differences androoted with four chimpanzee sequences (Foran et al.1988; Kocher and Wilson 1991). The ME tree roots firstamong African sequences. One type (299), from eastIndonesia, clustered among the African sequences. FourAboriginal Australian sequences (types 273–276) andone PNG coast sequence (type 277) clustered near thebasal portion of the tree, adjacent to a large Africancluster. The ME tree contains the three PNG clusters,largely intact, that were first identified by Stoneking et
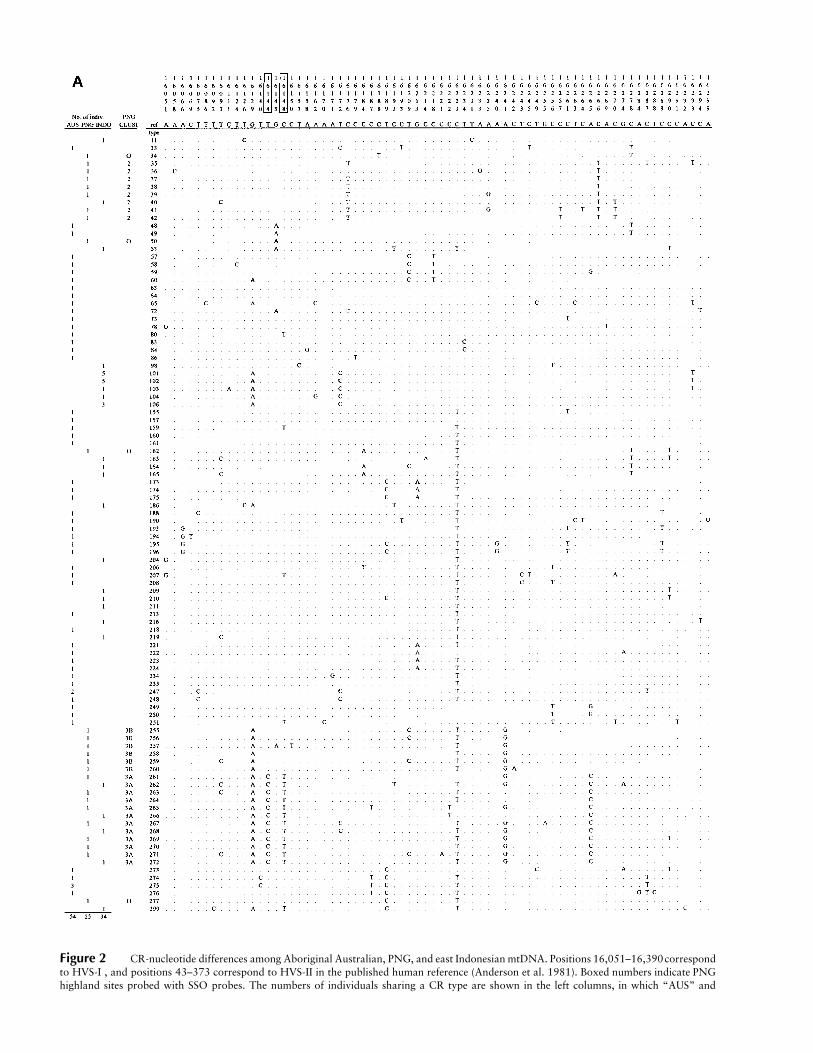
Figure 2 CR-nucleotide differences among Aboriginal Australian, PNG, and east Indonesian mtDNA. Positions 16,051–16,390correspondto HVS-I , and positions 43–373 correspond to HVS-II in the published human reference (Anderson et al. 1981). Boxed numbers indicate PNGhighland sites probed with SSO probes. The numbers of individuals sharing a CR type are shown in the left columns, in which “AUS” and

“INDO” denote Aboriginal Australian and east Indonesian, respectively. “PNG CLUST” denotes phylogenetic clusters PNG2, PNG3A, PNG3B,and PNG O (other) (Stoneking et al. 1992). CR sequences from mtDNA with the 9-bp deletion were not included in this figure, since theyhave been shown elsewhere by Redd et al. (1995).

Figure 3 ME tree of 308 CR sequences rooted with four chimpanzee sequences. An NJ tree was first constructed from a distance matrixof the proportion of nucleotide differences, after which the ME tree was determined (Rzhetsky and Nei 1992, 1993). The numbers in the rightcolumn (1–300) indicate sequence-type numbers in increments of ten and correspond to the three dots after the geometric symbols. The PNGclusters (1, 2, and 3) are indicated with brackets. The letters “A” and “B” denote PNG3 subclusters. Asterisks (*) denote the PNG nodes, withconfidence probabilities shown above, and the bootstrap probabilities shown below. Genetic distance is shown on the scale bar below the tree.Outgroup rooting with the Neanderthal sequence (Krings et al. 1997, 1999) produced nearly identical patterns of clustering.

818 Am. J. Hum. Genet. 65:808–828, 1999
Figure 4 NJ population tree on the basis of CR sequences. Thetree was constructed, with use of dXY distances, from a matrix of theproportion of nucleotide differences. The arrow indicates the root, onthe basis of chimpanzee outgroup and midpoint rooting. The numbersindicate the bootstrap probabilities (150%).
Figure 5 MDS population-plot of CR sequences. Abbreviations:“Afr” = African, “PNGh” = PNG highlander, “PNGc” = PNG coastal,“Poly” = Polynesian, “Mol” = Moluccas, “Nusa” = Nusa Tenggaras,“Asia” = Asian, “Euro” = European, “NWA” = northwest Australia,“Arn” = Arnhem Land, “Hav” = Havik, and “Muk” = Mukri. MDSwas performed on a genetic-distance matrix with the assumption ofthe Tamura-Nei model of substitution with a gamma correction.
al. (1992). The PNG3 cluster is located near the Africancluster and includes four east Indonesians (types 262,266, 268, and 272) in the PNG3B subcluster, whereasPNG3A remained monophyletic. The PNG2 cluster lostone PNG highlander (type 50) and includes one eastIndonesian (type 40). All mtDNA with the Asian formof the 9-bp deletion (types 121–154) but one (type 156[Japanese]) clustered together, consistent with previousfindings (Redd et al. 1995). CP values for the highlandPNG clusters and subclusters were all 187%, whereasbootstrap values were lower. Four PNG sequences didnot fall into any of the PNG clusters, with three of them(types 34, 50, and 277) clustering with Australian se-quences—albeit distantly (types 34, 50, and 277 differby 11, 3, and 9 sites, respectively, from their nearestAustralian neighbors)—and the other (type 162) clus-tering with east Indonesian sequences. In contrast, theAboriginal Australian sequences formed several smallerclusters with their nearest neighbors from southern India(five occurrences), Africa (five occurrences), Europe (fiveoccurrences), Asia (four occurrences), highland PNG(two occurrences), and coastal PNG (one occurrence).The east Indonesian sequences were also widely distrib-uted across the tree, and their clusters had nearest neigh-bors from Asia (10 occurrences), PNG (eight occur-rences), Polynesia (three occurrences), southern India(three occurrences), and Africa (two occurrences).
Coalescent Estimates
The rough age of the highland PNG clusters can beestimated from the genetic distance to the node of eachcluster, with the assumption of a constant rate ofmtDNA CR evolution. The estimated-sequence distanceto the nodes of the PNG highland clusters (fig. 3) are as
follows: PNG2, 0.71% 5 0.10%; PNG3A, 0.61% 50.10%; PNG3B, 0.45% 5 0.04%; and PNG3, 1.08%5 0.04%. The assumption of a rate of mtDNA CR-sequence evolution of 8.85 # 1028 5 0.9/site/year(Horai et al. 1995; Bonatto et al. 1997) results in a meanestimate of 80,226 years for PNG2 (95% CI =66,289–94,163 years); 68,927 years for PNG3A (95%CI = 55,630–82,224 years); 50,847 years for PNG3B(95% CI = 43,980–57,715 years); and 122,034 yearsfor PNG3 (95% CI = 108,826–135,242 years).
Population Tree and MDS Plot of CR Sequences
Figure 4 shows an NJ tree for populations, constructedfrom a matrix of the proportion of nucleotide differ-ences, with dXY distances. Midpoint and chimpanzee-outgroup rooting both place the root between Africa andthe other populations. The next major separation in thetree occurs between PNG highland populations and thenon-African populations. The Aboriginal Australianpopulations group with the southern Indian popula-tions, although the bootstrap probabilities are !50%.The cluster that received more support (bootstrap values150%) from the bootstrap test included the east Indo-nesian, PNG coastal, and Polynesian populations. A co-phenetic-distance matrix (Rohlf and Sokal 1981), pro-duced from the tree topology, correlates with the originaldistance matrix at value of (Mantel 1967); ther = 0.84fit between the original distances and the one-dimen-sional tree is, thus, moderately close.
The MDS plot (fig. 5) of the CR sequences displayedpatterns of population clustering that were very similarto the phylogenetic tree (fig. 4). Most of the populationsgrouped loosely in the center of the plot, whereas theAfrican and PNG highland populations were each sep-arated from all other populations. Both the phylogenetictree and the MDS plot separated PNG highlanders and

Redd and Stoneking: Australian and PNG mtDNA Diversity 819
Figure 6 NJ population tree on the basis of SSO-type data. Thetree was constructed from a matrix of Slatkin-linearized FST valuesthat incorporates the genetic distance between 504 SSO-types, detectedamong 1,355 individuals, and their frequency in 17 populations. Ge-netic distance is indicated on the scale bar below the tree.
Figure 7 MDS population-plot of SSO-type data. Abbreviations:“PNGh” = PNG highlander, “PNGc” = PNG coastal, “OA” = OrangAslian, “NWA” = northwest Australian, “Arn” = Arnhem Lander,“Bng” = Bangladeshian, “S Ind” = southern Indian, “Chi” = Chinese,“Psht” = Pushtoon, “Jav” = Javan, “Mly” = Malaysian, “Brn” = Bor-nean, “Flp” = Filipino, “Tai” = Taiwanese, “Mol” = Moluccasan,“Nus” = Nusa Tenggarasan. MDS was performed on a matrix ofSlatkin-linearized FST values that incorporates the genetic distance be-tween 504 SSO types, detected among 1,355 individuals, and theirfrequency in 17 populations.
Aboriginal Australians and placed Aboriginal Austra-lians closest to populations from the Indian subconti-nent. However, the correlation between the original ge-netic distances and the two-dimensional plot was muchcloser ( ).r = 0.96
SSO-Type Population Tree and MDS Plot
The above analyses of mtDNA CR sequences indicatethat Aboriginal Australian and PNG highland popu-lations do not group together. In fact, Aboriginal Aus-tralian populations group with Indian populations,whereas the highland PNG population is separate fromall other populations. To determine whether these pat-terns would persist in a larger sample of Asian popu-lations, these analyses were repeated with the SSO-typedata. Figure 6 shows an NJ tree for 17 populations,which was constructed from the SSO-type data. Thesedata incorporate the genetic distances between 504 SSOtypes detected among 1,355 individuals. The SSO-typepopulation tree shows a major division between the PNGhighland, PNG coastal, and Orang Asli populations andthe remaining populations. These remaining populationscan be divided into two subclusters, one that includesthe Aboriginal Australians, Bangladeshi, and southernand northern Indians and the Pushtoons; and a secondsubcluster that includes the Chinese and SoutheastAsians. The Moluccan sample is located at a basal po-sition to the second subcluster. A cophenetic-distancematrix, produced from the tree topology, correlates withthe original distance matrix at a low level ( ).r = 0.73
Figure 7 shows an MDS plot of the SSO-type data.The two major clusters in the plot include a PNG clusterand a large cluster of the remaining populations. Thislarge cluster can be divided into two subclusters, onethat includes the Southeast Asian and southern Chinesepopulations, and another cluster that includes the Ab-original Australian and Indian subcontinent popula-tions. The Orang Asli population is separated from allother populations in the MDS plot. The correlation be-tween the original genetic distances and the two-dimen-sional plot was close ( )r = 0.97
The patterns of population clustering, determinedfrom the CR-sequence data and the SSO-type data, weresimilar in most respects. Both data sets indicate that thehighland PNG and Aboriginal Australians do not clustertogether and that the Aboriginal Australians group withpopulations from the Indian subcontinent. However, theCR-sequence data separate highland and coastal PNGpopulations, whereas the SSO-type data place the coastaland highland PNG population samples closer together.SSO typing of the complete PNG coastal sample detectedmtDNA from PNG1 (43.8% of the sample), from thehighland-cluster PNG2 (14.6% of the sample), and fromPNG3 (31.3% of the sample) (table 4). In contrast, thesample of CR sequences from the PNG coast containsmore PNG1 sequences (68%) and fewer PNG2 (7%)and PNG3 (23%) sequences, because Redd et al. (1995)focused on the evolutionary history of the 9-bp deletion

820 Am. J. Hum. Genet. 65:808–828, 1999
Figure 8 Mismatch distributions of CR sequences within populations from Arnhem Land, northwest Australia, PNG highland, PNGcoast, Nusa Tenggaras, and the Moluccas. The numbers of nucleotide differences between all pairs of sequences are indicated along the x-axis,and the frequency of pairs is indicated along the y-axis.
lineage. In fact, when the PNG coastal sample includesonly SSO types that were deduced from the sequencedata, the trees and MDS plots of the SSO-type dataseparate highland and coastal PNG samples (data notshown).
Population-Differentiation Tests in SSO-Type Data
The permutation test of pairwise FST values betweenpopulations indicates that nearly all of the populationsare differentiated from each other ( ) with the fol-P ! .05lowing exceptions: Moluccas versus Java ( ),P = .0504Moluccas versus Malay ( ), Java versus MalayP = .44( ), Malay versus Chinese ( ), and PushtoonP = .06 P = .29versus Sikh ( ). The exact test of population dif-P = .15ferentiation also revealed significant differences betweenthe majority of populations with the following excep-
tions: Bangladesh versus southern India ( ), Bor-P = .31neo versus Java ( ), Java versus Malay ( ),P = .16 P = .36and Pushtoon versus Sikh ( ).P = .30
Pairwise Difference Distributions
Mismatch distributions within PNG (coast and high-land), Australia (northwest Australia and ArnhemLand), and east Indonesia (Moluccas and Nusa Teng-garas) are shown in figure 8, and their summary statisticsare shown in table 5. The mismatch distributions arederived from the same 672 nucleotide sites for all pop-ulations. The PNG coast mismatch distribution wasclearly bimodal and displayed a very high variance. Thisresult suggests the occurrence of two distinct migrations(Wakeley 1996) into this region, the first being the an-cient migration that gave rise to Papuan speakers, and

Redd and Stoneking: Australian and PNG mtDNA Diversity 821
Table 5
Mismatch Distributions and Their Summary Statistics
Population andGeographic Region
No. ofIndividuals Mean Variance
No. ofSegregating
SitesHarpending’s
ra
Tajima’sDb tc
AboriginalAustralian: 54 10.93 18.68 97 .004 21.712d 8.14
Arnhem Land 28 11.42 18.70 75 .010 21.561 8.73Northwest Australia 25 9.91 18.62 60 .008 21.461 6.96
PNG: 46 10.56 31.72 70 .009 21.196 5.96Highland 15 12.48 23.77 46 .019 2.507 9.12Coastal 31 7.94 41.24 48 .025 21.254 2.17
East Indonesians: 59 9.63 16.02 76 .006 21.419 7.10Moluccas 16 9.61 13.24 41 .061 2.934 7.70Nusa Tenggaras 43 9.61 17.37 67 .006 21.356 6.83
a Harpending’s (1994) raggedness statistic.b Tajima’s (1989) statistic.c (in which m = the mutation rate) Rogers (1995).t = 2mtd P ! .05
the second a more recent migration by Austronesianspeakers. When the mismatch distribution of mtDNAwith the 9-bp deletion from the PNG coast is plottedseparately it corresponds to the leftmost peak (Redd etal. 1995). The Moluccan sample displays the most un-even distribution when Harpending’s raggedness statisticis considered. The observed raggedness value of 0.061in the Moluccan population is within the range of values(0.05–0.75) that suggest constant population size, ac-cording to Harpending et al. (1993), although the sam-ple size is rather small.
Although all populations exhibit a negative value forTajima’s D statistic, suggesting population expansions,this value reaches statistical significance only in theAboriginal Australian sample. If we assume that theobserved values of Harpending’s raggedness statisticroughly indicate population expansions, then the PNGhighland mismatch distribution has the largest value fort, , whereas the Aboriginal Australian distri-9.1 5 2.3bution (not shown but unimodal) and the east Indo-nesian distribution (not shown but unimodal) haveslightly smaller t values of and , re-8.1 5 1.8 7.1 5 1.6spectively. These values correspond to estimated expan-sion times of ∼76,507 years for the PNG highland sam-ple ( ); ∼68,099 years95% CI = 55,663–97,350 yearsfor the Aboriginal Australian sample (95% CI =
); and 59,692 years for the east51,457–84,742 yearsIndonesian sample ( );95% CI = 44,934–74,450 yearswith the assumption of a substitution rate of 8.85 #
/site/year (Horai et al. 1995; Bonatto et al.2810 5 0.91997).
Population Divergence
Intermatch distributions from comparisons betweenAfricans and all other populations (PNG highland, PNG
coastal, Aboriginal Australian, east Indonesian, south-ern Indian, European, Asian, and Polynesian) are all verysimilar (fig. 9A). In contrast, the intermatch comparisonsbetween PNG highlanders and all other populations (fig.9B) show that the intermatch distribution between PNGhighlanders and Africans ( ) leads all othert = 15.1 5 2.1intermatch distributions. In addition, the intermatch dis-tribution between PNG highlanders and Aboriginal Aus-tralians ( ) mirrors the intermatch distri-t = 12.5 5 0.9butions between PNG highlanders and the remainingnon-African populations. Finally, the intermatch com-parisons between Aboriginal Australians and all otherpopulations (fig. 9C) show that the most leading inter-match distribution occurs between Aboriginal Austra-lians and Africans ( ). The second-mostt = 12.7 5 2.3leading intermatch distribution occurs between Aborig-inal Australians and PNG highlanders ( ),t = 12.5 5 0.9whereas the remaining intermatch distributions betweenAboriginal Australians and all remaining non-Africanpopulations are quite similar. However, the intermatchdistribution between Aboriginal Australians and south-ern Indians is furthest to the left ( ).t = 7.96 5 1.4
Similar patterns of population divergence are foundwhen one subtracts the ancestral polymorphism andconsiders only net genetic divergence (dA) between pop-ulations (fig. 10). Estimates made on the basis of theTamura-Nei model of substitution that include a cor-rection for rate variation ( ) indicate that the dAa = 0.19values between the PNG highlanders and all other pop-ulations is high, relative to dA values between AboriginalAustralians and all other populations. Aboriginal Aus-tralians show recent divergence with southern Indianpopulations. In fact, the net divergence between PNGhighlanders and Aboriginal Australian populations( ) is 12 times greater than the netd = 0.36% 5 0.11%A
divergence between Aboriginal Australians and southern

822 Am. J. Hum. Genet. 65:808–828, 1999
Figure 9 Intermatch distributions of CR sequences among sev-eral populations. Panel A plots the intermatch distributions betweenAfricans and all other populations (European, Asian, east Indonesian,Polynesian, Aboriginal Australian, PNG highlander, PNG coastal, andsouthern Indian). Panel B plots the intermatch distributions betweenPNG highlanders and all other populations. Panel C plots the inter-match distributions between Aboriginal Australians and all other pop-ulations. The numbers of nucleotide differences, between all pairs ofsequences among populations, are indicated along the x-axis, and thefrequency of pairs is indicated along the y-axis.
Indians ( ). These estimates of netd = 0.03% 5 0.03%A
divergence correspond to a date of separation betweenPNG highlanders and Australian Aborginals of 40,678years ( ) and a date of95% CI = 34,128–47,228 yearsseparation of Aboriginal Australians from southern In-dians of only 3,390 years (95% CI = 1,686–5,093years).
The population divergence between the Polynesian
(and PNG coastal populations) and all other populationsis relatively larger, with regard to dA distances, than withintermatch distributions and is likely the result of bot-tlenecks. Average-sequence variation within populationsindicates that the Africans harbor the most genetic di-versity, followed by PNG highlanders, whereas the Pol-ynesians show the least genetic diversity (fig. 10).
Discussion
The analyses of the mtDNA SSO-type and CR-se-quence data from this study highlight the distinctivenessof PNG highlanders in comparison with worldwide pop-ulations, including Aboriginal Australians, and suggesta possible connection between Aboriginal Australiansand populations from the Indian subcontinent. The newSSO probes (IF2, IG2, and IIB4) were detected in sta-tistically higher frequencies in highland PNG popula-tions than in coastal PNG populations and were presentin east Indonesians (3%–8%) but were nearly absent inAboriginal Australians (2%). Examination of SSO typesindicates that PNG2 and PNG3 mtDNA are most oftenfound among PNG highlanders (84%), are much lessfrequent among east Indonesians (8%), and are rare orabsent among Aboriginal Australians and all other Asianpopulations examined. This pattern is consistent withthe distribution of Papuan languages in New Guinea andeast Indonesia (see below). In addition, the SSO-typevariation is structured within PNG, with PNG2 se-quences being more frequent in populations from theeastern highlands and PNG3 sequences being more com-mon in populations from the southern highlands. Thus,the SSO-type data provide evidence for substantial in-ternal and external isolation in populations from thePNG highlands.
The ME gene tree constructed from CR sequencesdisplayed very little connection between PNG highland-ers and Aboriginal Australians, despite our efforts todetect common mtDNA between them by using the SSOtypes. East Indonesians were found in all three PNGclusters, whereas Aboriginal Australians were not foundin any of the PNG clusters. The highland PNG clusters(PNG3 and PNG2) received high support from the CPtest, whereas the PNG3B cluster also received high sup-port from the bootstrap test. This finding is noteworthybecause the majority of non-PNG clusters in the ME treereceived very low bootstrap probabilities, meaning thatthese PNG clusters are unique. The PNG3 cluster waslocated adjacent to the large African cluster, and theyshare some substitutions, such as 16129A, which is ab-sent or at very low frequency in Aboriginal Australianpopulations. mtDNA from the PNG2 and PNG3 clusterscomprised 84% of the PNG highland sample, 54% ofthe PNG coast sample, and 8% of the east Indonesiansample. The coalescence times for these two clusters are

Redd and Stoneking: Australian and PNG mtDNA Diversity 823
Figure 10 CR-nucleotide diversity within and between populations. Average-nucleotide differences are shown within (dX along diagonal,with their SE in parentheses) and between populations (dA below diagonal, with their SE above diagonal) (Nei and Jin 1989), with the assumptionof the Tamura and Nei (1993) model of substitution with a gamma parameter of 0.19. Net differences (dA) between Aboriginal Australian andsouthern Indian populations, and between Aboriginal Australian and PNG highlander populations, are boxed. All values were multiplied by10,000.
80,226 years for PNG2 and 122,034 years for PNG3.In contrast, mtDNA from Aboriginal Australian popu-lations were intermingled across the gene tree and wereabsent from the PNG2 and PNG3 clusters. These pat-terns suggest that the effects of genetic drift were moreimportant in PNG populations than in Aboriginal Aus-tralian populations, and they are consistent with an earlymigration from Africa to PNG (Sahul), with a muchgreater degree of isolation in populations from the high-lands than in populations from the coast and east In-donesia, as well as in populations from Australia.
The intermatch distributions also provide evidence forlarge evolutionary differentiation between PNG high-landers and Aboriginal Australians. The largest inter-match separation occurred between PNG highlandersand Africans, whereas another level of separation oc-curred between PNG highlanders and all other popu-lations including Aboriginal Australians. The peak( ) of the intermatch distribution betweent = 12.5 5 0.9PNG highlanders and Aboriginal Australians leads thepeaks of their mismatch distributions ( andt = 9.1 5 2.3
, respectively; excess = 3.87). Simulations in-8.1 5 1.8dicate that leading intermatch distributions occur whenancestral-population separations precede daughter-pop-ulation expansions and when there are very low migra-tion rates (Harpending et al. 1993). Thus, it appears,from the intermatch distributions, that the Aboriginal
Australian and southern Indian populations derive fromthe same ancestral population, whereas the highlandPNG population derives from a completely different an-cestral population.
Both the NJ tree and the MDS plot of the mtDNA-sequence data, as well as the tree and MDS plot of theSSO-type data, group the Aboriginal Australian popu-lations with populations from the Indian subcontinent.It is noteworthy that the CR-sequence and SSO-type dataderive from different Indian populations: the sequencedata are from the Havik and the Mukri, whereas theSSO-type data include Southern Indian, Sri Lankan,Sikh, and Pushtoon populations. Thus, the connectionbetween Australia and the Indian subcontinent suggestedhere is not dependent on specific Indian populations. Inaddition, an MDS plot that includes CR sequences(HVS-I only) from two additional groups of AboriginalAustralians, the Desert and the Riverine (van Holst Pel-lekaan et al. 1997), links all the Aboriginal Australianpopulations with Indian subcontinent populations, al-though the Riverine population clusters a bit more dis-tantly from the others (data not shown). Furthermore,the net separation between Aboriginal Australian pop-ulations and southern Indian populations appears to bemuch more recent than the separation between Aborig-inal Australian populations and PNG highland popu-lations. The precision of the estimated divergence times

824 Am. J. Hum. Genet. 65:808–828, 1999
should be considered somewhat cautiously, since theseestimates are associated with large uncertainties. How-ever, the patterns are consistent with a separate origin(or ancient separation) for PNG highlanders and Aus-tralian Aboriginals and with recent genetic affinities be-tween southern Indian populations and Aboriginal Aus-tralian populations.
These findings are somewhat consistent with Birdsell’strihybrid model for the peopling of Sahul, a model thatis based on morphological variation (Birdsell 1967,1993). Birdsell hypothesized that Oceanic “Negritos”first populated Sahul, but that two later migrations re-placed most of them in Australia but not in the Cairnsarea of northeast Queensland or in Tasmania and NewGuinea. According to this model, the second migrationof populations, with affinities to the Ainu of Japan, dis-persed throughout Australia, whereas the third migra-tion of populations, with affinities to tribal populationsof India, entered northern Australia around the Gulf ofCarpentaria. The gene tree in the present study showsthat the PNG3 cluster shares sites with African se-quences, a finding that may be consistent with Birdsell’sfirst-migration hypothesis. Our results also suggest thatthere may have been a migration(s) from an Indiansource that reached Australia but not PNG. However,our results do not support two distinct source popula-tions for the subsequent peopling of Australia, becauseAboriginal Australian populations cluster together withsouthern Indian populations. That is, we did not detecta major distinction between populations derived fromthe putative second migration (northwest Australia [Des-ert and Riverine]) and the third migration (ArnhemLand), although our analyses did not include Ainu pop-ulations. Furthermore, our findings link Hindu castepopulations from southern India, rather than exclusivelytribal populations, with Aboriginal Australians. Thismay indicate that substantial mixing of mtDNA has oc-curred among southern Indian populations (Mountainet al. 1995). To summarize, our data indicate thatthe PNG highlanders contain distinct and divergentmtDNA, with evidence of ancient African ties, that wererare or absent in Aboriginal Australians and suggest apossible recent connection between Aboriginal Austra-lian populations and populations from the Indiansubcontinent.
Anthropologists have long suggested that AboriginalAustralians and southern Indians have affinities (Birdsell1967; Brown 1997), although corroborative evidencehas been weak (Kirk and Thorne 1976; White andO’Connell 1982). The archaeological record in Australiahas been noted for its dramatic increase in the densityand range of stone-tool technology, including backedblades, across large areas of the continent, and the con-comitant first appearance of the dingo ∼4,500 years ago(Bellwood 1989). The similarities of the backed-blade
technology and dingo morphology in India and Australiahave been cited as support for Indian-Australian con-nections (Glover and Presland 1985; Gollan 1985). Arecent multivariate analysis of dingo morphology sup-ports a relationship between Indian and Arabian wolvesand Australian dingoes (Corbett 1995). However, Cor-bett (1995) thinks that dingoes were brought to Aus-tralia via the Austronesian expansion and that most ofthe primitive dogs of the Pacific were descended fromsoutheast Asian dingoes, perhaps from Thailand.
Linguistic diversity in the Pacific does not suggest acommon origin for PNG highlanders and AboriginalAustralians. New Guinean and Aboriginal Australianlanguages are very distinct. Papuan languages encom-pass one of the most diverse linguistic regions in theworld, with1700 different languages spoken by !4 mil-lion speakers, nearly all in New Guinea (Wurm 1982).The evolutionary relationships among many of the Pap-uan languages have not been discerned, thus the term“non-Austronesian” rather than “Papuan” is often usedto emphasize this fact (Foley 1986). Pockets of Papuan-speaking peoples are found on some islands in east In-donesia, such as Timor and Halmahera, and extend fromeastern PNG to the Solomon Islands chain and to theSanta Cruz Islands (Bellwood 1989). This linguistic dis-tribution is consistent with the mtDNA genetic links(PNG2 and PNG3 CR sequences) between east Indo-nesians (Hiri, Ternate, Flores, Alor, Roti, and Timor)and PNG.
Australian languages are confined to Australia and thewestern Torres Strait Islands (Dixon 1980). Today, ∼150Australian languages are spoken by Aboriginal people,although it is thought that ∼200 distinct languages werespoken by Aboriginal Australian people before Euro-pean contact (Dixon 1980). All Australian languages arethought to derive from the same language family. How-ever, two linguistic divisions are recognized, namelyPama-Nyungan, which includes a relatively homoge-neous group of languages that are found throughoutmost of Australia, and non-Pama-Nyungan, which in-cludes a larger number of languages that exhibit morediversity and are found in Arnhmen Land and north-central Australia. A variety of hypotheses have been sug-gested for Australian language affiliations with otherlanguages, including Malayo-Polynesian, Papuan, Dra-vidian, Indo-European, and Amerindian. Dixon (1980)says that the Dravidian connection is the only one thatdeserves any consideration since there are some similar-ities between Dravidian and Australian languages, butthe evidence does not meet standard criteria for a formalgenetic relationship. Linguistic relationships are difficultto trace beyond ∼8,000 years of separate evolution(Nichols 1994), and, since population divergence in Sa-hul likely precedes this date, the separate origin or an-cient divergence between Papuan- and Australian-speak-
Redd and Stoneking: Australian and PNG mtDNA Diversity 825
ing populations may be unresolvable with linguisticevidence.
Studies of morphological variation in crania seem tosupport the common-origin hypothesis for the peoplingof Sahul. One large study by Pietrusewsky (1994) in-cludes 12,500 male samples from 53 human groups fromPolynesia, Micronesia, Melanesia, Australia, southeastAsia, east Asia, and north Asia. Phylogenetic and mul-tivariate analyses place Aboriginal Australians and NewGuineans together in an “Australo-Melanesian” group.A similar suggestion of an Australian-New Guinean linkis supported by other studies of cranial variation inworldwide populations (Howells 1989; Hanihara 1996).
The common-origin hypothesis is rather equivocalwhen genetic evidence is considered. Polymorphisms inthe a-globin system have shown distinctive variation inPNG highland populations compared with northern Ab-original Australian populations (Yenchitosomanus et al.1985, 1986; Tsintsof et al. 1990), whereas central Aus-tralians shared similar haplotypes with PNG highlandpopulations (Roberts-Thomson et al. 1996). b-globinpolymorphisms indicated similarities with northern Ab-original Australians and island Melanesians rather thanwith PNG highlanders (Chen et al. 1992). Human leu-kocyte antigen (HLA)-A and HLA-B genes have indi-cated large genetic differences between AboriginalAustralians and PNG highlanders (Serjeantson 1985),whereas more-recent DNA-based research on HLA classI and II loci support the common-origin hypothesis (Ser-jeantson 1989; Gao and Serjeantson 1991; Yoshida etal. 1995).
Studies of classic polymorphisms have also led to con-flicting conclusions regarding Australian and New Gui-nean affinities. One study that included 21 populationsfrom Australia and New Guinea for nine classic loci didnot find any genetic similarities between Aboriginal Aus-tralians and New Guinea highlanders (Keats 1977). Fur-thermore, two studies of nuclear polymorphisms thatincluded large numbers of populations and loci showeddiscrepant results. Phylogenetic analyses of classic poly-morphisms (Nei and Roychoudhury 1993) in 29 loci(121 alleles) in worldwide populations placed the Ab-original Australian (Elcho Island, northern, central, andwestern populations) and New Guinea highlanders(north-central, western, eastern, and central-districthighlands) together in a cluster (see also Cavalli-Sforzaet al. 1994), but large genetic distances exist betweenthem, which are considerably larger than those that existbetween other Asian populations. In contrast, Kirk(1989) compared European, Asian (Japanese and Chi-nese), African, New Guinea highland (Fore and Go-roka), and Aboriginal Australian (central) populationsat 72 classic loci and found that the Aboriginal Austra-lian populations were more closely related to Asians thanto New Guinea highlanders.
One study (Roychoudhury 1984) specifically ad-dressed the hypothesis of genetic connections betweentribal Indian and Aboriginal Australian populations, us-ing 10 classic polymorphisms. The study included pop-ulations from India (Toda, Irula, and Kurumba), SriLanka (Veddah), Malaysia (Senoi), Australia (northernterritory), and New Guinea (western). A phylogenetictree grouped the Indian tribes closer to one another thanto the Australian population, and the Australian andNew Guinean populations clustered together. Neverthe-less, the distance matrix indicates that the Australianpopulation is equidistant from the Veddahs and the NewGuineans. In fact, when the matrix is examined in twodimensions with principal-coordinates analysis, the Aus-tralians are closest to the Veddahs (data not shown).
Another study of a large number of polymorphsims(∼75 RFLP loci) in small population samples did detectsome affinities between Aboriginal Australian and PNGhighlanders (Mountain and Cavalli-Sforza 1997). In aphylogenetic tree that included twelve populations fromAfrica, Asia (Chinese, Japanese, and Cambodian), Eu-rope, and the Pacific (Australian Aboriginals, highlandand coastal PNG, and Melanesians) most of the Abo-riginal Australians grouped with PNG highlanders.However, a large number of the Aboriginal Australianshad haplotypes that appeared to be the result of mixedancestry (Mountain and Cavalli-Sforza 1997).
Finally, analyses of data from Alu-insertion polymor-phisms provide evidence for a separate origin of Abo-riginal Australian and PNG populations. A principal-component analysis (PCA) of four Alu loci placed PNGpopulations close to the ancestral root, whereas thenorthwest Australian population clustered with westAsian populations that included southern Indian pop-ulations (Harpending et al. 1996). Harpending and col-leagues suggested that the PNG populations were in-volved in one of the earliest migrations from Africa.Similar results were found in a PCA of the same Aludata extended to eight loci (Stoneking et al. 1997).
Although these conflicting results leave many ques-tions open for further research, there seems to be grow-ing evidence (Keats 1977; Roychoudhury 1984; Yen-chitosomanus et al. 1985, 1986; Kirk 1989; Stonekinget al. 1990; Tsintsof et al. 1990; Chen et al. 1992; Har-pending et al. 1996; Stoneking et al. 1997; the presentstudy) that the common-origin hypothesis of AboriginalAustralian and New Guinean highlanders needs closerexamination. The studies of HLA (Serjeantson 1989;Gao and Serjeantson 1991; Yoshida et al. 1995), b-glo-bin (Roberts-Thomson et al. 1996), classic polymor-phisms (Nei and Roychoudhury 1993), and autosomalDNA (Mountain and Cavalli-Sforza 1997) that supporta common origin have not included southern Indians intheir comparisons (Nei and Roychoudhury 1993 in-cluded a northern Indian population in their study).

826 Am. J. Hum. Genet. 65:808–828, 1999
Many authors suggest that the genetic distinctions be-tween PNG highlanders and Aboriginal Australians arepartially the result of recent migrations that have alteredthe genetic similarity of PNG highland and AboriginalAustralian populations (Yenchitosomanus et al. 1986;Stoneking et al. 1990; Chen et al. 1992; Roberts-Thom-son et al. 1996). Other studies lump Aboriginal Austra-lians and New Guineans together in their analyses. Theevidence from the present study suggests that the as-sumption of a common origin of Aboriginal Australiansand PNG highlanders should be tested with studies thatinclude more loci and more populations from the Pacific,Asia, and the Indian subcontinent.
Acknowledgments
We are particularly grateful to the indigenous peoplesof the Pacific and Asia who participated in this study.In addition, we thank K. Bhatia, N. Kretchmer, J. Kuhl,and A. S. M. Sofro for providing blood and DNA sam-ples. We appreciate the generous computational assis-tance from N. Takezaki and S. Sherry. We thank A. G.Clark, L. Excoffier, H. Harpending, S. Kumar, C. R. Rao,A. Rogers, and G. Tiwari for their very helpful sugges-tions and comments, and T. Melton and R. Melton forassistance with software. We thank K. Tamura for pro-viding MEBoot version 1.0. This project was supportedby an National Science Foundation grant (to M.S.).
Electronic-Database Information
Accession numbers and URLs for data in this article are asfollows:
ARLEQUIN, http://anthropologie.unige.ch/arlequin (for AR-LEQUIN [S. Schneider, J.-M. Kueffer, D. Roessli, L.Excoffier])
GenBank, http://www.ncbi.nlm.nih.gov/Web/Genbank/index.html (for the sequences reported in this paper [accessionnumbers AF176125–AF176205])
GMAES, LINTRE, SENDBS, ftp.nig.ac.jp/pub/Bio (forGMAES, LINTRE, and SENDBS software packages [N.Takezaki] via FTP)
IWAVE, kimura.anthro.utah.edu/pub (for IWAVE softwarepackage [S.T. Sherry] via FTP)
MISMATCH, anthro.utah.edu/pub/rogers (for MISMATCHsoftware package [A.R. Rogers] via FTP)
MULTISCALE, ego.psych.mcgill.ca/pub/ramsay/multiscl (forMULTISCALE software package [J.O. Ramsay, McGill Uni-versity Psychology] via FTP)
References
Anderson S, Bankier AT, Barrell BG, de Bruijn MHL, CoulsonAR, Drouin J, Eperon IC, et al (1981) Sequence and organ-ization of the human mitochondrial genome. Nature 290:457–465
Aris-Brosou S, Excoffier L (1996) The impact of populationexpansion and mutation rate heterogeneity on DNA se-quence polymorphism. Mol Biol Evol 13:494–504
Bellwood PS (1989) The colonization of the Pacific: some cur-rent hypotheses. In: Hill AVS, Serjeantson SW (eds) Thecolonization of the Pacific: a genetic trail. Oxford UniversityPress, New York, pp 1–59
Betty DJ, Chin-Atkins AN, Croft L, Sraml M, Easteal S (1996)Multiple independent origins of the COII/tRNALys intergenic9-bp mtDNA deletion in Aboriginal Australians. Am J HumGenet 58:428–433
Birdsell JB (1993) Microevolutionary patterns in AboriginalAustralia: a gradiant analysis of clines. Oxford UniversityPress, New York, pp 22–23
——— (1967) Preliminary data on the trihybrid origin of theAustralian Aborigines. Archeology and Physical Anthro-pology in Oceania 2:100–155
——— (1957) Some population problems involving Pleisto-cene man. Cold Spring Harbor Symposium on QuantitativeBiology 22:47–69
Bonatto SL, Salzano FM (1997) Diversity and age of the fourmajor mtDNA haplogroups, and their implications for thepeopling of the New World. Am J Hum Genet 61:1413–1423
Brown P (1997) Australian paleoanthropology. In: Spencer F(ed) History of physical anthropology. Vol 1. Garland, NewYork, pp 138–145
Cavalli-Sforza LL, Menozzi P, Piazza A (1994) The history andgeography of human genes. Princeton University Press,Princeton, pp 77–79
Chen LZ, Easteal S, Board PG, Kirk RL (1992) Genetic affin-ities of Oceanic populations based on RFLP and haplotypeanalysis of genetic loci on three chromosomes. Hum Biol64:1–15
Corbett L (1995) The dingo in Australia and Asia. CornellUniversity Press, New York, 9–17
Dixon RMW (1980) The languages of Australia. CambridgeUniversity Press, New York, 1, 19–20, 234–236
Felsenstein J (1985) Confidence limits on phylogenies: an ap-proach using the bootstrap. Evolution 39:783–791
Foley WA (1986) The Papuan languages of New Guinea. Cam-bridge University Press, New York, pp 1–14
Foran DR, Hixson JE, Brown WM (1988) Comparisons ofape and human sequences that regulate mitochondrial DNAtranscription and D-loop DNA synthesis. Nucleic Acids Res16:5841–5861
Gao X, Serjeantson SW (1991) Diversity in HLA-DR4-relatedDR, DQ haplotypes in Australia, Oceania, and China. HumImmunol 32:269–276
Glover IC, Presland G (1985) Microliths in Indonesian flakedstone industries. In: Misra VN, Bellwood P (eds) Recentadvances in Indo-Pacific prehistory. Oxford and IBH, NewDelhi, pp 185–195
Gollan K (1985) Prehistoric dogs in Australia: an Indian or-igin? In: Misra VN, Bellwood P (eds) Recent advances inIndo-Pacific prehistory. Oxford and IBH, New Delhi, pp439–443
Graven L, Passarino G, Semino O, Boursot P, Santachiara-Benerecetti S, Langaney A, Excoffier L (1995) Evolutionarycorrelation between control region sequence and restriction

Redd and Stoneking: Australian and PNG mtDNA Diversity 827
polymorphisms in the mitochondrial genome of a large Se-negalese Mandenka sample. Mol Biol Evol 12:334–345
Groube L, Chappell J, Muke J, Price D (1986) A 40,000-year-old human occupation site at Huon Peninsula, Papua NewGuinea. Nature 324:453–455
Hanihara T (1996) Comparison of craniofacial features of ma-jor human groups. Am J Phys Anthrop 99:389–412
Harpending H (1994) Signature of ancient population growthin a low-resolution mitochondrial DNA mismatch distri-bution. Hum Biol 66:591–600
Harpending H, Relethford J, Sherry ST (1996) Methods andmodels for understanding human diversity. In: Boyce AJ,Mascie-Taylor CGN (eds) Molecular biology and humandiversity. Cambridge University Press, New York, pp283–299
Harpending HC, Sherry ST, Rogers AR, Stoneking M (1993)The genetic structure of ancient human populations. CurrAnthropol 34:483–496
Hertzberg M, Mickleson KNP, Serjeantson SW, Prior JF, TrentRJ (1989) An Asian-specific 9-bp deletion of mitochondrialDNA is frequently found in Polynesians. Am J Hum Genet44:504–510
Horai S, Hayasaka K, Kondo R, Tsugane K, Takahata N(1995) Recent African origin of modern humans revealedby complete sequences of hominoid mitochondrial DNAs.Proc Natl Acad Sci USA 92:532–536
Howells WW (1989) Skull shapes and the map: craniometricanalyses in the dispersion of modern Homo. Harvard Uni-versity Press, Cambridge, 37–79
Johnson BJ, Miller GH, Fogel ML, Magee JW, Gagan MK,Chivas AR (1999) 65,000 years of vegetation change in cen-tral Australia and the Australian summer monsoon. Science284:1150–1152
Jones R (1995) Tasmanian archaeology: establishing the se-quences. Annu Rev Anthropol 24:423–446
Keats B (1977) Genetic structure of the indigenous populationsin Australia and New Guinea. J Hum Evol 6:319–339
Kirk RL (1989) Population genetic studies in the Pacific: redcell antigen, serum protein, and enzyme systems. In: HillAVS, Serjeantson SW (eds) The colonization of the Pacific:a genetic trail. Oxford University Press, New York, pp60–119
Kirk RL, Thorne AG (eds) (1976) The origin of the Austra-lians. Humanities, New Jersey, 277–346, 379–410
Kocher TD, Wilson AC (1991) Sequence evolution of mito-chondrial DNA in humans and chimpanzees: control regionand a protein-coding region. In: Osawa S, Honjo T (eds)Evolution of life: fossils, molecules and culture. Springer,New York, pp 391–413
Krings M, Geisert H, Schmitz RW, Krainitzki H, Paabo S(1999) DNA sequence of the mitochondrial hypervariableregion II from the Neandertal type specimen. Proc Natl AcadSci USA 96:5581–5585
Krings M, Stone A, Schmitz RW, Krainitzki H, Stoneking M,Paabo S (1997) Neandertal DNA sequences and the originof modern humans. Cell 90:19–30
Kruskal JB (1964) Multidimensional scaling by optimizinggoodness of fit to a nonmetric hypothesis. Psychometrika29:1–27
Kumar S, Tamura K, Nei M (1993) MEGA: molecular evo-
lutionary genetics analysis, version 1.01. The PennsylvaniaState University, University Park
Mantel NA (1967) The detection of disease clustering and ageneralized regression approach. Cancer Res 27:209–220
Melton T, Peterson R, Redd AJ, Saha N, Sofro ASM, Martin-son J, Stoneking M (1995) Polynesian genetic affinities withsoutheast Asian populations as identified by mtDNA anal-ysis. Am J Hum Genet 57:403–414
Miller GH, Magee JW, Johnson BJ, Fogel ML, Spooner NA,McCulloch MT, Ayliffe LK (1999) Pleistocene extinction ofGenyornis newtoni: human impact on Australian mega-fauna. Science 283:205–208
Moutain JL, Cavalli-Sforza LL (1997) Multilocus genotypes,a tree of individuals, and human evolutionary history. AmJ Hum Genet 61:705–718
Mountain JL, Hebert JM, Bhattacharyya S, Underhill PA, Ot-tolenghi C, Gadgil M, Cavalli-Sforza LL (1995) Demo-graphic history of India and mtDNA-sequence diversity. AmJ Hum Genet 56:979–992
Nei M (1987) Molecular evolutionary genetics. Columbia Uni-versity Press, New York
Nei M, Jin L (1989) Variances of the average numbers ofnucleotide substitutions within and between populations.Mol Biol Evol 6:290–300
Nei M, Roychoudhury AK (1993) Evolutionary relationshipsof human populations on a global scale. Mol Biol Evol 10:927–943
Nichols J (1994) The spread of language around the Pacificrim. Evol Anthropol 3:206–215
O’Cornnell JF, Allen J (1998) When did humans first arrivein greater Australia and why is it important to know? EvolAnthropol 6:132–146
Piercy R, Sullivan KM, Benson N, Gill P (1993) The appli-cation of mitochondrial DNA typing to the study of whiteCaucasian genetic identification. Int J Legal Med 106:85–90
Pietrusewsky M (1994) Pacific-Asian relationships: a physi-cal anthropological perspective. Oceanic Linguistics 33:407–429
Raymond M, Rousset F (1995) An exact test for populationdifferentiation. Evolution 49:1280–1283
Redd AJ, Takezaki N, Sherry ST, McGarvey ST, Sofro ASM,Stoneking M (1995) Evolutionary history of the COII/t-RNALys intergenic 9 base pair deletion in human mitochon-drial DNAs from the Pacific. Mol Biol Evol 12:604–615
Roberts RG, Jones R (1994) Luminescence dating of sedi-ments: new light on the human colonisation of Australia.Australian Aboriginal Studies 2:2–17
Roberts RG, Jones R, Smith MA (1990) Thermoluminescencedating of a 50,000-year-old human occupation site in north-ern Australia. Nature 345:153–156
Roberts-Thomson JM, Martinson JJ, Norwich JT, HardingRM, Clegg JB, Boettcher B (1996) An ancient common or-igin of Aboriginal Australians and New Guinean highland-ers is supported by a-globin haplotype analysis. Am J HumGenet 58:1017–1024
Rogers AR (1995) Genetic evidence for a Pleistocene popu-lation explosion. Evolution 49:608–615
Rogers AR, Harpending H (1992) Population growth makeswaves in the distribution of pairwise genetic differences. MolBiol Evol 9:552–569

828 Am. J. Hum. Genet. 65:808–828, 1999
Rohlf FJ, Sokal RR (1981) Comparing numerical taxonomicstudies. Syst Zool 30:459–490
Roychoudhury AK (1984) Genetic relationship between Indiantribes and Australian Aboriginals. Hum Hered 34:314–320
Rzhetsky A, Nei M (1992) A simple method for estimatingand testing minimum-evolution trees. Mol Biol Evol 9:945–967
——— (1993) Theoretical foundation of the minimum-evo-lution method of phylogenetic inference. Mol Biol Evol 10:1073–1095
Saitou N, Nei M (1987) The neighbor-joining method: a newmethod for reconstructing phylogenetic trees. Mol Biol Evol4:406–425
Serjeantson SW (1989) HLA genes and antigens. In: Hill AVS,Serjeantson SW (eds) The colonization of the Pacific: a ge-netic trail. Oxford University Press, New York, pp 120–173
——— (1985) Migration and admixture in the Pacific: in-sights provided by human leukocyte antigens. In: Kirk RL,Szathmary E (eds) Out of Asia: peopling the Americas andthe Pacific. Australian National University Press, Canberra,pp 133–145
Slatkin M (1995) A measure of population subdivision basedon microsatellite allele frequencies. Genetics 139:457–462
Stoneking M, Fontius JJ, Clifford SL, Soodyall H, Arcot SS,Saha N, Jenkins T, et al (1997) Alu insertion polymorphismsand human evolution: evidence for a larger population sizein Africa. Genome Res 7:1061–1071
Stoneking M, Hedgecock D, Higuchi RG, Vigilant L, ErlichHA (1991) Population variation of human mtDNA controlregion sequences detected by enzymatic amplification andsequence-specific oligonucleotide probes. Am J Hum Genet48:370–382
Stoneking M, Jorde LB, Bhatia K, Wilson AC (1990) Geo-graphic variation in human mitochondrial DNA from PapuaNew Guinea. Genetics 124:717–733
Stoneking M, Sherry ST, Redd AJ, Vigilant L (1992) Newapproaches to dating suggest a recent age for the humanmtDNA ancestor. Philos Trans R Soc Lond B 337:167–175
Stoneking M, Wilson AC (1989) Mitochondrial DNA. In: HillAVS, Serjeantson SW (eds) The colonization of the Pacific:a genetic trail. Oxford University Press, New York, pp215–245
Sykes B, Leiboff A, Low-Beer J, Tetzner S, Richards M (1995)The origins of the Polynesians: an interpretation frommitochondrial lineage analysis. Am J Hum Genet 57:1463–1475
Tajima F (1989) Statistical method for testing the neutral mu-tation hypothesis by DNA polymorphism. Genetics 123:585–595
Tajima M, Takezaki N (1994) Estimation of evolutionary dis-
tance for reconstructing molecular phylogenetic trees. MolBiol Evol 11:278–286
Takezaki N, Rzhetsky A, Nei M (1995) Phylogenetie test ofthe molecular clock and linearized trees. Mol Biol Evol 12:823–833
Tamura K, Nei M (1993) Estimation of the number of nucle-otide substitutions in the control region of mitochondrialDNA in humans and chimpanzees. Mol Biol Evol 10:512–526
Thorne A, Grun R, Mortimer G, Spooner NA, Simpson JJ,McCulloch M, Taylor L, et al (1999) Australia’s oldest hu-man remains: age of the Lake Mungo 3 skeleton. J HumEvol 36:591–612
Tsintsof AS, Hertzberg MS, Prior JF, Mickleson KNP, TrentRJ (1990) a-globin gene markers identify genetic differencesbetween Australian Aborigines and Melanesians. Am J HumGenet 46:138–143
van Holst Pellekaan S, Frommer M, Sved J, Boettcher B (1998)Mitochondrial control-region sequence variation in Aborig-inal Australians. Am J Hum Genet 62:435–449
——— (1997) Mitochondrial D-loop diversity in Australianriverine and Australian desert Aborigines. Electrophoresis18:1538–1543
Vigilant L, Stoneking M, Harpending H, Hawkes K, WilsonAC (1991) African populations and the evolution of humanmitochondrial DNA. Science 253:1503–1507
Wakeley J (1996) Distinguishing migration from isolation us-ing the variance of pairwise differences. Theoretical Popu-lation Biology 49:369–386
——— (1993) Substitution rate variation among sites in hy-pervariable region 1 of human mitochondrial DNA. J MolEvol 37:613–623
White JP, O’Connell JF (1982) A prehistory of Australia, NewGuinea and Sahul. Academic Press, New York, pp 76–77,97–98
Wurm SA (1982) Papuan languages of Oceania. Gunter Narr,Tubingen, pp 1–2
Yenchitosomanus P, Summers KM, Bhatia KK, Board PG(1986) A single a-globin gene deletion in Australian Abo-rigines. Aust J Exp Biol Med Sci 64:297–306
Yenchitsomanus P, Summers KM, Bhatia KK, Cattani J, BoardPG (1985) Extremely high frequencies of a-globin gene de-letion in Madang and on Karkar Island, Papua New Guinea.Am J Hum Genet 37:778–784
Yoshida M, Ohtsuka R, Nakazawa M, Juji T, and TokunagaK (1995) HLA-DRB1 frequencies of non-Austronesian-speaking Gidra in South New Guinea and their genetic af-finities with Oceanian populations. Am J Phys Anthropol96:177–181