MTC Arterial Operations Committee January 21, 2014...
41
Utilizing Innovative Technology for Lowering the Cost of Traffic Signal Synchronization Projects -A Case Study of Beach Boulevard Presented by: Leo K. Lee, P.E., ADVANTEC Consulting Engineers MTC Arterial Operations Committee January 21, 2014
Transcript of MTC Arterial Operations Committee January 21, 2014...
Utilizing Innovative Technology for Lowering
the Cost of Traffic Signal Synchronization
Projects - A Case Study of Beach Boulevard
Presented by:
Leo K. Lee, P.E., ADVANTEC Consulting Engineers
MTC
Arterial Operations
Committee
January 21, 2014

Presentation Agenda
• OCTA’s TLSP Program
• Beach TLSP Project
• Project Objectives
• Project Elements
• Special Features
• Timing Optimization
• Results and Summary of Benefits

• Traffic Light Synchronization Program (TLSP)
• Proposition 1B TLSP Component = $250M• First $150M allocated to LADOT by law
• Last $100M competitive across California
• Funding Match is Key Leverage in Competition • $4M – Measure M Signal Improvement Program 50% Match
• $4M – Prop. 1B TLSP Match
• Number 1 project in competitive bid
• Project – 10 Interjurisdictional Corridors• 153 centerline miles – 533 signalized intersections
• 3 years – last 3 projects now entering final phase
Traffic Light Synchronization Program
Traffic Light Synchronization Program
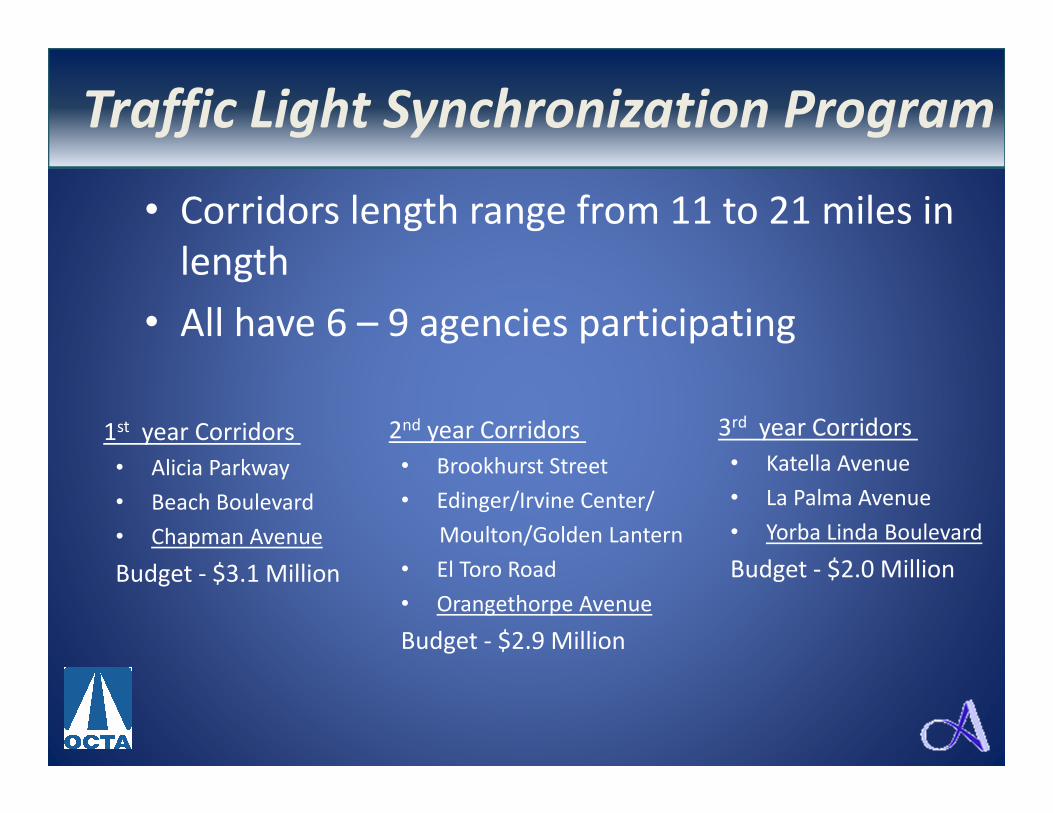
• Corridors length range from 11 to 21 miles in
length
• All have 6 – 9 agencies participating
1st year Corridors
• Alicia Parkway
• Beach Boulevard
• Chapman Avenue
Budget - $3.1 Million
2nd year Corridors
• Brookhurst Street
• Edinger/Irvine Center/
Moulton/Golden Lantern
• El Toro Road
• Orangethorpe Avenue
Budget - $2.9 Million
3rd year Corridors
• Katella Avenue
• La Palma Avenue
• Yorba Linda Boulevard
Budget - $2.0 Million
Traffic Light Synchronization Program
Traffic Light Synchronization Program
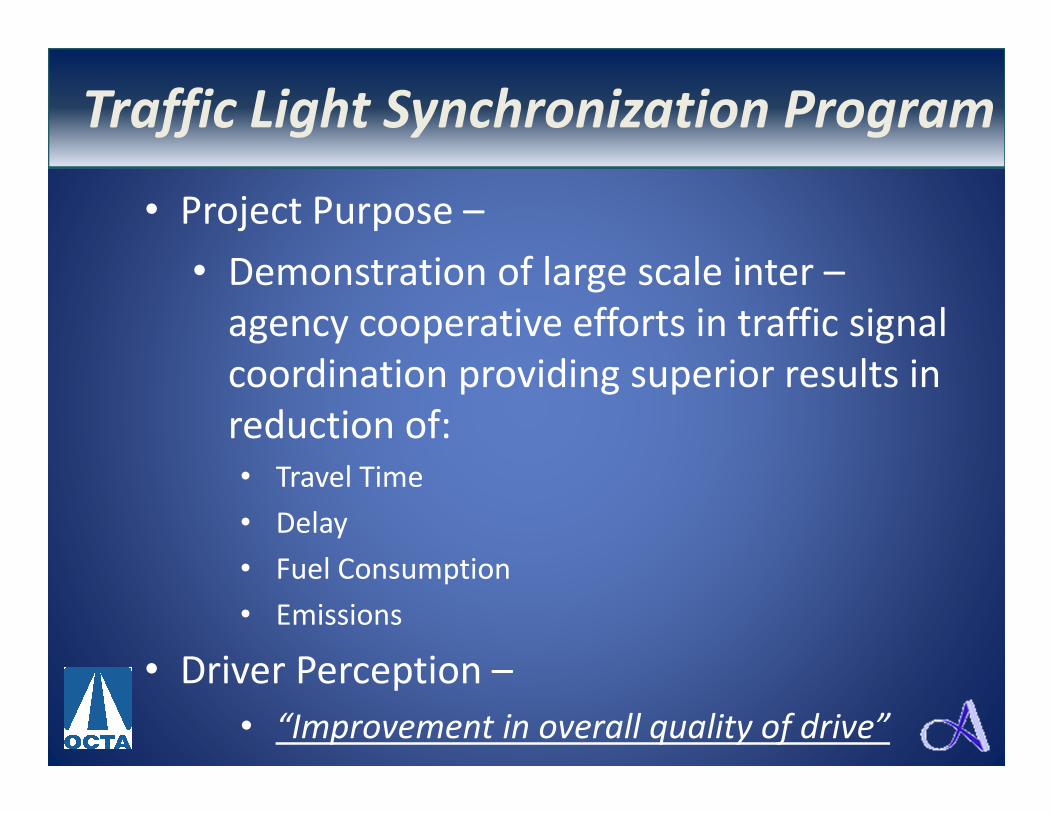
• Project Purpose –
• Demonstration of large scale inter –
agency cooperative efforts in traffic signal
coordination providing superior results in
reduction of:• Travel Time
• Delay
• Fuel Consumption
• Emissions
• Driver Perception –
• “Improvement in overall quality of drive”
Traffic Light Synchronization Program
Beach Blvd TLSP Project
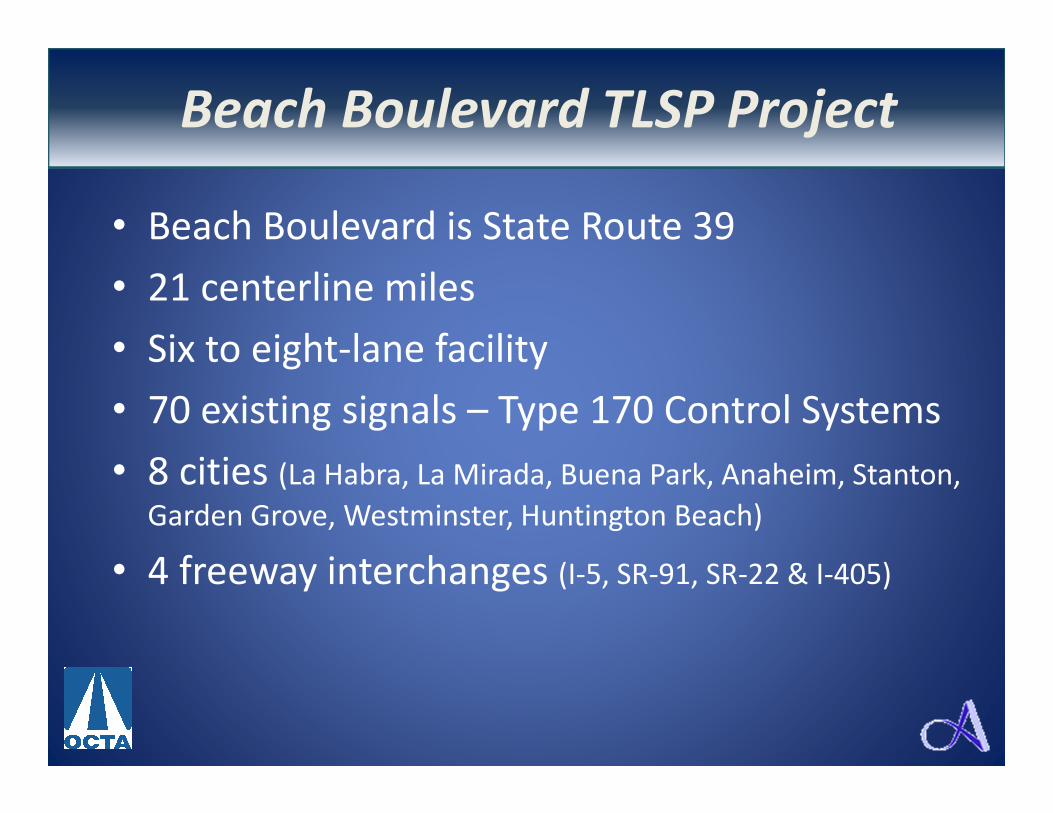
• Beach Boulevard is State Route 39
• 21 centerline miles
• Six to eight-lane facility
• 70 existing signals – Type 170 Control Systems
• 8 cities (La Habra, La Mirada, Buena Park, Anaheim, Stanton,
Garden Grove, Westminster, Huntington Beach)
• 4 freeway interchanges (I-5, SR-91, SR-22 & I-405)
Beach Boulevard TLSP Project
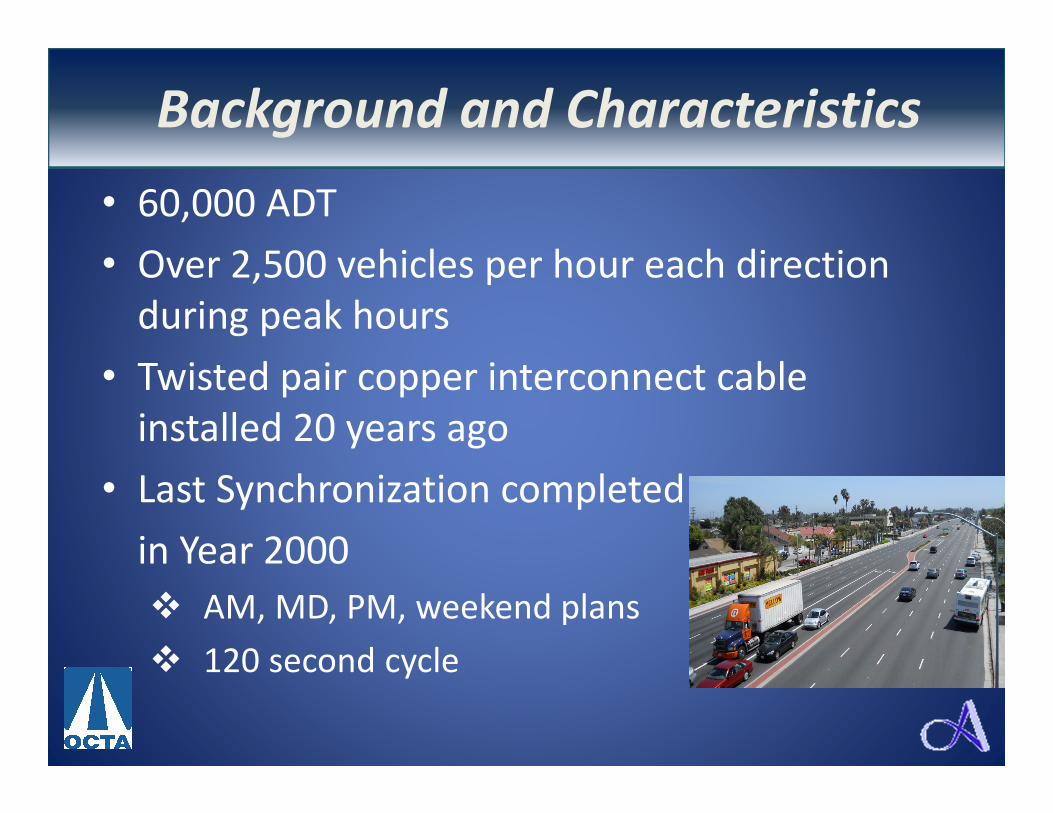
Background & Characteristics
• 60,000 ADT
• Over 2,500 vehicles per hour each direction
during peak hours
• Twisted pair copper interconnect cable
installed 20 years ago
• Last Synchronization completed
in Year 2000
� AM, MD, PM, weekend plans
� 120 second cycle
Background and Characteristics
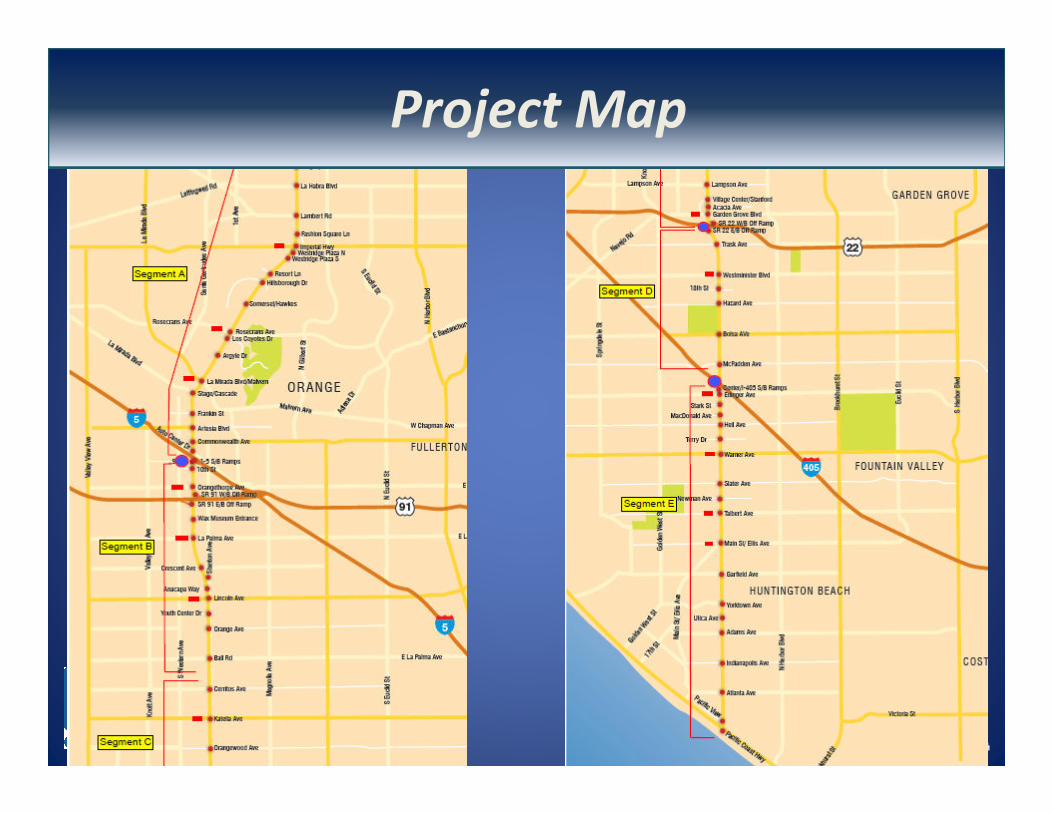
Project MapProject Map
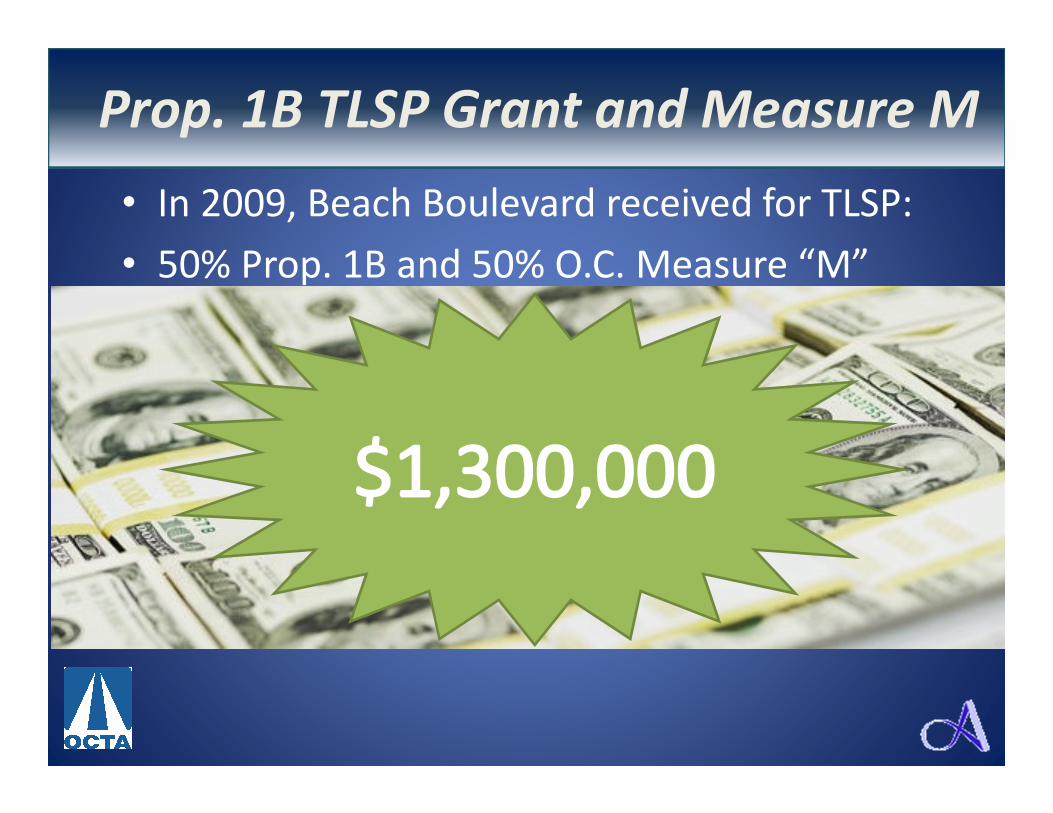
Prop. 1B TLSP Grant and Measure M
• In 2009, Beach Boulevard received for TLSP:
• 50% Prop. 1B and 50% O.C. Measure “M”
Prop. 1B TLSP Grant and Measure M
Project Elements
• NEW CCTV cameras at 14 locations
• Upgrade communications network
• NEW Type 2070 control systems at 68 locations
• NEW Type 170E Field Master Controllers – 6
• NEW GPS time-base units – 6
• NEW Optimized Timing Analysis entire corridor
• NEW timing implementation & fine-tuning
• Continuous Field Monitoring – 9 months
Project Elements

Project Objectives
• Reduce travel time, stops, fuel consumption
• Increase travel speeds
• Improve air quality
• Provide real-time video transmission to Caltrans
District 12 (D-12) Traffic Management Center
• Enable remote monitoring & control of traffic
signals from D-12 TMC
• Enhance controller functionalities
Project Objectives
Leveraging Existing Infrastructure
• Caltrans originally desired upgrade to fiber optic
cable
• Determined infeasible due to high cost
• Solutions:
�Reuse existing 12 pair#19 Copper I/C
�Implement Ethernet-over-Copper technology
�Proof that good quality video image can be
provided at a lower cost
�Results = over $500,000 savings
Leveraging Existing Infrastructure

Issues and Solutions
•Issues with Infrastructure�Conditions of existing cables and conduits
�Damaged and/or broken
�Quality of video transmitted over copper cable
•Solutions:�Field Inspection of infrastructure conduit and cable
�Audio/Tone, Electronic, Magnetic Time Domain
Reflectometry
•CCTV & Communications Bench Test�5000 Lineal Foot Spool
�Emulate Field Conditions
Conductivity Test
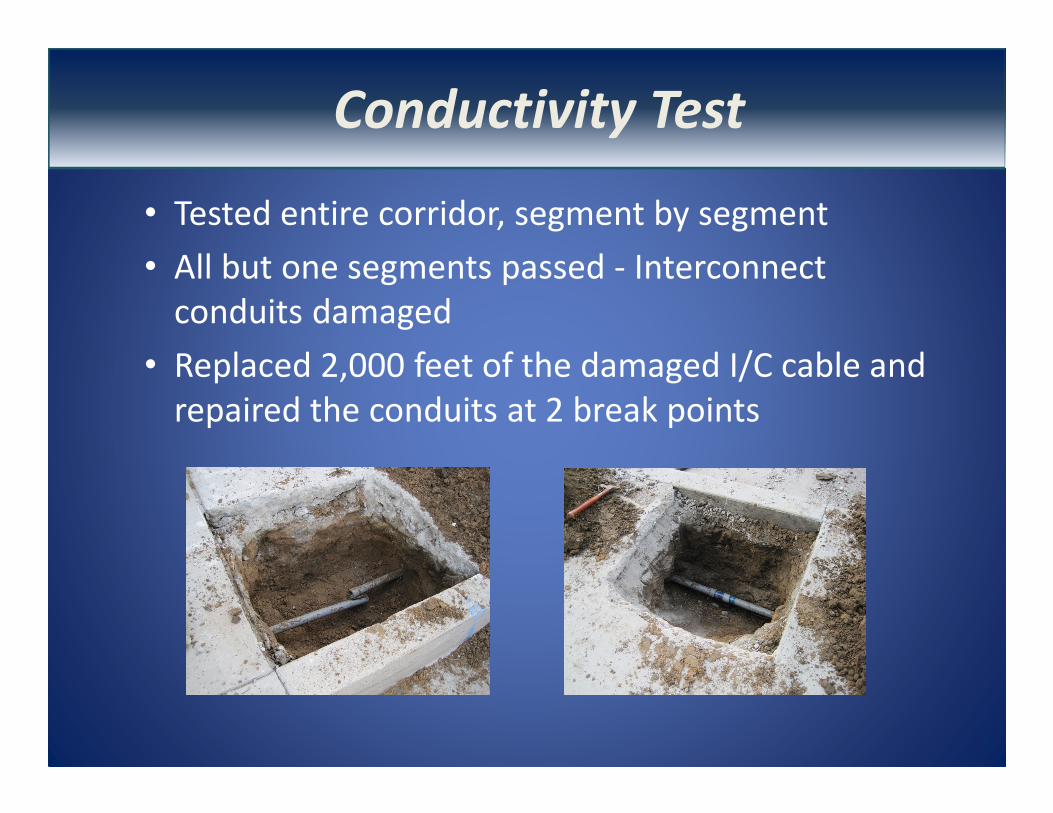
• Tested entire corridor, segment by segment
• All but one segments passed - Interconnect
conduits damaged
• Replaced 2,000 feet of the damaged I/C cable and
repaired the conduits at 2 break points
Conductivity Test
CCTV Bench Test• Bench test to simulate field conditions
• Utilize actual field devices, and over one mile of
copper cable
• Results
�Good video quality from 500 kbps to 3Mbps
speeds
�Negligible latency in video transmission
CCTV Bench Test
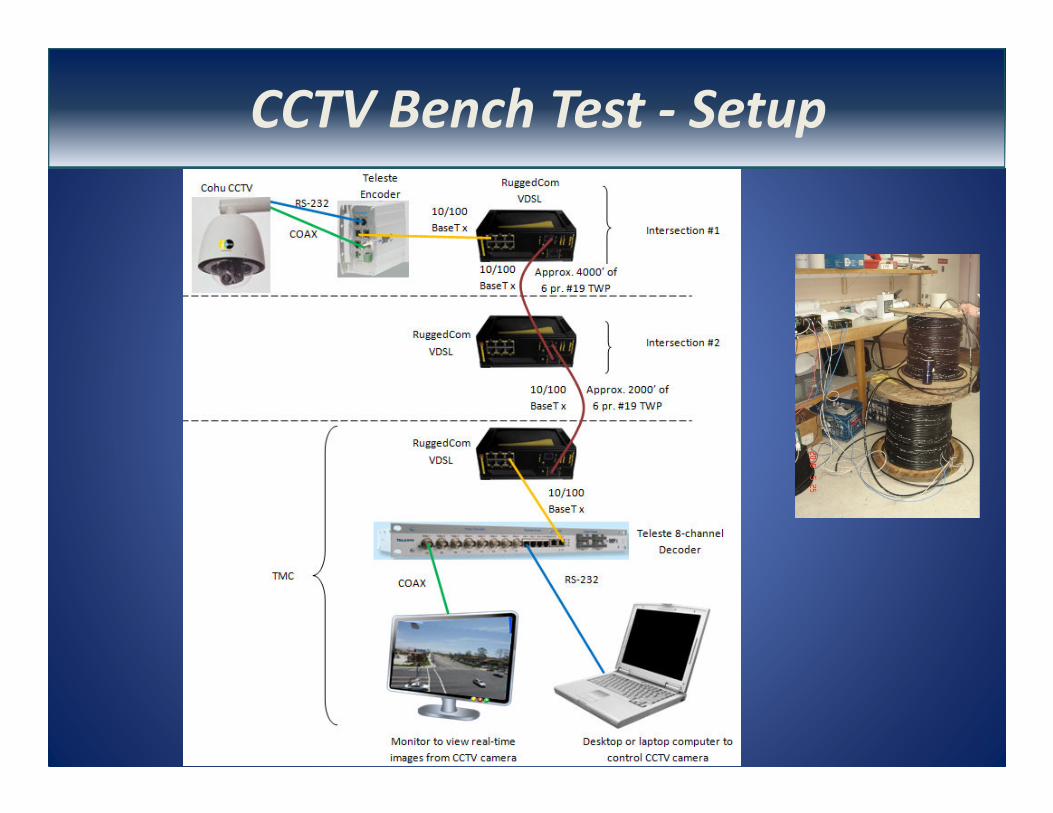
CCTV Bench Test – Set upCCTV Bench Test - Setup
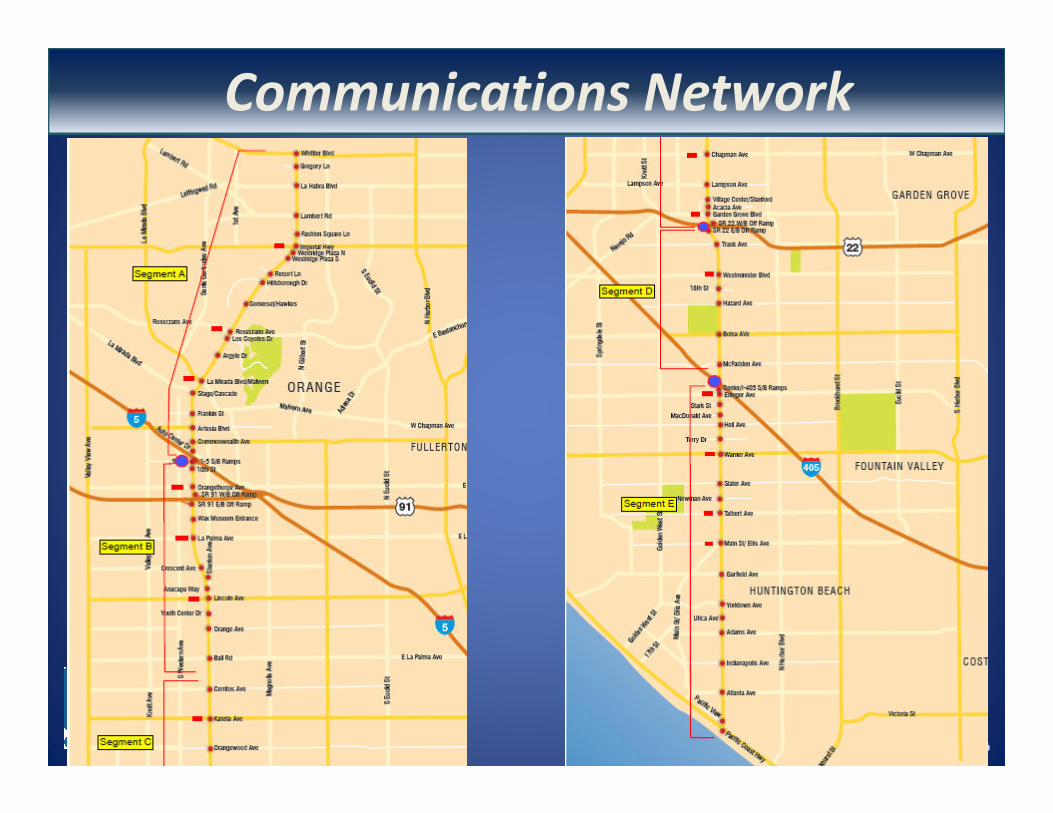
Communications NetworkCommunications Network
CCTV Camera Installation
• Constraint
� CEQA = No ground-disturbance (hence no
new pole or conduits)
• Solutions
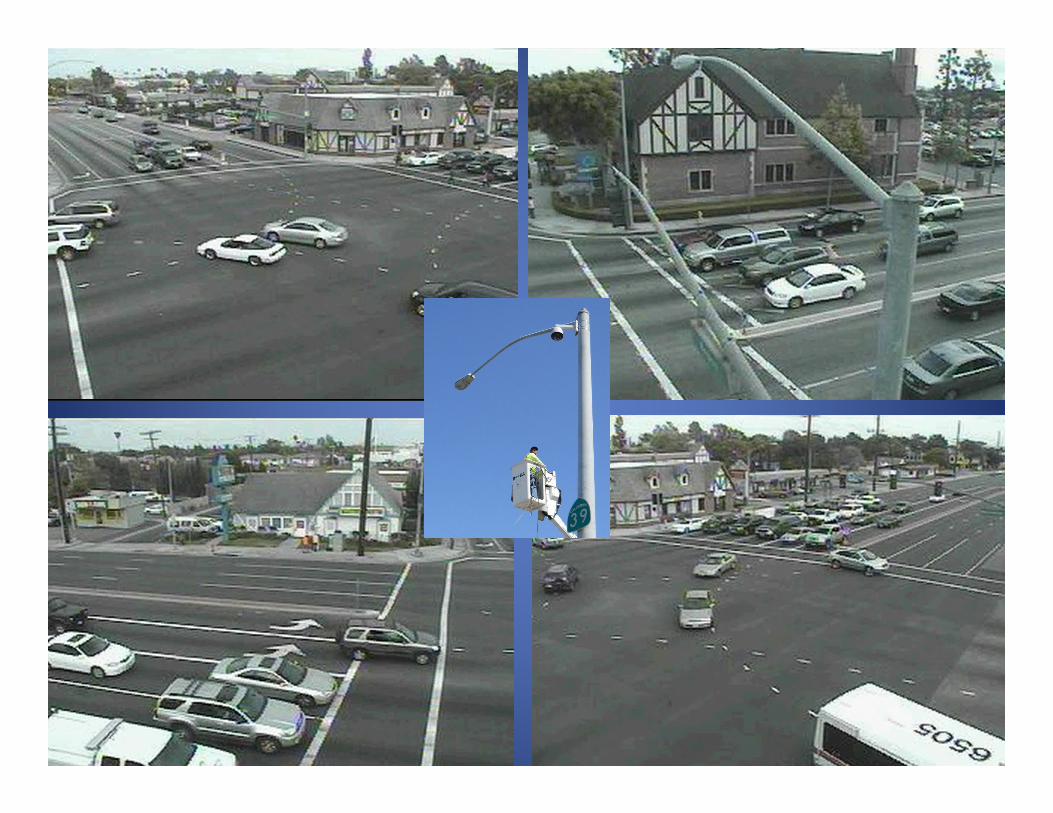
�Install CCTV camera on existing pole
�Install CCTV cable in existing conduits
�Utilize existing Controller Assemblies for
New Video Equipment
CCTV Camera Installation
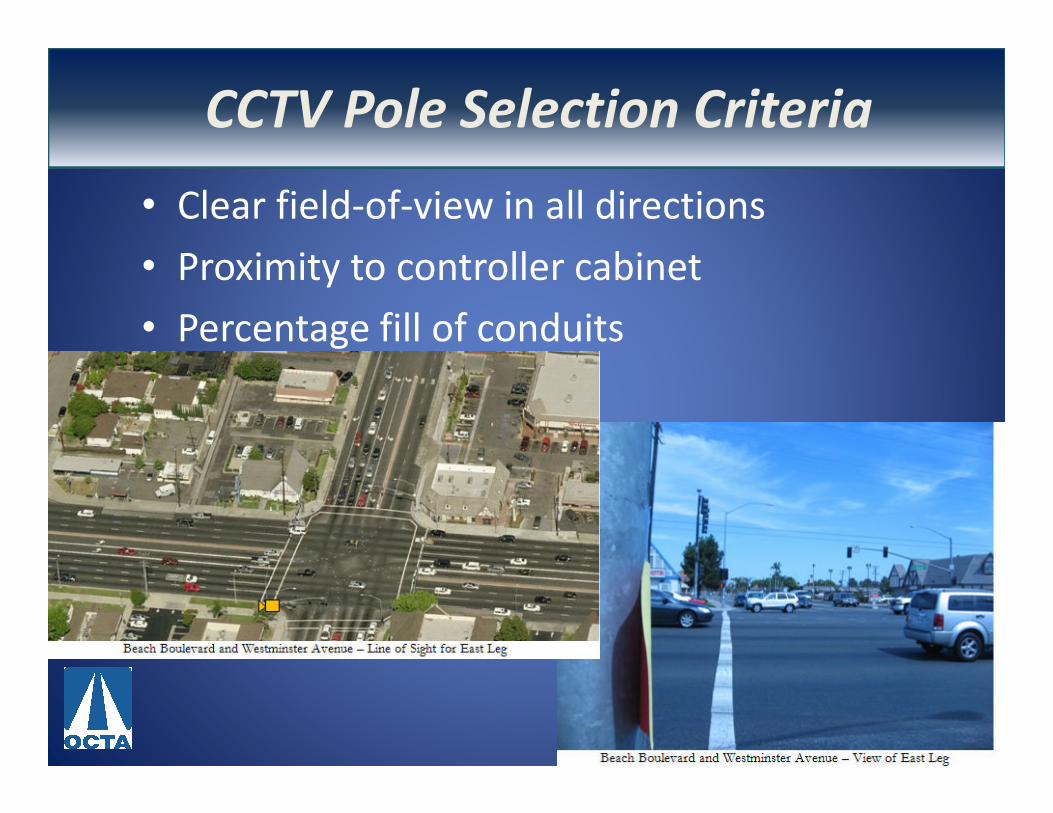
CCTV Pole Selection Criteria
• Clear field-of-view in all directions
• Proximity to controller cabinet
• Percentage fill of conduits
CCTV Pole Selection Criteria

Synchronization Phase
• Data Collection
• Traffic Counts
• 24/7 ADT
• Intersection Turning Movement Counts
• Auto, Pedestrian, Bicycle
• “Floating Car” Before Study (AM, MD & PM peaks)
• Analysis and Optimization of signal timing
• Implementation / finetuning
Traffic Light Synchronization Phase

Before StudyBefore Study Results
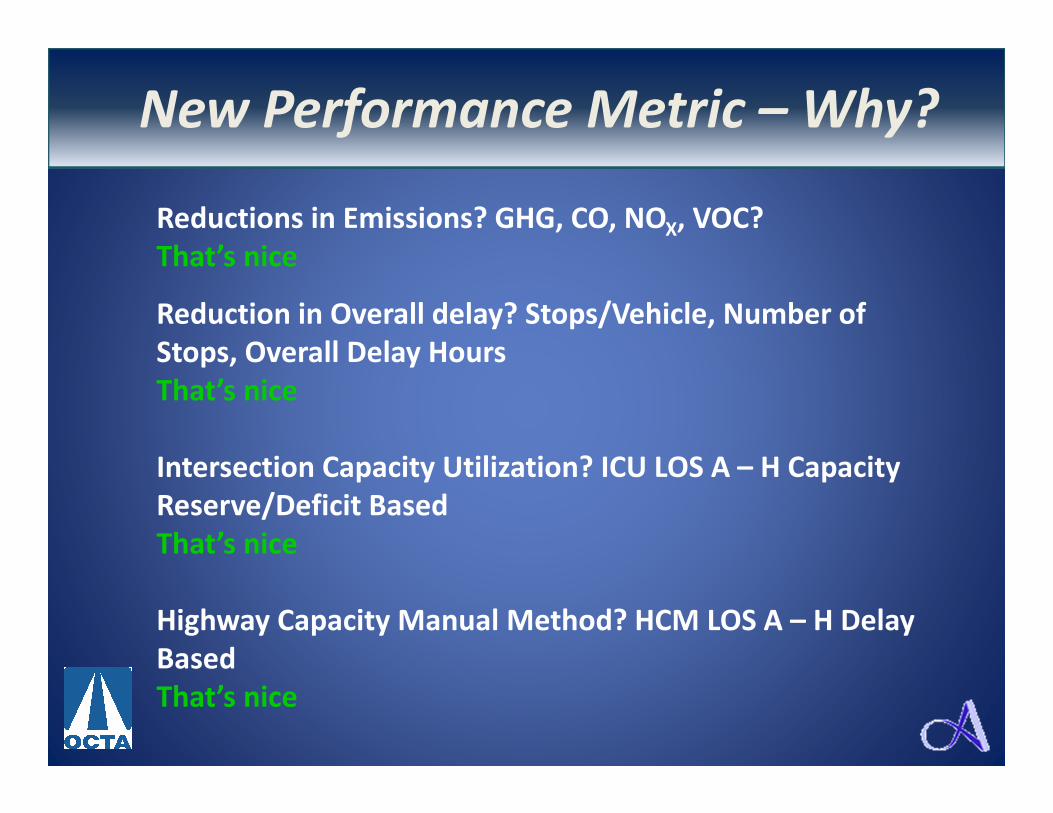
New Performance Measure – WHY?
Reductions in Emissions? GHG, CO, NOX, VOC?
That’s nice
Reduction in Overall delay? Stops/Vehicle, Number of
Stops, Overall Delay Hours
That’s nice
Intersection Capacity Utilization? ICU LOS A – H Capacity
Reserve/Deficit Based
That’s nice
Highway Capacity Manual Method? HCM LOS A – H Delay
Based
That’s nice
New Performance Metric – Why?
New Performance Measure – WHY?
• What does all this mean to us?
• ??? Do the Elected Officials and Public Get it ???
NO!NO!NO!NO!
New Performance Metric – Why?
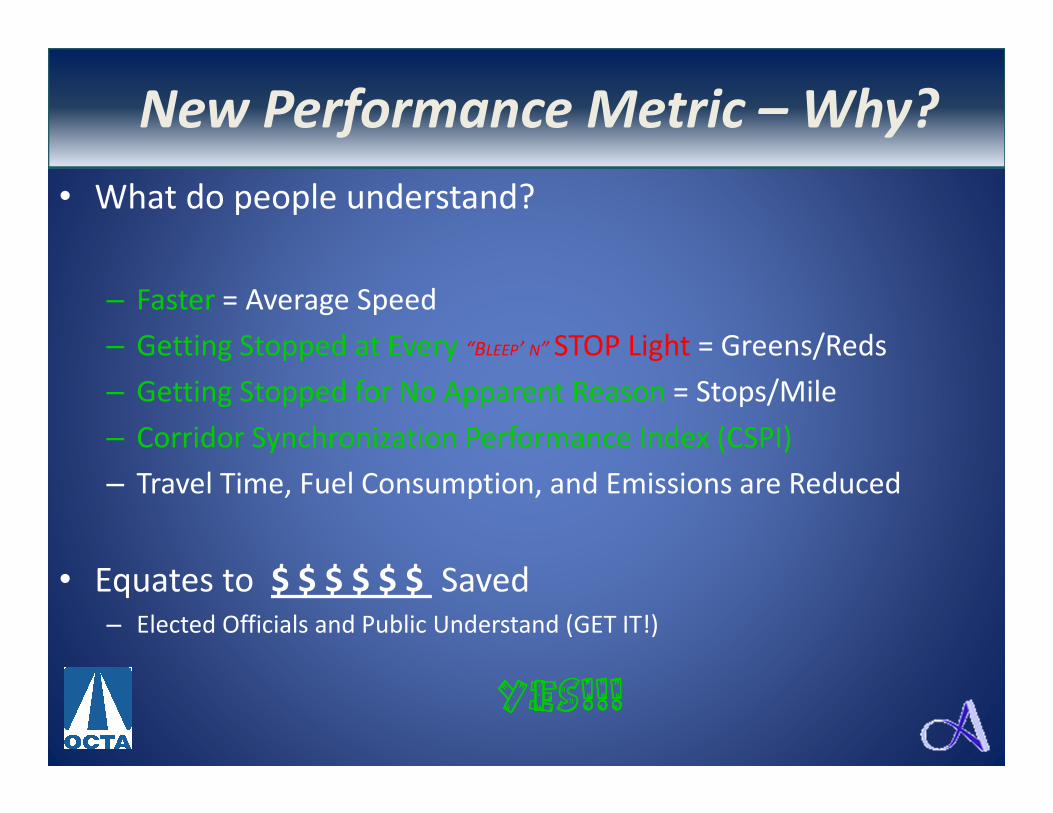
New Performance Measure – WHY?
• What do people understand?
– Faster = Average Speed
– Getting Stopped at Every “BLEEP’ N” STOP Light = Greens/Reds
– Getting Stopped for No Apparent Reason = Stops/Mile
– Corridor Synchronization Performance Index (CSPI)
– Travel Time, Fuel Consumption, and Emissions are Reduced
• Equates to $ $ $ $ $ $ Saved– Elected Officials and Public Understand (GET IT!)
YES!!!YES!!!YES!!!YES!!!
New Performance Metric – Why?
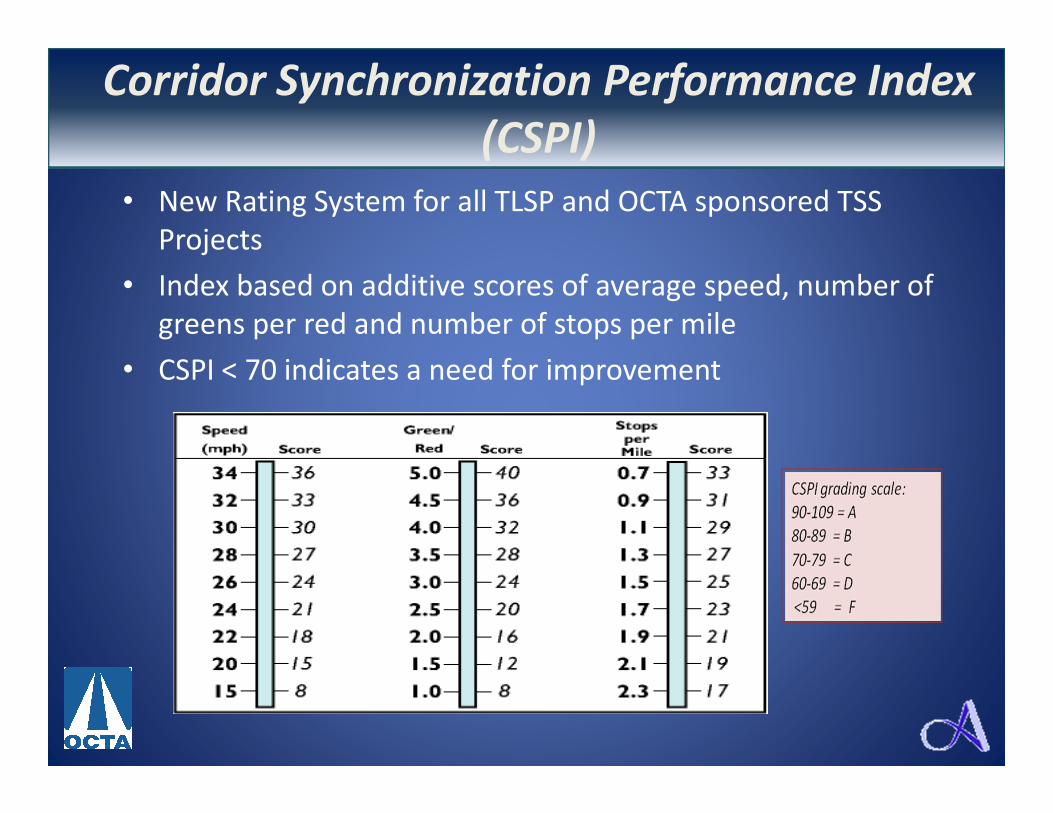
Corridor Synchronization Performance Index (CSPI)
• New Rating System for all TLSP and OCTA sponsored TSS
Projects
• Index based on additive scores of average speed, number of
greens per red and number of stops per mile
• CSPI < 70 indicates a need for improvement
Corridor Synchronization Performance Index
(CSPI)

Corridor Synchronization Performance Index (CSPI)CSPI

New Minimum Greens
• First corridor in Orange County to have new
minimum green implemented
• Changes affect all left-turns and side streets
• New min green increased by 5 to 10 seconds
over existing
• Increase of 30% to 200% from the previously
implemented minimum green timing
New Minimum or Initial Green
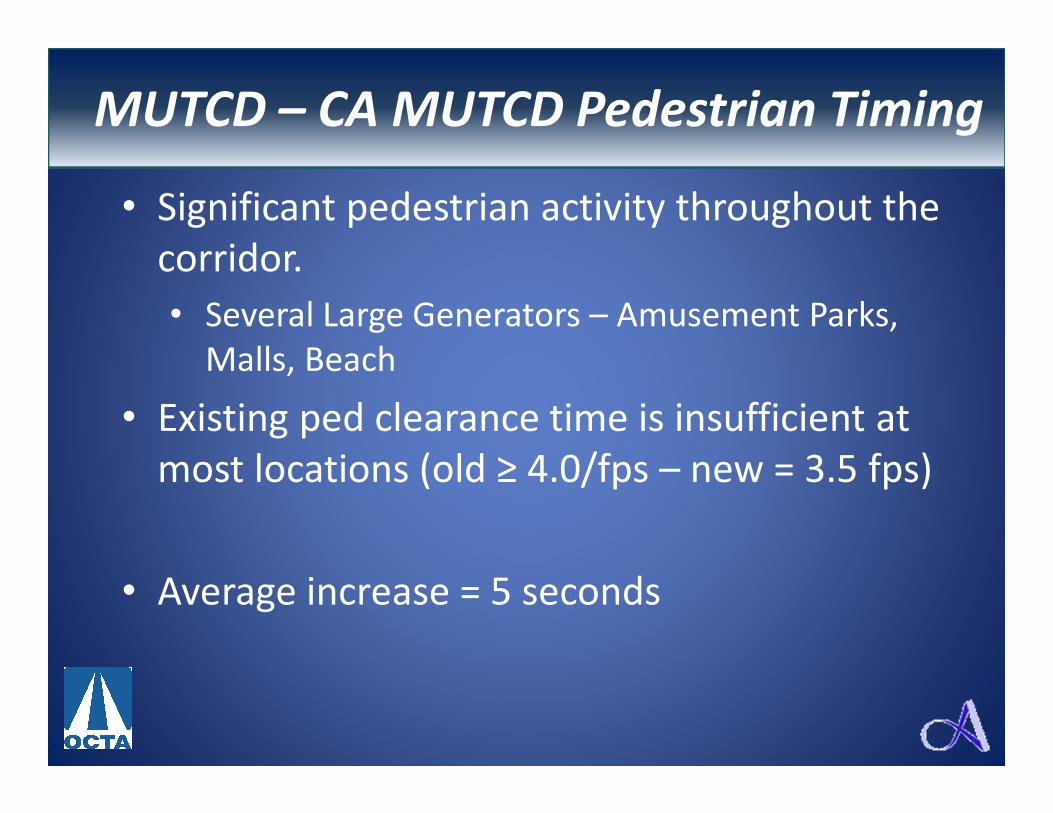
Pedestrian Timing
• Significant pedestrian activity throughout the
corridor.
• Several Large Generators – Amusement Parks,
Malls, Beach
• Existing ped clearance time is insufficient at
most locations (old ≥ 4.0/fps – new = 3.5 fps)
• Average increase = 5 seconds
MUTCD – CA MUTCD Pedestrian Timing

Reduction in Travel TimeReduction in Travel Time
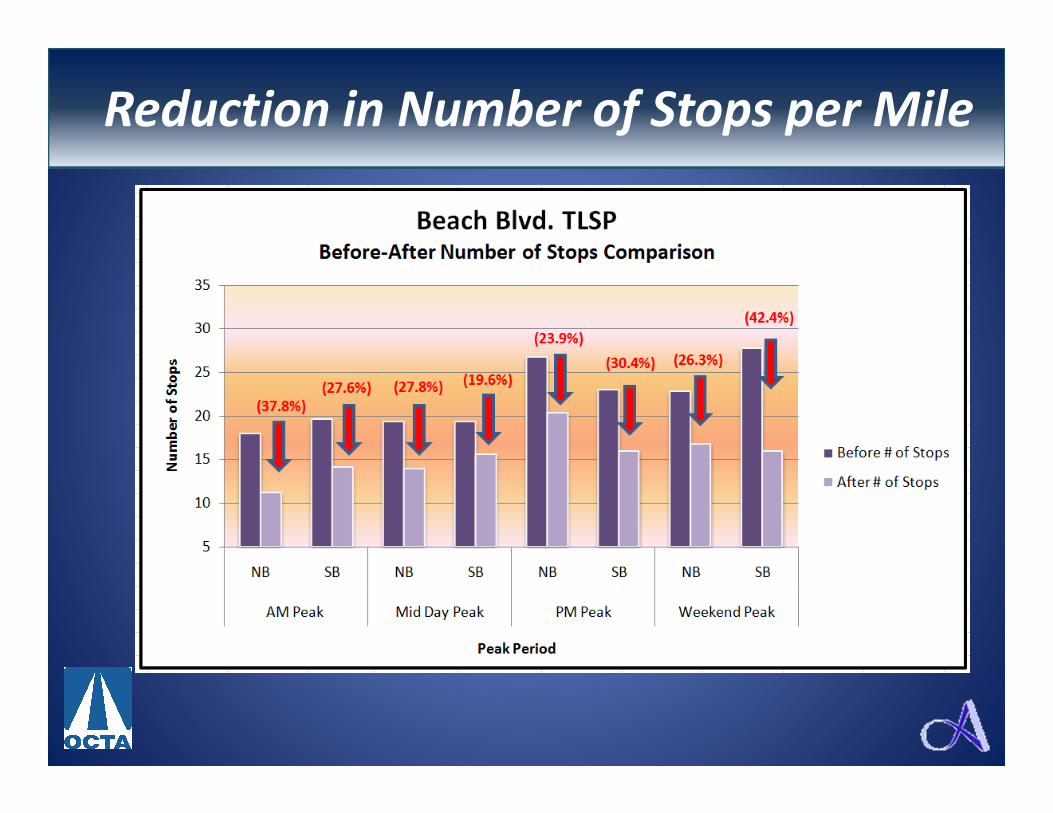
Reduction in No. of StopsReduction in Number of Stops per Mile

Reduction in Total DelayReduction in Total Delay
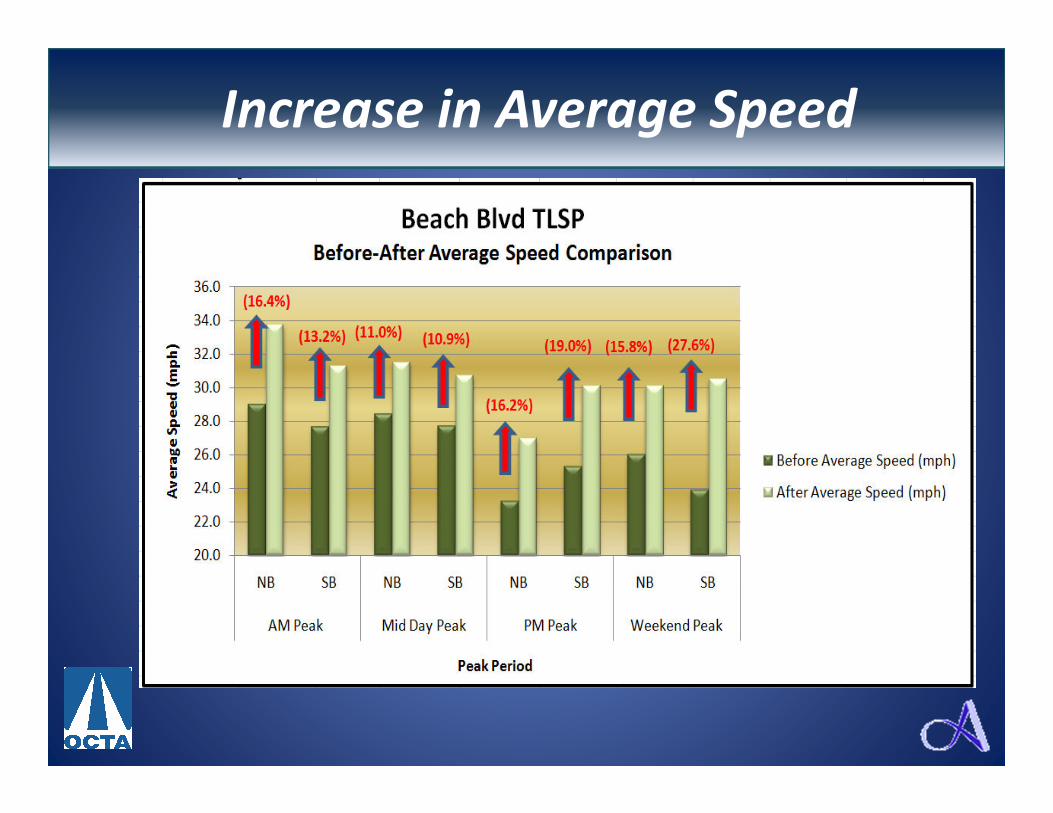
Increase in Average SpeedIncrease in Average Speed
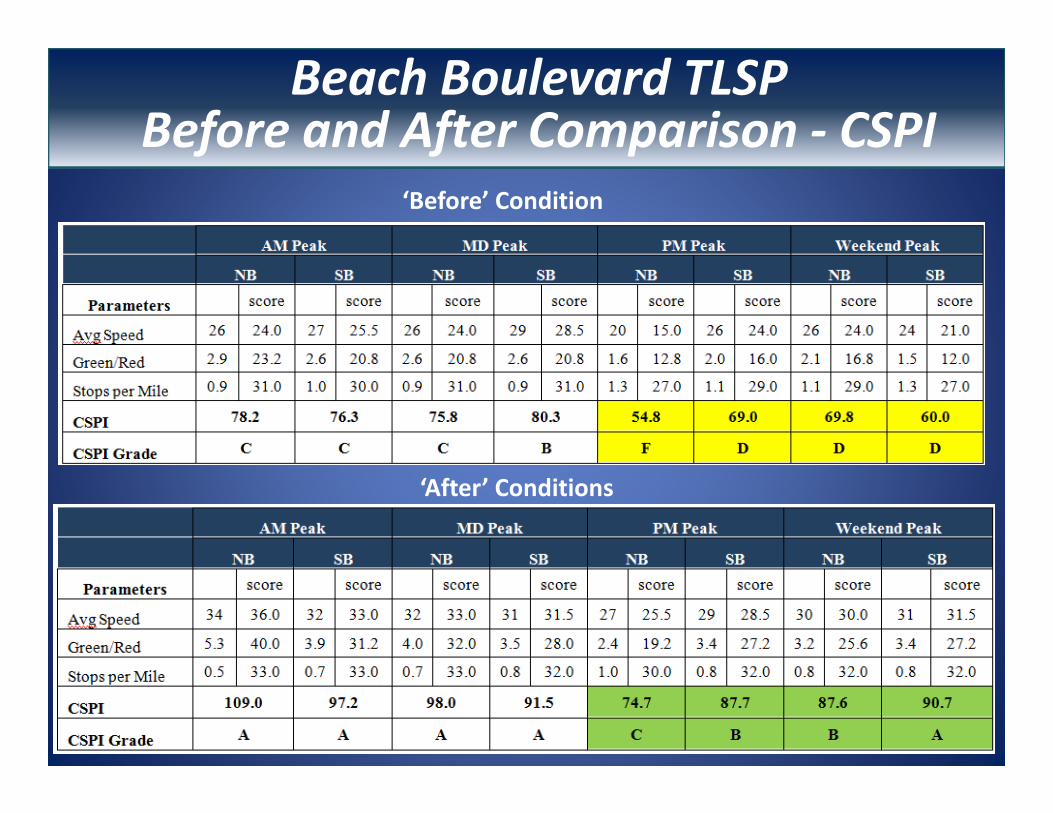
Before & After CSPI
‘Before’ Condition
‘After’ Conditions
Beach Boulevard TLSPBefore and After Comparison - CSPI

Project Benefits
�Annual Savings = $27.5 million/year
�Benefit to Cost Ratio = 21:1 in first year
�Reduction in GHG’s emissions:
�67,000 tons annually BEFORE PROJECT
�48,000 tons annually AFTER PROJECT
�19,000 tons or 28% REDUCTION!!!
Project Benefits

Questions ?Questions ???

TLSP Typical Improvements in
Travel Time, Stops/Mile and Average Speed
0
5
10
15
20
25
Morning Midday Evening
Tra
ve
l T
ime
(m
in)
Before
After
-27% -13% -25%
0
5
10
15
20
Morning Midday Evening
Nu
mb
er
of
Sto
ps
BeforeAfter
-53% -46% -50%
0
5
10
15
20
25
30
35
Morning Midday Evening
Av
era
ge
Sp
ee
d (
mp
h)
Before
After38% 16% 34%
TLSP – Typical ImprovementsTravel Time, Stops/Mile, and Average Speed

CSP Index for Beach BlvdCSPI for Beach Boulevard - Before
Special Feature
MUTCD’s New Bicycle Policy Directive
• Mandates provision of Bicycle and
Motorcycle Detection on all approaches to
traffic-actuated signals in CA
• Incorporated in the new optimized timing
plans for AM, Mid-Day, PM and Weekend
peak hours
Special Feature MUTCD’s New Bicycle Policy Directive

Special Feature
MUTCD’s New Bicycle Policy Directive
Special Feature MUTCD’s New Bicycle Policy Directive

Timing Optimization
• Incorporated new bicycle minimum green
and ped clearance time
• Accommodated heavy left turns
• Preserved “Smart Street” concept by
providing good progression in both directions
• New peak hour cycle lengths:
� 120s, 130s, & 140s depending on the
traffic conditions
Optimal Timing Implementation