The bigger picture: ceramic (CMC) metal (MMC) natural polymer (PMC) John Summerscales.
Upload
raymond-jeffersonCategory
view
218download
2
MST 326 Lecture 7MST 326 Lecture 7Project planningProject planning
John SummerscalesSchool of Engineering
University of Plymouth
Golden rule:Golden rule:
“A golden rule in terms of estimating the time required is to assume people are only productive four out of five days”
C Sheldon and M Yoxon, Environmental Management Systems– third edition, Earthscan, London and Sterling VA, 2006.
Lecture outlineLecture outline
Gantt charts Project Evaluation Review Technique
(PERT) Critical Path Analysis/Method (CPA/CPM)
Technology Road Maps (TRM)
What is a project ?What is a project ?
a group of people brought together to achieve a defined objectivein a defined period of timeand with defined resources

Measuring success?Measuring success?
deliverables: what will be achieved deadlines: when will it happen milestones: end of each significant
stage are there quantitative parameters ?
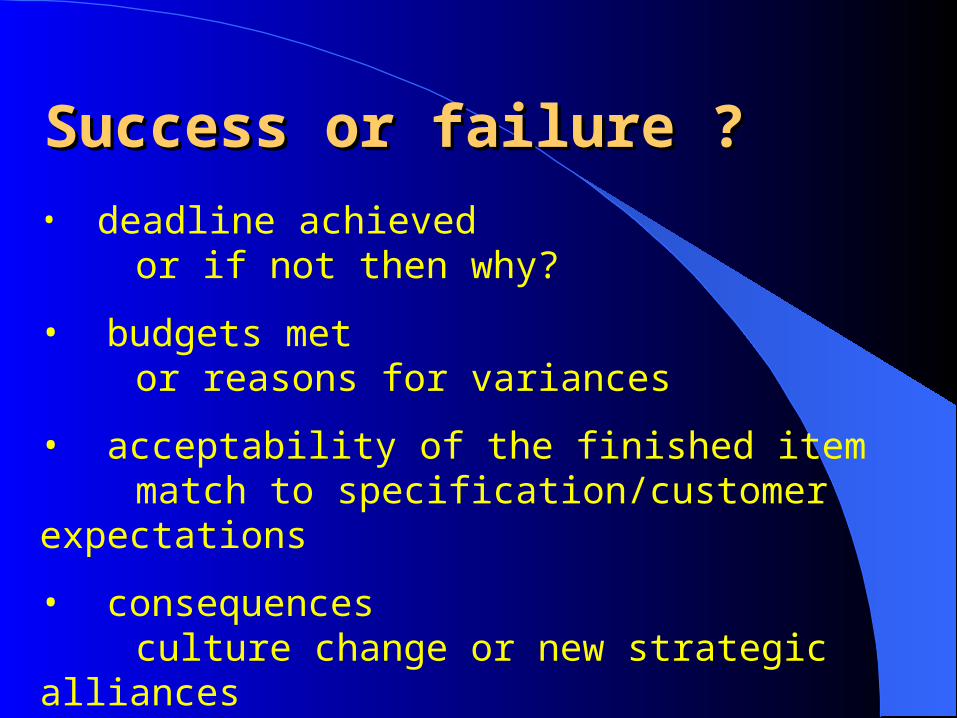
Success or failure ?Success or failure ?• deadline achieved
or if not then why?
• budgets metor reasons for variances
• acceptability of the finished itemmatch to specification/customer
expectations
• consequencesculture change or new strategic alliances
Project managementProject management
develops innovative, creative and committed managers
provides a vehicle for measurement of resource effectiveness and for optimisation
permits strategic accountability

Henry Laurence GanttHenry Laurence Gantt
• graphical representation of the duration of tasks plotted vs time
• e.g. student timetable• load chart shows workload relative to capacity
• one row per person vs hours in the day
• progress chart shows succession of tasks from start to finish
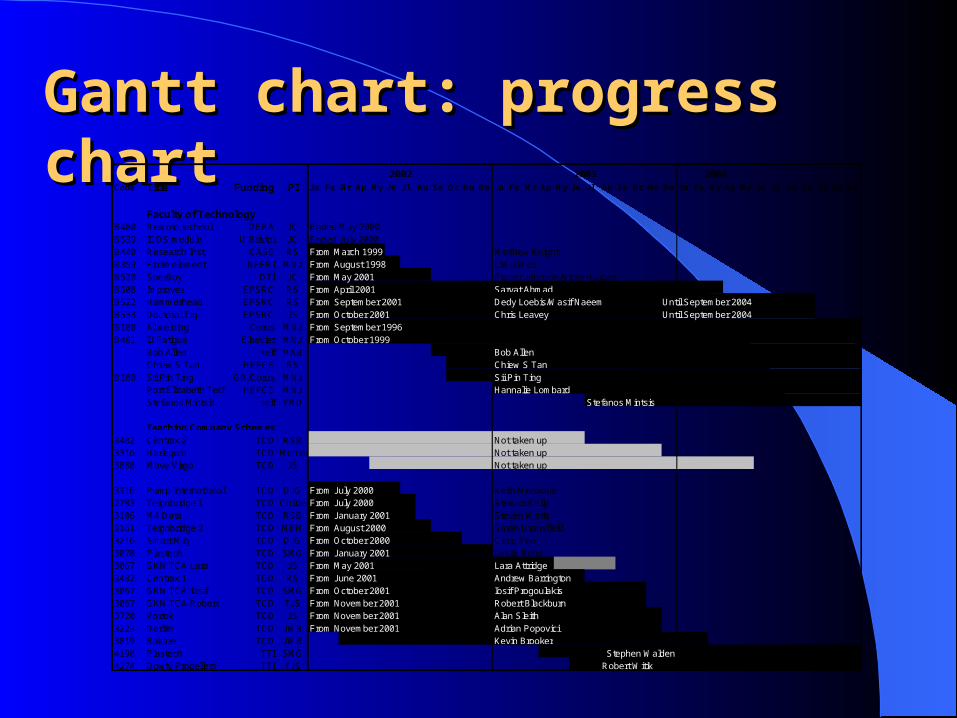
Gantt chart: progress Gantt chart: progress chartchart
Code Title Funding PI Ja Fe Mr Ap My Je Jl Au Se Oc No De Ja Fe Mr Ap My Je Jl Au Se Oc No De Ja Fe Mr Ap My Je Jl Au Se Oc No De
Faculty of TechnologyB480 Remote technol DERA JC Ended May 2000B539 IGDS module U Bristol JC Ended July 2000B440 Research Inst CASE RS From March 1999 Matthew KnightB359 Finite element NFFRI MNJ From August 1998 LiWu WeiB520 SperBoy DTI JC From May 2001 Fraser Johnson/Nicky HarperB508 Improves EPSRC RS From April 2001 Sarvat AhmadB522 Hammerhead EPSRC RS From September 2001 Dedy Loebis/Wasif Naeem Until September 2004B533 Doctoral Trg EPSRC JS From October 2001 Chris Leavey Until September 2004B180 Al welding Corus MNJ From September 1996B481 IJ Fatigue Elsevier MNJ From October 1999
Bob Allen self MAB Bob AllenChiew S Tan HEFCE RS Chiew S Tan
B180 Sii Pin Ting GR/Corus MNJ Sii Pin TingPort Elizabeth TechnikonHEFCE MNJ Hannalie LombardStefanos Mintsis self YMD Stefanos Mintsis
Teaching Company Schemes3482 Centrax 2 TCD RSB Not taken up3316 Harlequin TCD Moate Not taken up3888 Move Virgo TCD JS Not taken up
3116 Pump International TCD DJG From July 2000 Keith Menadue2783 Teignbridge 1 TCD Childe From July 2000 Stewart Kelly3106 M4 Data TCD RSB From January 2001 Steven Watts3161 Teignbridge 2 TCD MEM From August 2000 Sarah Dransfield3216 Smart Mfg TCD DJG From October 2000 Craig Yeo3078 Plastech TCD SMG From January 2001 Leslie Bond3067 GKN TCA Lara TCD JS From May 2001 Lara Attridge3482 Centrax 1 TCD RS From June 2001 Andrew Barrington3067 GKN TCA Iosif TCD SMG From October 2001 Iosif Progoulakis3067 GKN TCA Robert TCD TJS From November 2001 Robert Blackburn3720 Vortok TCD JS From November 2001 Alan Sleith3223 Derlite TCD JWB From November 2001 Adrian Popovici3819 Bakare TCD JWB Kevin Brooker4198 Plastech TTI SMG Stephen Walden4274 Dowty Propellers TTI TJS Robert Witik
2002 2003 2004
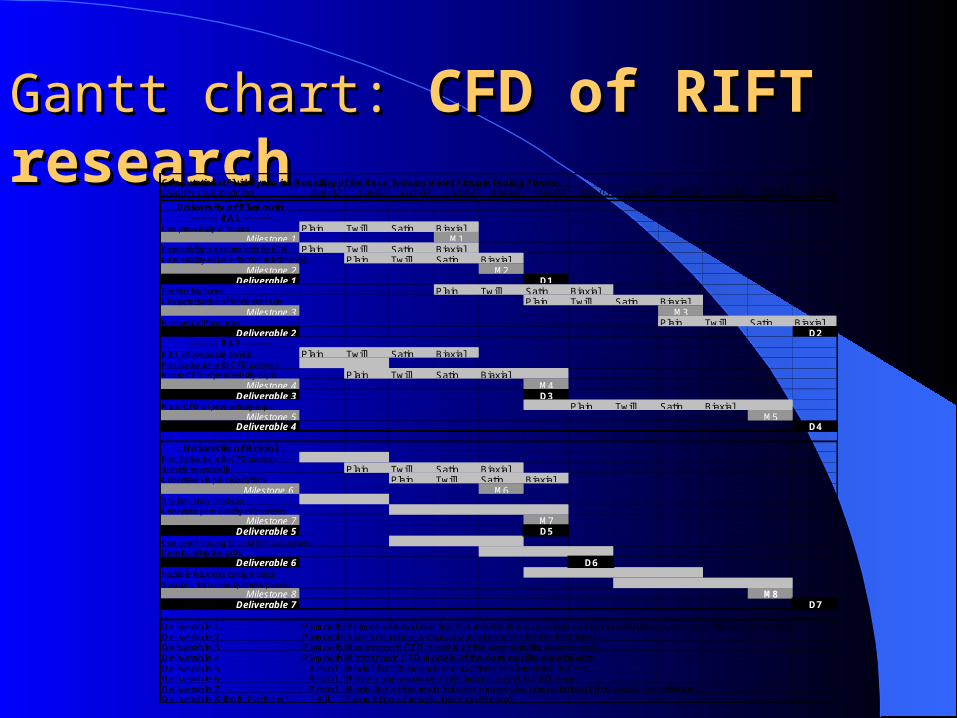
Gantt chart:Gantt chart: CFD of RIFT CFD of RIFT researchresearchComputational Fluid Dynamics Modelling of the Resin Infusion Under Flexible Tooling Process
Quarter commencing Apr-02 Jul-02 Oct-02 Jan-03 Apr-03 Jul-03 Oct-03 Jan-04 Apr-04 Jul-04 Oct-04 Jan-05
University of Plymouth~~~~~ RA1 ~~~~~
Compressibility of fabrics Plain Twill Satin BiaxialMilestone 1 M1
Permeability measurements by RTM Plain Twill Satin BiaxialPermeability-volume fraction relationships Plain Twill Satin Biaxial
Milestone 2 M2Deliverable 1 D1
Section laminates Plain Twill Satin BiaxialCharacterisation of fabric structure Plain Twill Satin Biaxial
Milestone 3 M3Mechanical Properties Plain Twill Satin Biaxial
Deliverable 2 D2~~~~~ RA2 ~~~~~
RIFT of composite panels Plain Twill Satin BiaxialFamiliarisation with CFD packageMacro-CFD of permeability expts Plain Twill Satin Biaxial
Milestone 4 M4Deliverable 3 D3
Micro-CFD of permeability expts Plain Twill Satin BiaxialMilestone 5 M5
Deliverable 4 D4
University of BristolFamiliarisation with CFD packageIdentify repeat cells Plain Twill Satin BiaxialUndertake simple calculations Plain Twill Satin Biaxial
Milestone 6 M6Slip-boundary conditionUndertake permeability calculations
Milestone 7 M7Deliverable 5 D5
Compare/coupling 1st and 2nd calculationsDevelop adaptive grids
Deliverable 6 D6Variable thickness cavity modelsSolutions for non-uniqueness problem
Milestone 8 M8Deliverable 7 D7
Deliverable 1 Plymouth Permeability/volume fraction relationships including validation of Kozeny-Carman model or alternativesDeliverable 2 Plymouth Structure-process-property relationships for the four fabricsDeliverable 3 Plymouth Macroscopic CFD models of the permeability experimentsDeliverable 4 Plymouth Microscopic CFD models of the permeability experimentsDeliverable 5 Bristol Model for slip-boundary conditions implemented in CFDDeliverable 6 Bristol Moving and adaptive grids implemented in CFD codeDeliverable 7 Bristol Modelling of the resin infusion process by computational fluid dynamics software Deliverable 8 (both Partners) All Correlation of results into Final Report
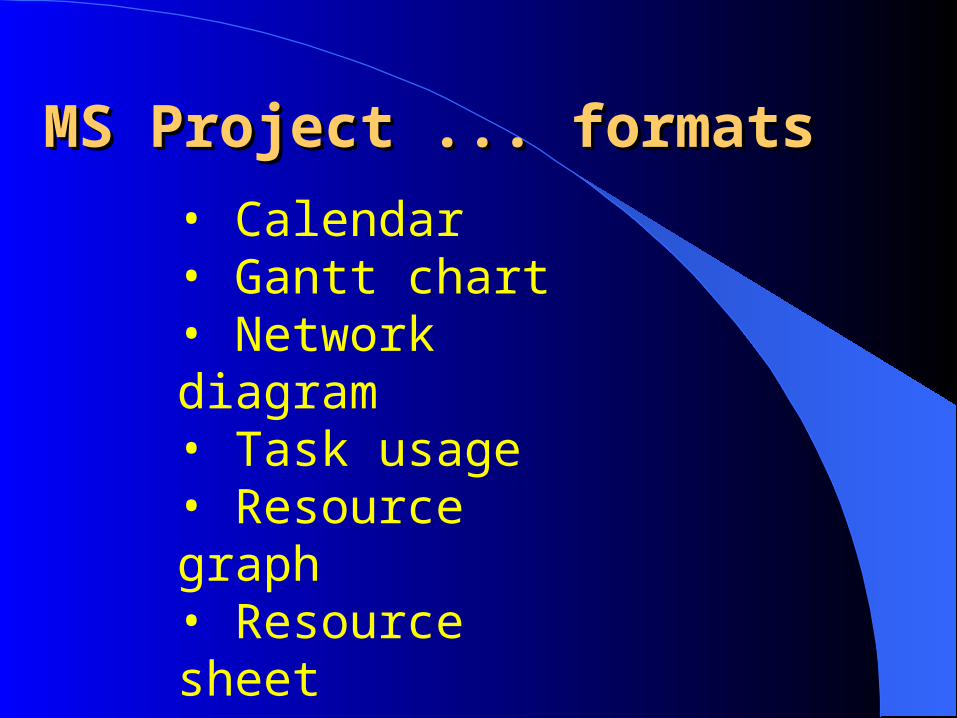
MS Project ... formatsMS Project ... formats
• Calendar• Gantt chart• Network diagram• Task usage• Resource graph• Resource sheet• Resource usage• Report
Program Evaluation Review Program Evaluation Review Technique (PERT) Technique (PERT)
graphic representation of schedule for project– developed by USN for Polaris missile programme
shows – sequence of tasks– which tasks can be performed simultaneously– permits determination of the critical path for the
individual tasks to be completed on time in order for the project to meet its completion deadline
Critical Path Critical Path Analysis/MethodAnalysis/Method
developed by the private sector at the time that PERT was started– has become synonymous with PERT– referred to as any of CPM, PERT or PERT/CPM
critical path is the set of individual tasks(each dependent on the preceding one) which taken together require thelongest time to complete (i.e. minimum time)
can be much more difficult to interpret than a Gantt chart.
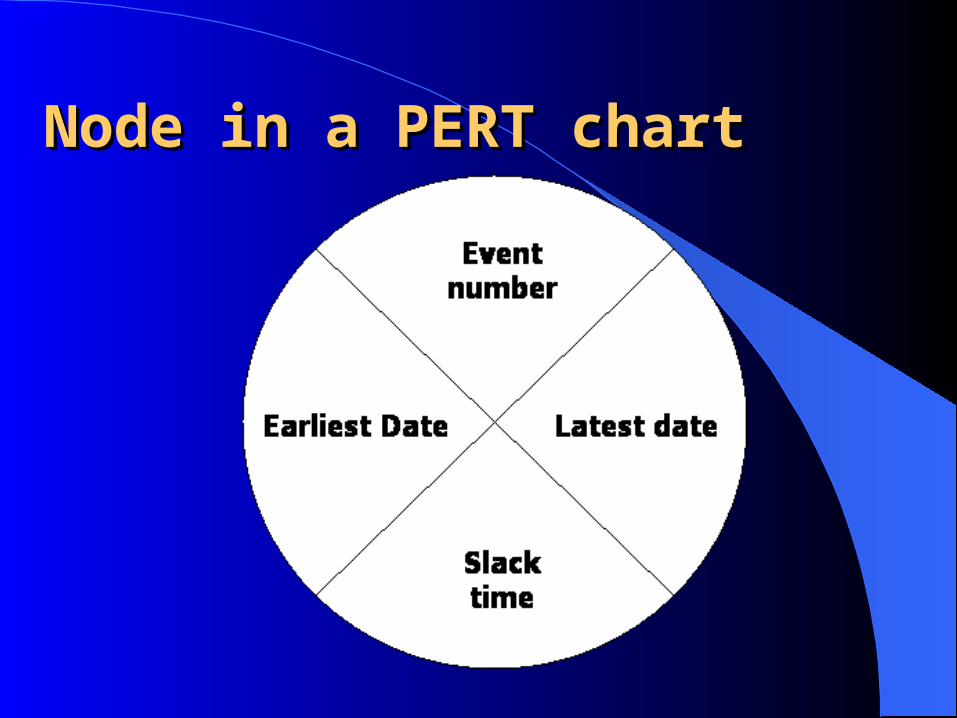
Node in a PERT chartNode in a PERT chart
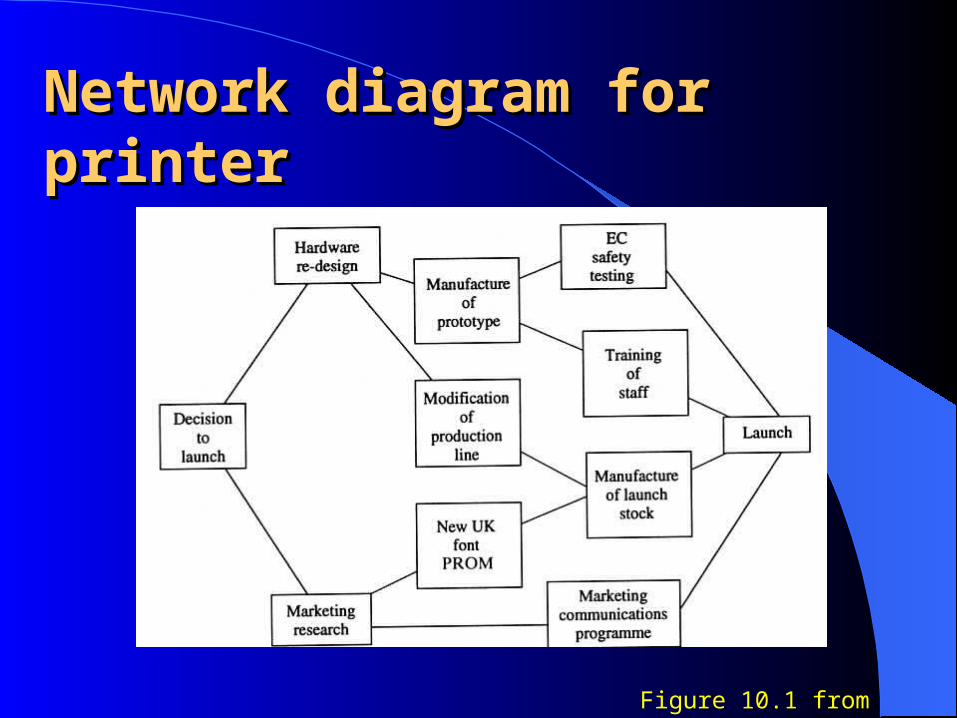
Network diagram for Network diagram for printerprinter
Figure 10.1 from Curtis book
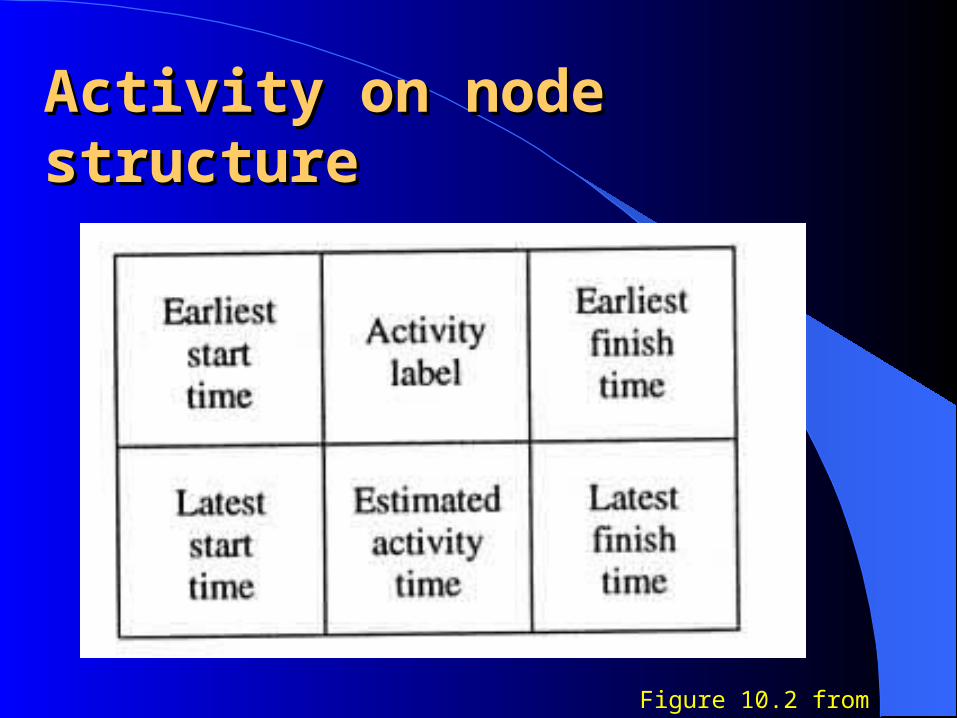
Activity on node structureActivity on node structure
Figure 10.2 from Curtis book
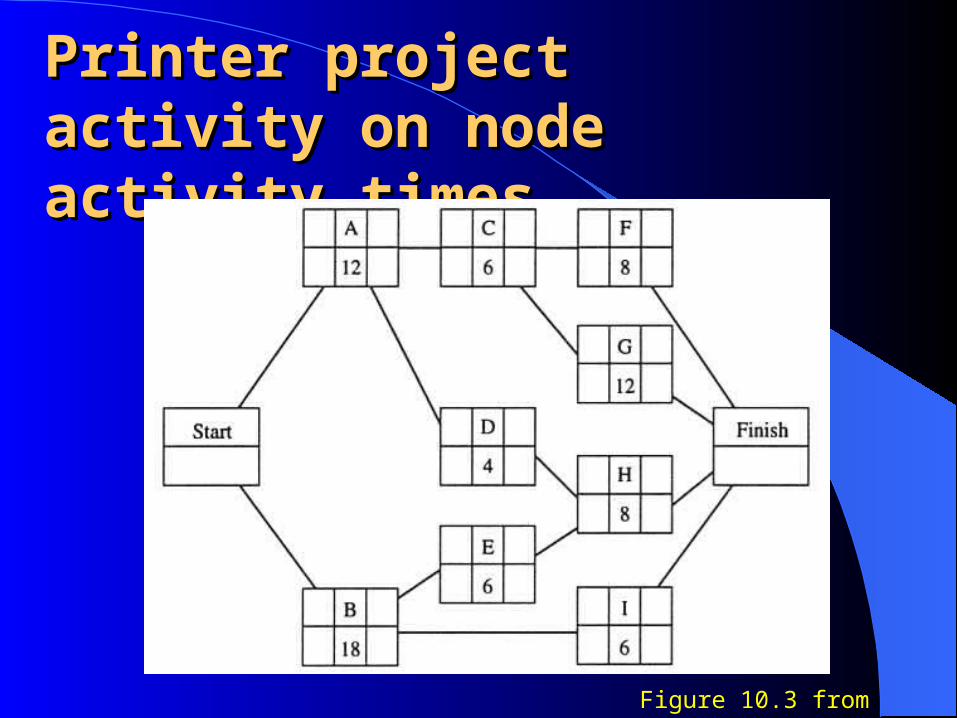
Printer project Printer project activity on node activity activity on node activity timestimes
Figure 10.3 from Curtis book
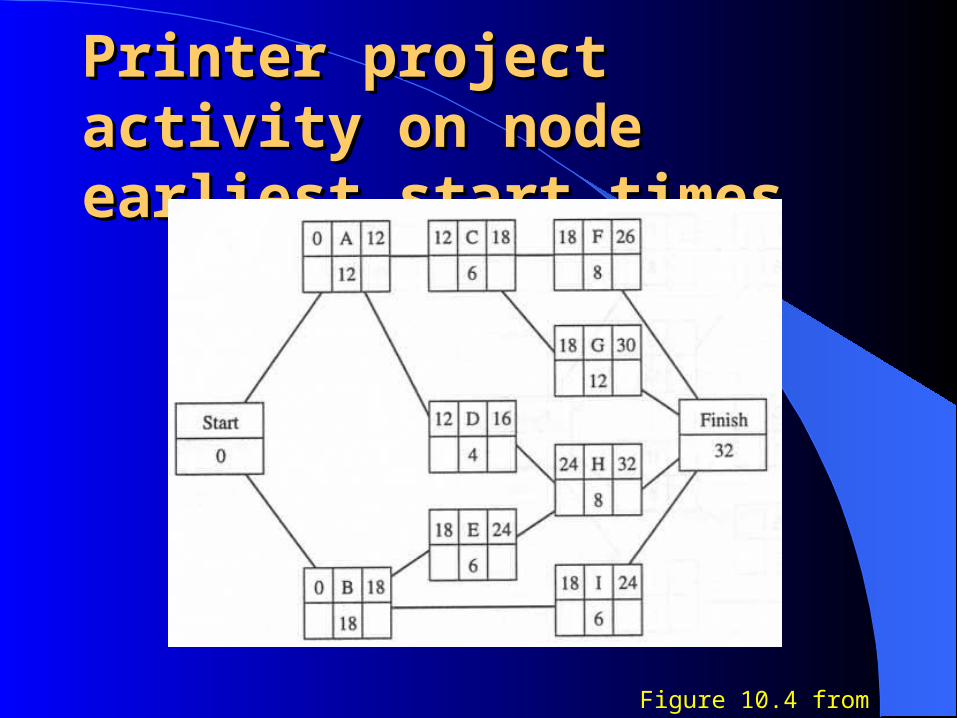
Printer project activity Printer project activity on node earliest start on node earliest start timestimes
Figure 10.4 from Curtis book
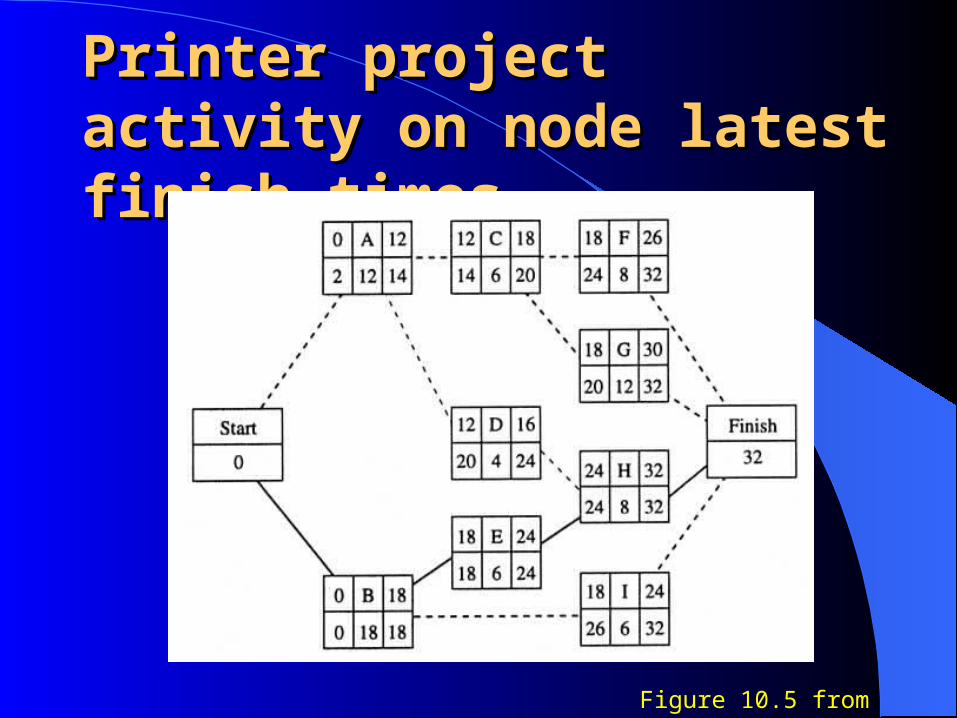
Printer project activity Printer project activity on node latest finish on node latest finish timestimes
Figure 10.5 from Curtis book
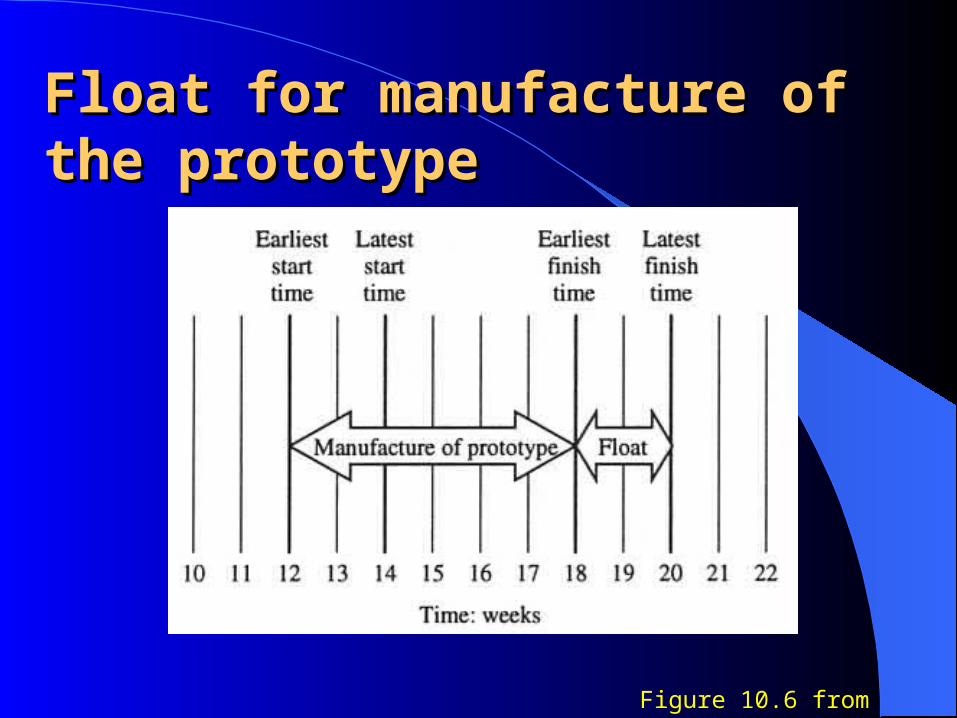
Float for manufacture of Float for manufacture of the prototypethe prototype
Figure 10.6 from Curtis book
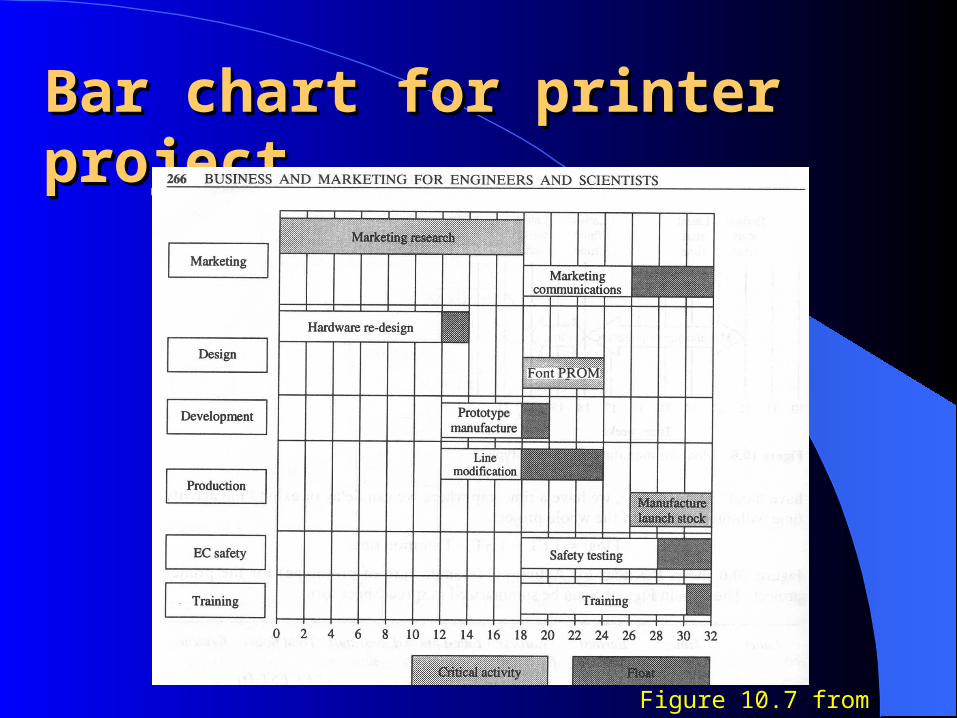
Bar chart for printer Bar chart for printer projectproject
Figure 10.7 from Curtis book
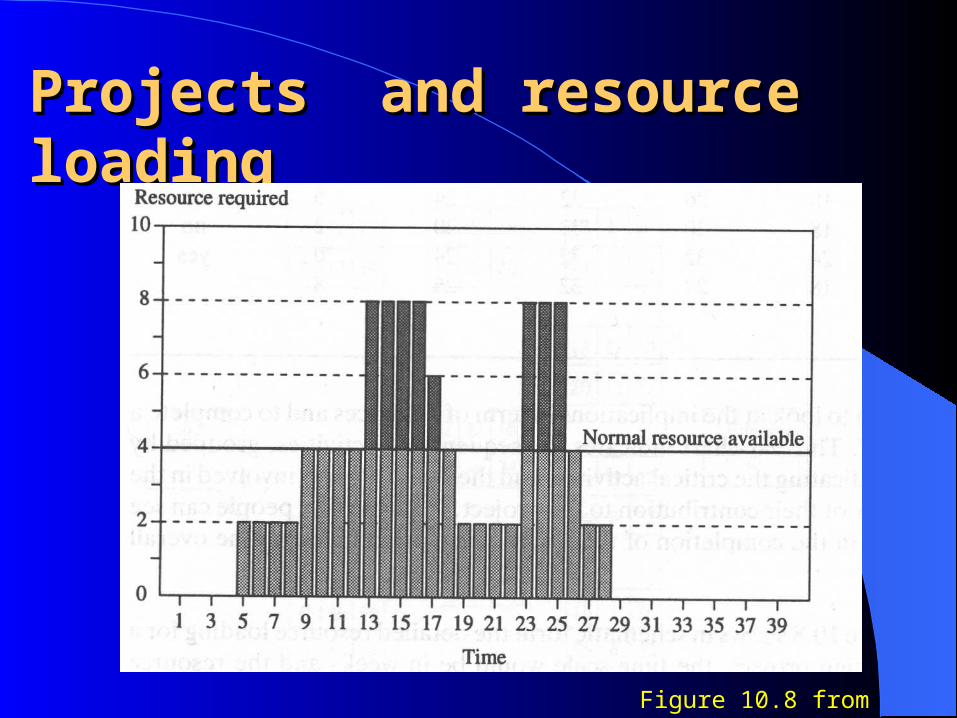
Projects and resource Projects and resource loadingloading
Figure 10.8 from Curtis book
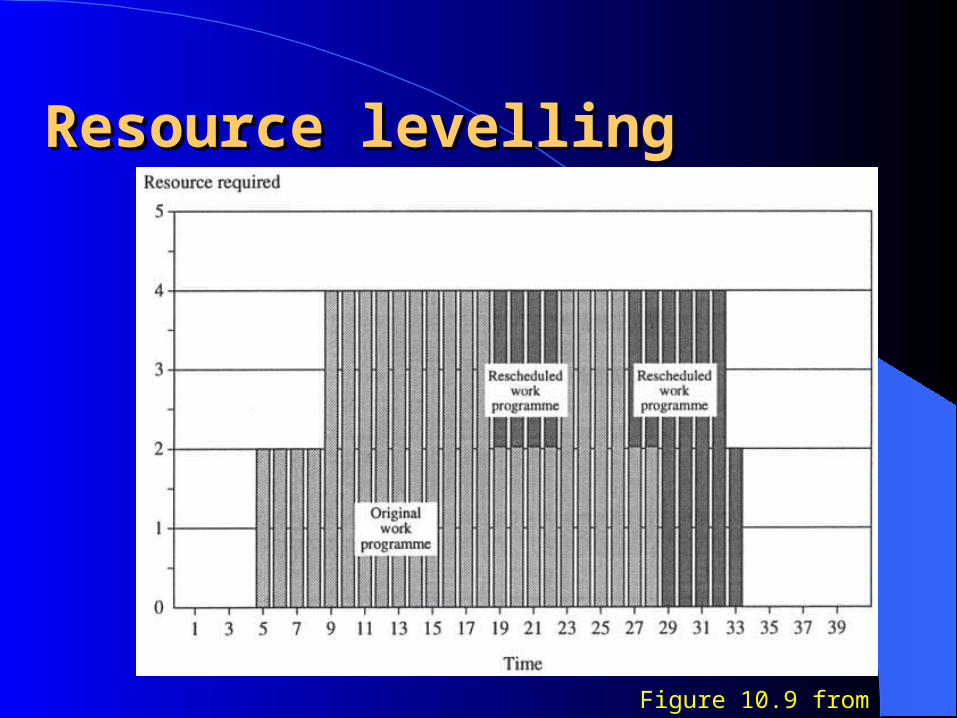
Resource levellingResource levelling
Figure 10.9 from Curtis book
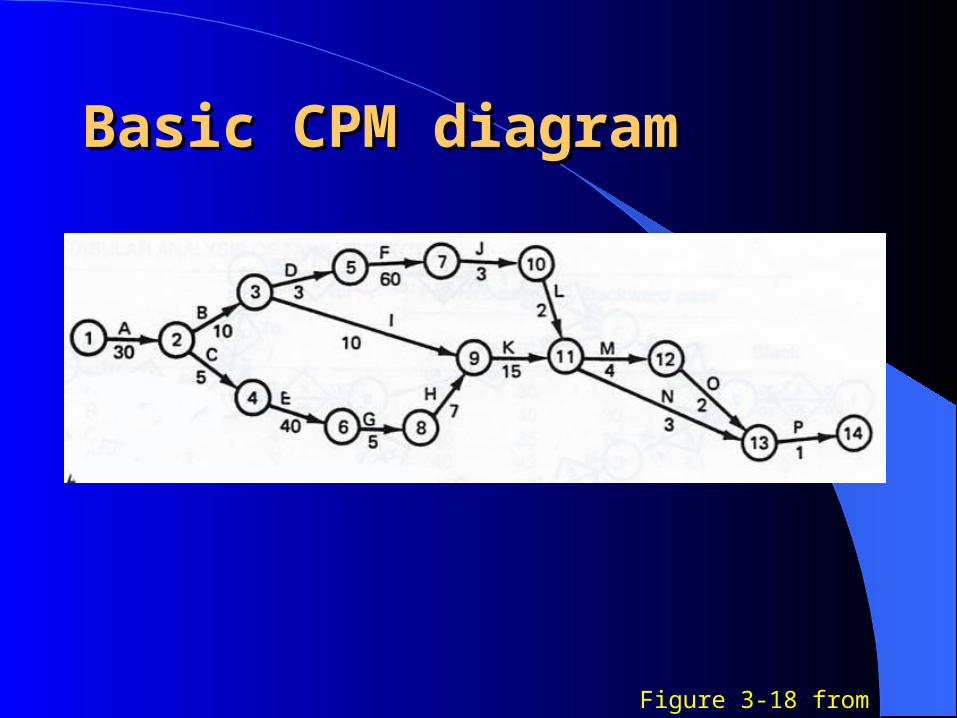
Basic CPM diagramBasic CPM diagram
Figure 3-18 from Hicks book
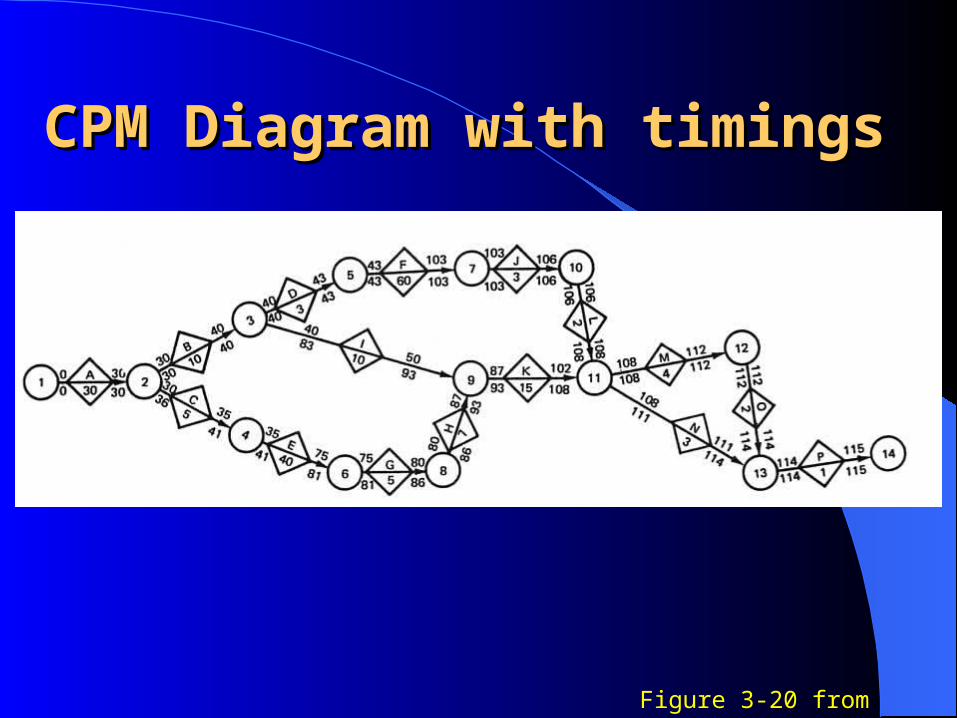
CPM Diagram with CPM Diagram with timingstimings
Figure 3-20 from Hicks book
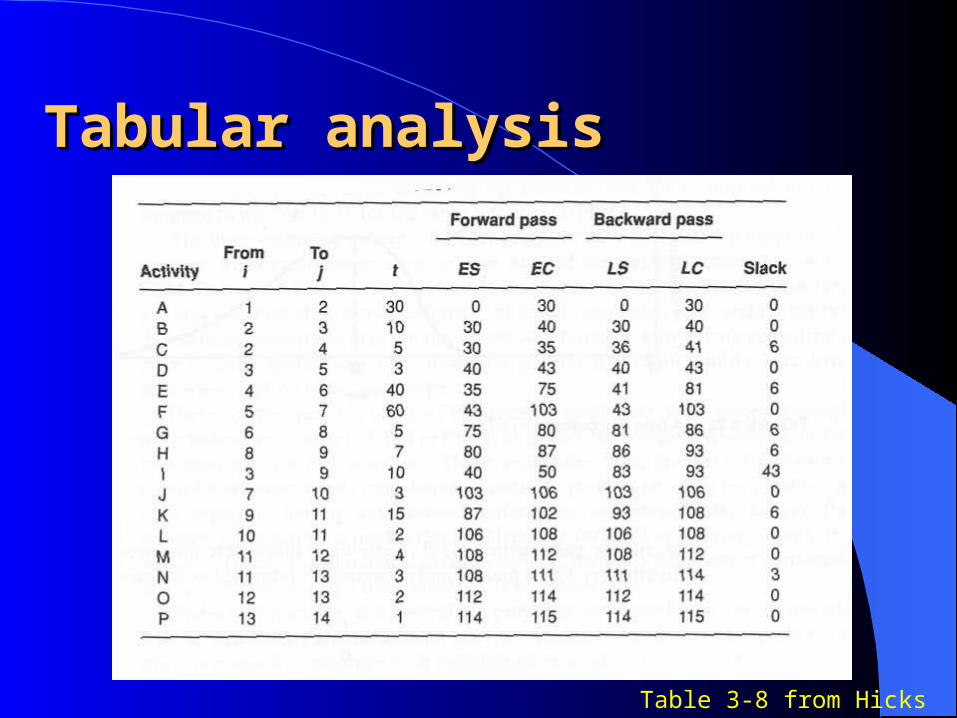
Tabular analysisTabular analysis
Table 3-8 from Hicks book
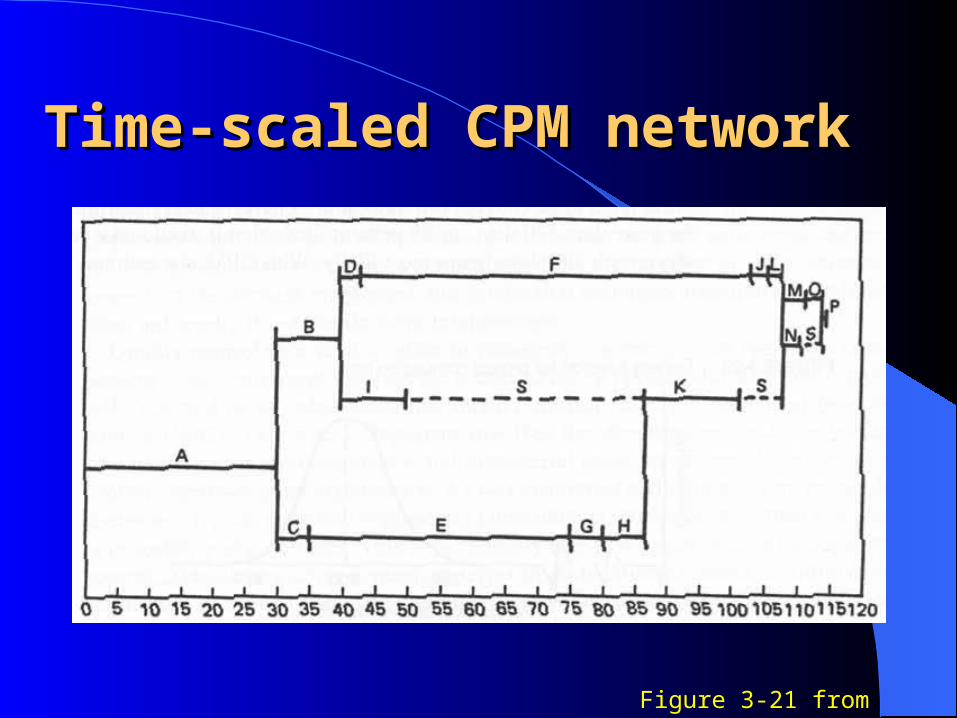
Time-scaled CPM networkTime-scaled CPM network
Figure 3-21 from Hicks book
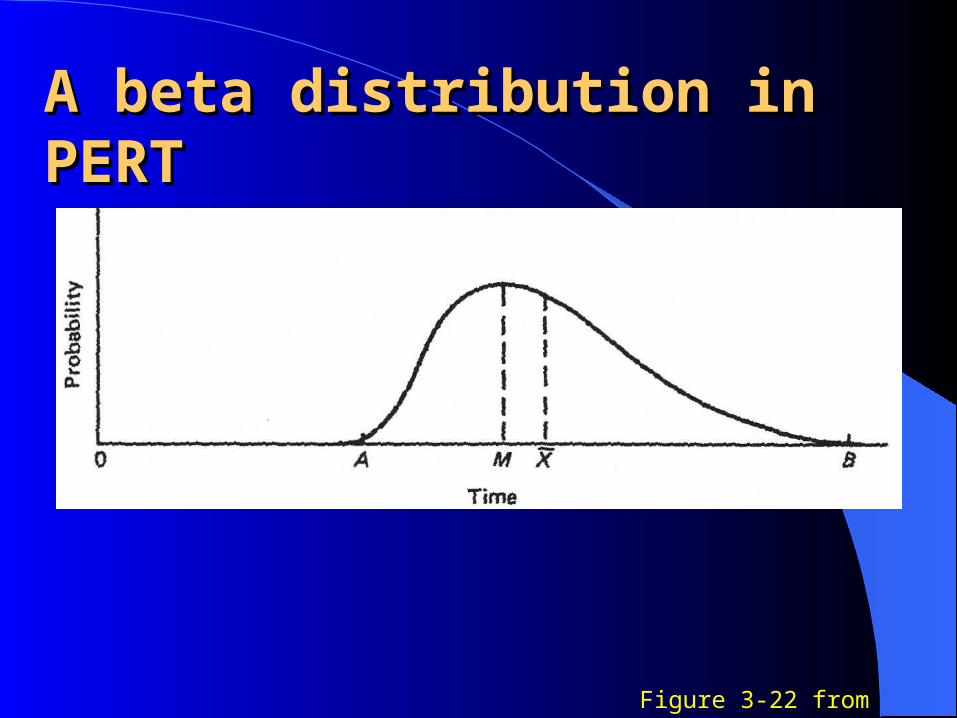
A beta distribution in A beta distribution in PERTPERT
Figure 3-22 from Hicks book
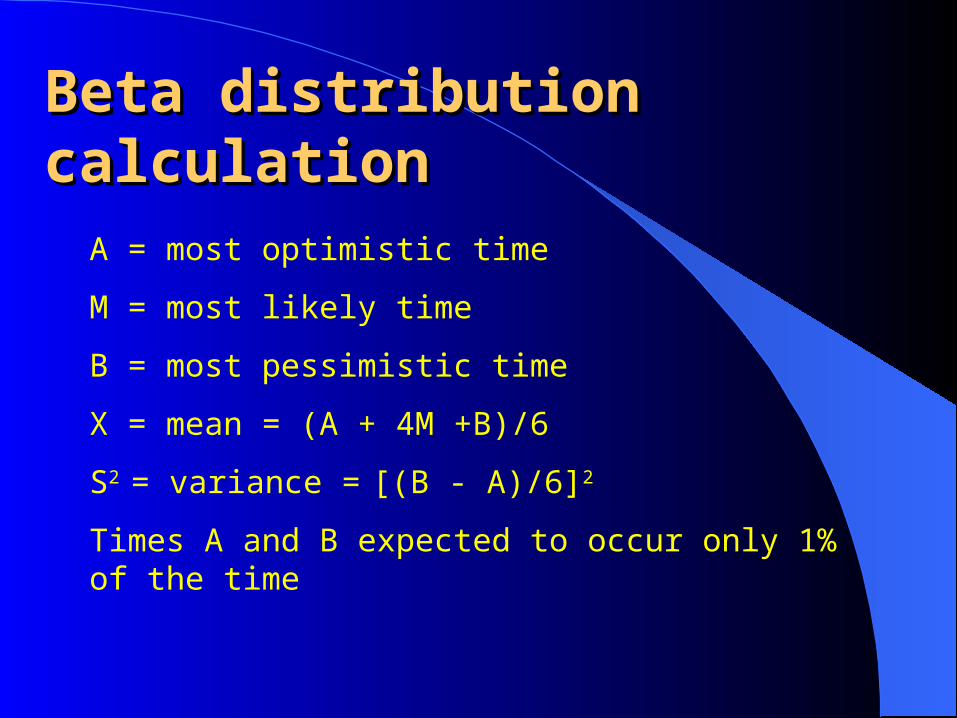
Beta distribution Beta distribution calculationcalculation
A = most optimistic time
M = most likely time
B = most pessimistic time
X = mean = (A + 4M +B)/6
S2 = variance = [(B - A)/6]2
Times A and B expected to occur only 1% of the time
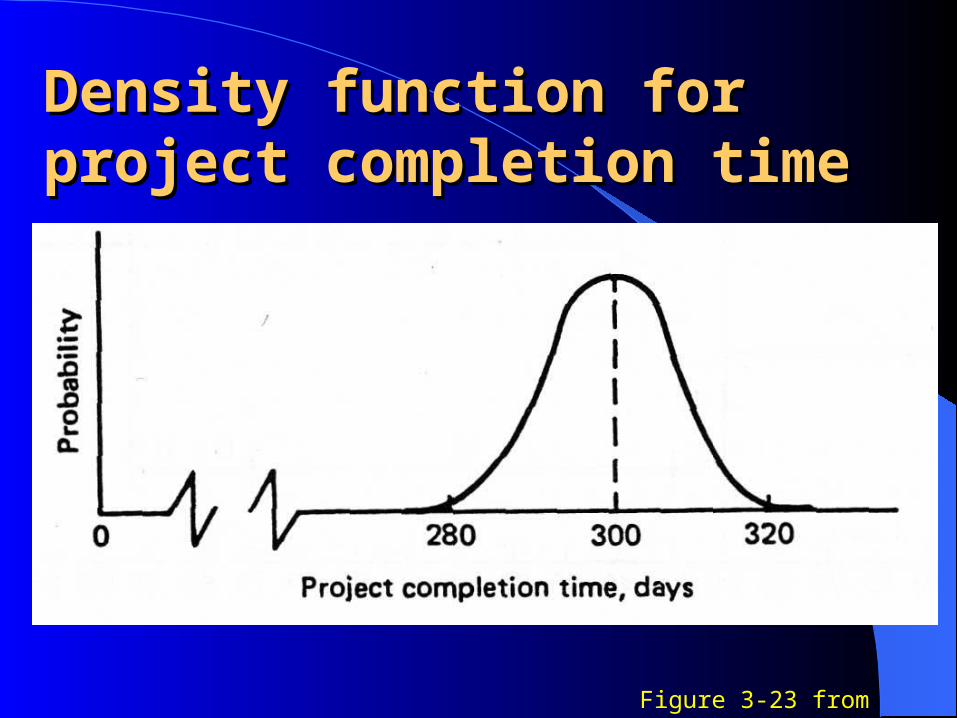
Density function for Density function for project completion timeproject completion time
Figure 3-23 from Hicks book
ReferencesReferences
Tony Curtis,Business and Marketing for Engineers and Scientists, McGraw-Hill, Maidenhead, 1993. ISBN 0-07-707-868-3.
Philip E Hicks,Industrial Engineering and Management - a new perspective, McGraw-Hill, 1994. ISBN 0-07-028807-0.
Richard Pettinger,Introduction to Management,Macmillan, Basingstoke, 1994. ISBN 0-333-59769-9.
Technology Road Maps Technology Road Maps (TRM)(TRM) the most basic form can be
considered as a time-based chart consisting of a number of layers– commercial,– technological,– legislative, and– environmental perspective
Technology Road Maps Technology Road Maps (TRM)(TRM) Developing a Technology Road Map
requires three steps:– Market requirements forecast, – Product implications forecast, and – Technology implications forecast.