Lecture 17: Modular Programming (cont) Debugging and Debuggers.

1SLAU647C–July 2015–Revised February 2016Submit Documentation Feedback
Copyright © 2015–2016, Texas Instruments Incorporated
MSP Debuggers
MSP430, E2E, EnergyTrace are trademarks of Texas Instruments.OS X is a registered trademark of Apple, Inc.IAR Embedded Workbench is a trademark of IAR Systems.Linux is a registered trademark of Linus Torvalds.Windows is a registered trademark of Micosoft Corporation.All other trademarks are the property of their respective owners.
User's GuideSLAU647C–July 2015–Revised February 2016
MSP Debuggers
This manual describes the use and the features of all MSP debug probes. It includes information about thedebugger probe hardware and software. It documents frequently asked questions on how to enable anddisable certain features. It shows the differences between the debug probes and offers a guide on how toidentify the specific version of the debug probe hardware.
Contents1 Introduction ................................................................................................................... 32 MSP Debug Probe Overview............................................................................................... 43 Hardware Identification...................................................................................................... 64 Hardware Installation ........................................................................................................ 85 Debug Probes Hardware and Software ................................................................................. 12
List of Figures
1 eZ-FET Windows Enumeration ............................................................................................ 62 eZ-FET Emulation IP ........................................................................................................ 63 eZ-FET Lite Emulation IP ................................................................................................... 64 eZ430 Emulation IP ......................................................................................................... 75 eZ430 Windows Enumeration.............................................................................................. 76 MSP Flasher Driver Install Notification .................................................................................. 107 CCS Cloud Agent Installation............................................................................................. 118 Successful CCS Cloud Agent Installation............................................................................... 119 MSP Ecosystem ............................................................................................................ 1210 MSP-FET Top View........................................................................................................ 1411 MSP-FET Bottom View .................................................................................................... 1412 MSP-FET 14-Pin JTAG Connector ...................................................................................... 1713 MSP-FET USB Debugger, Schematic (1 of 5) ......................................................................... 1914 MSP-FET USB Debugger, Schematic (2 of 5) ......................................................................... 2015 MSP-FET USB Debugger, Schematic (3 of 5) ......................................................................... 2116 MSP-FET USB Debugger, Schematic (4 of 5) ......................................................................... 2217 MSP-FET USB Debugger, Schematic (5 of 5) ......................................................................... 2318 MSP-FET USB Debugger, PCB (Top)................................................................................... 2319 MSP-FET USB Debugger, PCB (Bottom)............................................................................... 2320 MSP-FET430UIF Version 1.4a Top and Bottom Views ............................................................... 2521 MSP-FET430UIF Version 1.3 Top and Bottom Views ................................................................ 2522 MSP-FET430UIF 14-Pin JTAG Connector.............................................................................. 2623 MSP-FET430UIF USB Interface, Schematic (1 of 4).................................................................. 2824 MSP-FET430UIF USB Interface, Schematic (2 of 4).................................................................. 2925 MSP-FET430UIF USB Interface, Schematic (3 of 4).................................................................. 30

www.ti.com
2 SLAU647C–July 2015–Revised February 2016Submit Documentation Feedback
Copyright © 2015–2016, Texas Instruments Incorporated
MSP Debuggers
26 MSP-FET430UIF USB Interface, Schematic (4 of 4).................................................................. 3127 MSP-FET430UIF USB Interface, PCB .................................................................................. 3228 eZ-FET and eZ-FET Lite (Top View) .................................................................................... 3329 eZ-FET Rev1.3 (Top View) ............................................................................................... 3330 eZ-FET or eZ-FET Lite Debug Connector .............................................................................. 3531 MSP-FET to LaunchPad Pin Assignments ............................................................................. 3632 MSP-FET to LaunchPad Wiring Diagram ............................................................................... 3633 eZ-FET Schematic (USB Connection)................................................................................... 3734 eZ-FET Schematic (Emulation MCU).................................................................................... 3835 eZ-FET Schematic DCDC (No eZ-FET Lite) ........................................................................... 3936 eZ430 Emulation ........................................................................................................... 4037 eZ430 Debug Connector on MSP-EXP430G2 LaunchPad........................................................... 4138 eZ430 Schematic (Emulation MCU) ..................................................................................... 4239 eZ430 Schematic (USB Connection) .................................................................................... 4340 MSP-FET430PIF ........................................................................................................... 4441 MSP-FET430PIF FET Interface Module, Schematic .................................................................. 4542 MSP-FET430PIF FET Interface Module, PCB ......................................................................... 46
List of Tables
1 Debug Probes Features and Device Compatibility ...................................................................... 42 MSP-FET Backchannel UART Implementation ........................................................................ 153 MSP-FET Backchannel UART Activation Commands ................................................................ 164 MSP-FET MSP Target BSL Activation Commands.................................................................... 165 MSP-FET LED Signals .................................................................................................... 176 MSP-FET Pin States....................................................................................................... 187 MSP-FET430UIF LED Signals ........................................................................................... 268 MSP-FET430UIF Pin States .............................................................................................. 279 eZ-FET and eZ-FET Lite Backchannel UART Implementation....................................................... 3410 eZ-FET and eZ-FET Lite Backchannel UART Activation Commands............................................... 3511 eZ-FET LED Signals ....................................................................................................... 3512 eZ-FET and eZ-FET Lite Pin States ..................................................................................... 3613 eZ430 Backchannel UART Implementation ............................................................................ 4114 eZ430 Pin States ........................................................................................................... 41

www.ti.com Introduction
3SLAU647C–July 2015–Revised February 2016Submit Documentation Feedback
Copyright © 2015–2016, Texas Instruments Incorporated
MSP Debuggers
1 Introduction
1.1 Related Documentation From Texas Instruments
MSP430™ Hardware Tools User's Guide (SLAU278)
IAR Embedded Workbench™ Version 3+ for MSP430™ User's Guide (SLAU138)
Advanced Debugging Using the Enhanced Emulation Module (EEM) With Code Composer Studio™Version 6 (SLAA393)
MSP430™ Programming With the Bootloader (BSL) (SLAU319)
MSP430™ Programming Via the JTAG Interface (SLAU320)
1.2 Terms and Abbreviations
Term DefinitionBSL BootloaderCCS Code Composer Studio development tool for MSP430CDC Communications device classCPU Central processing unitCRC Cyclic redundancy checkCTS Clear to sendFET Flash emulation toolI2C Inter-Integrated Circuit 2-wire communication busIAR EW430 IAR Embedded Workbench development tool for MSP430JTAG Joint Test Action GroupJTAG 4-wire 4-wire JTAG protocol communicationMCLK Master clockMSP Mixed signal processorMSP-FET MSP debug probeMSP-FET430 UIF MSP debug probeMSPDebugStack Dynamic library (Windows®), shared object (Linux®), or dy library (OS X®) that offers functions to access and
debug MSP430 devices using an MSP debug probePC Personal computerRTS Request to sendRX Receive dataSBW Spy-Bi-Wire (2-wire JTAG protocol) communicationTX Transmit dataUART Universal asynchronous receiver/transmitterUIF USB interface to debug and access MSP derivativesUSB Universal serial bus
1.3 If You Need AssistanceSupport for the MSP microcontrollers and the development tools is provided by the TI Product InformationCenter (PIC). Contact information for the PIC can be found on the TI website at www.ti.com/support. TheTI E2E™ Community support forums for the MSP microcontrollers also provide open interaction andsupport from a community of peer engineers, TI engineers, and other experts. Additional device-specificinformation can be found on the MSP website.

MSP Debug Probe Overview www.ti.com
4 SLAU647C–July 2015–Revised February 2016Submit Documentation Feedback
Copyright © 2015–2016, Texas Instruments Incorporated
MSP Debuggers
2 MSP Debug Probe OverviewTable 1 is an overview of the capabilities and features for the available MSP debug probes.
CAUTIONNever disconnect the JTAG or emulator USB cable during an active debugsession. Always terminate a running debug session properly, by clicking on the"Terminate" icon, before disconnecting the target device.
(1) The MSP-FET430PIF is for legacy device support only. This emulation tool does not support any devices released after 2011.(2) Refer to Section 3.1 to identify the hardware.(3) The eZ-FET Emulation IP and eZ-FET Lite Emulation IP are used as the onboard emulation for the MSP LaunchPad tools.(4) Refer to Section 5.5 for more information.(5) The 2-wire JTAG debug interface is also referred to as Spy-Bi-Wire (SBW) interface.
Table 1. Debug Probes Features and Device Compatibility (1) (2) (3)
Feature and MSP430 Device Support
eZ43
0-F2
013
eZ43
0-R
F250
0
eZ43
0-R
F248
0
eZ43
0-R
F256
0
MSP
-WD
Sxx
Met
awat
ch
eZ43
0-C
hron
os
Laun
chPa
d(M
SP-E
XP43
0G2)
MSP
-EXP
430F
R57
39
MSP
-EXP
430F
5529
MSP
-FET
430P
IF
MSP
-FET
430U
IF
MSP
-FET
eZ-F
ETEm
ulat
ion
IP
eZ-F
ETLi
teEm
ulat
ion
IP
Supports all programmable MSP430 andCC430 devices ✓ ✓ ✓ ✓ ✓
Supports only F20xx, G2x01, G2x11,G2x21, G2x31 ✓
Supports F20xx, F21x2, F22xx, G2x01,G2x11, G2x21, G2x31, G2x53 ✓
Supports F20xx, F21x2, F22xx, G2x01,G2x11, G2x21, G2x31 ✓ ✓
Supports F5438, F5438A ✓Supports BT5190, F5438A ✓ ✓Supports only F552x ✓Supports FR57xx, F5638, F6638 ✓Supports only CC430F613x ✓Supports MSP432Pxx ✓Allows JTAG access protection(Fuse Blow) (4) ✓ ✓
Adjustable target supply voltage ✓ ✓Fixed 2.8-V target supply voltage ✓Fixed 3.3-V target supply voltage ✓ ✓Fixed 3.6-V target supply voltage ✓ ✓ ✓ ✓ ✓ ✓ ✓ ✓ ✓4-wire JTAG ✓ ✓ ✓2-wire JTAG (5) ✓ ✓ ✓ ✓ ✓ ✓ ✓ ✓ ✓ ✓ ✓ ✓ ✓BSL tool or mode ✓Backchannel UART ✓ ✓ ✓ ✓ ✓ ✓ ✓ ✓ ✓ ✓ ✓Supported by CCS for Windows ✓ ✓ ✓ ✓ ✓ ✓ ✓ ✓ ✓ ✓ ✓ ✓ ✓ ✓Supported by CCS for Linux ✓ ✓ ✓ ✓Supported by CCS for OS X ✓ ✓ ✓ ✓

www.ti.com MSP Debug Probe Overview
5SLAU647C–July 2015–Revised February 2016Submit Documentation Feedback
Copyright © 2015–2016, Texas Instruments Incorporated
MSP Debuggers
Table 1. Debug Probes Features and Device Compatibility (1) (2) (3) (continued)
Feature and MSP430 Device Support
eZ43
0-F2
013
eZ43
0-R
F250
0
eZ43
0-R
F248
0
eZ43
0-R
F256
0
MSP
-WD
Sxx
Met
awat
ch
eZ43
0-C
hron
os
Laun
chPa
d(M
SP-E
XP43
0G2)
MSP
-EXP
430F
R57
39
MSP
-EXP
430F
5529
MSP
-FET
430P
IF
MSP
-FET
430U
IF
MSP
-FET
eZ-F
ETEm
ulat
ion
IP
eZ-F
ETLi
teEm
ulat
ion
IP
Supported by IAR ✓ ✓ ✓ ✓ ✓ ✓ ✓ ✓ ✓ ✓ ✓ ✓ ✓ ✓EnergyTrace™, EnergyTrace++ ✓ ✓

Hardware Identification www.ti.com
6 SLAU647C–July 2015–Revised February 2016Submit Documentation Feedback
Copyright © 2015–2016, Texas Instruments Incorporated
MSP Debuggers
3 Hardware Identification
3.1 How to Determine If Your Hardware is Based on eZ-FET or eZ-FET Lite• Check the installed tool drivers by using the Windows Device Manager. eZ-FET tools enumerate as
CDC "MSP Debug Interface" and CDC "MSP Application UART1" devices (see Figure 1).• Check the Experimenter Board or LaunchPad emulation section to find out if it is based on an eZ-FET
tool. If it is based on an MSP430F5528 device, it is an eZ-FET tool.• There is a small print on the silkscreen that indicates eZ-FET or eZ-FET Lite (see Figure 2 and
Figure 3).
Figure 1. eZ-FET Windows Enumeration
Figure 2. eZ-FET Emulation IP
Figure 3. eZ-FET Lite Emulation IP

www.ti.com Hardware Identification
7SLAU647C–July 2015–Revised February 2016Submit Documentation Feedback
Copyright © 2015–2016, Texas Instruments Incorporated
MSP Debuggers
3.2 How to Determine If Your Hardware is Based on eZ430• Check the installed tool drivers by using the Windows Device Manager (see Figure 5). eZ430 tools
enumerate as HID (Debugger port) and CDC (Backchannel UART) devices.• Check the Experimenter Board to find out if it is based on an eZ430 tool (see Figure 4). If it is based
on an MSP430F1612 and a TUSB3410, it is an eZ430 tool.
Figure 4. eZ430 Emulation IP
Figure 5. eZ430 Windows Enumeration
3.3 Signal Connections for In-System Programming and DebuggingFor details about the hardware connections of all debug probes refer to the "Signal Connections for In-System Programming and Debugging" section of the MSP430 Hardware Tools User's Guide (SLAU278).
3.4 Using the Power Supply Feature of the eZ-FET and eZ-FET LiteThe eZ-FET and the eZ-FET Lite only support a fixed voltage power supply. The maximum supply currentis 75 mA. For more details, refer to the specific LaunchPad or experimenter board user's guide.
NOTE: These debug probes do not support externally powering of the device while debugging – ifan external voltage is needed for stand-alone testing, the eZ-FET emulation section shouldnot be connected through USB. If both external power and the USB power are connected,there could be a conflict that can damage the device.
3.5 Using the Power Supply Feature of the MSP-FET430UIF and MSP-FETAll MSP debug probes can supply targets with up to 100 mA through pin 2 of the 14-pin JTAG connector.
NOTE: The target should not consume more than 60 mA at peak current, as it may violate the USBspecification. Details can found on www.USB.org.
Example: If the target board has a capacitor on the VCC line with a capacity of more than 10 µF, it maycause an inrush current during capacitor charging that may exceed 60 mA. In this case, the current shouldbe limited by the design of the target board, or an external power supply should be used.

Hardware Installation www.ti.com
8 SLAU647C–July 2015–Revised February 2016Submit Documentation Feedback
Copyright © 2015–2016, Texas Instruments Incorporated
MSP Debuggers
Target VCC is selectable in a range between 1.8 V and 3.6 V in steps of 0.1 V.
Alternatively, the target can be supplied externally. In this case, the external voltage should be connectedto pin 4 of the 14-pin JTAG connector. MSP-FET tools adjusts the level of the JTAG signals toautomatically match the external VCC.
NOTE: Only pin 2 (MSP-FET tool supplies target) or pin 4 (target is externally supplied) must beconnected. Both connections are not supported at the same time.
Even if an external supply powers the target device on the target socket module and anyuser circuitry connected to the target socket module, the MSP-FET tool continues to bepowered from the PC through the USB interface.
NOTE: MSP-FET430PIF only
The PC parallel ports with a connected MSP-FET430PIF can source a maximum current of25 mA. Because of the ultra-low-power requirement of the MSP430, a stand-alone MSP430does not exceed the provided current. However, if additional circuits are added, the currentlimit could be exceeded. In this case, the MSP430 must be supplied externally.
4 Hardware InstallationThis section describes how to install the drivers for all MSP debug probes. The drivers are needed toenable the IDE (integrated development environment) to use the debug probe that is connected to thesystem. There are four different ways to install the drivers.1. CCS desktop: During the CCS setup, all MSP debug probe drivers are installed automatically for all
supported operation systems.2. CCS cloud: The automatic driver installer is included inside the TI Cloud Agent Application, which must
be downloaded when connecting a local MSP debug probe to CCS cloud.3. Stand-alone driver installer: The stand-alone driver installer is only available for Windows. It installs all
MSP debug probe drivers automatically.4. Using another supported IDE such as IAR EW430 or the MSP-Flasher: During the setup, all MSP
debug probe drivers are installed automatically.
4.1 MSP-FET430PIFThe MSP-FET430PIF has the following system requirements:
It supports only Windows XP with IAR EW430 version 5.xx.x and Code Composer Studio version 5.x.x. Nonew development is scheduled to support MSP-FET430PIF.
Follow these steps to install the hardware for the MSP-FET430PIF tool:1. Use the 25-pin ribbon cable to connect the debugger interface module to the parallel port of the PC.
The necessary driver for accessing the PC parallel port is installed automatically during CCS or IAREmbedded Workbench installation. Note that a restart is required after the CCS or IAR EmbeddedWorkbench installation.
2. Use the 14-pin ribbon cable to connect the parallel-port debug interface to a target board whichcontains the target MSP430 device.
4.2 MSP-FET430UIF, MSP-FET, eZ-FET, and eZ-FET Lite
NOTE: The built-in DC-DC converter of the MSP-FET and eZ-FET emulators causes a load-dependent amount of ripple on the output voltage (fripple = 1 kHz to 50 kHz, Vrms_ripple = 5 mV to50 mV), which might affect sensitive analog and RF circuits that are supplied by theemulator. For such sensitive circuits, TI recommends temporarily increasing the amount ofpower supply decoupling used during development, using an emulator with an integratedlinear regulator (MSP-FET430UIF or eZ-FET430), or using a separate bench supply.

www.ti.com Hardware Installation
9SLAU647C–July 2015–Revised February 2016Submit Documentation Feedback
Copyright © 2015–2016, Texas Instruments Incorporated
MSP Debuggers
Installation steps for the MSP-FET430UIF, MSP-FET, eZ-FET or eZ-FET Lite:1. Install the IDE (TI CCS or IAR EW430) before connecting the debug probe to the PC. During IDE
installation, the USB drivers for the debug probes are installed automatically. Make sure to use thelatest IDE version; older versions might install USB drivers that do not recognize the connected debugprobe.
2. Connect the debug probe to a USB port on the PC using the provided USB cable.3. The following procedure applies to operation under Windows:
(a) After connecting to the PC, the debug probe should be recognized automatically, as the USBdevice driver has been already installed together with the IDE.
(b) However, if the driver is not automatically detected, the "Found New Hardware wizard" starts.Follow the instructions and point the wizard to the driver files.The default location for CCS is: c:\ti\ccsv6\ccs_base\emulation\drivers\msp430\USB_CDC.The default location for IAR Embedded Workbench is: <Installation Root>\Embedded Workbenchx.x\430\drivers\<Win_OS>.
4. After connecting the debug probe to a PC, the probe performs a self-test. If the self-test passes, thegreen LED stays on. For a complete list of LED signals, refer to the "LED Signals" of each debugprobe in Section 5.6 through Section 5.8.
5. Connect the debug probe with the target board using the 14-pin ribbon cable.6. When using a target socket board, make sure that the MSP430 device is properly inserted in the
socket and that pin 1 of the device (indicated with a circular indentation on the top surface) aligns withthe "1" mark on the PCB.
NOTE: To use the debug probe without an IDE, install the stand-alone driver package. The stand-alone driver installer can be found at http://www.ti.com/mspds under the heading MSPDS-USB-DRIVERS.
4.3 eZ430-Based Experimenter Boards and LaunchPad KitsFor driver installation on a Windows operating system, follow the steps in Section 4.2.
NOTE: eZ430-tools are not supported on USB3.0 ports. eZ430 tools are supported on Windowsoperating systems only—Linux and OS X are not supported.
4.4 Hardware Installation Using the MSP FlasherMSP Flasher is an open-source shell-based interface for programming any MSP430 device through aMSP Debug Stack and provides the most common functions on the command line. MSP Flasher can beused to download binary files (.txt or .hex) directly to the MSP430 memory without the need for an IDE likeCCS or IAR. It can also be used to extract firmware directly from a device, set hardware breakpoints, andlock JTAG access permanently.
MSP Flasher supports the following operating systems:• Windows 10 32-bit or 64-bit• Windows 8 32-bit or 64-bit• Windows 7 32-bit or 64-bit• Windows XP 32-bit or 64-bit• Ubuntu 32-bit• OS X 64-bit

Hardware Installation www.ti.com
10 SLAU647C–July 2015–Revised February 2016Submit Documentation Feedback
Copyright © 2015–2016, Texas Instruments Incorporated
MSP Debuggers
Installation steps for the MSP-FET430UIF, MSP-FET, eZ-FET or eZ-FET Lite:1. After successfully downloading and executing the MSP Flasher installer, it prompts you to execute the
stand-alone driver installer for the MSP debug probes.
Figure 6. MSP Flasher Driver Install Notification
2. Follow the steps given by the stand-alone driver installer for debug probe driver installation.3. After successful driver installation, connect the debug probe to a USB port on the PC using the
provided USB cable.4. After connecting the debug probe to a PC, it performs a self-test. If the self-test passes, the green LED
stays on. For a complete list of LED signals, refer to the "LED Signals" of every debug probe inSection 5.6 through Section 5.8.
5. Connect the debug probe with the target board using the 14-pin ribbon cable.6. When using a target socket board, make sure that the MSP430 device is properly inserted in the
socket and that its pin 1 (indicated with a circular indentation on the top surface) aligns with the "1"mark on the PCB.

www.ti.com Hardware Installation
11SLAU647C–July 2015–Revised February 2016Submit Documentation Feedback
Copyright © 2015–2016, Texas Instruments Incorporated
MSP Debuggers
4.5 Hardware Installation Using CCS CloudCCS Cloud is web-based IDE that allows you to create, edit, and build CCS and Energia projects. After aproject is successfully built, it can be downloaded and run on the connected LaunchPad or any otherdebug probe. Basic debugging features, like setting breakpoints or viewing values of target variables arenow supported.
CCS Cloud can be used with the local debug probe connected to the PC through USB. To support thisconfiguration, install the "CCS Cloud browser extension", and download and install the "TI Cloud AgentApplication". For more details, refer to the CCS cloud documentation athttp://processors.wiki.ti.com/index.php/TI_Cloud_Agent.
Figure 7. CCS Cloud Agent Installation
Figure 8. Successful CCS Cloud Agent Installation
After the successful Agent installation, download the application by clicking the Flash or Debug button inCCS Cloud.

MSPDebugStack
JTAG/SBW2JTAG/
SBW2
MSP-Flasher
SBW2
MSP430
USB connection
Debug Probes Hardware and Software www.ti.com
12 SLAU647C–July 2015–Revised February 2016Submit Documentation Feedback
Copyright © 2015–2016, Texas Instruments Incorporated
MSP Debuggers
5 Debug Probes Hardware and SoftwareThis section includes all specifications and features of all MSP debug probes. The debug probe hardwareand different debug mode configuration and setting are descried.
Figure 9 is an overview of the MSP ecosystem showing the relations between IDE and debug probe andthe MSP device itself.
Figure 9. MSP Ecosystem
5.1 MSPDebugStackThe MSPDebugStack is the host side interface to all MSP debug probes. It is a library for controlling anddebugging Texas Instruments MSP ultra-low power microcontrollers during software development phase.
For this purpose the MSP microcontroller is controlled by the MSPDebugStack using the MSP device'sJTAG interface. The MSPDebugStack provides device control (for example, run and stop), memoryprogramming and debugging functionality (for example, breakpoints).
The MSPDebugStack supports Windows, Linux, and OS X operating systems.
The debug probe firmware for all field updatable tools is included in the MSPDebugStack. It automaticallydetects if an update of the debug probe is required.
For more details and information see www.ti.com/mspds.

www.ti.com Debug Probes Hardware and Software
13SLAU647C–July 2015–Revised February 2016Submit Documentation Feedback
Copyright © 2015–2016, Texas Instruments Incorporated
MSP Debuggers
5.2 Ultra-Low-Power Debug SupportUltra-low power (ULP) debug support enables users to debug in the low-power modes that are used intheir application software.
If this option is enabled during an active debug session in IAR EW430 or Code Composer studio, thetarget MSP430 device enters the low-power modes. Wake-up times can be measured on F5xx, F6xx,FR5xx, and FR6xx devices. For some MSP430 devices, special debug features are disabled in this mode;for example, setting breakpoints (hardware and software) while device is running in ULP mode.
NOTE: When debugging with EnergyTrace++ active, this mode must be used.
NOTE: Measured currents might be slightly higher than in stand-alone mode (EnergyTrace) due tothe active debugger connection.
For more details and information refer to the MSP430 Ultra-Low-Power LPMx.5 Modesection of the IDE user's guides for IAR EW430 (SLAU138) and CCS (SLAU157).
5.3 EnergyTrace™ TechnologyEnergyTrace Technology is an energy-based code analysis tool that measures and displays theapplication's energy profile, which helps to optimize it for ultra-low power consumption.
MSP devices with built-in EnergyTrace+[CPU State]+[Peripheral States] (or in short EnergyTrace++)technology allow real-time monitoring of many internal device states while user program code executes.EnergyTrace++ technology is supported on selected MSP devices and debuggers (see Table 1).
EnergyTrace mode (without the "++") is a fundamental part of EnergyTrace Technology and enablesanalog energy measurement to determine the energy consumption of an application but does not correlateit to internal device information. The EnergyTrace mode is available for all MSP devices with selecteddebuggers, including CCS (see Table 1).
For more details about the EnergyTrace Technology, refer to http://www.ti.com/tool/energytrace.
5.4 Unlimited Software Breakpoints in Flash, FRAM, and RAMAll MSP430 debug tools support the use of Software breakpoints in Flash, FRAM, and RAM. Softwarebreakpoints enable the user to set an unlimited number of breakpoints during an active debug session.
Without Software Breakpoints enabled, the number of breakpoints which can be set is limited to thenumber of hardware breakpoints available by the specific MSP device.. All MSP debug tools prefer theuse of hardware breakpoints as much as possible. However, if the MSP breakpoint logic runs out ofhardware breakpoints, software breakpoints are used automatically (if enabled in the IDE).
NOTE: When the debug session is closed, all software breakpoints are erased and the originalmemory content is restored.
For more details about the software breakpoints and their IDE-specific use, refer to the"Breakpoint Types" section in the IDE user's guides for IAR EW430 (SLAU138) and CCS(SLAU157).
For a practical example of different breakpoint types, refer to the application report AdvancedDebugging Using the Enhanced Emulation Module (EEM) With Code Composer StudioVersion 6 (SLAA393).

Debug Probes Hardware and Software www.ti.com
14 SLAU647C–July 2015–Revised February 2016Submit Documentation Feedback
Copyright © 2015–2016, Texas Instruments Incorporated
MSP Debuggers
5.5 JTAG Access Protection (Fuse Blow)Different MSP430 devices implement different methods to prevent JTAG debug access to the MSP430target device.
JTAG fuse:• Available on 1xx, 2xx, and 4xx families (except FRxx and I20xx devices).• Applying a high voltage to test the TEST pin of the MSP430 target device blows an actual physical
polyfuse and disables the JTAG interface.
JTAG lock without password (eFuse/"soft" fuse):• Available on 5xx, 6xx, and FRxx families.• A certain lock pattern is written into the MSP430 target memory to disable the JTAG interface.
JTAG lock with password:• Available only FRxx families.• A user-defined password can disable JTAG access to the MSP430 target device.• Using CCS, EW430, or the MSP Flasher, applying the configured password to the MSP430 target
restores JTAG access
Memory protection by custom startup code (SUC):• Available on only the i20xx family (for example, the MSP430i2040 device).• Custom startup code can enable or disable JTAG access to the MSP430i20xx target device.
NOTE: Only the MSP-FET and the MSP-FET430UIF support JTAG access protection to disableJTAG access.
For more details how the JTAG access protection mechanism is implemented refer to the"JTAG Access Protection" section in MSP430 Programming Via the JTAG Interface(SLAU320).
5.6 MSP-FET Stand-Alone Debug ProbeThe MSP-FET is a powerful debug probe for application development supporting all MSP430microcontrollers.
The MSP-FET provides a USB interface to program and debug the MSP430 devices in-system throughthe JTAG interface or the pin-saving Spy-Bi-Wire (2-wire JTAG) protocol. Furthermore, the USB interfacecan be used for Backchannel UART and MSP target BSL communication. UART BSL and I2C BSLcommunication modes are supported.
The MSP-FET development tool supports development with all MSP430 devices and is designed for usewith PCBs that contain MSP430 devices; for example, the MSP430 target socket boards.
Figure 10. MSP-FET Top View Figure 11. MSP-FET Bottom View

www.ti.com Debug Probes Hardware and Software
15SLAU647C–July 2015–Revised February 2016Submit Documentation Feedback
Copyright © 2015–2016, Texas Instruments Incorporated
MSP Debuggers
(4) Enable new device support by in field firmware updates
5.6.1 General FeaturesThe following features are provided by the MSP-FET debug probe.
Features:• MSP-FET is supported since:
– CCS v6.0.0– IAR EW430 v5.60.7 and v6.10.1
• Operating systems: OS X, Linux, Windows• Software configurable supply voltage between 1.8 V and 3.6 V at 100 mA• External voltage detection• Supports JTAG security fuse blow to disable debugging• Supports all MSP430 boards with JTAG header• Supports both JTAG and Spy-Bi-Wire (2-wire JTAG) debug protocols• EnergyTrace and EnergyTrace++ support• Software breakpoints in Flash, FRAM, and RAM• MSPDS application backchannel UART included• Target BSL communication mode available• Flash and FRAM programming support• Debug probe firmware field update is supported (4)
5.6.2 Backchannel UARTThe MSP-FET supports the Backchannel UART functionality only when using an MSPDebugStackv3.4.1.0 or higher for the MSP-FET connection.
The baud rates that are supported depend on the target configuration and the debug settings. Table 2shows which baud rates are supported with certain configuration combinations.
✓ means that the corresponding baud rate is supported without any data loss with the specifiedcombination of settings.
✗ means that the corresponding baud rate is not supported (data loss is expected) with the specifiedcombination of settings.
Table 2. MSP-FET Backchannel UART Implementation
Target MCLKFrequency: 1 MHz 8 MHz 1 MHz 8 MHz
Debugger: Active InactiveFlow Control: No Yes No Yes No Yes No Yes
4800 baud ✓ ✓ ✓ ✓ ✓ ✓ ✓ ✓9600 baud ✓ ✓ ✓ ✓ ✓ ✓ ✓ ✓
19200 baud ✓ ✓ ✓ ✓ ✓ ✓ ✓ ✓28800 baud ✗ ✓ ✓ ✓ ✓ ✓ ✓ ✓38400 baud ✗ ✓ ✗ ✓ ✗ ✓ ✗ ✓57600 baud ✗ ✓ ✗ ✓ ✗ ✓ ✗ ✓115200 baud ✗ ✗ ✗ ✓ ✗ ✗ ✗ ✓
5.6.2.1 UART Backchannel Activation CommandsThe MSP-FET supports two different Backchannel UART modes, one with flow control and one without.The different modes can be selected by opening the corresponding COM port with a dedicated baud rate.See Table 3 for the specific baud rates for each command.

Debug Probes Hardware and Software www.ti.com
16 SLAU647C–July 2015–Revised February 2016Submit Documentation Feedback
Copyright © 2015–2016, Texas Instruments Incorporated
MSP Debuggers
NOTE: The baud rates used by these activation commands cannot be used for communication.
NOTE: The Backchannel UART is disabled until the COM port is opened with a valid baud rate.
If none of the specified commands are transferred before setting the communication baud rate,communication starts with the default settings: 3.3 V target VCC, no flow control mechanism.
Table 3. MSP-FET Backchannel UART Activation Commands
Baud Rate Command9620 Set all backchannel UART pins to high impedance – no current flow into target device9621 Configure backchannel UART communication without handshake (default start behavior)9622 Configure backchannel UART communication with handshake
9623 Voltage configuration command. When this command is received, target VCC is set to 3.3 V. After target VCCis configured, it is switched through to the target device.
5.6.3 Target BSL Connection and BSL-Scripter SupportThe MSP-FET can be used for communication with the target device bootloader (BSL) through the I2C andUART protocols. The activation of the different protocols is equivalent to the MSP-FET backchannelUART. See Table 4 for command details.
The BSL-Scripter software in the zip file that is included with MSP430™ Programming With the Bootloader(BSL) (SLAU319) implements support for these activation commands and performs the correct sequenceaccording to the communication interface (UART, I2C) that is specified in the script.
In MSP-FET BSL communication mode, flow control is not available, because this is not supported by theMSP target device BSL.
UART BSL: The MSP-FET BSL UART mode supports the following baud rates: 9600, 14400, 19200,28800, 38400, 56000, 57600, and 115200. For the BSL UART, 8 + 1 + even parity is used.
I2C BSL: The MSP-FET is always the I2C master, and the target device BSL is always the I2C slave. 7-bitI2C addressing mode is used with a fixed I2C slave address of 0x48.
NOTE: If the MSP-FET is configured to support BSL communication, debugger functionality isdisabled. To switch to debugger mode, either perform a power cycle (unplug the USB cable)or configure the baud rate to 8001. The BSL mode is disabled until sending a BSL entrybaud rate command.
Maximum I2C clock rate; 55 kHz
Table 4. MSP-FET MSP Target BSL Activation Commands
Baud Rate Command9620 Set all UART or I2C pins to high impedance – no current flow into target device9601 BSL entry sequence and power up 3.3 V (UART BSL) – debugger is disabled
100000 or 100001 BSL entry sequence and power up 3.3 V (I2C BSL) – debugger is disabled400000 or 400001 BSL entry sequence and power up 3.3 V (I2C BSL) – debugger is disabled
9623 Power up 3.3 V8001 Activate debugger
NOTE: The MSP-FET I2C interface is a software I2C implementation, which always runs with aspeed of approximately 55 kHz. The four different speed configurations are supported forcompatibility purposes with BSL-Scripter and the BSL-Rocket.

www.ti.com Debug Probes Hardware and Software
17SLAU647C–July 2015–Revised February 2016Submit Documentation Feedback
Copyright © 2015–2016, Texas Instruments Incorporated
MSP Debuggers
5.6.4 LED SignalsThe MSP-FET shows its operating states using two LEDs, one green and one red. Table 5 lists allavailable operation modes. An or icon indicates that the LED is off, an or icon indicates thatthe LED is on, and an or icon indicates that the LED flashes.
Table 5. MSP-FET LED Signals
PowerLED Mode LED Function
MSP-FET not connected to PC or MSP-FET not ready; for example, after a major firmware update.Connect or reconnect MSP-FET to PC.
MSP-FET connected and ready
MSP-FET waiting for data transfer
Ongoing data transfer – during active debug session
An error has occurred; for example, target VCC over current. Unplug MSP-FET from target, and cycle thepower off and on. Check target connection, and reconnect MSP-FET.
Firmware update in progress. Do not disconnect MSP-FET while both LEDs are blinking slowly.
FPGA update in progress. Do not disconnect MSP-FET while both LEDs are blinking rapidly.
5.6.5 HardwareThis section includes MSP-FET hardware descriptions like the JTAG connector, schematics, and power-up states of the MSP-FET JTAG pins.
5.6.5.1 JTAG Target ConnectorFigure 12 shows the pinout of the MSP-FET JTAG connector.
Figure 12. MSP-FET 14-Pin JTAG Connector

Debug Probes Hardware and Software www.ti.com
18 SLAU647C–July 2015–Revised February 2016Submit Documentation Feedback
Copyright © 2015–2016, Texas Instruments Incorporated
MSP Debuggers
5.6.5.2 MSP-FET Pin States After Power UpTable 6 describes the electrical state of every JTAG pin after debug probe power up.
Table 6. MSP-FET Pin States
Pin Name After Power up When JTAG Protocol isActive
When Spy-Bi-WireProtocol is Active
1 TDO/TDI Hi-Z, pulled up to 3.3 V In, TDO In and Out, SBWTDIO(RST pin)
2 VCC_TOOL 3.3 V Target VCC Target VCC
3 TDI/VPP Hi-Z, pulled up to 3.3 V Out, TDI Hi-Z, pulled up to VCC
4 VCC_TARGET In, external VCC sense In, external VCC sense In, external VCC sense5 TMS Hi-Z, pulled up to 3.3 V Out, TMS Hi-Z, pulled up to VCC
6 N/C N/C N/C N/C7 TCK Hi-Z, pulled up to 3.3 V Out, TCK Out, SBWTCK8 TEST/VPP Out, Ground Out, TEST Hi-Z, pulled up to VCC
9 GND Ground Ground Ground
10 UART_CTS/SPI_CLK/I2C_SCL Hi-Z, pulled up to 3.3 V Out, Target UART Clear-To-Send Handshake input
Out, Target UART Clear-To-Send Handshake input
11 RST Out, VCC Out, RST Ground
12 UART_TXD/SPI_SOMI/I2C_SDA Hi-Z, pulled up to 3.3 V In, Target UART TXDoutput
In, Target UART TXDoutput
13 UART_RTS Hi-Z, pulled up to 3.3 VIn, Target UART Ready-
to-Send Handshakeoutput
In, Target UART Ready-toSend Handshake output
14 UART_RXD/SPI_SIMO Hi-Z, pulled up to 3.3 V Out, Target UART RXDinput
Out, Target UART RXDinput
NOTE: To enable the UART, I2C or SPI pins, the correct invalid baud rate activation command mustbe sent (see MSP-FET Backchannel UART Activation Commands and MSP-FET MSPTarget BSL Activation Commands). After this the pins switch into the state described in theTable 6.
NOTE: MSP430BSL-SPI support is currently not available using the MSP-FET. The pin names usedin Table 6 are the same as the names that are printed on the back of the MSP-FET.

MS
P-F
ET
Rev 1
.2
1
3/1
2/2
014
3/1
2/2
014
C
4
AB
CD
Date
E
Sheet
of
F
4 2
1
Title
3 1
AB
CD
E
Siz
eN
um
ber
F
23
Rev
1
A
5
Genera
lpow
er s
upply
Additio
nalsupply
LED
USB in
terfa
ce
Host M
CU
DVCC1
DVCC3
DVCC2
AVCC1
Debug i/f
USB B
SL a
ctiv
atio
n
VBU
S b
ypass
1P6.4
/CB4/A
4
2P6.5
/CB5/A
5
3P6.6
/CB6/A
6/D
AC0
4P6.7
/CB7/A
7/D
AC1
5P7.4
/CB8/A
12
6P7.5
/CB9/A
13
7P7.6
/CB10/A
14/D
AC0
8P7.7
/CB11/A
15/D
AC1
9P5.0
/VREF+
/VEREF+
10
P5.1
/VREF-/V
EREF-
11
AVCC1
12
AVSS1
13
XIN
14
XO
UT
15
AVSS2
16
P5.6
/AD
C12CLK/D
MAE0
17
P2.0
/P2M
AP0
18
P2.1
/P2M
AP1
19
P2.2
/P2M
AP2
20
P2.3
/P2M
AP3
21
P2.4
/P2M
AP4
22
P2.5
/P2M
AP5
23
P2.6
/P2M
AP6/R
03
24
P2.7
/P2M
AP7/L
CD
REF/
25
DVCC1
26DVSS1
27VCORE(2)
28P5.2/R23
29LCDCAP/R33
30COM0
31P5.3/COM1/S42
32P5.4/COM2/S41
33P5.5/COM3/S40
34P1.0/TA0CLK/ACLK/S3
35P1.1/TA0.0/S38
36P1.2/TA0.1/S37
37P1.3/TA0.2/S36
38P1.4/TA0.3/S35
39P1.5/TA0.4/S34
40P1.6/TA0.1/S33
41P1.7/TA0.2/S32
42P3.0/TA1CLK/CBOUT/S
43P3.1/TA1.0/S30
44P3.2/TA1.1/S29
45P3.3/TA1.2/S28
46P3.4/TA2CLK/SMCLK/S
47P3.5/TA2.0/S26
48P3.6/TA2.1/S25
49P3.7/TA2.2/S24
50P4.0/TB0.0/S23
51
P4.1
/TB0.1
/S22
52
P4.2
/TB0.2
/S21
53
P4.3
/TB0.3
/S20
54
P4.4
/TB0.4
/S19
55
P4.5
/TB0.5
/S18
56
P4.6
/TB0.6
/S17
57
P4.7
/TB0O
UTH
/SVM
OU
T
58
P8.0
/TB0CLK/S
15
59
P8.1
/UCB1STE
60
P8.2
/UCA1TXD
61
P8.3
/UCA1RXD
62
P8.4
/UCB1CLK/U
CA1ST 6
3D
VSS2
64
DVCC2
65
P8.5
/UCB1SIM
O
66
P8.6
/UCB1SO
MI
67
P8.7
/S8
68
P9.0
/S7
69
P9.1
/S6
70
P9.2
/S5
71
P9.3
/S4
72
P9.4
/S3
73
P9.5
/S2
74
P9.6
/S1
75
P9.7
/S0
76VSSU
77PU.0/DP
78PUR
79PU.1/DM
80VBUS
81VUSB
82V18
83AVSS3
84P7.2/XT2IN
85P7.3/XT2OUT
86VBAK
87VBAT
88P5.7/RTCCLK
89DVCC3
90DVSS3
91TEST/SBWTCK
92PJ.0/TDO
93PJ.1/TDI/TCLK
94PJ.2/TMS
95PJ.3/TCK
96RST/NMI/SBWTDIO
97P6.0/CB0/A0
98P6.1/CB1/A1
99P6.2/CB2/A2
100P6.3/CB3/A3
U1
MSP430F6638IP
ZR
C6
100n
+C5
10uF/6
.3V
C7
100n
C9
100n
C11
100n
R1
0R
C15
68p
C16
470n
C17
220n
C18
4.7
nD
1D
2
R47 470R
R50
0R
1 IO1
2 IO2
3 GND 4IO3
5IO4
6VCC
U5
TPD4E004DRYR
R2
1k4
C14
4.7
u, d
np
C23
100n
R60
33k
C31
10p
C33
10p
R61
1M
R62
100R
J5
C8
220n
13
2
P1
R17
0R
AC
D7
B0530W
-7-F
R76
27k
C70
4.7
u, d
np
C71
100n
R85
0R, dnp
C55
1n
R3
27R
R45
27R
R46 470R
+C12
10uF/6
.3V
12345
67
1110
J1
R28
4k7
R30
4k7
1
1
11
111
11
1
11
1
11
1
11
11
1
1
VCC_D
T_REF
VCC_D
CD
C_REF
VCC_D
T2TRG
T_CTRL
VCC_SU
PPLY
2TRG
T_CTRL
LED1
TDIOFF_CTRL
PW
M_SETVF
FPG
A_TCK
FPG
A_TD
I
FPG
A_TM
S
FPG
A_TD
O
FPG
A_TRST
VF2TEST_CTRL
VF2TDI_CTRL
AVCC_PO
D
VCC_PO
D33
VCC_PO
D33
VCC_POD33
VREF+
VCORE
VBAK
MCU
_D
MAE0
DCD
C_PU
LSE
MCU
_P2.2
MCU
_P2.3
MCU
_P2.4
MCU
_P2.5
MCU
_P2.6
MCU
_P2.7
MCU_P1.0
MCU_P1.1
MCU_P1.2
MCU_P1.3
MCU_P1.4
MCU_P1.5
MCU_P1.6
MCU_P1.7
MCU_P3.0
MCU_P3.1
MCU_P3.2
MCU_P3.3
MCU_P3.4
MCU_P3.5
MCU_P3.6
MCU_P3.7
MCU_P4.0
MCU
_P4.1
MCU
_P4.2
MCU
_P4.3
MCU
_P4.4
MCU
_P4.5
MCU
_P4.6
MCU
_P4.7
MCU
_P8.1
MCU
_P8.2
MCU
_P8.3
PUR
PU.1/DM
PU.0/DP
VBUS
VUSB
AVCC_PO
D
VCC_PO
D33
VCC_PO
D33
VCC_PO
D33
AVCC_PO
DVCC_PO
D33
VREF+
VCORE
V18
V18
VBAK
HOST_TEST
HOST_RST
FPG
A_RESET
LED0
LED1
PU
R
VU
SB
PU
.1/D
M
PU
.0/D
P
DCD
C_RST
HO
ST_SCL
HO
ST_SD
A
DCD
C_IO
0
LED
0
A_VBUS5
VBU
S
A_VCC_SUPPLY_HOST
DCD
C_TEST
A_VF
MCU
_P9.5
DCDC_IO1
HOST_TCK
HOST_TMS
HOST_TDI
HOST_TDO
VCC_POD33
HO
ST_RST
VCC_PO
D33
GN
D1
VBU
S5
MCU
_P2.1
GN
D1
GN
D1
VCC_D
T2SU
PPLY
_CTRL
A_VCC_D
T
A_VCC_D
T_BSR
A_VCC_SENSE0_TRGT
VCC_POD33
VCC_D
T_SEN
SE
www.ti.com Debug Probes Hardware and Software
19SLAU647C–July 2015–Revised February 2016Submit Documentation Feedback
Copyright © 2015–2016, Texas Instruments Incorporated
MSP Debuggers
5.6.5.3 Schematics
Figure 13. MSP-FET USB Debugger, Schematic (1 of 5)

MS
P-F
ET
Re
v 1
.2
3/1
2/2
014
5
1A
2
Rev
3 2
F
Num
ber
Siz
e
ED
CB
A
13
Title
1
24
F
of
Sheet
E
Date
DC
BA
4
C
3/1
2/2
014
VCC_PU
MP
VCC_JT
AG
FPG
A
1G
ND
2G
AA2/IO
51RSB1
3IO
52RSB1
4G
AB2/IO
53RSB1
5IO
95RSB1
6G
AC2/IO
94RSB1
7IO
93RSB1
8IO
92RSB1
9G
ND
10
GFB1/IO
87RSB1
11
GFB0/IO
86RSB1
12
VCO
MPLF
13
GFA0/IO
85RSB1
14
VCCPLF
15
GFA1/IO
84RSB1
16
GFA2/IO
83RSB1
17
VCC
18
VCCIB
1
19
GEC1/IO
77RSB1
20
GEB1/IO
75RSB1
21
GEB0/IO
74RSB1
22
GEA1/IO
73RSB1
23
GEA0/IO
72RSB1
24
VM
V1
25
GN
DQ
26GEA2/IO71RSB1
27FF/GEB2/IO70RSB1
28GEC2/IO69RSB1
29IO68RSB1
30IO67RSB1
31IO66RSB1
32IO65RSB1
33IO64RSB1
34IO63RSB1
35IO62RSB1
36IO61RSB1
37VCC
38GND
39VCCIB1
40IO60RSB1
41IO59RSB1
42IO58RSB1
43IO57RSB1
44GDC2/IO56RSB1
45GDB2/IO55RSB1
46GDA2/IO54RSB1
47TCK
48TDI
49TMS
50VMV1
51
GN
D
52
VPU
MP
53
NC
54
TD
O
55
TRST
56
VJT
AG
57
GD
A1/IO
49RSB0
58
GD
C0/IO
46RSB0
59
GD
C1/IO
45RSB0
60
GCC2/IO
43RSB0
61
GCB2/IO
42RSB0
62
GCA0/IO
40RSB0
63
GCA1/IO
39RSB0
64
GCC0/IO
36RSB0
65
GCC1/IO
35RSB0
66
VCCIB
0
67
GN
D
68
VCC
69
IO31RSB0
70
GBC2/IO
29RSB0
71
GBB2/IO
27RSB0
72
IO26RSB0
73
GBA2/IO
25RSB0
74
VM
V0
75
GN
DQ
76GBA1/IO24RSB0
77GBA0/IO23RSB0
78GBB1/IO22RSB0
79GBB0/IO21RSB0
80GBC1/IO20RSB0
81GBC0/IO19RSB0
82IO18RSB0
83IO17RSB0
84IO15RSB0
85IO13RSB0
86IO11RSB0
87VCCIB0
88GND
89VCC
90IO10RSB0
91IO09RSB0
92IO08RSB0
93GAC1/IO07RSB0
94GAC0/IO06RSB0
95GAB1/IO05RSB0
96GAB0/IO04RSB0
97GAA1/IO03RSB0
98GAA0/IO02RSB0
99IO01RSB0
100IO00RSB0
U2
A3PN
125-V
QG
100
R4
1k
R5
1k
12
L3
33n
+C19
10uF/6
.3V
C20
100n
C21
10n
C22
100n
C34
10n
C35
100n
C36
10n
C37
100n
C38
10n
C39
100n
C40
10n
C41
100n
C42
10n
C43
100n
C44
10n
C45
100n
C46
10n
C47
100n
C48
10n
C49
100n
C50
10n
C51
100n
C52
10n
R44
27R
1
111
1
1 1 1
1
1
1
1
1111
1
VCC_PLF
VCC_PO
D15
VCC_POD15
VCC_PO
D15
VCC_POD15
VCC_PO
D33
VCC_PO
D33
VCC_POD33
VCC_POD33
VCC_PO
D33
VCC_PO
D33
VCC_PO
D33
VCC_PO
D33
VCC_POD33
FPGA_TCK
FPGA_TDI
FPGA_TMS
FPG
A_TRST
MCU_DMAE0
MCU_P2.2
MCU_P2.3
MCU_P2.4
MCU_P2.5
MCU_P2.6
MCU_P1.0
MCU_P1.1
MCU_P1.2
MCU_P1.3
MCU_P1.4
MCU_P1.5
MCU_P1.6
MCU_P1.7
MCU_P3.0
MCU_P3.1
MCU_P3.2
MCU_P3.3
MCU_P3.4
MCU
_P3.5
MCU
_P3.6
MCU
_P3.7
MCU
_P4.0
MCU
_P4.1
MCU
_P4.2
MCU
_P4.3
MCU
_P4.4
MCU
_P4.5
MCU
_P4.6
MCU
_P4.7
MCU
_P8.1
MCU
_P8.2
MCU
_P8.3
FPG
A_IO
_TCK
FPG
A_D
IR_CTRL_TCK
FPG
A_IO
_TM
S
FPG
A_D
IR_CTRL_TM
S
FPG
A_IO
_TD
I
FPG
A_D
IR_CTRL_TD
I
FPG
A_IO
_TD
O
FPG
A_D
IR_CTRL_TD
O
MCU
_P2.7
FPG
A_D
IR_CTRL_RST
FPG
A_IO
_TEST
FPG
A_D
IR_CTRL_TEST
FPG
A_IO
_U
ART_TXD
FPG
A_D
IR_CTRL_U
ART_TXD
FPG
A_IO
_U
ART_RXD
FPG
A_D
IR_CTRL_U
ART_RXD
FPG
A_IO
_U
ART_CTS
FPGA_DIR_CTRL_UART_CTS
FPGA_IO_UART_RTS
FPGA_DIR_CTRL_UART_RTS
FPG
A_TD
O
FPGA_RESET
VCC_PO
D15
VCC_PO
D15
VCC_PO
D33
VCC_PLF
VCC_PO
D33
VCC_PO
D33
FPGA_IO_RST
FPGA_TP0
FPGA_TP1
FPGA_TP2
MCU_P9.5
MCU_P2.1
Debug Probes Hardware and Software www.ti.com
20 SLAU647C–July 2015–Revised February 2016Submit Documentation Feedback
Copyright © 2015–2016, Texas Instruments Incorporated
MSP Debuggers
Figure 14. MSP-FET USB Debugger, Schematic (2 of 5)

3/1
2/2
014
3/1
2/2
014
C
4
AB
CD
Date
E
Sheet
of
F
4 2
1
3 1
AB
CD
E
Siz
eN
um
ber
F
23
Rev
3
A1
5
S/W
contro
lled D
CD
C c
onverte
r
DCD
C M
CU
refe
rence v
olta
ge
DT le
velshifte
r supply
DCD
C c
alib
ratio
n s
witc
h
DCD
C M
CU
DCD
C M
CU
debug i/f
DT c
urre
nt m
easure
ment s
hunt
DT c
urre
nt s
ense
MSP-F
ET R
ev 1
.2
Energ
y m
easure
ment m
eth
od p
rote
cte
d u
nder U
.S. P
ate
nt A
pplic
atio
n 1
3/3
29,0
73
and s
ubsequent p
ate
nt a
pplic
atio
ns
1D
VCC
2P1.0
/TA0CLK
3P1.1
/TA0.0
4P1.2
/TA0.1
5P1.3
/AD
C10CLK
6P1.4
/TA0.2
7P1.5
/TA0.0
8P1.6
/TA0.1
9P1.7
/SD
I
10
NM
I-RST
11
TEST/S
BW
TCK
12
XO
UT/P
2.7
13
XIN
/P2.6
14
DVSS
U4
MS
P430G
2452P
W
MSP430G
2452PW
12
L4
R53
R55
R56
R64
1
2
3
D4
R65
220k
C28
33p
R63
C53
100n
1N
O1
2CO
M1
3N
O2
4CO
M2
5IN
2
6IN
3
7G
ND
8N
O3
9CO
M3
10
CO
M4
11
NO
4
12
IN4
13
IN1
14
V+
U20
TS
3A
47
51
PW
R
TS3A4751PW
R
C13
1n, d
np
C56
4.7
u
+C57
2.2
u
C63
100n
R19
1 A1
2 A2
3C1,C2
D8
C66
1n
R200R
R23180k
R25
150k
R15
220k
1G
2S3
D
Q3
R26
27k, d
np
1IN
2G
ND
3EN
4N
R
5O
UT
U7
TPS73401D
DCT
C54 1n
C26
2.2
u
R24160k
C24 1n
C62
10n
C29
4.7
u
C10
1u
2 E
1B
3C
Q4
R6
220k
C1
33p
R7
220k
C65 100n
5IN
-
4IN
+
6OU
T
1
REF
2
GND
3
V+
U10
INA21XD
CK
INA214AID
CKT
C67 10p
C68 1n
R49
10R
R54
10R
R57
0.2
C69
2.2
u
C72
2.2
u
C73
2.2
u
11
DCD
C_CAL0
DCD
C_CAL2
DCD
C_TEST
DCD
C_RST
HO
ST_SD
A
DCD
C_CAL1
VCC_PO
D33
DCD
C_PU
LSE
DCD
C_IO
0
VCC_D
CD
C_REF
A_VCC_SU
PPLY
VBU
S5
VCC_SU
PPLY
A_VCC_SU
PPLY
DCD
C_CAL0
VCC_SUPPLY
VCC_DT
DCD
C_CAL1
DCD
C_CAL2
DCD
C_RST
VCC_PO
D33
GN
D1
GND1
GN
D1
GN
D1
GN
D1
VBU
S
GN
D1
GN
D1
GN
D1
DCD
CG
ND
GN
D1
DCD
CG
ND
DCD
CG
ND
DCD
CG
ND
DCD
CG
ND
DCD
CG
ND
GN
D1
VCC_SU
PPLY
GN
D1
GN
D1
VCC_D
T_REF
GN
D1
DCD
C_IO
1
VCC_D
T
HO
ST_SCL
VCC_D
T_BSR
VCC_SU
PPLY
A_VCC_SU
PPLY
_H
OST
VCC_SU
PPLY
VCC_PO
D33
VCC_D
T_SEN
SE
VCC_D
T
VCC_D
T_BSR
GN
D1
GN
D1
GN
D1
www.ti.com Debug Probes Hardware and Software
21SLAU647C–July 2015–Revised February 2016Submit Documentation Feedback
Copyright © 2015–2016, Texas Instruments Incorporated
MSP Debuggers
Figure 15. MSP-FET USB Debugger, Schematic (3 of 5)
3/1
2/2
014
5
1A
4
Rev
3 2
F
Num
ber
Siz
e
ED
CB
A
13
1
24
F
of
Sheet
E
Date
DC
BA
4
C
3/1
2/2
014
VF =
+5V ... 6
.5V
Fuse b
low
ste
p-u
p c
onverte
r
Fuse v
olta
ge m
ultip
lexer / V
CC_D
T to
levelshifte
rs
ESD
pro
tectio
n
Targ
et M
CU
connecto
r
DT le
velshifte
rs
MSP-F
ET R
ev 1
.2
S1
D1
IN2
GN
DS2
D2
IN1
VD
D
U6
AD
G821BRM
Z-R
EEL7
D5
dnp
MM
SZ5232B-7
-F
R13
100RR14
2k2
S1
D1
IN2
GN
DS2
D2
IN1
VD
D
U9
AD
G821BRM
Z-R
EEL7
L2
33u
C30
330n
E
B
C
Q1
BC817-1
6LT
1
12345678910
11
12
13
14
J6
R35
100R
1IO
1
2IO
2
3IO
3
4IO
45
IO5
6IO
6
7IO
7
8IO
8
9 GND
U3
TPD
8E003D
QD
TPD
8E003D
QD
R
1IO
1
2IO
2
3IO
3
4IO
45
IO5
6IO
6
7IO
7
8IO
8
9 GND
U21
TPD
8E003D
QD
TPD
8E003D
QD
R
R22
47k
R29
47k
R421k
D3dnp
DD
Z9692-7
1VCCA
2G
ND
3A
4B
5D
IR
6VCCB
U12
SN
74LVC1T45D
CKR
1VCCA
2G
ND
3A
4B
5D
IR
6VCCB
U13
SN
74LVC1T45D
CKR
1VCCA
2G
ND
3A
4B
5D
IR
6VCCB
U14
SN
74LVC1T45D
CKR
1VCCA
2G
ND
3A
4B
5D
IR
6VCCB
U15
SN
74LVC1T45D
CKR
1VCCA
2G
ND
3A
4B
5D
IR
6VCCB
U16
SN
74LVC1T45D
CKR
1VCCA
2G
ND
3A
4B
5D
IR
6VCCB
U17
SN
74LVC1T45D
CKR
1VCCA
2G
ND
3A
4B
5D
IR
6VCCB
U22
SN
74LVC1T45D
CKR
1VCCA
2G
ND
3A
4B
5D
IR
6VCCB
U26
SN
74LVC1T45D
CKR
1VCCA
2G
ND
3A
4B
5D
IR
6VCCB
U27
SN
74LVC1T45D
CKR
1VCCA
2G
ND
3A
4B
5D
IR
6VCCB
U28
SN
74LVC1T45D
CKR
R27
47k
R31
47k
R84
47k, d
np
R86
47k
R87
47k
R88
47k
R89
47k
R90
47k
R91
47k
R92
47k
R93
47k
R94
47k
R95
47k
R96
47k
R97
47k
R98
47k
R99
47k
R100
47k
R101
47k
R102
47k
C77
100n
C78
100n
C79
100n
C80
100n
C82
100n
C83
100n
C84
100n
C85
100n
R32
100R
R33
100R
R34
100R
R37
100R
R38
100R
R39
100R
R40
100R
R41
100R
R43
100R
AC
D10
B0530W
-7-F
AC
D6
DN
PB0530W
-7-F
+C74
100u/1
0V
R48
47k
R58
47k
R59
47k
1
1
11
1
11
11111
11111
VF
VF2TD
I_CTRL
VF
VF2TEST_CTRL
TD
IOFF_CTRL
VF
TC_TD
I_FD
VF_TD
I
VBU
SVF
TC_TEST_FD
VF_TEST
TC_TEST_BSR
TC_TD
I_BSR
TC_TD
O_FD
VCC_SEN
SE0_TRG
T
TC_TM
S_FD
TC_TCK_FD
TC_U
ART_CTS_FD
TC_RST_FD
TC_U
ART_TXD
_FD
TC_U
ART_RTS_FD
TC_U
ART_RXD
_FD
VCC_SU
PPLY
_TRG
T
TC_TD
I_BSR
TC_TEST_BSR
VCC_SU
PPLY
_TRG
T
TC_TD
O_FD
TC_TCK_FD
TC_TEST_BSR
VCC_SEN
SE0_TRG
TTC_TM
S_FD
TC_TD
I_BSR
TC_U
ART_CTS_FD
TC_U
ART_RTS_FD
TC_U
ART_RXD
_FD
TC_RST_FD
TC_U
ART_TXD
_FD
VCC_JT
AG
LD
O_TRG
T
VCC_JT
AG
LD
O_TRG
T
VCC_DT2TRGT_CTRL
VCC_D
T_TRG
T
VCC_D
T
GN
D1
PW
M_SETVF
VCC_PO
D33
FPG
A_IO
_TCK
FPG
A_D
IR_CTRL_TCK
TC_TCK_FD
VCC_D
T_TRG
T
VCC_D
T_TRG
T
VCC_PO
D33
FPG
A_IO
_TM
S
FPG
A_D
IR_CTRL_TM
S
TC_TM
S_FD
VCC_D
T_TRG
T
VCC_D
T_TRG
T
VCC_PO
D33
FPG
A_IO
_TD
I
FPG
A_D
IR_CTRL_TD
I
TC_TD
I_FD
VCC_D
T_TRG
T
VCC_D
T_TRG
T
VCC_PO
D33
FPG
A_IO
_TD
O
FPG
A_D
IR_CTRL_TD
O
TC_TD
O_FD
VCC_D
T_TRG
T
VCC_D
T_TRG
T
VCC_PO
D33
FPG
A_IO
_RST
FPG
A_D
IR_CTRL_RST
TC_RST_FD
VCC_D
T_TRG
T
VCC_D
T_TRG
T
VCC_PO
D33
FPG
A_IO
_TEST
FPG
A_D
IR_CTRL_TEST
TC_TEST_FD
VCC_D
T_TRG
T
VCC_D
T_TRG
T
VCC_PO
D33
FPG
A_IO
_U
ART_TXD
FPG
A_D
IR_CTRL_U
ART_TXD
TC_U
ART_TXD
_FD
VCC_D
T_TRG
T
VCC_D
T_TRG
T
VCC_PO
D33
FPG
A_IO
_U
ART_RXD
FPG
A_D
IR_CTRL_U
ART_RXD
TC_U
ART_RXD
_FD
VCC_D
T_TRG
T
VCC_D
T_TRG
T
VCC_PO
D33
FPG
A_IO
_U
ART_CTS
FPG
A_D
IR_CTRL_U
ART_CTS
TC_U
ART_CTS_FD
VCC_D
T_TRG
T
VCC_D
T_TRG
T
VCC_PO
D33
FPG
A_IO
_U
ART_RTS
FPG
A_D
IR_CTRL_U
ART_RTS
TC_U
ART_RTS_FD
VCC_D
T_TRG
T
VCC_D
T_TRG
T
VCC_PO
D33
GN
D1
VCC_D
T_TRG
T
GN
D1
GN
D1
GN
D1
GN
D1
GN
D1
GN
D1
GN
D1
GN
D1
GN
D1
GN
D1
GN
D1
GN
D1
GN
D1
GN
D1
GN
D1
GN
D1
VCC_PO
D33
GND1
GN
D1
VF_TD
I
VF_TEST
Debug Probes Hardware and Software www.ti.com
22 SLAU647C–July 2015–Revised February 2016Submit Documentation Feedback
Copyright © 2015–2016, Texas Instruments Incorporated
MSP Debuggers
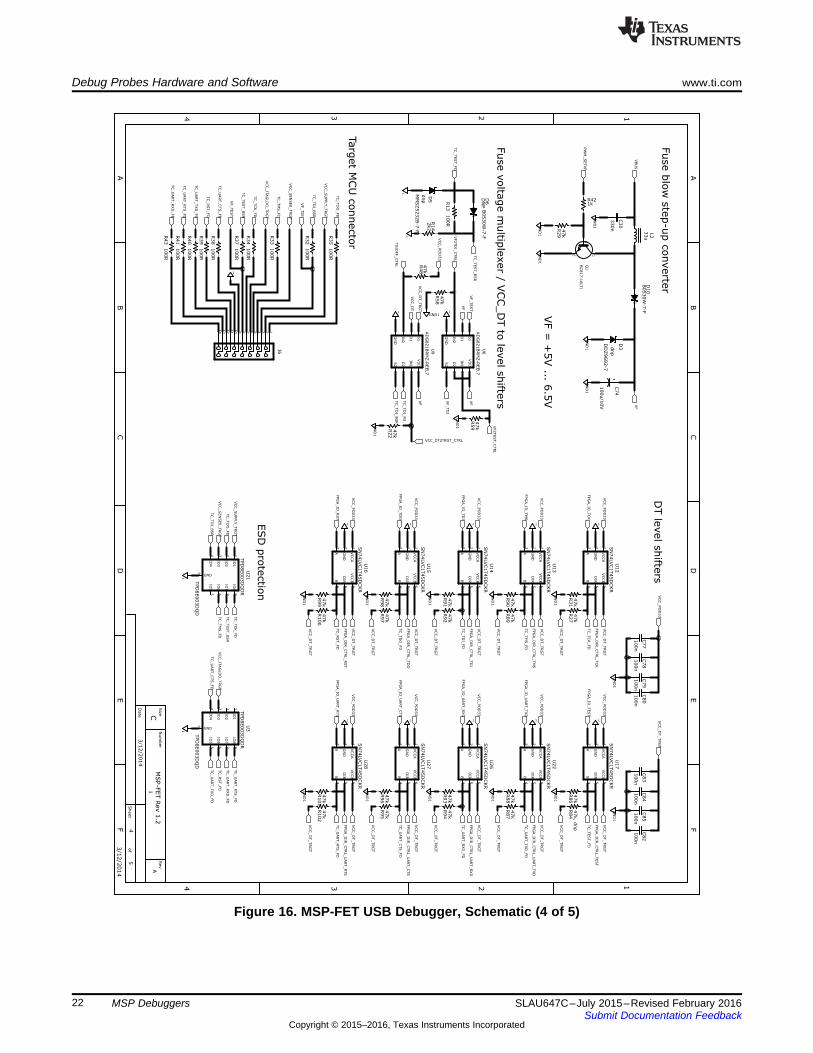
Figure 16. MSP-FET USB Debugger, Schematic (4 of 5)

3/1
2/2
014
3/1
2/2
014
C
4
AB
CD
Date
E
Sheet
of
F
4 2
1
3 1
AB
CD
E
Siz
eN
um
ber
F
23
Rev
5
A1
5
MSP-F
ET p
ow
er s
upply
Targ
et p
ow
er s
witc
h
Analo
g in
puts
to H
ost M
CU
Test p
oin
ts
Com
mon d
ebug a
nd te
st i/f
MSP-F
ET R
ev 1
.2
R80R
R11
150k
C3
33p
R51
240k
R52
150k
C27
33p
R12
270k
R36
150k
C4
33p
TP3
TP0
TP4
TP5
TP6
TP1
TP2
R10
150k
R21
47k
12345678
J4
HEAD
ER_1X8_50M
IL_A
12345678
J2
HEAD
ER_1X8_50M
IL_A
12345678
J3
HEAD
ER_1X8_50M
IL_A
C32
33p
R78
150k
R79
150k
TP7
TP8
TP9
TP11
R16
47k
1N
O1
2V+
3IN
1
4CO
M2
5N
O2
6G
ND
7IN
2
8CO
M1
U18
TS5A21366RSE
TS5A21366RSER
1EN
1
2IN
3EN
24
GN
D
5O
UT2
6O
UT1
U19
TLV7111533D
C25
10n
C58
1u
C59
1u
C61
1u
C2
33p
R9
150k
R18
150k
1
11
11
1
VCC_SEN
SE0_TRG
T
A_VCC_SEN
SE0_TRG
T
VBU
S5
A_VBU
S5
VF
A_VF
DCD
C_PU
LSE
VCC_SU
PPLY
FPG
A_TP0
FPG
A_TP1
FPG
A_TP2
VBU
S
GN
D1
VBU
SH
OST_TEST
HO
ST_TD
OH
OST_TD
IH
OST_TM
SH
OST_TCK
HO
ST_RST
DCD
C_RST
DCD
C_TEST
VCC_PO
D33
FPG
A_TRST
FPG
A_TCK
FPG
A_TM
SFPG
A_TD
IFPG
A_TD
O
GN
D1
GN
D1
A_VCC_SU
PPLY
_H
OST
VCC_PO
D15
VBU
S5
VCC_D
T
A_VCC_D
T
GN
D1
DCD
C_IO
1D
CD
C_IO
0
VCC_D
T
HO
ST_SCL
HO
ST_SD
A
VCC_SU
PPLY
_TRG
T
VCC_SU
PPLY
_TRG
T
VBU
S
VCC_SU
PPLY
2TRG
T_CTRL
VCC_SU
PPLY
VCC_D
T
VCC_D
T2SU
PPLY
_CTRL
GN
D1
GN
D1
GN
D1
VCC_PO
D15
VCC_PO
D33
VBU
S
PW
RG
ND
PW
RG
ND
PW
RG
ND
PW
RG
ND
PW
RG
ND
VCC_D
T_BSR
A_VCC_D
T_BSR
www.ti.com Debug Probes Hardware and Software
23SLAU647C–July 2015–Revised February 2016Submit Documentation Feedback
Copyright © 2015–2016, Texas Instruments Incorporated
MSP Debuggers
Figure 17. MSP-FET USB Debugger, Schematic (5 of 5)

Debug Probes Hardware and Software www.ti.com
24 SLAU647C–July 2015–Revised February 2016Submit Documentation Feedback
Copyright © 2015–2016, Texas Instruments Incorporated
MSP Debuggers
Figure 18. MSP-FET USB Debugger, PCB (Top) Figure 19. MSP-FET USB Debugger, PCB (Bottom)
www.ti.com Debug Probes Hardware and Software
25SLAU647C–July 2015–Revised February 2016Submit Documentation Feedback
Copyright © 2015–2016, Texas Instruments Incorporated
MSP Debuggers
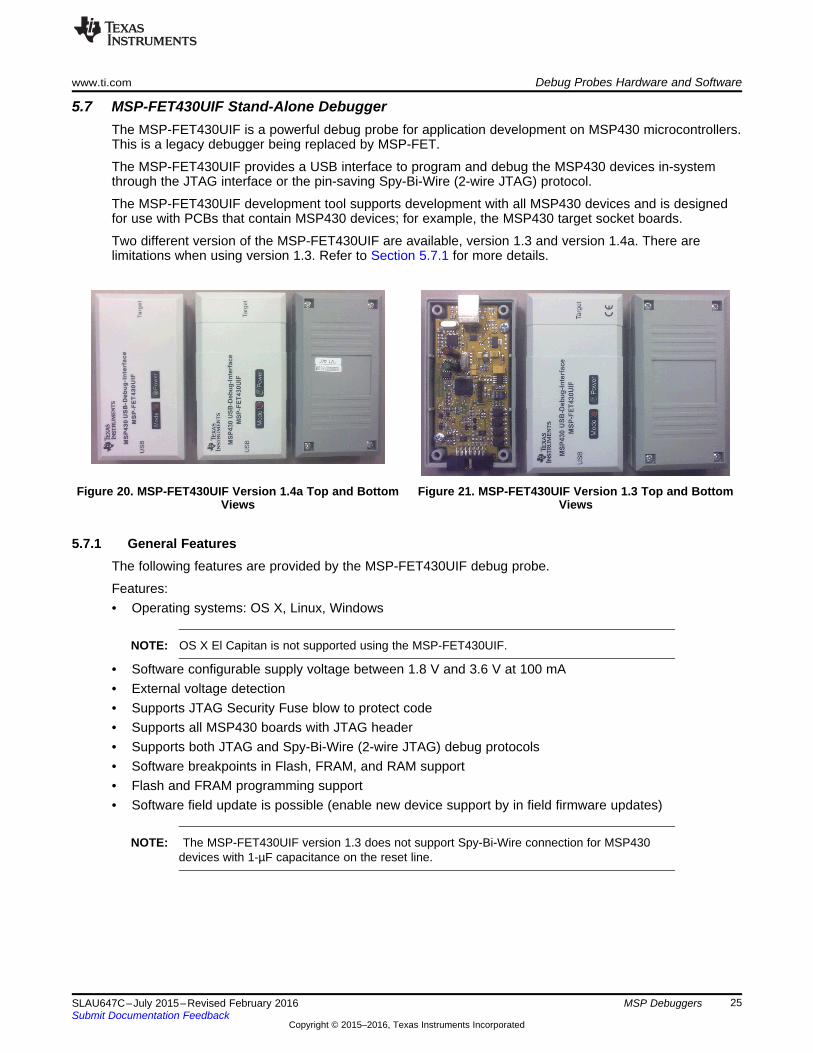
5.7 MSP-FET430UIF Stand-Alone DebuggerThe MSP-FET430UIF is a powerful debug probe for application development on MSP430 microcontrollers.This is a legacy debugger being replaced by MSP-FET.
The MSP-FET430UIF provides a USB interface to program and debug the MSP430 devices in-systemthrough the JTAG interface or the pin-saving Spy-Bi-Wire (2-wire JTAG) protocol.
The MSP-FET430UIF development tool supports development with all MSP430 devices and is designedfor use with PCBs that contain MSP430 devices; for example, the MSP430 target socket boards.
Two different version of the MSP-FET430UIF are available, version 1.3 and version 1.4a. There arelimitations when using version 1.3. Refer to Section 5.7.1 for more details.
Figure 20. MSP-FET430UIF Version 1.4a Top and BottomViews
Figure 21. MSP-FET430UIF Version 1.3 Top and BottomViews
5.7.1 General FeaturesThe following features are provided by the MSP-FET430UIF debug probe.
Features:• Operating systems: OS X, Linux, Windows
NOTE: OS X El Capitan is not supported using the MSP-FET430UIF.
• Software configurable supply voltage between 1.8 V and 3.6 V at 100 mA• External voltage detection• Supports JTAG Security Fuse blow to protect code• Supports all MSP430 boards with JTAG header• Supports both JTAG and Spy-Bi-Wire (2-wire JTAG) debug protocols• Software breakpoints in Flash, FRAM, and RAM support• Flash and FRAM programming support• Software field update is possible (enable new device support by in field firmware updates)
NOTE: The MSP-FET430UIF version 1.3 does not support Spy-Bi-Wire connection for MSP430devices with 1-µF capacitance on the reset line.

Debug Probes Hardware and Software www.ti.com
26 SLAU647C–July 2015–Revised February 2016Submit Documentation Feedback
Copyright © 2015–2016, Texas Instruments Incorporated
MSP Debuggers
5.7.2 LED SignalsThe MSP-FET430UIF shows its operating states using two LEDs, one green and one red. Table 7 lists allavailable operation modes. An or icon indicates that the LED is off, an or icon indicates thatthe LED is on, and an or icon indicates that the LED flashes.
Table 7. MSP-FET430UIF LED Signals
PowerLED Mode LED Function
MSP-FET430UIF not connected to PC, or MSP-FET430UIF not ready; for example, after a majorfirmware update. Connect or reconnect MSP-FET430UIF to PC.
MSP-FET430UIF connected and ready
MSP-FET430UIF waiting for data transfer
Ongoing data transfer – during active debug session
An error has occurred; for example, target VCC over current. Unplug MSP-FET430UIF from target, andcycle the power off and on. Check target connection, and reconnect MSP-FET430UIF.
Firmware update in progress. Do not disconnect MSP-FET430UIF while both LEDs are blinking.
5.7.3 HardwareThis section includes MSP-FET430UIF hardware descriptions like the JTAG connector, schematic, andpower up states of the JTAG pins.
5.7.3.1 JTAG Target ConnectorFigure 22 shows the pinout of the MSP-FET430UIF JTAG connector.
Figure 22. MSP-FET430UIF 14-Pin JTAG Connector

www.ti.com Debug Probes Hardware and Software
27SLAU647C–July 2015–Revised February 2016Submit Documentation Feedback
Copyright © 2015–2016, Texas Instruments Incorporated
MSP Debuggers
5.7.3.2 Pin States After Power UpTable 8 describes the electrical state of every JTAG pin after debug probe power up.
Table 8. MSP-FET430UIF Pin States
Pin Name After Power-Up When JTAG Protocol isActive
When Spy-Bi-WireProtocol is Active
1 TDO/TDI Hi-Z, pulled up to 3.3 V In, TDO In and Out, SBWTDIO2 VCC_TOOL 3.3 V Target VCC Target VCC
3 TDI/VPP Hi-Z, pulled up to 3.3 V Out, TDI Hi-Z, pulled up to VCC
4 VCC_TARGET In, external VCC sense In, external VCC sense In, external VCC sense5 TMS Hi-Z, pulled up to 3.3 V Out, TMS Hi-Z, pulled up to VCC
6 N/C N/C N/C N/C7 TCK Hi-Z, pulled up to 3.3 V Out, TCK Out, SBWTCK8 TEST/VPP Out, Ground Out, TEST Hi-Z, pulled up to VCC
9 GND Ground Ground Ground10 N/C N/C N/C N/C11 RST Out, VCC Out, RST Ground12 N/C N/C N/C N/C13 N/C N/C N/C N/C14 N/C N/C N/C N/C

Debug Probes Hardware and Software www.ti.com
28 SLAU647C–July 2015–Revised February 2016Submit Documentation Feedback
Copyright © 2015–2016, Texas Instruments Incorporated
MSP Debuggers
5.7.3.3 Schematics
Figure 23. MSP-FET430UIF USB Interface, Schematic (1 of 4)
www.ti.com Debug Probes Hardware and Software
29SLAU647C–July 2015–Revised February 2016Submit Documentation Feedback
Copyright © 2015–2016, Texas Instruments Incorporated
MSP Debuggers
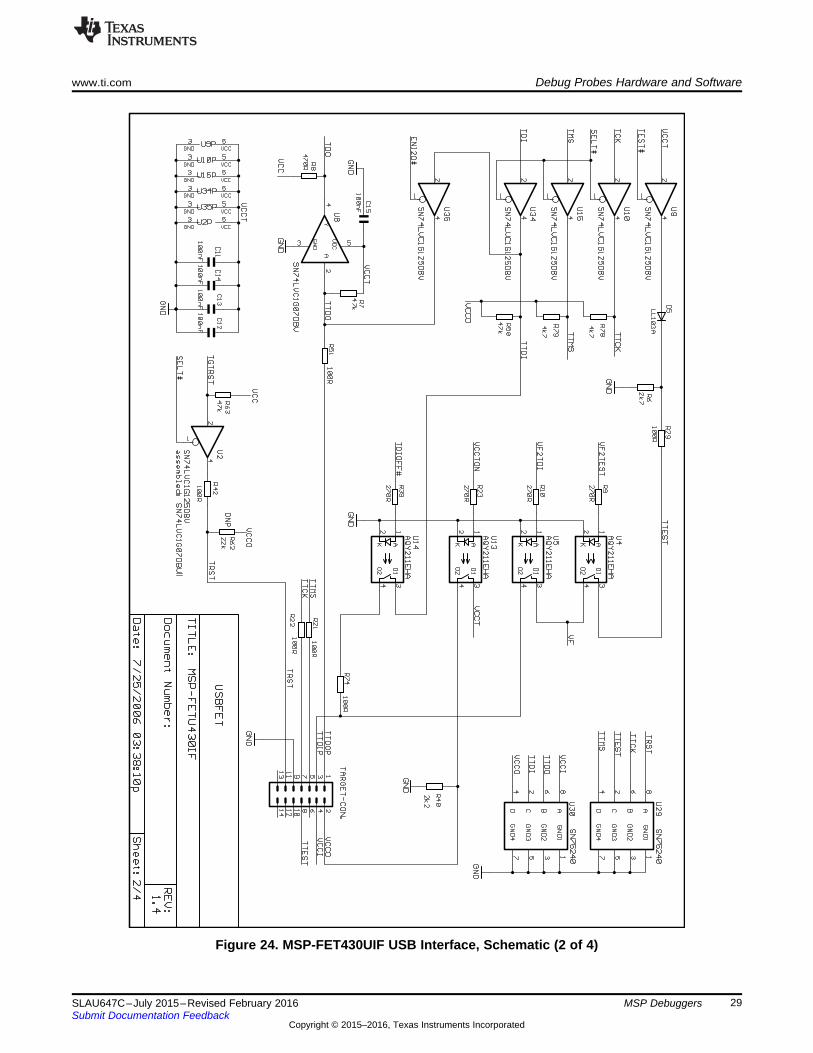
Figure 24. MSP-FET430UIF USB Interface, Schematic (2 of 4)

Debug Probes Hardware and Software www.ti.com
30 SLAU647C–July 2015–Revised February 2016Submit Documentation Feedback
Copyright © 2015–2016, Texas Instruments Incorporated
MSP Debuggers
Figure 25. MSP-FET430UIF USB Interface, Schematic (3 of 4)

www.ti.com Debug Probes Hardware and Software
31SLAU647C–July 2015–Revised February 2016Submit Documentation Feedback
Copyright © 2015–2016, Texas Instruments Incorporated
MSP Debuggers
Figure 26. MSP-FET430UIF USB Interface, Schematic (4 of 4)

Debug Probes Hardware and Software www.ti.com
32 SLAU647C–July 2015–Revised February 2016Submit Documentation Feedback
Copyright © 2015–2016, Texas Instruments Incorporated
MSP Debuggers
Figure 27. MSP-FET430UIF USB Interface, PCB

www.ti.com Debug Probes Hardware and Software
33SLAU647C–July 2015–Revised February 2016Submit Documentation Feedback
Copyright © 2015–2016, Texas Instruments Incorporated
MSP Debuggers
5.8 eZ-FET and eZ-FET Lite Onboard EmulationThe eZ-FET and eZ-FET Lite are powerful onboard flash emulation debug probes for applicationdevelopment on MSP430 microcontrollers (see Figure 28). The eZ-FET and eZ-FET Lite onboardemulation are the successors of the legacy eZ430.
Both eZ-FETs provide a USB interface to program and debug the MSP430 devices in-system through thepin-saving Spy-Bi-Wire (2-wire JTAG) protocol. Furthermore, the USB interface can be used forbackchannel UART communication.
Both development tools support development with all MSP430 devices. They are designed as onboardemulation that is available on several LaunchPad kits. (Only MSP430 devices that implement the SBW2protocol are supported.)
Figure 28. eZ-FET and eZ-FET Lite (Top View)
Figure 29 shows revision 1.3 of the eZ-FET.
Figure 29. eZ-FET Rev1.3 (Top View)

Debug Probes Hardware and Software www.ti.com
34 SLAU647C–July 2015–Revised February 2016Submit Documentation Feedback
Copyright © 2015–2016, Texas Instruments Incorporated
MSP Debuggers
5.8.1 General FeaturesThe following features are provided by the eZ-FET and eZ-FET Lite debug probes.
Features:• eZ-FET and eZ-FET Lite supported since:
– CCS v5.4.0– IAR EW430 v5.52.1 and v5.51.6
• Operating systems: OS X, Linux, Windows• Fixed supply voltage between 3.3 or 3.6 V at 75 mA• Support Spy-Bi-Wire (2-wire JTAG) debug protocol• Software Breakpoint in Flash, FRAM, and RAM support• Flash and FRAM programming support• Backchannel UART• eZ-FET only – EnergyTrace and EnergyTrace++ support• Software field update is possible
5.8.2 Backchannel UARTSupported baud rates depend on the target configuration and the debug settings. Table 9 shows whichbaud rates are supported with certain configuration combinations.
✓ means that the corresponding baud rate is supported without any data loss with the specifiedcombination of settings.
✗ means that the corresponding baud rate is not supported (data loss is expected) with the specifiedcombination of settings.
Table 9. eZ-FET and eZ-FET Lite Backchannel UART Implementation
Target MCLKFrequency: 1 MHz 8 MHz 1 MHz 8 MHz
Debugger: Active InactiveFlow Control: No Yes No Yes No Yes No Yes
4800 baud ✓ ✓ ✓ ✓ ✓ ✓ ✓ ✓9600 baud ✓ ✓ ✓ ✓ ✓ ✓ ✓ ✓19200 baud ✓ ✓ ✓ ✓ ✓ ✓ ✓ ✓28800 baud ✗ ✓ ✓ ✓ ✓ ✓ ✓ ✓38400 baud ✗ ✓ ✗ ✓ ✗ ✓ ✗ ✓57600 baud ✗ ✓ ✗ ✓ ✗ ✓ ✗ ✓115200 baud ✗ ✗ ✗ ✓ ✗ ✗ ✗ ✓
5.8.2.1 eZ-FET and eZ-FET Lite UART Backchannel Activation CommandsThe eZ-FET supports two different backchannel UART modes, one with flow control and one without. Thedifferent modes can be selected by opening the corresponding COM port with a dedicated baud rate. SeeTable 10 for the specific baud rates for each command.
NOTE: The baud rates used by these commands cannot be used for communication.
If none of the specified commands are transferred before setting the communication baud rate,communication starts with these default settings: VCC on, no flow control mechanism.

www.ti.com Debug Probes Hardware and Software
35SLAU647C–July 2015–Revised February 2016Submit Documentation Feedback
Copyright © 2015–2016, Texas Instruments Incorporated
MSP Debuggers
Table 10. eZ-FET and eZ-FET Lite Backchannel UART Activation Commands
Baud Rate Command9620 Set all backchannel UART pins to high impedance – no current flow into target device9621 Configure backchannel UART communication without handshake (default start behavior)
9622 Configure backchannel UART communication with handshakeNOTE: Available on Rev. 1.2 only.
9623 Voltage configuration command. When this command is received, target VCC switched on.
5.8.3 LED SignalseZ-FET emulators show their operating states using two LEDs, one green and one red. Table 11 lists allavailable operation modes. An or icon indicates that the LED is off, an or icon indicates thatthe LED is on, and an or icon indicates that the LED flashes.
Table 11. eZ-FET LED Signals
PowerLED Mode LED Function
eZ-FET not connected to PC, or eZ-FET not ready; for example, after a major firmware update. Connector reconnect eZ-FET to PC.
eZ-FET connected and ready
eZ-FET waiting for data transfer
Ongoing data transfer – during active debug session
An error has occurred; for example, target VCC over current. Unplug eZ-FET from target, and cycle thepower off and on. Check target connection, and reconnect eZ-FET.
Firmware update in progress. Do not disconnect eZ-FET while both LEDs are blinking.
5.8.4 HardwareThis section describes the pinout of the eZ-FET and eZ-FET Lite debug connector. It includes a list of alldebugger pin states after power up and the eZ-FET and eZ-FET Lite schematics.
5.8.4.1 JTAG Target ConnectorFigure 30 shows the pinout of the eZ-FET debug connector.
Figure 30. eZ-FET or eZ-FET Lite Debug Connector

Debug Probes Hardware and Software www.ti.com
36 SLAU647C–July 2015–Revised February 2016Submit Documentation Feedback
Copyright © 2015–2016, Texas Instruments Incorporated
MSP Debuggers
5.8.4.2 Connecting MSP-FET to LaunchPadFigure 31 and Figure 32 show how to connect an MSP-FET to the target MSP430 device that is soldersonto the LaunchPad, using an F5529 LaunchPad as an example.
Figure 31. MSP-FET to LaunchPad Pin Assignments Figure 32. MSP-FET to LaunchPad Wiring Diagram
5.8.4.3 Pin States After Power UpTable 12 describes the electrical state of every JTAG pin after debug probe power up.
Table 12. eZ-FET and eZ-FET Lite Pin States
Signal Name After Power-Up When Spy-Bi-Wire Protocol is ActiveSBWTDIO Hi-Z, pulled up to 3.3 V In and Out, SBWTDIOSBWTCK Hi-Z, pulled up to 3.3 V Out, SBWTCK
TXD Hi-Z, pulled up to 3.3 V In, Target UART TXD outputRXD Hi-Z, pulled up to 3.3 V Out, Target UART RXD inputCTS Hi-Z, pulled up to 3.3 V Out, Target UART Clear-To- Send Handshake inputRTS Hi-Z, pulled up to 3.3 V In, Target UART Ready-to Send Handshake output3V3 Target VCC Target VCC
5V USB VCC USB VCC
GND Ground Ground

www.ti.com Debug Probes Hardware and Software
37SLAU647C–July 2015–Revised February 2016Submit Documentation Feedback
Copyright © 2015–2016, Texas Instruments Incorporated
MSP Debuggers
5.8.4.4 Schematics
Figure 33. eZ-FET Schematic (USB Connection)

Debug Probes Hardware and Software www.ti.com
38 SLAU647C–July 2015–Revised February 2016Submit Documentation Feedback
Copyright © 2015–2016, Texas Instruments Incorporated
MSP Debuggers
Figure 34. eZ-FET Schematic (Emulation MCU)
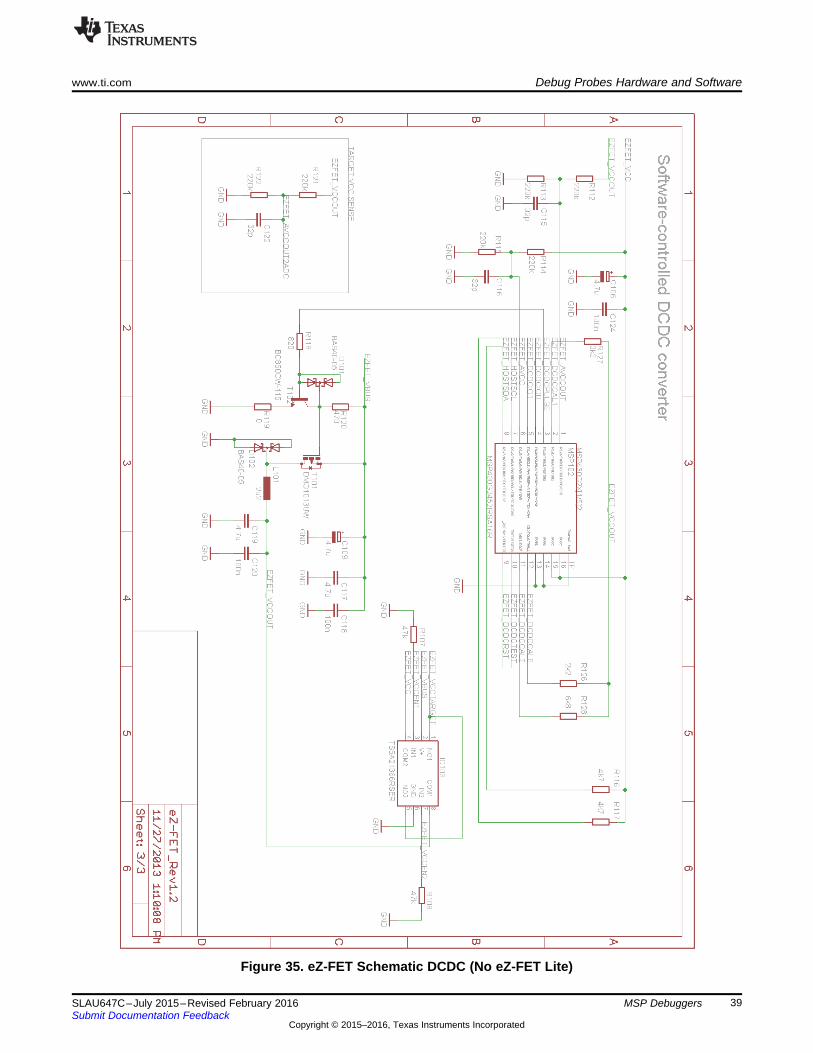
www.ti.com Debug Probes Hardware and Software
39SLAU647C–July 2015–Revised February 2016Submit Documentation Feedback
Copyright © 2015–2016, Texas Instruments Incorporated
MSP Debuggers
Figure 35. eZ-FET Schematic DCDC (No eZ-FET Lite)

Debug Probes Hardware and Software www.ti.com
40 SLAU647C–July 2015–Revised February 2016Submit Documentation Feedback
Copyright © 2015–2016, Texas Instruments Incorporated
MSP Debuggers
5.9 eZ430 Onboard EmulationThe eZ430 onboard emulation is the legacy onboard flash emulation for application development onMSP430 microcontrollers. The eZ-FET and eZ-FET Lite onboard emulation are the successors of thelegacy eZ430.
The eZ430 provides a USB interface to program and debug the MSP430 devices in-system through thepin-saving Spy-Bi-Wire (2-wire JTAG) protocol. Furthermore, the USB interface can be used forBackchannel UART communication.
NOTE: The eZ430 does not support all MSP430 device families. Refer to Table 1 for more detailsabout device support.
Figure 36. eZ430 Emulation
5.9.1 General FeaturesUSB debug interface to connect a MSP430 MCU to a PC for real-time in-system programming anddebugging.
Features:• Operating systems: Windows• Fixed supply voltage between 3.6 V at 75 mA• Support Spy-Bi-Wire (2-wire JTAG) debug protocol• Software Breakpoint in Flash, FRAM, and RAM support• Flash and FRAM programming support• Backchannel UART• Software field update is not possible (refer to Table 1 for device support details)• Limited device support

www.ti.com Debug Probes Hardware and Software
41SLAU647C–July 2015–Revised February 2016Submit Documentation Feedback
Copyright © 2015–2016, Texas Instruments Incorporated
MSP Debuggers
5.9.2 Backchannel UARTThe baud rates that are supported depend on the target configuration and the debug settings. Table 13shows which baud rates are supported with certain configuration combinations.
✓ means that the corresponding baud rate is supported without any data loss with the specifiedcombination of settings.
✗ means that the corresponding baud rate is not supported (data loss is expected) with the specifiedcombination of settings.
Table 13. eZ430 Backchannel UART Implementation
Target MCLK Frequency: 1 MHz 8 MHzDebugger: Active Active4800 baud ✓ ✓9600 baud ✓ ✓
19200 baud ✗ ✗28800 baud ✗ ✗38400 baud ✗ ✗57200 baud ✗ ✗115200 baud ✗ ✗
5.9.3 HardwareThis section describes the pinout of the eZ430 debug connector. It includes a list of all debugger pinstates after power up and the ez430 schematics.
5.9.3.1 JTAG Target ConnectorFigure 37 shows the pinout of the eZ430 debug connector.
Figure 37. eZ430 Debug Connector on MSP-EXP430G2 LaunchPad
5.9.3.2 Pin States After Power UpTable 14 describes the electrical state of every JTAG pin after debug probe power up.
Table 14. eZ430 Pin States
Signal Name After Power-Up When Spy-Bi-Wire Protocol is ActiveVCC Target VCC Target VCC
RST In and Out, SBWTDIO In and Out, SBWTDIOTST Out, SBWTCK Out, SBWTCKTXD In, Target UART TXD output In, Target UART TXD outputRXD Out, Target UART RXD input Out, Target UART RXD input

Debug Probes Hardware and Software www.ti.com
42 SLAU647C–July 2015–Revised February 2016Submit Documentation Feedback
Copyright © 2015–2016, Texas Instruments Incorporated
MSP Debuggers
5.9.3.3 Schematics
Figure 38. eZ430 Schematic (Emulation MCU)

www.ti.com Debug Probes Hardware and Software
43SLAU647C–July 2015–Revised February 2016Submit Documentation Feedback
Copyright © 2015–2016, Texas Instruments Incorporated
MSP Debuggers
Figure 39. eZ430 Schematic (USB Connection)

Debug Probes Hardware and Software www.ti.com
44 SLAU647C–July 2015–Revised February 2016Submit Documentation Feedback
Copyright © 2015–2016, Texas Instruments Incorporated
MSP Debuggers
(1) Spy-Bi-Wire (2-wire JTAG) is supported
5.10 MSP-FET430PIFThe MSP-FET430PIF is a parallel port interface that is used to program and debug MSP430 boardsthrough the JTAG interface. This interface uses a parallel PC port to communicate with the IDE (CCS,EW430, or the MSP Flasher) running on the PC. The interface uses the standard 14-pin JTAG header tocommunicate with the MSP430 device using the standard JTAG protocol.
The flash memory can be erased and programmed in seconds with only a few keystrokes, and becausethe MSP430 flash is extremely low power, no external power supply is required. The tool has anintegrated software environment and connects directly to the PC which greatly simplifies the setup anduse of the tool.
Figure 40. MSP-FET430PIF
5.10.1 General Features• Operating systems: Windows XP• Fixed supply voltage between 3.3 V at 25 mA• Software Breakpoint in Flash, FRAM, and RAM support• Flash and FRAM programming support• Supports JTAG protocol only (1)
NOTE: The MSP-FET430PIF is for legacy device support only. This emulation tool does not supportany devices released after 2011.

www.ti.com Debug Probes Hardware and Software
45SLAU647C–July 2015–Revised February 2016Submit Documentation Feedback
Copyright © 2015–2016, Texas Instruments Incorporated
MSP Debuggers
5.10.2 Schematics
Figure 41. MSP-FET430PIF FET Interface Module, Schematic

Debug Probes Hardware and Software www.ti.com
46 SLAU647C–July 2015–Revised February 2016Submit Documentation Feedback
Copyright © 2015–2016, Texas Instruments Incorporated
MSP Debuggers
Figure 42. MSP-FET430PIF FET Interface Module, PCB

www.ti.com Revision History
47SLAU647C–July 2015–Revised February 2016Submit Documentation Feedback
Copyright © 2015–2016, Texas Instruments Incorporated
Revision History
Revision History
Changes from November 3, 2015 to February 17, 2016 ................................................................................................. Page
• Added row "Supports MSP432Pxx" in Table 1, Debug Probes Features and Device Compatibility ........................... 4• Removed versions numbers from Ubuntu and OS X in Section 4.4, Hardware Installation Using the MSP Flasher........ 9• Added list item "MSP-FET is supported since" in Section 5.6.1, General Features ............................................ 15• Changed "57200 baud" to "57600 baud" in Table 2, MSP-FET Backchannel UART Implementation ....................... 15• Added note "OS X El Capitan is not supported using the MSP-FET430UIF" in Section 5.7.1, General Features ......... 25• Added Figure 29, eZ-FET Rev1.3 (Top View) ....................................................................................... 33• Added list item "eZ-FET and eZ-FET Lite supported since" in Section 5.8.1, General Features ............................. 34• Changed "57200 baud" to "57600 baud" in Table 9, eZ-FET and eZ-FET Lite Backchannel UART Implementation...... 34• Added note to Baud Rate 9622 in Table 10, eZ-FET and eZ-FET Lite Backchannel UART Activation Commands ....... 35
NOTE: Page numbers for previous revisions may differ from page numbers in the current version.

IMPORTANT NOTICE
Texas Instruments Incorporated and its subsidiaries (TI) reserve the right to make corrections, enhancements, improvements and otherchanges to its semiconductor products and services per JESD46, latest issue, and to discontinue any product or service per JESD48, latestissue. Buyers should obtain the latest relevant information before placing orders and should verify that such information is current andcomplete. All semiconductor products (also referred to herein as “components”) are sold subject to TI’s terms and conditions of salesupplied at the time of order acknowledgment.TI warrants performance of its components to the specifications applicable at the time of sale, in accordance with the warranty in TI’s termsand conditions of sale of semiconductor products. Testing and other quality control techniques are used to the extent TI deems necessaryto support this warranty. Except where mandated by applicable law, testing of all parameters of each component is not necessarilyperformed.TI assumes no liability for applications assistance or the design of Buyers’ products. Buyers are responsible for their products andapplications using TI components. To minimize the risks associated with Buyers’ products and applications, Buyers should provideadequate design and operating safeguards.TI does not warrant or represent that any license, either express or implied, is granted under any patent right, copyright, mask work right, orother intellectual property right relating to any combination, machine, or process in which TI components or services are used. Informationpublished by TI regarding third-party products or services does not constitute a license to use such products or services or a warranty orendorsement thereof. Use of such information may require a license from a third party under the patents or other intellectual property of thethird party, or a license from TI under the patents or other intellectual property of TI.Reproduction of significant portions of TI information in TI data books or data sheets is permissible only if reproduction is without alterationand is accompanied by all associated warranties, conditions, limitations, and notices. TI is not responsible or liable for such altereddocumentation. Information of third parties may be subject to additional restrictions.Resale of TI components or services with statements different from or beyond the parameters stated by TI for that component or servicevoids all express and any implied warranties for the associated TI component or service and is an unfair and deceptive business practice.TI is not responsible or liable for any such statements.Buyer acknowledges and agrees that it is solely responsible for compliance with all legal, regulatory and safety-related requirementsconcerning its products, and any use of TI components in its applications, notwithstanding any applications-related information or supportthat may be provided by TI. Buyer represents and agrees that it has all the necessary expertise to create and implement safeguards whichanticipate dangerous consequences of failures, monitor failures and their consequences, lessen the likelihood of failures that might causeharm and take appropriate remedial actions. Buyer will fully indemnify TI and its representatives against any damages arising out of the useof any TI components in safety-critical applications.In some cases, TI components may be promoted specifically to facilitate safety-related applications. With such components, TI’s goal is tohelp enable customers to design and create their own end-product solutions that meet applicable functional safety standards andrequirements. Nonetheless, such components are subject to these terms.No TI components are authorized for use in FDA Class III (or similar life-critical medical equipment) unless authorized officers of the partieshave executed a special agreement specifically governing such use.Only those TI components which TI has specifically designated as military grade or “enhanced plastic” are designed and intended for use inmilitary/aerospace applications or environments. Buyer acknowledges and agrees that any military or aerospace use of TI componentswhich have not been so designated is solely at the Buyer's risk, and that Buyer is solely responsible for compliance with all legal andregulatory requirements in connection with such use.TI has specifically designated certain components as meeting ISO/TS16949 requirements, mainly for automotive use. In any case of use ofnon-designated products, TI will not be responsible for any failure to meet ISO/TS16949.
Products ApplicationsAudio www.ti.com/audio Automotive and Transportation www.ti.com/automotiveAmplifiers amplifier.ti.com Communications and Telecom www.ti.com/communicationsData Converters dataconverter.ti.com Computers and Peripherals www.ti.com/computersDLP® Products www.dlp.com Consumer Electronics www.ti.com/consumer-appsDSP dsp.ti.com Energy and Lighting www.ti.com/energyClocks and Timers www.ti.com/clocks Industrial www.ti.com/industrialInterface interface.ti.com Medical www.ti.com/medicalLogic logic.ti.com Security www.ti.com/securityPower Mgmt power.ti.com Space, Avionics and Defense www.ti.com/space-avionics-defenseMicrocontrollers microcontroller.ti.com Video and Imaging www.ti.com/videoRFID www.ti-rfid.comOMAP Applications Processors www.ti.com/omap TI E2E Community e2e.ti.comWireless Connectivity www.ti.com/wirelessconnectivity
Mailing Address: Texas Instruments, Post Office Box 655303, Dallas, Texas 75265Copyright © 2016, Texas Instruments Incorporated