MSF Belgium Financial statements 2016 MSF Belgium... · MSF Belgium Financial Statements 2016 MSF...
32
0 MSF Belgium Financial statements 2016
Transcript of MSF Belgium Financial statements 2016 MSF Belgium... · MSF Belgium Financial Statements 2016 MSF...
0
MSF Belgium
Financial statements 2016
1
MSF Belgium Financial Statements 2016
MSF Belgium & OCB Finance department
1. Highlights on Profit and loss accounts 2016 Social mission expenses increasing In 2016, MSF Belgium increased its expenses with +6% (+ 18.5 Mio€) compared to the budget and +3% (+8.3 Mio€) compared to 2015. This is due to increasing Social mission expenses reaching 324.6 Mio€ in 2016, so +6% (+18.5 Mio€) more than budgeted or +3% (+9.9 Mio€) more than in 2015.
Support to other Operational centers
The main reason of this increase with the initial budget 2016 is because we had not budgeted to support and fund part of the program expenses of Operational Centre Barcelona (OCBA) and Operational Centre Paris (OCP) for 18 Mio€ (9 Mio€ each). This transfer of funds is related to the agreement to rebalance reserves between all MSF Operational centers
1.
More support to the field through HR reinforcement We spent less than foreseen in our initial budget directly in our missions (Programme expenses -3% (-7.4Mio€), but it was compensated with an increase in Program Support of 32% (+7.2 Mio€). This increase is the consequence of decisions taken by MSF Belgium to reinforce the support to our field missions, at first from an HR perspective to follow the increase in field projects and positions to be filled : more recruitment, more departures, more administrative support, more training, more complex local regulations, etc.
Structure support in Middle East and North Africa regions
The increasing needs and activities in the region Middle East (Lebanon, Turkey, Syria) and North African
2 missions
led to the creation of a new cell within operations and the set up of hubs in Lebanon and in Egypt to boost recruitments and to support the communication in the region.
New initiatives to improve data management and decrease paper work in the field
Finally, MSF Belgium defined as a priority objective the improvement of quality care, pointing out the necessity to focus on Data Management and hospitals. In 2016 several initiatives were launched to answer the need
1 in accordance with RSA3 : 3rd Resources Sharing Agreement. See Annexe 2 2 Middle East and North African is refered as MENA
expressed by the field missions to decrease paper work related to patients care and to collecting medical data : launch of the project Electronic Medical Record system (EMR) solution, the Monitoring and Surveillance Tools (MAST) program,…
Field litigations accrual In 2016 MSF Belgium made a provision of 3.4 Mio€ to cover existing financial risks related to litigations in some missions, mainly in South Sudan (issue related to expired drugs) and Pakistan (tax on incomes issue). We kept the provision (2.3 Mio€) made last year for the overstock at MSF Supply from our Ebola operations as the stock remains unsold.
Private income increasing Total private income amounted to 345.5 Mio€ in 2016, so 18% better than budgeted (+52.2 Mio€), and +11% compared to 2015 (+33.9 Mio€), whereas 2015 showed already an increase of +6% compared to 2014. The increase of regular donors in all our sections initiated by the Ebola crisis exposure together boost the regular donations with not much extra fundraising investment (+0.2 Mio€ versus 2015 in total). Regular donations represented in average 40% of our incomes in 2016. Moreover some big legacies and exceptional big donations were received in Sweden and Hong-Kong. Even in Belgium the legacies represent in 2016 more than 25% of the incomes.
Public Institutional Income decrease In 2016, MSF Belgium and its partner sections collected 15.2 Mio€ from Public Institutions such as governments and EU funds. This is a decrease -5.4 Mio€ compared to the initial budget and a decrease of -17.7 Mio€ versus 2015, as a consequence of a decision taken during 2016 to freeze all Public Institutional incomes from EU & EU government countries to what was already signed : so in 2016 the Public Institutional funds covered 6%of the OCB Mission expenses (14% in 2015).
Final result: a surplus of 34.8 Mio€ As a result, MSF Belgium ended 2016 with a surplus of 34.8 Mio€, which is +33.65 Mio€ above budget.
2
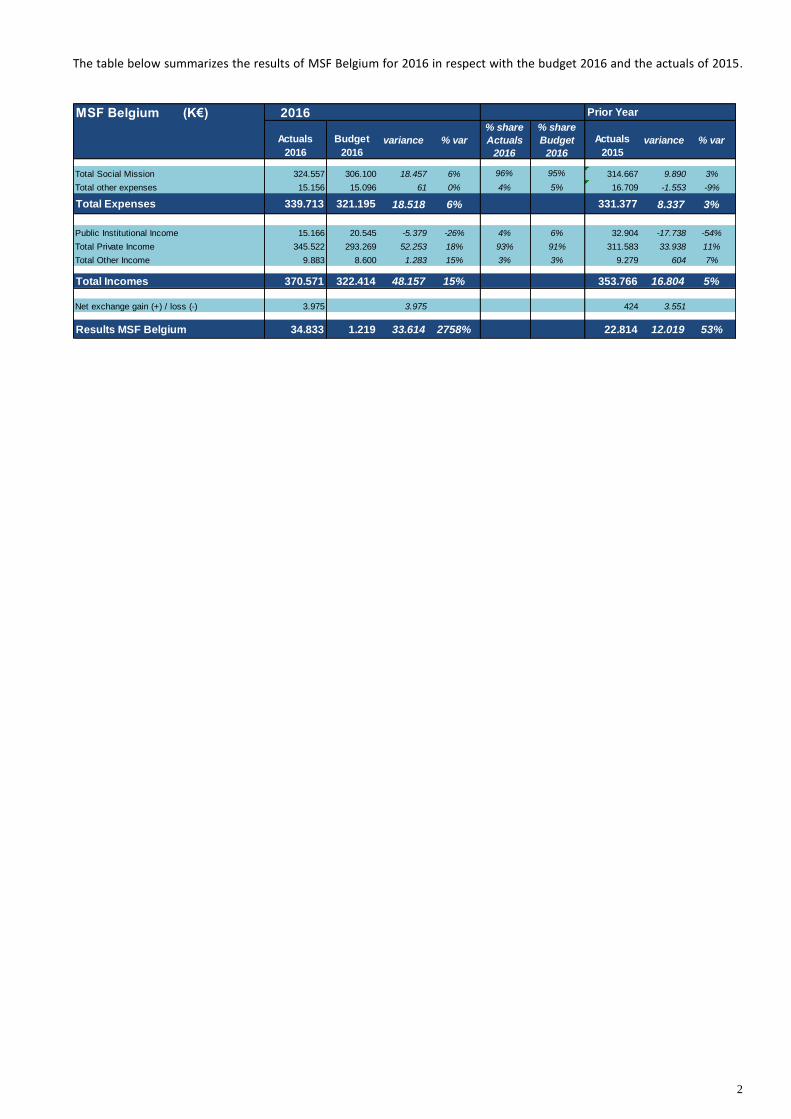
The table below summarizes the results of MSF Belgium for 2016 in respect with the budget 2016 and the actuals of 2015.
MSF Belgium (K€) 2016 Prior Year
Actuals
2016
Budget
2016
variance % var
% share
Actuals
2016
% share
Budget
2016
Actuals
2015
variance % var
Total Social Mission 324.557 306.100 18.457 6% 96% 95% 314.667 9.890 3%
Total other expenses 15.156 15.096 61 0% 4% 5% 16.709 -1.553 -9%
Total Expenses 339.713 321.195 18.518 6% 331.377 8.337 3%
Public Institutional Income 15.166 20.545 -5.379 -26% 4% 6% 32.904 -17.738 -54%
Total Private Income 345.522 293.269 52.253 18% 93% 91% 311.583 33.938 11%
Total Other Income 9.883 8.600 1.283 15% 3% 3% 9.279 604 7%
Total Incomes 370.571 322.414 48.157 15% 353.766 16.804 5%
Net exchange gain (+) / loss (-) 3.975 3.975 424 3.551
Results MSF Belgium 34.833 1.219 33.614 2758% 22.814 12.019 53%
3
2. Expenditure
MSF Belgium (K€) 2016 Prior Year
Actuals
2016
Budget
2016
variance % var
% share
Actuals
2016
% share
Budget
2016
Actuals
2015
variance % var
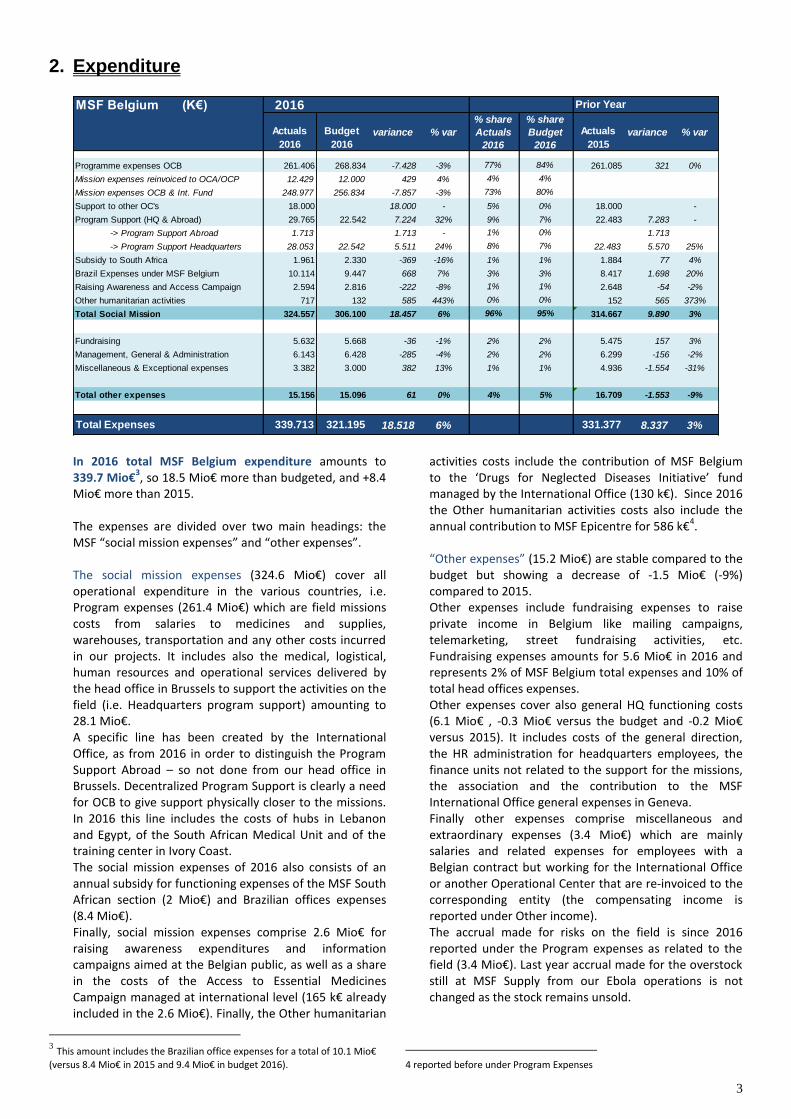
Programme expenses OCB 261.406 268.834 -7.428 -3% 77% 84% 261.085 321 0%
Mission expenses reinvoiced to OCA/OCP 12.429 12.000 429 4% 4% 4%
Mission expenses OCB & Int. Fund 248.977 256.834 -7.857 -3% 73% 80%
Support to other OC's 18.000 18.000 - 5% 0% 18.000 -
Program Support (HQ & Abroad) 29.765 22.542 7.224 32% 9% 7% 22.483 7.283 -
-> Program Support Abroad 1.713 1.713 - 1% 0% 1.713
-> Program Support Headquarters 28.053 22.542 5.511 24% 8% 7% 22.483 5.570 25%
Subsidy to South Africa 1.961 2.330 -369 -16% 1% 1% 1.884 77 4%
Brazil Expenses under MSF Belgium 10.114 9.447 668 7% 3% 3% 8.417 1.698 20%
Raising Awareness and Access Campaign 2.594 2.816 -222 -8% 1% 1% 2.648 -54 -2%
Other humanitarian activities 717 132 585 443% 0% 0% 152 565 373%
Total Social Mission 324.557 306.100 18.457 6% 96% 95% 314.667 9.890 3%
Fundraising 5.632 5.668 -36 -1% 2% 2% 5.475 157 3%
Management, General & Administration 6.143 6.428 -285 -4% 2% 2% 6.299 -156 -2%
Miscellaneous & Exceptional expenses 3.382 3.000 382 13% 1% 1% 4.936 -1.554 -31%
Total other expenses 15.156 15.096 61 0% 4% 5% 16.709 -1.553 -9%
Total Expenses 339.713 321.195 18.518 6% 331.377 8.337 3%
In 2016 total MSF Belgium expenditure amounts to 339.7 Mio€
3, so 18.5 Mio€ more than budgeted, and +8.4
Mio€ more than 2015.
The expenses are divided over two main headings: the MSF “social mission expenses” and “other expenses”. The social mission expenses (324.6 Mio€) cover all operational expenditure in the various countries, i.e. Program expenses (261.4 Mio€) which are field missions costs from salaries to medicines and supplies, warehouses, transportation and any other costs incurred in our projects. It includes also the medical, logistical, human resources and operational services delivered by the head office in Brussels to support the activities on the field (i.e. Headquarters program support) amounting to 28.1 Mio€. A specific line has been created by the International Office, as from 2016 in order to distinguish the Program Support Abroad – so not done from our head office in Brussels. Decentralized Program Support is clearly a need for OCB to give support physically closer to the missions. In 2016 this line includes the costs of hubs in Lebanon and Egypt, of the South African Medical Unit and of the training center in Ivory Coast. The social mission expenses of 2016 also consists of an annual subsidy for functioning expenses of the MSF South African section (2 Mio€) and Brazilian offices expenses (8.4 Mio€). Finally, social mission expenses comprise 2.6 Mio€ for raising awareness expenditures and information campaigns aimed at the Belgian public, as well as a share in the costs of the Access to Essential Medicines Campaign managed at international level (165 k€ already included in the 2.6 Mio€). Finally, the Other humanitarian
3 This amount includes the Brazilian office expenses for a total of 10.1 Mio€
(versus 8.4 Mio€ in 2015 and 9.4 Mio€ in budget 2016).
activities costs include the contribution of MSF Belgium to the ‘Drugs for Neglected Diseases Initiative’ fund managed by the International Office (130 k€). Since 2016 the Other humanitarian activities costs also include the annual contribution to MSF Epicentre for 586 k€
4.
“Other expenses” (15.2 Mio€) are stable compared to the budget but showing a decrease of -1.5 Mio€ (-9%) compared to 2015. Other expenses include fundraising expenses to raise private income in Belgium like mailing campaigns, telemarketing, street fundraising activities, etc. Fundraising expenses amounts for 5.6 Mio€ in 2016 and represents 2% of MSF Belgium total expenses and 10% of total head offices expenses. Other expenses cover also general HQ functioning costs (6.1 Mio€ , -0.3 Mio€ versus the budget and -0.2 Mio€ versus 2015). It includes costs of the general direction, the HR administration for headquarters employees, the finance units not related to the support for the missions, the association and the contribution to the MSF International Office general expenses in Geneva. Finally other expenses comprise miscellaneous and extraordinary expenses (3.4 Mio€) which are mainly salaries and related expenses for employees with a Belgian contract but working for the International Office or another Operational Center that are re-invoiced to the corresponding entity (the compensating income is reported under Other income). The accrual made for risks on the field is since 2016 reported under the Program expenses as related to the field (3.4 Mio€). Last year accrual made for the overstock still at MSF Supply from our Ebola operations is not changed as the stock remains unsold.
4 reported before under Program Expenses
4
3. Incomes
MSF Belgium (K€) 2016 Prior Year
INCOMES
Actuals
2016
Budget
2016
variance % var
% share
Actuals
2016
% share
Budget
2016
Actuals
2015
variance % var
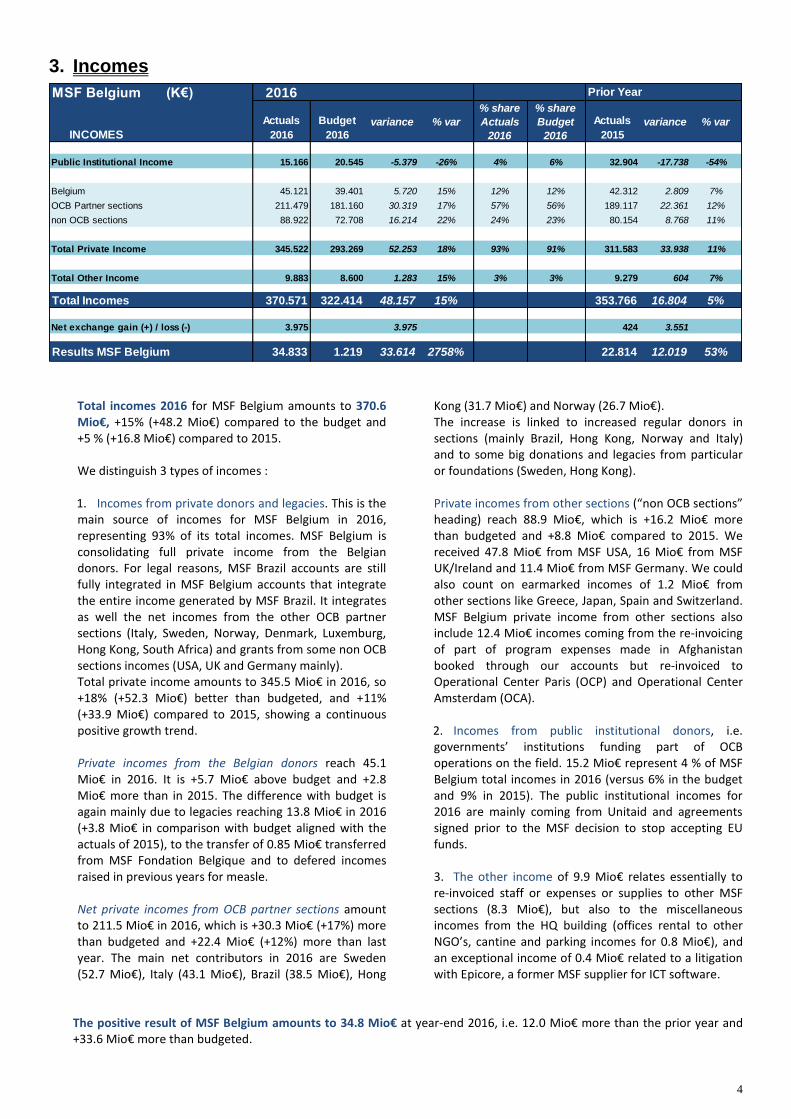
Public Institutional Income 15.166 20.545 -5.379 -26% 4% 6% 32.904 -17.738 -54%
Belgium 45.121 39.401 5.720 15% 12% 12% 42.312 2.809 7%
OCB Partner sections 211.479 181.160 30.319 17% 57% 56% 189.117 22.361 12%
non OCB sections 88.922 72.708 16.214 22% 24% 23% 80.154 8.768 11%
Total Private Income 345.522 293.269 52.253 18% 93% 91% 311.583 33.938 11%
Total Other Income 9.883 8.600 1.283 15% 3% 3% 9.279 604 7%
Total Incomes 370.571 322.414 48.157 15% 353.766 16.804 5%
Net exchange gain (+) / loss (-) 3.975 3.975 424 3.551
Results MSF Belgium 34.833 1.219 33.614 2758% 22.814 12.019 53%
Total incomes 2016 for MSF Belgium amounts to 370.6 Mio€, +15% (+48.2 Mio€) compared to the budget and +5 % (+16.8 Mio€) compared to 2015.
We distinguish 3 types of incomes : 1. Incomes from private donors and legacies. This is the main source of incomes for MSF Belgium in 2016, representing 93% of its total incomes. MSF Belgium is consolidating full private income from the Belgian donors. For legal reasons, MSF Brazil accounts are still fully integrated in MSF Belgium accounts that integrate the entire income generated by MSF Brazil. It integrates as well the net incomes from the other OCB partner sections (Italy, Sweden, Norway, Denmark, Luxemburg, Hong Kong, South Africa) and grants from some non OCB sections incomes (USA, UK and Germany mainly). Total private income amounts to 345.5 Mio€ in 2016, so +18% (+52.3 Mio€) better than budgeted, and +11% (+33.9 Mio€) compared to 2015, showing a continuous positive growth trend. Private incomes from the Belgian donors reach 45.1 Mio€ in 2016. It is +5.7 Mio€ above budget and +2.8 Mio€ more than in 2015. The difference with budget is again mainly due to legacies reaching 13.8 Mio€ in 2016 (+3.8 Mio€ in comparison with budget aligned with the actuals of 2015), to the transfer of 0.85 Mio€ transferred from MSF Fondation Belgique and to defered incomes raised in previous years for measle. Net private incomes from OCB partner sections amount to 211.5 Mio€ in 2016, which is +30.3 Mio€ (+17%) more than budgeted and +22.4 Mio€ (+12%) more than last year. The main net contributors in 2016 are Sweden (52.7 Mio€), Italy (43.1 Mio€), Brazil (38.5 Mio€), Hong
Kong (31.7 Mio€) and Norway (26.7 Mio€). The increase is linked to increased regular donors in sections (mainly Brazil, Hong Kong, Norway and Italy) and to some big donations and legacies from particular or foundations (Sweden, Hong Kong). Private incomes from other sections (“non OCB sections” heading) reach 88.9 Mio€, which is +16.2 Mio€ more than budgeted and +8.8 Mio€ compared to 2015. We received 47.8 Mio€ from MSF USA, 16 Mio€ from MSF UK/Ireland and 11.4 Mio€ from MSF Germany. We could also count on earmarked incomes of 1.2 Mio€ from other sections like Greece, Japan, Spain and Switzerland. MSF Belgium private income from other sections also include 12.4 Mio€ incomes coming from the re-invoicing of part of program expenses made in Afghanistan booked through our accounts but re-invoiced to Operational Center Paris (OCP) and Operational Center Amsterdam (OCA). 2. Incomes from public institutional donors, i.e. governments’ institutions funding part of OCB operations on the field. 15.2 Mio€ represent 4 % of MSF Belgium total incomes in 2016 (versus 6% in the budget and 9% in 2015). The public institutional incomes for 2016 are mainly coming from Unitaid and agreements signed prior to the MSF decision to stop accepting EU funds.
3. The other income of 9.9 Mio€ relates essentially to re-invoiced staff or expenses or supplies to other MSF sections (8.3 Mio€), but also to the miscellaneous incomes from the HQ building (offices rental to other NGO’s, cantine and parking incomes for 0.8 Mio€), and an exceptional income of 0.4 Mio€ related to a litigation with Epicore, a former MSF supplier for ICT software.
The positive result of MSF Belgium amounts to 34.8 Mio€ at year-end 2016, i.e. 12.0 Mio€ more than the prior year and +33.6 Mio€ more than budgeted.
5
4. 2016 Result allocation and balance sheet
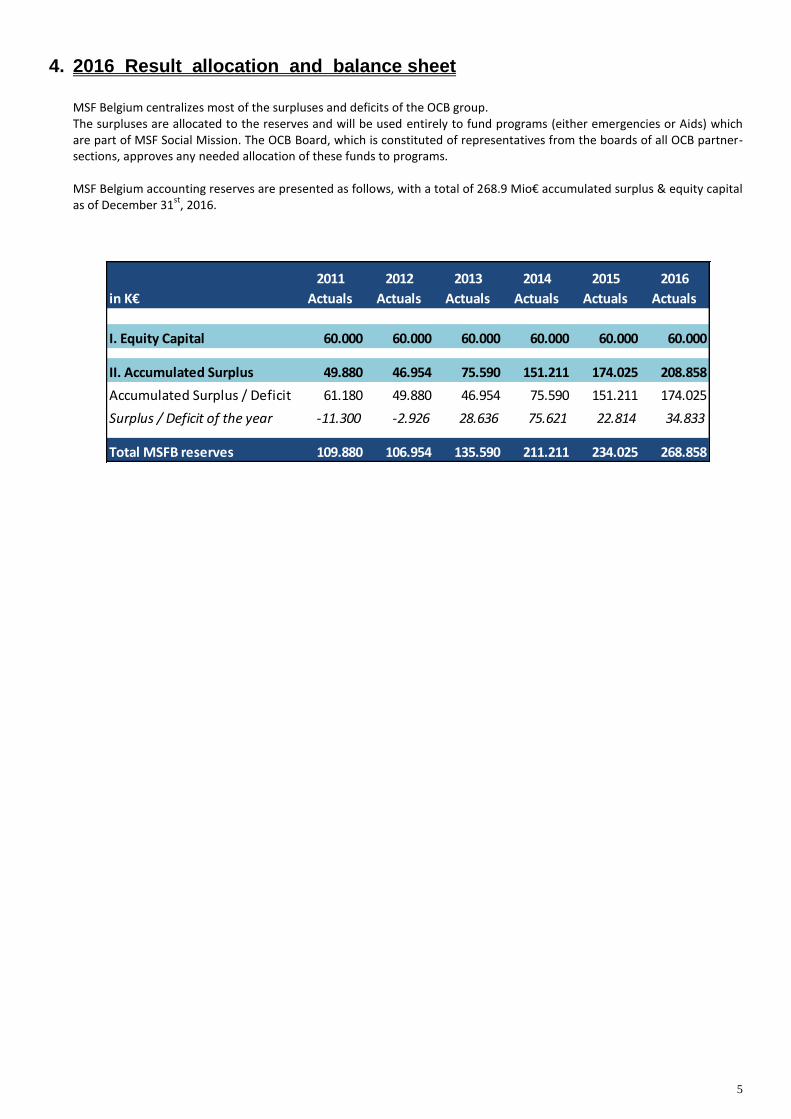
MSF Belgium centralizes most of the surpluses and deficits of the OCB group. The surpluses are allocated to the reserves and will be used entirely to fund programs (either emergencies or Aids) which are part of MSF Social Mission. The OCB Board, which is constituted of representatives from the boards of all OCB partner-sections, approves any needed allocation of these funds to programs. MSF Belgium accounting reserves are presented as follows, with a total of 268.9 Mio€ accumulated surplus & equity capital as of December 31
st, 2016.
in K€
2011
Actuals
2012
Actuals
2013
Actuals
2014
Actuals
2015
Actuals
2016
Actuals
I. Equity Capital 60.000 60.000 60.000 60.000 60.000 60.000
II. Accumulated Surplus 49.880 46.954 75.590 151.211 174.025 208.858
Accumulated Surplus / Deficit 61.180 49.880 46.954 75.590 151.211 174.025
Surplus / Deficit of the year -11.300 -2.926 28.636 75.621 22.814 34.833
Total MSFB reserves 109.880 106.954 135.590 211.211 234.025 268.858
6
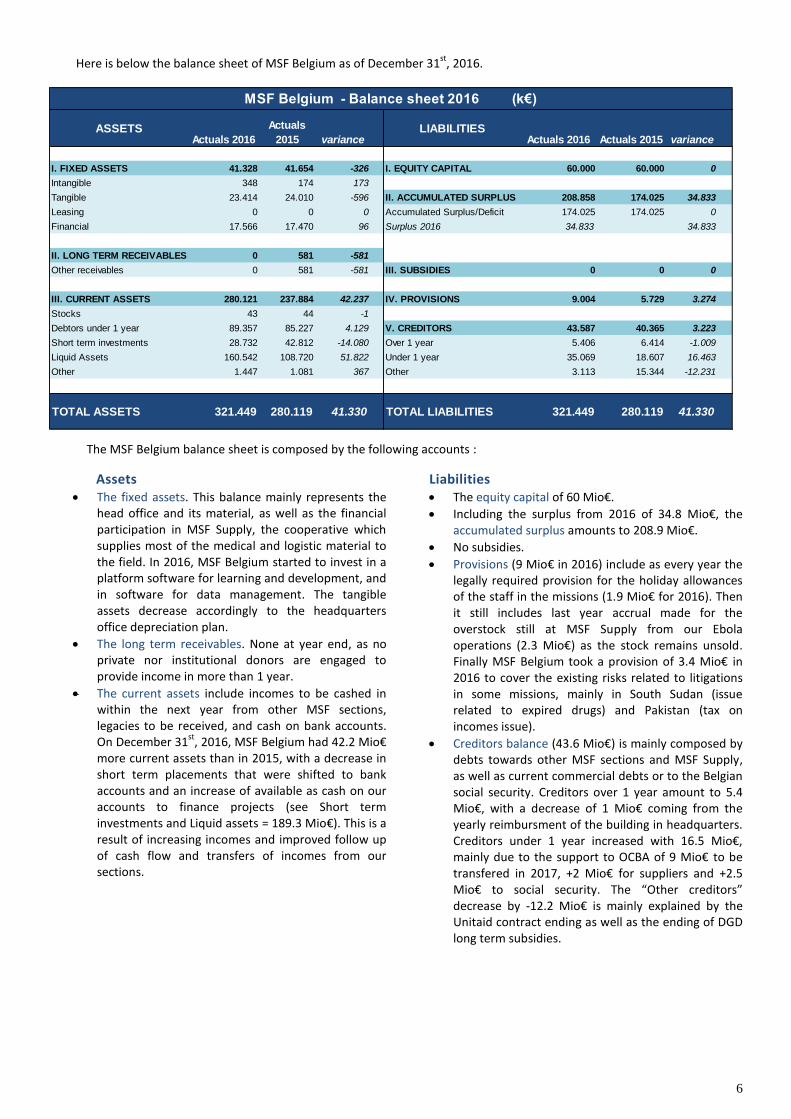
Here is below the balance sheet of MSF Belgium as of December 31st
, 2016.
ASSETSActuals 2016
Actuals
2015 varianceLIABILITIES
Actuals 2016 Actuals 2015 variance
I. FIXED ASSETS 41.328 41.654 -326 I. EQUITY CAPITAL 60.000 60.000 0
Intangible 348 174 173
Tangible 23.414 24.010 -596 II. ACCUMULATED SURPLUS 208.858 174.025 34.833
Leasing 0 0 0 Accumulated Surplus/Deficit 174.025 174.025 0
Financial 17.566 17.470 96 Surplus 2016 34.833 34.833
II. LONG TERM RECEIVABLES 0 581 -581
Other receivables 0 581 -581 III. SUBSIDIES 0 0 0
III. CURRENT ASSETS 280.121 237.884 42.237 IV. PROVISIONS 9.004 5.729 3.274
Stocks 43 44 -1
Debtors under 1 year 89.357 85.227 4.129 V. CREDITORS 43.587 40.365 3.223
Short term investments 28.732 42.812 -14.080 Over 1 year 5.406 6.414 -1.009
Liquid Assets 160.542 108.720 51.822 Under 1 year 35.069 18.607 16.463
Other 1.447 1.081 367 Other 3.113 15.344 -12.231
TOTAL ASSETS 321.449 280.119 41.330 TOTAL LIABILITIES 321.449 280.119 41.330
MSF Belgium - Balance sheet 2016 (k€)
The MSF Belgium balance sheet is composed by the following accounts :
Assets The fixed assets. This balance mainly represents the
head office and its material, as well as the financial participation in MSF Supply, the cooperative which supplies most of the medical and logistic material to the field. In 2016, MSF Belgium started to invest in a platform software for learning and development, and in software for data management. The tangible assets decrease accordingly to the headquarters office depreciation plan.
The long term receivables. None at year end, as no private nor institutional donors are engaged to provide income in more than 1 year.
The current assets include incomes to be cashed in within the next year from other MSF sections, legacies to be received, and cash on bank accounts. On December 31
st, 2016, MSF Belgium had 42.2 Mio€
more current assets than in 2015, with a decrease in short term placements that were shifted to bank accounts and an increase of available as cash on our accounts to finance projects (see Short term investments and Liquid assets = 189.3 Mio€). This is a result of increasing incomes and improved follow up of cash flow and transfers of incomes from our sections.
Liabilities The equity capital of 60 Mio€.
Including the surplus from 2016 of 34.8 Mio€, the accumulated surplus amounts to 208.9 Mio€.
No subsidies.
Provisions (9 Mio€ in 2016) include as every year the legally required provision for the holiday allowances of the staff in the missions (1.9 Mio€ for 2016). Then it still includes last year accrual made for the overstock still at MSF Supply from our Ebola operations (2.3 Mio€) as the stock remains unsold. Finally MSF Belgium took a provision of 3.4 Mio€ in 2016 to cover the existing risks related to litigations in some missions, mainly in South Sudan (issue related to expired drugs) and Pakistan (tax on incomes issue).
Creditors balance (43.6 Mio€) is mainly composed by debts towards other MSF sections and MSF Supply, as well as current commercial debts or to the Belgian social security. Creditors over 1 year amount to 5.4 Mio€, with a decrease of 1 Mio€ coming from the yearly reimbursment of the building in headquarters. Creditors under 1 year increased with 16.5 Mio€, mainly due to the support to OCBA of 9 Mio€ to be transfered in 2017, +2 Mio€ for suppliers and +2.5 Mio€ to social security. The “Other creditors” decrease by -12.2 Mio€ is mainly explained by the Unitaid contract ending as well as the ending of DGD long term subsidies.
7
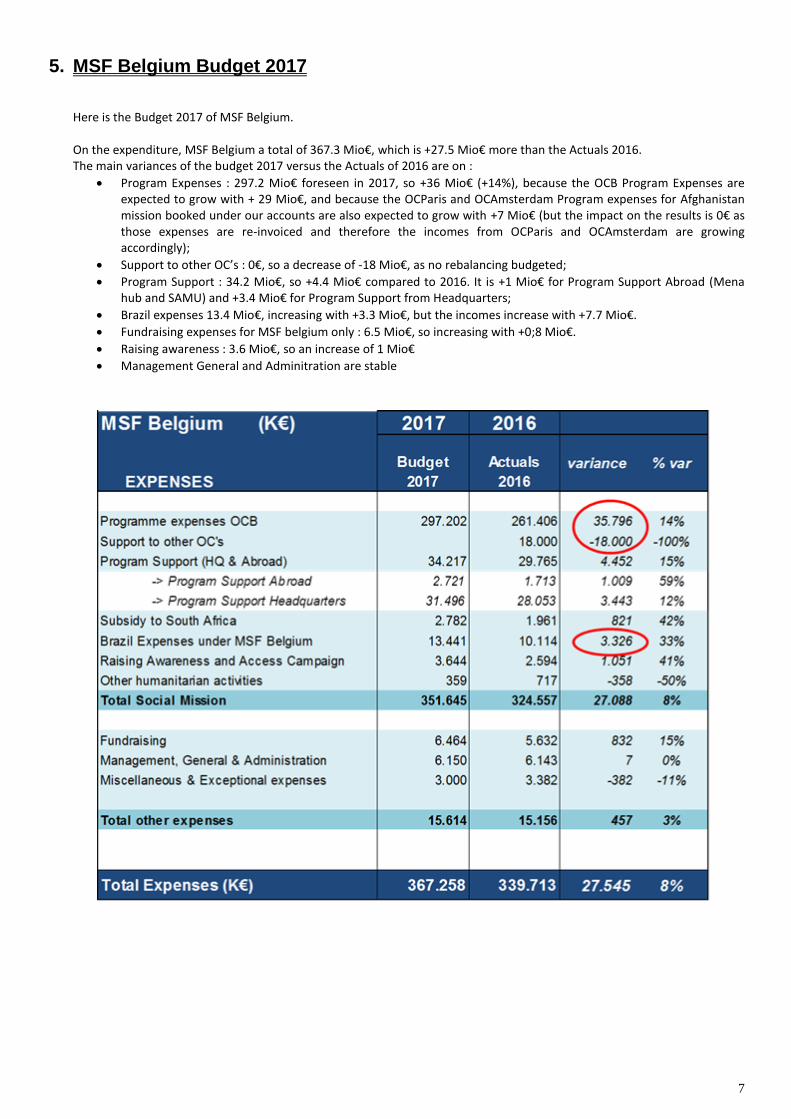
5. MSF Belgium Budget 2017
Here is the Budget 2017 of MSF Belgium. On the expenditure, MSF Belgium a total of 367.3 Mio€, which is +27.5 Mio€ more than the Actuals 2016. The main variances of the budget 2017 versus the Actuals of 2016 are on :
Program Expenses : 297.2 Mio€ foreseen in 2017, so +36 Mio€ (+14%), because the OCB Program Expenses are expected to grow with + 29 Mio€, and because the OCParis and OCAmsterdam Program expenses for Afghanistan mission booked under our accounts are also expected to grow with +7 Mio€ (but the impact on the results is 0€ as those expenses are re-invoiced and therefore the incomes from OCParis and OCAmsterdam are growing accordingly);
Support to other OC’s : 0€, so a decrease of -18 Mio€, as no rebalancing budgeted;
Program Support : 34.2 Mio€, so +4.4 Mio€ compared to 2016. It is +1 Mio€ for Program Support Abroad (Mena hub and SAMU) and +3.4 Mio€ for Program Support from Headquarters;
Brazil expenses 13.4 Mio€, increasing with +3.3 Mio€, but the incomes increase with +7.7 Mio€.
Fundraising expenses for MSF belgium only : 6.5 Mio€, so increasing with +0;8 Mio€.
Raising awareness : 3.6 Mio€, so an increase of 1 Mio€
Management General and Adminitration are stable
8
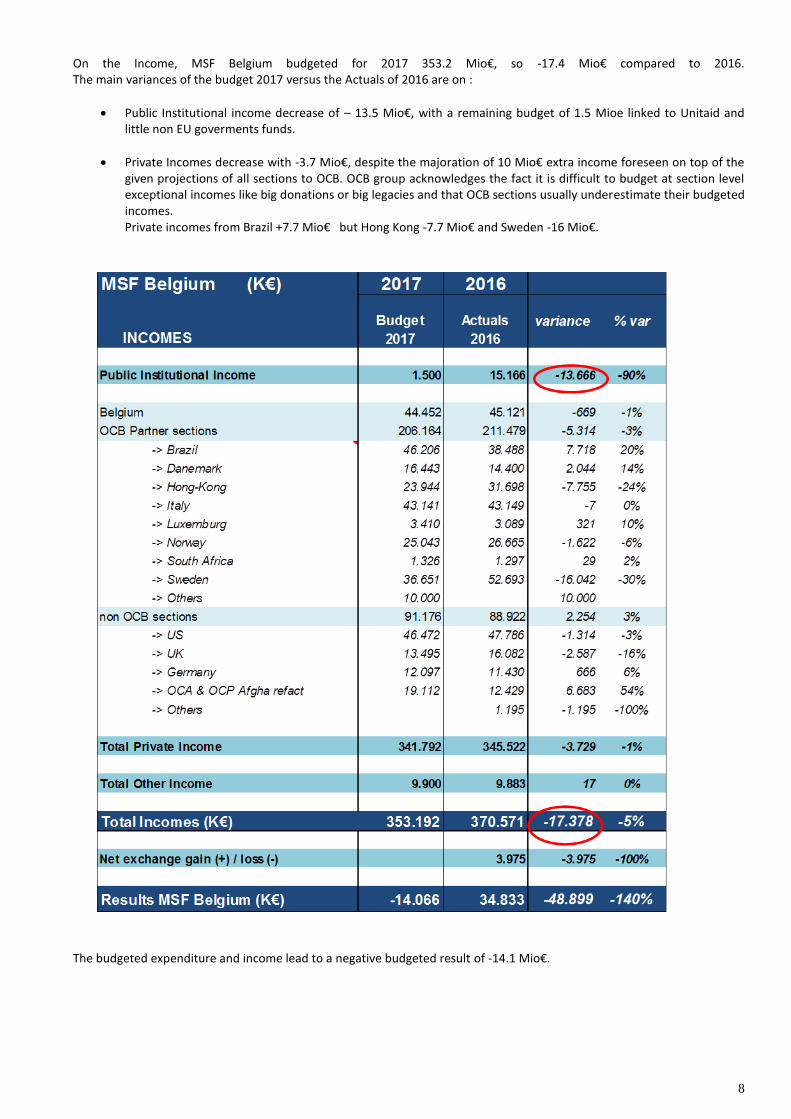
On the Income, MSF Belgium budgeted for 2017 353.2 Mio€, so -17.4 Mio€ compared to 2016. The main variances of the budget 2017 versus the Actuals of 2016 are on :
Public Institutional income decrease of – 13.5 Mio€, with a remaining budget of 1.5 Mioe linked to Unitaid and little non EU goverments funds.
Private Incomes decrease with -3.7 Mio€, despite the majoration of 10 Mio€ extra income foreseen on top of the given projections of all sections to OCB. OCB group acknowledges the fact it is difficult to budget at section level exceptional incomes like big donations or big legacies and that OCB sections usually underestimate their budgeted incomes. Private incomes from Brazil +7.7 Mio€ but Hong Kong -7.7 Mio€ and Sweden -16 Mio€.
The budgeted expenditure and income lead to a negative budgeted result of -14.1 Mio€.
9
6. OCB Results 2016 and indicators OCB profit and loss accounts should not be approved by the General Assembly and are provided for information only. They are similar on many points with MSF Belgium accounts. Presenting OCB group combined accounts enable to view the total incomes and the total costs of all OCB sections (not possible when we look at the MSF Belgium accounts only) and therefore enable to follow OCB’s Social mission and London ratio’s with more sense than looking at them through MSF Belgium perspective. The main differences lie in the facts that:
HQ expenses of partner sections are included in the combined OCB accounts (for example fundraising expenses, program support and office costs of OCB sections are not included in MSF Belgium legal accounts, but they are in the combined OCB accounts);
Private income raised from partner sections are shown as 100% under the incomes, whereas under MSF Belgium accounts it is only the net incomes (net incomes = partner section incomes less its expenses)
as defined and agreed within the Resources Sharing Agreement III at MSF movement level, Operational Center Amsterdam (OCA) received in 2016 20% from Sweden‘s net income plus 30% from Hong Kong’s net income. And Operational Center Barcelona (OCBa) received in 2016 20% from Norway‘s net income (this is new since 2016). This amount is mentioned under OCB social mission expenses as Support to other OC’s & 3
rd parties, whereas in
MSF Belgium accounts it does not appear;
as it is a consolidation view the inter-sections flows are eliminated, i.e. inter-sections re-invoicing, inter-OCB sections grants (ex. South Africa subsidy);
During 2016 it was decided at international level to change MSf accounting rules and to adopt the Swiss GAAP FER/RPC generally accepted accounting principles. The main effect of this change is related to the income recognition for legacies and bequests : as from 2016 incomes are accounted for at their best estimated amount when legally transferred to MSF. At OCB level, the financial impact of the migration to Swiss GAAP FER/RPC is 9.6 Mio€ on the incomes of 2016, as OCB sections recognised all in 2016 prior years legacies that were still not cashed in : Italy for 4.7 Mio€, Denmark for 2 Mio€, Sweden for 2.5 Mio€ and Norway for 0.5 Mio€.
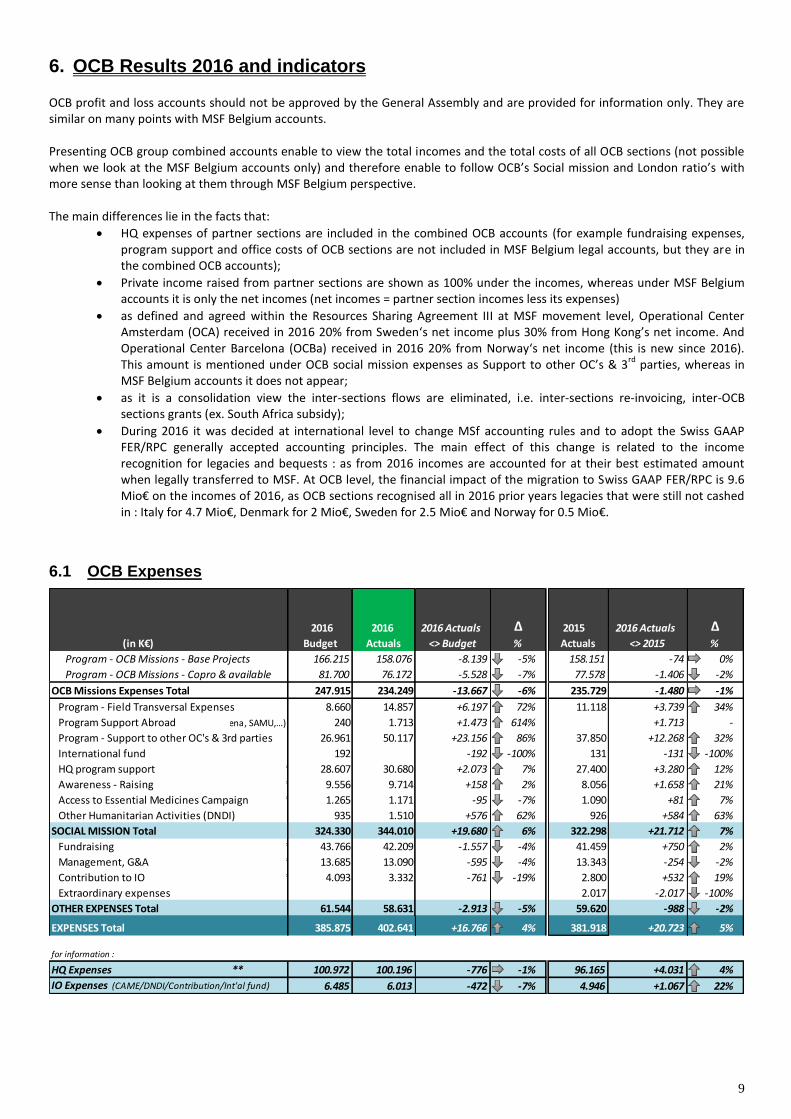
6.1 OCB Expenses
(in K€)
2016
Budget
2016
Actuals
2016 Actuals
<> Budget
Δ%
2015
Actuals
2016 Actuals
<> 2015
Δ%
Program - OCB Missions - Base Projects 166.215 158.076 -8.139 -5% 158.151 -74 0%
Program - OCB Missions - Copro & available 81.700 76.172 -5.528 -7% 77.578 -1.406 -2%
OCB Missions Expenses Total 247.915 234.249 -13.667 -6% 235.729 -1.480 -1%
Program - Field Transversal Expenses 8.660 14.857 +6.197 72% 11.118 +3.739 34%
Program Support Abroad (Mena, SAMU,…) 240 1.713 +1.473 614% +1.713 -
Program - Support to other OC's & 3rd parties 26.961 50.117 +23.156 86% 37.850 +12.268 32%
International fund 192 -192 -100% 131 -131 -100%
HQ program support ** 28.607 30.680 +2.073 7% 27.400 +3.280 12%
Awareness - Raising ** 9.556 9.714 +158 2% 8.056 +1.658 21%
Access to Essential Medicines Campaign ** 1.265 1.171 -95 -7% 1.090 +81 7%
Other Humanitarian Activities (DNDI) 935 1.510 +576 62% 926 +584 63%
SOCIAL MISSION Total 324.330 344.010 +19.680 6% 322.298 +21.712 7%
Fundraising ** 43.766 42.209 -1.557 -4% 41.459 +750 2%
Management, G&A ** 13.685 13.090 -595 -4% 13.343 -254 -2%
Contribution to IO ** 4.093 3.332 -761 -19% 2.800 +532 19%
Extraordinary expenses 2.017 -2.017 -100%
OTHER EXPENSES Total 61.544 58.631 -2.913 -5% 59.620 -988 -2%
EXPENSES Total 385.875 402.641 +16.766 4% 381.918 +20.723 5%
for information :
HQ Expenses ** 100.972 100.196 -776 -1% 96.165 +4.031 4%
IO Expenses (CAME/DNDI/Contribution/Int'al fund) 6.485 6.013 -472 -7% 4.946 +1.067 22%
10
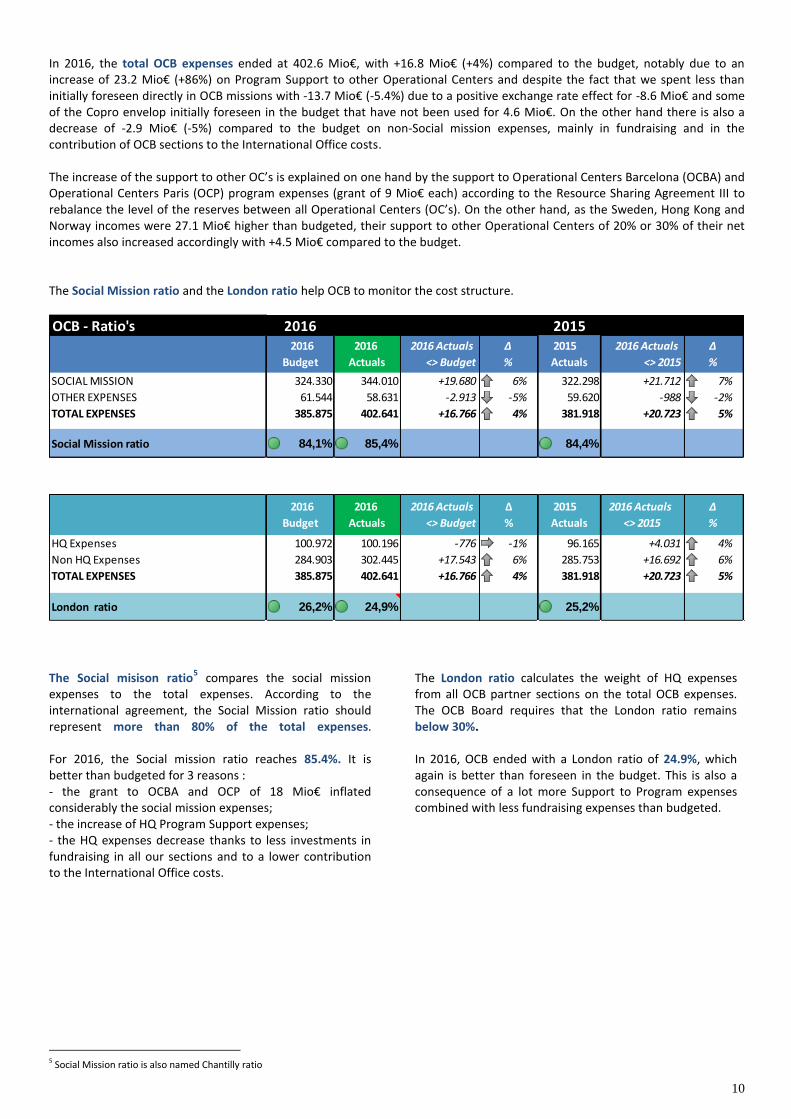
In 2016, the total OCB expenses ended at 402.6 Mio€, with +16.8 Mio€ (+4%) compared to the budget, notably due to an increase of 23.2 Mio€ (+86%) on Program Support to other Operational Centers and despite the fact that we spent less than initially foreseen directly in OCB missions with -13.7 Mio€ (-5.4%) due to a positive exchange rate effect for -8.6 Mio€ and some of the Copro envelop initially foreseen in the budget that have not been used for 4.6 Mio€. On the other hand there is also a decrease of -2.9 Mio€ (-5%) compared to the budget on non-Social mission expenses, mainly in fundraising and in the contribution of OCB sections to the International Office costs. The increase of the support to other OC’s is explained on one hand by the support to Operational Centers Barcelona (OCBA) and Operational Centers Paris (OCP) program expenses (grant of 9 Mio€ each) according to the Resource Sharing Agreement III to rebalance the level of the reserves between all Operational Centers (OC’s). On the other hand, as the Sweden, Hong Kong and Norway incomes were 27.1 Mio€ higher than budgeted, their support to other Operational Centers of 20% or 30% of their net incomes also increased accordingly with +4.5 Mio€ compared to the budget. The Social Mission ratio and the London ratio help OCB to monitor the cost structure.
OCB - Ratio's 2016 2015 2016
Budget
2016
Actuals
2016 Actuals
<> Budget
Δ
%
2015
Actuals
2016 Actuals
<> 2015
Δ
%
SOCIAL MISSION 324.330 344.010 +19.680 6% 322.298 +21.712 7%
OTHER EXPENSES 61.544 58.631 -2.913 -5% 59.620 -988 -2%
TOTAL EXPENSES 385.875 402.641 +16.766 4% 381.918 +20.723 5%
Social Mission ratio 84,1% 85,4% 84,4%
2016
Budget
2016
Actuals
2016 Actuals
<> Budget
Δ
%
2015
Actuals
2016 Actuals
<> 2015
Δ
%
HQ Expenses 100.972 100.196 -776 -1% 96.165 +4.031 4%
Non HQ Expenses 284.903 302.445 +17.543 6% 285.753 +16.692 6%
TOTAL EXPENSES 385.875 402.641 +16.766 4% 381.918 +20.723 5%
London ratio 26,2% 24,9% 25,2%
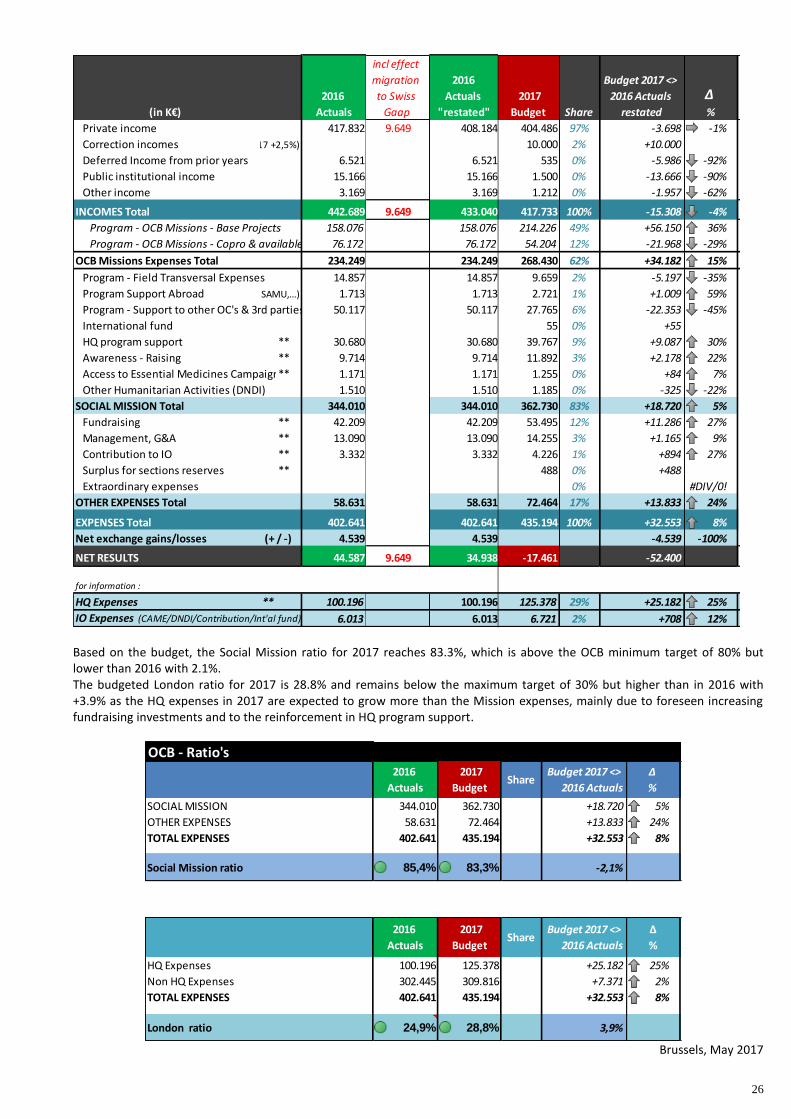
The Social misison ratio
5 compares the social mission
expenses to the total expenses. According to the international agreement, the Social Mission ratio should represent more than 80% of the total expenses. For 2016, the Social mission ratio reaches 85.4%. It is better than budgeted for 3 reasons : - the grant to OCBA and OCP of 18 Mio€ inflated considerably the social mission expenses; - the increase of HQ Program Support expenses; - the HQ expenses decrease thanks to less investments in fundraising in all our sections and to a lower contribution to the International Office costs.
5 Social Mission ratio is also named Chantilly ratio
The London ratio calculates the weight of HQ expenses from all OCB partner sections on the total OCB expenses. The OCB Board requires that the London ratio remains below 30%. In 2016, OCB ended with a London ratio of 24.9%, which again is better than foreseen in the budget. This is also a consequence of a lot more Support to Program expenses combined with less fundraising expenses than budgeted.
11
6.1.1 Operational Field Expenses in 2016
K€
2016
Budget
2016
Actuals
2016 Actuals
<> Budget
Δ
%
2015
Actuals
2016 Actuals
<> 2015
Δ
%
Program - OCB Missions - Base Projects 166.215 158.076 -8.139 -5% 158.151 -74 0%
Program - OCB Missions - Copro & available 81.700 76.172 -5.528 -7% 77.578 -1.406 -2%
OCB Missions Direct Costs Total 247.915 234.249 -13.667 -6% 235.729 -1.480 -1%
Program - Field Transversal Expenses 8.660 14.857 +6.197 72% 11.118 +3.739 34%
TOTAL Field Expenses 256.575 249.105 -7.470 -3% 246.847 +2.259 1%
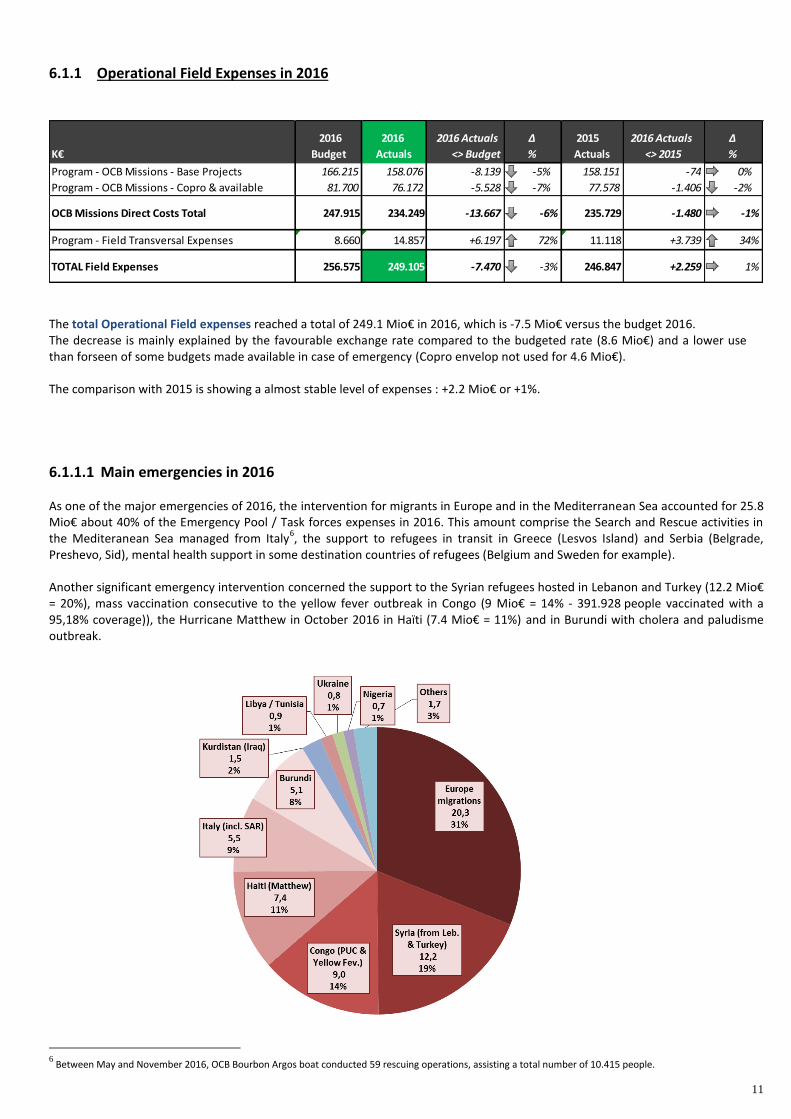
The total Operational Field expenses reached a total of 249.1 Mio€ in 2016, which is -7.5 Mio€ versus the budget 2016. The decrease is mainly explained by the favourable exchange rate compared to the budgeted rate (8.6 Mio€) and a lower use than forseen of some budgets made available in case of emergency (Copro envelop not used for 4.6 Mio€). The comparison with 2015 is showing a almost stable level of expenses : +2.2 Mio€ or +1%.
6.1.1.1 Main emergencies in 2016 As one of the major emergencies of 2016, the intervention for migrants in Europe and in the Mediterranean Sea accounted for 25.8 Mio€ about 40% of the Emergency Pool / Task forces expenses in 2016. This amount comprise the Search and Rescue activities in the Mediteranean Sea managed from Italy
6, the support to refugees in transit in Greece (Lesvos Island) and Serbia (Belgrade,
Preshevo, Sid), mental health support in some destination countries of refugees (Belgium and Sweden for example). Another significant emergency intervention concerned the support to the Syrian refugees hosted in Lebanon and Turkey (12.2 Mio€ = 20%), mass vaccination consecutive to the yellow fever outbreak in Congo (9 Mio€ = 14% - 391.928 people vaccinated with a 95,18% coverage)), the Hurricane Matthew in October 2016 in Haïti (7.4 Mio€ = 11%) and in Burundi with cholera and paludisme outbreak.
6 Between May and November 2016, OCB Bourbon Argos boat conducted 59 rescuing operations, assisting a total number of 10.415 people.
12
6.1.1.2 Stable projects vs Emergencies
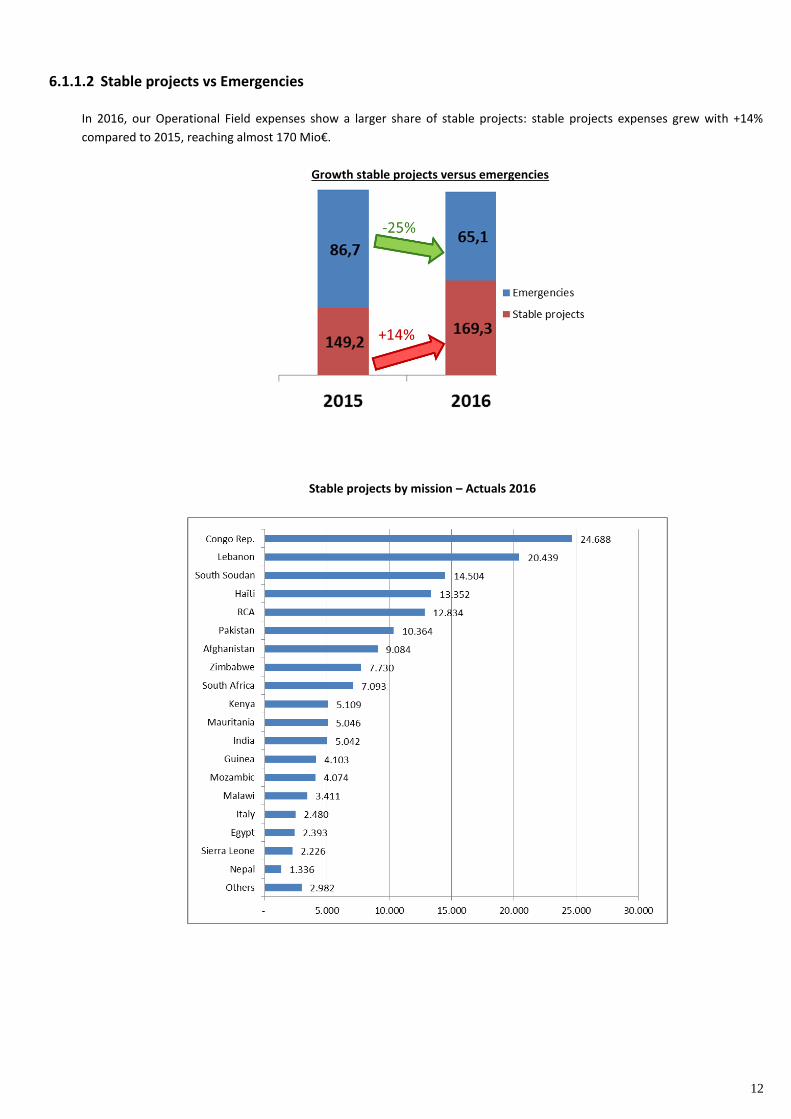
In 2016, our Operational Field expenses show a larger share of stable projects: stable projects expenses grew with +14%
compared to 2015, reaching almost 170 Mio€.
Growth stable projects versus emergencies
Stable projects by mission – Actuals 2016
13
6.1.1.3 Programme expenses broken down by nature
Programme expenses can be categorized by the nature of the costs as follow :
- Expatriates (XPT) costs include salaries, per diem, health and pension insurances;
- National staff (NST) costs include the salaries and employer’s taxes of MSF staff under local contract and well as the cost of
national MOH staff partially paid by MSF;
- Medical purchases (MED) include purchase of drugs, vaccines, small medical supplies, laboratory supplies and equipment,
medical equipment, etc.;
- Logistics costs (LOG) include purchase of all logistic equipment, material, supplies and services (purchase and rental of cars
and other means of transportation, spare parts, fuel, non-food relief items and temporary shelters distributed to
beneficiaries, construction material, equipment and subcontracted construction works, IT and communication equipment
and costs, water and sanitation material & equipment, etc.;
- Supply costs (SPL) include international (air and sea) and local freight costs as well as local custom taxes and clearance
costs;
- Administration costs (ADM) include rental and maintenance of premises (including accommodation for expatriates, rental
of offices, warehouses and other facilities) including utilities, stationaries and small supplies, international and domestic
travel costs, daily workers, local taxes, professional services.
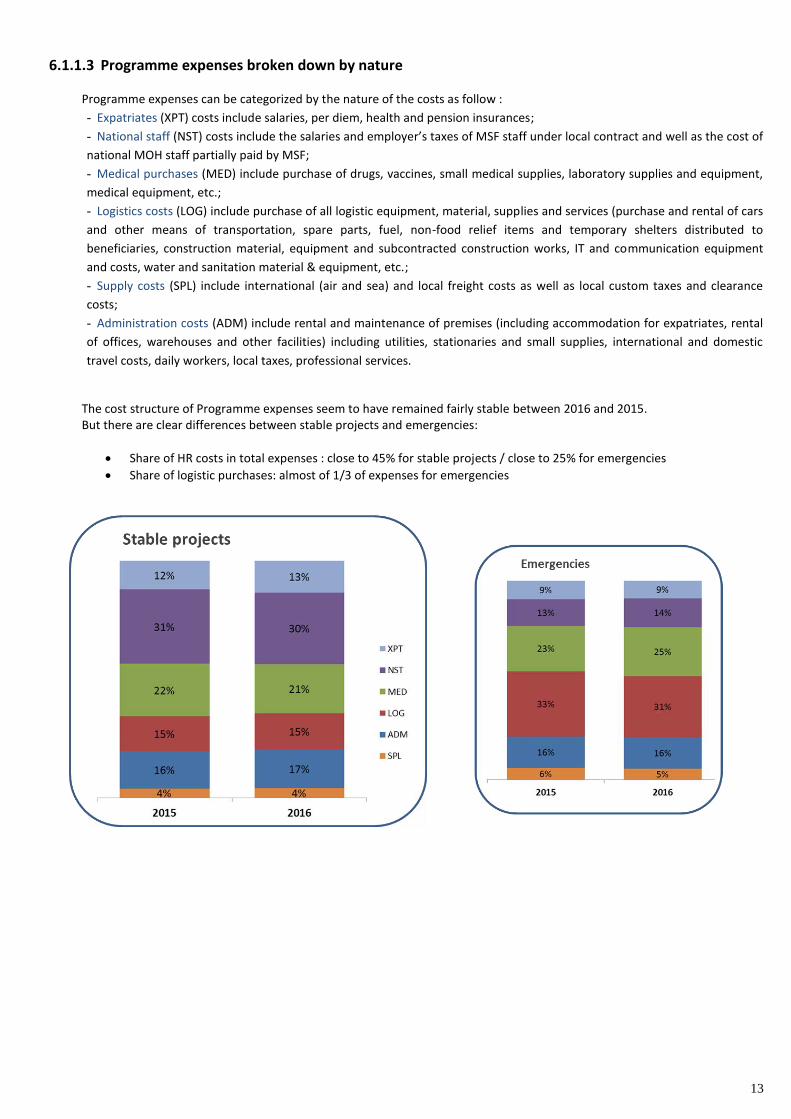
The cost structure of Programme expenses seem to have remained fairly stable between 2016 and 2015. But there are clear differences between stable projects and emergencies:
Share of HR costs in total expenses : close to 45% for stable projects / close to 25% for emergencies
Share of logistic purchases: almost of 1/3 of expenses for emergencies
14
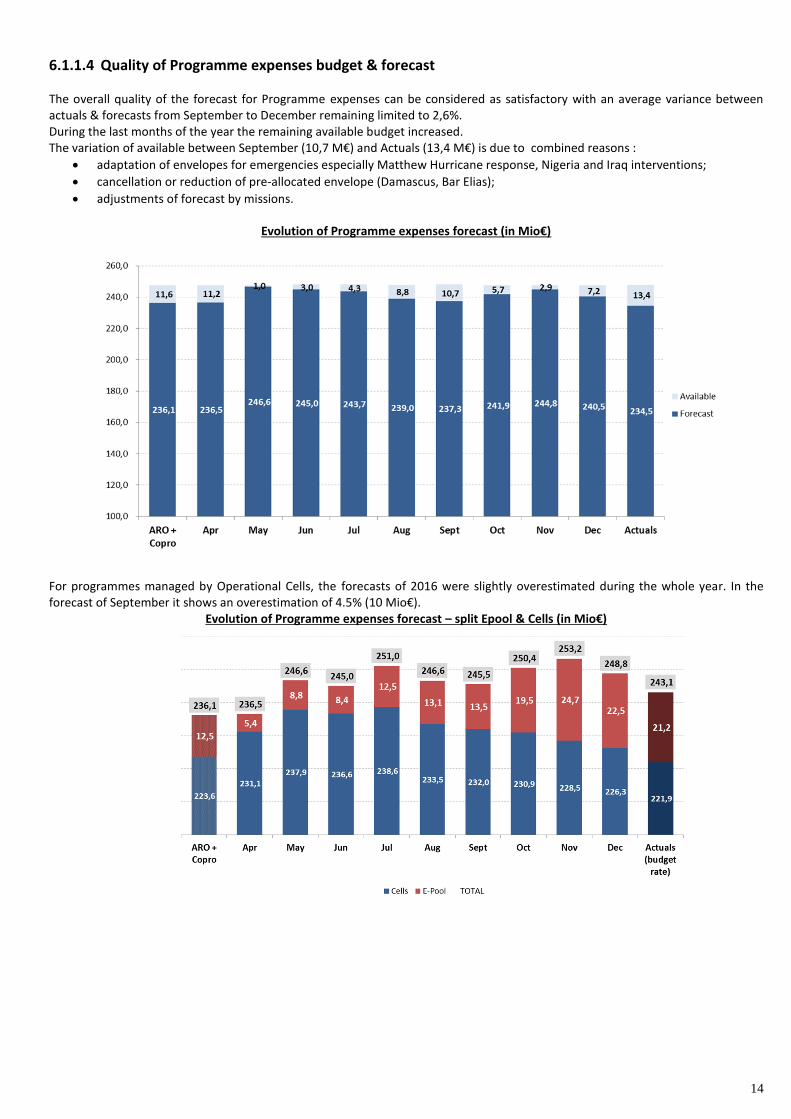
6.1.1.4 Quality of Programme expenses budget & forecast The overall quality of the forecast for Programme expenses can be considered as satisfactory with an average variance between actuals & forecasts from September to December remaining limited to 2,6%. During the last months of the year the remaining available budget increased. The variation of available between September (10,7 M€) and Actuals (13,4 M€) is due to combined reasons :
adaptation of envelopes for emergencies especially Matthew Hurricane response, Nigeria and Iraq interventions;
cancellation or reduction of pre-allocated envelope (Damascus, Bar Elias);
adjustments of forecast by missions.
Evolution of Programme expenses forecast (in Mio€)
For programmes managed by Operational Cells, the forecasts of 2016 were slightly overestimated during the whole year. In the forecast of September it shows an overestimation of 4.5% (10 Mio€).
Evolution of Programme expenses forecast – split Epool & Cells (in Mio€)
15
6.1.1.5 OCB operations context and beneficiaries7
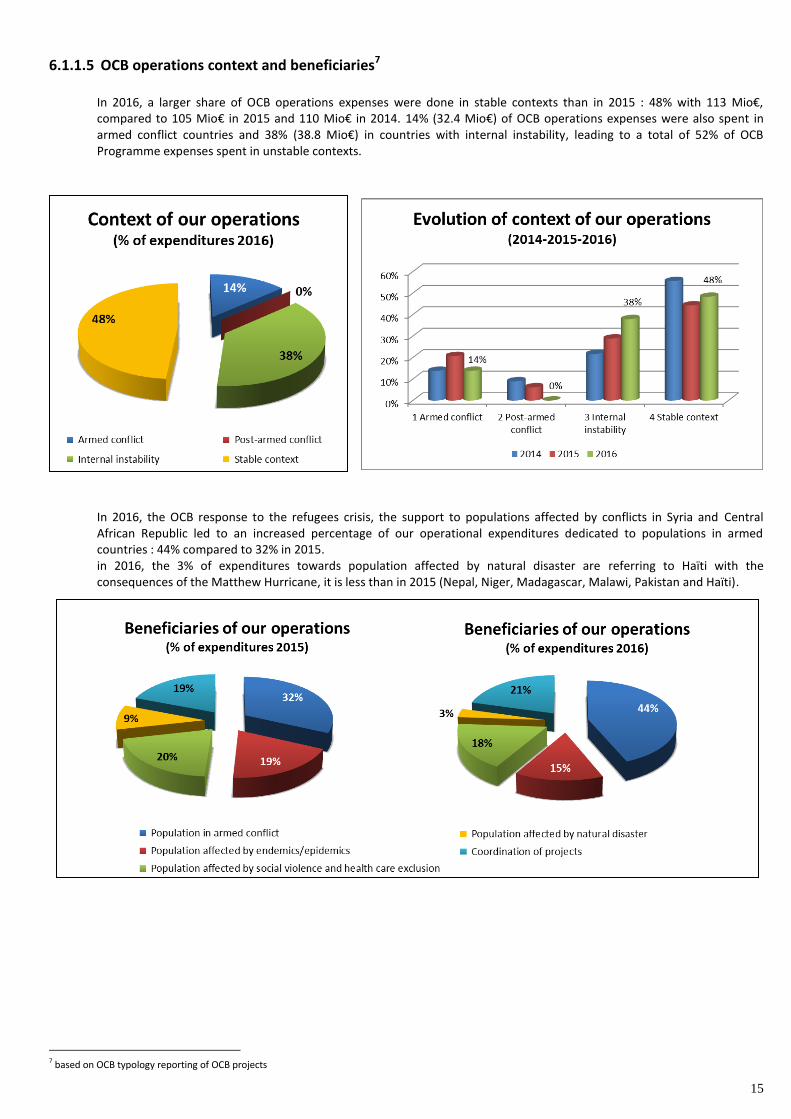
In 2016, a larger share of OCB operations expenses were done in stable contexts than in 2015 : 48% with 113 Mio€, compared to 105 Mio€ in 2015 and 110 Mio€ in 2014. 14% (32.4 Mio€) of OCB operations expenses were also spent in armed conflict countries and 38% (38.8 Mio€) in countries with internal instability, leading to a total of 52% of OCB Programme expenses spent in unstable contexts.
In 2016, the OCB response to the refugees crisis, the support to populations affected by conflicts in Syria and Central African Republic led to an increased percentage of our operational expenditures dedicated to populations in armed countries : 44% compared to 32% in 2015. in 2016, the 3% of expenditures towards population affected by natural disaster are referring to Haïti with the consequences of the Matthew Hurricane, it is less than in 2015 (Nepal, Niger, Madagascar, Malawi, Pakistan and Haïti).
7 based on OCB typology reporting of OCB projects
16
6.1.2 HQ expenses breakdown evolution
Expense type
2015
Actuals
2016
Budget
2016
Actuals
Actuals 2016 <>
Budget 2016 % EUR
Actuals 2016 <>
Actuals 2015 % EUR
HQ program support 27.400 28.607 30.680 2.073 7% 3.280 12%
Awareness - Raising 8.056 9.556 9.714 158 2% 1.658 21%
Access to Essential Medicines Campaign 1.090 1.265 1.171 -95 -7% 81 7%
Fundraising 41.459 43.766 42.209 -1.557 -4% 750 2%
Management, G&A 13.343 13.685 13.090 -595 -4% -254 -2%
Contribution to IO 2.800 4.093 3.332 -761 -19% 532 19%
Extraordinary expenses 2.017 - -2.017 -100%
HQ Expenses Total OCB 96.165 100.972 100.196 -776 -1% 4.031 4%
Non FR Total OCB 54.706 57.206 57.986 781 1% 3.281 6%
FR Total OCB 41.459 43.766 42.209 -1.557 -4% 750 2%
HQ Expenses Total OCB 96.165 100.972 100.196 -776 -1% 4.031 4%
Expense type
2015
Actuals
2016
Budget
2016
Actuals
Actuals 2016 <>
Budget 2016 % EUR
Actuals 2016 <>
Actuals 2015 % EUR
HQ program support 27.400 28.607 30.680 2.073 7% 3.280 12%
Awareness - Raising 8.056 9.556 9.714 158 2% 1.658 21%
Access to Essential Medicines Campaign 1.090 1.265 1.171 -95 -7% 81 7%
Fundraising 41.459 43.766 42.209 -1.557 -4% 750 2%
Management, G&A 13.343 13.685 13.090 -595 -4% -254 -2%
Contribution to IO 2.800 4.093 3.332 -761 -19% 532 19%
Extraordinary expenses 2.017 - -2.017 -100%
HQ Expenses Total OCB 96.165 100.972 100.196 -776 -1% 4.031 4%
Non FR Total OCB 54.706 57.206 57.986 781 1% 3.281 6%
FR Total OCB 41.459 43.766 42.209 -1.557 -4% 750 2%
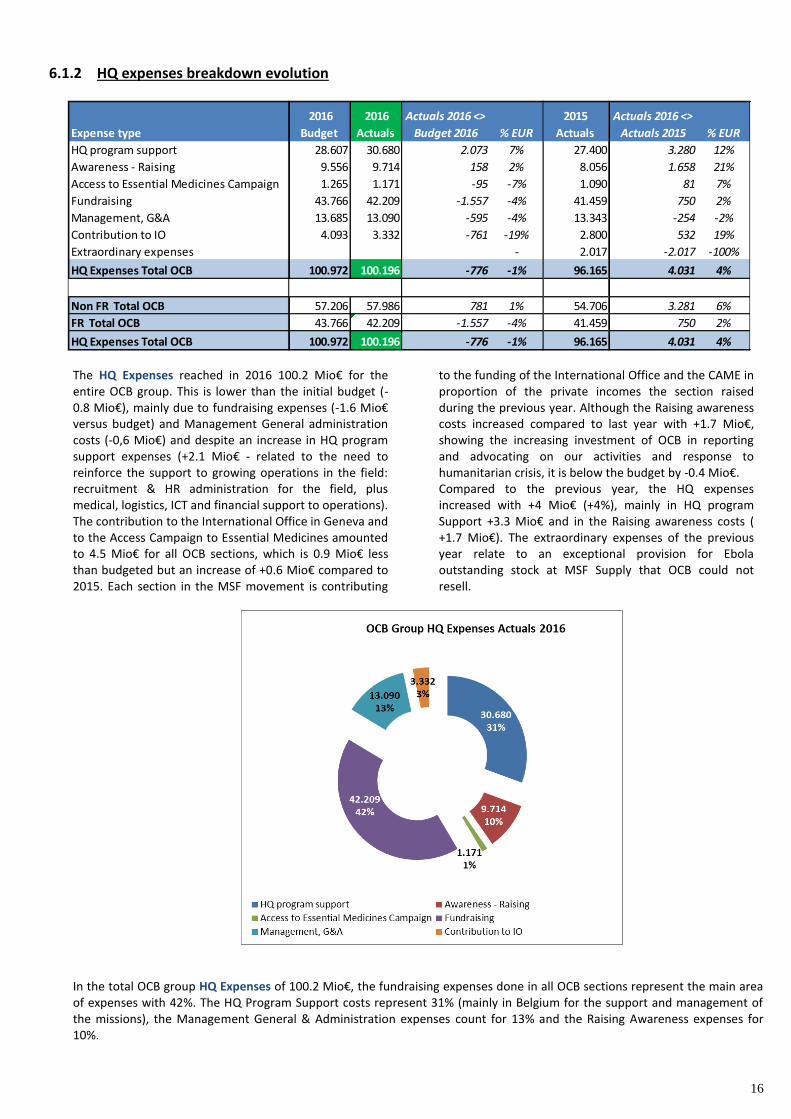
HQ Expenses Total OCB 96.165 100.972 100.196 -776 -1% 4.031 4% The HQ Expenses reached in 2016 100.2 Mio€ for the entire OCB group. This is lower than the initial budget (-0.8 Mio€), mainly due to fundraising expenses (-1.6 Mio€ versus budget) and Management General administration costs (-0,6 Mio€) and despite an increase in HQ program support expenses (+2.1 Mio€ - related to the need to reinforce the support to growing operations in the field: recruitment & HR administration for the field, plus medical, logistics, ICT and financial support to operations). The contribution to the International Office in Geneva and to the Access Campaign to Essential Medicines amounted to 4.5 Mio€ for all OCB sections, which is 0.9 Mio€ less than budgeted but an increase of +0.6 Mio€ compared to 2015. Each section in the MSF movement is contributing
to the funding of the International Office and the CAME in proportion of the private incomes the section raised during the previous year. Although the Raising awareness costs increased compared to last year with +1.7 Mio€, showing the increasing investment of OCB in reporting and advocating on our activities and response to humanitarian crisis, it is below the budget by -0.4 Mio€. Compared to the previous year, the HQ expenses increased with +4 Mio€ (+4%), mainly in HQ program Support +3.3 Mio€ and in the Raising awareness costs ( +1.7 Mio€). The extraordinary expenses of the previous year relate to an exceptional provision for Ebola outstanding stock at MSF Supply that OCB could not resell.
In the total OCB group HQ Expenses of 100.2 Mio€, the fundraising expenses done in all OCB sections represent the main area of expenses with 42%. The HQ Program Support costs represent 31% (mainly in Belgium for the support and management of the missions), the Management General & Administration expenses count for 13% and the Raising Awareness expenses for 10%.
17
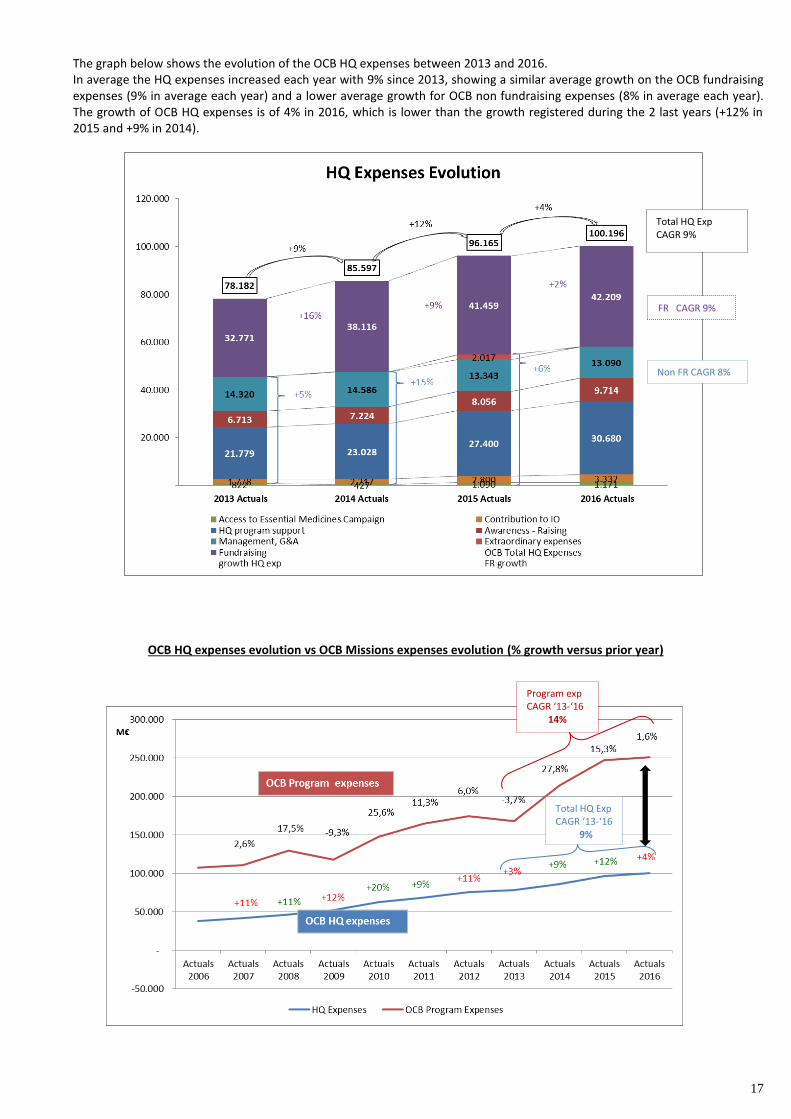
The graph below shows the evolution of the OCB HQ expenses between 2013 and 2016. In average the HQ expenses increased each year with 9% since 2013, showing a similar average growth on the OCB fundraising expenses (9% in average each year) and a lower average growth for OCB non fundraising expenses (8% in average each year). The growth of OCB HQ expenses is of 4% in 2016, which is lower than the growth registered during the 2 last years (+12% in 2015 and +9% in 2014).
OCB HQ expenses evolution vs OCB Missions expenses evolution (% growth versus prior year)
FR CAGR 9%
Non FR CAGR 8%
Total HQ Exp CAGR 9%
Total HQ Exp CAGR ‘13-‘16 9%
Program exp CAGR ‘13-‘16 14%
18
OCB tries to have a growth in HQ Expenses lower than the growth of its Program Expenses, but in 2016 the OCB Mission expenses growth was less (+1,6%) than the OCB HQ Expenses growth (+4%). When we look at the period of the last 4 years (2013 till 2016), the growth of the OCB HQ Expenses is in average each year of 9%, which still remains lower than the yearly average growth of Program expenses for the same period (+14% in average).
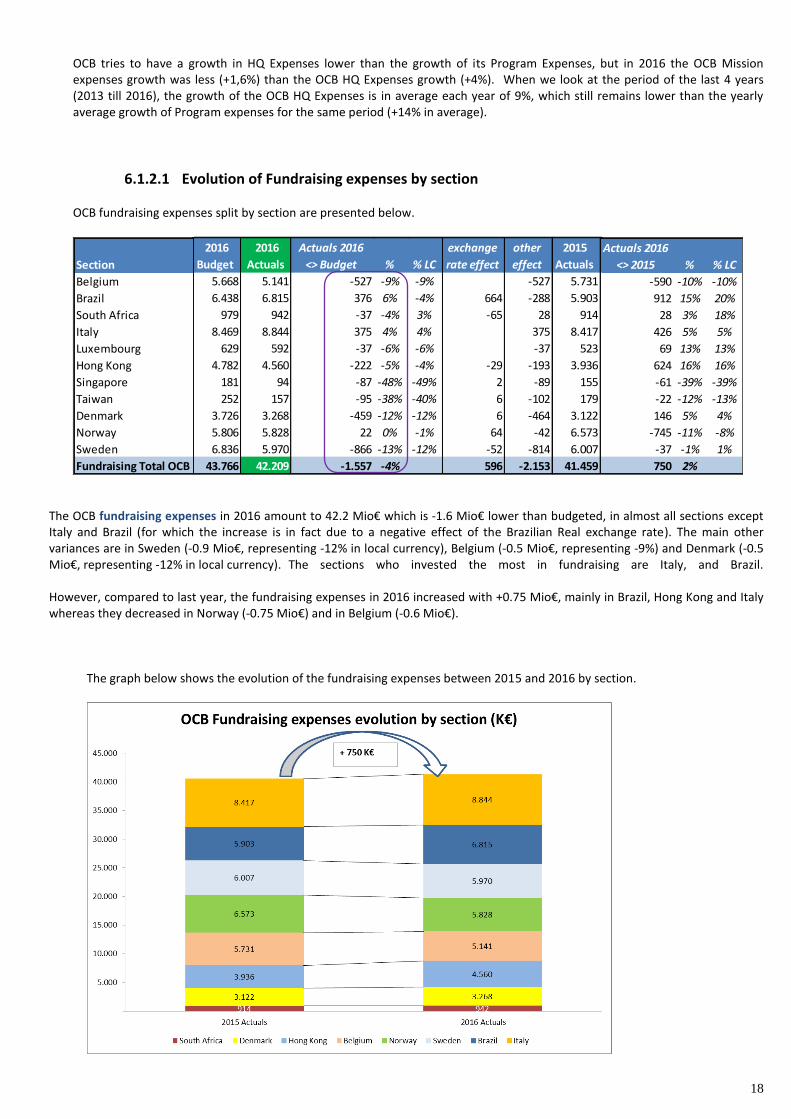
6.1.2.1 Evolution of Fundraising expenses by section
OCB fundraising expenses split by section are presented below.
Section
2015
Actuals
2016
Budget
2016
Actuals
Actuals 2016
<> Budget % % LC
exchange
rate effect
other
effect
Actuals 2016
<> 2015 % % LC
Belgium 5.731 5.668 5.141 -527 -9% -9% -527 -590 -10% -10%
Brazil 5.903 6.438 6.815 376 6% -4% 664 -288 912 15% 20%
South Africa 914 979 942 -37 -4% 3% -65 28 28 3% 18%
Italy 8.417 8.469 8.844 375 4% 4% 375 426 5% 5%
Luxembourg 523 629 592 -37 -6% -6% -37 69 13% 13%
Hong Kong 3.936 4.782 4.560 -222 -5% -4% -29 -193 624 16% 16%
Singapore 155 181 94 -87 -48% -49% 2 -89 -61 -39% -39%
Taiwan 179 252 157 -95 -38% -40% 6 -102 -22 -12% -13%
Denmark 3.122 3.726 3.268 -459 -12% -12% 6 -464 146 5% 4%
Norway 6.573 5.806 5.828 22 0% -1% 64 -42 -745 -11% -8%
Sweden 6.007 6.836 5.970 -866 -13% -12% -52 -814 -37 -1% 1%
Fundraising Total OCB 41.459 43.766 42.209 -1.557 -4% 596 -2.153 750 2%
The OCB fundraising expenses in 2016 amount to 42.2 Mio€ which is -1.6 Mio€ lower than budgeted, in almost all sections except Italy and Brazil (for which the increase is in fact due to a negative effect of the Brazilian Real exchange rate). The main other variances are in Sweden (-0.9 Mio€, representing -12% in local currency), Belgium (-0.5 Mio€, representing -9%) and Denmark (-0.5 Mio€, representing -12% in local currency). The sections who invested the most in fundraising are Italy, and Brazil. However, compared to last year, the fundraising expenses in 2016 increased with +0.75 Mio€, mainly in Brazil, Hong Kong and Italy whereas they decreased in Norway (-0.75 Mio€) and in Belgium (-0.6 Mio€).
The graph below shows the evolution of the fundraising expenses between 2015 and 2016 by section.
19
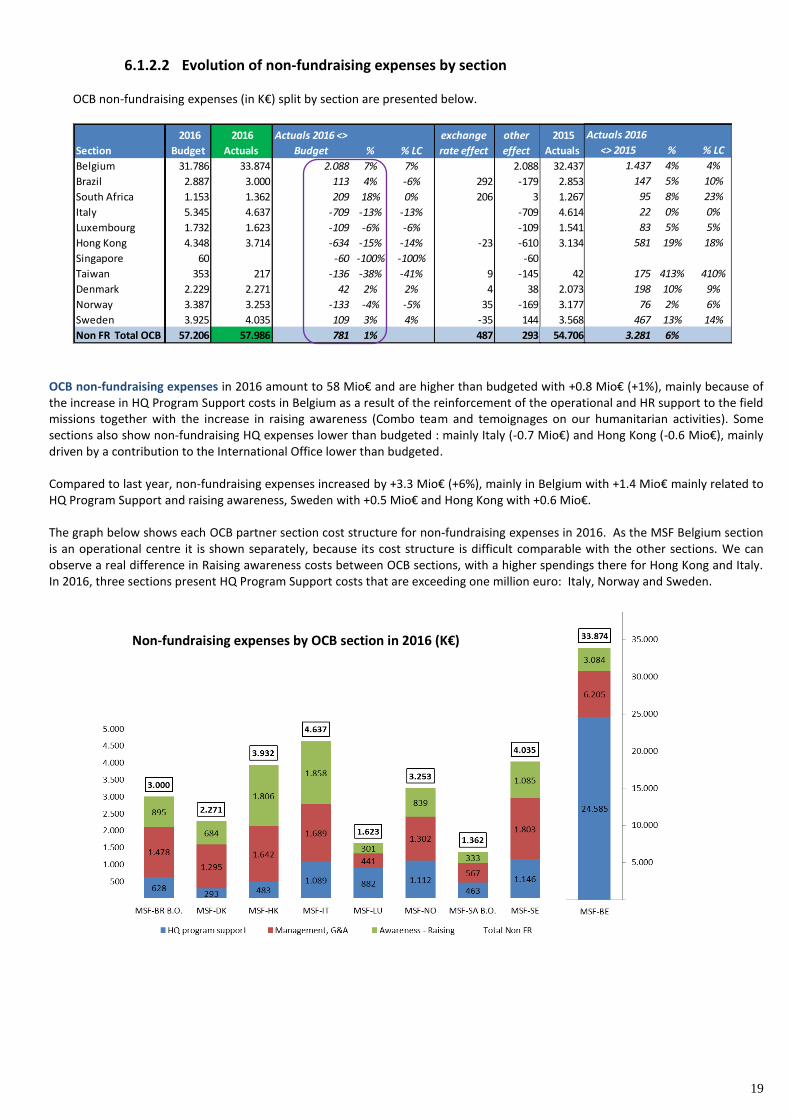
6.1.2.2 Evolution of non-fundraising expenses by section
OCB non-fundraising expenses (in K€) split by section are presented below.
Section
2015
Actuals
2016
Budget
2016
Actuals
Actuals 2016 <>
Budget % % LC
exchange
rate effect
other
effect
Actuals 2016 <>
2016 % % LC
Belgium 32.437 31.786 33.874 2.088 7% 7% 2.088 1.437 4% 4%
Brazil 2.853 2.887 3.000 113 4% -6% 292 -179 147 5% 10%
South Africa 1.267 1.153 1.362 209 18% 0% 206 3 95 8% 23%
Italy 4.614 5.345 4.637 -709 -13% -13% -709 22 0% 0%
Luxembourg 1.541 1.732 1.623 -109 -6% -6% -109 83 5% 5%
Hong Kong 3.134 4.348 3.714 -634 -15% -14% -23 -610 581 19% 18%
Singapore 60 -60 -100% -100% -60
Taiwan 42 353 217 -136 -38% -41% 9 -145 175 413% 410%
Denmark 2.073 2.229 2.271 42 2% 2% 4 38 198 10% 9%
Norway 3.177 3.387 3.253 -133 -4% -5% 35 -169 76 2% 6%
Sweden 3.568 3.925 4.035 109 3% 4% -35 144 467 13% 14%
Non FR Total OCB 54.706 57.206 57.986 781 1% 487 293 3.281 6%
Section
2015
Actuals
2016
Budget
2016
Actuals
Actuals 2016 <>
Budget % % LC
exchange
rate effect
other
effect
Actuals 2016
<> 2015 % % LC
Belgium 32.437 31.786 33.874 2.088 7% 7% 2.088 1.437 4% 4%
Brazil 2.853 2.887 3.000 113 4% -6% 292 -179 147 5% 10%
South Africa 1.267 1.153 1.362 209 18% 0% 206 3 95 8% 23%
Italy 4.614 5.345 4.637 -709 -13% -13% -709 22 0% 0%
Luxembourg 1.541 1.732 1.623 -109 -6% -6% -109 83 5% 5%
Hong Kong 3.134 4.348 3.714 -634 -15% -14% -23 -610 581 19% 18%
Singapore 60 -60 -100% -100% -60
Taiwan 42 353 217 -136 -38% -41% 9 -145 175 413% 410%
Denmark 2.073 2.229 2.271 42 2% 2% 4 38 198 10% 9%
Norway 3.177 3.387 3.253 -133 -4% -5% 35 -169 76 2% 6%
Sweden 3.568 3.925 4.035 109 3% 4% -35 144 467 13% 14%
Non FR Total OCB 54.706 57.206 57.986 781 1% 487 293 3.281 6%
OCB non-fundraising expenses in 2016 amount to 58 Mio€ and are higher than budgeted with +0.8 Mio€ (+1%), mainly because of the increase in HQ Program Support costs in Belgium as a result of the reinforcement of the operational and HR support to the field missions together with the increase in raising awareness (Combo team and temoignages on our humanitarian activities). Some sections also show non-fundraising HQ expenses lower than budgeted : mainly Italy (-0.7 Mio€) and Hong Kong (-0.6 Mio€), mainly driven by a contribution to the International Office lower than budgeted. Compared to last year, non-fundraising expenses increased by +3.3 Mio€ (+6%), mainly in Belgium with +1.4 Mio€ mainly related to HQ Program Support and raising awareness, Sweden with +0.5 Mio€ and Hong Kong with +0.6 Mio€. The graph below shows each OCB partner section cost structure for non-fundraising expenses in 2016. As the MSF Belgium section is an operational centre it is shown separately, because its cost structure is difficult comparable with the other sections. We can observe a real difference in Raising awareness costs between OCB sections, with a higher spendings there for Hong Kong and Italy. In 2016, three sections present HQ Program Support costs that are exceeding one million euro: Italy, Norway and Sweden.
Non-fundraising expenses by OCB section in 2016 (K€)
20
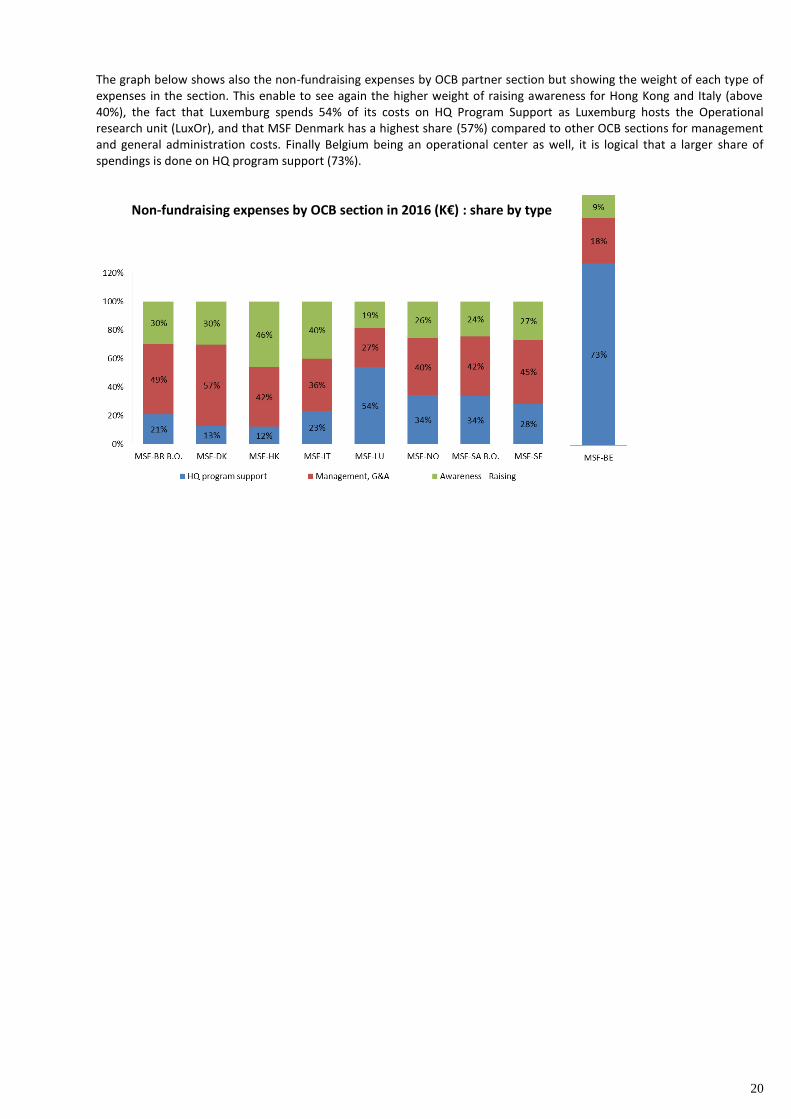
The graph below shows also the non-fundraising expenses by OCB partner section but showing the weight of each type of expenses in the section. This enable to see again the higher weight of raising awareness for Hong Kong and Italy (above 40%), the fact that Luxemburg spends 54% of its costs on HQ Program Support as Luxemburg hosts the Operational research unit (LuxOr), and that MSF Denmark has a highest share (57%) compared to other OCB sections for management and general administration costs. Finally Belgium being an operational center as well, it is logical that a larger share of spendings is done on HQ program support (73%).
Non-fundraising expenses by OCB section in 2016 (K€) : share by type
21
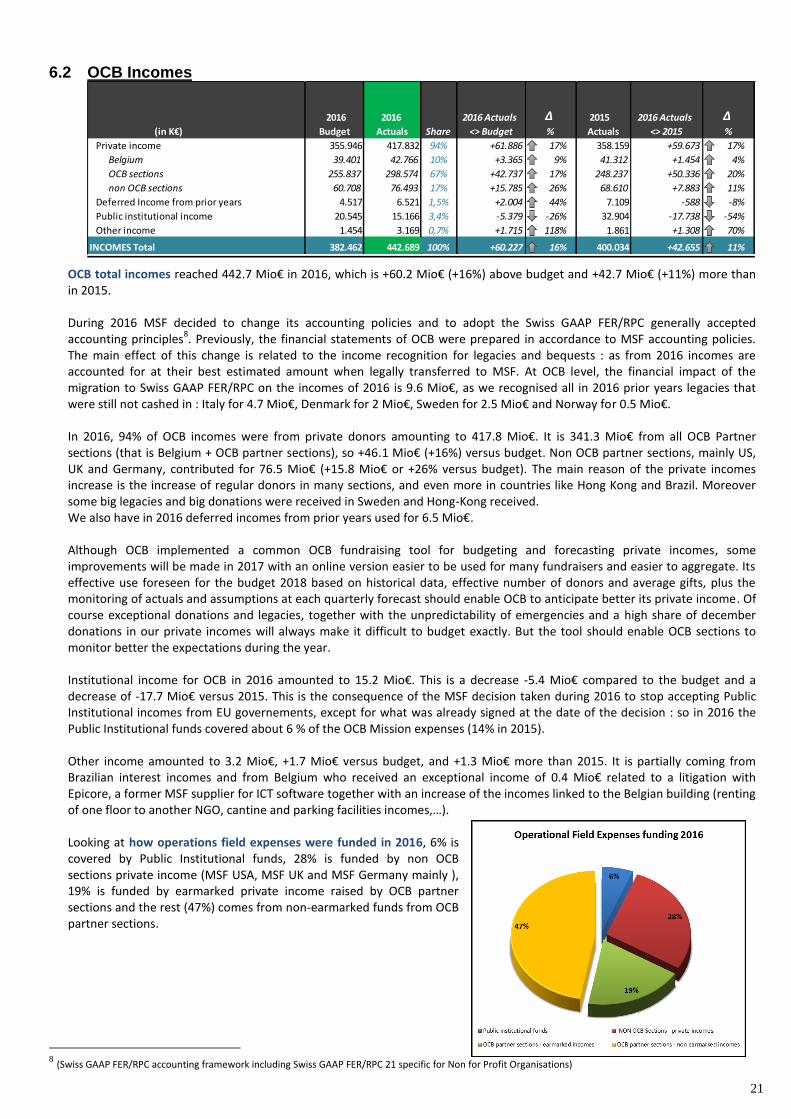
6.2 OCB Incomes
(in K€)
2016
Budget
2016
Actuals Share
2016 Actuals
<> Budget
Δ%
2015
Actuals
2016 Actuals
<> 2015
Δ%
Private income 355.946 417.832 94% +61.886 17% 358.159 +59.673 17%
Belgium 39.401 42.766 10% +3.365 9% 41.312 +1.454 4%
OCB sections 255.837 298.574 67% +42.737 17% 248.237 +50.336 20%
non OCB sections 60.708 76.493 17% +15.785 26% 68.610 +7.883 11%
Deferred Income from prior years 4.517 6.521 1,5% +2.004 44% 7.109 -588 -8%
Public institutional income 20.545 15.166 3,4% -5.379 -26% 32.904 -17.738 -54%
Other income 1.454 3.169 0,7% +1.715 118% 1.861 +1.308 70%
INCOMES Total 382.462 442.689 100% +60.227 16% 400.034 +42.655 11%
OCB total incomes reached 442.7 Mio€ in 2016, which is +60.2 Mio€ (+16%) above budget and +42.7 Mio€ (+11%) more than in 2015. During 2016 MSF decided to change its accounting policies and to adopt the Swiss GAAP FER/RPC generally accepted accounting principles
8. Previously, the financial statements of OCB were prepared in accordance to MSF accounting policies.
The main effect of this change is related to the income recognition for legacies and bequests : as from 2016 incomes are accounted for at their best estimated amount when legally transferred to MSF. At OCB level, the financial impact of the migration to Swiss GAAP FER/RPC on the incomes of 2016 is 9.6 Mio€, as we recognised all in 2016 prior years legacies that were still not cashed in : Italy for 4.7 Mio€, Denmark for 2 Mio€, Sweden for 2.5 Mio€ and Norway for 0.5 Mio€. In 2016, 94% of OCB incomes were from private donors amounting to 417.8 Mio€. It is 341.3 Mio€ from all OCB Partner sections (that is Belgium + OCB partner sections), so +46.1 Mio€ (+16%) versus budget. Non OCB partner sections, mainly US, UK and Germany, contributed for 76.5 Mio€ (+15.8 Mio€ or +26% versus budget). The main reason of the private incomes increase is the increase of regular donors in many sections, and even more in countries like Hong Kong and Brazil. Moreover some big legacies and big donations were received in Sweden and Hong-Kong received. We also have in 2016 deferred incomes from prior years used for 6.5 Mio€. Although OCB implemented a common OCB fundraising tool for budgeting and forecasting private incomes, some improvements will be made in 2017 with an online version easier to be used for many fundraisers and easier to aggregate. Its effective use foreseen for the budget 2018 based on historical data, effective number of donors and average gifts, plus the monitoring of actuals and assumptions at each quarterly forecast should enable OCB to anticipate better its private income. Of course exceptional donations and legacies, together with the unpredictability of emergencies and a high share of december donations in our private incomes will always make it difficult to budget exactly. But the tool should enable OCB sections to monitor better the expectations during the year. Institutional income for OCB in 2016 amounted to 15.2 Mio€. This is a decrease -5.4 Mio€ compared to the budget and a decrease of -17.7 Mio€ versus 2015. This is the consequence of the MSF decision taken during 2016 to stop accepting Public Institutional incomes from EU governements, except for what was already signed at the date of the decision : so in 2016 the Public Institutional funds covered about 6 % of the OCB Mission expenses (14% in 2015). Other income amounted to 3.2 Mio€, +1.7 Mio€ versus budget, and +1.3 Mio€ more than 2015. It is partially coming from Brazilian interest incomes and from Belgium who received an exceptional income of 0.4 Mio€ related to a litigation with Epicore, a former MSF supplier for ICT software together with an increase of the incomes linked to the Belgian building (renting of one floor to another NGO, cantine and parking facilities incomes,…). Looking at how operations field expenses were funded in 2016, 6% is covered by Public Institutional funds, 28% is funded by non OCB sections private income (MSF USA, MSF UK and MSF Germany mainly ), 19% is funded by earmarked private income raised by OCB partner sections and the rest (47%) comes from non-earmarked funds from OCB partner sections.
8 (Swiss GAAP FER/RPC accounting framework including Swiss GAAP FER/RPC 21 specific for Non for Profit Organisations)
22
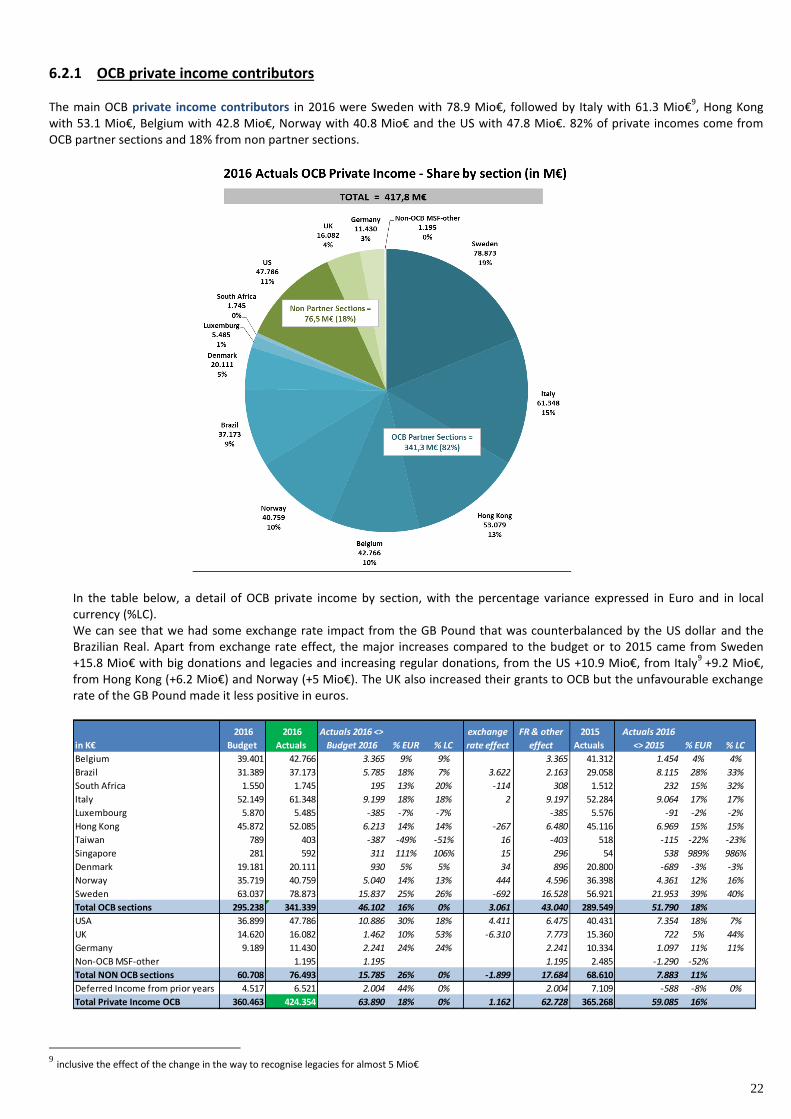
6.2.1 OCB private income contributors The main OCB private income contributors in 2016 were Sweden with 78.9 Mio€, followed by Italy with 61.3 Mio€
9, Hong Kong
with 53.1 Mio€, Belgium with 42.8 Mio€, Norway with 40.8 Mio€ and the US with 47.8 Mio€. 82% of private incomes come from OCB partner sections and 18% from non partner sections.
In the table below, a detail of OCB private income by section, with the percentage variance expressed in Euro and in local currency (%LC). We can see that we had some exchange rate impact from the GB Pound that was counterbalanced by the US dollar and the Brazilian Real. Apart from exchange rate effect, the major increases compared to the budget or to 2015 came from Sweden +15.8 Mio€ with big donations and legacies and increasing regular donations, from the US +10.9 Mio€, from Italy
9 +9.2 Mio€,
from Hong Kong (+6.2 Mio€) and Norway (+5 Mio€). The UK also increased their grants to OCB but the unfavourable exchange rate of the GB Pound made it less positive in euros.
in K€
2015
Actuals
2016
Budget
2016
Actuals
Actuals 2016 <>
Budget 2016 % EUR % LC
exchange
rate effect
FR & other
effect
Actuals 2016
<> 2015 % EUR % LC
Belgium 41.312 39.401 42.766 3.365 9% 9% 3.365 1.454 4% 4%
Brazil 29.058 31.389 37.173 5.785 18% 7% 3.622 2.163 8.115 28% 33%
South Africa 1.512 1.550 1.745 195 13% 20% -114 308 232 15% 32%
Italy 52.284 52.149 61.348 9.199 18% 18% 2 9.197 9.064 17% 17%
Luxembourg 5.576 5.870 5.485 -385 -7% -7% -385 -91 -2% -2%
Hong Kong 45.116 45.872 52.085 6.213 14% 14% -267 6.480 6.969 15% 15%
Taiwan 518 789 403 -387 -49% -51% 16 -403 -115 -22% -23%
Singapore 54 281 592 311 111% 106% 15 296 538 989% 986%
Denmark 20.800 19.181 20.111 930 5% 5% 34 896 -689 -3% -3%
Norway 36.398 35.719 40.759 5.040 14% 13% 444 4.596 4.361 12% 16%
Sweden 56.921 63.037 78.873 15.837 25% 26% -692 16.528 21.953 39% 40%
Total OCB sections 289.549 295.238 341.339 46.102 16% 0% 3.061 43.040 51.790 18%
USA 40.431 36.899 47.786 10.886 30% 18% 4.411 6.475 7.354 18% 7%
UK 15.360 14.620 16.082 1.462 10% 53% -6.310 7.773 722 5% 44%
Germany 10.334 9.189 11.430 2.241 24% 24% 2.241 1.097 11% 11%
Non-OCB MSF-other 2.485 1.195 1.195 1.195 -1.290 -52%
Total NON OCB sections 68.610 60.708 76.493 15.785 26% 0% -1.899 17.684 7.883 11%
Deferred Income from prior years 7.109 4.517 6.521 2.004 44% 0% 2.004 -588 -8% 0%
Total Private Income OCB 365.268 360.463 424.354 63.890 18% 0% 1.162 62.728 59.085 16%
9 inclusive the effect of the change in the way to recognise legacies for almost 5 Mio€
23
6.2.2 Institutional donors in 2016
2016
Budget
2016
Actuals
2016 Actuals
<> Budget
Δ
%
2015
Actuals
2016 Actuals <>
2015
Δ
%
Institutional income 20.545 15.166 -5.379 -26% 32.904 -17.738 -54%Program Expenses
incl. Field transversal & Program 247.915 250.818 +2.903 1% 246.847 +3.971 2%
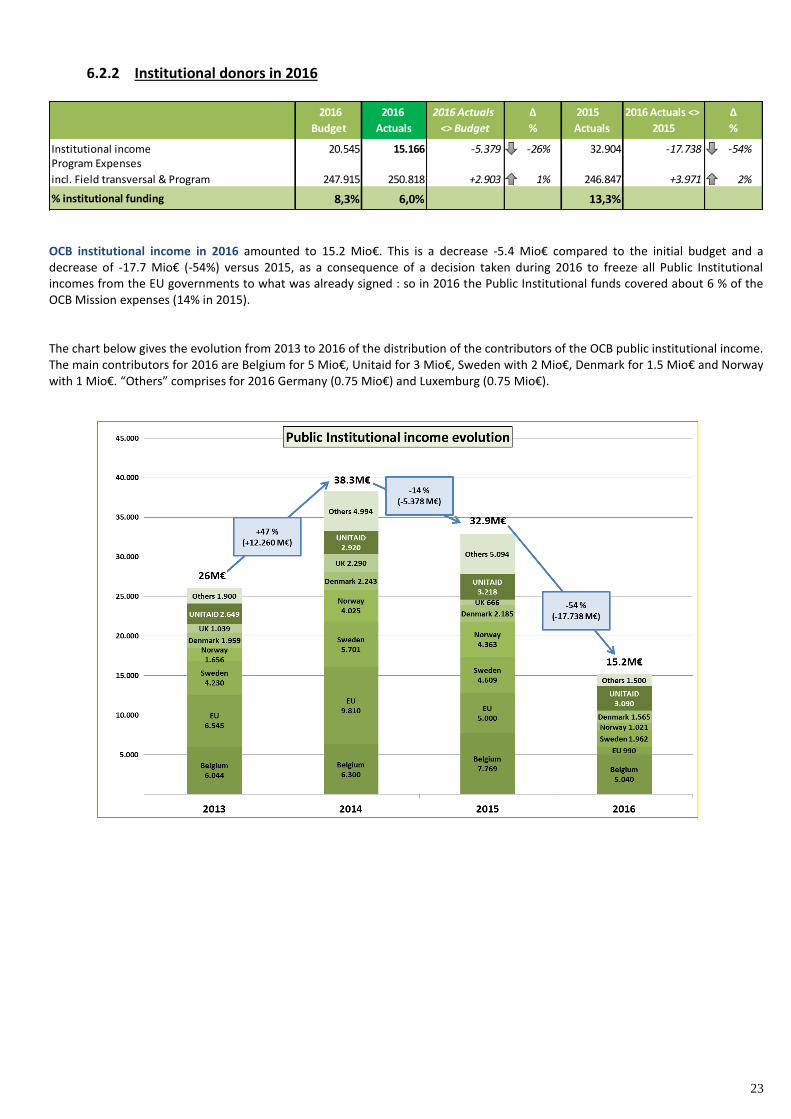
% institutional funding 8,3% 6,0% 13,3% OCB institutional income in 2016 amounted to 15.2 Mio€. This is a decrease -5.4 Mio€ compared to the initial budget and a decrease of -17.7 Mio€ (-54%) versus 2015, as a consequence of a decision taken during 2016 to freeze all Public Institutional incomes from the EU governments to what was already signed : so in 2016 the Public Institutional funds covered about 6 % of the OCB Mission expenses (14% in 2015). The chart below gives the evolution from 2013 to 2016 of the distribution of the contributors of the OCB public institutional income. The main contributors for 2016 are Belgium for 5 Mio€, Unitaid for 3 Mio€, Sweden with 2 Mio€, Denmark for 1.5 Mio€ and Norway with 1 Mio€. “Others” comprises for 2016 Germany (0.75 Mio€) and Luxemburg (0.75 Mio€).
24
6.3 OCB Results 2016
6.3.1 Comparison versus the budget
(in K€)
2016
Actuals
2017
Budget
2016 Actuals
<> Budget
Δ%
incl effect
migration
to Swiss
Gaap
2016
Actuals
"restated"
2016 Actuals
restated <>
Budget
Δ%
INCOMES Total 442.689 417.733 +60.227 16% 9.649 433.040 +50.578 13%
SOCIAL MISSION Total 344.010 362.730 +19.680 6% 344.010 +19.680 6%
OTHER EXPENSES Total 58.631 72.464 -2.913 -5% 58.631 -2.913 -5%
EXPENSES Total 402.641 435.194 +16.766 4% 402.641 +16.766 4%
Net exchange gains/losses (+ / -) 4.539 +4.539 4.539 +4.539
NET RESULTS 44.587 -17.461 +47.999 9.649 34.938 +38.351
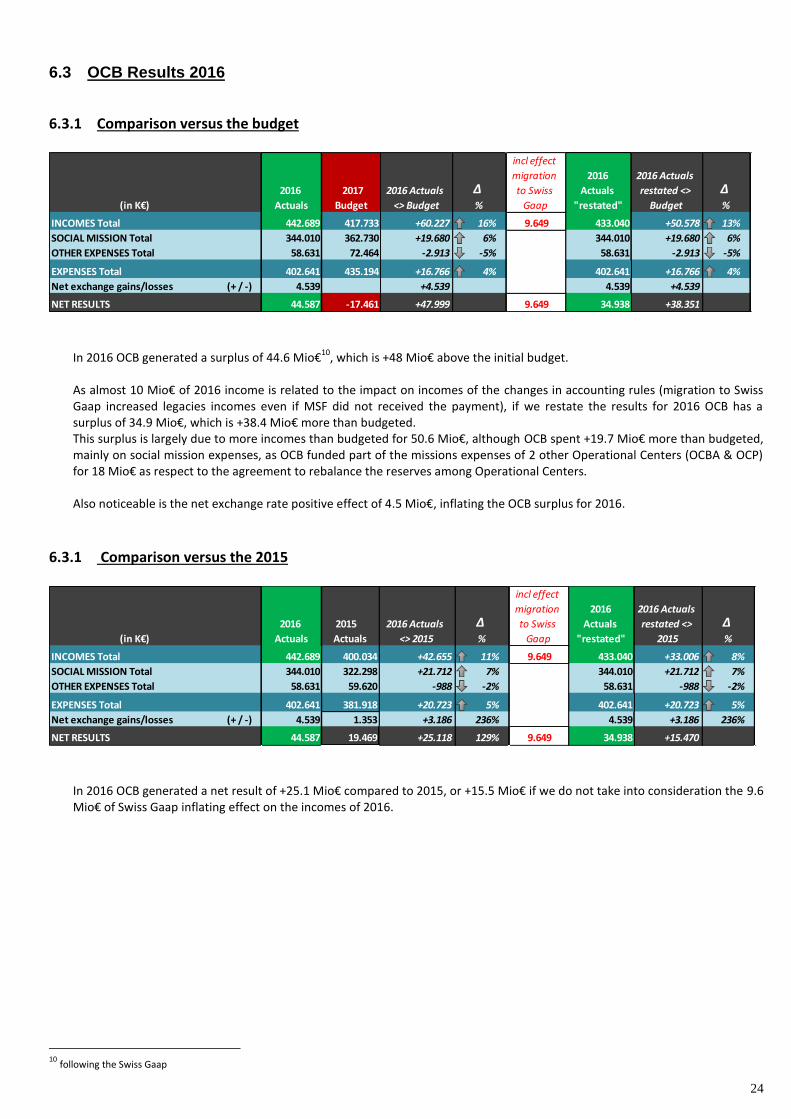
In 2016 OCB generated a surplus of 44.6 Mio€
10, which is +48 Mio€ above the initial budget.
As almost 10 Mio€ of 2016 income is related to the impact on incomes of the changes in accounting rules (migration to Swiss Gaap increased legacies incomes even if MSF did not received the payment), if we restate the results for 2016 OCB has a surplus of 34.9 Mio€, which is +38.4 Mio€ more than budgeted. This surplus is largely due to more incomes than budgeted for 50.6 Mio€, although OCB spent +19.7 Mio€ more than budgeted, mainly on social mission expenses, as OCB funded part of the missions expenses of 2 other Operational Centers (OCBA & OCP) for 18 Mio€ as respect to the agreement to rebalance the reserves among Operational Centers. Also noticeable is the net exchange rate positive effect of 4.5 Mio€, inflating the OCB surplus for 2016.
6.3.1 Comparison versus the 2015
(in K€)
2016
Actuals
2015
Actuals
2016 Actuals
<> 2015
Δ%
incl effect
migration
to Swiss
Gaap
2016
Actuals
"restated"
2016 Actuals
restated <>
2015
Δ%
INCOMES Total 442.689 400.034 +42.655 11% 9.649 433.040 +33.006 8%
SOCIAL MISSION Total 344.010 322.298 +21.712 7% 344.010 +21.712 7%
OTHER EXPENSES Total 58.631 59.620 -988 -2% 58.631 -988 -2%
EXPENSES Total 402.641 381.918 +20.723 5% 402.641 +20.723 5%
Net exchange gains/losses (+ / -) 4.539 1.353 +3.186 236% 4.539 +3.186 236%
NET RESULTS 44.587 19.469 +25.118 129% 9.649 34.938 +15.470
In 2016 OCB generated a net result of +25.1 Mio€ compared to 2015, or +15.5 Mio€ if we do not take into consideration the 9.6 Mio€ of Swiss Gaap inflating effect on the incomes of 2016.
10
following the Swiss Gaap
25
6.4 OCB Initial budget 2017
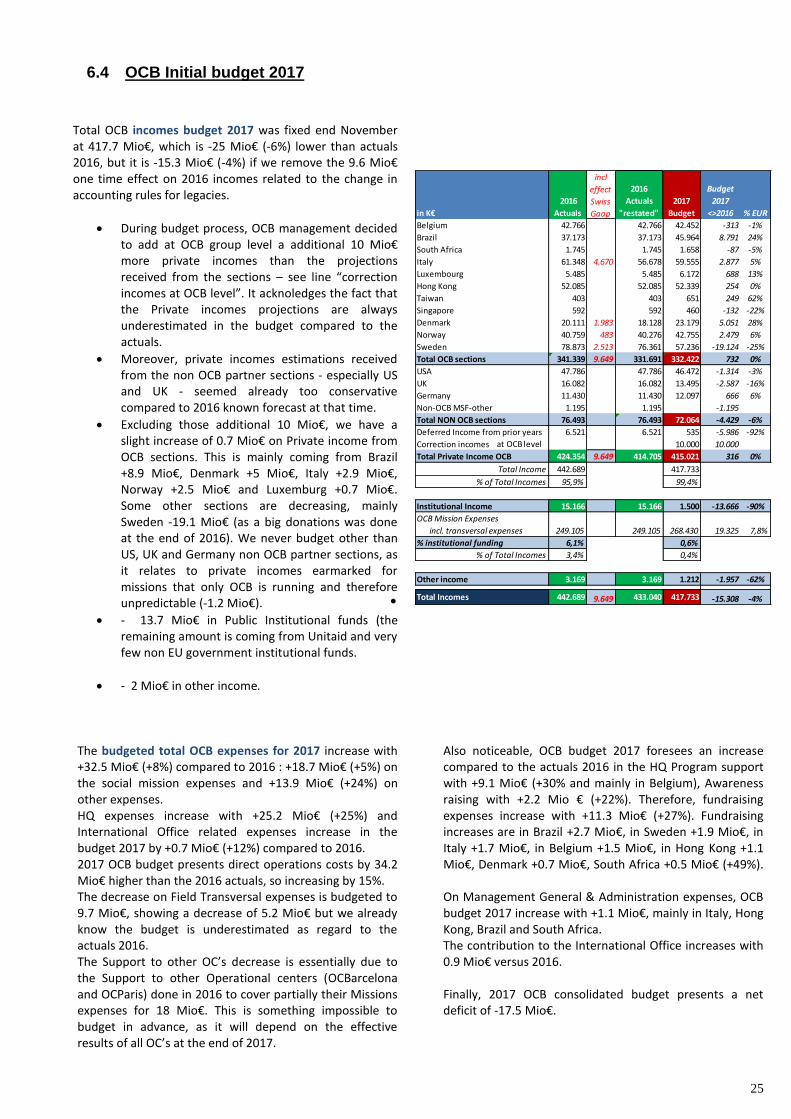
Total OCB incomes budget 2017 was fixed end November at 417.7 Mio€, which is -25 Mio€ (-6%) lower than actuals 2016, but it is -15.3 Mio€ (-4%) if we remove the 9.6 Mio€ one time effect on 2016 incomes related to the change in accounting rules for legacies.
During budget process, OCB management decided to add at OCB group level a additional 10 Mio€ more private incomes than the projections received from the sections – see line “correction incomes at OCB level”. It acknoledges the fact that the Private incomes projections are always underestimated in the budget compared to the actuals.
Moreover, private incomes estimations received from the non OCB partner sections - especially US and UK - seemed already too conservative compared to 2016 known forecast at that time.
Excluding those additional 10 Mio€, we have a slight increase of 0.7 Mio€ on Private income from OCB sections. This is mainly coming from Brazil +8.9 Mio€, Denmark +5 Mio€, Italy +2.9 Mio€, Norway +2.5 Mio€ and Luxemburg +0.7 Mio€. Some other sections are decreasing, mainly Sweden -19.1 Mio€ (as a big donations was done at the end of 2016). We never budget other than US, UK and Germany non OCB partner sections, as it relates to private incomes earmarked for missions that only OCB is running and therefore unpredictable (-1.2 Mio€).
- 13.7 Mio€ in Public Institutional funds (the remaining amount is coming from Unitaid and very few non EU government institutional funds.
- 2 Mio€ in other income.
in K€
2016
Actuals
incl
effect
Swiss
Gaap
2016
Actuals
"restated"
2017
Budget
Budget
2017
<>2016 % EUR
Belgium 42.766 42.766 42.452 -313 -1%
Brazil 37.173 37.173 45.964 8.791 24%
South Africa 1.745 1.745 1.658 -87 -5%
Italy 61.348 4.670 56.678 59.555 2.877 5%
Luxembourg 5.485 5.485 6.172 688 13%
Hong Kong 52.085 52.085 52.339 254 0%
Taiwan 403 403 651 249 62%
Singapore 592 592 460 -132 -22%
Denmark 20.111 1.983 18.128 23.179 5.051 28%
Norway 40.759 483 40.276 42.755 2.479 6%
Sweden 78.873 2.513 76.361 57.236 -19.124 -25%
Total OCB sections 341.339 9.649 331.691 332.422 732 0%
USA 47.786 47.786 46.472 -1.314 -3%
UK 16.082 16.082 13.495 -2.587 -16%
Germany 11.430 11.430 12.097 666 6%
Non-OCB MSF-other 1.195 1.195 -1.195
Total NON OCB sections 76.493 76.493 72.064 -4.429 -6%
Deferred Income from prior years 6.521 6.521 535 -5.986 -92%
Correction incomes 10.000 10.000
Total Private Income OCB 424.354 9.649 414.705 415.021 316 0%
Total Income 442.689 417.733
% of Total Incomes 95,9% 99,4%
Institutional Income 15.166 15.166 1.500 -13.666 -90%
OCB Mission Expenses
incl. transversal expenses 249.105 249.105 268.430 19.325 7,8%
% institutional funding 6,1% 0,6%
% of Total Incomes 3,4% 0,4%
Other income 3.169 3.169 1.212 -1.957 -62%
Total Incomes 442.689 9.649 433.040 417.733 -15.308 -4%
at OCB level
The budgeted total OCB expenses for 2017 increase with +32.5 Mio€ (+8%) compared to 2016 : +18.7 Mio€ (+5%) on the social mission expenses and +13.9 Mio€ (+24%) on other expenses. HQ expenses increase with +25.2 Mio€ (+25%) and International Office related expenses increase in the budget 2017 by +0.7 Mio€ (+12%) compared to 2016. 2017 OCB budget presents direct operations costs by 34.2 Mio€ higher than the 2016 actuals, so increasing by 15%. The decrease on Field Transversal expenses is budgeted to 9.7 Mio€, showing a decrease of 5.2 Mio€ but we already know the budget is underestimated as regard to the actuals 2016. The Support to other OC’s decrease is essentially due to the Support to other Operational centers (OCBarcelona and OCParis) done in 2016 to cover partially their Missions expenses for 18 Mio€. This is something impossible to budget in advance, as it will depend on the effective results of all OC’s at the end of 2017.
Also noticeable, OCB budget 2017 foresees an increase compared to the actuals 2016 in the HQ Program support with +9.1 Mio€ (+30% and mainly in Belgium), Awareness raising with +2.2 Mio € (+22%). Therefore, fundraising expenses increase with +11.3 Mio€ (+27%). Fundraising increases are in Brazil +2.7 Mio€, in Sweden +1.9 Mio€, in Italy +1.7 Mio€, in Belgium +1.5 Mio€, in Hong Kong +1.1 Mio€, Denmark +0.7 Mio€, South Africa +0.5 Mio€ (+49%). On Management General & Administration expenses, OCB budget 2017 increase with +1.1 Mio€, mainly in Italy, Hong Kong, Brazil and South Africa. The contribution to the International Office increases with 0.9 Mio€ versus 2016. Finally, 2017 OCB consolidated budget presents a net deficit of -17.5 Mio€.
26
(in K€)
2016
Actuals
2017
Budget Share
Budget 2017 <>
2016 Actuals
restated
Δ%
incl effect
migration
to Swiss
Gaap
2016
Actuals
"restated" Share
Private income 417.832 404.486 97% -3.698 -1% 9.649 408.184 94%
Correction incomes (budget 2017 +2,5%) 10.000 2% +10.000 0%
Deferred Income from prior years 6.521 535 0% -5.986 -92% 6.521 1,5%
Public institutional income 15.166 1.500 0% -13.666 -90% 15.166 3,5%
Other income 3.169 1.212 0% -1.957 -62% 3.169 0,7%
INCOMES Total 442.689 417.733 100% -15.308 -4% 9.649 433.040 100%
Program - OCB Missions - Base Projects 158.076 214.226 49% +56.150 36% 158.076 39%
Program - OCB Missions - Copro & available 76.172 54.204 12% -21.968 -29% 76.172 19%
OCB Missions Expenses Total 234.249 268.430 62% +34.182 15% 234.249 58%
Program - Field Transversal Expenses 14.857 9.659 2% -5.197 -35% 14.857 4%
Program Support Abroad (Mena, SAMU,…) 1.713 2.721 1% +1.009 59% 1.713 0,4%
Program - Support to other OC's & 3rd parties 50.117 27.765 6% -22.353 -45% 50.117 12%
International fund 55 0% +55
HQ program support ** 30.680 39.767 9% +9.087 30% 30.680 8%
Awareness - Raising ** 9.714 11.892 3% +2.178 22% 9.714 2,4%
Access to Essential Medicines Campaign** 1.171 1.255 0% +84 7% 1.171 0,3%
Other Humanitarian Activities (DNDI) 1.510 1.185 0% -325 -22% 1.510 0,4%
SOCIAL MISSION Total 344.010 362.730 83% +18.720 5% 344.010 85%
Fundraising ** 42.209 53.495 12% +11.286 27% 42.209 10%
Management, G&A ** 13.090 14.255 3% +1.165 9% 13.090 3,3%
Contribution to IO ** 3.332 4.226 1% +894 27% 3.332 0,8%
Surplus for sections reserves ** 488 0% +488
Extraordinary expenses 0% #DIV/0!
OTHER EXPENSES Total 58.631 72.464 17% +13.833 24% 58.631 15%
EXPENSES Total 402.641 435.194 100% +32.553 8% 402.641 100%
Net exchange gains/losses (+ / -) 4.539 -4.539 -100% 4.539
NET RESULTS 44.587 -17.461 -52.400 9.649 34.938
for information :
HQ Expenses ** 100.196 125.378 29% +25.182 25% 100.196 25%
IO Expenses (CAME/DNDI/Contribution/Int'al fund) 6.013 6.721 2% +708 12% 6.013 1,5%
Based on the budget, the Social Mission ratio for 2017 reaches 83.3%, which is above the OCB minimum target of 80% but lower than 2016 with 2.1%. The budgeted London ratio for 2017 is 28.8% and remains below the maximum target of 30% but higher than in 2016 with +3.9% as the HQ expenses in 2017 are expected to grow more than the Mission expenses, mainly due to foreseen increasing fundraising investments and to the reinforcement in HQ program support.
OCB - Ratio's2016
Actuals
2017
BudgetShare
Budget 2017 <>
2016 Actuals
Δ
%
SOCIAL MISSION 344.010 362.730 +18.720 5%
OTHER EXPENSES 58.631 72.464 +13.833 24%
TOTAL EXPENSES 402.641 435.194 +32.553 8%
Social Mission ratio 85,4% 83,3% -2,1%
2016
Actuals
2017
BudgetShare
Budget 2017 <>
2016 Actuals
Δ
%
HQ Expenses 100.196 125.378 +25.182 25%
Non HQ Expenses 302.445 309.816 +7.371 2%
TOTAL EXPENSES 402.641 435.194 +32.553 8%
London ratio 24,9% 28,8% 3,9%
Brussels, May 2017
27
Annexe 1
28
29
30
Annexe 2
In order to facilitate the comprehension of the OCB figures consolidated, you will find a small glossary.
31