MSEIA Comparative Study of Rate Impacts by Program Transition/MSEIA...MSEIA COMPARATIVE STUDY OF...
22
MSEIA COMPARATIVE STUDY OF RATE IMPACTS BY PROGRAM PRELIMINARY RELEASE for SOLAR TRANSITION WORKING GROUP MEETING January 12, 2012 Lyle K. Rawlings, P.E. Vice-President, New Jersey
Transcript of MSEIA Comparative Study of Rate Impacts by Program Transition/MSEIA...MSEIA COMPARATIVE STUDY OF...

MSEIA COMPARATIVE STUDY OF RATE IMPACTS BY PROGRAM
PRELIMINARY RELEASE for
SOLAR TRANSITION WORKING GROUP MEETING January 12, 2012
Lyle K. Rawlings, P.E.
Vice-President, New Jersey

MSEIA COMPARATIVE STUDY OF RATE IMPACTS BY PROGRAM 1
TABLE OF CONTENTS SECTION PAGE NO. Background 2 Development of the New Jersey Solar Energy Market 2 Genesis of This Study 3 Methodology 4 Assumptions 7 Size, Cost and Performance 8 Financing 8 Key Rates 9 Tax Benefits 9 Financing 10 SRECs 10 Results 10 Results for 2012 Projects 10 Changes in Results for Future Years 12 Discussion and Conclusions 20

MSEIA COMPARATIVE STUDY OF RATE IMPACTS BY PROGRAM 2
Background Development of the New Jersey Solar Energy Market The New Jersey solar energy market is the second-largest in the U.S., and grew to this position in a relatively short period of time – about nine years from the inception of statewide incentives to today. The first years of this state program to encourage the development of a solar energy market in New Jersey was fueled by an incentive program centered on rebates. The rebates were supported by funds raised through a Societal Benefits Charge (SBC). In 2003 and 2004, regulations were adopted under the Renewable Portfolio Standard (RPS) of the EDECA law that established requirements for the supply of solar power as a percentage of each energy supplier’s electric power sales. This began a transition from a rebate-based incentive program for solar energy to a program based on a tradable commodity called a Solar Renewable Energy Certificate, or SREC. It soon became apparent that energy suppliers were not willing to, or capable of, offering long-term contracts to solar generators for their SRECs. A study by Summit Blue Associates, commissioned by the Board of Public Utilities, concluded that such long-term contracts, or other long-term instruments, would result in lower rate impacts. Based on this, the Board of Public Utilities approved programs by the Electric Distribution Companies (EDC’s) to offer long-term commitments for SRECs. PSE&G began a program to offer loans to solar generators that would be paid off through their SRECs, with an administratively-set floor price for the full 15-year generation period of the SRECs (the “PSE&G Loan program”). JCP&L, Atlantic City Electric, and Rockland Electric began a program of competitive solicitations for 10-year contracts to buy solar generators’ SRECs (the “JCP&L/ACE 10-year Contract program”). Both of these program tracks have ended as of the end of 2011. In this study the PSE&G Loan program and the JCP&L/ACE 10-year Contract program are referred to collectively as the “EDC Programs”, as distinguished from the unstructured market for SRECs. In 2009 a new schedule of SREC requirements was established by the Solar Advancement and Fair Competition Act (A3520). At the time of this writing, the SBC-supported rebate program has essentially ended. The Transition Working Group is a stakeholder group consisting of state governmental agencies, solar industry representatives, utility companies, energy suppliers, and other stakeholders. Its purpose is to discuss and compare alternative SREC-based program designs to fulfill the requirements of A3520, or any new requirements that might arise.
MSEIA COMPARATIVE STUDY OF RATE IMPACTS BY PROGRAM 3
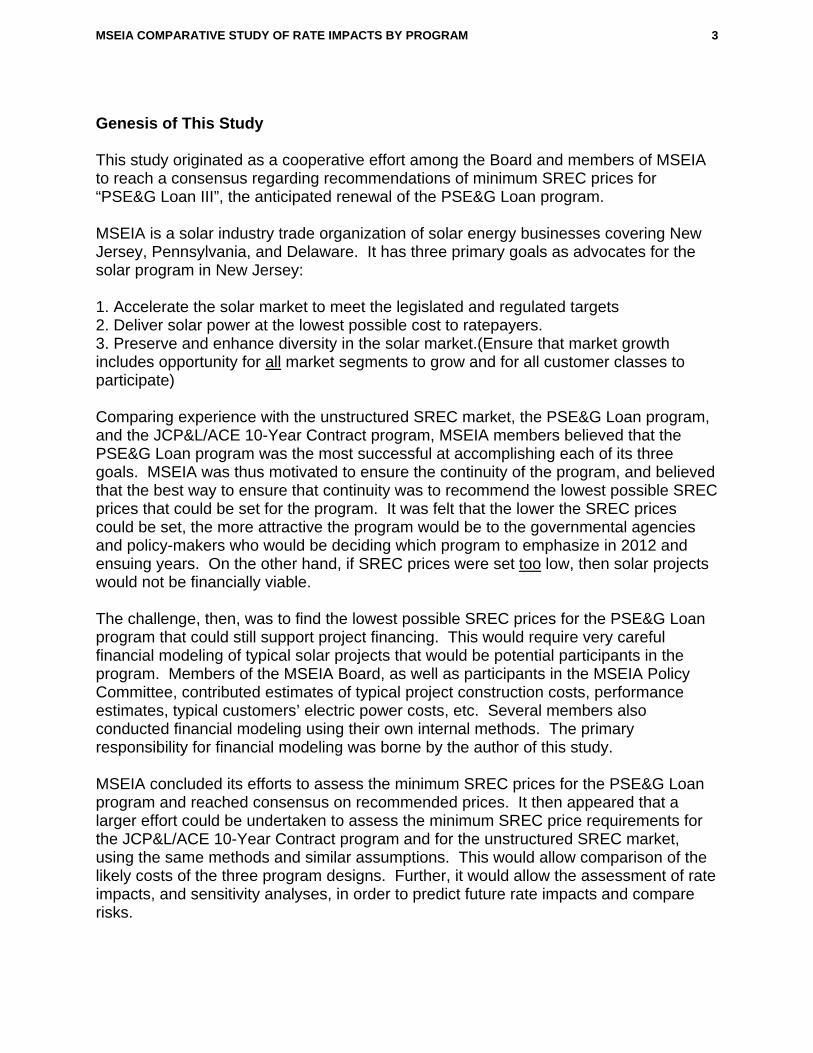
Genesis of This Study This study originated as a cooperative effort among the Board and members of MSEIA to reach a consensus regarding recommendations of minimum SREC prices for “PSE&G Loan III”, the anticipated renewal of the PSE&G Loan program. MSEIA is a solar industry trade organization of solar energy businesses covering New Jersey, Pennsylvania, and Delaware. It has three primary goals as advocates for the solar program in New Jersey:
1. Accelerate the solar market to meet the legislated and regulated targets 2. Deliver solar power at the lowest possible cost to ratepayers. 3. Preserve and enhance diversity in the solar market.(Ensure that market growth includes opportunity for all market segments to grow and for all customer classes to participate) Comparing experience with the unstructured SREC market, the PSE&G Loan program, and the JCP&L/ACE 10-Year Contract program, MSEIA members believed that the PSE&G Loan program was the most successful at accomplishing each of its three goals. MSEIA was thus motivated to ensure the continuity of the program, and believed that the best way to ensure that continuity was to recommend the lowest possible SREC prices that could be set for the program. It was felt that the lower the SREC prices could be set, the more attractive the program would be to the governmental agencies and policy-makers who would be deciding which program to emphasize in 2012 and ensuing years. On the other hand, if SREC prices were set too low, then solar projects would not be financially viable. The challenge, then, was to find the lowest possible SREC prices for the PSE&G Loan program that could still support project financing. This would require very careful financial modeling of typical solar projects that would be potential participants in the program. Members of the MSEIA Board, as well as participants in the MSEIA Policy Committee, contributed estimates of typical project construction costs, performance estimates, typical customers’ electric power costs, etc. Several members also conducted financial modeling using their own internal methods. The primary responsibility for financial modeling was borne by the author of this study. MSEIA concluded its efforts to assess the minimum SREC prices for the PSE&G Loan program and reached consensus on recommended prices. It then appeared that a larger effort could be undertaken to assess the minimum SREC price requirements for the JCP&L/ACE 10-Year Contract program and for the unstructured SREC market, using the same methods and similar assumptions. This would allow comparison of the likely costs of the three program designs. Further, it would allow the assessment of rate impacts, and sensitivity analyses, in order to predict future rate impacts and compare risks.

MSEIA COMPARATIVE STUDY OF RATE IMPACTS BY PROGRAM 4
Methodology The primary economic modeling tool used in this study is based on a proprietary model developed by Advanced Solar Products, Inc. of Flemington, NJ (ASP). Like other models of its sort, it was developed to be an investment decision-making tool for specific solar energy projects. At various times its uses have included aiding decisions regarding whether or not to invest, or at what price to invest, in solar projects on the part of Advanced Solar Products, on the part of its customers, and on the part of financial partners such as banks or PPA companies. The model measures the net economic benefits that will be generated by a solar power project for its owners. The inputs are costs, performance estimates, financing terms, and key rates and characteristics of the owner and the project. The outputs are several measures of economic success (or lack thereof). The primary measures of success are Project Internal Rate of Return, after tax; and net cash flow by year. It was assumed that all of the modeled projects were completed in 2012. The study involved first iteratively running the model at different SREC prices under the PSE&G Loan program, until a target IRR was reached. This was done for each of four size categories in the PSE&G program: Residential Small Non-Residential (0-150 KWdc) Large Non-Residential (150-500 KWdc) Very Large Non-Residential (500-2,000 KWdc) (for simplicity, the term “Commercial” is used hereinafter in place of “Non-Residential”) The target IRR was 11.5%. After the target IRR was reached, net cash flow was examined for each year, and assessed for problems or any obvious unattractive features. One common feature in the net cash flow of New Jersey solar projects is that strongly positive net cash flow occurs during the first few years of the project due to the Federal Investment Tax Credit and the accelerated federal depreciation schedule (Modified Accelerated Cost Recovery System, or MACRS). After that, however, with no depreciation to offset the taxes due on SRECs and electric revenue (or avoided cost), negative net cash flow often ensues for several years until the project loans are paid off. After SREC prices were established that could produce the target IRR and an investment-worthy project, the resulting model was used as a benchmark for modeling the JCP&L/ACE long-term contract program and the unstructured SREC market program. The model was run iteratively for the same four system sizes for JCP&L/ACE 10-Year Contract and unstructured SREC market cases, until an SREC price was reached for each case that would produce the same 11.5% IRR as the PSE&G cases.

MSEIA COMPARATIVE STUDY OF RATE IMPACTS BY PROGRAM 5
After identifying the SREC price that would produce the target IRR, the model was run again for each case until an SREC price was reached that would produce the same cumulative net cash flow in the year the loans were paid off. Thus two different results were generated for each case. The two different results were reached using two different measures of investment worthiness, but always using the results for the PSE&G cases as the benchmark. The same procedure was followed for the unstructured SREC Market cases. Besides the PSE&G Loan, JCP&L/ACE 10-year contracts, and unstructured SREC market, a fourth, theoretical alternative was also added. Generally the term LCOE, or Levelized Cost Of Energy, is used to describe the “real” cost of electricity from a power plant. It involves calculating revenue at a levelized price, over a period roughly corresponding to the financial life of the plant, to produce a target rate of return. This study was dealing with SRECs (attributes), however, not bundled energy plus attributes, so the term LCOE is not really accurate. Nonetheless, the term LCOE was used loosely to describe the levelized price of SRECs that would be necessary over 20 years to produce the same target IRR as the other programs. This essentially set a likely lower limit to the price of SRECs, one that the other programs could be compared to and should aspire to equal. The following are the primary inputs to the models, and the sources that were used to create values for them: Size, Cost and Performance 1. System Size (KWdc) Representative sizes based on PSE&G Loan II program size categories. 2. Construction cost ($) MSEIA Policy Committee consensus 3. Construction interest, closing cost for financing, and similar “soft costs” ($) ASP estimate 4. Annual solar power generation (KWH/year/KWdc) PV:WATTS, Philadelphia station, AC-DC derate = 0.835 5. Annual degradation in power generated (%/year) ASP estimate Financing 1. PSE&G Loan rates (interest, term, and method of calculation) (%, years) Based on PSE&G Loan II policies 2. Cash equity input, (% of project cost after PSE&G Loan is subtracted) Variable 3. Commercial or homeowner loan Interest rate (%) ASP estimate

MSEIA COMPARATIVE STUDY OF RATE IMPACTS BY PROGRAM 6
4. Commercial or homeowner loan term (years) Variable Key Rates 1. Avoided Electric power cost ($/KWH) MSEIA Policy Committee consensus 2. Inflation rate of electric power cost (%) ASP estimate 3. Inflation rate, general (%) ASP estimate 4. Maintenance reserve, percent of construction cost (%/year) ASP Estimate 5. Combined tax rate (%) ASP estimate SRECs 1. Initial/contracted SREC price ($/SREC) Final product of the model, obtained by iteratively changing the value until the target result is achieved 2. Years of SRECs under contract for SREC Market cases (years) Estimate of ASP and NJSREC.com 3. SREC prices after SREC contracts end (for JCP&L/ACE and SREC Market cases) ($/SREC) Estimate of ASP and NJSREC.com Tax Benefits 1. FITC (% of project cost) Current law 2. Bonus Depreciation (% of project cost) Current law (2012 only) 3. MACRS schedule (% of project cost) Current law The following are the primary outputs of the model: 1. Project rate of return, after tax (IRR) (%) Compares after tax net income before debt service to the total cost of the project. This measure of investment worthiness was the primary target result, and the initial SREC price was varied to produce the desired target IRR.
MSEIA COMPARATIVE STUDY OF RATE IMPACTS BY PROGRAM 7
2. Year-by-year cash flow ($) Net cash flow after tax for each year, after debt service, and after cash equity (downpayment) has been repaid. Most solar power projects in New Jersey, under the current tax environment, will experience strongly positive net cash flow during the first few years of operation (due to the tax credit and MACRS). The project then will experience several years of negative net cash flow, until the loan(s) are paid off. The cumulative net cash flow after the years of negative net cash flow – that is to say, cumulative net cash flow for the year the project’s loans are paid off – was used as a secondary measure of investment worthiness. The value of this measure from the PSE&G Loan program runs was used as the benchmark, and then the initial SREC price for the other two programs was varied to produce the same value. Optional output measures that were not used in this study include Modified IRR (MIRR); Net Present Value of the net cash flow at a selected discount rate; and yearly cash flow with net cash flow from each year re-invested at a selected interest rate. The results in terms of initial SREC prices were tabulated and compared for the three programs and LCOE. In order to analyze these results, assumptions were first made regarding the relative percentage of statewide construction occupied by the four size categories. This allowed the calculation of a weighted average SREC price for each of the three existing alternatives. The results of runs targeting IRR and the results of runs targeting cash flow were slightly different. They are also equally valid, depending on the preferences of the investor examining the project. Therefore, a table was made averaging the results from the IRR runs and results from the Cash Flow runs. These averages from the two methods were used in the next part of the analysis, which involved projections of how the costs of the three programs and LCOE might change relative to each other in future years. Assumptions The following assumptions were common to the models that were run for all three programs:

MSEIA COMPARATIVE STUDY OF RATE IMPACTS BY PROGRAM 8
Size, Cost and Performance 1. System Size (KWdc) Category Size, KWdc Residential 9 Small Non-Residential (0-150 KWdc) 150 Large Non-Residential (150-500 KWdc) 400 Very Large Non-Residential (500-2,000 KWdc) 1,175 2. Construction cost ($) Category Cost, $/wattdc Residential $4.20 Small Non-Residential (0-150 KWdc) $3.70 Large Non-Residential (150-500 KWdc) $3.50 Very Large Non-Residential (500-2,000 KWdc) $3.40 3. Construction interest, closing cost for financing, and similar “soft costs” ($) Category Cost, $ Residential $ 4,134 Small Non-Residential (0-150 KWdc) $ 19,650 Large Non-Residential (150-500 KWdc) $ 40,000 Very Large Non-Residential (500-2,000 KWdc) $122,850 4. Annual solar power generation (KWH/year/KWdc) 1,241 KWH/year/KWdc, all cases 5. Annual degradation in power generated (%/year) 0.4% per year Financing 1. PSE&G Loan rate (interest, term, and method of calculation) (%, years) 11.3% interest, 15-year term 3. Commercial or homeowner loan Interest rate (%) Category Interest, % Residential 4.5% Small Non-Residential (0-150 KWdc) 6.0% Large Non-Residential (150-500 KWdc) 6.0% Very Large Non-Residential (500-2,000 KWdc) 6.0%

MSEIA COMPARATIVE STUDY OF RATE IMPACTS BY PROGRAM 9
4. Commercial or homeowner loan term (years) Category Term, years Residential 10 years Small Non-Residential (0-150 KWdc) 15 years Large Non-Residential (150-500 KWdc) 15 years Very Large Non-Residential (500-2,000 KWdc) 15 years Key Rates 1. Avoided Electric power cost ($/KWH) Category Cost, $/KWH Residential $0.167 Small Non-Residential (0-150 KWdc) $0.134 Large Non-Residential (150-500 KWdc) $0.132 Very Large Non-Residential (500-2,000 KWdc) $0.120 2. Inflation rate of electric power cost (%) 1.5% 3. Inflation rate, general (%) 1.5% 4. Maintenance reserve, percent of construction cost (%/year) 0.3% 5. Combined tax rate (%) 40% Tax Benefits 1. FITC (% of project cost) 30% 2. Bonus Depreciation (% of project cost) 50% 3. MACRS schedule (% of project cost) Year 1 Year 2 Year 3 Year 4 Year 5 Year 6 20% 32% 19.20% 11.52% 11.52% 5.76% The following inputs were different for the different programs, due to inherent differences in how they work:

MSEIA COMPARATIVE STUDY OF RATE IMPACTS BY PROGRAM 10
Financing 2. Cash equity input, (% of project cost after PSE&G Loan is subtracted): PSE&G Loan program all sizes: 50% JCP&L/ACE programs all sizes: 30% SREC Market program all sizes: 30% SRECs 2. Years of SRECs under contract for SREC Market cases (years): 3-year SREC contracts 3. SREC prices after SREC contracts end (for JCP&L/ACE and SREC Market cases) ($/SREC): JCP&L/ACE programs $75/SREC in year 11 then declining by 4% per year SREC Market program $120/SREC in year 4 $90/SREC in year 5 $75/SREC in year 6 then declining by 4% per year Results Results for 2012 projects The results of the modeling of the four size categories, for the four program alternatives, to find the initial/contracted SREC prices to produce a target IRR is shown in Table 1: Table 1 SUMMARY OF MODELED 2012 SREC PRICES BY PROGRAM
SOLVED FOR TARGET IRR4
Segment
Assumed Capacity
(% of Total)
PSEG Loan1
JCP&L/ACE10-yr
Contract1,2
SREC Market (3-yr
Contract)3
LCOE
Residential 18% 194 235 360 155Small Commercial 15% 185 248 387 168Large Commercial 27% 166 226 332 151Very Large Commercial 40% 169 229 342 154Weighted Average 100.0% 175 232 349 155

MSEIA COMPARATIVE STUDY OF RATE IMPACTS BY PROGRAM 11
Notes: 1. Does not include administrative costs 2. Includes $35 cost recovery incentive 3. Does not include transaction costs 4. Prices adjusted to produce the same target Internal Rate of Return
Table 2 presents the results of the modeling of the four size categories, for the four program alternatives, to find the initial/contracted SREC prices to produce a target cumulative net cash flow in the year the project loans are paid off. Table 2 SUMMARY OF MODELED 2012 SREC PRICES BY PROGRAM
SOLVED FOR TARGET CASH FLOW4
Segment
Assumed Capacity
(% of Total)
PSEG Loan1
JCP&L/ACE10-yr
Contract1,2
SREC Market (3-yr
Contract)3
LCOE
Residential 18% 194 216 410 181Small Commercial 15% 185 210 378 133Large Commercial 27% 166 192 318 121Very Large Commercial 40% 169 194 323 122Weighted Average 175 200 346 134
Notes: 1. Does not include administrative costs 2. Includes $35 cost recovery incentive 3. Does not include transaction costs 4. Prices adjusted to produce the same cumulative net cash flow in the year loan is paid off.
The average of the modeled results solved for IRR and the results solved for cash flow are shown in Table 3: Table 3 SUMMARY OF MODELED 2012 SREC PRICES BY PROGRAM
AVERAGE OF IRR AND CASH FLOW METHODS4
Segment
Assumed Capacity
(% of Total)
PSEG Loan1
JCP&L/ACE10-yr
Contract1,2
SREC Market (3-yr
Contract)3
LCOE
Residential 18% 194 226 385 168Small Commercial 15% 185 229 383 151Large Commercial 27% 166 209 325 136Very Large Commercial 40% 169 212 333 138Weighted Average 175 216 347 145

MSEIA COMPARATIVE STUDY OF RATE IMPACTS BY PROGRAM 12
Notes: 1. Does not include administrative costs 2. Includes $35 cost recovery incentive 3. Does not include transaction costs 4. Prices averaged between those determined by IRR and those determined by cash flow
As noted, the SREC prices for the PSE&G do not include administrative costs. They do include PSE&G’s rate of return, since that is built in to the loan structure. Similarly, the SREC prices for the JCP&L/ACE 10-year contract program do not include administrative costs. They do include the cost recovery incentive, since that is paid separately to the utilities. For the SREC market program, transaction costs were not included. The weighted average figures in Table 3 (in blue type) are the primary results of the study for projects completed in the year 2012. They represent the predicted SREC prices, across the three program alternatives, that are necessary to produce equivalent economic attractiveness. The results show that the PSE&G Loan program can be expected to produce results with lower SREC prices than the JCP&L/ACE 10-year contract programs (23% higher than the PSE&G required price) or the SREC Market program (98% higher than the PSE&G required price). The PSE&G price was 21% higher than the LCOE. Change in Results for Future Years In order to assess whether the three programs’ SREC price advantages and disadvantages presented above would remain true in future years, it was necessary to assess the effects of anticipated declines in the cost of solar power relative to fossil fuels. In other words, the required price for SRECs can be expected to decline over time, and this could have more of an effect on one program or another. For instance, it can be expected that the decline in required SREC prices would not result in the average SREC cost declining as fast for the PSE&G Loan program as for the SREC Market. This is because older systems built under the PSE&G Loan program will continue to get the SREC price that was set in the year they were built for 15 years, thus holding up the decline in weighted average SREC price in any given year, relative to the SREC Market program in which the SREC price for older projects will start to decline after only 3 years. In order to calculate the results of this effect and predict rate impacts for the three programs into the future, a matrix had to be constructed showing SREC prices for each year, for projects of each vintage year, with a given rate of decline. These figures could then be combined into a weighted average SREC price for each year.

MSEIA COMPARATIVE STUDY OF RATE IMPACTS BY PROGRAM 13
The weighted average SREC price for a given year was calculated by summing the SREC price paid in that year for projects of each vintage year multiplied by the total amount of solar power built in the year of vintage, divided by the total solar power built in all the years through that given year. A sample formula for this calculation is shown below for the third year (2014):
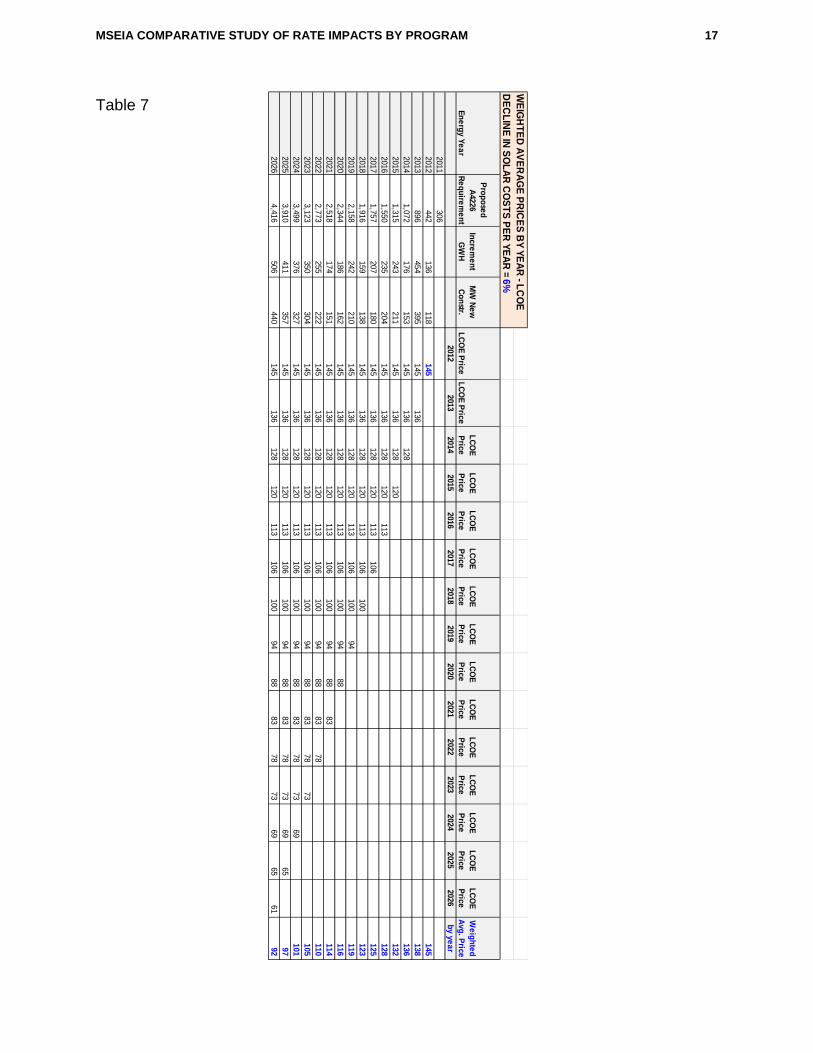
Weighted Average SREC Price, yr.3 = [(SREC Price in yr.3 for projects built in yr.1 x MW built, yr.1) plus (SREC Price in yr.3 for projects built in yr.2 x MW built, yr.2) plus (SREC Price in yr.3 for projects built in yr.3 x MW built, yr.3)] Divided by (Total MW built, yrs.1-3) The weighted averages for each year allow a comparison of the rate impacts of each program for each year, on a per SREC basis. In order to calculate the impact for each program one at a time, it was assumed that all of the solar projects were built under that program. The matrix of SREC prices and weighted averages by year for each program and for the LCOE, for a 6% per year decline in SREC costs, are shown in Tables 4, 5, 6, and 7 on the following pages.

MSEIA COMPARATIVE STUDY OF RATE IMPACTS BY PROGRAM 14
WE
IGH
TED AV
ERA
GE PR
ICE
S BY YE
AR - PS
EG LO
AND
EC
LINE IN
SO
LAR
CO
STS
PER
YEAR
=6%
Energy Year
Proposed A
4226 R
equirement
Increment
GW
HM
W New
C
onstr.P
SEG
Price
PS
EG P
riceP
SEG
P
riceP
SEG
Price
PSEG
P
riceP
SEG
P
riceP
SEG
P
riceP
SEG
P
ricePS
EG
Price
PS
EG
Price
PS
EG
Price
PS
EG
Price
PSEG
P
riceP
SEG
P
riceP
SEG
P
riceW
eighted A
vg. Price
20122013
20142015
20162017
20182019
20202021
20222023
20242025
2026by year
2011306
2012
442
136
118
175
175
2013896
454
395
175
165
167
2014
1,072
176
153
175
165
155
164
20151,315
243
211
175
165
155
145
160
2016
1,550
235
204
175
165
155
145
137
155
20171,757
207
180
175
165
155
145
137
128
151
2018
1,916
159
138
175
165
155
145
137
128
121
148
20192,158
242
210
175
165
155
145
137
128
121
114
144
2020
2,344
186
162
175
165
155
145
137
128
121
114
107
141
20212,518
174
151
175
165
155
145
137
128
121
114
107
100
137
2022
2,773
255
222
175
165
155
145
137
128
121
114
107
100
94
133
20233,123
350
304
175
165
155
145
137
128
121
114
107
100
94
89
127
2024
3,499
376
327
175
165
155
145
137
128
121
114
107
100
94
89
83
122
20253,910
411
357
175
165
155
145
137
128
121
114
107
100
94
89
83
78
117
2026
4,416
506
440
175
165
155
145
137
128
121
114
107
100
94
89
83
78
74
112
Table 4

MSEIA COMPARATIVE STUDY OF RATE IMPACTS BY PROGRAM 15
WEIG
HTED
AVE
RA
GE P
RIC
ES B
Y YEAR
- JCP
&L/AC
E 10-YR
. CO
NTR
ACT
DE
CLIN
E IN
SOLA
R C
OSTS
PER
YEAR
=6%
Energy Year
A3520
Requirem
ent G
WH
A3520
increment
GW
HM
W N
ew
Constr.
JCP
&L/A
CE
Price
JCP
&L/
AC
E Price
JCP
&L/
AC
E P
rice
JCP
&L/
AC
E P
rice
JCP
&L/
AC
E P
rice
JCP
&L/
AC
E P
rice
JCP
&L/
AC
E P
rice
JCP
&L/
AC
E P
rice
JCP
&L/
AC
E P
rice
JCP
&L/
AC
E P
rice
JCP
&L/
AC
E P
rice
JCP
&L/
AC
E P
rice
JCP
&L/
AC
E P
rice
JCP
&L/
AC
E P
rice
JCP
&L/
AC
E P
riceW
eighted A
vg. Price
20122013
20142015
20162017
20182019
20202021
20222023
20242025
2026by year
2011306
2012
442
136
118
216
216
2013896
454
395
216
203
206
2014
1,072
176
153
216
203
191
203
20151,315
243
211
216
203
191
179
197
2016
1,550
235
204
216
203
191
179
169
192
20171,757
207
180
216
203
191
179
169
159
187
2018
1,916
159
138
216
203
191
179
169
159
149
183
20192,158
242
210
216
203
191
179
169
159
149
140
178
2020
2,344
186
162
216
203
191
179
169
159
149
140
132
173
20212,518
174
151
216
203
191
179
169
159
149
140
132
124
169
2022
2,773
255
222
116
203
191
179
169
159
149
140
132
124
116
158
20233,123
350
304
109
109
191
179
169
159
149
140
132
124
116
109
137
2024
3,499
376
327
103
103
103
179
169
159
149
140
132
124
116
109
103
127
20253,910
411
357
97
97
97
179
169
159
149
140
132
124
116
109
103
97
122
2026
4,416
506
440
91
91
91
179
169
159
149
140
132
124
116
109
103
97
91
117
Table 5

MSEIA COMPARATIVE STUDY OF RATE IMPACTS BY PROGRAM 16
WE
IGH
TED
AV
ER
AG
E P
RIC
ES
BY YE
AR
- SR
EC
MA
RK
ET (3-YR
. CO
NTR
AC
T)D
EC
LINE
IN S
OLA
R C
OS
TS P
ER
YEA
R =
6%
Energy Year
A3520
Requirem
ent G
WH
A3520
increment
GW
HM
W N
ew
Constr.
SR
EC M
arket 3-Yr P
rice
SR
EC
Market 3-Yr
Price
SR
EC
Market 3-
Yr Price
SR
EC
Market 3-
Yr Price
SR
EC
Market 3-
Yr Price
SR
EC
Market 3-
Yr Price
SR
EC
Market 3-
Yr Price
SR
EC
Market 3-
Yr Price
SR
EC
Market 3-
Yr Price
SR
EC
Market 3-
Yr Price
SR
EC
Market 3-
Yr Price
SR
EC
Market 3-
Yr Price
SR
EC
Market 3-
Yr Price
SR
EC
Market 3-
Yr Price
SR
EC
Market 3-
Yr Price
Weighted
Avg. P
rice2012
20132014
20152016
20172018
20192020
20212022
20232024
20252026
by year2011
306
2012442
136
118
347
347
2013
896
454
395
347
327
331
20141,072
176
153
347
327
307
326
2015
1,315
243
211
289
327
307
289
309
20161,550
235
204
271
271
307
289
271
280
2017
1,757
207
180
255
255
255
289
271
255
263
20181,916
159
138
240
240
240
240
271
255
240
246
2019
2,158
242
210
225
225
225
225
225
255
240
225
230
20202,344
186
162
212
212
212
212
212
212
240
225
212
216
2021
2,518
174
151
199
199
199
199
199
199
199
225
212
199
203
20222,773
255
222
187
187
187
187
187
187
187
187
212
199
187
190
2023
3,123
350
304
176
176
176
176
176
176
176
176
176
199
187
176
178
20243,499
376
327
165
165
165
165
165
165
165
165
165
165
187
176
165
168
2025
3,910
411
357
155
155
155
155
155
155
155
155
155
155
155
176
165
155
158
20264,416
506
440
146
146
146
146
146
146
146
146
146
146
146
146
165
155
146
149
Table 6
MSEIA COMPARATIVE STUDY OF RATE IMPACTS BY PROGRAM 17
WE
IGH
TE
D A
VE
RA
GE
PR
ICE
S B
Y Y
EA
R - L
CO
ED
EC
LIN
E IN
SO
LA
R C
OS
TS
PE
R Y
EA
R =
6%
En
erg
y Ye
ar
Pro
po
sed
A
4226 R
eq
uire
me
nt
Incre
me
nt
GW
HM
W N
ew
C
on
str.L
CO
E P
riceL
CO
E P
riceL
CO
E
Price
LC
OE
P
riceL
CO
E
Price
LC
OE
P
riceL
CO
E
Price
LC
OE
P
riceL
CO
E
Price
LC
OE
P
riceL
CO
E
Price
LC
OE
P
riceL
CO
E
Price
LC
OE
P
riceL
CO
E
Price
We
igh
ted
A
vg. P
rice2012
20132014
20152016
20172018
20192020
20212022
20232024
20252026
by ye
ar
2011306
2012
442
136
118
145
145
2013896
454
395
145
136
138
2014
1,072
176
153
145
136
128
136
20151,315
243
211
145
136
128
120
132
2016
1,550
235
204
145
136
128
120
113
128
20171,757
207
180
145
136
128
120
113
106
125
2018
1,916
159
138
145
136
128
120
113
106
100
123
20192,158
242
210
145
136
128
120
113
106
100
94
119
2020
2,344
186
162
145
136
128
120
113
106
100
94
88
116
20212,518
174
151
145
136
128
120
113
106
100
94
88
83
114
2022
2,773
255
222
145
136
128
120
113
106
100
94
88
83
78
110
20233,123
350
304
145
136
128
120
113
106
100
94
88
83
78
73
105
2024
3,499
376
327
145
136
128
120
113
106
100
94
88
83
78
73
69
101
20253,910
411
357
145
136
128
120
113
106
100
94
88
83
78
73
69
65
97
2026
4,416
506
440
145
136
128
120
113
106
100
94
88
83
78
73
69
65
61
92
Table 7

MSEIA COMPARATIVE STUDY OF RATE IMPACTS BY PROGRAM 18
‐
50
100
150
200
250
300
350
400
2012 2014 2016 2018 2020 2022 2024 2026
Wei
gh
ted
Ave
rag
e S
RE
C P
rice
, $
Energy Year
FIGURE 1: PREDICTED RATE IMPACT (WEIGHTED AVERAGE SREC PRICE) BY YEAR
6% DECLINE IN SOLAR COSTS PER YEAR
PSEG LOAN
JCP&L/ACE10‐YR CONTRACT
SREC MARKET(3‐YR CONTRACT)
LCOE
The following Table 8 combines the predictions for weighted average SREC prices over future years for the three alternative programs and LCOE:
Table 8 PREDICTED RATE IMPACT BY YEAR AND BY PROGRAM
(MODELED WEIGHTED AVERAGE SREC PRICES)
6% DECLINE IN SOLAR COSTS PER YEAR
YEAR PSEG LOAN JCP&L/ACE
10-YR CONTRACT
SREC MARKET(3-YR
CONTRACT) LCOE 2012 175 216 347 145 2013 167 206 331 138 2014 164 203 326 136 2015 160 197 309 132 2016 155 192 280 128 2017 151 187 263 125 2018 148 183 246 123 2019 144 178 230 119 2020 141 173 216 116 2021 137 169 203 114 2022 133 158 190 110 2023 127 137 178 105 2024 122 127 168 101 2025 117 122 158 97 2026 112 117 149 92
And Figure 1 shows these results in graphical form:

MSEIA COMPARATIVE STUDY OF RATE IMPACTS BY PROGRAM 19
‐
50
100
150
200
250
300
350
400
2012 2014 2016 2018 2020 2022 2024 2026
Wei
gh
ted
Ave
rag
e S
RE
C P
rice
, $
Energy Year
FIGURE 2PREDICTED RATE IMPACT (WEIGHTED AVERAGE SREC PRICE) BY YEAR
4% DECLINE IN SOLAR COSTS PER YEAR
PSEG LOAN
JCP&L/ACE10‐YR CONTRACT
SREC MARKET(3‐YR CONTRACT)
LCOE
‐
50
100
150
200
250
300
350
400
2012 2014 2016 2018 2020 2022 2024 2026Wei
gh
ted
Ave
rag
e S
RE
C P
rice
, $
Energy Year
FIGURE 3PREDICTED RATE IMPACT (WEIGHTED AVERAGE SREC PRICE) BY YEAR
8% DECLINE IN SOLAR COSTS PER YEAR
PSEG LOAN
JCP&L/ACE10‐YR CONTRACT
SREC MARKET(3‐YR CONTRACT)
LCOE
Figures 2 and 3 show the results of sensitivity studies for a 4% decline and an 8% decline in required SREC prices per year:

MSEIA COMPARATIVE STUDY OF RATE IMPACTS BY PROGRAM 20
Finally, Figure 4 shows the results of sensitivity study based on a 10% decline in required SREC prices per year:
Discussion and Conclusions
This study was undertaken in order to provide quantitative analysis to support a policy choice being considered by the Transition Working Group, and in particular by the Board of Public Utilities with advice from the Office of the Rate Counsel. The choice may come down to two paths: one which places more emphasis on the EDC programs (PSE&G Loan, JCP&L/ACE 10-year contracts), or one which places more emphasis on the unstructured SREC market. One of these paths, over time, will produce lower SREC prices than the other.
Risk from the point of view of the ratepayer consists essentially of choosing the path that results in higher SREC prices over time, instead of the one which produces lower prices. The task of minimizing that risk can best be accomplished by utilizing all available data and analysis to choose the path most likely to produce the lowest SREC prices over time.
The results of the financial medeling and the analysis undertaken by MSEIA indicates that, based on the assumptions believed by MSEIA to fairly represent the solar market, the lowest SREC prices over time will be produced by the EDC programs – the PSE&G
‐
50
100
150
200
250
300
350
400
2012 2014 2016 2018 2020 2022 2024 2026Wei
gh
ted
Ave
rag
e S
RE
C P
rice
, $
Energy Year
FIGURE 4PREDICTED RATE IMPACT (WEIGHTED AVERAGE SREC PRICE) BY YEAR
10% DECLINE IN SOLAR COSTS PER YEAR
PSEG LOAN
JCP&L/ACE10‐YR CONTRACT
SREC MARKET(3‐YR CONTRACT)
LCOE

MSEIA COMPARATIVE STUDY OF RATE IMPACTS BY PROGRAM 21
Loan program and the JCP&L/ACE 10-year contract program. The graphs presented above indicate that on average over the period covered by the RPS law, the unstructured SREC market can be expected to require substantially higher SREC prices to produce the same results. This remains true over a range of assumptions regarding the rate of decline of the cost of solar power.
There are confounding factors which could affect this conclusion.
At very high rates of decline in the relative cost of solar power, the unstructured SREC market could drop below the SREC price required by the EDC programs in later years. However, even at rates of decline so high that MSEIA believes them to be unlikely, the average price of SRECs over the whole period remains higher for the unstructured SREC market. In addition, the models assume rational behavior on the part of investors in solar projects, as well as competitive behavior of the market as a whole. If the market is chronically oversupplied, and at the same time investors are willing to take unusual risks on projects out of desperation (or for whatever reason), then the unstructured SREC market could perform better than predicted relative to the EDC programs. On the other hand, if the market for SRECs is short or otherwise not intensely competitive, the unsturctured SREC market could remain above the minimum requirements calculated in this study. Likewise, if the solicitations in the 10-year contract program are not highly competitive, those prices could be higher than the minimum requirements calculated in this study. The foregoing confounding factors constitute the real risk factors related to the decision about which of the two paths to emphasize. These confounding factors could pull the conclusions of this study in either direction. However, the analysis showed a wide difference in rate impacts between the two paths, and the difference appeared to persist through a broad range of change in the most sensitive assumptions. MSEIA therefore believes that the probability is very high that the EDC programs will produce substantially lower rate impacts over the period covered by the RPS.