
MSE Working Papers WORKING PAPER 155/2017 … PAPER 155/2017 Zareena Begum Irfan Venkatachalam. L...
29
WORKING PAPER 155/2017 Zareena Begum Irfan Venkatachalam. L Jayakumar Satarupa Rakshit EVALUATION INDEX SYSTEM (EIS) FOR THE ECOLOGICAL- ECONOMIC- SOCIAL PERFORMANCES OF OUSTERI WETLAND ACROSS PUDUCHERRY AND TAMIL NADU MADRAS SCHOOL OF ECONOMICS Gandhi Mandapam Road Chennai 600 025 India January 2017
Transcript of MSE Working Papers WORKING PAPER 155/2017 … PAPER 155/2017 Zareena Begum Irfan Venkatachalam. L...
WORKING PAPER 155/2017
Zareena Begum Irfan
Venkatachalam. L
Jayakumar
Satarupa Rakshit
EVALUATION INDEX SYSTEM (EIS) FOR
THE ECOLOGICAL- ECONOMIC- SOCIAL PERFORMANCES OF OUSTERI WETLAND ACROSS PUDUCHERRY AND TAMIL NADU
MADRAS SCHOOL OF ECONOMICS Gandhi Mandapam Road
Chennai 600 025
India
January 2017
MSE Working Papers
Recent Issues
* Working Paper 145/2016 Contribution of Mangroves to Marine Fisheries in India Lavanya Ravikanth Anneboina and K. S. Kavi Kumar
* Working Paper 146/2016 Changing Trends of India’s Corporate Leverage – The Fault Lines Saumitra Bhaduri and Mriga Bansal
* Working Paper 147/2016 Benefits of Coastal Shipping: Scope For Sea Change In Domestic Freight Transportation In India Lavanya Ravikanth Anneboina and K. S. Kavi Kumar
* Working Paper 148/2016 Universal PDS: Efficiency and Equity Dimensions Sowmya Dhanaraj and Smit Gade
* Working Paper 149/2016 Interwar Unemployment in the UK and US: Old and New Evidence Naveen Srinivasan and Pratik Mitra
* Working Paper 150/2016 Anatomy of Input Demand Functions for Indian Farmers Across Regions Shrabani Mukherjee and Kailash Chandra Pradhan
* Working Paper 151/2016 Determinants of Outsourcing in the Automobile Sector in India Santosh K. Sahu and Ishan Roy
* Working Paper 152/2016 Evaluating Asian FTAs: What do Gravity Equation Models Tell Us? Sunder Ramaswamy, Abishek Choutagunta and Santosh Kumar Sahu
* Working Paper 153/2016 Asymmetric Impact of Relative Price Shocks in Presence of Trend Inflation Sartaj Rasool Rather
* Working Paper 154/2016 Triggers And Barriers for ‘Exclusion’ to ‘Inclusion’ in the Financial Sector: A Country-Wise Scrutiny Keshav Sood and Shrabani Mukherjee
* Working papers are downloadable from MSE website http://www.mse.ac.in $ Restricted circulation

i
Evaluation Index System (EIS) for the Ecological- Economic- Social Performances of Ousteri Wetland
across Puducherry and Tamil Nadu
Zareena Begum Irfan Corresponding Author
Associate Professor, Madras School of Economics
Venkatachalam. L Professor, Madras Institute of Development Studies, Gandhi Nagar, Adyar, Chennai
Jayakumar S
Associate Professor, Department of Ecology, Pondicherry University, Puducherry
and
Satarupa Rakshit Research Associate, Madras School of Economics

ii
WORKING PAPER 155/2017
January 2017
Price : Rs. 35
MADRAS SCHOOL OF ECONOMICS Gandhi Mandapam Road
Chennai 600 025 India
Phone: 2230 0304/2230 0307/2235 2157
Fax : 2235 4847/2235 2155
Email : [email protected]
Website: www.mse.ac.in

iii
Evaluation Index System (EIS) for the Ecological- Economic- Social Performances of Ousteri Wetland
across Puducherry and Tamil Nadu
Zareena Begum Irfan, Venkatachalam. L, Jayakumar S and Satarupa Rakshit
Abstract
Wetlands play a key role in the ecological conservation, in environmental quality improvement, and in human habitat environment improvement. Primer field investigations, primary survey and series of stakeholder meetings were utilised to evaluate the performance of the wetland. It was done using the complex index system covering wider aspect to correlate the comparative status of both Tamil Nadu and Puducherry zone of the Ousteri wetland. Compared with the researches applying the ecosystem service evaluation method, the proposed scoring method in this study can evaluate on some important performance indices (aquatic vegetation coverage, plant community integrity, integrity of management operating system, stakeholders feedback on the wetland protection, public satisfaction) that cannot be ignored and unable to be transformed to a monetary form. The Delphi method was used to screen preset 35 sub-indicators prior to evaluation. By using Delphi and Analytic Hierarchy Process method, as well as the weighted linear combination model, the ecological-economic-social performances were obtained. This indices system was applied to the case of Ousteri wetland with respect to Puducherry and Tamil Nadu scenario separately. With the help of the Evaluation Index system (EIS) established in this study, decision makers can obtain more omni-visual information so that an ecological subsidy policy by incorporating rewards and punishments mechanisms according to the performance evaluations can be formulated to enable the greatest returns on investment in the wetland conservative measure. Keywords: Wetland, Performance Evaluation, Evaluation Index System,
Conservation
JEL Codes: O13, Q15, Q56, N55, R11

iv
ACKNOWLEDGEMENT
The authors are grateful to their parent institutes, which provided them the infrastructural benefit of conducting the research work. The authors are also thankful to the funding agency Deutsche Gesellschaft für Internationale Zusammenarbeit (GIZ) GmbH, Indo-German Biodiversity Programme Office, New Delhi and Ministry of Environment, Forest and Climate Change, Government of India for their financial support. .
Zareena Begum Irfan
Venkatachalam, L.
Jayakumar, S.
Satarupa Rakshit

1
INTRODUCTION
Wetland provides a wide range of ecosystem goods and services for
human well-being through hydrologic, geochemical, and biological
functions functions (Costanza et. al., 1997; Molnar and Kubiszewski,
2012; Trabucchi et. al., 2012). Among these goods and services, the
mjor ones are habitat provision, biodiversity conservation, water
purification and recreation (Li et. al., 2008). Unfortunately, rapid
urbanization and growing population have brought excessive
anthropogenic influences to the wetland ecosystem (Mensing et. al.,
1998). As a result, the wetland ecosystem is facing disturbance, thus
gradually losing its original functions, goods and services.
Conservation scientists, national governments, and international
conservation groups seek to devise conservative measures to manage
the damaged and being damaged wetland ecosystems. However, what
should be emphasized is that the pre-set goals would not be certainly
achieved by following the planned ecological approaches needing
repeated modifications according to the follow-up evaluations of the
performance based on the conservative measures adapted. Lack of
performance evaluation would lead to wastage of scarce financial
resources and a risk of poorly designed and ineffective conservation
programs (Chow-Fraser, 1998). It is in urgent need to develop a
framework to evaluate the performance of the ecosystem services
provided by the ecosystem presently and to find the way of achieving
successful conservative method to improve the quality and the status of
an ecosystem goods and services.
The evaluation should involve indices with which a
comprehensive evaluation framework could possibly be built. Moore and
Hunt (2012) proposed a framework focusing on carbon
sequestration, vegetative diversity and cultural ecosystem service to
evaluate the efficiency of a wetland hydrology and its water quality.

2
Chang et. al. (2013) developed a systematic indices system to
quantify the performance of constructed wetlands’ functional capacity
by using DPSIR model (driving force, pressure, state-impact and
respond). In China, there were also some cases addressing the
ecosystem services provided by the goods of wetland ecosystem. For
example, based on system dynamics, a comprehensive model is proposed
in order to evaluate the performance of Qilihai Wetland, Tianjin City
(Guoetal, 2011). Zheng et. al. (2012) developed an indices system to
protect efficacy of national wetland reserves in China. Additionally, there
were other case studies to conduct performance evaluation of wetland in
light of ecosystem service (Horwitz and Finlayson, 2011; Jenkins et. al.,
2010; Liquete et. al., 2013). However there is a lack of indices system for
evaluation on the economic, ecological and social performances of
wetland.
In the present paper, an evaluation index system (EIS) has been
established to assess the performance of the Ousteri lake to mainly
address the following issues: (1) which ecosystem service is better
performing in the aspects of economic, social and ecological benefit
attained by local residents (2) discussions on the implications of
performance evaluation on ecological subsidy policy (3) recommending
approaches for enhancing ecological-economic-social performances. This
study will provide some useful information for decision makers to
improve the effectiveness of wetland conservative measure. The aim of
this analyses was to provide an indices system covering full ecological,
economic and social performances of wetland. The complex evaluation
was performed based on the inputs attained from the primary and
secondary survey along with the series of stakeholder meetings
conducted across various clusters of participants associated with the
benefits and loss attained from the Ousteri lake both directly and
indirectly.

3
Establishment of Evaluation Index System and Weighting
In purpose of evaluating the economic, social and ecological
performances of Ousteri wetland, the Delphi methods (Austen and
Hanson, 2008; Sagoff, 2011) were applied to screen the major indices
from 35 pre-set indices and Analytic Hierarchy Process (Wattage and
Mardle, 2006; Ouyang et. al., 2011; Guuo et. al., 2011; Cools et. al.,
2011) were used to weighting each index. The criteria to select the major
indexes are based on integrity, representativeness, and suitability for
comparable evaluation. In this study, we established two evaluation
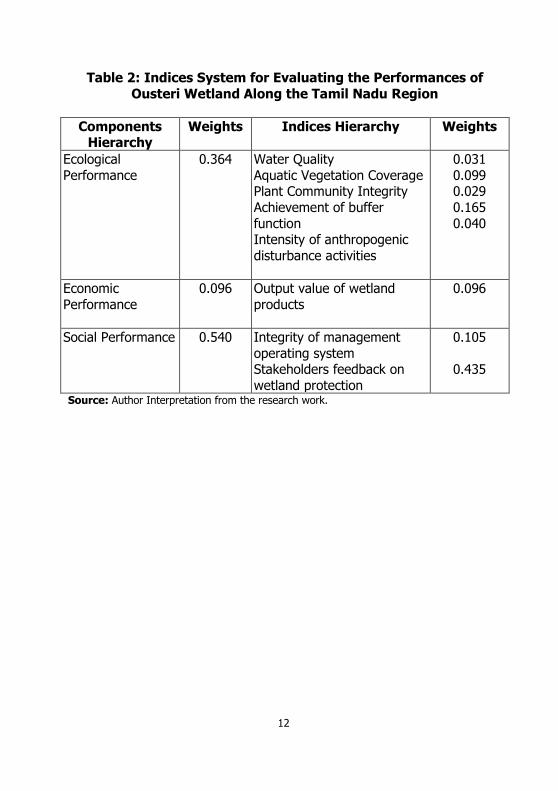
indices system for the Ousteri wetland across the Puducherry and Tamil
Nadu region indicated as EIS I and EIS II, respectively. 15 indices were
selected and measured for EIS I (Table 1 and Figure 1(a)), while 7
indices were measured for EIS II (Table 2 and Figure 1(b). Since wetland
across the Puducherry zone provides more benefits than across Tamil
Nadu, EIS I needs to be developed with more indicators than EIS II,
eight additional indices (botanic biodiversity, wetland tourism value,
increase of house price in the surrounding area of wetlands, public
awareness on wetland protection, public satisfaction, scientific education
service and job provision) were included in the indices system for
evaluating the performance of EIS I.
Index Explanation, Calculation and Scoring
The definition, explanation and calculation of 15 indices were described
as follows. The scoring criteria for each of the 15 indices are summarized
in Table 3.
Water Quality (WQ)
The integrated water quality assessment was adopted to measure the
water quality after implementing the conservative measure of the Ousteri
wetland. Water quality indicator was used to measure the function of
water purification provided by the conservative method. Five pollution
indicators were involved, including total phosphorus (TP), chemical
oxygen demand (CODMn), Arsenic, Lead and dissolved oxygen (DO). The

4
inde of water quality (P) was calculated as follows:
Pi =
∑
where n is the number of pollution indicators; Pi is the integrated
pollution index for pollutant i.
The Pi of TP, As, Pb and CODMn were calculated by
Pi =Ci /Si
where Ci is the concentration of pollutant i (mg/l); Si is national water
quality standard of pollutant i in India (mg/l).
The Pi of DO was calculated by
Pi =
Pi = 10-9 x
when DOi < DOs
DOf =
where DOf is the concentration of saturated DO (mg/l); DOs is the
national water quality standard of DO is India (mg/l); T is water
temperature (C).
The 5-points –scoring criterion for P is shown in Table 3.
Aquatic Vegetation Coverage (AVC)
Aquatic plants supply oxygen and provide shelter to aquatic animals, and
can be food for fishes. Aquatic vegetation coverage, defined as the
percentage of the total aquatic vegetation occupying the total wetland
area, was one of important indicators for measuring the aquatic habitat
(Zhao et. al., 2013); in this study we used this indicator. According to
Abbasi (1997), the maximum documented aquatic vegetation coverage of
natural wetland in Ousteri wetland was 60 percent. Meanwhile, according
to statistics, greening coverage in built-up area was 40 percent, which

5
was taken as a pass threshold reference. The 5-points-scoring criterion of
AVC for conservation to EIS Iis shown in Table 3. Since the EIS II were
mainly built for filtering out cyanobacteria and absorbing nutrient
pollutants, the plants with strong function of absorbing nutrient
pollutants such as reed were used for EIS II. Aquatic vegetation coverage
of 80-90 percent were recommended and preferred, which enable better
realizing the function of absorbing nutrient pollutants; so the aquatic
vegetation coverage for EIS II might require a greater degree than EIS I.
The 5-points-scoring criterion of AVC for EIS II is also shown in Table 3.
The aquatic vegetation coverage for each of the conservation was
obtained through site observation and through the feedback provided by
stakeholders.
Aquatic Botanic Biodiversity (ABB)
According to the Chari and Abbasi, 2003, there are 220 different kind of
aquatic species in Ousteri lake. After the conservative measure, the
aquatic botanic biodiversity is expected to increase. The increase in
aquatic botanic biodiversity provided more suitable habitat for aquatic
animals, thereby increasing aquatic animal biodiversity (Kentula, 2000).
In this study, we used aquatic botanic species expected to be attained by
conservative measure to the total documented botanic species in the
Ousteri lake, to measure the aquatic habit after the implementation. The
5-point scoring criterion of ABB is shown in Table 3.
Plant Community Integrity (PCI)
The integrity of wetland plant community indicated the health of its
ecosystem (Raab and Bayley, 2012). The integrity of plant community
should include five typical wetland plant communities, namely, the
submerged plants, the floating plant, the emerged plant, the helophyte
and the hygrophyte. In this study, as Table 3 shows, the score of plant
community integrity depends on the variety of plant community in the
present condition of the wetland.

6
Achievement of Buffer Function (ABF)
Buffer zone is the lake land ecotone which is adjacent to the rivers, lakes,
reservoirs and has certain buffering capacity for the pollutants, sediments
and floods (Natural Resources Conservation Service, 1998). Mauscutt et.
al. (1993) and Parkyn (2004) pointed out a narrow buffer zone (5-6 m) in
the subsurface can remove 80 percent of nitrate nitrogen. Hefting et. al.
(2003) reported that 10 m grass buffer zone can remove 96 percent of
nitrate nitrogen through the undercurrent water. Yang (2008) showed
that ammonia nitrogen purification rate was increased along with the
increase of the width of vegetation zone, and the purification rate was
approximately 75.2 percent if the width of buffer zone was 20-40 m. In
this study, the buffer function was the buffering capacity for the
pollutants and the achievement of buffer function was measured by the
width of buffer zone. The 5 points scoring criterion of achievement of
buffer function is shown in Table 3.
Habitat Protection and Improvement for Faunal Species
Faunal habitat function is one the wetlands fundamental ecological
services. Wetland provides shelter and food to wild animals, especially to
the migrants (Paulo and van den Bergh, 2011). In this study, the index of
habitat protection and improvement for fauna was measured by whether
there were core conservation zones for wildlife and the abundance of the
faunal species that could be gained after implementing the incentive
mechanism; abundance of wild life in the Ousteri lake was characterized
by the proportion of wildlife species observed to the whole information
documented of Ousteri lake. The 5 point scoring criterion of the habitat
protection and improvement for faunal species is shown in Table 3. From
the present study sampling and site investigation, it was inferred that
currently there are 166 bird’s species, 63 butterflies’ species, 9 frog
species, 3 turtle species, 10 lizard species, 15 snake species, 24 fish
species and 14 mammals found around the lake.
7
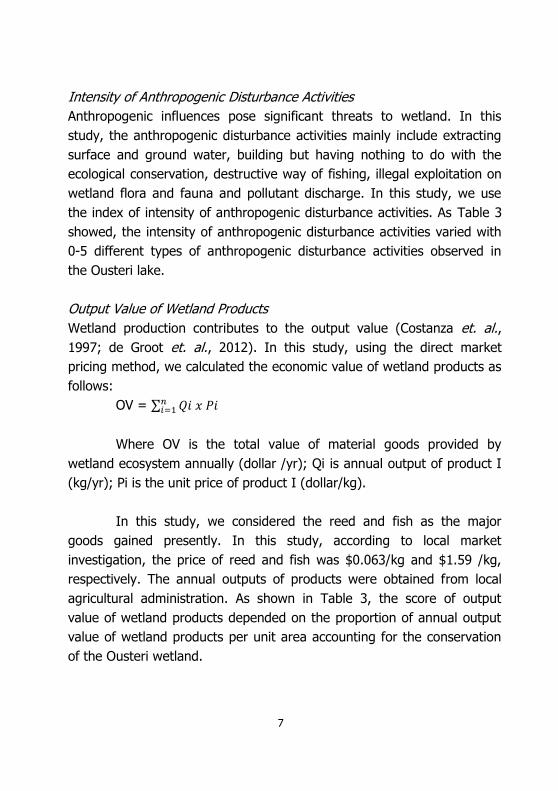
Intensity of Anthropogenic Disturbance Activities
Anthropogenic influences pose significant threats to wetland. In this
study, the anthropogenic disturbance activities mainly include extracting
surface and ground water, building but having nothing to do with the
ecological conservation, destructive way of fishing, illegal exploitation on
wetland flora and fauna and pollutant discharge. In this study, we use
the index of intensity of anthropogenic disturbance activities. As Table 3
showed, the intensity of anthropogenic disturbance activities varied with
0-5 different types of anthropogenic disturbance activities observed in
the Ousteri lake.
Output Value of Wetland Products
Wetland production contributes to the output value (Costanza et. al.,
1997; de Groot et. al., 2012). In this study, using the direct market
pricing method, we calculated the economic value of wetland products as
follows:
OV = ∑
Where OV is the total value of material goods provided by
wetland ecosystem annually (dollar /yr); Qi is annual output of product I
(kg/yr); Pi is the unit price of product I (dollar/kg).
In this study, we considered the reed and fish as the major
goods gained presently. In this study, according to local market
investigation, the price of reed and fish was $0.063/kg and $1.59 /kg,
respectively. The annual outputs of products were obtained from local
agricultural administration. As shown in Table 3, the score of output
value of wetland products depended on the proportion of annual output
value of wetland products per unit area accounting for the conservation
of the Ousteri wetland.

8
Wetland Tourism Value
Due to the biodiversity and pretty scenery, the wetland parks are often a
destination for tourists. Tourists need to pay for their visits to wetland
parks. Therefore, those payments and traveling time they took during the
visit could be regarded as the ecosystem services value (Costanza et. al.,
1997). In this study, in order to simply calculate, we used the annual
tourism income to measure the index of wetland tourism value. As shown
in Table 3, the scores for each of the wetland system’s were classified by
comparison with the average of annual tourism income per scenic area in
the Ousteri lake and the annual tourism income for each of the wetland
systems were all obtained from the tourism administration and through
primary survey.
Increase of House Price in Surrounding Area of Wetland
The availability of wetland system’s especially the rehabilitation of
wetland could stimulate the house price in surrounding area of wetland
(Kaza and BenDor, 2013). In this study, the score of the increase of
house price presently and attained after implementation of the wetland
system (Table 3). The house price in surrounding area of wetland was
obtained from local housing authority.
Integrity of Management Operating System
The management of Ousteri wetland plays a significant role in the
realization of wetland’s ecological service. A full integrity of management
operating system should include four components: administration of
wetland, effective implementation of administration, adequate organizers
and managers, and sufficient funds for the sustainable management of
the wetland. As shown in Table 3, the score of the integrity of the
management operating system varied with the presence of the four
components of management operating system.
Stakeholder’s Feedback on Wetland Protection
The information on the opinion of bureaucrats, academicians, politicians,

9
local communities and non-governmental bodies was obtained through
the six round of stakeholder meetings conducted from October 2014 to
February 2015 across the Puducherry and Tamil Nadu region of the
Ousteri lake. These meetings were focused in order to collect the details
and feedback of stakeholders with regards to the conserving of wetland
and adopting the incentive mechanism to conserve the lake. In this
study, the information was segregated across five disciplines: well known
issue which needs to resolve through with mutual colloraboration, issue
across Puducherry alone, issue prevails because of Tamil Nadu, issue
prevails because of anthropogenic activities and no problem faced. Then
the scores of stakeholder’s feedback on wetland protection were
measured by the percentage of respondents who were in level of which
category of opinion (Table 3).
Public Satisfaction
Through face-to face interviews, we measured the public satisfaction by
calculating the percentage of interviewers who were satisfied with the
Ousteri wetland system across Puduchery and Tamil Nadu labelled as ES
I and ES II, respectively. In this study, the five point scoring creiteria was
used to rate the public satisfaction (Table 3).
Scientific Education Service
The wetlands can serve as educational spot for students and scientific
research locations for researchers. For the Ousteri wetland system, the
ecological education areas with the function of popularization of wetland
conservation knowledge were preferred to be built for visitors. In this
study, as shown in the Table 3, the score of scientific education service
depended on whether there were ecological education areas or not, and
the percentage of scientific researchers accounting.

10
Weighted Linear Combination and the Final Performance
Categorization
Finally, the weighted linear combination (WLC) was applied for
calculating the ecological-economic-social performances of the Ousteri
wetland system. The combination of the components, according to the
WLC model, is carried out as the following equation
FEESP = ∑
where FEESP was the final score of the ecological-economic-social
performance: indicatori was the score of indicator i of the evaluated
wetland system. Weighti was the weight corresponding to the ith
indicator.
The final ecological-economic-social performances ranged from 0
to 100. The results of evaluations were finally divided into five levels with
a centesimal grade (Table 3).

11
Table 1: Indices System for Evaluating the Performance of
Ousteri Wetland Along the Puducherry Region
Components Hierarchy
Weights Indices Hierarchy Weights
Ecological
Performance
0.428 Water Quality
Aquatic Vegetation Coverage Aquatic botanic biodiversity
Plant Community Integrity
Achievement of buffer function
Habitat protection and improvement
Intensity of anthropogenic disturbance activities
0.240
0.028 0.033
0.015
0.021 0.004
0.087
Economic Performance
0.096 Output value of wetland products
Wetland tourism value
Increase of house price in the surrounding area of weltands
0.068 0.017
0.011
Social Performance 0.476 Integrity of management
operating system
Stakeholders feedback on wetland protection
Public satisfaction Scientific education service
0.020
0.242
0.013 0.201
Source: Author Interpretation from the research work.
12
Table 2: Indices System for Evaluating the Performances of
Ousteri Wetland Along the Tamil Nadu Region
Components Hierarchy
Weights Indices Hierarchy Weights
Ecological
Performance
0.364 Water Quality
Aquatic Vegetation Coverage Plant Community Integrity
Achievement of buffer
function Intensity of anthropogenic
disturbance activities
0.031
0.099 0.029
0.165
0.040
Economic
Performance
0.096 Output value of wetland
products
0.096
Social Performance 0.540 Integrity of management
operating system Stakeholders feedback on
wetland protection
0.105
0.435
Source: Author Interpretation from the research work.

13
Table 3: Scoring Criteria
Indices Score
5 point 4 point 3 point 2 point 1 point
Water Quality P< 0.2 0.2 P < 0.4 0.4 P <0.7 0.7 P <1.0 P 1.0
Aquatic Vegetation Coverage ES I
65-80 percent 45-65 percent 25-45 percent 25 percent
Aquatic Vegetation Coverage ES II
45-65 percent 35-45 percent 25-35 percent 25 percent
Aquatic botanic biodiversity
40 percent 30-40 percent 20-30 percent 10-20 percent
Plant Community Integrity
All of the 5 typical wetland communities
4 typical wetland plant communities
3 typical wetland plant communities
2 typical wetland plant communities
1 typical wetland plant communities
Achievement of buffer function
Width of buffer zone
Width of buffer zone 20 -30 m
Width of buffer zone 10-20 m
Width of buffer zone 5-10 m
Width of buffer zone
Faunal Habitat protection and improvement
Having core conservation zone and abundance of fauna in the Ousteri wetland
Having core conservation zone and abundance of fauna in Ousteri wetland 30-60 percent
Having core conservation zone and abundance of fauna in Ousteri wetland
Having core conservation zone, but few fauna observed in the Ousteri wetland
Lack of core conservation zone and few fauna observed in the Ousteri wetland
Intensity of anthropogenic disturbance activities
No human disturbance activities in the Ousteri wetland
1 type of human disturbance activities in the Ousteri wetland
2-3 types of human disturbance activities in the Ousteri wetland
4 types of human disturbance activities in the Ousteri wetland
5 types of human disturbance activities in the Ousteri wetland
Output value of wetland products
Annual Output value of wetland products per unit area if more than 2 percent of Ousteri wetland
Annual Output value of wetland products per unit area is 1.5 - 2 percent of Ousteri wetland
Annual Output value of wetland products per unit area is 1-1.5 percent of Ousteri wetland
Annual Output value of wetland products per unit area is less than 1 percent but >0 of Ousteri wetland
No Output value of wetland products as of Ousteri wetland
(Table contd…)

14
(Table contd…) Wetland tourism value
Atleast 10 percent less than the average annual tourism income per scenic area of Ousteri wetland
0-10 percent less than the average annual tourism income per scenic area of Ousteri wetland
Approaching the average annual tourism income per scenic area of Ousteri wetland
0- 10 percent more than the average annual tourism income per scenic area of Ousteri wetland
Atleast 10 percent more than the average annual tourism income per scenic area of Ousteri wetland
Increase of house price in the surrounding area of weltands
Annual growth on house price
15 percent per year
Annual growth on house price 10 - 15 percent per year
Annual growth on house price 5-10 percent per year
Annual growth on house price
5 percent per year
No annual growth on house price or negative impact of price of house per year
Integrity of management operating system
All of 4 components of management operating system
3 components of management operating system
2 components of management operating system
1 components of management operating system
No management operating system
Stakeholder feedback on wetland protection
The percentage of stakeholders who think that the conservation of the Ousteri wetland could be achieved only through mutual colloraboration between the Puducherry and Tamil Nadu government
The percentage of stakeholders who have public awareness on wetland protection 90
percent
The percentage of stakeholders who have public awareness on wetland protection
The percentage of stakeholders who have public awareness on wetland protection
The percentage of stakeholders who have public awareness on wetland protection
Public satisfaction
The percentage of stakeholders who are presently satisfied with Ousteri wetland conditions 90-100 percent
The percentage of stakeholders who are presently satisfied with Ousteri wetland conditions 80-90 percent
The percentage of stakeholders who are presently satisfied with Ousteri wetland conditions 70-80 percent
The percentage of stakeholders who are presently satisfied with Ousteri wetland conditions 60-70 percent
The percentage of stakeholders who are presently satisfied with Ousteri wetland conditions <60 percent
(Table contd…)

15
(Table contd…) Scientific education service
There were ecological education areas and the scientific researchers accounted for more than 15 percent of the visitors
There were ecological education areas and the scientific researchers accounted to less than 15 percent of the visitors
No ecological education areas; but the scientific researchers accounted for more than 15 percent of the visitors
No ecological educations areas and the scientific researchers accounted for less than 15 percent of the visitors
No ecological education areas and no scientific researchers
Job provision Very high job provision
High job provision
Many job provision
Low job provision
Very low job provision
Note:
The score ranged from 1 to 5; 5 point indicated the best performance, while 1 point
indicated the worst performance
P is the index of water quality calculated by equation 1
Aquatic botanic biodiversity was measured by the percentage of aquatic botanic species
which could be attained by conservative measure to the total documented botanic
species in the Ousteri lake
The integrity of plant community should include 5 typical wetland plant communities;
namely the submerged plants, the floating plants, the emerged plants, the helophyte
plant and the hygrophyte
The aquatic fauna habitat protection and improvement was measured by whether there
were core conservation zones, and the abundance of fauna which could be achieved
by EIS I; abundance of fauna through conservative measure was characterized by the
proportion of fauna species observed in the EIS II to the whole Ousteri wetland’s
documented faunal species
Source: Author Interpretation from the research work.
In this study, the anthropogenic disturbance activities mainly
include extracting surface and ground water, building but having nothing
to do with the ecological conservation, destructive way of fishing, illegal
exploitation on wetland flora and fauna and pollutant discharge
We used the number of visitors to measure the index of wetland
tourism value; the average tourism income per scenic area in Ousteri
lake and the annual tourism income for each of the conservative measure
were all obtained from the tourism administration and through primary
survey.

16
A full integrity of management operating system should include
four components, namely administration of wetland, effective
implementation of administration, adequate organizers and managers
and sufficient funds for sustainably managing the Ousteri wetland
Table 4: Final Categorization of Performance
Level Very poor Poor Fair Good Excellent
Scores 0-30 30-60 60-70 70-85 85-100
Source: Author Interpretation from the research work.
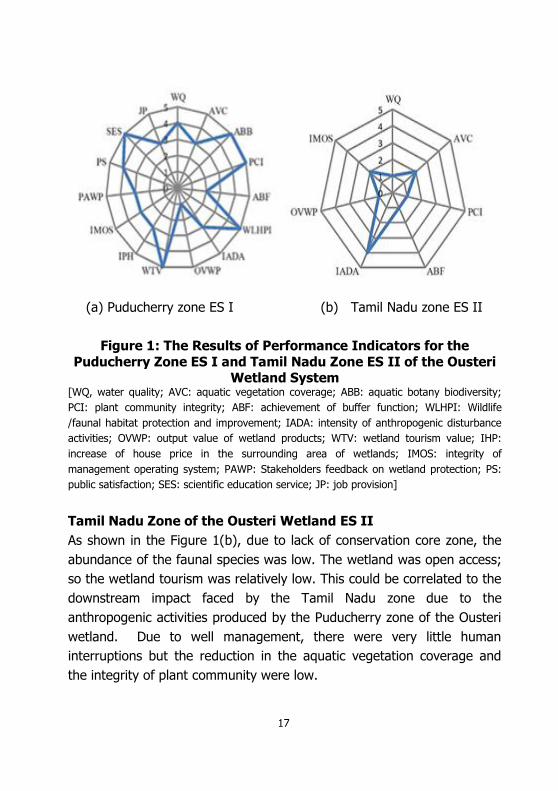
The Performance of the Ousteri Wetland System ES I and ES II
Puducherry Zone of the Ousteri Wetland ES I
According to our field investigation (Figure 1(a), primary survey and the
stakeholder discussions, it was observed that the aquatic botanic
biodiversity was high and wetland plant community in the Ousteri
wetland across the Puducherry zone of the Ousteri wetland was relatively
complete, making it a beautiful scenic spot and attracting a large number
of visitors daily. However, due to lack of management operating system,
the increasing human disturbance activities were observed, which posed
severe threats to the wetland ecosystem and caused the low water
quality. Though there was no conservation core zone, migratory birds can
be found regularly. There were no ecological education areas that should
be paid more attention in the future. The migrant birds were frequently
observed and the biodiversity of aquatic animal ecosystem was high.
Therefore, it could be observed that in overall, the Ousteri
wetland witnessed a nearly complete plant community and a wide buffer
zone. However, strong human interruptions were observed in the Ousteri
wetland; hence it was under severe threats and the water quality was
low.
17
(a) Puducherry zone ES I (b) Tamil Nadu zone ES II
Figure 1: The Results of Performance Indicators for the
Puducherry Zone ES I and Tamil Nadu Zone ES II of the Ousteri Wetland System
[WQ, water quality; AVC: aquatic vegetation coverage; ABB: aquatic botany biodiversity;
PCI: plant community integrity; ABF: achievement of buffer function; WLHPI: Wildlife
/faunal habitat protection and improvement; IADA: intensity of anthropogenic disturbance
activities; OVWP: output value of wetland products; WTV: wetland tourism value; IHP:
increase of house price in the surrounding area of wetlands; IMOS: integrity of
management operating system; PAWP: Stakeholders feedback on wetland protection; PS:
public satisfaction; SES: scientific education service; JP: job provision]
Tamil Nadu Zone of the Ousteri Wetland ES II
As shown in the Figure 1(b), due to lack of conservation core zone, the
abundance of the faunal species was low. The wetland was open access;
so the wetland tourism was relatively low. This could be correlated to the
downstream impact faced by the Tamil Nadu zone due to the
anthropogenic activities produced by the Puducherry zone of the Ousteri
wetland. Due to well management, there were very little human
interruptions but the reduction in the aquatic vegetation coverage and
the integrity of plant community were low.

18
CONCLUSION
Wetlands play a key role in the ecological conservation, in environmental
quality improvement, and in human habitat environment improvement.
Primer field investigations, primary survey and series of stakeholder
meetings were utilized to evaluate the performance of the wetland. It
was done using the complex index system covering wider aspect to
correlate the comparative status of both Tamil Nadu and Puducherry
zone of the Ousteri wetland. Compared with the researches applying the
ecosystem service evaluation method, the proposed scoring method in
this study can evaluate on some important performance indices (aquatic
vegetation coverage, plant community integrity, integrity of management
operating system, stakeholders feedback on the wetland protection,
public satisfaction) that cannot be ignored and unable to be transformed
to a monetary form.
The Delphi method was used to screen preset 35 sub-indicators
prior to evaluation. After the survey, fifteen indexes were selected and
measured for the wetland system ES I representing Puducherry while
seven indexes were measured for the ES II representing the Tamil Nadu
zone of the Ousteri wetland. By using Delphi and Analytic Hierarchy
Process method, as well as the weighted linear combination model, the
ecological-economic-social performances were obtained. This indices
system was applied to the case of Ousteri wetland with respect to
Puducherry and Tamil Nadu scenario separately.
With the help of the Evaluation Index system (EIS) established in
this study, decision makers can obtain more omni-visual information so
that an ecological subsidy policy by incorporating rewards and
punishments mechanisms according to the performance evaluations can
be formulated to enable the greatest returns on investment in the
wetland conservative measure. By investigating the wetland system with
good ecological, economic and social performances, the experience of
successes included all of the management right (management right,

19
disposition right, and the right to benefit from wetland management)
demised to the private, the development of management system,
improvement in education level of managers, scientific wetland plant
community composition and spatial patterns and the ticketing for
entering the wetland park. It should be emphasized that the proposed
indices system is not only applicable to this case study, but also suitable
to be applied to conduct ecological, economic, and social performance for
wetland in other areas.

20
REFERENCES
Austen,E.I.and,A(2008),”Identifying Wetland Compensation Principles an
d Mechanisms for Atlantic Canada Using a Delphi Approach”,
Wetlands 28 (3), 640–655.
Chang, H.T., Yang, l., Yeh, S.C and Chen,H.W (2013), “Systematic index frame for functional assessment of constructed wetlands”, Ocean and Coastal Management 73,145-152.
Chow-Fraser,P (1998), “A Conceptual Ecological Model to aid restoration
of Cootes Paradise Marsh, a degraded Coastal Wetland of Lake Ontario, Canada”, Wetlands Ecology and Management 6(1),43-
57.
Cools, J., Johnston, R., Hattermann, F.F., Douven, W., Zsuffa,I (2013),
“Tools for Wetland Management: Lessons from a Comparative Assessment”, Environment Science and Policy 34(0), 138-145.
Costanza, R., d’Arge, R., De Groot, R., Farber, S., Grasso, M., Hannon,
B., Limburg, K., Naeem, S., O’niell, R.V., Paruelo, J (1997), “The
value of the world’s Ecosystem Services and Natural Capital Nature 387 (6630)”, 253-260.
de Groot, R., Brander, L., Van der Ploeg, S., Costanza, R., Bernard, F.,
Braat, L., Chirstie, M., Crossman, N., Ghermandi, A., Hein, L.,
Hussian, S., Kumar, P., McVittie, A., Portela, R., Rodriguez, L.C., ten Brink, P., vanBeukering, P (2012), “Global estimates of the
value of Ecosystems and their services in Monetary Units”,Ecosystem Services 1(1), 50-61.
Guo, T., Zhang, X., Cheng, T (2011), “Evaluation of wetland restoration
project based on SD: a case study on Qilihai Wetland in Tianjin”,
Procedia Environment Science 10 (Part C),2587–2593.
Hefting, M.M., Bobbink, R., de Caluwe, H (2003), “Nitrous oxide emission and denitrification in chronically nitrate loaded riparian buffer
zones”, Journal of Environmental Quality 32, 1194–1203.

21
Horwitz, P and Finlayson, C.M (2011), “Wetlands as settings for human
health: incorporating ecosystem services and health impact assessment into water resource management”, Bioscience 61 (9),
679–688.
Jenkins, W.A., Murray, B.C., Kramer, R.A., Faulkner, S.P (2010), “Valuing ecosystem services from wetlands restoration in the Mississippi
Alluvial Valley”, Ecological Economics 69, 1051–1061.
Kaza, N and BenDor, T.K (2013), “The land value impacts of wetland
restoration”, Journal of Ecological Management 127, 289–299.
Kentula, M.E (2000), “Perspectives on setting success criteria for wetland
restoration”, Ecological Engineering 15 (3–4), 199–209.
Li, L., Li, Y., Biswas, D.K., Nian, Y.G., Jiang, G.M (2008), “Potential of constructed wetlands in treating the eutrophic water, evidence
from Taihu Lake of China”, Bioresoure Technology 99 (6), 1656–1663.
Liquete, C., Zulian, G., Delgado, J., Stips, A., Maes, J (2013), “Assessment of coastal protection as an ecosystem service in
Europe”, Ecological Indicators 30, 205–217.
Mensing, D.M., Galatowitsch, S.M., Tester, J.R (1998), “Anthropogenic
effects on the biodiversity of riparian wetlands of a northern temperate landscape”, Journal of Ecological Management 53 (4),
349–377.
Molnar, J.L., Kubiszewski, I (2012), “Managing natural wealth, research and implementation of ecosystem services in the United States
and Canada”, Ecosystem Services 2, 45–55.
Moore, T.L., Hunt, W.F (2012), “Ecosystem service provision by storm
water wetlands and ponds – a means for evaluation?”, Water Resource 46 (20), 6811–6823.
Natural Resources Conservation Service (NRCS), Buffer strips: Common
sense conservation. Available online at http://www.nrcs.usda.gov/feature/buffers/. Accessed 29
September 2009.

22
Ouyang, N.L., Lu, S.L., Wu, B.F., Zhu, J.J., Wang, H (2011), “Wetland restoration suitability evaluation at the watershed scale – a case
study in upstream of the Yongdinghe River”, Procedia Environment Science, 10 (Part C), 1926–1932.
Parkyn, S (2004), “Review of Riparian Buffer Zone Effectiveness”,
Ministry of Agriculture and Forestry Technical Paper No. 2004/05,
Wellington, New Zealand.
Paulo, A.L.D.N., van den Bergh, J.C.J.M (2011), “Economic valuation of biodiversity: sense or nonsense”, Ecological Economics 39, 203–
222.
Raab, D., Bayley, S.E(2012), “A vegetation-based index of biotic integrity
to assess marsh reclamation success in the Alberta oil sands, Canada”, Ecological Indicators 15 (1), 43–51.
Sagoff, M (2011), “The quantification and valuation of ecosystem
services”, Ecological Economics 70 (3), 497–502.
Trabucchi, M., Ntshotsho, P., O'Farrell, P., Comin, F.A (2012), “Ecosystem
service trends in basin-scale restoration initiatives, A Review”, Journal of Environmental Management 111, 18–23.
Wattage, P., Mardle, S (2006), “Valuing wetland aquatic resources using the analytic hierarchy process. In: Herath, G. (Ed.), Using Multi-
Criteria Decision Analysis in Natural Resource Management, Empirical Applications”, Ashgate Pub Co, UK, pp. 205.
Zhao, D.H., Lv, M.T., Jiang, H., Cai, Y., Xu, D.L., An, S.Q (2013), “Spatio-
temporal variability of aquatic vegetation in Taihu Lake over the
past 30 years”, PLoS One 8 (6), 1–7.
Zheng, Y.M., Zhang, H.Y., Niu, Z.G., Gong, P (2012), “Protection Efficacy of National Wetland Reserves in China”, Chinese Science Bulletin
57 (1), 1–24.

* Monograph 24/2013 Estimation and Forecast of Wood Demand and Supply in Tamilandu K.S. Kavi Kumar, Brinda Viswanathan and Zareena Begum I
* Monograph 25/2013 Enumeration of Crafts Persons in India Brinda Viswanathan
* Monograph 26/2013 Medical Tourism in India: Progress, Opportunities and Challenges K.R.Shanmugam
* Monograph 27/2014 Appraisal of Priority Sector Lending by Commercial Banks in India C. Bhujanga Rao
* Monograph 28/2014 Fiscal Instruments for Climate Friendly Industrial Development in Tamil Nadu D.K. Srivastava, K.R. Shanmugam, K.S. Kavi Kumar and Madhuri Saripalle
* Monograph 29/2014 Prevalence of Undernutrition and Evidence on Interventions: Challenges for India Brinda Viswanathan
* Monograph 30/2014 Counting The Poor: Measurement And Other Issues C. Rangarajan and S. Mahendra Dev
* Monograph 31/2015 Technology and Economy for National Development: Technology Leads to Nonlinear Growth Dr. A. P. J. Abdul Kalam, Former President of India
* Monograph 32/2015 India and the International Financial System Raghuram Rajan
* Monograph 33/2015 Fourteenth Finance Commission: Continuity, Change and Way Forward Y.V. Reddy
* Monograph 34/2015 Farm Production Diversity, Household Dietary Diversity and Women’s BMI: A Study of Rural Indian Farm Households Brinda Viswanathan
* Monograph 35/2016 Valuation of Coastal and Marine Ecosystem Services in India: Macro Assessment K. S. Kavi Kumar, Lavanya Ravikanth Anneboina, Ramachandra Bhatta, P. Naren, Me-gha Nath, Abhijit Sharan, Pranab Mukhopadhyay, Santadas Ghosh, Vanessa da Costa, Sulochana Pednekar
MSE Monographs

WORKING PAPER 155/2017
Zareena Begum Irfan
Venkatachalam. L
Jayakumar
Satarupa Rakshit
EVALUATION INDEX SYSTEM (EIS) FOR
THE ECOLOGICAL- ECONOMIC- SOCIAL PERFORMANCES OF OUSTERI WETLAND ACROSS PUDUCHERRY AND TAMIL NADU
MADRAS SCHOOL OF ECONOMICS Gandhi Mandapam Road
Chennai 600 025
India
January 2017
MSE Working Papers
Recent Issues
* Working Paper 145/2016 Contribution of Mangroves to Marine Fisheries in India Lavanya Ravikanth Anneboina and K. S. Kavi Kumar
* Working Paper 146/2016 Changing Trends of India’s Corporate Leverage – The Fault Lines Saumitra Bhaduri and Mriga Bansal
* Working Paper 147/2016 Benefits of Coastal Shipping: Scope For Sea Change In Domestic Freight Transportation In India Lavanya Ravikanth Anneboina and K. S. Kavi Kumar
* Working Paper 148/2016 Universal PDS: Efficiency and Equity Dimensions Sowmya Dhanaraj and Smit Gade
* Working Paper 149/2016 Interwar Unemployment in the UK and US: Old and New Evidence Naveen Srinivasan and Pratik Mitra
* Working Paper 150/2016 Anatomy of Input Demand Functions for Indian Farmers Across Regions Shrabani Mukherjee and Kailash Chandra Pradhan
* Working Paper 151/2016 Determinants of Outsourcing in the Automobile Sector in India Santosh K. Sahu and Ishan Roy
* Working Paper 152/2016 Evaluating Asian FTAs: What do Gravity Equation Models Tell Us? Sunder Ramaswamy, Abishek Choutagunta and Santosh Kumar Sahu
* Working Paper 153/2016 Asymmetric Impact of Relative Price Shocks in Presence of Trend Inflation Sartaj Rasool Rather
* Working Paper 154/2016 Triggers And Barriers for ‘Exclusion’ to ‘Inclusion’ in the Financial Sector: A Country-Wise Scrutiny Keshav Sood and Shrabani Mukherjee
* Working papers are downloadable from MSE website http://www.mse.ac.in $ Restricted circulation