
Ms. ZEBA NAGEEN Mr. S. MUSTAFA ZAIDIbibliometrics 3 - 22 citation analysis 23 - 28 chapter two: weed...
119
LITERATURE ON WEED AND WEED CONTROL A BIBLIOMETRIC ANALYSIS 1994-1998 J>tSS6f^lAHON Submitted in partial fulfillment of the Requirements for the Award of the Degree of inafifter of Hfbrarp anh ^Information Science 1998-99 BY Ms. ZEBA NAGEEN Roll No. 98-LSM-04 Enrol. No. AA-8300 UNDER THE SUPERVISION OF Mr. S. MUSTAFA ZAIDI (Reader) DEPARTMENT OF LIBRARY AND INFORMATION SCIENCE ALIGARH MUSLIM UNIVERSITY, ALIGARH (INDIA) 1999
Transcript of Ms. ZEBA NAGEEN Mr. S. MUSTAFA ZAIDIbibliometrics 3 - 22 citation analysis 23 - 28 chapter two: weed...

LITERATURE ON WEED AND WEED CONTROL A BIBLIOMETRIC ANALYSIS
1994-1998
J>tSS6f^lAHON Submitted in partial fulfillment of the Requirements
for the Award of the Degree of
inafifter of Hfbrarp anh ^Information Science 1998-99
BY
Ms. ZEBA NAGEEN Roll No. 98 -LSM-04 Enrol. No. AA-8300
UNDER THE SUPERVISION OF
Mr. S. MUSTAFA ZAIDI (Reader)
DEPARTMENT OF LIBRARY AND INFORMATION SCIENCE ALIGARH MUSLIM UNIVERSITY,
ALIGARH (INDIA)
1999

DS307A
[ ( Ace;J;,.;.'- ) r ]


Phones: (0571) 40009 Internal 193
Telex: 564-230 AMU IN Fax: 91-0531-400528
DEPARTMENT OF LIBRARY & INFORMATION SCIENCE Aligarh Muslim University, Aligarh - 202002 (U.P.), India
Certificate
Ok id id to certifu that ff/i. /leba riaaeen had conipleted
ker diddertation entitled lA/eed ana vweea L^ontrol
^>v f^ipliometric J^tuau in partial fulfilment of the
reauirementd for the aearee of nfadter of cJLioraru ana
information Science. J^he had conauctea tke work
under mu duperuidion.
^.(^CM.Sl.'^auA Reader

CONTENTS
ACKNOWLEDGEMENT
INTRODUCTION 1 - 2
CHAPTER - ONE:
BIBLIOMETRICS 3 - 22
CITATION ANALYSIS 23 - 28
CHAPTER TWO:
WEED & WEED CONTROL 29 - 58
CHAPTER THREE:
OBJECTIVE, SCOPE AND METHODOLOGY 59 - 66
CHAPTER FOUR: DATA ANALYSIS, INTERPRETATION AND REPRESENTATION 67 - 91
LEVEL-2: CITATION ANALYSIS 92-103
APPLICATION OF BIBLIOMETRICS LAWS 104-108
CONCLUSION 109 - 111

ACKNOWLEDGEMENT
At first let me express my endless thanks to the Almighty who is
our expression for all forces and powers which we do not understand or
with which we are unfamiliar.
I take this opportunity to express my deepest sense of gratitude to
my supervisor Mr. S. Mustafa K.Q.Zaidi, Reader, Department of Library
& Information Science, A.M.U., Aligarh for suggesting the problems
extending his guidance and continual assistance remaining for me a source
of encouragement during the entire course of investigation.
I feel immense pleasure in expressing my regard, deep sense of
gratitude heartful devotion to Mr. Shabahat Husain, Professor and
Chairman, Department of Library & Information Science, A.M.U., Aligarh
for his useful and unavailable suggestions which greatly help me to come
out from difficulties faced during the work.
I am thankful to my teachers Ms Nishat Fatima, Mr. Naushad AH,
Mr. Masoom Raza, Ms Sudharma Haridasan, Lecturers, Department of
Library & Information Science, A.M.U., Aligarh for extending their
support.
I am thankful to my seminar incharge Mr. Riaz Abbas and Mr. Israr

Ahmad and office staff of the Department of Library & Information
Science, A.M.U., Aligarh for their cooperation.
I am also thankful to Mr. Mohd Riaz Khan for typing dissertation
very neat and clean in a very short period of time.
Last but not least, I am grateful to all my family members who were
always there besides me and helped in so many different ways, without
whose support and contribution my work would not have been upto the
mark.
( Zeba Nageen)

INTRODUCTION
"Weed and Weed Control" being a major subject of
research makes an important part of collection in any library.
Moreover, this being a specific field of research assumes a
special significance for the university library. Books, journals,
projects and research paper on this topic are quite considerable
in number. Therefore, a bibliometric study of the published
material on this subject of the past 5 years was taken up.
In the queantitative analysis of the topic I have tried to
identify the core journals, frequency of the publication,
productivity of the authors and language which is frequently
used in the written document. The process adopted for the
quantitative analysis was done on lines of suggestions given by
eminent authorities like Price and Ravichandra Rao.
Citation counts are used in measuring the adequacy and
organisation of library. Therefore, citation analysis forms second
level of analysis in this dissertation where the citation of the
articles, authors, institution and scientific activities are counted
in order to identify the connection between the two documents
and put them in order so that the users may find it more

organised and easy to approach.
Hope this study will contribute in systematic analysis and
organisation of the recorded documents on "Weed and Weed
Controol" in the library.
The dissertation has been divided into four chapters. The
first chapter deals with the theory of bibliometrics and citation
analysis. Second chapter covers the topic i.e. Weed and Weed
Control. Objective, Scope and Methodology is the third chapter.
Data Analysis, Interpretation and Representation is the fourth
chapter. Conclusion has been defined as last part of the
dissertation.

BIBLIOMETRICS
1. Introduction:
Bibliometrics is relatively a subject of recent origin. It
is that branch of information science which lies between the
border areas of the social and physical sciences. It is a
quantitative study of various aspects of literature on a topic
and is used to identify the pattern of publication, authorship,
citations and/or secondary journal coverage with the objective
of getting an insight into the dynamics of the growth of
knowledge in the areas under consideration. This all
consequently leads to the better organisation of information
resources which is essential for its most effective and efficient
use. Bibliometrics today has attained sophistication and
complexity having national, international, and interdisciplinary
character. As Lawani says, "Bibliometrics has clearly become
established as a sub-discipline with application in the history
and sociology of knowledge in communication and information
science".
Though the term 'Bibliometrics' was first coined by
Pritchard in 1969, its usage and practice can be traced back
to the second decade of this century. A pioneer example is of
a bibliometric study conducted by Cole and Eales in 1917. They
conducted a 'statistical analysis of the literature* of
comparative anatomy from 1543 to 1860 by counting the
number of titles, both books and journal articles, and grouping
them by countries of origin within periods. It was followed in
1923 by a second study "Statistical analysis of the history of
science" by Hulme. His analysis was based on the original
entries in the seventeen sections of the "English International
Catalogue of Scientific Literature (rank orders and so on). The
third study was the pioneering work of Gross and Gross
reported in 1927. They used the method of counting and
analysing the citations appended to articles in the Journal of
the American Chemical Society, and produced a list of journals
of 'importance in chemical education. As per the historians of
bibliometrics, this was the first recorded study based on
counting and analysing of citation i.e. citation analysis. The
fourth and the most prominent work was of Bradford in 1943
on the distribution of papers among journals in Applied
Geophysics and in Lubrication Research. It formed the
backbone of the theoretical foundation of the 'Bibliometric'
study, known as the "Bradfrod's law of Scattering".

The British Librarian, Alan Pritchard, was credited with
introducing the term "Bibliometrics" in 1969 to replace the
term "Statistical bibliography." He did not find the term
"Statistical bibliography' at all satisfactory, as used by Hulme
According the him "the term is clumsy, not very descriptive and
can be confused with statistics itself or bibliographies on
statistics. Thereafter, a lot of studies were made in this field
by various scientists. Desolla Price published some of the first
observations of exponential rate of growth in the number of
scientific formulas. More recently in 1971 Goffiman developed
the Epidemic Theory for the growth rate of specific scientific
area of activity Vickery, Clark and others have also illustrated
a recent application of this type of analysis.
3. Other Analogous Terms:
Bibliometric is just one of the many sciences whose name
ends with "metrics". Many scientists have used the term under
different names, but the concepts were more or less
supplementary and complementary to each other with some
broader and narrower extension of an idea. One name that was
used quite early but very scarcely was statistical analysis of
the literature' by Cole and Eale in 1917., while Hulme used

the term as 'Statistical Bibliography' in 1923. In 1948, the
great Indian library scientist, S.R. Ranganathan, coined the term
"Librametry", which historically appeared first and perhaps
seemed proper to streamline the services of librarianship. The
term 'Bibliometrics' is just analogous to Ranganathan's
"Librametrics', the Russian concept of 'Scientometrics, FID's
'Informetrics' and to some other well established sub-
disciplines like Econometrics'. 'Psychometrics ' ,
Sociometrics', 'Biometries', Technometrics', Xhemometrics',
Xliometrics', where mathematical and statistical calculus have
been systematically applied to study and solve problems in their
respective fields. Now-a-days, the term 'scientometrics' is used
for the application of quantitative methods to the history of
science and obviously overlaps with bibliometrics to a
considerable extent.
Bibliometrics Defined:
The word "Bibliometrics" is coined by two words "(i)
biblio, and (ii) metrics. The word biblio is derived from the
combination of Latin and Greek word biblion, meaning book,
paper. On the other hand, the word metrics indicates the science
of metre i.e. measurement and is also derived either from the

Latin or Greek word metrics or ^ metrikos', each meaning
measurement. Accordingly, Pritchard defined bibliometrics as
the application of mathematics and statistical methods to books
and other media of communication".
There are a number of definitions of bibliometrics given
by different researchers such as Hulme, Raising, Fairthome,
Beck, Potter, Scharder, Sengupta, Kabir, and others. However,
a more elaborative concept of bibliometrics has recently been
expounded by Egghe, who defines as the development and
application of mathematical (including statistical and
optimizational models and techniques to all aspects of
communication (including libraries, documentation and
information centres, science policy)".
DEFINITIONS:
HULME
The purpose of statistical bibliography is to shed light on the
process of written communication and of the nature and course of
development of a discipline by means of counting and analysis its
various facets of written communication.

RAISING
The assembling and interpretation of statistics relating to books
and periodicals to demonstrate historical movements, to determine
national and universal research, use of books and journals and to
ascertain in many local situation the general use of books and
journals.
PRITCHARD
According to him, bibliometrics is defined as the application
of mathematical methods to books and other media of
communication.
FAIRTHORNE
The definition given by him is that it is the "Quantitative
treatment of properties of recorded discourse and behaviour
appertaining to it.
POTTER
According to him the study and measurement of the publication
patterns of all forms of written communication and their authorship.

SCHRADER
Bibliometrics is the scientific study of recorded discourse.
SENGUPTA
Sengupta defines bibliometrics as the organisation,
classification and quantitative evaluation of publication patterns of
all macro and micro communications alongwith their authorship by
mathematical and statistical calculus.
Origin of Bibliometrics:
The application of quantitative techniques to libraries was
until recently known as "statistical bibliography" (Pritchard,
1969). Wittig (1974), in a footnote, traces the historical
development of the term 'statistical bibliography'. He points out
that "The root of the term 'statistical bibliography' can be raced
to its first use by Hulme in 1923, in his summary of the work
done in 1917 by Cole and Eales".
Ranganathan suggested as early as 1948 at the Aslib
Conference in Leamington Spa, that is necessary for librarians
to develop "librametry" on the lines of biometry, econometry
and psychometry, since "many of the matters connected with
library work and services involve large numbers" (Aslib
Proceedings, 1949). In spite of his early attempt to define the
scope of librametry, the subject hardly developed until the early
1970's. Rangnathan in a paper submitted at the 1969 annual
seminar of the Documentation Research and Training Centre
(DRTC), illustrated a few examples of the applications of
statistics to library science. On the basis of this paper and
investigation carried out at DRTC, Neelameghan (1969)
outlined the applicability of the librametry.
Pritchard used the term 'bibliometrics' in 1969 to describe
at "studies which seek to quantify the process of written
communication". Fairthorne (1969) defined bibliometrics as "
the quantitative treatment of the properties of recorded
discourse and behaviour pertaining to it."
These definition of librametry and bibliometrics show that
librametirc primary aims at the quantitative analysis of the
management of libraries and bibliometrics is limited to
recorded knowledge. The publication in both the fields
suggests that in librametry and bibliometrics, one examines the
statistical distribution of the process relating to
10

1. The utilization of documents
2. Library staff, and
3. Library users
to establish a theory for the structural aspects of library.
Bibliometrics and librametry may therefore be commonly
defined as areas in which one studies.
"Information processes and information handling in
libraries and information centres by quantitatively analysing the
characteristics and behavioural of documents, library staff, and
library users."
Bibliometric distributions are used to study:
1. Frequency of occurrence of words in a text (Zipfs law)
2. Productivity of authors in terms of scientific papers
(Lotka's law),
3. Scattering of articles over different journals (Bradford's
law).
These distribution are characterised as positively skewed,
long-tailed and reverse-J shaped. A similar characteristics is
also observed in distributions relating to library size, citation
11

of papers, book usage, and obsolescence of literature. These
distribution are discussed in detail below.
Zipf's Law:
Zipf (1949) developed and extended an empirical law, as
observed by Estoup (1916), governing a relation between the
rank of a word and the frequency of its appearance in a long
text. If r is a rank of a word and f is its frequency, then Zipf s
law is stated as follow:
rf = c
where c is a constant. Zipf derived his law from a general "principle
of least effort" Words whose cost of usage is small or whose
transmittal demands the least effort are frequency used in a
large text.
12

Example:
In any textual part, certain words are picked up.
Words Rank Frequency fxr
(r) (0
the 1 245 245
of 2 136 272
terms 3 98 294
to 4 81 324
a 5 65 325
Thus it shows that if the words are arranged in their
decreasing order of frequency, then the rank of any given word
of the text will be inversely proportion to the frequency of
occurrence of the word.
Lotka*s Law:
Lotka (1926), in his classic paper published in 1926 in
the journal of the Washington Academy of Sciences on the
frequency distribution of scientific productivity presented an
analysis of the number of publications listed in Chemical
Abstracts from 1907 to 1916 with the frequency of
13

publications by particular authors.
Lotka's law is considered as the earliest and most widely
applied study in measuring the scientific productivity of an
author. He claims that a large proportion of the literature is
produced by a small number of authors and it is distributed so
as the number of people producing n papers is approximately
proportional to 1/n .
Author a l / n '
where n = number of papers / contribution
Example:
Authors Papers
100 1
25 2
11 3
6 4
4 5
14

Authors contributing 2 papers
= No. of author contributing 1 paper 12x2
= 1 0 0 / 4
= 25
Authors contributing 3 papers
= No. of author contributing 1 paper / 3 x 3
= 1 0 0 / 9
= 11
Scientific Productivity:
In recent years, there have been many analytical
approaches different from Lotka's Law for scientific
productivity, Narin (1976) reviewed the early studies of
scientific productivity and the concluded that "scientific talent
is highly concentrated in a limited number of individuals". He,
therefore, points out that the science policy should be designed
to encourage the productive scientists. He further observes that
there are very few studies in his area.
'Scientific productivity' is frequency measured in terms of
published output. Perhaps, because the data on the number of
publications by the authors can easily be collected and are also
15

quite reliable, Lotka (1926) Shockley (1957), Hersh (1942),
Williams (1944), Murphy (1973), Schorr (1975) and many
other have used the number of publications of an individual
scientist as a measure of his/her scientific productivity. Dennis
(1959) studies the relationship between quantity of publication
by outstanding scientists and scientific recondition. His study
was based on 71 members of the National Academy of Sciences.
He observes that all these scientists substantially contribute to
literature, with the range of publications between 27 and 768
and the median is 145. He also asserts that the members of
the National Academy of Sciences contribute a large number
of publications. He shows that almost without exception, those
who have published many papers have also achieved eminence
by being listed in the Encyclopedia Britannica. He obtains a
similar result in a study on the pattern of publications by
European scientists. He observes a close correlation between
the quantity of scientific publication and the achievement of
eminence as contributor. We can therefore take the number of
publication as a measure of scientific productivity. Since the
number of articles published by an author can usually take only
discrete values, it is reasonable to assume a discrete
16

probability distribution function to describe the phenomenon of
scientific productivity.
Bradford's Law of Scattering:
In the literature of bibliometrics that has accumulated so
far, Bradford's observation regarding distribution of articles on
a subject in different periodicals, which has come to be
referred to as the Law of Scattering, still holds an important
place. Many recent authors have only discussed Bradford's
observation and formulated it in more precise mathematical
terms. Some have also tried to extend the Law to other areas
of library and information work. Some authors have even
compared the distribution pattern of Bradford's Law in
comparatively unrelated fields.
Bradford published his observation first in an article in the
Engineering in 1934. This paper was reproduced in his book
documentation in 1948. Analysing the periodical literature of
two different subjects, geophysics and lubrication, he found
that if the source periodicals were arranged in decreasing order
of productivity, a number of zones of these periodicals could
be created according to their yields. Each zone contributed the
17

same number of articles but from increasing number of
periodicals. The number of periodicals in each successive zone
increased at geometric progression. In the first zone or the
'nucleus' will come the periodicals which are more particularly
devoted to the subject. The relation between the number of
periodicals coming in the nucleus and the successive zones
could be represented as l:a:a. Apart from the verbal
formulation, Bradford also gave a graphical representation of
the scattering of articles in periodicals. The value of a in
Bradford's analysis of data was found to be about 5,0. So,
according to the formulation, if the total literature on a subject
is contributed by 248 journals they might be divided into a
nucleus zone of 8 highly productive journals, a second zone
5x8 or 40 journals of moderate productivity and a third zones
of 5^x8 or 200 journals of low productivity. Each zone
contributes about 200 to the total of 600 relevant papers on
the subject.
It is said that quite for some time this law of scattering
remained a 'statistical curiosity'. It is surprising that Bradford
did not express his discovery in a more precise mathematical
form. He even left some aspects uncertain. Fairthome said "his
18

private conversations gave me the impression that he was sure
it was important, but equally sure that he had no enough
evidence or explanation to sustained in public debate".
Bradford's limited objective appears to have been to emphasis
that periodical literature must be abstracted by source and not
by subject.
Refinement of the Law:
It was Vickery who first took a closer look at Bradford's
formulation and clarified some of the obscurities. He found
certain discrepancy between the verbal and the graphical
representations. The mathematical expression was restated by
Vickery as follows:
T,: (T,^ - T,): (T3, - T J : : l:n:n^
When T . T^, etc. are related in this way, we are told, the
plot of R against log T is not a straight line. Thus, the above
expression come closer to the graphical expression of
Bradford. Vickery also simplified the technique of deriving the
ratio of a. He pointed out that the Law should apply not only
to three zones but, with suitably modified values of the ratio
a, to any number of zones.
19

Applications of Bibliometrics:
Now-a-days bibliometrics are being applied to get factual
and accurate data in the transfer and handling of information.
According to Narin & Moll, "the most active area of modern
bibliometrics is concerned with citation. Gross and Gross were
the first to apply bibliometric techniques to the problem of
chemical library acquisition Broadus has applied citation
analyses to collection building. Since then a number of works
have been undertaken for different purposes. Raising has
applied this method to evaluate the relative importance of
scientific journals. Brown has studied the list of serials most
frequently cited in eight major scientific fields and suggested
to increase library co-operation to satisfy the scientist's need
Goffman & Morris have applied Brardford's Law of Journal
acquisitions in the libraries Brookes has used to estimate the
size and composition of scientific periodicals Donohue has
used three bibliometric techniques to study the literature of
information science for library measurement purposes. Martyn
& Gilchrist has used to rank British Scientific journals. Lawani
has prepared to ranked list of 681 journals according to their
productivity; and this has been used as guide for the acquisition
20

of titles on Tropical and subtropical agriculture by a number
of libraries. Garfield has reported an analysis of more than 5
million citation in the references of the journal articles
covered by Science Citation index during 1974 and he has
presented a ranked list of highly cited journals by the total
citation received by 'Impact Factor' and by 'Immediacy Factor'
Wade has successfully applied this method for evaluating the
university and government officials administering scientific
research programmes. Mirsky has provided a brief overview of
science studies in the Soviet Union Lai and Ray have used the
Bibliomtric techniques to measure the relative scientific
activity of the nations of the world in the field of horticulture
Sengupta has presented a list of areas where these techniques
are profitably used.
Conclusion:
Bibliometric studies have enabled to develop a body of
theoretical knowledge and a group of techniques and have
facilitated its application for the further growth of knowledge
based on bibliographical data. The past work by Lotka, Bradford
and Zipf have been valuable in helping the librarians to assess
the pattern of authorship, identifying the core collections and
21

designing better retrieval system. Bibliometric data provide
precise and accurate observations particularly in the study of
science and scientists. The information scientists makes use of
this techniques for economical and efficient management of his
material and services. The sociologist of science continues to
utilise bibliometric techniques to analyse the structure of
science. While, the historians found these techniques very
useful in the development of an innovation University
administration and officials of government agencies have seen
it as a tool for evaluating the effectiveness of their research
programmes. Thus, the techniques seems very promising in the
realm of practical knowledge in recent years, bibliometric
techniques present themselves as a key to objective evaluation.
According to O'Connor and Voos. The widespread application
of practical bibliometric methods useful to library manages will
continue to be limited until a more general unified is
developed.

CITATION ANALYSIS
The primary function of citation is to provide "a connection
between two documents, one which cites and the other which is cited".
There are umpteen nmnber of reasons for giving citations. Weinstock,
Lipetz, Moravcsik and Murugesan, Hodges, Oppenheam and Renn,
Finney, Frost and Thome have all attempted to explore the possible
reasons for giving citations. They include the positive and negative
reasons for inclusion. However, it has to be conceded that if the
reason is positive, there is bound to have some connection between
the citing and cited papers. The first recorded citation analysis was a
study by P.L.K Gross and E.M. Gross published in 1927 in order to
determine the journals to be subscribed to and the back volumes to
be acquired for the Library of the Pomona College. They studied the
citation frequency in the references given in the Journal of the
American Chemical Society. Citation analysis is very often fiiiitfully
applied to derive the following benefits :
a) To lead the reader to further studies in the field
This is perhaps, the primary purpose of citations. Readers can
verify the correctness of the information and thereby convince
themselves of the need to follow them up.
23

b) For the preparation of bibliographies
The first use of citation indexing was made in Shepherd's
Citations published in 1873. This technique of citation indexing has
been perfected by Eugene Garfield and others since early 1960s. It
is a fact that compilation of bibliographies in new fields is really
difficult. In such circumstances, analysis of citations of articles may
be the only way to gather information. The very fact that the citations
have been verified, evaluated and recommended by authors who are
experts in their own fields make them all the more acceptable for
inclusion in a bibliography.
c) To study the use pattern of different types of documents
Citations given may be of books, journals, articles, reports,
standards, theses / dissertations etc. The relative use of each of these
types can be ascertained based on the frequency of citations. For
example, various source consulted by scientists since they constitute
about 70-80% of the total citations. Similarly citation practices
among social scientists indicate that they give equal importance to
books and journals.
d) To find out the relative use of different languages
Since English has emerged as a world language, especially in
science and technology, there is a predominance of English language
24

publications in all branches. This can easily be understood from
citation analysis. In the mid-sixties. For instance, the share the share
of English language papers in Mathematics and Chemistry was more
than 50 percent. Russian occupied the second position with about 20
percent followed by German and French.
Citation practices have also shown that the relative amount of
literature in different subjects produced by different countries
changes with time. It has been observed that German has declined
very much in the 20th century, especially in the field of Chemistry
where publications in this language reigned supreme.
e) To study the use of literature from different countries
From the citations, the country of their origin can be identified
in all types of materials like journal articles, books, reports etc. In
many subject areas, U.S. Publications are found to be used more
heavily. In medicine, biochemistry, physiology and pharmacology,
Sengupta had identified the leading role played by U.S. journals.
Journals of U.K. occupied the second position, but they come nowhere
near their American counterparts in the frequency of use. Similarly,
Martyn and Gilchrist had found that in sixties one in every eight
citations was to British publication. Some of the user studies in India
have shown that Indian publications are also equally cited in certain
25

subjects.
f) To study the scattering of subjects
Studies about the dispersion or scattering of subjects in
different sources as evidenced by citation analysis have brought out
interesting results. For example.
i) Social science and arts subjects show a wider scatter of
publications than the sciences.
ii) Research publications in technology show a greater dispersion
than those in science.
iii) A new branch of science, especially an interdisciplinary one,
show a greater disperson than an older branch of science,
iv) There can be differences in scatter between sub-fields within
a subject as also among major subjects,
v) The rate of scatter within the same subject alters with time.
g) To decide the obsolescence rate of documents in different
subjects
Citations in subsequent literature and usage pattern in libraries
are considered as two indicators of the obsolescence of literature.
Analysis of citatios by age of the cited document can show the useful
life of a document. In order to measure the decay or obsolescence
rate of documents, the concept of half life has been borrowed from
26

Nuclear Physics. Using this measure Burton and Kebler had
suggested a range of half-lives for different subjects. The fast growing
subjects would have lesser half lives compared to established
disciplines. The above study had shown the half-life of Metallurgical
Engineering as 3,9 while that of Botany is 10 years. These time scales
are highly useful in the planning of library holdings.
h) To determine the interdependence and lineage of subjects
The interdependence of basic and applied fields can be
understood by citation studies. Establishment of this interdependence
can be of use in the acquisition policy of special libraries or
information centres. The analysis of citations of the Annual Review
ofMdicine for the years 1965-69 by I.N. Sengupta has established
the contribution made by journals in the fields of biochemistry and
physiology to the medical research. Further studies by him have
brought to light the mutual contribution of biochemistry, physiology
and microbiology.
As far as lineage of subjects are concerned, Garfield's
experiments in citation indexes have very much contributed in
mapping the history of many of them.
1. To prepare ranked list of periodicals.
2. To study the rate of collaborative research.
27

3. For the analysis of scientific journals.
4. Citation rate of journals.
5. Impact factor.
6. Self-citing rate.
7. Self-cited rate
8. Immediacy index.
28

WEED AND WEED CONTROL
CONCEPTS AND DEFINITIONS
Weeds are constant associates of our cultivated plants.
Anyone familiar with plants has a perception of what is a weedy
and what is a clean crop, lawn, vegetable garden or other
managed use of plants. Yet as we shall see, it is not easy to
determine the degree of weediness that represents a threat to
crop yield or to survival of a town. Neither is it easy to define
a weed in terms that clearly distinguish it from cultivated plants
and from other weed plants.
We will see however that weeds do have important
charactersitics different from cultivated plants. Also, out of
250,000 plant species on the world fewer that 250 species (1%)
account for the readily apparent weediness often seen. Thus
weeds are handle synonymous with wild plants.
WEED DEFINED
Numerous definitions can be found in the literature. Such
common definitions as a plant out of place, a plant interfering
with man's intended use of the land and a plant with negative

value fairly well describe a weed in a vegetable control context.
That is they are adequate when our focus is only on the problems
posed by the growth of unwanted plants at a particular plant
in time.
A useful definition of a weed for weed - crop ecology is
a plant that originated under a natural environment and in
response to imposed and natural environments, involved and
continue to do so, as an interfering associate with our crops and
activities.
WEEDINESS DEFINED
Weediness is defined as "the state or condition of a field
flower bed lawn and so forth in which there is an abundance
of weeds.
COSTS OF WEEDS
Weediness also connotes "numbers". That is to suggest that
a crop is weedy implies that it has many weeds - enough to
reduce crop yield.
Although weeds have many other negative aspects it is this
threat to yield, to the production of food, that accounts for most 30

of the effort devoted to their control since the beginning of
agriculture.
Still crop losses due to weeds are very large. The United
States done as shown in table, the estimated average annual loss
was healthy $ 8 billion in the period 1973-1977.
Estimated Average annual losses due to weeds in all crops in
the U.S. 1973-1977.
Commodity Group Average Annual Monetary Losses ($ 1,000)
Field Crops $ 5,735,821
Vegetables 450,093
Fruits and Nuts 299,498
Forage Seed Crops 38,763
Half 676,221
Pasture and rangelands 788,805
Total $ 7,989,201
Weed management definition: Weed management is an approach
in which weed prevention and weed control have companion
31

roles. It implies a systems context in which all available tools
are used to reduce the propagate seedbank, prevent weed
emergence with crops and minimize competition from weeds
growing with crops. Thus weed management has both immediate
and long term objectives.
WEED NOMENCLATURE AND CLASSIFICATION
Because weed species have ecological characteristics unique
to each. It is essential that they be identified by a standard
system.
Hierarchy of the plant kingdom using lambsquarters
(Chenopodium albium) as an example, the major subdivisions of
the taxonomic hierarchy of the plant kingdom include the
following name:
Kingdom - Plantae
Division - Tracheophyta
Subdivision - Spermatophytma
Class - Angiospermae
Order - Caryophyllales
32

Family - Chenopodiaceae
Genus - Chenopodium
Species - Chenopodium album
The ranks used most often in weed science are family genuis
and species.
Common systems of classification grasslike and broadleaf
weeds. The seed producing plants have two classes: Angiosperma
and Gymnospermae. Most weeds are in the angiospemae class.
ANNUAL BIENNIAL AND PERENNIAL WEEDS «
Weeds are also commonly classified according to their life
cycles. Some plant families and a representative weed species
of each
33

Table-1
Family Representative weed
Common Latin Common Latin name name name name
Amaranath or Amaranthaceae Redroot pigweed Amaranathus Pigweed retroflexus
Buckwheat or Polygonaceae Pennsylvania Polygonium Smartweed smartweed pennsylvanicum
Chickweed Gary ophyll- Common Stellaria media or pink aceae chickweed
Composite Compositae Common ragweed Ambsrosia art emisiifoha
Goosefoot Chenopodiaceae Lambs quarters Chenopodium album
Sedge Cyperaceae Yellow nuts edge Cyperus esculentus
WEED-CROP ECOLOGY
Definition
Ecology by definition is concerned with the relationship
between organisms and the environment. Understanding the
relationship between structure (growth form, species makeup,
and other growth characteristics) and function (role in the
system) is the ultimate goal of a study of any level of a plant
system. Understanding the relationship between the weeds
associated with a given set of production practices and the 34

function of that ecosystem is the goal of weed-crop ecology.
The weed-crop relationships are depicted schematically in
Fig. 1. This schematic reprersentation shows that there are four
key components : (1) the weed, (2) the crop, (3) the natural
environment, and (4) human being. Our more traditional
viewpoint and approach have been to focus mainly on the weed
and the crop in this four-part system. In this chapter and those
that follow, we will see that weeds also influence the
environment. Thus, the four compoents create a dynamic system
called the weed-crop ecosystem.
Weed Weed
Crop Humans
Natural en vironme nt
Figure 1: Weed-crop ecosystem. Each part has a potential impact on all other parts.
The weed seed, especially of annual species, holds the key
to success for both a control and a prevention approach to weeds.
The number of seeds that germinate and survive control efforts
largely determines crop loss for a given year. The number of
35

seeds both in the soil (seedbank) and returned to the soil in a
new crop determines whether the species will survive to pose
a potential threat to future crops. For this reason, it is important
to adopt a mindset that views the plant as a vehicle for producing
seeds. Only with such a mindset can there be appropriate focus
on the seed commensurate with its key role. Its role is larger
than simply serving as the vehicle for multiplication, however,
important as that role is.
Four additional roles are played by the seed in a weed's
life cycle: (1) dispersal, (2) protection during conditions
unfavorable for germination and development (democracy), (3)
a temporary source of food for the embryo, and (4) a source
for transfer of new genetic combinations. All five roles come
into play in the natural selection of individuals best suited to
specific conditions. In the remainder of this chapter, we examine
multiplication, dispersal, and longevity. Democracy and its
particular effect on longevity are examined.
WEED SEED CHARACTERISTICS
The seed is an interesting package indeed. By definition,
a seed is a fertilized, mature ovule having an embryonic plant,
36

stored food material (rarely missing) and a protective coat or
coats. Thus, it contains all that is necessary to transmit the
genetic material provided by the parents and sustain, at least
temporarily, the new seedling that carries this genetic
information.
External Characteristics :
The seed varies tremendously in its external characteristics. It
may vary in size from a 10 kg. coconut to a seed of false
pimpernell {Lindernia spp.) so small that approximately 300
million are required to weigh 1 kg. Its shape may vary from
round to trapezodial and from spherical to flat. It comes in all
colors of the rainbow. Its surface may be smooth, rough, coated
with mucilage, or covered with a variety of appendages
important to widespread dispersal.
Internal Characteristics :
Internal characteristics of seeds are equally variable.
Differences include embryo characteristics, quantity of food
reserve stored, and chemical composition. One obvious
difference in embryo characteristic is in the number of
37

cotyledons. Monocot embryos in the seed have one cotyledon,
and dicot embryos, two cotyledons. The quantity of stored food
in a coconut may be a billion times greater than that in an
orchid seed. Seeds of corn are high in starfh, and soybean and
cotton seeds are high in protein and in oil.
Seed Numbers :
Weeds vary greatly in their potential seed production
capacity. Table-2 shows the relative potential seed production
capacity per plant and per gram for a number of common weeds.
The actual production per plant will vary greatly from the
potential indicated depending upon environmental conditions
under which the plant is grown.
38

Table 2: Seed Production Capacities of Selected Weeds
Common Name Number of Seeds Per Plant Per Gram
Barnyardgrass 7,160 714
Buckwheat, wild 11,900 143
Charlock 2,700 526
Dock, curly 29,500 714
Dodder, field 16,000 1,299
Kochia 14,600 1,176
Lambsquarters 72,450 1,428
Medic, black 2,350 833
Mullein 223,200 11,111
Mustard, black 13,400 * 588
Nutsedge, yellow 2,420 5,263
Oat, wild 250 57
Pigweed, redroot 117,400 2,632
Plantain, broadleaf 36,150 5,000
Primrose, evening 118,500 3,030
Purslane 52,300 7,692
Ragweed, common 3,380 253
Sandbur 1,110 148
Shepherdspurse 38,500 10,000
39

Common Name Number of Seeds Per Plant Per Gram
Smatweed,Pennsylvania 3,140 278
Spurge, leaft 140 286
Stinkgrass 82,100 14,286
Sunflower,common 7,200 152
Thistle,Canada 680 637
Entry of Weed Seeds:
The significance of additions to the seedbank - that is, the
reservoir of viable seeds in the soil - from outside a given site
must be understood for the importance of weed seed production
and longevity to be fully appreciated. Of concern here is the
addition of numbers sufficient to significantly increase the size
of the seedbank. Thus, we are not concerned at this point with
the spread of weeds from place to place over relatively great
distance, this topic covrd in earlier chapter.
In the past, the contamination of crop seed with weed seed
was a major source of additions to the seedbank. With the
general use of high-quality seed today, this problem is not major,
although it may be for selected weed species. For example,
eastern black nightshade (Solanum ptycanthum) is increasing as
40

a problem in soybeans, in part because the fruit is comparable
in shape and size to the soybean seed and therefore cannot easily
be separatede during seed cleaning. Nevertheless, ample supplies
of clean seed are usually available for all crops and thus should
not be an important source of addition to the seedbank.
Birds and other animals, water, and wind are vehicles for
the movement of weed seeds into an area. Weeds and weed seeds
have a number of unique characteristics that aid such movement.
FACTORS AFFECTING WEED SEED REPRODUCTION
At the outsde of this section, it is important to emphasize
two characteristics common to many annual weeds that further
complicate preventive approaches. These characteristics are : (1)
the relatively short period from emergence to first production
of seed (precocity), and (2) the ability to produce viable seeds
even when the flowering part is severed or the parent plant is
destroyed before the seeds reach maturity.
The seed holds the key to success in both weed control
and weed prevention.
Most problem annual weeds have the capacity to produce
41

a large number of seeds per plant.
Most problem annual weeds can adjust seed production per
plant to compensate for losses in plant numbers over a relatively
wide range.
Many annual weeds can produce some seed even under very
adverse conditions.
Light is the growth factor to which seed production is most
sensitive in many weeds; production of sed is commonly retarded
and may even be prevented completely by degrees of shading
that have much less effect on vegetative growth.
Invasion of weed seeds from outside is of only minor
importance as a source of additions to the seedbank on a given
area.
Many weeds, especially annuals, have a relatively short
period from emergence to flowering and quickly reach the point
of having viable seed.
Seeds of many weeds suffer sizable losses in viability if
left on the soil surface for extended periods of time.
42

The number of seeds in the seedbank is commonly on the
order of several million for the plow layer.
The seeds of some weeds may remain viable for many years
in the soil, but for many, germination the following production
accounts for a majority of total germination for the life of the
seed in the seedbank.
Tillage reduces the longevity of weed seeds in soil.
For most weed seeds, longevity is extended by incorporation
in the soil and the relationship is likely to approach linearity
with depth in the top 15 cm.
TYPES OF PERENNATING PARTS FOR VEGETATIVE
PRODUCTION
Vegetative reproduction of perennial weeds is achieved
through the production of various types of perennating
(vegetative) parts. Perennating parts can be produced in both
stem and root tissues of perennial weeds. The types produced
in stem tissue include bulbs, corms, rhizomes, stolons, and
tubers. Some of these reproductive parts and representative
weeds possessing them are shown in Figure-2 and 3.
43

A bulb is an underground bud consisting of a hort stem axis
with fleshy scales (leaves) enclosing a growing point. A corm
is the swollen base of a stem axis and is distinguished from
a bulb by its solid stem structure with distinct nodes and
internodes. Rhizomes are specialized horizontal stems that grow
belowground or just at the soil surface. Stolons are similar in
habit but are usually above ground and produce adventitious
roots when in contact with soil. A tuber is a specialized structur
that results from the swelling of the subapical portion of an
underground stem. The reproductive function in all of these stem
structures is quite easily identified because each structure
contains one or more buds.
Rootstock is a type of perennating part that is produced in
a root tissue of perennial weeds. It is the general term for roots
that have the capability to develop adventiious buds. Rootstock
cannot always be distinguished for its reproductive function.
Indeed, in many species, such as dandelion, the root assumes
the reproductive function only following injury. That is, only
if a dendelion plant is cut below the surface of the ground will
adventitious buds develop at the cut surface, from which new
plants develop. In other species, such as leafy spurge shown in
44
figure-3, buds form on rootstock in the soil and develop to send
up new shoots or to extend laterally. Except for roots such as
described for dandelion, all reproductive parts shown in Figures
4, 5 and 6 may be considered as being designed for regeneration.
Thus, they are readily distinguished from segments of stems or
leaves that for some species under proper conditions can form
roots and develop into a new plant. Nonetheless, it is well known
that many weeds, such as crabgrass and purslane, have the ability
to develop aventitious roots at nodes and, thus, become
reestablished after the plant is severed at the soil surface.
Therefore, vegetative specialization for regeneration must be
recognized as a relative rather than an absolute process.
Some perennial weeds utilize more than one type of
perennating part for vegetative reproduction. Wild garlic, for
example, reproduces from both aerial bulblets and underground
bulbs. The bulbs may be central or offset, hardshell or softshell.
Bermudagrass has both above grounde abd below ground
reproductive stems.
Confinement of perennating, or vegetative reproduction,
parts near or physically attached to the parent plant maximizes
45

the opportunities for the clone to utilize growth factors in a
given area. Restricted dispersal is a major reason for the strong
competitiveness of many perennial weeds.
The greater competitiveness from restricted dispersal is
obtained at a sacrifice of protection against elimination by
cultivation and the natural environment.
Until a plant originating from a perennating part separated
from the parent plant begins to produce such parts on its own,
removing the top growth is lethal. During this time, the perennial
plant is no different than an annual in this respect.
The period after emergence when a perennial weed may be
treated like an annual is commonly relatively short.
The production of perennating, or vegetative regeneration,
parts is sensitive to competition for light.
The production of perennating parts is reduced by elevated
nitrogen levels in the soil and by low temperatures.
The relative longevity of perennating parts in soil is less
than that of most seeds.
46

Longevity of perennating parts varies directly with burial
depth, due likely to protection against desiccation and low
temperature.
The ability of perennating parts to support sprouting and
growth is directly related to their level of food reserves.
The level of food reserves is rapidly reduced during
sprouting and early growth. Thus, there is commonly a period
of days immediately following the flush sprouting in the spring
when a perennial is most easily destroyed by tillage.
Germination of seeds involves a precise sequence of events;
this sequence may either be delayed in its initiation or stopped
along the way by what is termed dormancy.
Dormancy, although not itself a factor in competition, is
important in the persistence and survival of weeds.
Many seeds, and possibly vegetativ regenerating parts, have
an apparent season-anticipating characteristic that assures
resumption of growth when chances are optimal for survival and
completion of their life cycle.
47

Although there are quite wide differences among species,
the general pattern is that emergence from seed is inversely
related to depth of burial; the top 2.5 cm soil layer contributes
the most new seedlings.
Many weed seeds require light for germination; the far-red,
which passes through leaves, in fact often inhibits germination.
Many weed seeds that do not have innate dormancy acquire
dormancy when subjected to shading by burial in the soil and
thus are protected against rapid loss of viability.
Temperature is a modifying rather.than a triggering factor
in germination. Thus, the curve relating temperature and
germination percentage is S-shaped.
Germination of seeds of weeds common to temperature
regions is improved by exposure to alternating temperatures and
by accumulated exposure to temperatures at or below freezing.
Emergence for perennating parts is also inversely related to
depth of burial, but in general terms, such emergence is from
greater depths than the depths for seeds.
48

Growth-regulating substances are mostly likely important
modifiers of resumption of growth of both seeds and perennating
parts.
High nitrogen levels in soil are conducfive to regrowth from
perennating parts produced by weeds grown under such
conditions.
With rhizomes, an inverse relationship exists between the
length of the rhizome and the number of buds that sprout.
With perennating parts, it is common for one bud to have
an inhibiting effect on regrowth of other buds; the apical bud
commonly possesses this inhibiting effect.
49

Table-3 : Plant Population and shoot dry weights of redroot
pigweed (RR) and common lambsquarters (LQ) in a mixed
culture in the greenhouse
Treatment Number of Grams Dry Weight
t„ t , . Species Plants (/m*) of Shoots (/m-2)
RR LQ RR 2307 398 LQ 0 0
KQ RR RR 0 0 LQ 1985 255
1 RR:1 LQ 0 RR 1862 320 LQ 457 5
1 RR:10 LQ 0 RR 437 230 LQ 2240 57
Note:Plants grown for 36 days under average temperatures of 29°C day and 24°C night. t = initial sowing; 1^^= sown 20 days later.
Source :Chu et al., 1978. Reproduced from Crop Science 18 (2):308-10, 1978, by permission of the Crop Science Society of America.
50

Table-4 : Effect of temperature on the germination of redroot
pigweed and common lambsquarters
Temperature Species Germination (day/night °C Rate Index
24°/18° Redroot pigweed 14.8
24°/18" Lambsquarters6.6
130/70 Redroot pigweed 0.4
13°/7° Lambsquarters 2.6
BIOTIC AGENTS IN WEED MANAGEMENT
Weeds have their enemies, earlier chapter discussed the fact
that a significant portion of the weed seeds produced are
destroyed by predators before ever reaching the soil, and many
more are destroyed by predators and microorganisms in the soil.
The growing weed is also preyed upon. These effects of natural
enemies, biotic agents, may go relatively unnoticed unless of a
dramatic nature, such as the elimination of American elm in
much of the eastern United States by the Dutch elm disease
during the second half of this century. It seems reasonable to
expect that some weed have similarly been eliminated by natural
enemies and, therefore, logical to believe that natural enemies
51

might be used in weed control. In fact, attempts to use such
natural enemies in controlling torublesome weeds go back to at
least the beginning of this century.
Before considering biological control, we should again
remind ourselves that we are dealing with an ecological system.
Insects, plant pathogens, and other crops pests, along with
weeds, humans, the environment, and the crops are all part of
this system. A change in any part of this system causes changes
in the other parts. Thus, as we change our practices for dealing
with weeds, we must be alert to the changes that will occur with
the other pests. Similarly, we must take into account the
potential harmful effects on biotic weed control agents of control
treatments, especially pesticides, used agains tother crop pests.
It has been found, for example, that fungicides used in vegetable
crops may reduce control of yellow nutsedge with the rust
Puccinia canaliculata (Phatak et al., 1983).
The purpose of this discussion of biotic agents is to identify
the place for such agents in weed management and to develop
an understanidng of factors affecting their successrful use. To
do this, it is necessary to draw upon work that was designed
52

to control a particular weed since this is the nature of most
available information. The concepts appropriate to weed
management are identified from the research reported on control.
A knowledge of weeds' natural enemies gained in the
process should help conserve and augment infestations of such
natural enemies. Selected examples of successful control with
biotic agents are used to identify and develop the concepts, but
no attempt is made to review all available literature. Refer to
the proceedings of the JV International Symposium on Weeds
(Freeman, ed., 1976) for information on control of specific
weeds.
SUCCESSFUL CONTROL OF WEEDS WITH BIOTIC
AGENTS
Insects: Among the potential biotic agents, insects have received
by far the most attention. Goeden et al., 1974, in a review of
the status of research on biological control of weeds through
1973, found that of the 78 weed under study, 73 were the target
of insects. Thus, it is not surprising that a majority of the
successes in biological control have been with insects. This fact
should not be construed as indicative of the relative potential
53

of insects since there is reason to believe, as discussed later,
that pathogens may offer at least as great a potential.
ROLE OF BIOLOGICAL CONTROL IN WEED
MANAGEMENT
A potential hazard exists in over emphasis of the
bioherbicide approach. This approach offers some clear-cut
adantages over the classical approach discussed in the previous
section and can be summed up by the analogy tha tin methods
of application and activity, bioherbicides are quite comparable
to chemical herbicides. As with herbicides, however, elimination
of a weed by a biotic agent can be expected to be followed by
replacement with another weed unless we do something about
the conditions that caused us to have the weed in the first place
" a niche for it. Any approach, whether with herbicides, biotic
agents, or tillage, that looks only to control a weed without
regard to the conditions that accounted for its presence is
destined to be only a short-term solution for the agroecosystem,
or inded, the individual farm, on which it is used.
We should also keep in mind that there are conflicting
interests in weeds that are likely to always pose a problem for
54

biological control, especially with the classical approach. Once
a biotic agent is established, for example, it cannot easily be
kept from spreading to all areas infested with the target weed.
That is, it is no respecter of land use or ownership. The agent
could remove the target weed from grazing land where the weed
has value for forage, or from game preserves, parks, or forests
where it might be an important source of food or protection for
game.
What then may be the role of biotic agents in systems of
crops production? It would seem they will continue to play a
part in the control of specific weeds on relatively low-value
land. Their role on relatively high-value land in intensive
agriculture may well be as an adjunct to the other approaches.
Thus, they need to take their place alongside tillage and cropping
practice,s herbicides, and allelopathy as one of the tools
available for effective weed management.
In this context, it should be emphasized that biotic agents,
if used, become a part of the agroecosystem, which is dynamic.
As already mentioned, removal of a weed leaves room for
another to enter. Further, the interrelationships of weeds with
55

insects and diseases will be affected; secondly infection with
other biotic agents may frequently be involved in bringing about
the final effect. Fertility and other factors affecting overall vigor
of the crop may also influence results with biologial control.
The importance of these ecological relationships for biological
control is in pointing up the merits of planning their use in terms
of the entire production system, not simply in terms of control
of a particular weed. As our knowledge and experience with
them grows, and as we shift our weed control thinking towares
management, roles for biotic agents should increased. Some of
the broad usages are discussed here. Usage in management
systems is considered.
PREVENTING WEED SEED PRODUCTION
One role for biotic agents may be in preventing seed
production of wood specimens that escape the other weed
management practices. As mentioned previously, preventing seed
production (renewal of the seedbank in the soil) must be
accomplished for a long-term effort to reduce weed problems to
be fully successful. I have examined the several practices that
might be embraced in attaining this goal. Here, I simply need
to recognize that a farmer or other land owner will probably
56

not be able to justify more than a mdoest cost for practices
designed to cut weed seed production.
The reason is that weed seed production in itself does not
represent a yield loss for a particular crop in a particular year.
But that crop, in effect, must pay the cost of a treatment to
reduce weed seed. Thus, we need a relatively inexpensive
treatment, but one that does not necessarily have to destroy the
weed since competition may not be involved. Biotic agents may
fit these requirements, especially if it is acceptable for the biotic
effect to develop over a period of years and to be less than 100%
effective. Both qualifications indeed may be acceptable.
WEED MANAGEMENT Vs WEED CONTROL
It is conceivable that biotic agents achieve a level of usage
in weed management well beyond their potential in weed control.
Realizing their potential in weed management will require
careful articulation of the objectives and the selection of
appropriate evaluation measures. With uses in management,
numbers, used as a measure in control approaches, have little
value. For example, numbers of weeds destroyed or prevented
from developing by a biotic agent, although a measure of the
agent's activity, do not in themselves tell us the effect on a given
57

weed population over time. Yet, it is the latter information that
will determine whether or not such a management effort should
be initiated. Using biotic agents to keep a weed below a
economic loss level calls for an understanding fo the nature of
competition involved in order to identify the best ways to
measure it. In a larger sense, uses of biotic agents in weed
management require a way of measuring and assigning the costs
and returns not provided by measures of control approaches.
Devleoping satisfactory meaures must be addressed for biotic
agent technology to advance.
Biological control is taking place ocntinuously in the plant
world. Biotic agents can be selective not only against specific
weeds, but also against specific plant parts. Biotic agents may
have greater potential value in weed management than in weed
control. Success with biotic agents in weed management calls
for a full understanding of ecological relationships between the
weed and the biotic agent and of both as a part of a larger
ecosystem. Evaluating effectiveness of biotic agents in weed
management requires different measures than those used in weed
control.
58

OBJECTIVE, SCOPE AND METHODOLOGY
Though the term bibliometrics was introduced only in
1969 to indicate a new discipline which employs quantitative
methods for analysing various aspects of written documents its
origin can be traced back to the efforts of early twentieth century
documentalists to apply mathematical and statistical analysis to
bibliographical units. The most prominent efforts were that of
Cole and Eales, Hulme, Lotka, Zipf, Bradford, Ranganathan,
Price, Kessler, Garfield, Goffman and Warren and Pritchard. The
history of this discipline is discussed by Egghe.
Of the various prominent studies mentioned above, three
laws became the cornerstones of bibliometrics. They were :
i) Lotka's inverse square law about the productivity of authors;
ii) Zipfs law about the frequency occurrence of words in a text;
and
iii) Bradford's law of scattering of articles.
Ravichandra Rao summarises other empirical laws in one
of his papers and those who are interested can go through the
59

reference. He has also listed more important bibliometric models.
The discovery of the empirical laws of bibliometrics has led
to a series of studies which can be broadly differentiated into
quantitative and qualitative. In fact, the early statistical studies
of Cole and Eales, Hulme, Lotka, Zipf and Bradford belong to
the quantitative category. B.C. Brookes is of opinion that such
quantiative studies have five general objectives.
i) Design of more economic information systems and net
works.
ii) Improvement of efficiency rates of information handling
process.
iii) Identification and measurement of deficiencies in
bibliographical services.
iv) Prediction of publishing trends; and
v) Discovery and elucidation of empirical laws that can
provide a basis for developing a theory of information science.
OBJECTIVES
The major purpose of the present study is to examine the
60

studies and research conducted during the last five years onv
arious aspects of Weed and Weed Control and can be summarised
as follows :
* to ascertain the strength and weakness of the research
activities conducted during the last five years on weed and
weed control.
* to draw a detailed picture of the way in which literature
has developed during the period of study and the relative
distribution in various facets of the subject field.
* to identify the gaps in the research output in respect of
various forms of weed and weed control areas.
* to identify in quantitative terms, the relative use of the
different forms of documents, authorship pattern, language,
etc. and their chronological scattering.
•
*
to understand the core journals for the scientists working
on weed and weed control and to identify them.
to investigate the degree of collaboration in authorship in
the field of weed and weed control.
61

SCOPE
The present study is confined to the literature published in
the Weed Science which of course carry the majority of the
research output on weed and weed control for a period of five
years as cited above. However, the findings are likely to have
general implications for the scientific community working on
weed and weed control. The period of the study is 1994-1998
and for the citation analysis, same period is taken.
METHODOLOGY
The following methods were adopted for the present study:
Literature Survey : To collect material on the subject secondary
sources such as biological abstract were consulted to approach
primary sources which include periodicals.
The entry has been prepared on the card of 3" x 5" size.
The following details has been noted on the card.
62

Source Card:
SHARPLES (Catherine R), HULL (Mark R) COBB
(Andew H). Growth and photosynthetic characteristics of
two biotypes of the weed black-grass resistant &
suspectible to the herbicide chlorotuloron. Annals of
Botany. 79(4): 455-461.1997 (Dept. Life Sci, Nottingham
Trent Univ. Nottingham NGll 8NS, U.K)
English
First the name of author(s) are given. Followed by the title
of the article. After that name of the journal is given. Volume,
Issue number, pages and year are given next. Within brackett
the address of the institution is given. At the end, language of
the article is given.
Reference Card:
MOSS (SR), CUSSANS (GW).
Variability in
Aspects of Applied Biology.
1985

In this card name of the author(s) is given followed by 2
or 3 words of the title, then name of the journal and year is
given.
Citation Analysis : According to Garfield "true citation analysis
is one which deals with works cited as having actually been used
in the preparation of or having otherwise contributed to the
source paper". In the present study, this method is used for
measurig the relative use of journals as sources of research
information and also for identifying the core literature
specialised area or discipline.
The journals present in Aligarh is studied and the references
are taken out from the articles.
ANALYSIS
The total data based on entries has been collected and
analysed under the following headings:
1. Yearwise analysis of the paper
2. Ranking of Author
3. Authorship pattern
64

3. Ranking of journals
4. Geographical analysis
5. Languagewise distribution of papers
1. Yearwise analysis of the paper: The chronological study will
tell about the number of articles published in a year. The graph
will show the upward or downward trend in the publication. The
chronological study helps in the services of the library.
2. Ranking of Author: This is done to know the eminent
personalities in the subject. The data cards of different
contributors in the field were separated out. The number of cards
under each name were counted and tabulated. Auithors are
arranged in order of decreasing productivity.
3. Authorship pattern : This shows the authorship pattern
whether the single authorship is more popular or the team
research.
3. Ranking of journals : The main objective of this study is
to identify the core journal containing the research literature on
weed and weed control. To conduct this the items published in
65

different periodicals title are grouped together and counted it
is necessary to know the most productive periodicals in the
subject. The information is useful for librarians as well as the
research scholars.
4. Geographical analysis : This is done to determine the
geographical scattering of item while studying the use pattern
of research literature in subject under study. The information was
collected from the informative abstract.
5. Languagewise distribution of papers : As the biological
abstract is the most comprehensive source on its subject. Its
scope is international. In other words biological abstract report
items published from different countries in different libraries.
It is therefore important to know the dominant language.
66

DATA ANALYSIS, INTERPRETATION AND
REPRESENTATION
Biblometrics analysis is used to find out the nature and
characteristics of weed and weed control research based on the papers
published for a period of five years (1994-1998).
The analysis is done in two steps. Firstly, the published papers
were analysed. Secondly, the citations appended to the papers in the
formal were analysed.
Analysis of the papers
In the first level of analysis such as -
Yearwise analysis of the paper.
Ranking of authors
Authorship pattern
Ranking of journals
Geographical analysis
Languagewise distribution of papers

YEARWISE ANALYSIS OF THE PAPERS
The number of papers and their corresponding year are shown in
the table-1.
The table-1 showed that the maximum number of papers were
published in the year 1995 i.e. 307 papers and the minimum appeared
in the year 1998, this may be because of the fact that the secondary
sources consulted did not have the complete referrences of 1998. There
is no spectacular growth in the number of papers in recent years.
68
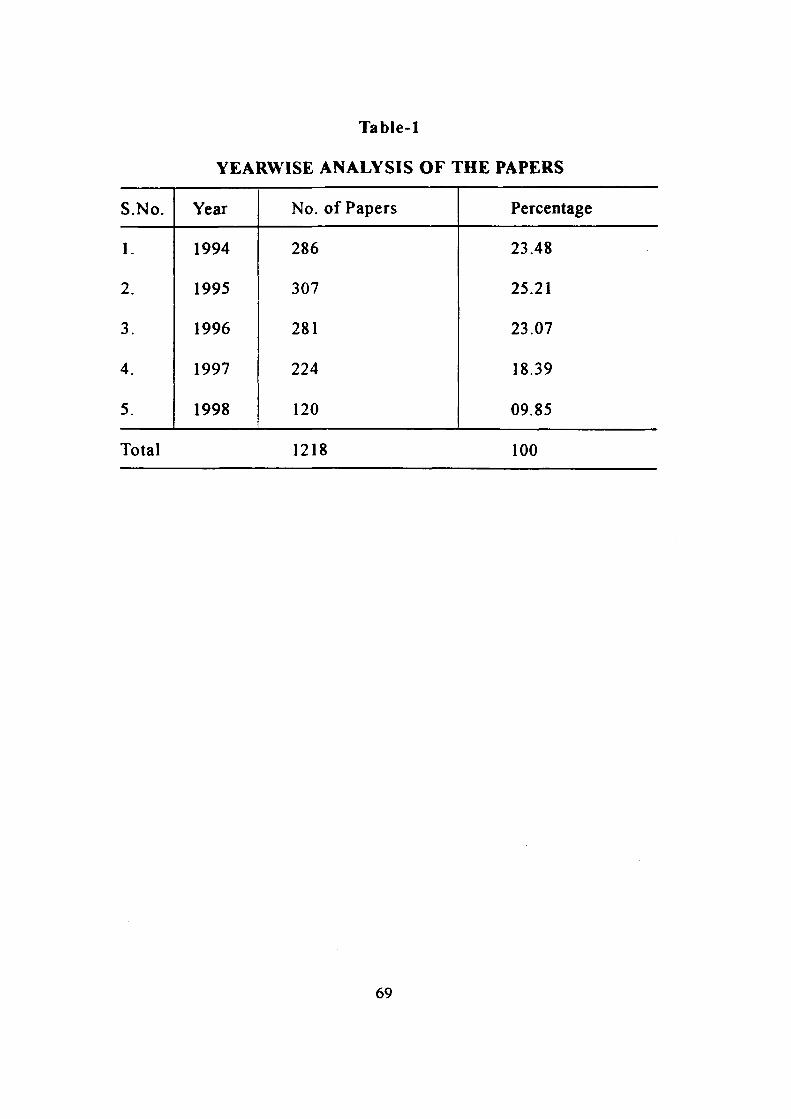
Table-1
YEARWISE ANALYSIS OF THE PAPERS
S.No. Year No. of Papers Percentage
1. 1994 286 23.48
2. 1995 307 25.21
3. 1996 281 23.07
4. 1997 224 18.39
5. 1998 120 09.85
Total 1218 100
69

380
Table-1.1 Yearwise Distribution
70

RANKING OF AUTHORS
The table-2 showed the ranking of authors in the five year study
of weed and weed control research.
Out of the total of 1853 authors 1414 has written single articles,
265 has written 2 articles, 82 has written 3 articles, 43 has written 4
articles.
Among the authors Donald Penner is the most prolific writer
followed by R.K. Malik with 10 articles.
Three authors i.e. Larry W. Mitich, Robert E. Blackshaw &
Donald C. Thill have written 9 articles each.
Due to joint authorship the number of authors has increased.
71

Table-2
RANKING OF AUTHORS
S.No. Rank Authors 1994 1995 1996 1997 1998 Total
1. 1 PENNER (Donald) 5 3 2 1 II
2. 2 MALIK (RK) 3 3 4 10
3. 3 MITICH (Larr>' W) 2 2 2 3 09
4. 3 BLACKSHAW (Robert E 1 3 3 2 09
5. 3 THILL (Donald C) 5 1 3 09
6. 4 HSIAO (Andrew I) 4 1 2 1 08
8. 4 JOHNSON (Gregg A) 3 1 2 2 08
9. 4 STOLTENBERG (David) 4 1 3 08
10. 4 SHAW (David R) 1 3 1 3 08
11. 4 SINGH (Samunder) 3 4 1 08
12. 4 QUICK (William A) 4 1 2 1 08
13. 4 OWEN (Michael DK) 1 2 2 2 1 08
14. 4 O'DONOVAN (John T) 3 3 2 08
15. 5 WAX (Loyd M) 2 2 3 07
16. 5 ZHANG (J) 2 2 2 1 07
17. 5 SHILLING (Donn 'G) 1 3 3 07
18 5 MORTENSEN (DA) 3 1 1 2 07
19 5 POWLES (Stephen R) 3 1 3 07
20. 5 BUHLER (Douglas D) 2 3 2 07
72

S.No. Rank Authors 1994 1995 1996 1997 1998 Total
21. 6 BALYAN (RS) 1 1 4 06
22. 6 SWANTON (J) 1 4 1 06
23. 6 SAVERBORN (J) 1 2 2 1 06
24. 6 KOKI (Loke T) 3 1 2 06
25. 6 WEHTJE (Glenn R) 1 1 3 1 06
26. 6 XIE (HS) 2 1 2 1 06
27. 6 FROUDWILLIAMS (RJ) 1 2 1 2 06
28. 6 AULD (BA) 1 4 1 06
29. 6 CARDINA (John) 1 1 4 06
30. 6 HORAK (Michael J) 1 3 2 06
31. 6 HAMMILL (Allan S) 1 2 2 1 06
32. 7 JORDAN (David L) 1 1 1 2 05
33. 7 THOMAS (AG) 3 1 1 05
34. 7 DUKE (SO) 4 1 05
35. 7 GRIFFIN (JL) 3 1 1 05
36. 7 LOCKE (MA) 1 2 1 1 05
37. 7 NIMBAL (CI) 3 1 1 05
38. 7 BOYETTE (CD) 1 2 1 1 05
39. 7 BULCKE (R) 1 2 2 05
40. 7 PRESTON (C) 1 2 2 05
41. 7 MASTERS (RA) 1 2 1 1 05
73

S.No Rank Authors 1994 1995 1996 1997 1998 Total
42. 7 MAXWELL (BP) 2 1 1 1 05
43. 7 SCHROEDER (Dieta) 1 2 2 05
44. 7 KELLS (JJ) 2 3 05
45. 7 WEAVER (SE) 2 2 1 05
46. 7 COUSENS(R) 2 2 1 05
47. 7 CAREY (VF) 2 1 2 05
48. 7 CALLENS (D) 1 2 2 05
49. 7 COBLE(HD) 2 4
3 05
50. 7 MARKER(KN) 1 1 2 1 05
51. " 8 HALL (LM) 1 1 2 04
52. 8 HOLT (JS) 2 1 1 04
53. 8 CAVERS (PB) 2 1 1 04
54. 8 CHRISTIANS (N) 1 1 1 1 04
55. 8 CAMPBELL (MH) 1 2 1 04
56. 8 CUSSANS (GW) 3 1 04
57. 8 WALKER (RH) 1 3 04
58. 8 WATSON (AK) 4 04
59. 8 KIRKWOOD (RC) 1 2 1 04
60. 8 KROSCHEL (J) 2 1 1 04
61. 8 SCHREIBER (MM) 2 1 1 04
62. 8 SHARMA (MP) 3 1 04
74

S.No. Rank Authors 1994 1995 1996 1997 1998 Total
63. 8 STREIBIG (JC) 2 1 1 04
64. 8 SMITH (C) 1 2 1 04
65. 8 STERLING (TM) 3 1 04
66. 8 SATAO (RN) 2 1 1 04
67. 8 MULUGETA (D) 1 3 04
68. 8 MALLORYSMITH (CA) 3 1 04
69. 8 MARRS (RH) 1 3 04
70. 8 MOSS (SR) 1 2 1 04
71. 8 MEDD (RW) 1 2 1 04
72. 8 PAKEMAN (RJ) 1 3 04
73. 8 PATIL (BP) 1 3 04
74. 8 BLOSSEY (B) 2 1 04
75. 8 BRUCE BABEL (AL) 1 2 04
76. 8 BOWES (GG) 2 1 04
77. 8 NISSEN (SJ) 1 1 1 04
78. 8 LOTZ (LAP) 1 2 04
79. 8 LINDQUIST (JL) 1 1 1 04
80. 8 GILL (GS) 1 2 1 04
81. 8 GRAY (JA) 2 1 1 04
82 8 DITOMMASO (A) 1 2 1 04
83. 8 TALEB (A) 2 2 04
75

AUTHORSHIP PATTERN
Multiple authorship has been a characteristic feature of the
modern science and there has been a consistent trend towards increased
collaboration in all the branches of sciences.
It has also been found that the late of increase in the multiple
authorship varies considerably with the subjects concerned.
The table-3 showed the pattern of authorship in terms of single
and multiple.
76

Table-3
AUTHORSHIP PATTERN Single Authorship I Multiple Authorship I Total No. of Authors
No. of Authors
Percentage No. of Authors
Percentage
242 13.06 1611 86.94 1853
Single Authorship Multiple Authorship Total No. of Articles
No. of Articles
Percentage No. of Articles
Percentage
242 19.87 976 80.13 1218
r •\
( Ace. N - )
f > :
77

Table 3.1 Authorship Pattern
3
cu
Authors
78

RANKING OF JOURNALS
206 journals were analysed in relation to their productivity. The
more frequently published journals by the weed and weed control
scientists were identified and the ranked list of journals were
prepared by decreasing productivity.
The list of the journals shows that Weed Science is the most
highly used journal as far as the weed and weed control research is
concemed.lt has 212 articles out of 1218 articles.
Weed Technology and Weed Research are also equally important
journal of this field.These three constitute around 40% of the
articles. And the rest 60% is covered by 203 journals.
79

I
z
o •-9
b. O O
z :^ z <
u 60 60
o vC r _ • V l • / - I oc o T f rt r- .« C u o ^ ^ <N TT ON o oe 0 0 VO vp ^ m C u o r-' ro ON' m rvi <N
b u D .
^ «N r VO vc U-) r o r>j o O oo VO
o ( S ^ \ C d <N rsl r>i ( N rN4
oc OS
o\ o oo
o NC o C — o >ri m o
r~ ^ r r r o •<r oc o o •^ VO —
"
vC
o\ ' I -
O N CM
oc NC oc r«-. •* — ON — «ri
* >n
CNJ o — r - C r<-i o rvl >ri <N
• ON ON
oc CM
m oe >o vC NO — «/-i TT JN VO 00
""
CO
"o
I . 4-rf
E u
> u c
_>»
T3 O O
U .
4-*
3 E >>
u "o
O ^ « « o c
• 60 c i2
C t u en o O &
CO
3
c "o 4-*
"i 3
3 o
'E
00 < o O u
o •3
c 3 O
1—»
o u c o
"5
o "S c
.c u o
U
o en U
o u u o Urn
c o U
u
o o
ffl u
CO
< o
u o w CO
<
c k> 3
o
"S. o. <
o
s o
'3
u
c 3 0
o u E
• o H
«> u
a. •«* c _o
4 - * c u
o c en n c c
<
(3
•5 It
e
U
Z ^ $ 1 o IB
U 3 O
—> f2 "5
en n c c
< o a.
(3
•5 It
e
U JK C rt
o: - cs r»> ^ </ VC r» 0 0 O N o\ o
=
6 Z o f N C/3 "" f>i r»i T t >n vb r>-' oo ON' —
80

u 00
c u
00
c u r^ •<»•
o O O oo 0 0 oe © o < N x - i T)
00
c u < N ^^ o O O 0\ O N O N ON OS OC VO »C
u ^ M • i< iM ^ ^ • ^ ^ • ^
w u
O.
.« o >/ • > » r^ m m fN) < N <N1 — o 0 0 0 0
(-
0 0 0 0
r^ oc — <o rM — cn
"
r~ r - l — VC CM ro
O N
0 - . O N
0 - . • * m — ro ^ • V r» V", — —> — ""
ON ON T •>3- — i / ^ rn — —. — r^ o VO rv)
r M o — — vO r t ^ o rvi —' O l O 0 0
C
u E c o b-
> c >.
4-t c u E u 00 a c n
in
k« 3
4-rf
3 O en
00
o c u
c^ 00 a. E
£ «: o o < e •T3 £ < t/3
E o "rt
c u u c C/3
c
c
o
C/5 >. cn O O
U u b. a 4 ^
c o u o o
o cd u CO
c tu
c o E
c 3 O
"(5 c o
c u s o
E
C
o ' • J o o o
u s
• o o k .
a . «». o
u "o
'c J2 a.
4-» C
CL.
c en u o c >
u u c «
o
"o k.
1
k.
u ' • * - »
O c ( 0 •o T3 o
a E
"5 o
0 0 o
a:
o b i
s o > c
C
u c
o c o 00
o " 5 c k . a o
*-»
t3 o
o.
4-» C
CL.
c en u o c >
4 ^ c o u o
O u
en
z < u U u
C
u c
< o.
" 5 c k . a o
*-» < < ffi <
en
.:!< c
< N ro •* ^ rr «% <r> • T i vC VO t^ 0 0 0 0
d z .
m • ^ «ri VO r ' 0 0 o> o »* CNJ CO r f «r> C/3 < N r«» < N CN4 C N I c^
81

u 60 ca
•/ </ t ~ 1 ^ r- Ov
u \ C NO >rt v> • r , TJ- 'a- ^ ^ TT • * •* u
u Cu
, , (d
o OC oo t^ t ^ r«- vO • n «ri •T) «ri « - i >ri
P
9C 0 \ Ov ( N CNI " ^
t ~ 0^ r* r^. f S " •
f S
"
ON ON m r^ f»-. NC fNj ^ ™ "~ rsi <N
ON ON r«"4 CM r s rNi r o ^ ~
ON ON ON ON >n <VI — <N — r n <N
c o
£
u 3
3 O
CO
<
u er, R O . o M
1 ^ o
u
a; -c •o eo C
o Ml
c 4-* c u E u
C
c u .E
1 £
U CO
1"E
u o c u 3
5 c
_C3
4-* c u E u
C
u D .
u w
j O
o
o —' £ = :3 S.
U CO
1"E O
u u c o
0 0
o u
00 u oi
% CL s (<- u
— o 3 S
U CO
1"E 1/3 C/3 tu
00 u oi
%
en
U
3
'5 O
"5 — o 3 S
1 2 E c
2 " - >
(41 O u o
I .
o •«3
U
3 > c b.
1 2 E c
2 " - > "5 c
'5 1 • • ^
c or u 3 D . u. tS "5 c V3 o c
JS a . 3
O
u <
tn u o •—> c
O .
< op « &i 3 O
D .
U CL.
c JS a .
Vi- o -o .2 o •E-5
3 ^
in s D . o O o O o E <<>
c 3
c
o 75 M 3
c 3
"O CO • O 0 0 -§ ^ 5 o 3 ^
i5 c
•5 c
O E o
4- i c U
c 3
c 3
c 3
Z o
c
o
< O 1—I S f f i JS£ CL
•5 c
O E o
4- i c U
O O 1—>
O
^ c (3 OC oo O N cr O N O (3
rsj «N CNJ f S rN| <N CN)
d d vd (-»' OC ON' O ^ CNl f ^ T f •r> so" r-
C/} CM f N CM f S r»^ f n r^ f»i m r o m f ^
82

u CO a c r^ r»^ m r o m r»i d r^ CO m «o «r> •o o r o r o «*> r o m r»i r^ r<% r»^ rn CM CM CM u w u
CL.
n 4-> o •o- T • * ^ r r TT •"O- ^ • "* m f O CO
F
oc 0^ O. CN ^ " r o (?• fvl
a. a. ^ •" " I N rsi * • *
CM — — — — — r<", — CM » • • "
•V a o CM f » i m m
u u c
u 3
u • c
u . B
s cn u
C o
' •5
u k-3
4») O B
o G
C/3
"« k. 3
C
o o
>> 60
3 O
k-
CO
B O
"5 o o
O o
O
C
o G
C/3
"« k. 3
o
o "o E o
• * ^ c
o I
.E t 3
ffl
to o
(A c o 3 O
CL
"o E o
• * ^ c 2
E B
8. B CO
B CO
o CO
« "5. a. <
00
< _eO
cu
2
E B
1 60
k« 3
e (0 o.
1 -
CO
t o
c k. s o
1—>
c u 3 O
cn
CO
« "5. a. < u
o
c
o
c k.
o "5. <
O u "> B u
3 * 3 U
O
o E o
3 O k. 00
<
CO
>-» CO
"cO
u
E u
u U ka
t o
c k. s o
1—> ^ '5) 15 u
o u U
u 3 3 <«> (<- < E ^ 1 u
o k. bO
<
E u
u U ka
o o E z.
c .5
CO c CO
o o E o B
15 u
o u U
c w
'5 CO
o
O
c « •5
o c .2 •5 JC
o
B w 3 O
o
B k. 3 O
• — I
CO CO CO
<
B CO u
<
CO
u •fib _o "o m
1 u
o k. bO
<
3
3 o 'C 00
< Jat C CO CN CM r<) «s rs <N CM CM CM CM r o C^ f ^ CO
CM «N rs M «N f S CM CM f S CM CM CM CM
6 Z 6 Z
OC ON o • • M CM f*^ TT «ri VO r- 00 o\ O
c/i m r^. • V • * • ^ ''T ^ • ^ • * • * • ^ >r>
83

GEOGRAPHICAL ANALYSIS
The table-5 showed the geographical distribution of items. The
country coming first publish the maximum number of articles and the
rest are arranged in order of decreasing productivity.
In the table-5, out of 54 countries USA publishes the maximum
number of articles with 38.26%, Canada is second with 10.20%,
Australia is third with 8.62%, and India is fourth with 7.67%.
11 countries have published single articles.
Table 5.1 shows the graph of the countries in order of decreasing
productivity.
84

TabIe-5
GEOGRAPHICAL ANALYSIS
S.No. Rank Countries 1994 1995 1996 1997 1998 Total %age
1. 1 USA 104 132 110 106 32 484 38.26
2. 2 CANADA 30 32 30 32 5 129 10.20
3. 3 AUSTRALIA 26 19 27 20 17 109 8.62
4. 4 INDIA 23 15 19 4 36 97 7.67
5. 5 U.K. 12 17 22 13 4 68 5.38
6. 6 JAPAN 12 6 4 6 4 32 2.53
7. 7 SWEDEN 12 7 5 3 3 30 2.37
8. 8 SOUTH AFRICA 12 7 4 4 27 2.13
9. 9 FRANCE 4 7 4 5 1 21 1.66
10. 10 GERMANY 6 6 2 3 2 19 1.50
11. 10 SPAIN 3 4 6 5 1 19 1.50
12. 10 NETHERLANDS 5 1 7 6 19 1.50
13. 11 ISRAEL 2 10 4 2 18 1.42
14. 12 SWITZERLAND 2 4 5 1 4 16 1.26
15. 13 RUSSIA 7 3 2 2 14 1.11
16. 13 DENMARK 4 5 2 1 2 14 1.11
17. 14 ARGENTINA 3 2 4 2 11 .87
18. 15 ITALY 3 5 1 1 10 .79
19. 15 HUNGARY 3 1 6 10 .79
85

S.No. Rank Countries 1994 1995 1996 1997 1998 Total %age
20. 16 BELGIUM 1 3 3 2 9 .71
21. 17 NEW ZEALAND 3 1 2 2 8 .63
22. 18 SOUTH KOREA 1 1 2 3 7 .55
23. 19 NIGERIA 4 1 1 6 .48
24. 19 PORTUGAL 1 2 3 6 .48
25. 20 MALAYSIA 2 1 1 1 5 .39
26., 20 EGYPT 1 1 3 5 .39
27. 20 CZECH REPUBUC 1 2 2 5 .39
28. 20 JORDAN 1 3 1 5 .39
29. 21 UKRAINE 2 1 1 4 .32
30. 21 SRI LANKA 1 2 1 4 .32
31. 21 ZIMBABWE 1 2 1 4 .32
32. 22 MEXICO 2 1 3 .24
33. 22 BELARUS 2 1 3 .24
34. 22 POLAND 1 1 1 3 .24
35. 22 BULGARIA 2 1 3 .24
36. 22 NORWAY 2 1 3 .24
37. 22 CROATIA 1 1 1 3 .24
38. 22 PHILLIPINES 3 3 .24
39. 23 CHINA 1 1 2 .16
40. 23 GREECE 1 I 2 .16
86

S.No. Rank Countries 1994 1995 1996 1997 1998 Total %age
41. 23 BRAZIL 1 1 2 .16
42. 23 S. ARABIA 1 1 2 .16
43. 23 MALI 2 2 .16
44. 24 ECUADOR 1 .08
45. 24 PALAU 1 .08
46. 24 INDONESIA 1 .08
47. 24 NEW GUINEA 1 .08
48. 24 ETHIOPIA 1 .08
49. 24 CAMEROON 1 .08
50. 24 YEMEN 1 .08
51. 24 KENYA 1 .08
52. 24 FINLAND 1 .08
53. 24 UAE 1 .08
54. 24 VENEZUELA 1 .08
Total 100%
87

1 I
o. CO
«• E
B S
in ^
0)
I < i oi
I I
5 c
3 <
U
I <
-4 o o l O
CM o lO — I —
lO
88

LANGUAGEWISE DISTRIBUTION OF PAPERS
Languagewise distribution of papers is showed in the table-6.
It shows the most dominant language used in the publication of weed
and weed control articles is English.
The table-6 shows that out of 20 languages, Enghsh is flie most common
language used with 92.87% followed by Russian with 1.17%. The otiier
languages used are very small in number.
Table 6.1 shows the graph of the languages used in the
publication of the articles relating to weed and weed control.
89
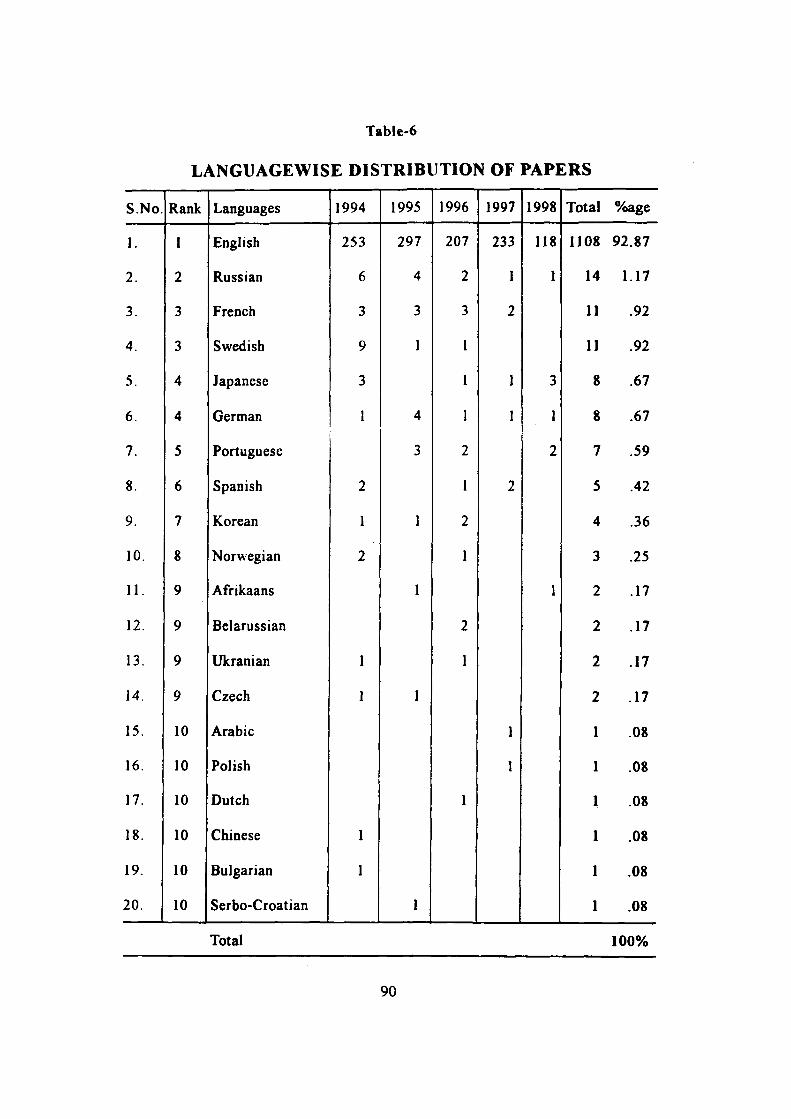
Table-6
LANGUAGEWISE DISTRIBUTION OF PAPERS
S.No. Rank Languages 1994 1995 1996 1997 1998 Total %age
I. 1 English 253 297 207 233 118 1108 92.87
2. 2 Russian 6 4 2 1 1 14 1.17
3. 3 French 3 3 3 2 11 .92
4. 3 Swedish 9 1 1 11 .92
5. 4 Japanese 3 1 1 3 8 .67
6. 4 German 1 4 1 1 1 8 .67
7. 5 Portuguese 3 2 2 7 .59
8. 6 Spanish 2 1 2 5 .42
9. 7 Korean 1 1 2 4 .36
10. 8 Norwegian 2 1 3 .25
11. 9 Afrikaans 1 1 2 .17
12. 9 Belarussian 2 2 .17
13. 9 Ukranian 1 1 2 .17
14. 9 Czech 1 1 2 .17
15. 10 Arabic 1 .08
16. 10 Polish 1 .08
17. 10 Dutch 1 .08
18. 10 Chinese 1 .08
19. 10 Bulgarian 1 .08
20. 10 Serbo-Croatian 1 .08
Total 100%
90

V
ID
SO
ao
70
2 w eo
Table 6.1 Literature Vs Language
•4->
c a
SD
«
2D
6vN' RBian Henh
Language
91

LEVEL-2
CITATION ANALYSIS
To carry out citation analysis, only journals available in Aligarh
libraries were taken into consideration.
The number of such journals are five and source articles are 10.
They gave us a total of 252 references. After this following analysis
has been done.
Formwise distribution
Ranked list of cited authors
Ranked list of cited journals
Chronological analysis of journals citations
92

FORMWISE DISTRIBUTION
The slips were sorted into different categories on the basis of
docupfient cited. They were grouped into journal, articles, books,
proceedings of workships / symposia, reports, bulletins, serials, theses
and others, which do not belong to any of the above groups. These
represent the major source of references though some others like
newspapers, articles, patents, standards, circulars, etc are also found.
The papers that appeared in research journals. The group books,
denote trade books and monographs.
Proceedings of workshop covers the papers presented to
workshop. Reports refers to research report and progress reports of
research organisation. Serials are publications at regular or irregular
intervals. It is shown that journals is the most popular form with 76.19%
followed by institution with 7.14%.
93

Table!
FORMWISE DISTRIBUTION
S.No. Rank Forms 1994 1995 1996 1997 1998 Total %age
1. 1 Journals Articles 45 101 12 34 192 76.19
2, 2 Institution 3 15 18 7.14
3. 3 Bulletin/Reports 5 12 17 6.75
4. 4 Books 5 6 3 14 5.56
5. 5 Proceedigns of S>npc6iuni / Seminar / Workshop 1 7 8 3.17
6. 6 Thesis/ Dissertation 1 1 2 1.26
7. 7 Others 1 1 .39
Total 252 100%
94

70-
3 CO
c o
20 '
Table-1.1 Formwise Distribution
Forms
95

RANKED LIST OF CITED AUTHORS
A ranked list of cited authors has been prepared. It shows that
which author is most frequently cited in the research of weed and weed
control for the period of 1994-1998.
It is shown in the table-2 that Buhler is the most cited author
followed by Moss, Inderjit is third and Dakshini fourth.
278 authors have been cited once, 28 authors have been cited
twice, while 17 authors have been cited thrice.
96

Table-2
RANKED LIST OF CITED AUTHORS
S.No Rank Authors 1994 1995 1996 1997 1998 Total
1. 1 BUHLER(DD) 14 14
2. 2 MOSS (SR) 4 8 12
3. 3 INDERJIT (KM) 7 7
4. 3 DAKSHINI (KM) 7 7
5. 4 CUSSANS (GW) 4 2 6
6. 4 TRUJILLO (EE) 3 1 2 6
7. 4 ROSENTHAL (SS) 6 6
8. 5 ANDERSON (RN) 5 5
9. 5 HEINY (DK) 5 5
10. 5 BEINER (DK) 5 5
11. 6 WICKS (GA) 4 4
12. 6 FORCELLA (F) 4 4
13. 6 CAESAR (AJ) 4 4
14. DOLL (JD) 3 3
15. WORSHAM (AD) 1 2 3
16. BURNSIDE (OC) 3 3
17. TRIPLETT (GB) 3 3
18. ROSS (MA) 2 1 3
19. ROBERTS(HA) 2 1 3
97
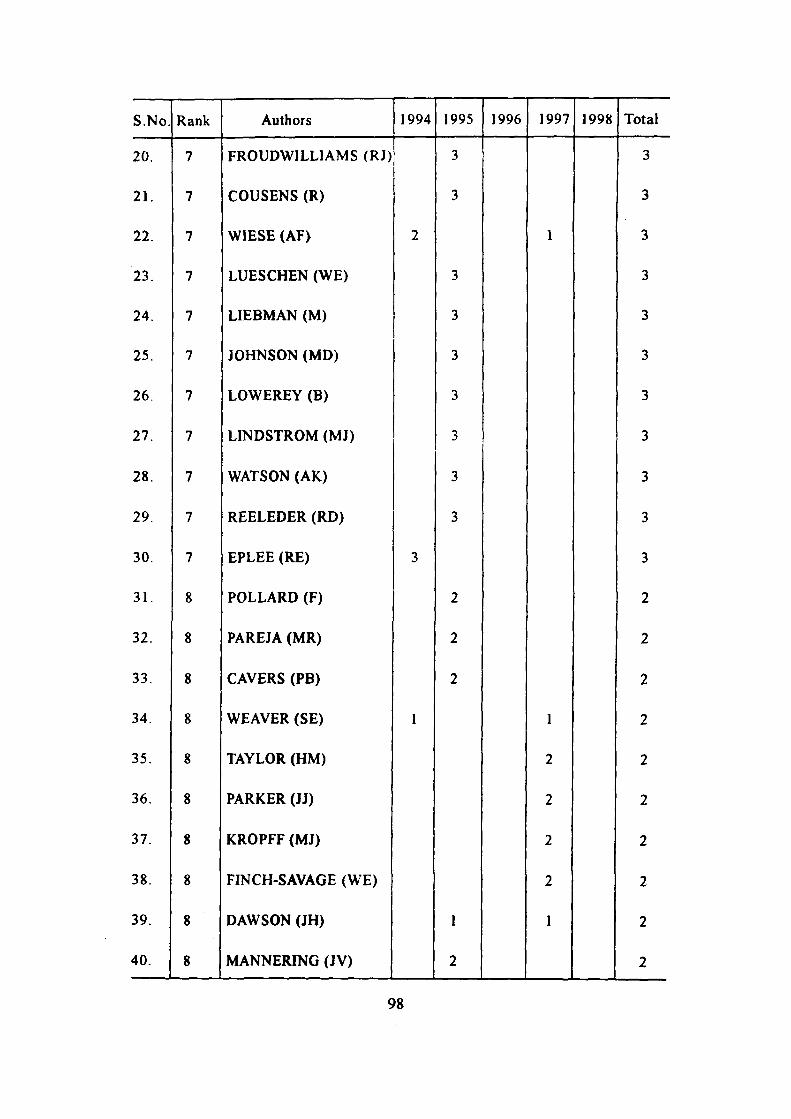
S.No. Rank Authors 1994 1995 1996 1997 1998 Total
20. 7 FROUDWILLIAMS (RJ) 3 3
21. 7 COUSENS (R) 3 3
22. 7 WIESE (AF> 2 1 3
23. 7 LUESCHEN (WE) 3 3
24. 7 LIEBMAN (M) 3 3
25. 7 JOHNSON (MD) 3 3
26. 7 LOWEREY (B) 3 3
27. 7 LINDSTROM (MJ) 3 3
28. 7 WATSON (AK) 3 3
29. 7 REELEDER (RD) 3 3
30. 7 EPLEE(RE) 3 3
31. 8 POLLARD (F) 2 2
32. 8 PAREJA (MR) 2 2
33. 8 CAVERS (PB) 2 2
34. 8 WEAVER (SE) 1 1 2
35. 8 TAYLOR (HM) 2 2
36. 8 PARKER (JJ) 2 2
37. 8 KROPFF (MJ) 2 2
38. 8 FINCH-SAVAGE (WE) 2 2
39. 8 DAWSON (JH) 1 1 2
40. 8 MANNERING (JV) 2 2
98

S.No Rank Authors 1994 1995 1996 1997 1998 Total
41. 8 KELLS (JJ) 2 2
42. 8 HARPER (JL) 2 2
43. 8 DONALD (WW) 2 2
44. 8 BLACKLOW (WM) 2 2
45. 8 GABRIELSON (RL) 1 1 2
46. 8 GROGAN (RG) 1 1 2
47. 8 MORTIMER (AM) 1 1 2
48. 8 WIN DELS (EE) 2 2
49. 8 QUIMBY (PC) 2 2
50. 8 MORIN (L) 2 2
51. 8 SAND (PF) 2 2
52. 8 KIM (SK) 2 2
53. 8 LA ROSA (AM) 2 2
54. 8 VAN OORSCHOT (JLP) 2 2
55. 8 VAN LEEUWEN (PH) 2 2
56. 8 HOLT (JS) 2 2
57. 8 CASELEY (J) 2 2
58. 8 BLAIR (AM) 2 2
59. 9 SINGLE CITATIONS 278
99

RANKED LIST OF CITED JOURNALS
The journal articles obtained were analysed in detail. The
most frequently used journals by the weed and weed control
research scientist were identified and the ranked list of journals
were prepared.
The list of journals showed that the journal Weed Science
is the most highly used journal as far as weed and weed control
research is concerned. This finding support the earlier findings
that scientists of highly specialised discipline depend on the core
journa ls in the specific discipl ine for their information
requirements. Weed and weed control is a narrow field in
agricultural sciences and journals devoted to this area are very
few in number.
100

TabIe-3
RANKED LIST OF CITED JOURNALS
S.No Rank Journals 1994 1995 1996 1997 1998 Total
1. 1 Weed Science 4 39 3 46
2. 2 Weed Research 8 8 16
3. 3 Agronomy Journal 1 7 3 11
4. 3 Ph\topathology 5 3 3 11
5. 4 Journal of Chemical Ecolpg>- 8 2 10
6. 5 Weed Technolog> 2 7 9
7. 5 Plant Disease 1 4 4 9
8. 6 Crop Science 3 3 6
9. 6 American Journal of Botan; 4 1 1 6
10. 7 Canadian Journal of Botan} 1 2 1 1 5
11. 7 Journal of Applied Ecology 3 2 5
12. 8 Journal of Ecology 4 4
101

CHRONOLOGICAL ANALYSIS OF JOURNAL CITATIONS
The citations were grouped based on the year of publication
into a period of 5 years as shown in the table-4.
The analysis shows that maximum number of citations
belonged to the period 1981-1990.
This may be due to the fact that the period 1981-1990
records the maximum of research conducted in all the basic areas
of weed and weed control and a number of publications were
released during this period.
102

Table-4
CHRONOLOGICAL ANALYSIS OF JOURNAL CITATIONS
Period No. of Citations Percentage
1991-1997 163 47.94
1981-1990 181 53.24
1971-1980 58 17.06
1961-1970 19 5.59
1951-1960 7 2.06
1941-1950 2 .59
1931-1940 3 .88
1921-1930 1 .29
1911-1920 2 .59
1901-1910 3 .88
1881-1890 1 .29
103

APPLICATION OF THE BIBLIOMETRIC LAWS
Bibliometric distributions are ued to study :
1. Frequency of occurrence of words in a text (Zipf s law).
2. Productivity of authors in terms of scientific papers (Lotka's law).
3. Scattering of articles over different journals (Bradford's law).
Bradford's Law
If a group of journals are arranged in an order of decreasing
productivity i.e. the journals that yield the most relevant articles coming
first and the most unproductive last, then the journals well be grouped
into a number of zones. Each producing a similar number of relevant
articles. However, the number of journals for each zone well be increasing
very rapidly and show a geometric progression. The relationship between
the zones is to be given by the following equation, i.e.
1 : n : n
From the above table it is clear that zone 1 is the nucleus consisting
of core journals were particularly devoted to the subject.
Total number of articles is 1218. Total number of journal is 206.
104

2:2x1 : {2xlf
2 : 14 : (14)^
2 : 14 : 196
= 212.
2 journals constitute 376 articles
14 journals constitute 427 articles
196 journals constitute 415 articles.
Thus from the Bradford law it is proved that 2 core journals has
approximately same number of articles as that of other zones. Thus the
law is proved broadly.
BRADFORD'S BIBLIOGRAPH
On X axis cumulative number of journals in 3 different zones are
taken. First zone consist of 2 journals. Second zone consist of 14 journals.
Third zone consists of 196 journals.
The log value of 2 journals in the first zone is .30103, log value of
14 journals in the second zone is 1.146128, log value of 196 journals in
the third zone is 2.2922561.
105

On Y axis cumulative number of articles are taken at 3 points Y,,
Yj and Y,. The first zone consist of 376 articles. The second zone consist
of 803 articles, the third zone consist of 1218 articles.
Log value is taken on X axis only, thatswhy it is semi-log graph. Pj,
P , P, are the boundaries of 3 equiproductive zones. Straight line shows
that the number of journals are increasing while the curve shows the
number of core journals.
LOTKA's LAW:
Due to multiple authorship the number of authors have increased.
No. of Authors No. of Articles
1414 1 article
265 2 articles
82 3 article
According to law :
No. of scientist publishing 1 paper / n
where n = number of papers
Authors 2 papers
= 1414/22
= 353
106

Authors 3 papers
= 1414/32
= 157
Thus the law is not proved at any stage may be because of the
prevalence of multiple authorship of individual papers.
Zipf s Law:
It is not applied as it deals with the long textual matter of the article.
107
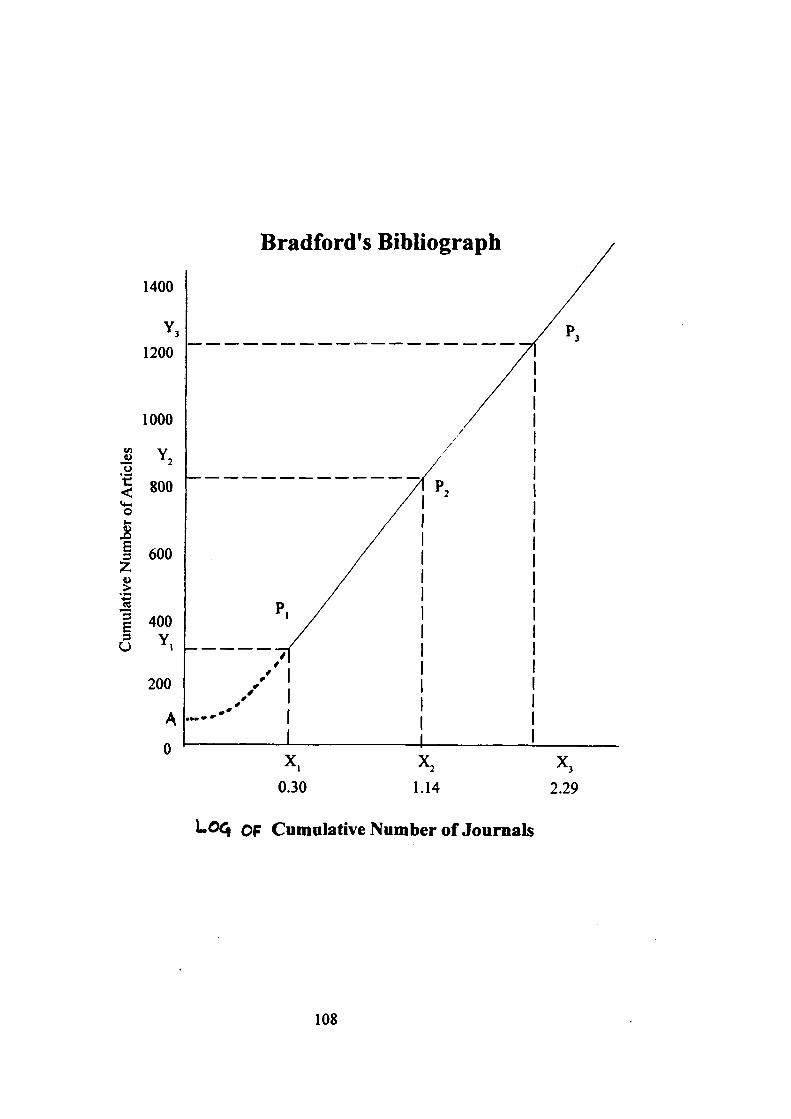
Bradford*s Bibliograph
1400
1200
1000
Y, U
< 800 < 0 b< i>
Si
3 600 Z u >
+rf ee 3 400 3
U Y.
200
A
0
0.30 2
1.14 ' 3
2.29
LO^ OF CumulativeNumber of Journals
108

CONCLUSION
Bibliometric study has been done on the topic "Weed and Weed
Control". The analysis is done at two level. The first level gives the core
journal of the subject, most productive author, most dominant language
and the most productive country.
Level two gives the most cited journal, most cited author, most
popular form of publication and the years in which the publication is done
most on the subject..
Application of laws has also been done. Level one shows the
following results regarding Ranked Authors. First five authors which are
arranged in decreasing productivity.
S.No. Rank Author Total Articles
1. 1 Penner(D) 11
2. 2 Malik (RK) 10
3. 3 Mitich (LW) 9
4. 3 Blackshaw (RE) 9
5. 3 Thill (DC) 9
Ranked journals - the top most five ranked journal are S.No. Rank Journal Percentage 1. 1 Weed Science 17.40 2. 2 Weed Technology 13.46 3. 3 Weed Research 9.27
4. 4 Plant Protection Quarterly 5.41
5. 5 Biological Control 2.95
109

Countries - the top five countries regarding the publication are
S.No. Rank Countries Percentage
1. 1 U.S.A. 38.26
2. 2 Canada 10.20
3. 3 Australia 8.62
4. 4 India 7.67
5. 5 U.K. 5.38
Language - the top five language used in the publication of artitles
related to weed and weed control.
S.No. Rank Language Percentage
1. 1 English 92.87
2. 2 Russian 1.17
3. 3 French .92
4. 3 Swedish .92
5. 4 Japanese .67
At the stage of level-2 the following conclusions come out regarding
the most cited author, journal, form.
Author - the most cited authors are
S.No. Rank Author Total
1.
2.
2.
1
2
3
Buhler (DD)
Moss (SR)
Inderjit
14
12
7
Journal - the most cited journals are weed science and weed research
which is similar to level-1.
S.No. Rank Journal Total
1.
2.
3.
1
2
3
Weed Science
Weed Research
Agronomy
46
16
11
Forms - the form which is most cited in the articles.
S.No. Rank Form Percentage
1.
2.
3.
1
2
3
Journal
Institution
Bulletin/Reports
76.19
7.14
6.75
110

FINDINGS:
After going through the level-1 and level-2 it is found that the
journals used by the scientists of the topic Weed and Weed Control are
similar i.e. weed science and weed research. While that of authors it is
not matched. Journals are preferred at level-2.
Regarding the laws of bibliometrics, Bradford law have been proved
broadly but Lotka's law could not be proved because of the reason cited
in the study.
Zipf s law could not be applied because it refers to counting of words
in a long textual matter.
HI

1. DEV RAJAN. Bibliometric studies. New Delhi, Ess Ess publication,
1997.
2. GARFIELD ( E.). Citation indexing : its theory and application
in science, technology and humanities. New Yourk, John wiley.
GUHA ( B ). Documentation and information. Calcutta, the/vorld
)ress, 1978. p 279- 291.
4. PRASHER (R.G.).]dbrary and Information Science: Parameters and
Perspectives. New Delhi, Concepts, 1997. Vol. 2, p. 245-346.
5. PRITCHARD ( A ), statistical bibliography or bibliometrics. Journal
of documentation. Vol. 25; 1969; p 348- 349.
6. SENGUPTA ( I.N.). A new bibliometric technique for quantitative
evaluation of core journals of basic sciences horizon, 1986,
Allied; New Delhi, p 329- 368.
7. SENGUPTA (I.N.). Bibliometrics : A bird eye view. lASLIC
bulleting. Vol 30; 1985; p 167- 174.
8. Mathews, G. Weed and Weed management. London, Vol. 2.