
MS Amlin AG - FCR 2020
76
1
Transcript of MS Amlin AG - FCR 2020

1

© MS Amlin AG 2
Contents 1. Cautionary Statements ............................................................................................................... 3
2. Executive Summary .................................................................................................................... 4
3. Business Activities ...................................................................................................................... 7
3.1 Information about the insurance company’s business activities and Group Status .............. 7 3.2 Strategy, objectives and key business segments .................................................................. 7 3.3 External auditors .................................................................................................................... 8 3.4 Significant unusual events ..................................................................................................... 8
4. Performance ................................................................................................................................. 9
4.1 Underwriting performance...................................................................................................... 9 4.2 Financial Performance ......................................................................................................... 11 4.3 Profits & Losses recognized directly in Equity ..................................................................... 13 4.4 Other material income and expenses .................................................................................. 13
5. Corporate Governance and Risk Management ...................................................................... 14
5.1 Overview of Corporate Governance .................................................................................... 14 5.2 Overview of Risk Management ............................................................................................ 16
6. Risk Profile ................................................................................................................................. 20
6.1 Quantitative & Qualitative Information about Risk Profile .................................................... 20 6.2 Material risk exposures ........................................................................................................ 27
7. Valuation ..................................................................................................................................... 28
7.1 Market Consistent Asset Valuation for solvency purposes .................................................. 28 7.2 Market Consistent Valuation of Provisions for Insurance Obligations for Solvency ............ 29 7.3 Information on the Risk Margin ............................................................................................ 29 7.4 Market consistent valuation of other liabilities (for solvency purposes) ............................... 30
8. Capital Management .................................................................................................................. 31
8.1 Goals, strategy and time horizon for capital planning .......................................................... 31 8.2 Structure, level and quality of the equity capital reported in the annual report .................... 32
9. Solvency ..................................................................................................................................... 33
9.1 Information about the Internal Model ................................................................................... 33 9.2 Information about Target Capital (with explanatory notes) .................................................. 35 9.3 Information about Risk-Bearing Capital ............................................................................... 36
10. Appendices ................................................................................................................................ 38
10.1 Appendix 1 ........................................................................................................................... 38 10.2 Appendix 2 ........................................................................................................................... 41 10.3 Appendix 3 ........................................................................................................................... 44
© MS Amlin AG 3
1. Cautionary Statements This Report may include statements with respect to future events, trends, plans, expectation or objectives relating to MS Amlin AG’s future business, financial condition, results of operations, performance and strategy. Forward looking statements are not statements of historical fact and may contain the terms, “may”, “will”, “should”, “continue”, “aims”, “estimates”, “projects”, “believes”, “intends”, “expects”, “plans”, “seeks” or “anticipates” or words which have a similar meaning. No undue reliance should be placed on such statements because, by their nature, they are subject to unknown risks and uncertainties and can be affected by other factors that could cause actual results and plans of MS Amlin AG to differ materially from those expressed or implied in the forward looking statements (or from past results). Factors such as, but not limited to (i) general economic conditions and competitive factors, particularly in key markets, in each case on a local, regional, national and/or global basis (ii) the risk of a global economic downturn (iii) performance of financial markets (iv) levels of interest rates and currency exchange rates (v) the frequency, severity and development of insured claims events (vi) policy renewal and lapse rates (vii) changes in laws and regulations and in the policies of regulators (viii) increases in loss expenses may all have a direct bearing on the results of operations of MS Amlin AG and on whether any targets may be achieved. Many of these factors may be more likely to occur or be more pronounced as a result of catastrophic events. MS Amlin AG does not undertake or assume any obligation to update or revise any of these forward looking statements, whether to reflect any new information, future events or circumstances or otherwise, except as required by applicable laws and regulations.
© MS Amlin AG 4
2. Executive Summary This annual Financial Condition Report (“FCR”) for the year ended 31 December 2020 has been prepared for MS Amlin AG (“MS AAG” or “the Company”).
MS Amlin AG is a wholly owned subsidiary of Mitsui Sumitomo Insurance Company, Limited. (MSI) with its ultimate parent being MS&AD Insurance Group Holdings, Inc. (MS&AD). The Company was previously a wholly owned subsidiary of MS Amlin plc, however its share ownership in the Company transferred to MSI on 1 January 2020.
Basis of preparation
This Financial Condition Report has been prepared in line with the requirements as set out in the Swiss Financial Market Supervisory Authority (“FINMA”) Circular 2016/2 “Disclosure – insurers”. The circular expands on Articles 111a and 203a of the Insurance Supervision Ordinance (ISO; SR 961,011) on the FCRs of supervised insurance companies, groups and conglomerates. This report is to meet the regulatory reporting requirements of MS Amlin AG, and for no other purpose and should not be relied upon for any other such purpose.
Financial information included in this report is based on MS Amlin AG’s 2021 Swiss Solvency Test’s (“SST”) Market Consistent Balance Sheet (for Balance Sheet financial information) and the 2020 Swiss CO Annual Report (“Swiss CO”), (for Profit or Loss information); both have been prepared in accordance with their relevant regulatory or accounting standards. Unless stated otherwise, this report represents the position of MS Amlin AG as at 31 December 2020 only and will not necessarily reflect all changes in MS Amlin AG’s operations since that date. All quantitative information in this report is disclosed in USD, MS Amlin AG’s functional currency, unless otherwise specified.
Business and Performance
The Company is a Swiss-domiciled, global specialty reinsurer operating in local and international reinsurance markets, underwriting many classes of business through one capitalised underwriting platform.
The Company was originally established in 2005 as Amlin Bermuda Limited, domiciled in Bermuda. In 2010, the corporate seat of this company was redomiciled to Switzerland and became Amlin AG. The existing Bermuda operations continued as a separate underwriting centre but as a branch of Amlin AG. Amlin AG was renamed as MS Amlin AG during 2016.
MS Amlin AG consists of four businesses: MS Amlin AG Zurich based in Switzerland, MS Amlin AG Bermuda based in Hamilton, Bermuda, binders with the Miami and New Jersey branches of MS Amlin Reinsurance Managers Inc (“ARMi”), and MS Amlin AG Labuan based in Malaysia. The Company is supervised by FINMA, with the Bermuda branch also registered under the authority of the Bermuda Monetary Authority (“BMA”), and the Malaysia branch under the authority of the Labuan Financial Services Authority (“LFSA”).
MS Amlin AG also provides internal reinsurance cover for other MS Amlin entities. These internal contracts are collectively known as “Amber Re” when written by the Bermuda branch or “Azur Re” when written from Zurich. Further details on the various businesses are provided below:
MS Amlin AG Bermuda: Bermuda writes a portfolio of reinsurance business on a third party basis including property, casualty, financial lines and specialty lines written in both the US and international markets. In recent years there has been a growth in the non-property business.
MS Amlin AG Zurich: Zurich is focused on business which provides diversification when compared to Bermuda’s book, particularly with regard to natural catastrophe exposures. Accordingly Zurich targets EMEA (Europe, Middle East and Africa) clients for all classes of business.
Binder with MS Amlin Reinsurance Managers Inc, Miami: Miami is focused on Latin American Property, Accident & Health as well as Credit & Surety business, and is written under binding authority from Zurich.
Binder with MS Amlin Reinsurance Managers Inc, New Jersey: New Jersey is focused on US Motor and General Liability business, and is written under binding authority from Zurich.
MS Amlin AG Labuan: Established in 2013 to carry out reinsurance business geographically located in East and South East Asia. The operation stopped writing business in early 2018 and has been put into run-off.

© MS Amlin AG 5
In addition, other MS Amlin entities have placed a number of intercompany reinsurance contracts with the Company. These intercompany reinsurance contracts are:
o a whole account quota share with Syndicate 2001 (“the Syndicate”), a Lloyd’s Syndicate managed by MS Amlin Underwriting Limited, which covers a percentage of all of the Syndicate’s business;
o a number of proportional treaty and excess of loss contracts covering cessions of various classes of business; and
a 100% quota share agreement with MSI to support MSI’s strategic partnership with Hippo, an American property insurance company, which includes providing them with reinsurance quota share capacity.
MS Amlin AG strategy is executed across MS Amlin AG’s operating platforms, and the business managed accordingly. MS Amlin AG is supported by functions under MS Amlin Business Services (“MS ABS”) who seek to optimise operations and service levels across the MS Amlin entities.
System of Governance
The Company operates a two-tier board governance structure with the Supervisory Board made up of Non-Executive directors who are not actively engaged in the day-to-day management of the Company, of which over one third are independent of the Company. The Supervisory Board appoints a Chairman from its members.
The Executive Board is the Company’s managing body and consists of the Chief Executive Officer and other senior officers and managers of the Company. These appointments are at the discretion of the Supervisory Board.
The Supervisory Board also appoints Board Committees for specific purposes from among its members. Currently these committees comprise:
• the Audit Committee;
• the Risk & Solvency Committee;
• the Underwriting Committee; and
• the Remuneration & Nomination Committee.
The Company has a “Fit & Proper Standard” which sets out how the organisation ensures that senior management and other key function holders are fit and proper in accordance with both internal and external regulatory requirements.
Risk management objectives seek to bring business strategy, capital management, and enterprise risk management together to optimise the relationship between these elements to achieve the best long-term sustainable outcome for shareholders, insured parties, employees and other stakeholders. As part of the Risk Management Framework, risk tolerances are monitored and reported on a quarterly basis to the Company’s Risk & Solvency Committee and Boards. Further information on risk management is provided in section 5.2.
The Company operates a system of internal controls. These internal controls contribute to meeting various objectives, including operational effectiveness, reliable financial reporting, compliance with laws and regulations and management of reputational and strategic risk.
The Internal Audit function guarantees its independence and objectivity through direct reporting lines to the MS Amlin AG Audit Committee and Supervisory Board. The Supervisory Board has delegated its responsibility for overseeing the internal audit activity to its Audit Committee. The Internal Audit function’s programme of work is based on an annual audit plan compiled by the Chief Internal Auditor and presented to the MS Amlin AG Audit Committee for approval annually.
The Company has a dedicated Compliance function as part of its management structure. The role of the Compliance function is to provide assurance to the Boards that the Company complies with all regulatory requirements, associated laws, and MS Amlin AG internal policies. The Compliance function reports to the MS Amlin AG Risk & Solvency Committee regarding progress against the Compliance annual plan, regulatory returns, integrity risks, and monitoring activities.
MS Amlin AG has a local actuarial team supported by the actuarial function in MS Amlin Business Services, a service company providing outsourced services to all MS Amlin companies, where required. The core actuarial function focuses on providing capital modelling and reserving services. The pricing actuaries report
© MS Amlin AG 6
directly to the underwriting function and there is close co-operation between the pricing actuaries and the core team in the areas of business planning, reserving and setting of technical pricing standards.
Valuation for Solvency purposes
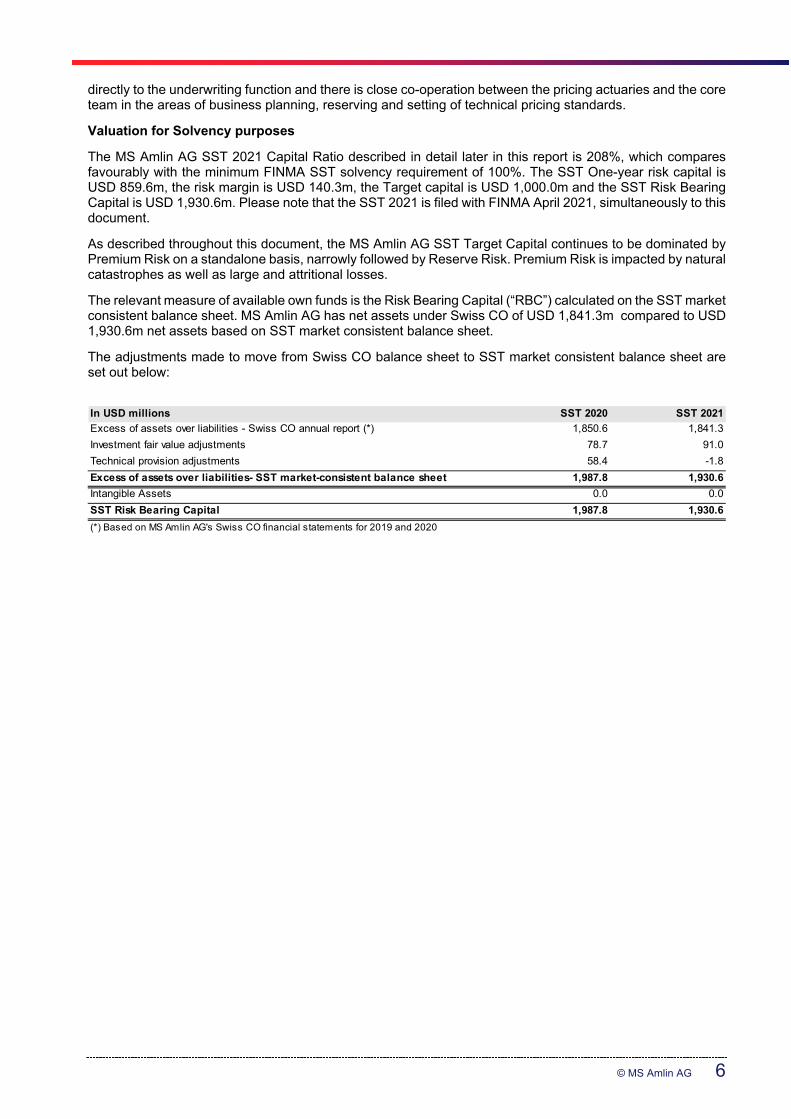
The MS Amlin AG SST 2021 Capital Ratio described in detail later in this report is 208%, which compares favourably with the minimum FINMA SST solvency requirement of 100%. The SST One-year risk capital is USD 859.6m, the risk margin is USD 140.3m, the Target capital is USD 1,000.0m and the SST Risk Bearing Capital is USD 1,930.6m. Please note that the SST 2021 is filed with FINMA April 2021, simultaneously to this document.
As described throughout this document, the MS Amlin AG SST Target Capital continues to be dominated by Premium Risk on a standalone basis, narrowly followed by Reserve Risk. Premium Risk is impacted by natural catastrophes as well as large and attritional losses.
The relevant measure of available own funds is the Risk Bearing Capital (“RBC”) calculated on the SST market consistent balance sheet. MS Amlin AG has net assets under Swiss CO of USD 1,841.3m compared to USD 1,930.6m net assets based on SST market consistent balance sheet.
The adjustments made to move from Swiss CO balance sheet to SST market consistent balance sheet are set out below:
In USD millions SST 2020 SST 2021
Excess of assets over liabilities - Swiss CO annual report (*) 1,850.6 1,841.3
Investment fair value adjustments 78.7 91.0
Technical provision adjustments 58.4 -1.8
Excess of assets over liabilities- SST market-consistent balance sheet 1,987.8 1,930.6
Intangible Assets 0.0 0.0
SST Risk Bearing Capital 1,987.8 1,930.6
(*) Based on MS Amlin AG's Swiss CO financial statements for 2019 and 2020
© MS Amlin AG 7
3. Business Activities
3.1 Information about the insurance company’s business activities and Group Status
MS Amlin AG is a Swiss-domiciled, global specialty reinsurer operating in local and international reinsurance markets and underwriting many classes of business through one capitalised underwriting platform.
MS Amlin AG is a wholly owned subsidiary of Mitsui Sumitomo Insurance Company Limited (“MSI”), which in turn is a wholly owned subsidiary of MS&AD Insurance Group Holdings, Inc. (“MS&AD”). Both MSI and MS&AD are registered in Japan. The Company was previously a wholly owned subsidiary of MS Amlin plc, however its share ownership in the Company transferred to MSI on 1 January 2020.
The Company was originally established in 2005 as a separately capitalised reinsurance vehicle in 2005, Amlin Bermuda Limited, domiciled in Bermuda. In 2010, the corporate seat of this company was redomiciled to Switzerland and became Amlin AG. The existing Bermuda operations continued as a separate underwriting centre but as a branch of Amlin AG. Amlin AG was renamed as MS Amlin AG during 2016.
It merged with MS Frontier Reinsurance Limited (“MSF”), the principal reinsurance vehicle of MSI, on 31 December 2016. MSF was established in 1997 and primarily wrote property catastrophe business in North America, Europe and Australasia.
MS Amlin AG now consists of four platforms: MS Amlin Zurich in Switzerland, where the company headquarters are located; its two branches, MS Amlin Bermuda based in Hamilton, Bermuda and MS Amlin Labuan based in Malaysia; and finally the business written through binding authority with MS Amlin Reinsurance Managers, Inc. The Labuan branch was put into run-off in April 2018. MS Amlin AG also writes intragroup reinsurance treaties with other MS Amlin entities which are direct subsidiaries of MSI. Further information on the business written by each area of MS Amlin AG is included in Section 2.
3.2 Strategy, objectives and key business segments
The Company has a vision to be a ‘Respected Global Reinsurance Partner’. This is anchored in our values of Client Understanding, Respecting Each Other, Probity, ‘Kaizen’, One MS Amlin Team and Courage to Challenge. Future prospects and vision
Our strategy as a leading global reinsurer remains consistent following the change in direct ownership to MSI on1 January 2020 and the Company benefits from the support of one of the world’s largest non-life insurance groups. Following an organisational restructure in 2020 resulting in greater resource alignment to the business, MS Amlin AG is well positioned to build for the future.
The Company’s strategy is driven by a client-focused approach together with a well-balanced and diverse underwriting portfolio. This is enabled by further developing a high performing platform alongside our ability to attract and retain world class talent.
The focus for 2021 is on those levers and enablers which support execution of the short and longer term goals. This includes further development of the Company’s portfolio management capabilities to enhance responsiveness and flexibility to the cycle and growth opportunities across the business particularly given the improving market environment.
The Company is expected to further grow and diversify the portfolio over the longer term with investment being made into supporting infrastructure to allow for scalability and increased efficiencies whilst ensuring that we are accessible to our clients via the most appropriate distribution channels.
The strategy is intended to see the Company being well diversified in terms of products and geographies and therefore able to support clients more broadly, to be financially sound with the ability to offer substantial line sizes and capacity and to develop long-term relationships with clients and brokers.

© MS Amlin AG 8
3.3 External auditors
The external auditors are KPMG AG, Switzerland. The company address is:
KPMG AG Badenerstrasse 170 CH-8004 Zurich Switzerland
3.4 Significant unusual events During 2020, the influence of COVID-19 was assessed as impacting all categories of risk and had a fundamental impact on MS AAG’s operations. The most material impacts we have seen from COVID-19 are the losses to our insurance portfolios. COVID-19 losses were accounted for in reserves in Q2 and have remained fairly stable through the end of 2020.
As we proceed through 2021 and with risk of subsequent waves of the virus and additional lockdowns, we continue to monitor this risk closely but believe the risk is well mitigated due to improvements in contract terms and business continuity plans which were well tested and evidenced as operating effectively.

© MS Amlin AG 9
4. Performance In the following sections we have summarised information about MS Amlin AG’s income statement, including underwriting and financial performance. Please note that the income statement as disclosed in Appendix 1, and in the following sections, is based on MS Amlin AG’s Swiss Code of Obligation (Swiss CO) annual report for the year ended 31 December 2020.
MS Amlin AG’s Swiss CO investment valuation basis represents fair value for the majority of investments. For specific investments types, e.g. property funds and government bonds Swiss CO valuation represents the lowest of cost or market value/amortized cost value. The valuation adjustments mainly reflect unrealized gains for these investments. This is in line with the revision of the Swiss CO Accounting Standards with an effective date of 01.01.2015 allowing the flexibility to record financial assets at Market Value. Acquisition costs are deferred in Swiss CO financials and an asset is booked in the balance sheet. The Company applied IFRS 16 Leases from 1 January 2019. In Swiss Co Annual Report, the cumulative effect of initial application (modified retrospective approach) is included in the current period profit and loss.
The company decided to change the Swiss CO presentation currency for the 2020 Financial Statements from Swiss Francs (CHF) to US dollars (USD). USD contributes a material part of the company's business. The functional currencies of the underlying branches remains consistent and the foreign exchange translation methodology remains unchanged. For further details please refer to Appendix 3.
Please note that the Swiss CO Annual Report is re-mapped to the FCR format, which follows the Aufsichtsverordnung (AVO)-FINMA. The format used for the income statement is the FCR Standard Template translated into English and is disclosed in Appendix 1. The values in this section are shown both in USD and CHF following the same presentation as in MS Amlin AG Swiss CO annual report (please see Appendix 3).
4.1 Underwriting performance Gross written premium was maintained at similar levels to 2019 however with increased diversification of the portfolio. Reductions in catastrophe and aggregate exposures were offset by growth in engineering and financial lines as well as ARMI New Jersey and Miami business. Loss activity was most notably impacted by COVID-19 losses which have been estimated at in excess of USD 100m for the Company. In addition, claims have been incurred through the catastrophe portfolio, including from Hurricane Laura and the Mid-West Derecho, smaller natural perils such as Hurricanes Delta and Zeta and also man made losses such as the Beirut Explosion. Reserves for prior years were strengthened in relation to casualty, engineering and motor classes. Administrative expenses were broadly in line with the prior year however savings were made predominantly as a result of reduced travel and entertainment expenses due to COVID-19.

© MS Amlin AG 10
The tables below show the main components of MS Amlin AG’s technical result. For further details please refer to Appendix 1 which includes the income statement split by relevant class of business.
In USD millions 2020Gross premium written 1,604.5Net premiums written 1,419.9Net premiums earned 1,392.7Other insurance income 0.7Total technical income 1,393.4 Net claims and claim expenses incurred (1,084.2)Net acquisition costs and administrative expenses (394.6)Total technical result (85.4)Claims ratio 78%Expense ratio 28%Combined ratio 106%
In CHF millions 2019 2020Gross premium written 1,572.4 1,419.8Net premiums written 1,451.9 1,256.5Net premiums earned 1,251.1 1,232.4Other insurance income 0.6 0.6Total technical income 1,251.7 1,233.0 Net claims and claim expenses incurred (875.6) (959.4)Net acquisition costs and administrative expenses (334.1) (349.2)Total technical result 42.0 (75.6)Claims ratio 70% 78%Expense ratio 27% 28%Combined ratio 97% 106%

© MS Amlin AG 11
4.2 Financial Performance Net income from investments was USD 82.7m. This was a positive outcome given the volatility in the investment markets which showed negative returns during the first quarter, rebounding most positively in zero duration bonds and equities. Property investments also showed positive returns. The table below shows the main components of MS Amlin AG’s net investment return by asset class. For further details, please refer to Appendix 1. Please note that the numbers shown in the table reflect the investment income by asset category, as presented in the MS Amlin AG Swiss CO annual report (please see Appendix 3). In USD millions 2020IncomeInvestment income: - Fixed-interest securities 10.4 - Shares 2.7 - Other investments 30.4
43.4 Net unrealized gains: - Fixed-interest securities 1.5 - Shares 0.0 - Other investments 110.9
112.3 Net realized gain: - Fixed-interest securities 1.4 - Shares 0.0 - Other investments 107.2
108.6 Total net income 264.4
ExpensesInvestment expense: - Fixed-interest securities (0.8) - Shares 0.0 - Other investments (3.2)
(4.1)Net unrealized losses: - Fixed-interest securities (2.2) - Shares 0.0 - Other investments (39.1)
(41.2)Net realized loss: - Fixed-interest securities (1.9) - Shares 0.0 - Other investments (134.4)
(136.3)
Total net expense (181.6)
Net investment return 82.7

© MS Amlin AG 12
© MS Amlin AG 13
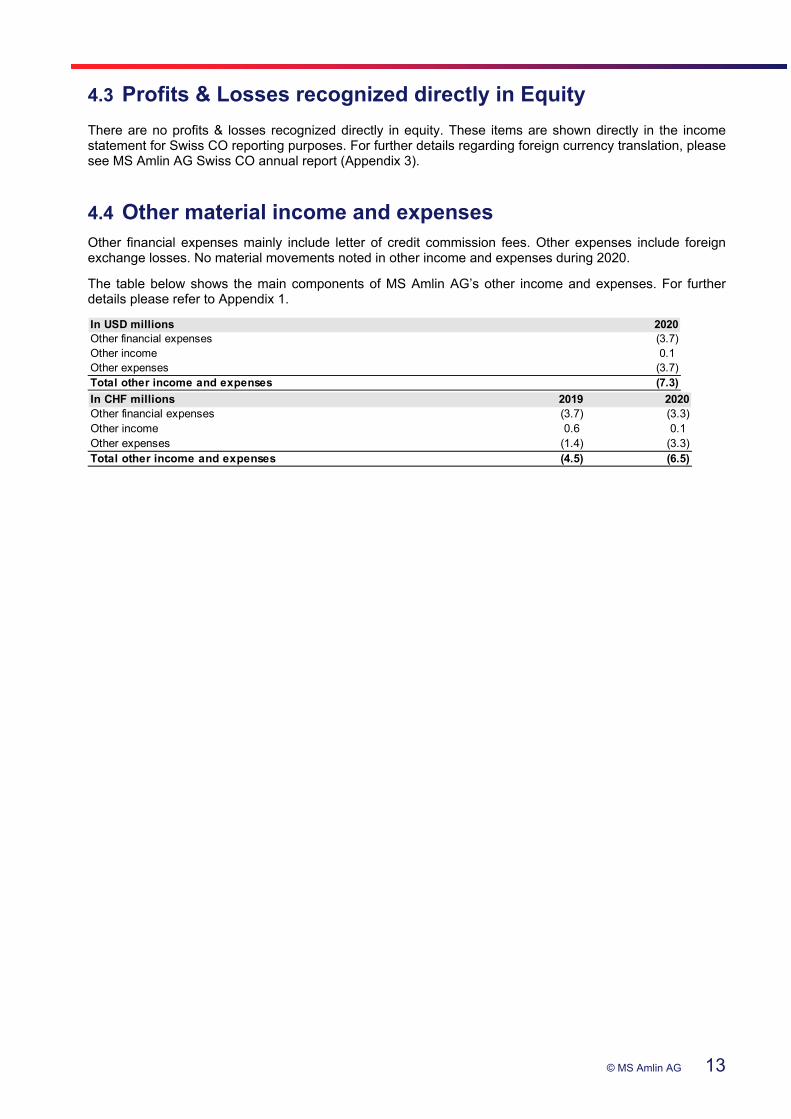
4.3 Profits & Losses recognized directly in Equity There are no profits & losses recognized directly in equity. These items are shown directly in the income statement for Swiss CO reporting purposes. For further details regarding foreign currency translation, please see MS Amlin AG Swiss CO annual report (Appendix 3).
4.4 Other material income and expenses Other financial expenses mainly include letter of credit commission fees. Other expenses include foreign exchange losses. No material movements noted in other income and expenses during 2020.
The table below shows the main components of MS Amlin AG’s other income and expenses. For further details please refer to Appendix 1.
In USD millions 2020Other financial expenses (3.7)Other income 0.1Other expenses (3.7)Total other income and expenses (7.3)
In CHF millions 2019 2020Other financial expenses (3.7) (3.3)Other income 0.6 0.1Other expenses (1.4) (3.3)Total other income and expenses (4.5) (6.5)

© MS Amlin AG 14
5. Corporate Governance and Risk Management
5.1 Overview of Corporate Governance
5.1.1 Corporate Governance Framework
MS Amlin AG’s governance framework is based on the underlying principles of accountability, transparency, integrity and a focus on the sustainable success of the Company over the long term.
The governance framework in MS Amlin AG ensures:
sufficient review and challenge of decision making processes;
the responsibilities and interests of all stakeholders are appropriately considered; and
appropriate reporting, of both frequency and content, to enable the Executive Board and Supervisory Board to exercise adequate oversight over the business activities.
5.1.2 System of Corporate Governance in MS Amlin AG
The Company operates a two tier board governance structure. The Supervisory Board is made up of Non-Executive directors who are not actively engaged in the management of the Company and of whom over one third are independent of the Company. The Executive Board is the Company’s managing body and consists of the Chief Executive Officer and other senior officers and managers of the Company. These appointments are at the discretion of the Supervisory Board. The Supervisory Board also appoints Board Committees for specific purposes from among its members. Currently these committees comprise:
the Risk & Solvency Committee;
the Audit Committee;
the Underwriting Committee; and
the Remuneration & Nomination Committee.
The Supervisory Board and Executive Board are responsible for the governance of MS Amlin AG. The responsibilities of these boards include setting strategic aims, providing the leadership and oversight to implement strategy, supervising the management of the business and reporting to the shareholder on their stewardship.
The following mechanisms are in place for MS Amlin AG:
matters reserved for the Supervisory Board’s decision ensure it has sufficient oversight and control over certain business decisions and activities;
roles and terms of reference of the committees of the Supervisory Board, namely the Risk & Solvency, Audit, Underwriting and Remuneration & Nomination Committees;
Board and Committee agendas, and related reporting, comprising of both standing quarterly requirements and items to be covered over the course of a year; and
a minimum frequency of Board and Committee meetings; usually monthly for the Executive Board and quarterly for the Supervisory Board and its committees.

© MS Amlin AG 15
5.1.3 Board membership
The Supervisory Board of Directors as at 31 December 2020 was composed of the following non-executive members:
Name Board Position
Martin Albers Chairman
Stefan Materne Director
Stephan Knipper Director
Martin Burke Director
Robin Adam Director
Tamaki Kawate Director
Shinichi Imayoshi Director
Masataka Kitagawa left the Supervisory Board in April 2020. Tamaki Kawate and Shinichi Imayoshi were appointed to the Supervisory Board in April 2020. Stephan Knipper was appointed to the Supervisory Board in September 2020. The Executive Board of Directors as at 31 December 2020 was composed of the following members:
Name Chief and Senior Executive Position
Chris Beazley Chief Executive Officer
Kate McDonald Chief Financial Officer
Catherine Farnworth Chief Risk Officer
Jerome Domenichini Chief Underwriting Officer, MS Amlin Zurich
Chris Hayward Chief Underwriting Officer, MS Amlin Bermuda
Gregoire Mauchamp Chief Operating Officer
Gregoire Mauchamp was appointed to the Executive Board as Chief Operating Officer in June 2020.
© MS Amlin AG 16
5.2 Overview of Risk Management
5.2.1 Risk Management Strategy
MS Amlin AG’s vision and core values provide the strategic focus for the risk management system to deliver “effective risk management which optimises return for the risks we take” with the objective to deliver long-term value. This is achieved by actively seeking and accepting risk while managing that risk within acceptable bounds.
5.2.2 Risk Management Framework
MS Amlin AG has developed a Risk Management Policy committed to establishing and maintaining a sustainable enterprise risk management process as an integral part of its business model supporting business planning, capital management and decision making in the business. The Policy is intended to provide transparency, and define ownership and responsibilities throughout the risk management process as well as create a risk aware culture across the organization. To supplement and fulfil the needs of the Policy, a Risk Management Framework has been developed and documented which provides:
A strong, risk based organisation, supported by an appropriate risk management system;
A robust governance framework supporting its organisational structure;
Clear roles and responsibilities and effective escalation processes;
Effective monitoring; and
Clear and effective communication and reporting lines.
MS Amlin AG’s Risk Management Framework consists of a suite of standards, governance processes and procedures that ensure a strong risk management function. It is built into the core operating model of the business and forms part of the overall approach to internal control. It provides the infrastructure within risk governance and also sets out the processes required to sustain risk management across the business.
5.2.3 Risk Management Methods and Processes
Risk Governance
The operation of effective risk management requires the active involvement of all employees and the responsibility for each risk has been clearly allocated within the Company.
MS Amlin AG operates risk management through a ‘three lines’ model.
First line – all employees are expected to be risk aware and exercise controls over their activities so that levels of risk are understood and managed appropriately;
Second line - MS Amlin AG’s Risk function is responsible for the design and coordination of the risk framework architecture, working together with the Compliance function for additional support;
Third line - MS Amlin’s Internal Audit function is independent and has direct reporting to the MS Amlin AG Audit Committee. The function has responsibility for the review of the effectiveness of controls.
The Boards and the Risk & Solvency Committee receive reports from the Risk function that escalate risk areas of concern.
As part of its risk management system MS Amlin AG conducts, at least annually, an Own Risk and Solvency Assessment (“ORSA”) taking into account its risk profile, business strategy and related capital requirements. The ORSA is fully embedded into the overall Risk Management Framework and is aligned to capital strategy and business planning related processes.
© MS Amlin AG 17
Risk Appetite and Tolerances
A key objective of the Risk Management Framework is to establish risk appetites for all key areas of risk identified. This appetite is implemented through a set of tolerances and limits which are approved by the Risk & Solvency Committee and the Supervisory Board. Management is accountable for managing levels of risk within the allocated tolerances. The status of profile versus tolerance is reported quarterly to the Risk & Solvency Committee with breaches escalated up to the Supervisory Board.
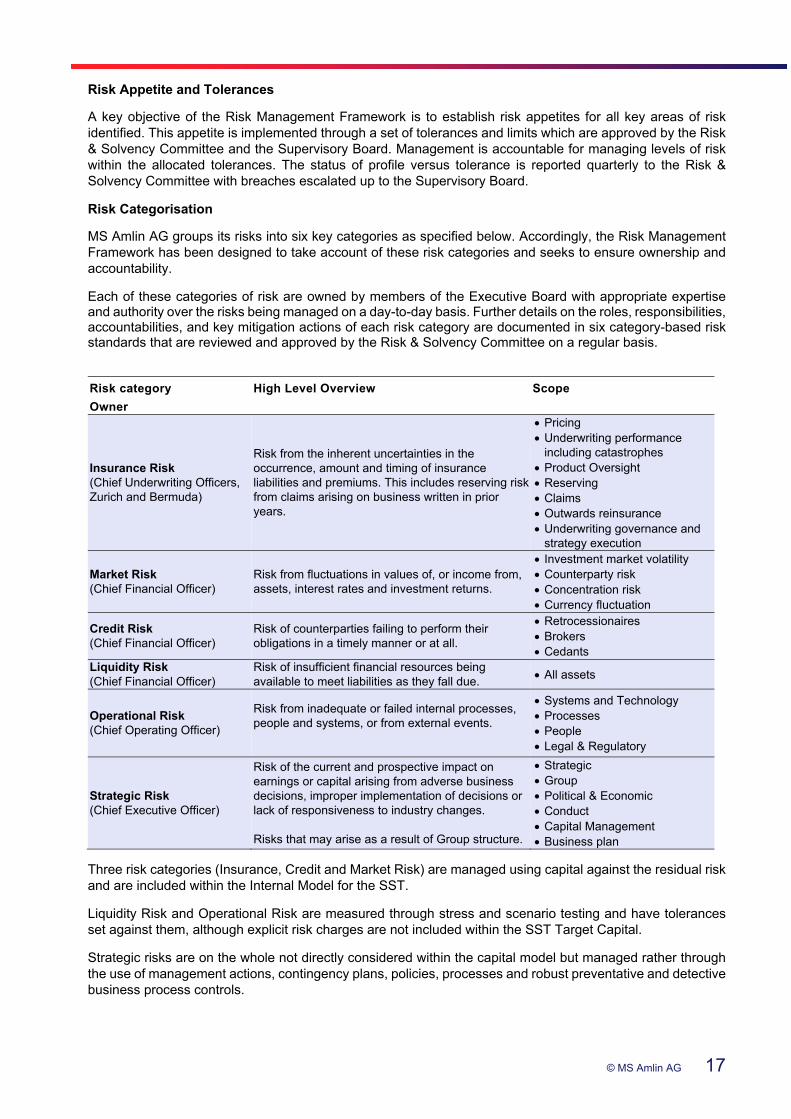
Risk Categorisation
MS Amlin AG groups its risks into six key categories as specified below. Accordingly, the Risk Management Framework has been designed to take account of these risk categories and seeks to ensure ownership and accountability.
Each of these categories of risk are owned by members of the Executive Board with appropriate expertise and authority over the risks being managed on a day-to-day basis. Further details on the roles, responsibilities, accountabilities, and key mitigation actions of each risk category are documented in six category-based risk standards that are reviewed and approved by the Risk & Solvency Committee on a regular basis.
Three risk categories (Insurance, Credit and Market Risk) are managed using capital against the residual risk and are included within the Internal Model for the SST.
Liquidity Risk and Operational Risk are measured through stress and scenario testing and have tolerances set against them, although explicit risk charges are not included within the SST Target Capital.
Strategic risks are on the whole not directly considered within the capital model but managed rather through the use of management actions, contingency plans, policies, processes and robust preventative and detective business process controls.
Risk category
Owner
High Level Overview Scope
Insurance Risk (Chief Underwriting Officers, Zurich and Bermuda)
Risk from the inherent uncertainties in the occurrence, amount and timing of insurance liabilities and premiums. This includes reserving risk from claims arising on business written in prior years.
Pricing Underwriting performance
including catastrophes Product Oversight Reserving Claims Outwards reinsurance Underwriting governance and
strategy execution
Market Risk (Chief Financial Officer)
Risk from fluctuations in values of, or income from, assets, interest rates and investment returns.
Investment market volatility Counterparty risk Concentration risk Currency fluctuation
Credit Risk (Chief Financial Officer)
Risk of counterparties failing to perform their obligations in a timely manner or at all.
Retrocessionaires Brokers Cedants
Liquidity Risk (Chief Financial Officer)
Risk of insufficient financial resources being available to meet liabilities as they fall due.
All assets
Operational Risk (Chief Operating Officer)
Risk from inadequate or failed internal processes, people and systems, or from external events.
Systems and Technology Processes People Legal & Regulatory
Strategic Risk (Chief Executive Officer)
Risk of the current and prospective impact on earnings or capital arising from adverse business decisions, improper implementation of decisions or lack of responsiveness to industry changes. Risks that may arise as a result of Group structure.
Strategic Group Political & Economic Conduct Capital Management Business plan

© MS Amlin AG 18
Linkage to Capital Management
MS Amlin AG has an Internal Model which has been built to reflect the risk variables which could impact the performance of the Company. The MS Amlin AG Supervisory Board has confirmed that the Internal Model is the appropriate method for the calculation of solvency capital under the requirements of the Swiss Solvency Test. The Internal Model has been approved by the supervisory regulator, FINMA, for use when calculating the SST for risk charges including Insurance Risk, Reinsurance Credit Risk and Dependencies. The Internal Model is a core component of the risk management system and is used for a range of business decisions including setting and assessing risk tolerances, business planning, strategic decision making and purchase of outwards reinsurance, and is a key input into the technical pricing framework.
Alignment to Business Strategy
MS Amlin AG’s risk management objectives seek to bring business strategy, capital management, and enterprise risk management together to achieve long-term sustainable outcomes for all stakeholders.
This approach allows the business to maximise its return on risk where there is opportunity to, subject to limitations over acceptable risk taking. This is done through the adoption of risk appetites and tolerances that link closely to the return objectives set by the Board.
5.2.4 Internal Control System implemented in the Company
MS AAG has an internal control framework in place to help manage, monitor and mitigate our inherent and residual risks, and to help meet the Japanese Financial Services Agency requirements and standards for Internal Control over Financial Reporting, commonly termed “J-SOX”. MS Amlin AG is in-scope for these requirements as a subsidiary of MSI.
The internal control framework and JSOX compliance programme are supported by the following:
A Risk & Control software platform that provides dashboards to all users;
A suite of documented key controls with an established self-certification process;
A control attestation quality assurance programme to ensure results are validated; and
Transparent and meaningful management and committee reporting.
Quarterly control effectiveness results are reported directly into the Risk & Solvency Committee and Audit Committee. Actions to remedy ineffective controls are agreed with management and are tracked and reported to these committees on a quarterly basis. This governance arrangement allows access to key stakeholders to ensure that, where necessary, appropriate oversight and remediation take place.
The control framework is subject to ongoing review and revision with a focus on refining key internal controls, following a detailed plan to challenge the appropriateness of the key risks, their drivers and the key controls that mitigate them. This approach frequently identifies improvements to the key control library. This programme of work involves all three lines of defence and addresses all of the Company’s risks, on an as-needed basis, with certain risk areas in greater focus on any particular year. In 2021, it is intended to focus on reviewing the Company’s underwriting, operational and strategic risks.
5.2.5 Compliance and Internal Audit Functions
The main objectives of MS Amlin AG’s combined assurance initiatives are to:
Deliver a joined up approach to risk identification, assessment, mitigation and reporting;
Increase efficiency and effectiveness by preventing gaps, overlaps and duplication in assurance activity; and
Promote risk management and its assurance as an integrated process across all business areas and locations.

© MS Amlin AG 19
Compliance function The Company has a dedicated Compliance function as part of its management structure, reporting to the CRO. The role of the Compliance function is to provide assurance to the Executive Board and Supervisory Board that the Company complies with all regulatory requirements, associated laws, and relevant internal policies. The Compliance function reports to the Risk & Solvency Committee regarding progress against the Compliance annual plan, regulatory returns, integrity risks and monitoring activities. Internal Audit function
MS Amlin Business Services’ Internal Audit function services MS Amlin AG through an agreed service level agreement and its independence and objectivity are guaranteed through direct reporting lines to the Audit Committee and Supervisory Board. The Supervisory Board has delegated its responsibility for overseeing the internal audit activity to its Audit Committee. The Internal Audit function’s programme of work is based on an annual audit plan compiled by the Chief Internal Auditor and presented to the Audit Committee for approval annually.
5.2.6 Changes in risk management during the period During 2020 there were no material changes to the Risk Management Framework, including the risk assessment and reporting processes that had been established and embedded in prior years. Improvements of the framework have occurred throughout the year, such as refinements of the tolerance schedule and a number of policies and standards that fall under the CRO’s ownership as well as changes made to the reporting processes.

© MS Amlin AG 20
6. Risk Profile MS Amlin AG is exposed to six main categories of risk: Insurance, Market, Credit, Liquidity, Operational and Strategic risk. Three risk categories (Insurance, Credit and Market Risk) are managed using capital against the residual risk and are included within the Internal Model. The associated risk charges are included within the risk sections below.
The MS Amlin AG Risk function works closely with business functions and senior management to identify, assess and monitor risk profiles throughout the year. This section summarises the key risk profile movements throughout the year, the current key risk concerns and outlines the mitigating actions being taken by management in response to these risks.
6.1 Quantitative & Qualitative Information about Risk Profile
6.1.1 Insurance Risk
MS Amlin AG separates Insurance Risk into the following two key sub-risks:
Premium Risk: Relates to the risk of inadequate pricing, inappropriate terms and conditions, and unexpected level and/or frequency of losses; and
Reserving Risk: The risk of inadequate reserving. Premium Risk Risk Definition and Appetite Premium Risk relates to unexpected losses on the active portfolio that can be caused by inadequate pricing, inappropriate terms and conditions, unexpected claims frequency, or catastrophe losses from large natural or non-elemental events such as earthquake, hurricane or terrorism threats. MS Amlin AG has a risk-seeking attitude to Premium Risk and accepts that there will be claims arising from all areas of its Insurance Risk profile. The appetite for risk is governed by the amount of business that meets our pricing requirements but also by the capacity determined by the available capital base and outwards reinsurance arrangements. MS Amlin AG aims to achieve a diversified balance of exposures across lines of business and territories.
Risk Concentration and Changes over the year
The scale of risk concentration is identified through several core methodologies:
Stochastic Modelling – MS Amlin AG utilises exposure data to feed its internal model that aggregates the risk concentration, taking account of inherent exposure and the benefit of the associated mitigation strategies. Modelling takes place on a single Occurrence Exceedance Probability basis as well as at an Aggregated Exceedance Probability basis.
Realistic Disaster Scenarios (“RDS”) - Specific event scenarios are run and monitored quarterly. The RDSs cover both modelled and non-modelled classes as well as natural and man-made perils, also taking account of single occurrence and multi occurrence events.
Line Guide Monitoring – Large loss concentration is identified through line size monitoring across classes.
Premium Risk concentration is derived from:
Natural perils such as windstorm or earthquake;
Large losses from man-made events such as terrorism, cyber or industrial accidents; and
Correlated Liability coverage, such as professional liability coverage for medical practice.
© MS Amlin AG 21
Within natural perils, the most material concentrations are made up of natural catastrophe exposures as follows:
US Windstorm - particularly North East, Gulf of Mexico, and Florida;
US Earthquake - particularly California; and
Concentrations to European, Australasian and Japanese perils.
As at 1 January 2021, MS Amlin AG quantified its Premium Risk as USD 581.6m on a stand-alone SST basis.
Premium risk reduced year on year, principally driven by a reduction in proportional casualty business and property business as well as refinement in the modelling of cyber risk.. Assessment, Monitoring & Mitigation Techniques
The business looks to mitigate exposure through the application of strategies, processes and controls. The key mitigation techniques are:
Business planning - Annual business plans are developed that allow for the best combination of return on capital, concentration risk and diversification within the portfolio;
Tolerance setting and monitoring - The setting of tolerances is closely linked to strategy and business planning. Stochastic Modelling is utilised to set and monitor exposure to catastrophe perils against tolerance for both single and annual aggregate losses using proprietary catastrophe model output and netted down for reinsurance in the Internal Model. Results are reported to the Risk and Solvency Committee on a quarterly basis;
Technical pricing - Takes account of hazards so that premiums are adequate and exposures are contained within tolerances;
Outwards reinsurance - The main instrument for risk mitigation of Insurance Risk is the use of outwards reinsurance. Reinsurance treaties are purchased for MS Amlin’s global reinsurance business which includes MS Amlin AG and MS Amlin Underwriting Ltd; and
Policies, procedures and standards - Underwriting policies and standards ensure consistency and control across underwriting activities.
Reserving Risk Risk Definition and Appetite Reserving Risk relates to the possible inadequacy of claims provisions. Specifically, it relates to the uncertainty around whether reserves are adequately accounted for, taking account of fluctuations in claim settlements. MS Amlin AG adopts a neutral approach to Reserving Risk (accepting risk with caution as a by-product of pursuing desired business strategy), which is an unavoidable consequence of underwriting a portfolio of business where claims may develop after the policy period has elapsed. Our appetite is governed by a policy that ensures that reserves are carried above the actuarial best estimate of future outcomes. Classes with a higher level of uncertainty of potential development will naturally carry a higher level of reserve provision.
Risk Concentration and Changes over the year
Reserving Risk concentrations are the accumulation of assumed claims and the uncertainty associated with the ultimate size of the claims given the extended duration it can take for some claims to mature. Liability classes are considered as the primary drivers of reserve risk.
MS Amlin AG operates an actuarial led reserving process to estimate the reserves on a Best Estimate basis. Reserving Risk exposures and concentrations are identified through the use of the Internal Model. Volatility in forecast reserve requirements are monitored on a quarterly basis.
© MS Amlin AG 22
MS Amlin AG’s Internal Model produces a full distribution of possible reserving outcomes with the intention of capturing the uncertainty in the reserves. Expert judgement is applied during parameterisation to ensure that the final results from the Internal Model appropriately reflect MS Amlin AG’s risk profile.
As at 1 January 2021, MS Amlin AG quantified its Reserving Risk as USD 545.5m on a stand-alone SST basis.
Reserve Risk has Increased over the year, principally driven by the Zurich office, for which Reserves have grown most considerably, with increases in net reserves consistent across the majority of classes. The main drivers are the gradual increase in reserves resulting from growth in engineering and proportional liability business in recent years, reserve increases in relation to COVID-19, as well as reserve strengthening on proportional motor, engineering and catastrophe aggregate business. The Bermuda office also saw consistent increases in net reserves across the majority of classes, driven by growth in casualty and financial lines classes over recent years and the recent deteriorations due to COVID-19, and offset by a reduction in the risk related to unearned reserves due to a reduction in high volatility catastrophe exposed business and reduced volatility in casualty and cyber due to model recalibration. Reserves also increased moderately due to the addition of new business to MS Amlin AG from the New Jersey and Miami offices.
Assessment, Monitoring & Mitigation Techniques
The key mitigation strategies, processes and controls are as follows:
Actuarial reserving process - MS Amlin AG operates a consistent, actuarially driven process each quarter to assess the appropriateness of reserves held, taking account of the characteristics and risks of each class of business. The best estimates are subject to challenge and review by management;
Reinsurance programme - responds to large loss developments from prior years.
Tolerance setting and monitoring - requires a minimum probability of carried reserves being in excess of liabilities. This is tracked as a key actuarial metric that is monitored quarterly to assess that appropriate levels of reserves are carried; and
Claims Policy and process - consistent claims processes and accurate case reserve setting aim to ensure that adequate provision is established for advised claims.
6.1.2 Market Risk
Risk Definition and Appetite
MS Amlin AG seeks to optimise its investment income whilst focusing on ensuring it maintains sufficient capital to meet solvency requirements and maintain sufficient liquid funds to meet liabilities when they fall due. Exposure to Market Risk is therefore limited to the extent that investment strategies are balanced by these primary objectives. MS Amlin AG considers the following risks as the key drivers of market risk:
Investment Market Volatility: This is the risk of loss resulting from volatility of market assets and financial instrument valuations, either directly or indirectly. MS Amlin AG has a risk-seeking attitude to Market Volatility Risk, constrained by a desire to limit the potential downside risk to the value of carried assets to within a maximum Value at Risk tolerance.
Investment Counterparty Credit Risk: The risk of loss resulting from fluctuations in the credit standing of issuers of securities, counterparties and any debtors to which MS Amlin AG is exposed. MS Amlin AG has a risk-seeking appetite to maintain Investment Counterparty Credit Risk relatively consistent with current exposures but limits investment counterparty exposure through concentration limits
Currency fluctuation: This relates to the impact on the value of the balance sheet or on earnings arising from the movement in the value of USD against key non-functional currencies. MS Amlin AG has a risk-neutral attitude towards Currency Risk, which is an unavoidable consequence of holding balance sheet assets, premiums and liabilities in currencies other than USD. This risk is managed by matching asset and liability currencies where possible.

© MS Amlin AG 23
Risk Concentration and Changes over the year
Concentration in Market Risk can result from holding disproportionate levels of assets in particular financial securities or asset classes, foreign currencies, banks or fund managers or political domiciles. MS Amlin AG recognises its exposure to all of these and has established mitigation strategies against such concentration exposure as described in the following sub sections.
As at 1 January 2021, MS Amlin AG quantified its Market Risk as USD 238.7m on a stand-alone SST basis.
There has been an increase in Market Risk over the last year, driven by an increase in the overall investable asset portfolio, with most significant increases in exposures from Government and corporate bonds, with partial investment in foreign currencies. This increases the mismatch position of assets versus liabilities by currency and hence leads to a higher foreign exchange rate risk. The equity risk also increased as there was a reduction in hedging of equity exposure using equity futures.
Assessment, Monitoring & Mitigation Techniques
The key mitigation strategies, processes and controls are as follows:
Investment policy and strategic asset allocation - aims to maximise long-term investment returns in relation to an agreed risk budget.
Asset Duration Management - Interest Rate Risk is managed relative to liabilities through the strategic asset allocation.
Tactical asset allocation - responds to expectations for short-term market prospects or volatility.
A diversified portfolio - limits exposure to any one security or asset class.
Tolerance, limit setting and performance monitoring - Stochastic Value at Risk Monitoring is utilised by the investment team through the modelling and monitoring of investment risk against agreed tolerance.
Sub-advisor monitoring - sub-advisors are appointed to carry out stock selection within their specialist asset class. Each sub-advisor has discretion to manage the funds within their Investment Guidelines. Performance and compliance with mandates are monitored by the investment team.
Hedging - MS Amlin Investment Management actively manages Interest Rate Risk exposure and the level of equity exposure.
6.1.3 Credit Risk MS Amlin AG separates Credit Risk into the following key sub-risks:
Reinsurance Counterparty Risk: The risk of loss if a reinsurance counterparty fails to fulfil its underwritten obligations; and
Broker Credit Risk: The risk of loss if an insurance intermediary fails to follow MS Amlin AG's settlement instructions.
Reinsurance Counterparty Risk
Risk Definition and Appetite Reinsurance purchase exposes the business to losses on recoveries, from either an inability or unwillingness to pay on the part of reinsurers. There is the risk of loss if a reinsurance counterparty fails to fulfil its underwritten obligations in full or fails to perform them in a timely fashion.

© MS Amlin AG 24
MS Amlin AG has a risk-seeking appetite with a desire to maintain Reinsurance Counterparty Credit Risk relatively consistent with current exposures, which emanates from use of reinsurance to protect the company against severe catastrophic events and other scenarios.
Risk Concentration and Changes over the year
Concentration risk is mitigated by controlling exposure to each reinsurer through the reinsurer accreditation process and application of exposure limits for each reinsurer, based on MS Amlin’s internal credit rating process. As at 1 January 2021 MS Amlin AG quantified its Credit Risk (Reinsurance and Broker Credit Risk combined) as USD 75.0m on a stand-alone SST basis. There has been a slight decrease in Credit Risk over the last year, principally driven by changes in the outwards reinsurance cover purchased including lower orders, changes in the mix of reinsurers and credit ratings improvements..
Assessment, Monitoring & Mitigation Techniques
The key mitigation strategies, processes and controls are as follows:
Selection management - The reinsurance security team conducts accreditation selection and rating of all reinsurers.
Reinsurer review process - Takes account of publicly available information such as rating agency input and financial statements.
Aggregate Exposure planning and monitoring - There are limits of exposure to be placed with any one reinsurer.
Collateralisation – Reinsurance credit risk is reduced through the purchase of some collateralised reinsurance.
Claims management - MS Amlin AG’s Claims Management procedures ensure that every claim is reviewed to identify any potential recoveries and assess whether these can be pursued effectively.
Broker Credit Risk
Risk Definition and Appetite MS Amlin AG conducts business through brokers and directly with cedants meaning it is exposed to credit risk in respect of the following balances: inwards gross premium, outwards claims payments, outwards reinsurance premiums and retro recoverable. There is the risk of loss if an insurance intermediary fails to follow MS Amlin AG's settlement instructions in a timely fashion. MS Amlin AG has a risk neutral approach to Broker Credit Risk (the Company does not seek this risk exposure, but recognises that it has unavoidable exposure to brokers, which consequently comes with a risk of financial loss due to failure of intermediaries to meet their credit obligations in a timely fashion).
Risk Concentration and Changes over the year
Brokers need to both collect premiums and settle claims as part of their service. Risk concentration can occur as a result of accumulation of MS Amlin AG owned assets within insurance intermediaries, such as brokers, who may default or fail to settle transactions when instructed. MS Amlin AG sets limits according to broker financial strength to control exposure to each counterparty.
The 1 January 2021 Combined Reinsurance and Broker Credit Risk, along with movements throughout the year, are discussed above.
Assessment, Monitoring & Mitigation Techniques
The key mitigation strategies, processes and controls are as follows:
On-boarding - Local teams are responsible for broker accreditation and on-boarding.
© MS Amlin AG 25
Broker review process - Takes account of the latest available full year financials, comparison with MS Amlin recommended standards, recent developments, and background information.
Policies, procedures and standards - Policies and standards are in place to explain the process of on-boarding, broker review, debt control, and claims management.
Tolerance, limit setting and performance monitoring - The business seeks to manage and monitor exposures to brokers by a number of risk tolerances across the risk category.
Debt control - Broker debt credit control is carried out to limit outstanding balances owed by counterparties.
6.1.4 Liquidity Risk
Risk Definition and Appetite
The strength and liquidity of the balance sheet is fundamental to our proposition as a reinsurer of choice, providing us with the ability to respond quickly to claims, particularly relevant in the event of a large catastrophic loss such as a hurricane or earthquake. Consequently, MS Amlin AG has a risk-averse attitude towards Liquidity Risk. Liquidity risk arises from insufficient financial resources being available to meet liabilities as they fall due.
MS Amlin AG’s liquidity risk is tested on a monthly basis. Assets are stressed by applying Basel III regulatory haircuts to total assets under management to determine our high quality liquid assets which are then compared to the SST Target Capital. There is a tolerance metric where this liquidity ratio must remain above 100%.
Risk Concentration and Changes over the year
Throughout the year, the Liquidity Ratio has remained comfortably above the minimum ratio of 100% against solvency capital requirements.
Catastrophe events over the last few years have led to large losses for MS Amlin AG, testing our Liquidity risk mitigation measures in earnest. This has given us confidence that MS Amlin AG has sufficient liquid assets and is expected to be able to meet its obligations in stressed circumstances.
Assessment, Monitoring & Mitigation Techniques
The key mitigation strategies, processes and controls are as follows:
MS Amlin AG aims to ensure its investment portfolios are sufficiently liquid to allow its liabilities to be settled. In the event of a large catastrophic loss, these liquidity requirements are reviewed. Liquidity management is closely aligned to investment management. Returns are balanced against the need for liquidity and assets backing reserves are invested to meet expected claims payment profile.
In terms of Liquidity management, the Bond funds, which would often be the source of money used to pay claims (alongside cash), are highly liquid and can generally be liquidated within two days.
Bank facilities are in place to mitigate liquidity constraints.
A Liquidity Policy and Liquidity Risk Standard are in place to formally articulate the liquidity risk management strategy. This policy articulates MS Amlin AG’s liquidity strategy to ensure there are sufficient liquid assets and/or available sources of financing to support the payment of claims and operating cash flows as they fall due while supporting the goal of maximising investment returns. The Liquidity Policy also articulates a liquidity contingency plan and the actions required by the finance and investment management functions following a large or catastrophic loss event or material investment markets liquidity event.

© MS Amlin AG 26
6.1.5 Operational Risk
Risk Definition and Appetite
MS Amlin AG operates a diverse business across several offices and jurisdictions and is expected to comply with legal, regulatory and best-practice standards. Operational Risk spans many risks including the potential failure of critical business processes, people or systems resulting in an interruption to normal operations. The failure of management to address performance issues may impact the level of, or potential for, Operational Risk. Natural or man-made disasters could impact MS Amlin AG’s operating platforms in one or more locations. Cyber Risk is also an increasing source of risk.
MS Amlin AG has a risk averse attitude to most areas of Operational Risk and seeks to avoid operational failures which may hinder the operational capability of MS Amlin AG, result in financial loss, or lead to a regulatory sanction for inadequate compliance.
Risk Concentration and Changes over the year
Operational risks are identified and assessed using a deterministic risk assessment process that requires engagement with the business periodically to assess current risks and issues, project risks, emerging risks and control adequacy. Deep dive assessments and other such assurance activities also seek to evaluate risks from a thematic perspective.
There were no material changes to the Operational Risk framework in the last year.
Assessment, Monitoring & Mitigation Techniques
The key mitigation strategies, processes and controls are as follows:
Risk Management Framework - The implementation of a framework for the identification, assessment and control of operational risks ensures that these risks are understood and managed by the business.
Policies, Procedures & Standards – The Operational Risk Standard ensures all significant operational risks are identified, assessed, managed, monitored and reported to relevant stakeholders.
Policy Framework - A policy framework is in place to apply control over people matters, key business processes, business continuity, data quality, information security, outsourcing, procurement and other key risk areas.
Internal Control Framework – A framework measures the operation of key controls in day-to-day operations and evaluates the effectiveness of managing Operational Risk.
Risk Events & Near Miss Capture – The Company monitors risk events in order to raise awareness, identify areas for improvement and drive remedial response.
Assurance Monitoring - An established assurance plan including Compliance, Risk and Internal Audit plan, seeks to identify both general and regulatory vulnerabilities.
Scenario Analyses - are used to determine the level of capital required to support the level of operational risk charge within the business.
Insurance - is acquired to recover from financial losses where appropriate.
6.1.6 Other Material Risks
Strategic Risk Risk Definition and Appetite
Strategic Risks are defined as risks to current and prospective earnings or capital arising from adverse business decisions, improper implementation of decisions or lack of responsiveness to industry changes. This includes risks associated with the appropriateness of business strategy in the face of the current and future commercial, political, legislative, and economic environment.
© MS Amlin AG 27
MS Amlin AG has a risk-seeking attitude to maintain consistent levels of Strategic Risk as it actively pursues ways of developing the business. The Company also faces a number of external factors which may impact demand for or supply of products. These risks are analysed and actions agreed to adapt the strategic approach to cater for them.
Risk Concentration and Changes over the year
MS Amlin AG sees Strategic Risk concentration derived from:
Strategy Setting - The development of strategic objectives is carried out by MS Amlin AG senior executives and these are then approved by MS Amlin AG's Supervisory Board. There is a risk around the appropriateness of business strategy in the face of the current and future commercial, political, legislative, and economic environment.
Group Risk - MS Amlin AG is a subsidiary of MSI and also the wider MS&AD group. There is a risk that potential issues in other parts of the MS&AD group of companies may impact the ability of MS Amlin AG to execute its strategy.
Political and Economic Factors - MS Amlin AG is exposed to political uncertainty and resulting instability that could affect the delivery of MS Amlin AG's strategy or the provision of its products and services. This could crystallise as a result of political decisions, events or conditions.
Assessment, Monitoring & Mitigation Techniques
The key mitigation and monitoring consist of:
Strategy Alignment - MS Amlin AG’s strategic objectives and decisions take account of the expectations of the ultimate parent company, MS&AD. There is communication of MS Amlin AG’s business plans and strategic requirements to MSI, including capital needs, regulatory requirements and risks.
Strategic Risk Assessment – Strategic initiatives are reviewed from a second line perspective to ensure alignment with our vision and impacts on the Company risk profile as well as risks to achieving the strategy.
Culture - MS Amlin AG's culture and strategic objectives take account of client needs and expectations.
Strategy Commitment - There is resource commitment to support the duration of the executed strategy. Strategies have flexible re-directive decision points in their plans.
Market Monitoring - Horizon scanning often takes place, decisions take account of current market environment and are made in a structured, governed manner by subject matter experts.
Capital Management - Aggregate risk exposure is continually monitored against available capital, and responses would be made if solvency ratios began to deteriorate. Contingency and resilience plans are developed to manage adverse capital events.
Governed Decision Making - Capital requirements are fully assessed taking account of all requirements and risk acceptance is undertaken within a controlled manner.
6.2 Material risk exposures
6.2.1 Exposure to Material Off Balance Sheet positions MS Amlin AG does not have any exposure to material off balance sheet positions.
© MS Amlin AG 28
7. Valuation
7.1 Market Consistent Asset Valuation for solvency purposes
7.1.1 Value of assets broken down by asset class (as per breakdown in quantitative templates)
The market-consistent balance sheet as disclosed in the FCR Standard Template (Appendix 1) is based on MS Amlin AG’s SST balance sheet. For assets and liabilities in the SST balance sheet, we applied the same account mapping structure as in Swiss CO. The SST balance sheet is then re-mapped to the FCR format with current year figures. Please note that SST 2021 is filed with FINMA on 30 April 2021 simultaneously to this document. The market consistent value of investments of MS Amlin AG amounts to USD 3,790.2m as of 31 December 2020. Investments mainly consist of other investments (USD 3,334.6m), fixed-income securities (USD 446.7m) and equities (USD8.3m). In line with FCR Standard Template (Appendix 1), receivables from derivative financial instruments (USD 0.2m) are included as part of overall investments. The market consistent value of other assets of MS Amlin AG amounts to USD 2,114.2m as of 31 December 2020. They mainly consist of receivables from insurance business, cash and cash equivalents and deferred acquisition costs.
7.1.2 Description of basis and methods used for valuation The starting point for the FCR balance sheet is the SST which captures the market consistent value of assets. SST figures are re-mapped to the FCR Standard Template (Appendix 1). The market consistent SST valuation method on investments is based on IFRS fair values. The financial data used in preparing the FCR balance sheet originates from the MS Amlin financial reporting system and is as of 31 December 2020.
7.1.3 Discrepancies between asset valuation for solvency and annual report
The valuation discrepancy between MS Amlin AG’s FCR (i.e. SST) and annual report (i.e. Swiss CO) is in regards to investment fair value adjustments. MS Amlin AG’s Swiss CO investment valuation basis represents fair value for the majority of investments. A small portion of the portfolio continues to be recognized at the “lower of cost or market value”, being property funds and government bonds. For FCR reporting purposes these investment types are adjusted to fair values. These adjustments are based on market values and reconcile to the IFRS. The valuation adjustments are calculated on a security by security basis.

© MS Amlin AG 29
7.2 Market Consistent Valuation of Provisions for Insurance Obligations for Solvency
7.2.1 Gross & Net Value of the provisions for insurance obligations For FCR reporting purposes the best estimate of provisions for insurance liabilities (gross) amount to USD 3,694.0m which includes loss reserves (USD 2,557.2m) and unearned premium reserves (UPR) (USD 1,136.8m) as of 31 December 2020. The reinsurers' share of best estimate of provisions for insurance liabilities amount to USD 160.2m consisting of loss reserves (USD 134.7m) and UPR (USD 25.5m).
7.2.2 Description of basis, methods and key assumptions used in the valuation for insurance obligations
MS Amlin AG’s (gross and net) reserves are discounted in order to reflect discounted best estimate values required in a market consistent view. The discounting adjustment is calculated using various actuarial assumptions including those on payment patterns, and also using the FINMA yield curves.
7.2.3 Discrepancies between valuation for solvency and annual report for insurance obligations
We summarized valuation discrepancies between MS Amlin AG’s FCR (i.e. SST) and annual report (i.e. Swiss CO) as follows:
Reserve Discounting Adjustment: Under Swiss CO loss reserves are on an undiscounted basis, whereas market consistent view is on a discounted best estimate basis. We therefore apply a discounting adjustment on loss reserves (including inward business as well as ceded reserves) based on actuarial assumptions. The net discounting effect is USD 15.3m which represents an increase to loss reserves due to negative interest rates.
Retro recoveries: As part of market consistent view a ceded reserve (USD 13.5m) is included in order to reflect recoveries expected under an Adverse Development Cover (ADC). This ADC ceded reserve is discounted together with overall ceded reserves.
The net impact of the technical provision adjustments (i.e. discounting and retro recoveries) amounts to USD 1.8m.
7.3 Information on the Risk Margin
7.3.1 Value of the risk margin and of the other effects on target capital The Risk Margin (also known as the Market Value Margin) is calculated in order to reach a market-consistent valuation for the insurance liabilities (reserves). Specifically it is the difference between the discounted best-estimate reserve value and the market-consistent value; it is deducted from the Risk Bearing Capital in determining surplus capital.
7.3.2 Description of basis, methods and key assumptions used in the valuation. The Risk Margin is modelled as being equal to the cost of regulatory capital an entity would be required to hold to account for the risk of running off the business. Regarding the model elements included in the regulatory capital for the calculation of Risk Margin we exclude the following:
1. Market Risk: Market Risk is assumed to be a risk which can be hedged and is therefore excluded. The hedging can be done through a portfolio of highly rated government bonds. MS Amlin AG
© MS Amlin AG 30
liabilities are mainly in currencies for which government bonds are widely available (mostly USD) and the payment pattern is relatively short which simplifies matching issues.
2. Credit Risk (investment): is reduced to zero, due to the assumption of holding highly rated government bonds.
3. SST required scenarios: except for the “under-reserving” scenario, the SST required scenarios are related either to new claims or to financial market events which do not apply to a matched portfolio of government bonds. Therefore they are excluded. The reserving scenario is appropriate for consideration. This is a 10% increase in reserves at a 0.5% annual probability.
The following elements are included in regulatory capital for the calculation of Risk Margin:
1. Reserve Risk
2. Reinsurance Credit Risk relating to the held reserves
The cost of capital is assumed to be 6% as prescribed by FINMA for the purpose.
Based on the above assumptions we calculate a Risk Margin of USD 140.3m. Accordingly the SST Target Capital is USD 1,000.0m and the SST Capital Ratio is 208%. For further details please refer to Appendix 1.
7.4 Market consistent valuation of other liabilities (for solvency purposes)
7.4.1 Value of provisions for other liabilities
Out of the total 3,973.9m liabilities, USD 3,694.0m are technical provisions including UPR. The remainder of liabilities includes liabilities from insurance business (USD 235.9m), other liabilities (USD 21.8m), non-technical provisions (USD 12.8m) and liabilities from derivative financial instruments (USD 9.3m).
7.4.2 Description of basis, methods and key assumptions used in the valuation of other liabilities
MS Amlin AG’s other liabilities in a market consistent view are valued in line with Swiss CO.
© MS Amlin AG 31
8. Capital Management
8.1 Goals, strategy and time horizon for capital planning With respect to its capital philosophy, MS Amlin AG seeks to maintain sufficient capital to comfortably meet its regulatory capital requirements, to maintain a strong credit rating, to ensure cedants are sufficiently protected and to fulfil its on-going business objectives. In line with its capital philosophy, the Boards regularly monitor the capital position. The Company calculates its regulatory capital requirement using its Internal Model on the Swiss Solvency Test basis. MS Amlin AG utilises its internal model to calculate the capital requirements, utilising data from the business and the forecast business plan that has been approved by the MS Amlin AG Supervisory Board. MS Amlin AG Target Capital is measured using the Swiss Solvency Test risk-based capital methodology. Swiss Solvency Test Capital Requirement This is a regulatory mandatory capital requirement measure that is based on the calculation of capital requirements to operate on a one-year basis. It is calculated to cover the risks that could materialise based on the execution of the one-year business plan that runs from 1 January to 31 December of the same calendar year. Through the annual business planning cycle and forward looking plans, MS Amlin AG considers capital management to ensure any business growth is supported by retained profit or through raising of additional capital. Under the requirements of SST, MS Amlin AG operates a framework to ensure that capital needs are assessed. MS Amlin AG’s Internal Model has been approved by FINMA for use when calculating the SST for risk charges including Insurance Risk, Reinsurance Credit Risk and Dependencies. In all circumstances, capital needs are assessed through MS Amlin’s Internal Model. The Internal Model forecasts a wide range of potential financial outcomes for each area of the business, which are used to calculate capital requirements and other risk adjusted metrics.
Dividend Policy In principle, MS Amlin AG’s excess capital would be available to be paid to MSI as dividends. The timing, manner and amount will be decided considering MSI’s future strategy for the businesses, subject to regulatory considerations. Available Funds to meet Capital Requirement The relevant measure of available own funds is the Risk Bearing Capital (“RBC”) calculated on the SST market consistent balance sheet. MS Amlin AG has net assets under Swiss CO of USD 1,841.3m as compared to USD 1,930.6m net assets based on SST market consistent balance sheet. The adjustments made to adjust from Swiss CO balance sheet to SST market consistent balance sheet are set out below:

© MS Amlin AG 32
For further details regarding the significant discrepancies please refer to Section 7 “Valuation”. Capital Composition MS Amlin AG must ensure that it continuously maintains Risk Bearing Capital of a suitable quality and permanence to meet the admissibility requirements of the Swiss Solvency Test. Contingency Plans
As part of the MS&AD Group, MS Amlin AG benefits from being able to draw on a substantial capital base from a secure and supportive parent. The specific response to any capital shortfall will depend on the circumstances giving rise to it.
In an event of an extreme threat to MS Amlin AG’s capital adequacy, MS Amlin AG would have two choices: to either reduce its capital needs by altering areas of its business plans; or seek to raise capital to support the current business plan and future strategy. A solution could involve a contribution of one or both of these options. Any proposals to change the business plan or raise additional capital would require approval by MS Amlin AG Supervisory Board as well as by MSI.
The timescales and associated limitations of raising capital are dependent on the context of the event that may invoke the necessity of executing the contingency plan.
8.2 Structure, level and quality of the equity capital reported in the annual report
For details regarding structure, level and quality of the equity capital please refer to MS Amlin AG’s Swiss CO annual report.
In USD millions SST 2020 SST 2021
Excess of assets over liabilities - Swiss CO annual report (*) 1,850.6 1,841.3
Investment fair value adjustments 78.7 91.0
Technical provision adjustments 58.4 -1.8
Excess of assets over liabilities- SST market-consistent balance sheet 1,987.8 1,930.6
Intangible Assets 0.0 0.0
SST Risk Bearing Capital 1,987.8 1,930.6
(*) Based on MS Amlin AG's Swiss CO financial statements for 2019 and 2020

© MS Amlin AG 33
9. Solvency
9.1 Information about the Internal Model
9.1.1 Choice and justification of choice of the Internal Model For the SST, MS Amlin AG uses a partial internal model:
Premium Risk, Reserve Risk and Reinsurance Credit Risk are modelled using MS Amlin’s Internal Model (which is described below).
For Market Risk and Investment Credit Risk, the standard models of FINMA are used, with approved model adjustments as required.
The Internal Model is an integral part of MS Amlin AG’s Risk Management Framework and is also used to support the wider management of the business. The main reasons for using FINMA’s standard models for SST Market Risk and Investment Credit Risk, instead of internal models, is that these risks are relatively less material for MS Amlin AG compared to Insurance Risk, and we believe that FINMA’s standard models provide a sufficient reflection of these risks for MS Amlin AG. The scope and structure of MS Amlin AG’s Internal Model is shown in the diagram below.
© MS Amlin AG 34
9.1.2 Description of the Internal Model’s salient features MS Amlin AG’s policy framework surrounding the Internal Model includes: Governance
The MS Amlin AG Internal Model is governed by MS Amlin AG’s Internal Model Policy and the supporting Internal Model Standards. Governance responsibilities are set out in the Internal Model Governance Standard. These are reviewed and approved annually by the MS Amlin AG Boards.
The MS Amlin AG Risk & Solvency Committee receives a quarterly report on the Solvency position for the Company. This outlines modelling activities over the last quarter including rationale for movements in the capital, reasons behind model changes and validation work performed. Changes to the Internal Model
Changes to the Internal Model are approved in accordance with the Internal Model Change Standard. Changes are classified as major, minor or operational in accordance with the Internal Model Change Standard. Model changes are reported to the MS Amlin AG Risk & Solvency Committee on a quarterly basis. All Internal Model methodology changes and parameter changes are incrementally tracked.
Data Quality
Data and data processes used within the Internal Model adhere to the Internal Model Data Quality Standard. Data feeding the Internal Model is recognised as needing to be ‘accurate, complete, and appropriate’.
Data quality controls are included within the Internal Control Framework and attested to on a quarterly cycle. Where controls are identified as requiring remediation as a result of their design or operation improvement plans are agreed and actioned.
Validation
The Internal Model is validated to enable Boards, management and supervisory authorities to conclude that the Internal Model is appropriate for the calculation of regulatory capital and appropriate for use within the Risk Management Framework and decision making process of the Company.
Validation is carried out by both the team responsible for the design and operation of the Internal Model (dependent validation) as well as by independent validators. Independent validation is carried out in accordance with the Internal Model Validation Standard.
Documentation The Internal Model documentation is recognised as needing to be complete, accurate, relevant and up to date with enough content and clarity to allow an independent, knowledgeable third party to understand the model. An important use for the documentation is to mitigate key personnel risk. Therefore, documentation is written and reviewed at an appropriate level so that an individual can gain adequate knowledge of the structure, methodology and functionality of MS Amlin AG’s Internal Model. The minimum requirements for Internal Model documentation are set out in the Internal Model Documentation Standard. Expert Judgement There may be instances when the valuation of assets and liabilities cannot be determined solely by the empirical analysis of data, but must be determined instead by the application of expert judgement. The Internal Model Expert Judgement Standard provides clear guidelines for the use of expert judgement as part of MS Amlin AG’s Internal Model. Use
The Internal Model Use Standard provides a governance and compliance framework to manage the use of MS Amlin AG’s Internal Model, ensuring that it is widely used, and playing an important role in the management of the business.

© MS Amlin AG 35
9.1.3 Internal Model approval by FINMA MS Amlin AG’s Internal Model has been approved by FINMA for use when calculating the SST for risk charges including Insurance Risk, Reinsurance Credit Risk and Dependencies.
9.2 Information about Target Capital (with explanatory notes)
9.2.1 Breakdown of target capital into its key components The table below shows the overall result of the SST quantitative model, combining all the components discussed in previous sections. The SST Target Capital is USD 1,000.0m and the SST Capital Ratio is 208%. Please note that SST 2021 is filed with FINMA on April 2021 simultaneously to this document.
9.2.2 Breakdown of market risk and insurance risk into their key components Market risk Market Risk represents the risk to the MS Amlin AG Balance Sheet from financial market volatility, for example from changes in currency exchange rates, yield curves, credit spreads, property values and equity market volatility. The basis of the MS Amlin AG Market Risk calculation is the SST Standard Market Risk model.
The results of the Market Risk Model are presented below. The overall Market Risk charge is USD 238.7m.

© MS Amlin AG 36
Comparing the market risk result for the SST 2021 with the SST 2020, there has been an increase in the risk in monetary terms from USD 215.7m to USD 238.7m.
The biggest change can be attributed to an increase of the overall investable asset portfolio by 8.8%, with Government and corporate bond exposures having increased from USD 1,870.6m to USD 2,124.4m. These exposures are partially invested in foreign currencies. This increases the mismatch position of assets versus liabilities by currency and hence leads to a higher foreign exchange rate risk.
The equity risk also increased as there was a reduction in hedging of equity exposure using equity futures.
Insurance risk Insurance Risk for MS Amlin AG is dominated by Premium Risk, with Reserve Risk having a much less material impact. The components of Insurance Risk are shown in the table in section 9.2.1 and discussed in section 6.1.1.
9.2.3 Comparison with corresponding information from previous reporting period In this section we compare the results from this submission to those submitted for the SST 2020. We note the following overall changes:
The SST Capital Ratio has increased to 208% compared to 200% for 2020 One-year risk capital has decreased from USD 942.6m to USD 859.6m
Risk Bearing Capital has decreased from USD 1,987.8m to USD 1930.6m
The SST Target Capital has remained fairly stable with a moderate reduction compared to 2020, with underlying offsetting movements in the individual risk categories:
Insurance Risk has increased by 2%, resulting from an increase in Reserving Risk (+15%) partially offset by reductions in Premium Risk (-4%) and RI Credit Risk (-5%);
Increase in Market Risk (+11%), principally due to the increased mismatch position of assets versus liabilities
Decrease in the Expected Insurance Result (-16%), though the reduction was more than offset by a 75% increase in Expected Investment Result.
The increase in Reserving Risk coupled with a slight lengthening of the total claims pay-outs and reductions in yield curves results in an increase in the Market Value Margin (+31%)
9.3 Information about Risk-Bearing Capital
9.3.1 Breakdown of the risk bearing capital into its key components Market consistent value in the FCR template of total assets amount to USD 5,904.5m and total liabilities amount to USD 3,973.9m as of 31 December 2020 resulting in a difference between market-consistent assets and market-consistent liabilities of USD 1,930.6m. For further details please refer to Appendix 1.
The comparison of the Risk Bearing Capital between 2020 and 2021 is shown in Appendix 1. The capital has been relatively stable throughout the year but has seen a slight reduction due to the downward movement of yield curves..

© MS Amlin AG 37
9.3.2 The insurance company’s comments on its reported solvency The MS Amlin AG SST 2021 Capital Ratio described in this report is 208%, which compares favourably with the minimum FINMA SST solvency requirement of 100%. The SST One-year risk capital is USD 859.6m, the risk margin is USD 140.3m and the SST Risk Bearing Capital is USD 1,930.6m.
Since last year, the SST One-year risk capital has decreased by USD 83.3m compared to an decrease of USD 49.8m in Risk Bearing Capital.
9.3.3 Comparison with information provided to FINMA and assurance of subjection to regulatory audit
Please note that in the above, we denote by “One-year risk capital” the denominator of the SST ratio as per 2018 methodology prescribed by FINMA, i.e. excluding the Market Value Margin.

38
10. Appendices
10.1 Appendix 1

39
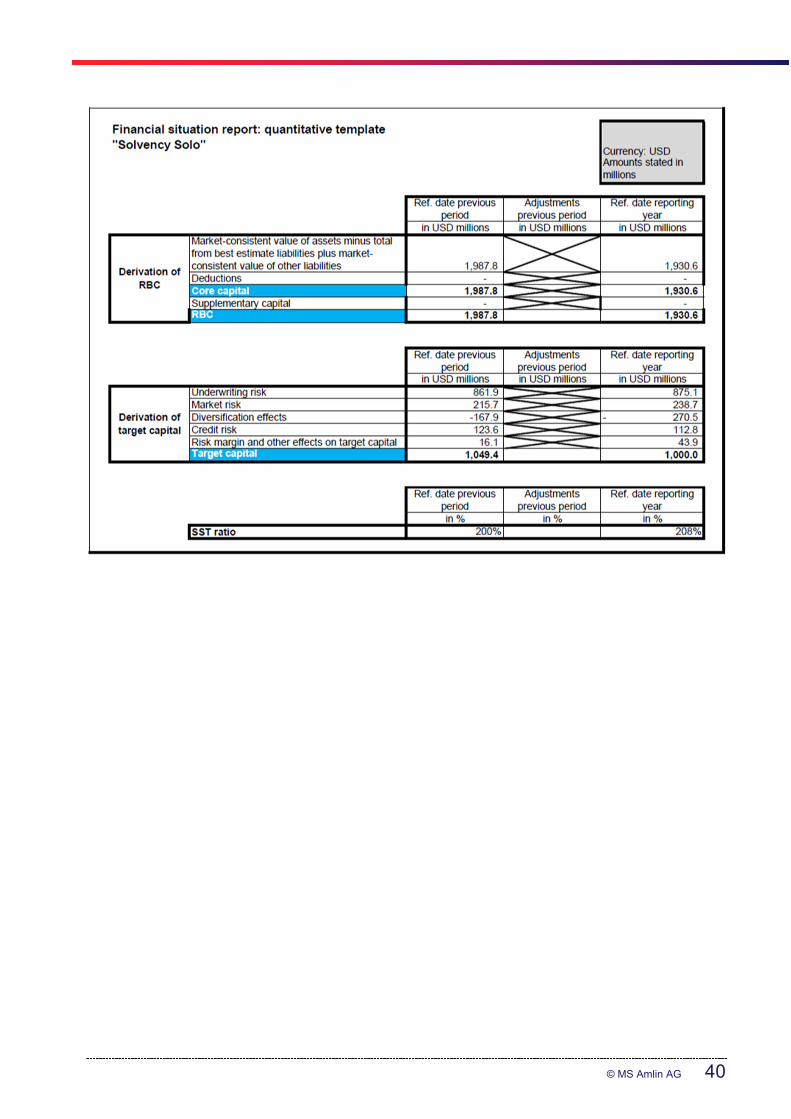
© MS Amlin AG 40

41
10.2 Appendix 2
10.2.1 Structure of MS Amlin entities within MS&AD Group from 1 January 2020

Annual Report MS Amlin AG
2020
Kirchenweg 5
8008 Zürich
Switzerland
10.3 Appendix 3

Management Report
Business Development and Financial Condition
Number of full-time positions on an annual average
Extraordinary events
Future prospects and vision
The overall result was a loss for the Company for the year 2020 of USD 9.3 million.
The Company employed a worldwide staff at an average of 126 full time equivalents (2019: 125).
One year on from the declaration of a Public Health Emergency due to Coronavirus by the World Health Organisation there still remains significant uncertainty which is impacting the financial markets and the economy as a whole. The longer term impacts of the virus are yet to be fully understood. Included within the result are reserves specifically related to COVID-19. MS Amin AG has maintained a strong capital position through the event and operations continued to run as expected.
Prior to 1 January 2020, MS Amlin AG (the Company) was a wholly owned subsidiary of MS Amlin plc, whose parent was Mitsui Sumitomo Insurance Company (MSI) Limited, a wholly owned subsidiary of MS&AD Group Holding, Inc. (MS&AD). On 1 January 2020 the share ownership in the Company transferred to MSI with MS Amlin AG becoming a direct subsidiary of MSI.
MS Amlin AG operates in four underwriting locations. The Zurich operations of the Company writes reinsurance for predominantly small and mid-sized insurance companies across all non-life classes and products. The Bermuda branch writes a geographical spread of catastrophe, property, casualty, financial lines and speciality business. Two new underwriting locations were added in 2019 and 2020 through MS Amlin Reinsurance Managers Inc (ARMI) in the USA. The Miami branch of ARMI writes Latin American property and casualty reinsurance business and New Jersey, US motor and general liability business, both through a binder agreement with MS Amlin AG.
MS Amlin AG additionally retains a branch in Labuan.
Net income from investments was USD 82.8 million. This was a positive outcome given the volatility in the investment markets which showed negative returns during the first quarter, rebounding most positively in zero duration bonds and equities. Property investments also showed positive returns.
Gross written premium was maintained at similar levels to 2019 however with increased diversification of the portfolio. Reductions in catastrophe and aggregate exposures were offset by growth in engineering and financial lines as well as ARMI New Jersey and Miami business being general liability, US motor and Latin American property and casualty respectively.
Loss activity was most notably impacted by COVID-19 losses which have been estimated at in excess of USD 100.0 million for the Company. In addition, claims have been incurred through the catastrophe portfolio, including from Hurricane Laura and the Mid West Derecho, smaller natural perils such as Hurricanes Delta and Zeta and also man made losses such as the Beirut Explosion. Reserves were increased in long tail classes such as casualty, engineering and motor classes to reflect market trends as well as recent experience.
Administrative expenses were broadly in line with the prior year however savings were made predominantly as a result of reduced travel and entertainment expenses due to COVID-19.
The Company is expected to further grow and diversify the portfolio over the longer term with investment being made into supporting infrastructure to allow for scalability and increased efficiencies whilst ensuring that we are accessible to our clients via the most appropriate distribution channels.
The strategy is intended to see the Company being well diversified in terms of products and geographies and therefore able to support clients more broadly, to be financially sound with the ability to offer substantial line sizes and capacity and to develop long-term relationships with clients and brokers.
Within the strategic plans, MS Amlin AG does not anticipate, or rely on a market-turning event. Instead, the Company expects a series of smaller market rate corrections that will neither materially attract nor deflect significant volumes of capital to the market.
The Company has a vision to be a ‘Respected Global Reinsurance Partner’. This is anchored in our values of Client Understanding, Respecting Each Other, Probity, ‘Kaizen’, One MS Amlin Team and Courage to Challenge.
Our strategy as a leading global reinsurer remains consistent following the change in direct ownership of the Company to MSI and benefits from the support of one of the world’s largest non-life insurance groups. Following an organisational restructure in 2020 resulting in greater resource alignment to the business, MS Amlin AG is well positioned to build for the future. The Company’s strategy is driven by a client-focused approach together with a well-balanced and diverse underwriting portfolio. This is enabled by further developing a high performing platform alongside our ability to attract and retain world class talent.
The focus for 2021 is on those levers and enablers which support execution of the short and longer term goals. This includes further development of the Company’s portfolio management capabilities to enhance responsiveness and flexibility to the cycle and growth opportunities across the business particularly given the improving market environment.

Risk Assessment
Risk Management Strategy
Risk Management Framework
Risk Management Methods and Processes
Risk Governance
Risk Appetite and Tolerances
Risk Categorisation
MS Amlin AG’s vision and core values provide the strategic focus for the risk management system to deliver 'effective risk management which optimises return for the risks we take' with the objective to deliver long-term value. This is achieved by actively seeking and accepting risk while managing that risk within acceptable bounds.
The Boards and the Risk & Solvency Committee receive reports from the Risk function that escalate risk areas of concern.
A key objective of the Risk Management Framework is to establish risk appetites for all key areas of risk identified. This appetite is implemented through a set of tolerances and limits which are approved by the Risk & Solvency Committee and the Supervisory Board. Management is accountable for managing levels of risk within the allocated tolerances. The status of profile versus tolerance is reported quarterly to the Risk & Solvency Committee with breaches escalated up to the Supervisory Board.
MS Amlin AG groups its risks into six key categories as specified below. Accordingly, the Risk Management Framework has been designed to take account of these risk categories and seeks to ensure ownership and accountability.
Each of these categories of risk is owned by an Executive Board member with appropriate expertise and authority over the risks being managed on a day to day basis. Further details on the roles, responsibilities, accountabilities, and key mitigation actions of each risk category are documented in six category-based risk standards that are reviewed and approved by the Risk & Solvency Committee each year.
- Third line - MS Amlin’s Internal Audit function is independent and has direct reporting to the MS Amlin AG Audit Committee. The function hasresponsibility for the review of the effectiveness of controls.
MS Amlin AG has developed a Risk Management Policy committed to establishing and maintaining a sustainable enterprise risk management process as an integral part of its business model supporting business planning, capital management and decision making in the business. The Policy is intended to provide transparency, and define ownership, and responsibilities throughout the risk management process as well as create a risk aware culture across the organization.
· A strong, risk based organisation, supported by an appropriate risk management system;· A robust governance framework supporting its organisational structure;· Clear roles and responsibilities and effective escalation processes;· Effective monitoring; and· Clear and effective communication and reporting lines.
MS Amlin AG’s Risk Management Framework consists of a suite of standards, governance processes and procedures that ensure a strong risk management function. It is built into the core operating model of the business and forms part of the overall approach to internal control. It provides the infrastructure within risk governance and also sets out the processes required to sustain risk management across the business.
The operation of effective risk management requires the active involvement of all employees and the responsibility for each risk has been clearly allocated within the Company.
MS Amlin AG operates risk management through a ‘three lines of defence’ model.
- First line – all employees are expected to be risk aware and exercise controls over their activities so that levels of risk are understood andmanaged appropriately; - Second line - MS Amlin AG’s Risk function is responsible for the design and coordination of the risk framework architecture, working togetherwith the Compliance function for additional support;
To supplement and fulfil the needs of the Policy, a Risk Management Framework has been developed and documented which provides:

Linkage to Capital Management
Alignment to Business Strategy
• Retrocessionaires• Brokers• Cedents• Banks and Investment counterparties
Risk category Owner
High Level Overview Scope
Insurance Risk(Chief Underwriting Officer)
Risk from the inherent uncertainties in the occurrence, amount and timing of insurance liabilities and premiums. This includes reserving risk or claims arising on business written in prior years.
• Business plan• Pricing risk• Underwriting performance including
catastrophes• Product Oversight• Reserving • Claims
Market Risk (Chief Financial Officer)
Risk from fluctuations in values of, or income from, assets, interest rates and investment returns.
• Investment market volatility• Counterparty risk• Concentration risk• Currency fluctuation
Credit Risk (Chief Financial Officer)
Risk of counterparties failing to perform their obligations in a timely manner or at all.
MS Amlin AG’s risk management objectives seek to bring business strategy, capital management, and enterprise risk management together to achieve long-term sustainable outcomes for all stakeholders.
This approach allows the business to maximise its return on risk where there is opportunity to, subject to limitations over acceptable risk taking. This is done through the adoption of risk appetites and tolerances that link closely to the return objectives set by the Supervisory Board.
Strategic Risk(Chief Executive Officer)
Risk of the current and prospective impact on earnings or capital arising from adverse business decisions, improper implementation of decisions or lack of responsiveness to industry changes.
Risks that may arise as a result of Group structure.
• Group• Strategic• Political & economic• Conduct• Capital Management
MS Amlin AG has an Internal Model which has been built to reflect the economic risk variables, which could impact the performance of the Company. The MS Amlin AG Supervisory Board has confirmed that the Internal Model is the appropriate method for the calculation of solvency capital under the requirements of the Swiss Solvency Test and the Internal Model has been approved by the supervisory regulator, FINMA, for use when calculating the SST for risk charges including Insurance Risk, Reinsurance Credit Risk and Dependencies. The Internal Model is a core component of the risk management system and is used for a range of business decisions including setting and assessing risk tolerances, business planning, strategic decision making and purchase of outwards reinsurance, and is a key input into the technical pricing framework.
Three risk categories (Insurance, Market and Credit Risk) are managed using capital against the residual risk and are included within the Internal Model for the SST.
Liquidity Risk and Operational Risk are measured through stress and scenario testing and have tolerances set against them, although explicit risk charges are not included within the SST Target Capital.
Strategic risks such as reputational and political risks are on the whole not directly considered within the capital model but managed rather through the use of management actions, contingency plans, policies, processes and robust preventative and detective business process controls.
Liquidity Risk (Chief Financial Officer)
Risk of insufficient financial resources being available to meet liabilities as they fall due.
• All assets
Operational Risk (Chief Operating Officer)
Risk from inadequate or failed internal processes, people and systems, or from external events.
• Systems and Technology• Processes• People• Legal & Regulatory

KPMG AG Zurich, 21 April 2021
MS Amlin AG, Zurich
Report of the Statutory Auditor on the Financial Statements
to the General Meeting of Shareholders
Financial Statements 2020

© 2021 KPMG AG, a Swiss corporation, is a subsidiary of KPMG Holding AG, which is a member firm of the KPMG global organization of independent member firms affiliated with KPMG International Limited, a private English company limited by guarantee. All rights reserved.
KPMG AG Räffelstrasse 28 PO Box CH-8036 Zurich
+41 58 249 31 31kpmg.ch
Report of the Statutory Auditor to the General Meeting of Shareholders of MS Amlin AG, Zurich
Report of the Statutory Auditor on the Financial Statements
As statutory auditor, we have audited the accompanying financial statements (on pages 5 to 17 and pages 19 to 30) of MS Amlin AG, which comprise the income statement, balance sheet, cash flow statement and notes for theyear ended 31 December 2020.
Board of Directors’ Responsibility The board of directors is responsible for the preparation of the financial statements in accordance with the require-ments of Swiss law and the company’s articles of incorporation. This responsibility includes designing, implement-ing and maintaining an internal control system relevant to the preparation of financial statements that are free from material misstatement, whether due to fraud or error. The board of directors is further responsible for selecting and applying appropriate accounting policies and making accounting estimates that are reasonable in the circum-stances.
Auditor’s Responsibility Our responsibility is to express an opinion on these financial statements based on our audit. We conducted our audit in accordance with Swiss law and Swiss Auditing Standards. Those standards require that we plan and per-form the audit to obtain reasonable assurance whether the financial statements are free from material misstate-ment.
An audit involves performing procedures to obtain audit evidence about the amounts and disclosures in the finan-cial statements. The procedures selected depend on the auditor’s judgment, including the assessment of the risks of material misstatement of the financial statements, whether due to fraud or error. In making those risk assess-ments, the auditor considers the internal control system relevant to the entity’s preparation of the financial state-ments in order to design audit procedures that are appropriate in the circumstances, but not for the purpose of ex-pressing an opinion on the effectiveness of the entity’s internal control system. An audit also includes evaluating the appropriateness of the accounting policies used and the reasonableness of accounting estimates made, as well as evaluating the overall presentation of the financial statements. We believe that the audit evidence we have obtained is sufficient and appropriate to provide a basis for our audit opinion.
Opinion In our opinion, the financial statements for the year ended 31 December 2020 comply with Swiss law and the com-pany’s articles of incorporation.
© 2021 KPMG AG, a Swiss corporation, is a subsidiary of KPMG Holding AG, which is a member firm of the KPMG global organization of independent member firms affiliated with KPMG International Limited, a private English company limited by guarantee. All rights reserved.
MS Amlin AG, Zurich Report of the Statutory Auditor
on the Financial Statements to the General Meeting of Shareholders
2
Report on Other Legal Requirements We confirm that we meet the legal requirements on licensing according to the Auditor Oversight Act (AOA) and independence (article 728 CO and article 11 AOA) and that there are no circumstances incompatible with our in-dependence.
In accordance with article 728a paragraph 1 item 3 CO and Swiss Auditing Standard 890, we confirm that an inter-nal control system exists, which has been designed for the preparation of financial statements according to the instructions of the board of directors.
We further confirm that the proposed appropriation of available earnings complies with Swiss law and the com-pany’s articles of incorporation. We recommend that the financial statements submitted to you be approved.
KPMG AG
Rainer Pfaffenzeller Licensed Audit Expert Auditor in Charge
Christoph Hörl Licensed Audit Expert
Zurich, 21 April 2021
Enclosure(s): - Financial statements (income statement, balance sheet, cash flow statement and notes)- Proposal for the appropriation of distributable earnings

Financial Statements ofMS Amlin AG
2020
Kirchenweg 58008 ZürichSwitzerland
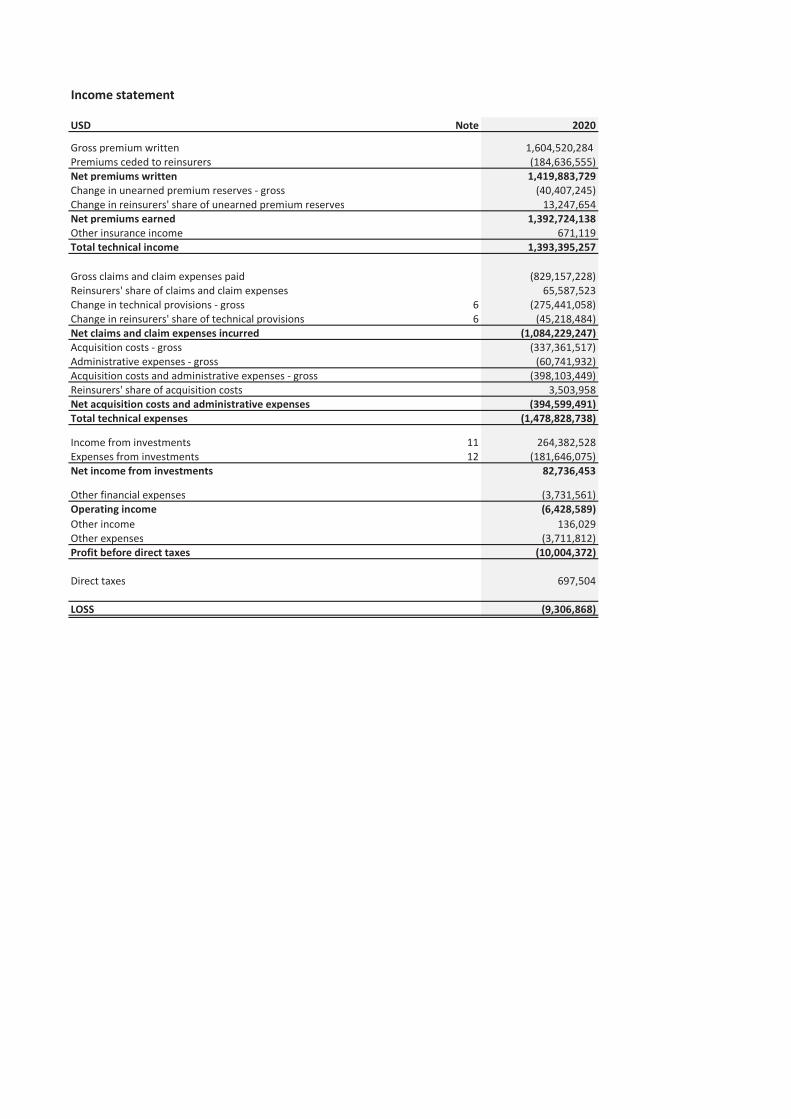
Income statement
USD Note 2020 2019
Gross premium written 1,604,520,284 1,572,412,134 Premiums ceded to reinsurers (184,636,555) (120,525,785)Net premiums written 1,419,883,729 1,451,886,349Change in unearned premium reserves - gross (40,407,245) (209,731,603)Change in reinsurers' share of unearned premium reserves 13,247,654 8,956,508Net premiums earned 1,392,724,138 1,251,111,254Other insurance income 671,119 606,459Total technical income 1,393,395,257 1,251,717,713
Gross claims and claim expenses paid (829,157,228) (863,596,094)Reinsurers' share of claims and claim expenses 65,587,523 129,122,511Change in technical provisions - gross 6 (275,441,058) 10,148,290Change in reinsurers' share of technical provisions 6 (45,218,484) (151,307,439)Net claims and claim expenses incurred (1,084,229,247) (875,632,732)Acquisition costs - gross (337,361,517) (275,318,942)Administrative expenses - gross (60,741,932) (59,015,994)Acquisition costs and administrative expenses - gross (398,103,449) (334,334,936)Reinsurers' share of acquisition costs 3,503,958 265,946Net acquisition costs and administrative expenses (394,599,491) (334,068,990)Total technical expenses (1,478,828,738) (1,209,701,722)
Income from investments 11 264,382,528 248,321,116Expenses from investments 12 (181,646,075) (93,616,335)Net income from investments 82,736,453 154,704,781
Other financial expenses (3,731,561) (3,686,232)Operating income (6,428,589) 193,034,540Other income 136,029 585,661 Other expenses (3,711,812) (1,437,733)Profit before direct taxes (10,004,372) 192,018,157
Direct taxes 697,504 (6,837,674)
LOSS (9,306,868) 185,180,483

Balance sheet
AssetsUSD Note 31/12/2020 31/12/2019
Investments 3,698,552,689 3,399,882,748Fixed-interest securities 445,225,596 409,100,165Shares 8,726,879 6,905,555Other investments 2 3,244,600,214 2,983,877,028
Receivables from derivative financial instruments 645,409 214,060Deposits on reinsurance business 87,752,843 81,818,117Cash and cash equivalents 418,088,847 354,693,090Reinsurers' share of technical provisions 5 148,706,157 180,842,201Property and equipment 7,112,212 4,039,965Deferred acquisition costs 301,118,145 274,950,689Reinsurance receivables 3 / 8 1,071,086,847 1,007,049,549Other receivables 8 41,917,935 90,655,732Prepaid expenses and accrued income 26,956,969 31,186,719TOTAL ASSETS 5,801,938,053 5,425,332,870
Liabilities and equityUSD Note 31/12/2020 31/12/2019
Technical provisions 5 3,680,740,616 3,244,052,138Non-technical provisions 12,822,268 12,453,996Liabilities from derivative financial instruments 9,298,154 8,568,221Reinsurance payables 4 / 9 235,933,631 222,174,726Other liabilities 9 21,818,544 87,452,081TOTAL LIABILITIES 3,960,613,213 3,574,701,162
Share capital 10,333,001 10,333,001Legal capital reserves 1,516,426,106 1,516,426,106
Reserves from capital contributions 21 1,516,426,106 1,516,426,106Legal retained earnings 5,166,500 5,166,500 Voluntary retained earnings 309,399,233 318,706,101
Merger reserve 180,256,440 180,256,440 Profit brought forward 138,449,661 (52,897,332) Profit/(Loss) (9,306,868) 191,346,993
Total equity 7 1,841,324,840 1,850,631,708 TOTAL LIABILITIES AND EQUITY 5,801,938,053 5,425,332,870

Cash Flow Statementin USD
2020 2019
Loss for the year (9,306,868) 185,180,483
Net (purchases)/sales of property, plant and equipment and intangible assets (incl. depreciation)
(3,072,247) (503,316)
Net (purchases)/sales of investments (incl. realised gains/losses)
(298,669,942) (118,677,782)
Net (purchases)/sales of derivatives (incl. realised gains/losses) 298,584 14,393,423
Decrease/(increase) in deposits on reinsurance business (5,934,726) 7,386,705
(Increase)/decrease in reinsurance contract assets 32,136,044 142,975,348
(Increase)/decrease in deferred acquisition cost (26,167,456) (67,062,762)
(Increase)/decrease in insurance receivables (64,037,299) (197,445,885)
(Increase)/decrease other receivables and other payables (16,895,739) 14,902,347
Increase/(decrease) in outstanding claims 366,922,263 (39,210,356)
Increase/(decrease) in unearned premium 69,766,214
Increase/(decrease) in creditors arising from insurance operations
13,758,904
Increase/(decrease) in non-technical provision 368,273
(Increase)/decrease prepaid expenses and accrued income 4,229,753
Cash flow from operating activities 63,395,757 84,664,461
Cash flow from investing activities - -
Cash flow from financing activities - 3,801,627
Cash flow for the financial year 63,395,757 88,466,088
Cash on 1 January 354,693,090 254,796,362
Cash on 31 December 418,088,847 343,262,450
Change in cash 63,395,757 88,466,088

Notes to the Financial Statements
1. General
Basis of presentation
Change in Accounting Policy
Use of estimates in the preparation of annual accounts
Foreign currency translation
Presentation of numbers
Prior to 1 January 2020, MS Amlin AG (the Company) was a wholly owned subsidiary of MS Amlin plc, whose parent was Mitsui Sumitomo Insurance Company (MSI) Limited, a wholly owned subsidiary of MS&AD Group Holding, Inc. (MS&AD). On 1 January 2020 the share ownership in the Company transferred to MSI with MS Amlin AG becoming a direct subsidiary of MSI.
These financial statements were prepared in accordance with the principles of the Swiss Law on Accounting and Financial Reporting (32nd title of the Swiss Code of Obligations) and AVO-FINMA.
Change in Presentation Currency:The company decided to change the Swiss CO presentation currency for the 2020 Financial Statements from Swiss Francs (CHF) to US dollars (USD). This is allowed according to the Swiss Code of Obligations as USD is one of the functional currencies which contributes to a material part of the company's business.
The company's functional currencies stay the same (USD and EUR) and the foreign exchange translation mentioned below remain. The starting point for the change were the year end 2019 CHF numbers which were then converted to USD and represent the new historical balances (CHF/USD FX rate: 0.9678).
Pursuant to Art. 958d, paragraph 3, CO, figures must also be presented in CHF and the year end CHF/USD exchange rate of 0.8849 was applied for converting the USD numbers to CHF. For 2019, the CHF numbers from the audited 2019 Annual Report are shown.
IFRS 16 (adopted in 2019):The Company applied IFRS 16 Leases from 1 January 2019. In this context the definitions as defined under IFRS were also applied to Swiss CO. A contract is a lease if the contract conveys the right to control the use of an identified asset for a period of time in exchange for consideration.
The Company recognises a right of use asset and a lease liability at the lease commencement date. The right of use asset is initially measured at cost, which comprises the initial amount of the lease liability adjusted for any lease payments made at or before the commencement date. The right of use asset is subsequently depreciated using the straight line method from the commencement date to the earlier of the end of the useful life of the right of use asset or the end of the lease term. The estimated useful lives of right of use assets are determined on the same basis as those of property and equipment.
The lease liability is initially measured at the present value of the lease payments that are not paid at the commencement date, discounted using the interest rate implicit in the lease. The lease liability is measured at amortised cost using the effective interest method.
In Swiss CO financials, the cumulative effect of initial application (modified retrospective approach) which is recognised in retained earnings at 1 January 2019 under IFRS 16 are excluded from retained earnings and included in the prior period (Income statement: "Extraordinary expenses").
The preparation of the annual accounts requires management to make significant estimates and assumptions that affect the reported amounts of assets, liabilities, income and expenses as well as the related disclosures. Actual results could differ significantly from these estimates.
At year-end, assets and liabilities denominated in foreign currencies are translated into US dollars at the exchange rate on the balance sheet date whereas revenues and expenses are translated at the average exchange rate for the period under report. Shareholders' equity is translated at historical rates.FX gains arising from the revaluation of the opening balance sheet as well as from the adjustments from application of year-end or average rates are deferred and booked under provision for currency fluctuation (Balance Sheet: "Non-technical provisions"). FX losses are directly recognised in the income statement.
Realised FX arising from foreign exchange transactions are recognised in the income statement.
The translation from functional currency (EUR) to presentational currency of USD gave rise to a FX translation gain of USD 3.5 million. The translation to the functional currencies led to a FX loss of USD 2.3 million. The combined unrealised FX gain of USD 1.2 million was reversed and a corresponding FX provision booked as a liability (Balance Sheet: "Non-technical provisions").
The realized FX loss of USD 3.7 million for the financial year is recognised in the income statement.
The numbers presented throughout this report may not add up precisely to the totals provided in the tables and text.

Notes to the Financial Statements
Valuation Principles
InvestmentsInvestments (except for bonds) are carried at market value if an observable market price is available. If the market price is not available (category Participations in pooled investment funds - Property), investments are accounted for at cost less necessary impairments. Subsequent recoveries of previously recorded impairments may be recognised up to the cost value. Bond investments are valued at amortized cost less necessary impairments, if any.Derivative instruments are valued at market value. Gains and losses are shown as part of Income and Expenses from investments.
Deposits on reinsurance businessDeposits are held at nominal value.
Cash and cash equivalentsCash and cash equivalents include cash at bank and short-term deposits. Such current assets are held at nominal value, after deduction of known credit risks.
Reinsurers' share of technical provisionsReinsurers' share of technical provisions represent the retroceded part of the technical provisions. The same accounting principles apply as for the technical provisions.
Property and equipmentProperty and equipment are stated at historical cost less accumulated depreciation and provision for impairment where appropriate.
Reinsurance receivablesReinsurance receivables are carried at nominal value, after deduction of known credit risks if applicable.The position mainly consists of receivables from insurance companies and brokers.
Other receivablesOther receivables are recognised at the nominal value. The set up of bad debt reserves or write offs will be recorded on a cedent basis.
Technical provisionsThe technical provisions are based on the cedent information (case reserves) and the reserves for already incurred but not yet reported claims (IBNR). Additionally, the technical provisions include the written but not yet earned part of the premiums (Unearned premium reserve).
Reinsurance payablesReinsurance balances payable are held at redemption value.
Acquisition costsAcquisition costs comprise brokerage incurred on insurance contracts written during the financial year. They are charged on the same basis as the earned proportions of the premium they relate to. Deferred acquisition costs are amortised over the period in which the related revenues are earned. Deferred acquisition costs are reviewed at the end of each reporting period and are impaired where they are no longer considered to be recoverable.
Direct taxesDirect taxes relate to income and capital taxes.

Notes to the Financial Statements
2. Other investmentsUSD 31/12/2020 31/12/2019Participations in pooled investment funds - Property 282,869,958 295,631,034 Participations in pooled investment funds - Equity 519,244,586 455,869,825 Participations in pooled investment funds - Bonds 2,049,086,781 1,839,881,595 Participations in pooled investment funds - Money Market 189,906,266 151,081,999 Private equity of which participations (holding < 20%) 4,231,973 2,241,193 Short-term investments in pooled investment funds 199,260,650 239,171,381 Total 3,244,600,214 2,983,877,028
3. Reinsurance receivablesUSD 31/12/2020 31/12/2019Receivables from agents and brokers 834,018,981 691,021,208 Receivables from insurance companies 237,067,866 316,028,341 Total 1,071,086,847 1,007,049,549
4. Reinsurance payablesUSD 31/12/2020 31/12/2019Liabilities to agents and brokers 82,229,910 68,519,808 Liabilities to insurance companies 153,703,721 153,654,918 Total 235,933,631 222,174,726
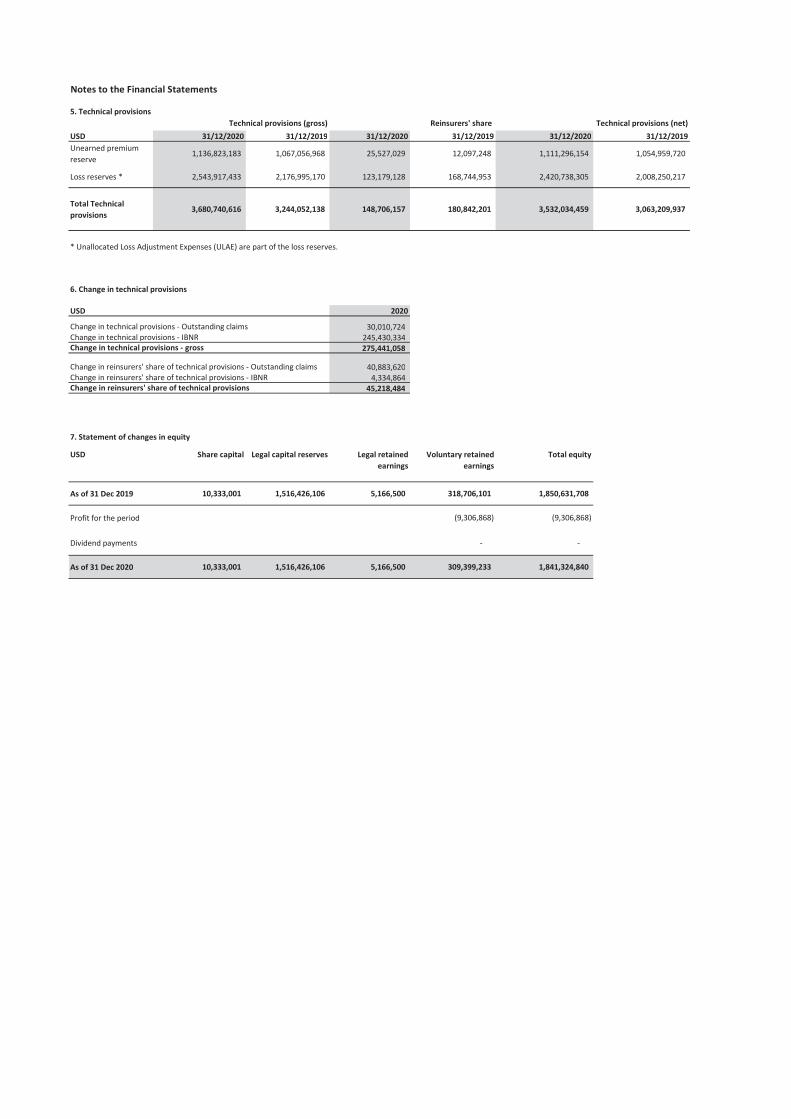
Notes to the Financial Statements
USD 31/12/2020 31/12/2019 31/12/2020 31/12/2019 31/12/2020 31/12/2019Unearned premium reserve
1,136,823,183 1,067,056,968 25,527,029 12,097,248 1,111,296,154 1,054,959,720
Loss reserves * 2,543,917,433 2,176,995,170 123,179,128 168,744,953 2,420,738,305 2,008,250,217
Total Technical provisions
3,680,740,616 3,244,052,138 148,706,157 180,842,201 3,532,034,459 3,063,209,937
* Unallocated Loss Adjustment Expenses (ULAE) are part of the loss reserves.
USD 2020 2019
Change in technical provisions - Outstanding claims 30,010,724 41,345,258 Change in technical provisions - IBNR 245,430,334 51,493,548-
275,441,058 10,148,290-
Change in reinsurers' share of technical provisions - Outstanding claims 40,883,620 (23,397,792) Change in reinsurers' share of technical provisions - IBNR 4,334,864 174,705,231
45,218,484 151,307,439
7. Statement of changes in equity
USD Share capital Legal capital reserves Legal retained earnings
Voluntary retained earnings
Total equity
As of 31 Dec 2019 10,333,001 1,516,426,106 5,166,500 318,706,101 1,850,631,708
Profit for the period (9,306,868) (9,306,868)
Dividend payments - -
As of 31 Dec 2020 10,333,001 1,516,426,106 5,166,500 309,399,233 1,841,324,840
Change in reinsurers' share of technical provisions
Change in technical provisions - gross
5. Technical provisionsTechnical provisions (gross) Reinsurers' share Technical provisions (net)
6. Change in technical provisions

Notes to the Financial Statements
8. Receivables from third parties and affiliated companies31/12/2020
USD Third party Affiliated companies TotalReceivables from reinsurance business 846,535,277 224,551,570 1,071,086,847Other receivables 32,845,221 9,072,714 41,917,935Total 879,380,498 233,624,284 1,113,004,782
31/12/2019USD Third party Affiliated companies TotalReceivables from reinsurance business 705,770,279 301,279,270 1,007,049,549Other receivables 88,826,710 1,829,022 90,655,732Total 794,596,989 303,108,292 1,097,705,281
9. Payables to third parties and affiliated companies31/12/2020
USD Third party Affiliated companies TotalPayables from reinsurance business 80,386,459 155,547,172 235,933,631Other liabilities 11,289,851 10,528,694 21,818,544Total 91,676,310 166,075,866 257,752,175
31/12/2019USD Third party Affiliated companies TotalPayables from reinsurance business 68,955,497 153,219,229 222,174,726Other liabilities 68,401,436 19,050,645 87,452,081Total 137,356,933 172,269,874 309,626,807

Notes to the Financial Statements
USD 31/12/2020Audit services 676,153
Other services -Total 676,153
USD 2020 2020 2020 2020
Fixed-interest securities 10,364,023 1,470,172 1,365,540 13,199,735 Shares 2,679,932 - - 2,679,932 Other investments 30,404,282 110,869,173 107,229,406 248,502,861 Total 43,448,237 112,339,345 108,594,946 264,382,528
USD 2020 2020 2020 2020
Fixed-interest securities 834,828 2,161,120 1,889,208 4,885,156 Shares - - - - Other investments 3,245,380 39,082,780 134,432,759 176,760,919 Total 4,080,208 41,243,900 136,321,967 181,646,075
Net unrealized gains Net realized gains Total
10. Audit fees
11. Income from investments
Income
TotalNet realized lossesNet unrealized lossesExpenses
12. Expenses from investments

Notes to the Financial Statements
13. Personnel expenses
14. Contingent liabilities
15. Depreciation of real estate and equipment and amortization of intangible assets
USD 31/12/2020 31/12/2019Property and equipment 964,760 1,187,243 Intangible assets 2,542 2,526 Total 967,302 1,189,768
16. Restricted assets
Trust FundsAt 31 December 2020, cash and cash equivalents with a fair value of USD 263.8 million (2019: USD 211.0 million) have been deposited in trust by the Company for the benefit of U.S. ceding companies. These funds are held in trust by a U.S. based bank.
Funds withheld as premium/claim depositsAt 31 December 2020, the Company had placed funds totalling net to USD 20.3 million (2019: USD 18.6 million) as premium deposits and USD 67.5 million (2019: USD 63.2 million) as claim deposits. These funds are held by external brokers or cedents. In addition a further USD 136.3 million (2019: USD 93.3 million) has been placed into pledge accounts to collateralise against losses due to reinsurance cedents.
The Company has no contingent liabilities at 31 December 2020 (31 December 2019: USD nil). There were no capital commitments or authorised but uncontracted commitments at the end of the financial year.
Personnel expenses for fiscal year 2020 amount to USD 30.0 million and are included in the line item administrative expenses.
At 31 December 2020, the Company holds restricted funds in the form of letter of credit (LOC) collaterals, initial margin calls on derivative financial instruments, and collateral received from reinsurance counterparties.
Letter of Credit (“LOC”) facilitiesMS Amlin AG has three LOC facilities of USD 450.0 million (2019: USD 450.0 million), USD 210.0 million (2019: USD 210.0 million) and USD 53.9 million (2019: USD 50.5 million). The USD 450.0 million facility is secured by a registered charge over a portfolio of assets managed by Fiera Capital with BNP Paribas as custodian. The USD 210.0 million facility is secured by time deposits held at Barclays Bank. The NZD 75.0 million LOC is secured by time deposits held at National Australia Bank. As at 31 December 2020, USD 572.6 million of LOC were issued (2019: USD 567.0 million). The total value of restricted assets as at 31 December 2020 was USD 646.0 million (2019: USD 645.0 million).
Derivative margins and collateralDerivative instruments traded by the Company for hedging purposes give rise to collateral being placed with, or received from, external counterparties. At 31 December 2020 included in other receivables is USD 31.5 million (2019: USD 23.5 million) margins and collateral pledged in relation to listed future margins.
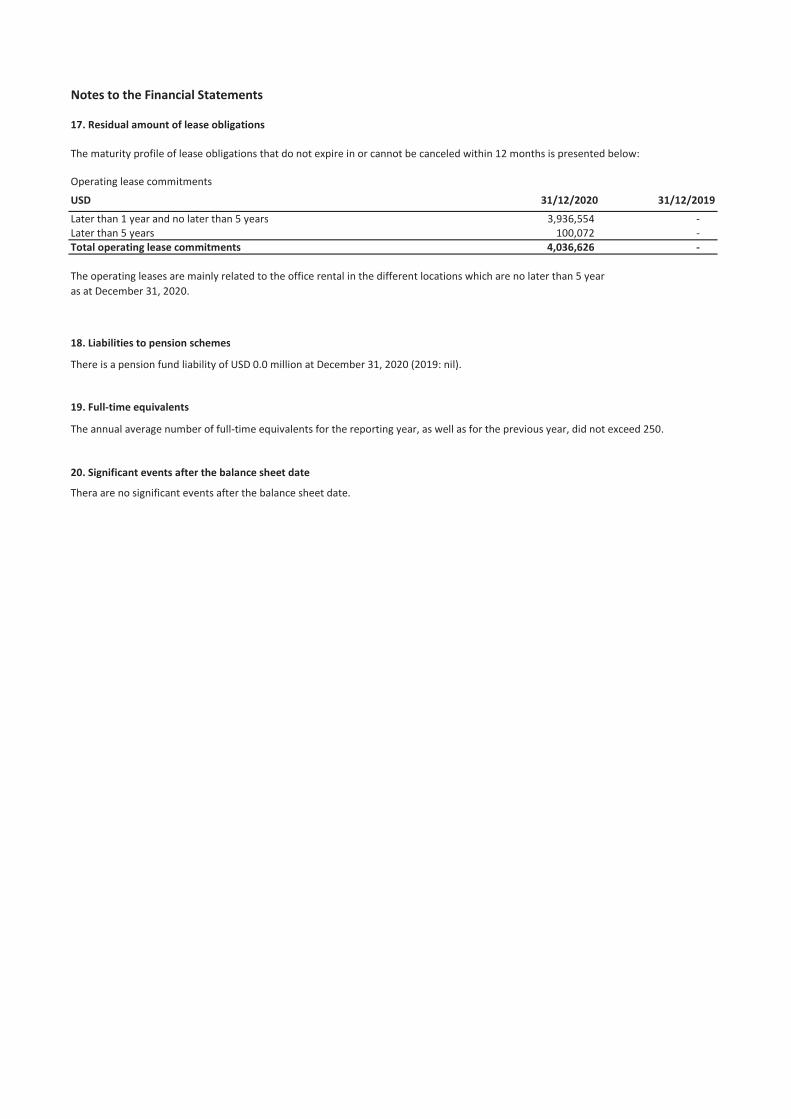
Notes to the Financial Statements
17. Residual amount of lease obligations
Operating lease commitmentsUSD 31/12/2020 31/12/2019Later than 1 year and no later than 5 years 3,936,554 - Later than 5 years 100,072 - Total operating lease commitments 4,036,626 -
18. Liabilities to pension schemes
There is a pension fund liability of USD 0.0 million at December 31, 2020 (2019: nil).
19. Full-time equivalents
20. Significant events after the balance sheet date
The maturity profile of lease obligations that do not expire in or cannot be canceled within 12 months is presented below:
The annual average number of full-time equivalents for the reporting year, as well as for the previous year, did not exceed 250.
Thera are no significant events after the balance sheet date.
The operating leases are mainly related to the office rental in the different locations which are no later than 5 yearas at December 31, 2020.

Notes to the Financial Statements
21. Shareholders' equity (reserves from capital contributions)
22. Hidden reserves
23. General
On 31 December 2020, USD 1,516.4 million are shown as "reserves from capital contributions" (31 December 2019: USD 1,516.4 million). The total reserves from capital contributions include USD 144.7 million of "capital reserves" as agreed with FINMA during the application process.
In 2020, the company did not release nor does it hold any hidden reserves.
The numbers presented throughout this report may not add up precisely to the totals provided in the tables and text.

Proposal for the appropriation of distributable earnings
USD 31/12/2020 31/12/2019Profit/(loss) carried forward 318,706,101 127,359,108 Profit (9,306,868) 191,346,993 Merger reserve - -Distributable earnings 309,399,233 318,706,101
Proposal of the Board of Directors:
Distributable earnings 309,399,233 318,706,101 Dividend payments - -Amount carried forward 309,399,233 318,706,101
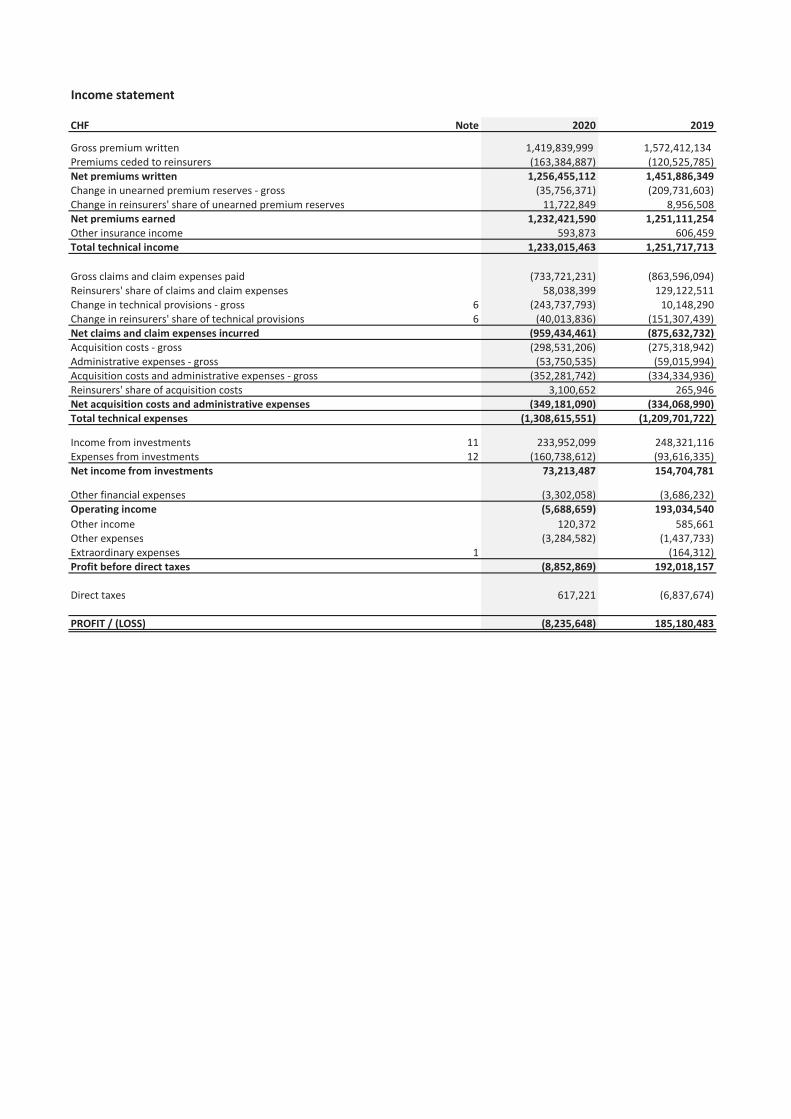
Income statement CHF
CHF Note 2020 2019
Gross premium written 1,419,839,999 1,572,412,134 Premiums ceded to reinsurers (163,384,887) (120,525,785)Net premiums written 1,256,455,112 1,451,886,349Change in unearned premium reserves - gross (35,756,371) (209,731,603)Change in reinsurers' share of unearned premium reserves 11,722,849 8,956,508Net premiums earned 1,232,421,590 1,251,111,254Other insurance income 593,873 606,459Total technical income 1,233,015,463 1,251,717,713
Gross claims and claim expenses paid (733,721,231) (863,596,094)Reinsurers' share of claims and claim expenses 58,038,399 129,122,511Change in technical provisions - gross 6 (243,737,793) 10,148,290Change in reinsurers' share of technical provisions 6 (40,013,836) (151,307,439)Net claims and claim expenses incurred (959,434,461) (875,632,732)Acquisition costs - gross (298,531,206) (275,318,942)Administrative expenses - gross (53,750,535) (59,015,994)Acquisition costs and administrative expenses - gross (352,281,742) (334,334,936)Reinsurers' share of acquisition costs 3,100,652 265,946Net acquisition costs and administrative expenses (349,181,090) (334,068,990)Total technical expenses (1,308,615,551) (1,209,701,722)
Income from investments 11 233,952,099 248,321,116Expenses from investments 12 (160,738,612) (93,616,335)Net income from investments 73,213,487 154,704,781
Other financial expenses (3,302,058) (3,686,232)Operating income (5,688,659) 193,034,540Other income 120,372 585,661Other expenses (3,284,582) (1,437,733)Extraordinary expenses 1 (164,312)Profit before direct taxes (8,852,869) 192,018,157
Direct taxes 617,221 (6,837,674)
PROFIT / (LOSS) (8,235,648) 185,180,483

Balance sheetCHF CHF
AssetsCHF Note 31/12/2020 31/12/2019
Investments 3,272,849,276 3,290,315,250Fixed-interest securities 393,980,130 395,916,157Shares 7,722,416 6,683,011Other investments 2 2,871,146,730 2,887,716,082
Receivables from derivative financial instruments 571,122 207,162Deposits on reinsurance business 77,652,491 79,181,377Cash and cash equivalents 369,966,820 343,262,450Reinsurers' share of technical provisions 5 131,590,078 175,014,227Property and equipment 6,293,597 3,909,769Deferred acquisition costs 266,459,447 266,089,896Reinsurance receivables 3 / 8 947,804,751 974,595,518Other receivables 8 37,093,180 87,734,184Prepaid expenses and accrued income 23,854,221 30,181,670TOTAL ASSETS 5,134,134,983 5,250,491,503
Liabilities and equityCHF Note 31/12/2020 31/12/2019
Technical provisions 5 3,257,087,371 3,139,506,570Non-technical provisions 11,346,425 12,052,643Liabilities from derivative financial instruments 8,227,936 8,292,095Reinsurance payables 4 / 9 208,777,670 215,014,736Other liabilities 9 19,307,230 84,633,776TOTAL LIABILITIES 3,504,746,632 3,459,499,819
Share capital 10,000,001 10,000,001Legal capital reserves 1,467,556,475 1,467,556,475
Reserves from capital contributions 21 1,467,556,475 1,467,556,475Legal retained earnings 5,000,000 5,000,000 Voluntary retained earnings 300,199,560 308,435,208
Merger reserve 174,447,343 174,447,343 Profit brought forward 133,987,865 (51,192,618) Profit/(Loss) (8,235,648) 185,180,483
Conversion difference (153,367,685) -Total equity 7 1,629,388,351 1,790,991,684 TOTAL LIABILITIES AND EQUITY 5,134,134,983 5,250,491,503

Cash Flow Statement FXin CHF 0.8849
2020 2019
Profit / (Loss) for the year (8,235,648) 185,180,483
Net (purchases)/sales of property, plant and equipment and intangible assets (incl. depreciation) (2,718,632) (503,316)Net (purchases)/sales of investments (incl. realised gains/losses) (264,293,031) (118,677,782)Net (purchases)/sales of derivatives (incl. realised gains/losses)
264,217 14,393,423Decrease/(increase) in deposits on reinsurance business
(5,251,639) 7,386,705(Increase)/decrease in reinsurance contract assets 28,437,185 142,975,348(Increase)/decrease in deferred acquisition cost (23,155,582) (67,062,762)(Increase)/decrease in insurance receivables (56,666,605) (197,445,885)(Increase)/decrease other receivables and other payables
(14,951,040) 14,902,347Increase/(decrease) in outstanding claims 324,689,511 (39,210,356)Increase/(decrease) in unearned premium 61,736,123 187,576,967Increase/(decrease) in creditors arising from insurance operations 12,175,255 (5,866,033)Increase/(decrease) in non-technical provision 325,885 (23,321,034)(Increase)/decrease prepaid expenses and accrued income
3,742,908 (15,663,644)
Cash flow from operating activities 56,098,906 84,664,461
Cash flow from investing activities - -
Interest received on loan - 3,801,627Cash flow from financing activities - 3,801,627
Cash flow for the financial year 56,098,906 88,466,088
Cash on 1 January 343,262,450 254,796,362Exchange rate difference on cash and cash equivalents (29,394,536)Cash on 31 December 369,966,820 343,262,450
Change in cash 56,098,906 88,466,088

Notes to the Financial Statements
1. General
Basis of presentation
Change in Accounting Policy
Use of estimates in the preparation of annual accounts
Foreign currency translation
Presentation of numbers
The preparation of the annual accounts requires management to make significant estimates and assumptions that affect the reported amounts of assets, liabilities, income and expenses as well as the related disclosures. Actual results could differ significantly from these estimates.
Prior to 1 January 2020, MS Amlin AG (the Company) was a wholly owned subsidiary of MS Amlin plc, whose parent was Mitsui Sumitomo Insurance Company (MSI) Limited, a wholly owned subsidiary of MS&AD Group Holding, Inc. (MS&AD). On 1 January 2020 the share ownership in the Company transferred to MSI with MS Amlin AG becoming a direct subsidiary of MSI.
These financial statements were prepared in accordance with the principles of the Swiss Law on Accounting and Financial Reporting (32nd title of the Swiss Code of Obligations) and AVO-FINMA.
Change in Presentation Currency:The company decided to change the Swiss CO presentation currency for the 2020 Financial Statements from Swiss Francs (CHF) to US dollars (USD). This is allowed according to the Swiss Code of Obligations as USD is one of the functional currencies which contributes to a material part of the company's business.
The company's functional currencies stay the same (USD and EUR) and the foreign exchange translation mentioned below remain. The starting point for the change were the year end 2019 CHF numbers which were then converted to USD and represent the new historical balances (CHF/USD FX rate: 0.9678).
Pursuant to Art. 958d, paragraph 3, CO, figures must also be presented in CHF and the year end CHF/USD exchange rate of 0.8849 was applied for converting the USD numbers to CHF. For 2019, the CHF numbers from the audited 2019 Annual Report are shown.
IFRS 16 (adopted in 2019):The Company applied IFRS 16 Leases from 1 January 2019. In this context the definitions as defined under IFRS were also applied to Swiss CO. A contract is a lease if the contract conveys the right to control the use of an identified asset for a period of time in exchange for consideration.
The Company recognises a right of use asset and a lease liability at the lease commencement date. The right of use asset is initially measured at cost, which comprises the initial amount of the lease liability adjusted for any lease payments made at or before the commencement date. The right of use asset is subsequently depreciated using the straight line method from the commencement date to the earlier of the end of the useful life of the right of use asset or the end of the lease term. The estimated useful lives of right of use assets are determined on the same basis as those of property and equipment.
The lease liability is initially measured at the present value of the lease payments that are not paid at the commencement date, discounted using the interest rate implicit in the lease. The lease liability is measured at amortised cost using the effective interest method.
In Swiss CO financials, the cumulative effect of initial application (modified retrospective approach) which is recognised in retained earnings at 1 January 2019 under IFRS 16 are excluded from retained earnings and included in the prior period (Income statement: "Extraordinary expenses").
At year-end, assets and liabilities denominated in foreign currencies are translated into US dollars at the exchange rate on the balance sheet date whereas revenues and expenses are translated at the average exchange rate for the period under report. Shareholders' equity is translated at historical rates.FX gains arising from the revaluation of the opening balance sheet as well as from the adjustments from application of year-end or average rates are deferred and booked under provision for currency fluctuation (Balance Sheet: "Non-technical provisions"). FX losses are directly recognised in the income statement.
Realised FX arising from foreign exchange transactions are recognised in the income statement.
The translation from functional currency (EUR) to presentational currency of USD gave rise to a FX translation gain of USD 3.5 million (CHF 3.1 million). The translation to the functional currencies led to a FX loss of USD 2.3 million (CHF 2.0 million). The combined unrealised FX gain of USD 1.2 million (CHF 1.1 million) was reversed and a corresponding FX provision booked as a liability (Balance Sheet: "Non-technical provisions").
The realized FX loss of USD 3.7 million (CHF 3.3 million) for the financial year is recognised in the income statement.
The numbers presented throughout this report may not add up precisely to the totals provided in the tables and text.
Notes to the Financial Statements
Valuation Principles
InvestmentsInvestments (except for bonds) are carried at market value if an observable market price is available. If the market price is not available (category Participations in pooled investment funds - Property), investments are accounted for at cost less necessary impairments. Subsequent recoveries of previously recorded impairments may be recognised up to the cost value. Bond investments are valued at amortized cost less necessary impairments, if any.Derivative instruments are valued at market value. Gains and losses are shown as part of Income and Expenses from investments.
Deposits on reinsurance businessDeposits are held at nominal value.
Cash and cash equivalentsCash and cash equivalents include cash at bank and short-term deposits. Such current assets are held at nominal value, after deduction of known credit risks.
Reinsurers' share of technical provisionsReinsurers' share of technical provisions represent the retroceded part of the technical provisions. The same accounting principles apply as for the technical provisions.
Property and equipmentProperty and equipment are stated at historical cost less accumulated depreciation and provision for impairment where appropriate.
Reinsurance receivablesReinsurance receivables are carried at nominal value, after deduction of known credit risks if applicable.The position mainly consists of receivables from insurance companies and brokers.
Other receivablesOther receivables are recognised at the nominal value. The set up of bad debt reserves or write offs will be recorded on a cedent basis.
Technical provisionsThe technical provisions are based on the cedent information (case reserves) and the reserves for already incurred but not yet reported claims (IBNR). Additionally, the technical provisions include the written but not yet earned part of the premiums (Unearned premium reserve).
Reinsurance payablesReinsurance balances payable are held at redemption value.
Acquisition costsAcquisition costs comprise brokerage incurred on insurance contracts written during the financial year. They are charged on the same basis as the earned proportions of the premium they relate to. Deferred acquisition costs are amortised over the period in which the related revenues are earned. Deferred acquisition costs are reviewed at the end of each reporting period and are impaired where they are no longer considered to be recoverable.
Direct taxesDirect taxes relate to income and capital taxes.

FXNotes to the Financial Statements 0.8849
2. Other investmentsCHF 31/12/2020 31/12/2019Participations in pooled investment funds - Property 250,311,626 286,103,778 Participations in pooled investment funds - Equity 459,479,534 441,178,579 Participations in pooled investment funds - Bonds 1,813,236,893 1,780,588,014 Participations in pooled investment funds - Money Market 168,048,055 146,213,103 Private equity of which participations (holding < 20%) 3,744,873 2,168,967 Short-term investments in pooled investment funds 176,325,749 231,463,642 Total 2,871,146,730 2,887,716,082
3. Reinsurance receivablesCHF 31/12/2020 31/12/2019Receivables from agents and brokers 738,023,396 668,751,775 Receivables from insurance companies 209,781,355 305,843,745 Total 947,804,751 974,595,518
4. Reinsurance payablesCHF 31/12/2020 31/12/2019Liabilities to agents and brokers 72,765,247 66,311,630 Liabilities to insurance companies 136,012,423 148,703,105 Total 208,777,670 215,014,736

FXNotes to the Financial Statements 0.8849
CHF 31/12/2020 31/12/2019 31/12/2020 31/12/2019 31/12/2020 31/12/2019Unearned premium reserve
1,005,974,834 1,032,669,088 22,588,868 11,707,392 983,385,966 1,020,961,696
Loss reserves * 2,251,112,537 2,106,837,482 109,001,210 163,306,835 2,142,111,327 1,943,530,647
Total Technical provisions
3,257,087,371 3,139,506,570 131,590,078 175,014,227 3,125,497,293 2,964,492,343
* Unallocated Loss Adjustment Expenses (ULAE) are part of the loss reserves.
CHF 2020 2019
Change in technical provisions - Outstanding claims 26,556,490 41,345,258 Change in technical provisions - IBNR 217,181,303 (51,493,548)
243,737,793 (10,148,290)
Change in reinsurers' share of technical provisions - Outstanding claims 36,177,915 (23,397,792) Change in reinsurers' share of technical provisions - IBNR 3,835,921 174,705,231
40,013,836 151,307,439
7. Statement of changes in equity
CHF Share capital Legal capital reserves Legal retained earnings
Voluntary retained earnings
Conversion difference *
Total equity
As of 31 Dec 2018 10,000,001 1,467,556,476 5,000,000 123,254,724 - 1,605,811,201
Profit for the period 185,180,483 - 185,180,483
Dividend payments - - -
As of 31 Dec 2019 10,000,001 1,467,556,476 5,000,000 308,435,207 - 1,790,991,684
Conversion difference * (153,367,685) (153,367,685)
Profit for the period (8,235,648) - (8,235,648)
Dividend payments - - -
As of 31 Dec 2020 10,000,001 1,467,556,476 5,000,000 300,199,559 (153,367,685) 1,629,388,351
* Pursuant to Art. 958d, paragraph 3, CO, figures must also be presented in CHF and the year end CHF/USD exchange rate of 0.8849 was applied for converting the USD numbers to CHF. Equity nominals, exceptfor the free reserves, are revalued with historical rates leading to a conversion difference.
Change in reinsurers' share of technical provisions
5. Technical provisionsTechnical provisions (gross) Reinsurers' share Technical provisions (net)
6. Change in technical provisions
Change in technical provisions - gross

FXNotes to the Financial Statements 0.8849
8. Receivables from third parties and affiliated companies31/12/2020
CHF Third party Affiliated companies TotalReceivables from reinsurance business 749,099,067 198,705,684 947,804,751Other receivables 29,064,735 8,028,445 37,093,180Total 778,163,802 206,734,129 984,897,931
31/12/2019CHF Third party Affiliated companies TotalReceivables from reinsurance business 683,025,528 291,569,989 974,595,518Other receivables 85,964,105 1,770,078 87,734,184Total 768,989,634 293,340,068 1,062,329,701
9. Payables to third parties and affiliated companies31/12/2020
CHF Third party Affiliated companies TotalPayables from reinsurance business 71,133,977 137,643,693 208,777,670Other liabilities 9,990,389 9,316,841 19,307,230Total 81,124,366 146,960,534 228,084,900
31/12/2019CHF Third party Affiliated companies TotalPayables from reinsurance business 66,733,278 148,281,457 215,014,736Other liabilities 66,197,074 18,436,703 84,633,776Total 132,930,352 166,718,160 299,648,512

FxNotes to the Financial Statements 0.8849
CHF 31/12/2020 31/12/2019Audit services 598,328 664,778
Other services - -Total 598,328 664,778
CHF 2020 2019 2020 2019 2020 2019 2020 2019
Fixed-interest securities 9,171,124 9,141,439 1,300,955 897,818 1,208,367 2,394,249 11,680,446 12,433,505 Loans - 1,935,202 - - - - - 1,935,202 Shares 2,371,472 5,027 - - - - 2,371,472 5,027 Other investments 26,904,749 51,033,545 98,108,131 161,185,846 94,887,302 21,727,991 219,900,182 233,947,382 Total 38,447,345 62,115,213 99,409,086 162,083,664 96,095,668 24,122,240 233,952,099 248,321,116
CHF 2020 2019 2020 2019 2020 2019 2020 2019
Fixed-interest securities 738,739 245,266 1,912,375 - 1,671,760 339,871 4,322,875 585,137 Shares - - - - - - - - Other investments 2,871,837 2,963,734 34,584,352 21,635,695 118,959,549 68,431,770 156,415,737 93,031,199 Total 3,610,576 3,208,999 36,496,728 21,635,695 120,631,309 68,771,640 160,738,612 93,616,335
10. Audit fees
11. Income from investments
Income Net unrealized gains Total
12. Expenses from investments
Expenses Net unrealized losses Net realized losses Total
Net realized gains

Notes to the Financial Statements
13. Personnel expenses
14. Contingent liabilities
FX15. Depreciation of real estate and equipment and amortization of intangible assets 0.8849
CHF 31/12/2020 31/12/2019Property and equipment 853,716 1,187,243 Intangible assets 2,249 2,526 Total 855,965 1,189,768
16. Restricted assets
Trust FundsAt 31 December 2020, cash and cash equivalents with a fair value of CHF 233.4 million (2019: CHF 204.2 million) have been deposited in trust by the Company for the benefit of U.S. ceding companies. These funds are held in trust by a U.S. based bank.
Personnel expenses for fiscal year 2020 amount to CHF 26.5 million (2019: CHF 32.3 million) and are included in the line item administrative expenses.
The Company has no contingent liabilities at 31 December 2020 (31 December 2019: CHF nil). There were no capital commitments or authorised but uncontracted commitments at the end of the financial year.
At 31 December 2020, the Company holds restricted funds in the form of letter of credit (LOC) collaterals, initial margin calls on derivative financial instruments, and collateral received from reinsurance counterparties.
Letter of Credit (“LOC”) facilitiesMS Amlin AG has three LOC facilities of CHF 398.2 million (2019: CHF 435.5 million), CHF 185.8 million (2019: CHF 203.2 million) and CHF 47.7 million (2019: CHF 48.9 million). The US$450.0 million facility is secured by a registered charge over a portfolio of assets managed by Fiera Capital with BNP Paribas as custodian. The US$210.0 million facility is secured by time deposits held at Barclays Bank. The NZ$75.0 million LOC is secured by time deposits held at National Australia Bank. As at 31 December 2020, CHF 506.7 million of LOC were issued (2019: CHF 548.7 million). The total value of restricted assets as at 31 December 2020 was CHF 571.6 million (2019: CHF 624.2 million).
Derivative margins and collateralDerivative instruments traded by the Company for hedging purposes give rise to collateral being placed with, or received from, external counterparties. At 31 December 2020 included in other receivables is CHF 27.9 million (2019: CHF 22.8 million) margins and collateral pledged in relation to listed future margins.
Funds withheld as premium/claim depositsAt 31 December 2020, the Company had placed funds totalling net to CHF 18.0 million (2019: CHF 18.0 million) as premium deposits and CHF 59.7 million (2019: CHF 61.2 million) as claim deposits. These funds are held by external brokers or cedents. In addition a further CHF 120.6 million (2019: CHF 90.3 million) has been placed into pledge accounts to collateralise against losses due to reinsurance cedents.

Notes to the Financial Statements
17. Residual amount of lease obligations
Operating lease commitmentsCHF 31/12/2020 31/12/2019Later than 1 year and no later than 5 years 3,483,457 - Later than 5 years 88,553 - Total operating lease commitments 3,572,010 -
18. Liabilities to pension schemes
There is a pension fund liability of CHF 0.0 million at December 31, 2020 (2019: nil).
19. Full-time equivalents
20. Significant events after the balance sheet date
The maturity profile of lease obligations that do not expire in or cannot be canceled within 12 months is presented below:
The operating leases are mainly related to the office rental in the different locations which are no later than 5 yearas at December 31, 2020.
The annual average number of full-time equivalents for the reporting year, as well as for the previous year, did not exceed 250.
Thera are no significant events after the balance sheet date.

Notes to the Financial Statements
21. Shareholders' equity (reserves from capital contributions)
22. Hidden reserves
23. General
On 31 December 2020, CHF 1,467.6 million are shown as "reserves from capital contributions" (31 December 2019: CHF 1,467.6 million). The total reserves from capital contributions include CHF 140.0 million of "capital reserves" as agreed with FINMA during the application process.
In 2020, the company did not release nor does it hold any hidden reserves.
The numbers presented throughout this report may not add up precisely to the totals provided in the tables and text.

Proposal for the appropriation of distributable earnings
CHF 31/12/2020 31/12/2019Profit/(loss) carried forward 308,435,208 123,254,725 Profit (8,235,648) 185,180,483 Merger reserve - -Distributable earnings 300,199,560 308,435,208
Proposal of the Board of Directors:
Distributable earnings 300,199,560 308,435,208 Dividend payments - -Amount carried forward 300,199,560 308,435,208

MS♦Rmlin MS Amlin AG
Kirchenweg 5
8008 Zurich
Switzertand
msamlin.com