MRV Demonstration Study (DS) using a Model Project 2012 ...
20
<1> MRV Demonstration Study (DS) using a Model Project 2012 Final Report 「Modal Shift through Construction of Mass Rapid Transit (MRT) System」 (implemented by JWA & ALMEC Consortium for MRV Demonstration Study) Study Partners OTP (Office of Transport and Traffic Policy and Planning) SRTET (SRT Electrified Train Co., Ltd) Location of Project/Activity Bangkok metropolitan region, Thailand Category of Project/Activity Transport Description of Project/Activity This project and activities will establish MRT networks in Bangkok metropolitan region in Thailand, which is expected to lead to a modal shift and a reduction in traffic congestion on the roads, thus reducing GHG emissions and generating offset credits. Eligibility Criteria The project introduces a new urban MRT, including its extension. The MRT is for passenger transport. The MRT is a rail-based transport system. There is a traditional transportation system along the MRT routes in the reference scenario. Technology transfers and/or financial support from Japan and/or other developed countries are provided for the construction or operation of the MRT. Reference Scenario and Project/Activity Boundary Reference scenario: The reference scenario shall be Business as Usual (BaU). Boundary: The boundary for the effect of the passenger modal shift shall be the MRT line used for a trip from entry station to exit station by MRT passengers. It excludes access transportation from origin to station (access) and from station to destination (egress) such as ACM0016. The boundary for the effect of the change in vehicle speed shall be the roads affected by the establishment of the MRT line. This refers only to the roads running parallel on both sides of the MRT line. Calculation Method Options Calculation option 1-1: Passenger modal shift (No interview survey required) : Simplified method in which reference emissions are calculated without conducting a survey of MRT passengers (conservative mode of transportation in reference scenario is set.) Calculation option 1-2: Passenger modal shift (Interview survey required) : A method in which a questionnaire is given to MRT passengers and reference emissions are calculated based on actual conditions. It is presented in conjunction with the conservative option of reducing the number of samples in the riders’ questionnaire. Calculation option 2: Change in vehicle speed : A method in which reference emissions are calculated by conducting a survey on the traffic count/travel speed on specific roads in the vicinity. Default Values set in Methodology A default factor was examined for the “share of passengers using the transport mode in the reference scenario” and the “CO 2 emissions factor per passenger kilometer for transport mode i.” In calculation option 1-1, the share of passengers for the most conservative transport mode in terms of CO 2
Transcript of MRV Demonstration Study (DS) using a Model Project 2012 ...

<1>
MRV Demonstration Study (DS) using a Model Project 2012
Final Report
「Modal Shift through Construction of Mass Rapid Transit (MRT) System」
(implemented by JWA & ALMEC Consortium for MRV Demonstration Study)
Study Partners OTP (Office of Transport and Traffic Policy and Planning)
SRTET (SRT Electrified Train Co., Ltd)
Location of Project/Activity
Bangkok metropolitan region, Thailand
Category of Project/Activity
Transport
Description of Project/Activity
This project and activities will establish MRT networks in Bangkok
metropolitan region in Thailand, which is expected to lead to a modal shift
and a reduction in traffic congestion on the roads, thus reducing GHG
emissions and generating offset credits.
Eligibility Criteria The project introduces a new urban MRT, including its extension.
The MRT is for passenger transport.
The MRT is a rail-based transport system.
There is a traditional transportation system along the MRT routes in the
reference scenario.
Technology transfers and/or financial support from Japan and/or other
developed countries are provided for the construction or operation of the
MRT.
Reference Scenario and Project/Activity Boundary
Reference scenario: The reference scenario shall be Business as Usual (BaU).
Boundary: The boundary for the effect of the passenger modal shift shall be
the MRT line used for a trip from entry station to exit station by MRT
passengers. It excludes access transportation from origin to station (access)
and from station to destination (egress) such as ACM0016. The boundary for
the effect of the change in vehicle speed shall be the roads affected by the
establishment of the MRT line. This refers only to the roads running parallel
on both sides of the MRT line.
Calculation Method Options
Calculation option 1-1: Passenger modal shift (No interview survey required)
: Simplified method in which reference emissions are calculated without
conducting a survey of MRT passengers (conservative mode of
transportation in reference scenario is set.)
Calculation option 1-2: Passenger modal shift (Interview survey required)
: A method in which a questionnaire is given to MRT passengers and
reference emissions are calculated based on actual conditions. It is
presented in conjunction with the conservative option of reducing the
number of samples in the riders’ questionnaire.
Calculation option 2: Change in vehicle speed
: A method in which reference emissions are calculated by conducting a
survey on the traffic count/travel speed on specific roads in the vicinity.
Default Values set in Methodology
A default factor was examined for the “share of passengers using the
transport mode in the reference scenario” and the “CO2 emissions factor per
passenger kilometer for transport mode i.” In calculation option 1-1, the
share of passengers for the most conservative transport mode in terms of CO2

<2>
emissions per passenger kilometer (for example, buses) shall be set at 100%
in calculating the share of passengers using the transport mode in the
reference scenario; the default factor shall not be set in the calculation option
1-2.
The default factor used for the CO2 emission factor per passenger kilometer
for transport mode i shall be the lower of the literature data presented in the
MRV methodology in both calculation option 1-1 and 1-2.
Monitoring Method Using the simplest calculation, the MRT operator will monitor within the
scope of regular operations.
Parameter Monitoring method Frequency
MRT traffic volume
(passenger km/year)
Aggregate data provided
by MRT operator Annually
Number of MRT passengers
(passengers/year)
Aggregate data provided
by MRT operator Annually
Average distance traveled by
MRT passenger
(km)
Data provided by MRT
operator Annually
Electricity consumption
associated with MRT
operations
(MWh/year)
Aggregate data provided
by MRT operator Annually
Result of Monitoring Activity
Monitoring activities were carried out as follows in August 2012.
Questionnaire: More than 6,000 questionnaires were collected in an
interview survey of passengers using the City Line on the ARL Station
platform and premises.
Traffic count survey: A survey was carried out in 20 locations near ARL.
Vehicle travel speed survey: Vehicles equipped with GPS drove on roads
running parallel to the north and south of ARL and obtained data.
Occupancy rate survey: The occupancy rate for passenger cars, two-wheeled
vehicles, taxis and buses was surveyed in the section of the blue line that is to
be extended in order to ascertain the occupancy rate in the absence of MRT.
GHG Emissions and its Reductions
Emissions reductions on the ARL’s City Line were calculated using each
calculation option.
Calculation
option 1-1
Calculation
option 1-2
Calculation
option 2
Project emissions
(tCO2/year) 6,302 6,302 152,430
Reference emissions
(tCO2/year) 11,618 24,167 155,872
Reduction in emissions
(tCO2/year) 5,316 17,865 3,442
Method and Result of Verification
The third-party verification covered the emissions reductions calculated
based on data provided by SRTET and monitoring data. The inspection
organization made observations about the traceability of the data, among
other issues. SRTET is not managing the data on emissions reductions that
could be used for credits, which is an issue to address going forward.
Environmental Impacts
This project is a priority project to achieve the GHG emission reduction
targets in the transportation sector. Moreover, appropriate environmental

<3>
impact assessments were carried out since the project fell under the remit of
Thailand’s environmental impact assessment program; this assessment
determined that there would be no negative impact on the environment.
Promotion of Japanese Technology
Technology manufactured in Japan has the edge in areas on the software side
as well as the infrastructure side. Japan’s expertise is expected to be utilized
in designing measures to improve the bus route for better access to the
railway station, redevelop the front of the station, including the construction
of a plaza in front of the station, enable joint use via Sony’s FeliCa system,
and address climatic disasters such as the 2011 flood.
Sustainable Development in Host Country
NOx reductions as follows can be expected through ARL operations,
estimated from monitoring results.
Reference emissions
(t-NOx/year)
Project emissions
(t-NOx/year)
Reduction in emissions
(t-NOx/year)
177.0 15.8 161.2

MRV DS Report in 2012
<4>
Study Title: MRV Demonstration Study using a Model Project
“Modal Shift through Construction of Mass Rapid Transit (MRT) System”
Study Entity: JWA & ALMEC Consortium for MRV Demonstration Study
1. Study Implementation Scheme Climate Consulting, LLC: This company is in charge of the MRV methodology related to the
passenger modal shift.
OTP (Office of Transport and Traffic Policy and Planning): As part of Thailand’s Ministry of Transport,
OTP instructs that persons working in the transport sector related to this survey receive cooperation.
SRTET (SRT Electrified Train Co., Ltd): SRTET is a subsidiary of the State Railway of Thailand
(SRT) and the operator of the line targeted for the demonstration. SRTET provided cooperation and
data on operations during the monitoring of the Airport Rail Link (ARL).
Asian Transportation Research Society (ATRANS): This society carried out monitoring based on a
monitoring plan drafted by JWA and ALMEC.
2.Overview of Project/Activity
(1) Description of Project/Activity Contents: Item Explanation
Host country and region Bangkok Metropolitan Area (BMA), Thailand, and the surrounding region
(Bangkok Metropolitan Region, or BMR)
Description of project
and activities Development of railway within city to reduce GHG emissions by taking
measures to address the traffic volume and improve the traffic stream
through a modal shift within the boundary. ARL is the city railway targeted
for the project.
Scale of installation As of September 2012, a 28km distance between Phaya Thai and
Suvarnabhumi Airport. An extension in the direction of the former
international airport is planned.
Start of operations August 23, 2010
Status of operations ARL is a railway line used by people commuting to work and school in
central Bangkok, and passengers transferring from the SRT short-range line,
which runs parallel to ARL, also use ARL. ARL runs the City Line, which
stops at every station and is used for commutes to school and work, and the
Express Line, which is used for access to the city center and the airport. The
City Line runs from 6am to 12am, and both railway tracks are run at
15-minute intervals. There are approximately 40,000 users per day.
Fares are set with local users in mind, with a fare of 15 baht for the shortest
ride and a maximum of 45 baht. There is also a discount program for Thai
people only in which the far for the conventional railway line is free when
the passenger changes to a conventional line.
Technology adopted in
the project and
activities
Railway technology
Project and activity
owner SRT
Project and activities In BMA and BMR, the development of MRT will result in a modal shift
MRV DS Report in 2012
<5>
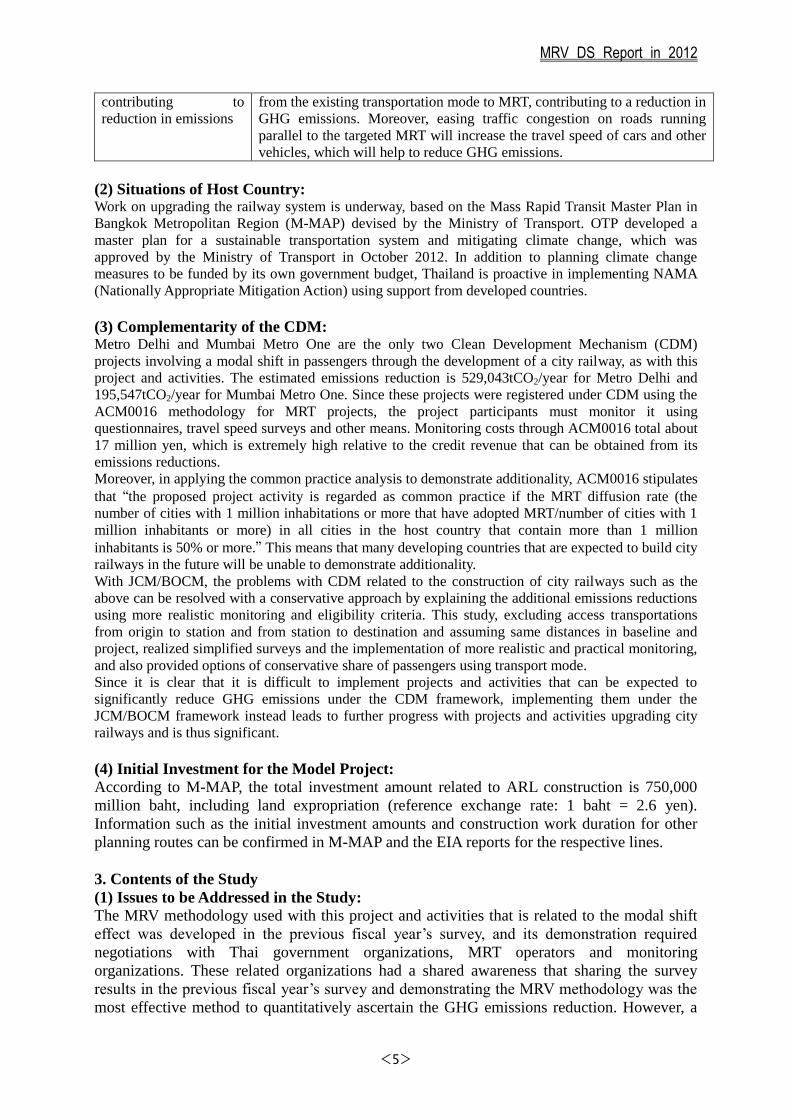
contributing to
reduction in emissions
from the existing transportation mode to MRT, contributing to a reduction in
GHG emissions. Moreover, easing traffic congestion on roads running
parallel to the targeted MRT will increase the travel speed of cars and other
vehicles, which will help to reduce GHG emissions.
(2) Situations of Host Country: Work on upgrading the railway system is underway, based on the Mass Rapid Transit Master Plan in
Bangkok Metropolitan Region (M-MAP) devised by the Ministry of Transport. OTP developed a
master plan for a sustainable transportation system and mitigating climate change, which was
approved by the Ministry of Transport in October 2012. In addition to planning climate change
measures to be funded by its own government budget, Thailand is proactive in implementing NAMA
(Nationally Appropriate Mitigation Action) using support from developed countries.
(3) Complementarity of the CDM: Metro Delhi and Mumbai Metro One are the only two Clean Development Mechanism (CDM)
projects involving a modal shift in passengers through the development of a city railway, as with this
project and activities. The estimated emissions reduction is 529,043tCO2/year for Metro Delhi and
195,547tCO2/year for Mumbai Metro One. Since these projects were registered under CDM using the
ACM0016 methodology for MRT projects, the project participants must monitor it using
questionnaires, travel speed surveys and other means. Monitoring costs through ACM0016 total about
17 million yen, which is extremely high relative to the credit revenue that can be obtained from its
emissions reductions.
Moreover, in applying the common practice analysis to demonstrate additionality, ACM0016 stipulates
that “the proposed project activity is regarded as common practice if the MRT diffusion rate (the
number of cities with 1 million inhabitations or more that have adopted MRT/number of cities with 1
million inhabitants or more) in all cities in the host country that contain more than 1 million
inhabitants is 50% or more.” This means that many developing countries that are expected to build city
railways in the future will be unable to demonstrate additionality.
With JCM/BOCM, the problems with CDM related to the construction of city railways such as the
above can be resolved with a conservative approach by explaining the additional emissions reductions
using more realistic monitoring and eligibility criteria. This study, excluding access transportations
from origin to station and from station to destination and assuming same distances in baseline and
project, realized simplified surveys and the implementation of more realistic and practical monitoring,
and also provided options of conservative share of passengers using transport mode.
Since it is clear that it is difficult to implement projects and activities that can be expected to
significantly reduce GHG emissions under the CDM framework, implementing them under the
JCM/BOCM framework instead leads to further progress with projects and activities upgrading city
railways and is thus significant.
(4) Initial Investment for the Model Project:
According to M-MAP, the total investment amount related to ARL construction is 750,000
million baht, including land expropriation (reference exchange rate: 1 baht = 2.6 yen).
Information such as the initial investment amounts and construction work duration for other
planning routes can be confirmed in M-MAP and the EIA reports for the respective lines.
3. Contents of the Study
(1) Issues to be Addressed in the Study:
The MRV methodology used with this project and activities that is related to the modal shift
effect was developed in the previous fiscal year’s survey, and its demonstration required
negotiations with Thai government organizations, MRT operators and monitoring
organizations. These related organizations had a shared awareness that sharing the survey
results in the previous fiscal year’s survey and demonstrating the MRV methodology was the
most effective method to quantitatively ascertain the GHG emissions reduction. However, a
MRV DS Report in 2012
<6>
methodology for the effect of change in vehicle speed on the roads had to be developed for
this survey, and the following issues were identified. Ensuring accuracy and conservativeness and evaluating uncertainty
Validity of factoring in effect of change in vehicle speed on roads to emissions reductions
Identification of surrounding roads used to factor in effect of change in vehicle speed on roads
Setting the speed on surrounding roads in reference scenario
Examining rebound impact
Method for traffic volume survey and vehicle travel speed survey to formulate the relationship
between traffic volume and vehicle travel speed in a road section (QV model).
(2) Process to Solve the Issues in the Study: An on-site survey was carried out to compile information on policy in Thailand, gather the existing
materials needed to demonstrate the MRV methodology and carry out monitoring.
Five on-site surveys were conducted until the preliminary report was submitted. Table 3.1 provides an
overview of the on-site survey. The respective on-site survey reports are provided separately. The
monitoring survey based on the MRV methodology in the separate materials was carried out in August.
The monitoring that was carried out is described in “(7) Monitoring Method.” Table 3.2 provides an
overview of other survey content. Details on the examination are provided in the corresponding
sections.
Table 3.1: Overview of On-Site Survey
Implementation Period Overview
First (July 8-14)
Submission of request for cooperation with this fiscal year’s
survey to Thailand’s Ministry of Transport, visits to related
organizations, requests for data, etc.
Second (July 22-28) On-site survey of roads around ARL, the target of the traffic
count survey and vehicle travel speed survey, etc.
Third (August 15-19, 23-26)
Discussion of monitoring plan, confirmation of implementation
conditions, compilation of information related to MRT
upgrades, etc.
Fourth (October 9-13) Interim reports, workshop meetings, visits to verification
bodies, etc.
Fifth (November 27 - December
1)
Workshops held, visits to verification bodies, etc.
Sixth (February 6 – February 9) Workshops held to share outputs, etc.
Table 3.2: Survey Components and Overview of Examination
Survey Components Overview of Examination
Survey related to eligibility
criteria for application of MRV
methodology
Eligibility criteria for methodology were considered, taking into
account the results of this fiscal year’s on-site survey.
Survey on options for
calculation options
Several options for calculation options were examined (method
for calculating the GHG emissions reduction effect achieved
through modal shift and change in vehicle speed) so as to
propose a simple but serviceable calculation option.
Survey on information and data
needed for calculations
In the on-site survey, related Thai organizations were asked to
provide data, data was sequentially provided, and the content of
this data was confirmed.
Survey related to project and
activity boundaries
An appropriate boundary was examined for the proposed
calculation option. In the method calculating the effect of the
passenger modal shift in reducing GHG emissions, the relevant
MRT line was set as the boundary, and in the method calculating
the effect of change in vehicle speed in reducing GHG
emissions, the roads affected by the upgrades to the relevant

MRV DS Report in 2012
<7>
MRT were set as the boundary.
Survey on reference scenario A reference scenario was examined for the proposed calculation
option. The reference scenario is the condition in the absence of
MRT.
Survey on monitoring
implementation and monitoring
method
In the aforementioned on-site survey, monitoring was carried out
through ATRANS after confirming the monitoring plan. This
confirmed the feasibility of implementation in the host country.
Survey on setting default values
for parameter
Data on occupancy rate was collected from existing literature to
set the default value.
4. Results of MRV Demonstration Study
(1) GHG Emission Reduction Effects by the Implementation of Project/Activity: Upgrading MRT resulted in a modal shift and reduced the traffic count on surrounding roads, and can
be expected to reduce GHG emissions within the boundary. Accordingly, these two types of effects are
the target in the MRV methodology.
Passenger Modal Shift
An MRV methodology that would enhance the project’s feasibility was considered and revised based
on ACM0016. Important parameters in calculating the reference emissions volume were the transport
mode that would have been used in the absence of MRT (hereinafter, “reference transport mode”) and
the distance traveled (hereinafter, “reference distance traveled”) and the CO2 emissions factor per
passenger km. A questionnaire given to passengers can be used as the specific method for the
reference transport mode, but a simplified method not using a questionnaire was proposed for the
MRV methodology. The possibility of using the distance traveled by MRT passengers as the reference
distance traveled in order to simplify the procedure was also examined. The validity of these
simplified options was examined by analyzing the monitoring survey results. The project emissions
can be calculated by multiply the electricity consumption during MRT operations by the grid CO2
emission factor.
Change in Vehicle Speed
The parameters used to calculate the reference emissions and the project emissions are the CO2
emission factors for the traffic volume and the travel speed. Of these, setting the travel speed for the
reference scenario is important. The relationship between traffic volume and vehicle travel speed in a
road section (QV model) that would experience an effect of traffic congestion mitigation and that is
travelled by people who would likely drive in the absence of MRT is developed based on traffic
volume and travel speed survey performed prior to project start. Vehicle travel speed is estimated from
the QV model using the traffic volume/travel speed survey.
The traffic volume and travel speed for the project emissions are set using the traffic volume/travel
speed survey. Nevertheless, the use of a method in which travel speed was calculated using the QV
model is also considered.
An overview of the MRV methodology and the ACM0016 used as a reference is shown in Table 4.1.

MRV DS Report in 2012
<8>
Table 4.1: Overview of MRV Methodology
MRV Methodology ACM0016
Eligibility
Criteria
This methodology applies only to projects
that fully satisfy all of the following
criteria.
The project introduces a new urban
MRT, including its extension. The MRT
is for passenger transport.
The MRT is a rail-based transport
system.
There is a traditional transportation
system along the MRT routes in the
reference scenario.
Technology transfers and/or financial
support from Japan and/or other
developed countries are provided for the
construction or operation of the MRT.
The eligibility criteria are as follows:
The project constructs a new
rail-based infrastructure or
segregated bus lanes.
The segregated bus lanes in the Bus
Rapid Transit (BRT) system or the
rail-based MRTS replace existing
bus routes operating under mixed
traffic conditions.
The methodology is not applicable
for operational improvements to an
existing bus lane or rail-based
MRTS (for example, new or larger
buses).
The methodology is not applicable
for bus lanes replacing an existing
rail-based system, i.e., the existing
urban or suburban rail infrastructure
must remain fully (along its full
length) operational.
The methodology is applicable for
passenger transport only.
Any fuels, including (liquefied)
gaseous fuels or biofuel blends as
well as electricity can be used in the
baseline or project case.
The methodology is not applicable
for the implementation of air and
water-based transport systems.
The methodology is applicable for
urban or suburban trips. The
methodology is not applicable for
inter-urban transport.
Calculation
Option
The operator may choose the option in
which the modal shift effect and the
change in vehicle speed effect are
calculated. A passenger questionnaire may
be selected or not in measuring the modal
shift effect.
The stipulated calculation option is
followed.
Boundary Passenger Modal Shift
Only the MRT section
The boundary encompasses all of the
transport modes used by the MRT user
from the trip origin to the destination.
Change in Vehicle Speed
The boundary is the roads affected by the
upgrades to the MRT line. Out of roads
running parallel on both sides of the MRT
line, the roads which are more close to the
MRT line and arterial roads.
The effect of traffic congestion
mitigation is not included in the
calculation.
MRV DS Report in 2012
<9>
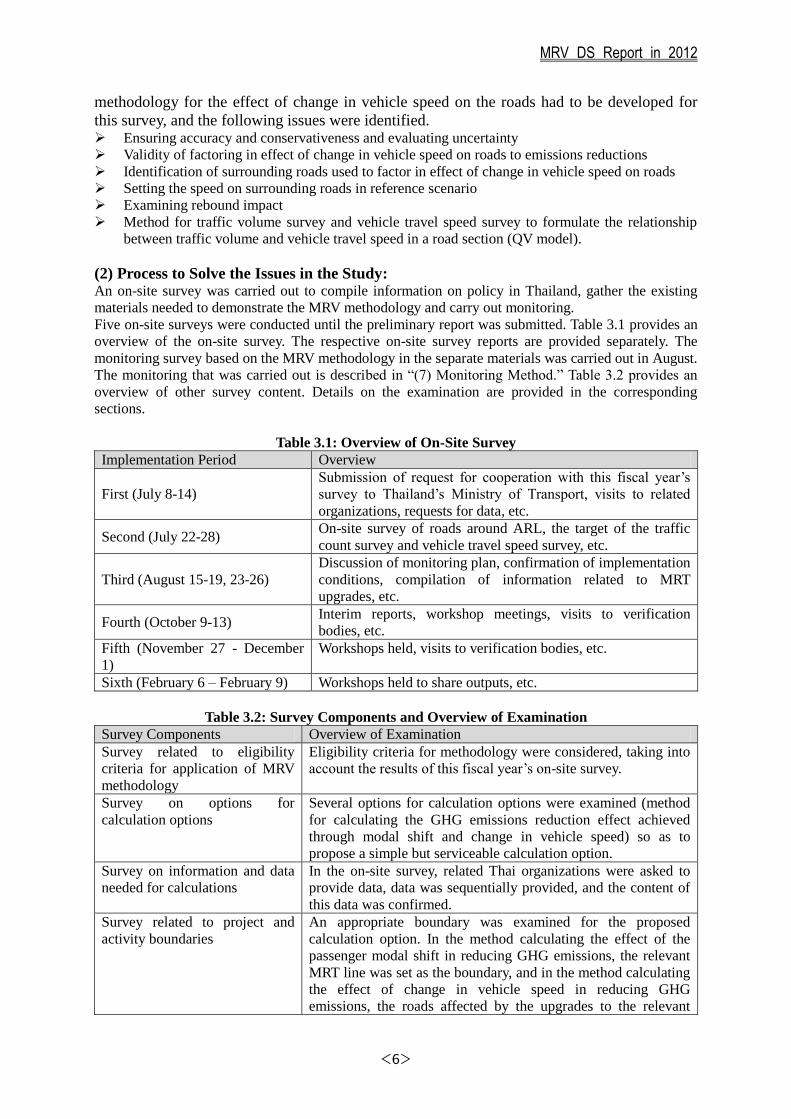
Reference
Scenario
Emissions
Passenger Modal Shift
(MRT traffic volume [passenger km])
x (share of passengers using transport
mode i in the reference scenario) x
(CO2 emission factor for transport
mode i)
MRT traffic volume (passenger km):
This is used when the data can be
obtained directly from the railway
company. When it cannot be obtained,
it is calculated using the equation
(Number of MRT passengers x
average distance traveled by MRT
passengers). The reference travel
distance can be calculated in a
simplified process using the average
distance traveled by MRT passengers
rather than the actual distance
traveled by individual passengers
(from origin to destination).
Share of passengers using transport
mode i in reference scenario:
Calculation Op.1-1: Without conducting a
questionnaire, the transport mode with a
relatively conservative emissions factor
(for example, buses) is used.
Calculation Op.1-2: Average proportion of
full sample is calculated from
questionnaire.
CO2 emission factor for transport
mode i: Essentially, the project
specific value is used, but a default
value can be used when this is not
available.
Passenger Modal Shift
A survey is conducted to
determine the trip distance (from
trip origin to destination) per
mode of transport that would
have taken place in the baseline
for each surveyed passenger. The
baseline emissions are multiplied
by an individual expansion factor
to improve the accuracy of the
survey results.
Change in Vehicle Speed (Distance of
affected road section ) x (project traffic
volume) x (CO2 emission factor by
vehicle in reference scenario vehicle
speed)
Distance of affected road section :
Measured on map
Project traffic volume: The traffic
volume survey results obtained in
monitoring are used.
CO2 emission factor by vehicle in
reference scenario vehicle speed:
Default value is used.
The vehicle speed in the reference
scenario is set using the QV model. The
QV model is devised from the traffic
volume survey and travel speed survey
conducted via monitoring.
The effect of traffic congestion
mitigation is not included in the
calculation.
Project
Emissions
Passenger Modal Shift
・ (Electricity consumed in MRT
operation) x (Grid CO2 emission factor)
Passenger Modal Shift
In addition to emissions from
MRT, emissions from the trip

MRV DS Report in 2012
<10>
*The average distance traveled by MRT
passengers is used as the reference travel
distance, so emissions resulting from the
trip origin to the entry station and from the
exit station to the final destination are not
included.
origin to the entry station and
from the exit station to the final
destination are included.
Change in Vehicle Speed (Distance of
affected road section ) x (project
traffic volume) x (CO2 emission
factor by vehicle in reference scenario
vehicle speed)
The factors are set in the same way as
the reference scenario emissions.
Project vehicle speed is set using the
travel speed survey conducted as part
of monitoring.
The effect of traffic congestion
mitigation is not included in the
calculation.
Leakage Not applicable
*The effect of traffic congestion
mitigation is included in the reference
scenario emissions and project emissions.
Emissions due to changes in the
load factor of taxis and buses and
emissions due to reduced
congestion on affected roads,
leading to higher average vehicle
speed, are included. Leakage
emissions are only counted when
they exceed zero.
(2) Eligibility Criteria for MRV Methodology Application: The eligibility criteria for applying the MRV methodology is as follows:
The project introduces a new urban MRT, including its extension.
The MRT is for passenger transport.
The MRT is a rail-based transport system.
There is a traditional transportation system along the MRT routes in the reference scenario.
Technology transfers and/or financial support from Japan and/or other developed countries are
provided for the construction or operation of the MRT.
The MRV methodology is only used with MRT intended to transport passengers within a city, and is
not applicable with MRT between cities. Applicable projects include new construction or extensions of
existing lines, but measures intended to augment traffic are not applicable. Freight transport is also not
eligible. MRT includes railways, subways, LRT, and monorail, but does not include vehicles such as
BRT. Moreover, there must be either a bus system or public transportation system under the current
situation or reference scenario, and the aim is to shift passengers from these modes of transport to
MRT. The project must also include technical or financial support from Japan or other sources for the
construction of MRT, or transfers of technology and expertise related to MRT operations.
(3) Calculation Method Options: The modal shift effect brought about by upgrades to MRT is used to measure the GHG reduction effect,
but the operator could optionally factor the traffic congestion mitigation effect into the emission
reduction effect.
There are two options for calculating the modal shift effect: a simplified, conservative method
(Calculation option 1-1) in which a passenger survey—the most cost- and labor-intensive aspect of
calculating reference emissions—is not carried out and the method in which a questionnaire is given
(Calculation option 1-2).
Calculation option 1-1: Passenger modal shift (No interview survey required)
Simplified method in which reference emissions are calculated without conducting a survey of MRT
passengers (conservative mode of transportation in reference scenario is set)
Calculation option 1-2: Passenger modal shift (Interview survey required)

MRV DS Report in 2012
<11>
A method in which a questionnaire is given to MRT passengers and reference emissions are calculated
based on actual conditions. It is presented in conjunction with the conservative option of reducing the
number of samples in the interview survey
Calculation option 2: Change in vehicle speed A method in which reference emissions are calculated
by conducting a survey on the traffic count/travel speed on specific roads in the vicinity.
Passenger modal shift is based on conservative and
simplified approachMethod1-1
Method 1-2and
Method 2
Method 1-2
Reference emissions include changes in
vehicle speed
YES
YES
NO
NO
(4) Necessary Data for Calculation: Table 4.2: Information and Data for Calculations
Information, Data
Monitoring (M),
Project Specific Value
(S),
Default Value (D)
Status of Upgrades in
Project and Activities Note
MRT traffic volume
(passenger km/year):
BPKMy
M Can be compiled within
scope of SRTET’s
normal operations
Calculated on a
monthly basis
Number of MRT
passengers
(passengers/year): Py
M
*Not necessary when
MRT traffic volume can
be obtained
Already ascertained
within scope of
SRTET’s normal
operations
Calculated on a daily
basis
Average distance
traveled by MRT
passengers
(km): BTDPy
M
*Not necessary when
MRT traffic volume can
be obtained
Can be calculated within
scope of SRTET’s
normal operations
Calculated on a
monthly basis
Share of passengers
using the transport
mode in the
reference scenario
(%): MSi
D (Calculation Op. 1-1)
or S (Calculation Op.
1-2)
Default value or project
specific value from
passenger questionnaire
-
Electricity
consumption
associated with MRT
operation
(MWh/year): ECMRT,y
M Already ascertained
within scope of
SRTET’s normal
operations
Calculated on a
monthly basis
CO2 emission factor
per passenger
S or D Data from PCD1 is used
for vehicle emission
The host country’s
value is used, but if it
1 Thailand’s Pollution Control Department

MRV DS Report in 2012
<12>
kilometer for
transport mode i
(gCO2/passenger
km): EFPKM,i
factor (gCO2/km). This
survey and past surveys
are used for occupancy
rate.
cannot be obtained,
the default value
provided in the
methodology is used.
Grid CO2 emission
factor (tCO2/MWh):
EFgrid
S National data provided
by host country
Project (host
country) specific
value
Distance of affected
road section i (km):
Di
S Map measurement -
Number of vehicle
type j in road section
i at time h
(vehicle/h):
TVPJ,h,i,j
M Set by traffic volume
survey
Per-hour data on
weekdays/weekends
Travel speed of
vehicle type j in road
section i at time h
(km/h): VPJ,h,i
M Set using the travel
speed survey, or
calculated using the QV
model. The QV model is
devised from the traffic
volume survey and
travel speed survey
conducted via
monitoring.
Per-hour data on
weekdays/weekends
Vehicle speed in
reference scenario in
road section i at time
h
(km/h): VBS,h,i
M Calculated using the QV
model. The QV model is
devised from the traffic
volume survey and
travel speed survey
conducted via
monitoring.
Per-hour data
CO2 emission factor
at vehicle travel
speed v in vehicle
type j
(gCO2/vehicle km):
EF(v)KM,j
S or D Value provided by PCD
can be used.
The host country’s
value is used, but if it
cannot be obtained,
international data2
shall be used as the
default value.
(5) Default Value(s) Set in MRV Methodology:
① Default Value
The “share of passengers using the transport mode in the reference scenario” and the “CO2 emission
factor for transport mode i” were examined. Table 4.3 provides an overview of the default value
presented in the MRV methodology.
Table 4.3: Default Value
Parameter Default Value
Share of passengers using
the transport mode in the
reference scenario
Calculation option 1-1:
The share of passengers for the most conservative transport mode in
terms of CO2 emissions per passenger kilometer (for example, buses)
2 For example, EMEP/EEA emission inventory guidebook-200.

MRV DS Report in 2012
<13>
(%): MSi shall be set at 100% in calculating the share of passengers using the
transport mode in the reference scenario.
Calculation option 1-2:
A default value is not set
CO2 emissions factor per
passenger kilometer for
transport mode i
(gCO2/passenger km):
EFPKM,i
Same for calculation options 1-1 and 1-2:
The value given in Table 4.6.2 in the detailed version shall be the
default value (using the lower value).
② Project Specific Value
The project specific value (the fixed value for each project decided in advance or set after the project
begins) was considered for the “share of passengers using the transport mode in the reference scenario,”
“CO2 emissions factor per passenger kilometer for transport mode i,” “grid CO2 emission factor,” and
“CO2 emission factor at vehicle travel speed v in vehicle type j.” Table 4.4 provides an overview of the
methods used to set the project specific values presented in the MRV methodology.
Table 4.4: Method for Setting the Project Specific Value
Parameter Project Specific Value
Share of passengers using
the transport mode in the
reference scenario
(%): MSi
Calculation option 1-1:
If conservativeness can be ensured in terms of emissions under objective
opinions by local experts, the project specific value can be set using any of
these methods. Calculation option 1-2 can be used if this is not possible.
Other survey results for the relevant line, etc.
Share of passengers using mode of transport in city overall
Calculation option 1-2:
Set the share of passengers specific to the project using a passenger
questionnaire (within one year of the project’s launch)
The method for setting the share of passengers using a passenger
questionnaire is laid out in the detailed version of “4.7.4 Method for
Setting Share of Passengers Using the Transport Mode in the Reference
Scenario (Questionnaire Aggregation Method) ”.
The case of the relevant project is described in the detailed version of
Table 4.7.3.
CO2 emissions factor per
passenger kilometer for
transport mode i (gCO2/
passenger km): EFPKM,i
The project specific value is set using the host country’s literature data
and measurements.
This project’s project specific value is shown in the detailed version of
Table 4.7.15.
Grid CO2 emission factor
(tCO2/MWh): EFgrid
Host country’s publicly released value is used.
This project’s project specific value is 0.5113 tCO2/MWh.3
CO2 emission factor at
vehicle travel speed v in
vehicle type j
(gCO2/vehicles km):
Host country’s publicly released value is used.
3 Summary Report: The Study of emission factor for an electricity system in Thailand 2010 (Publish Date: 30 December
2011), Thailand Greenhouse Gas Management Organization (2010)

MRV DS Report in 2012
<14>
EF(v)KM,j
(6) Setting of Reference Scenario and Project/Activity Boundary:
① Setting the Reference Scenario
The Reference Scenario is the scenario that assumes the absence of the MRT in the future. This study
set the Reference Scenario by reviewing the evaluation of the following measures expected to affect
business as usual (BaU) based on the information collected through this study. Additionally, if the
introduction of biofuels and fuel regulations were set as the Reference Scenario, the default value as
well as the project specific value would be set conservatively, thereby the Reference emissions might
be set conservatively.
BRT introduction
Usage of alternative transport mode including realignment of bas routes
Change to share
Biofuel trends
Fuel regulations
In this study, these measures were evaluated as likely effects on the Reference Scenario. As a result,
there are many uncertainties in these measures, and it is difficult to determine a specific scenario at the
present. These measures need to be evaluated whether they should be reflected into the Reference
Scenario when the project is implemented. Accordingly, it was determined that BaU would be
appropriate for the Reference Scenario of this study.
② Setting Boundaries
When setting boundaries for ACM0016, which can be applied to MRT projects, the transports covered
in the survey are (1) MRT lines, (2) transport used from trip origin to MRT and from MRT to trip
destination, (3) transport on surrounding roads. In the absence of MRT, the calculation option for
emissions caused by the transport method likely to be used in the section of the MRT line traveled will
differ depending on the calculation target selected.
Table 4.5: Summary of Boundary Setting
Calculation
Option Boundary Type of GHG and Source of Emissions
Calculation
option 1-1
and 1-2
MRT line used for a trip from entry
station to exit station by MRT
passengers. It excludes access
transportation from origin to station and
from station to destination such as
ACM0016.
In the absence of MRT, the CO2
emissions from the transport mode
that the passenger likely used (not
including transport used from trip
origin to MRT and from MRT to trip
destination)
CO2 emissions resulting from MRT
operations
Calculation
option 2
Roads affected by the
construction/upgrade of the MRT line.
Out of roads running parallel on both
sides of the MRT line, the roads which
are more close to the MRT line and
arterial roads.
CO2 emissions from cars traveling the
relevant section of road
(7) Monitoring Methods: The summary version describes monitoring methods in the most simplified calculations.

MRV DS Report in 2012
<15>
Table 4.6: Monitoring Parameters (Calculation Option 1-1)
Parameter Monitoring
Method
Monitoring
Frequency
Possibility of Implementation in
Host Country QA/QC
MRT traffic
volume
(passenger
km/year):
BPKMy
Aggregate data
provided by MRT
operator
*If it cannot be
obtained,
estimated using Py
and BTDPy
Annually Calculated within scope of SRT and
MRTA’s normal operations.
In this study, estimated from Py and
BTDPy.
Number of
MRT
passengers
(passengers/y
ear): Py
Aggregate data
provided by MRT
operator
*Only if BPKMy
cannot be obtained
Annually
(calculated
every 15
minutes)
Ascertained within scope of SRT
and MRTA’s normal operations.
SRTET, the target of this study,
collects the data every 15 minutes
using “the Automatic Fare
Collection System” and calculates
daily data.
Checked
against
SRT’s
public data
(annual
report, etc.)
Average
distance
traveled by
MRT
passengers
(km): BTDPy
Data provided by
MRT operator
*Only if BPKMy
cannot be obtained
Annually Calculated within scope of SRT and
MRTA’s normal operations.
SRTET, the target of this study,
calculates the data from the
distance traveled by each passenger
using “the Automatic Fare
Collection System.”
Electricity
consumption
associated
with MRT
operation
(MWh/year):
ECMRT,y
Aggregate data
provided by MRT
operator
Annually
(Collected
on a
monthly
basis)
Ascertained within scope of SRT
and MRTA’s normal operations.
SRTET, the target of this study,
uses the data provided by the
Metropolitan Electricity Authority,
which inspects use every month and
issues an invoice.
① Default Value
The “share of passengers using transport mode i in the reference scenario in year y (%): MSi,y” was set
at 100% for buses, which have a conservative emission factor, in Table 4.8. Two-wheeled vehicles and
tuk-tuk have lower emission factors than buses, but in Thailand, it is not realistic to set the share for
these at 100% and accordingly the share of buses was set at 100%.
② Project Specific Value
The value provided in Table 4.8 was used for the “CO2 emission factor for transport mode i,” and the
Thai government’s official figure of 0.5113 tCO2/MWh was used for the “grid CO2 emission factor.”

MRV DS Report in 2012
<16>
Table 4.7: Project specific value for CO2 emission factor per passenger kilometer for transport mode i
CO2 Emission Factor
for Transport Mode i
(gCO2/km): EFKM,i
Occupancy
Rate
(people): ORi
CO2 Emission Factor per Passenger
kilometer for Transport Mode i
(gCO2/passenger km): EFPKM,i
Bus 1150.1 24.2 47.5
Two-wheeled vehicles 38.2 1.3 29.4
Passenger cars 170.2 1.5 113.5
Taxis 156.6 0.8 195.8
Tuk-tuk 76.5 2.0 38.3
Railway - - 25.2
Source: EFKM,i : Emission Factor of Carbon Dioxide from In-Use Vehicles in Thailand, Sutthicha Nilrit and Pantawat
Sampanpanish, Modern Applied Science; Vol. 6, No. 8; 2012.
ORi : Set based on monitoring survey (August 2012). The value for tuk-tuk is the notional value in the OTP survey.
Note: When setting the EFKM,i for the respective transport modes, efforts were made to ensure that the emission factor is
conservative.
Buses: The factor for diesel was used (most conservative); two-wheeled vehicles: the factor for Gasoline 91 was used (most
conservative); passenger vehicles: the factor for Gasoline 91 was used (most conservative with the exception of gas-based
fuels; moreover, the proportion of gas-based fuels used in passenger cars is low); taxis: factor for LPG was used (most
conservative of all the fuels; the majority of taxis use LPG or CNG.)
(8) Quantification of GHG Emissions and its Reductions:
① Calculation Option Emissions reductions were calculated using calculation option 1-1, calculation option 1-2 or
calculation option 2.
② Applicable Lines ARL’s City Line (the Express Line is not included) is the line covered in calculations of GHG
emission reductions.
③ Applicable Period GHG emission reductions were calculated from October 2011 to September 2012, when the most
recent data could be obtained, and includes the period in which monitoring was carried out.
④ Data used in Calculations
Table 4.8: Data used in Calculations
Parameter
Monitoring (M),
Project Specific Value
(S), Default Value (D)
Value Note
Number of MRT
Passengers
(passenger/year): Py
M 13,656,586 SRT aggregate value
(one-year period from
October 2011 –
September 2012)
Average distance
traveled by MRT
passengers
(km): BTDPy
M 17.9 SRT aggregate value
Share of passengers
using transport mode i
in the reference
scenario in year y
(%): MSi,y
D (calculation option
1-1)
Bus: 100.0 Default value

MRV DS Report in 2012
<17>
S (calculation option
1-2)
Bus: 32.2
Two-wheeled
vehicles: 1.6
Passenger cars:
24.7
Taxis: 26.4
Tuk-tuk: 0.2
Railway: 13.2
Passenger questionnaire
results (August 2012)
Electricity
consumption
associated with MRT
operation (MWh/year):
ECMRT,y
M 12,325 SRT aggregate value
(one-year period from
October 2011 –
September 2012)
CO2 emission factor
per passenger
kilometer for transport
mode i
(gCO2/passenger km):
EFPKM,i
S Bus: 47.5
Two-wheeled
vehicles: 29.4
Passenger cars:
113.5
Taxis: 195.8
Tuk-tuk: 38.3
Railway: 25.2
Calculated from PCD
report value and results of
occupancy rate survey
(August 2012)
Grid CO2 emission
factor (tCO2/MWh):
EFgrid
S 0.5113 Thai government’s
official value4
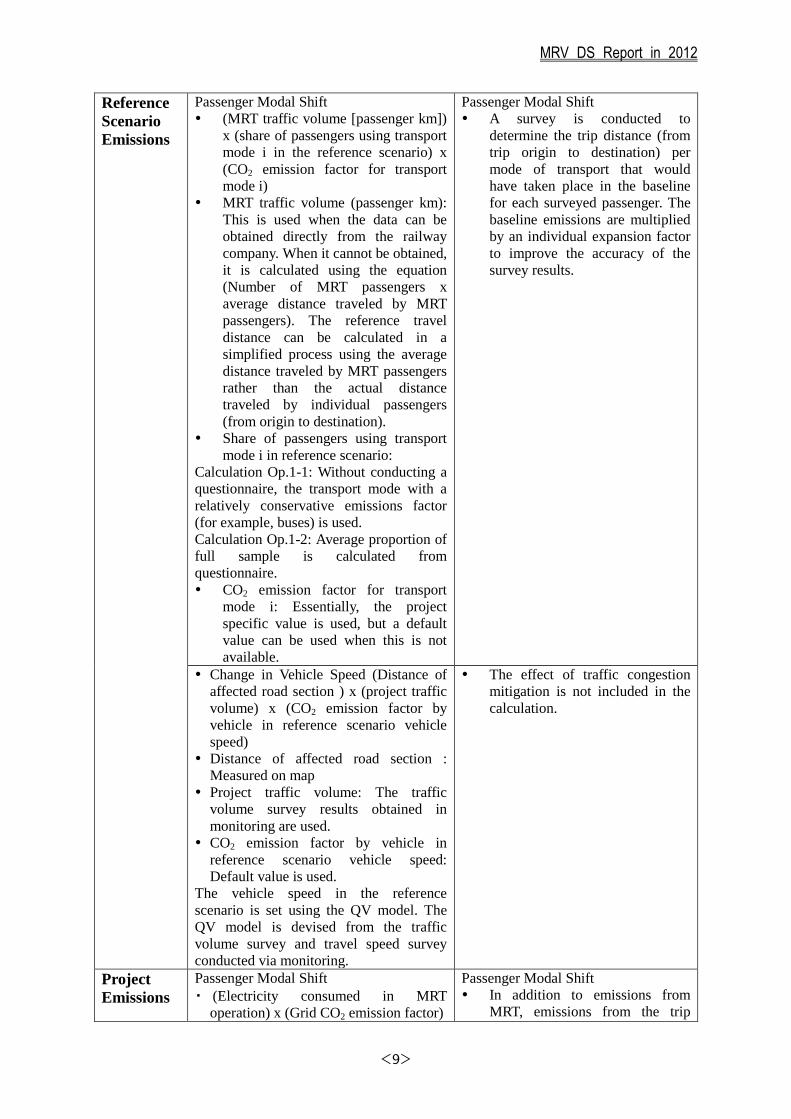
Table 4.9: Data Used in Calculations (Change in Vehicle Speed)
Parameter
Monitoring (M),
Project Specific Value
(S), Default Value (D)
Value Note
Distance of affected
road section i
(km): Di
S 1. PTH-2.RPR: 1.2 km
2. RPR-3.MAS: 2.2
km
3. MAS-4.RKH: 4.2
km
4. RKH-5.HUM: 4.9
km
5. HUM-6.BTC: 5.0
km
6. BTC-7.LKB: 6.0
km
7. LKB-8.SVB: 1.4
km
Map measurement
The section of track is set
for the distance between
each ARL station.
Number of vehicle
type j in road
section i at time h
(vehicle/h): TVPJ,h,i,j
M Traffic volume at
Rama 9 off of the
Motorway for each
cross-section direction,
time period, and type
of vehicle
Results of traffic count
survey (August 2012)
Travel speed in
road section i at
time h
(km/h): VPJ,h,i
M Travel speed in road
section at Rama 9 off
of the Motorway for
each cross-section
Results of traffic speed
survey (August 2012)
4 Summary Report : The Study of emission factor for an electricity system in Thailand 2010 (Publish Date: 30 December
2011), Thailand Greenhouse Gas Management Organization (2010)
MRV DS Report in 2012
<18>
direction and time
period
Vehicle speed in
reference scenario
in road section i at
time h
(km/h): VBS,h,i
M Travel speed in road
section at Rama 9 off
of the Motorway for
each cross-section
direction and time
period
The vehicle speed in the
reference scenario is set
using the QV model. The
QV model is devised from
the traffic volume survey
and travel speed survey
conducted via monitoring
(August 2012).
The traffic volume
substituted in the QV
model is calculated using
the OD between stations
for ARL passengers and
the share of transport
modes in the reference
scenario (refer to graph in
detailed version).
CO2 emission
factor at vehicle
travel speed v of
vehicle type j in
road section i at
time h
(gCO2/vehicle km):
EF(v)KM,j
S or D Refer to the section
entitled “4.7 Method
for Setting Project
Specific Value” in
detailed version.
PCD value
⑤ Calculation Results Calculation Target Equation
Calculation
Option
1-1
Reference
Emissions
yeartCO
EFMSBTDPPREi
iPKMyiyyyMD
/618,11
10
2
6
,,,
Project
Emissions yeartCOEFECPE gridyMRTyMRT /302,6 2,,
Emission
Reductions yeartCO
PEREPEREER yMRTyMDyyy
/316,5302,6618,11 2
,,
Calculation
Option
1-2
Reference
Emissions
yeartCO
EFMSBTDPPREi
iPKMyiyyyMD
/167,24
10
2
6
,,,
Project
Emissions yeartCOEFECPE gridyMRTyMRT /302,6 2,,
Emission
Reductions yeartCO
PEREPEREER yMRTyMDyyy
/865,17302,6167,24 2
,,
Calculation
Option
2
Reference
Emissions
yeartCO
vEFTVDRElh i j
jihKMBSjihPJiyCC
/872,155
36510)(
2
246
,,,,,,,
Project
Emissions
yeartCO
vEFTVDPElh i j
jihKMPJjihPJiyCC
/430,152
36510)(
2
246
,,,,,,,

MRV DS Report in 2012
<19>
Emission
Reductions yeartCOPEREER yyy /442,3 2
⑥ Potential for Emission Reductions in Bangkok Overall (Modal Shift Effect) Case 1: The share of passengers using transport mode i in the reference scenario assumes that buses
account for 100% of the share. This is a fictitious scenario that makes it easier to implement the
project and reduces monitoring costs. Emissions in the reference scenario are assessed extremely
conservatively, but it enables the costs and labor involved in monitoring to be significantly reduced.
Case 2: The share of passengers using transport mode i in the reference scenario is set using the survey
results for ARL. ARL results cannot necessarily be applied to other lines, but were used in this survey
because it is difficult to survey all lines.
Table 4.10: Overview of Emission Reductions (ERy: tCO2/year)
Case 1 Case 2
Average value from 2014 to 2029 309,038 1,014,866
(9) Verification of GHG Emission Reductions:
① Reason for Selecting Verification Organization It was determined that either a designated operational entity (DOE) accredited by the CDM with an
office in Thailand or an ISO-accredited organization would be selected as the verification organization.
In this study, a CDM-accredited DOE was chosen, specifically Lloyd’s Register Quality Assurance
Limited (LRQA), which conducts CDM verifications in Thailand and neighboring countries.
② Verification Method The third-party verification through the MRV methodology examines the project specific value,
monitoring value and the resulting emission reductions, from the data listed in “4.5 Information and
Data for Calculations.” Data for the most recent one-year period provided by SRTET is examined in
the verification.
The following information was provided to the verification organization as necessary evidence for the
verification.
Monitoring report: Includes monitoring parameter, monitoring frequency, QA/QC information
and other information
MRV methodology, calculation sheets: Version 1 is attached to the interim report
PDD: Simplified PDD in J-VER format
Calculation option subject to verification: Three calculation options stipulated in the MRV
methodology
Other materials indicating reasonable grounds: Materials indicating reasonable grounds such
information pointing to the validity of the monitoring period, GPS calibration information used in
the traffic speed survey, management of electricity consumption by SRTET, etc.
③ Verification Results The following issue was given from the implementation of the third-party verification in this study.
The Verification Manual for the Bilateral Offset Credit Mechanism Demonstration/Feasibility Study
programme aims to simplify the verification process to the extent possible based on issues from CDM.
Monitoring parameters shown in the calculation option 1-1 of this methodology would be satisfied by
only the data from normal activities of the railway company, and thereby the simplified verification
could be realized.
However, when assuming the certification of emission reductions in the BOCM project, there is a risk
that emission reductions which are certified by the simplified verification comparing to CDM are
inferior in terms of the credibility. In addition, to verify the GHG emission reductions in the project
rigorously, the verifier requests detailed evidences same as CDM in order to ensure the credibility, and
therefore it might cause a verification method not to be simple. In this study, also, detailed evidences
were requested from the verifier.
The verifier made the following recommendations to improve the project.

MRV DS Report in 2012
<20>
Improve the traceability of data activity flow from its source to aggregated data.
Improve the transparency of all calculation spreadsheets by providing linkages to source data and
applied equations.
Improve the data management system with internal self-verification controls (i.e., QA/QC) and
put in place appropriate control systems and methodologies to ensure the robustness, effectiveness, accuracy, completeness, consistency and timeliness of its data collection and management systems.
Improve its existing monitoring plan and ensure that they describe comprehensively the
requirements of the Monitoring Manual for Bilateral Offset Credit Mechanism
Demonstration/Feasibility study Programme.
(10) Ensuring Environmental Integrity: The environmental improvements are significant, including the alleviation of air pollution due to the
alleviation of traffic congestion, which is included in the MRV methodology. The congestion
mitigation effect can be ascertained by ongoing monitoring of traffic volume. Moreover, the effect of
improvements in air pollution can be ascertained by air pollution monitoring stations in Bangkok. The
negative environmental effects would be the environmental impact during ARL’s construction and the
noise pollution resulting from ARL’s operation. These environmental impacts are avoided by
implementing an environmental impact assessment.
(11) How to Promote the Dissemination of Japanese Technologies: Competition with other countries in terms of MRT infrastructure is extremely harsh. However,
Japan-made technology has advantages on the software side.
Japan’s expertise is expected to be utilized in designing measures to improve the bus route for better
access to the railway station, redevelop the front of the station, including the construction of a plaza in
front of the station, enable joint use via Sony’s FeliCa system, and address climatic disasters such as
the 2011 flood.
(12) Prospects and Challenges for Similar Project/Activity Implementation: Calculations of emission reductions targeting MRT in M-MAP overall in the MRV methodology
indicate that major emissions reductions can be expected. However, there are several issues in using
the JCM/BOCM framework for MRT.
Cabinet approval of JCM/BOCM in Thailand
Establishment of a data management system by a railway company that can satisfy third-party
verification
5. Contribution to Sustainable Development in Host Country Last fiscal year’s study quantitatively determined that the construction of an MRT network had great
potential for improving air quality in the Bangkok metropolitan region. This fiscal year’s study used
actual monitoring results to estimate the effect that the construction of these rail lines would have in
reducing air pollution (NOx).
Calculations using the monitoring results showed that ARL operations could be expected to reduce
NOx as follows:
Reference emissions
(t-NOx/year)
Project emissions
(t-NOx/year)
Emission reductions
(t-NOx/year)
177.0 15.8 161.2