MR Spectroscopic Imaging: Principles and Recent...
25
Invited Review MR Spectroscopic Imaging: Principles and Recent Advances Stefan Posse, PhD, 1–3 * Ricardo Otazo, PhD, 4 Stephen R. Dager, MD, 5 and Jeffry Alger, PhD 6 MR spectroscopic imaging (MRSI) has become a valuable tool for quantifying metabolic abnormalities in human brain, prostate, breast and other organs. It is used in rou- tine clinical imaging, particularly for cancer assessment, and in clinical research applications. This article describes basic principles of commonly used MRSI data acquisition and analysis methods and their impact on clinical applica- tions. It also highlights technical advances, such as paral- lel imaging and newer high-speed MRSI approaches that are becoming viable alternatives to conventional MRSI methods. Although the main focus is on 1 H-MRSI, the principles described are applicable to other MR-compatible nuclei. This review of the state-of-the-art in MRSI method- ology provides a framework for critically assessing the clin- ical utility of MRSI and for defining future technical devel- opment that is expected to lead to increased clinical use of MRSI. Future technical development will likely focus on ultra-high field MRI scanners, novel hyperpolarized con- trast agents using metabolically active compounds, and ultra-fast MRSI techniques because these technologies offer unprecedented sensitivity and specificity for probing tissue metabolic status and dynamics. Key Words: MR spectroscopic imaging; chemical shift imaging; spatial and spectral encoding; spatial prelocali- zation; spectral quantification; echo-planar spectroscopic imaging; parallel imaging; compressed sensing; human; brain; breast J. Magn. Reson. Imaging 2013;37:1301–1325. V C 2012 Wiley Periodicals, Inc. MR SPECTROSCOPIC IMAGING (MRSI) is a widely available routine clinical imaging tool and clinical research tool for spatially mapping multiple tissue metabolites signals in vivo to characterize neurologi- cal, psychiatric and metabolic disease. This technol- ogy, which is available on many clinical MR scanners, has reached a remarkable degree of maturity in recent years and has stimulated considerable interest in clinical applications. The purpose of this article is to introduce the technological features of MRSI in a manner that can be readily understood and appreci- ated by the practicing radiologist who is not a physi- cist or MRS specialist. As most MRSI development and applications have been focused on the brain, MRSI (as well as MRS in general) is sometimes viewed as having importance only within the neuroradiologi- cal community. This article includes the description of MRSI applications that extend beyond the field of neuroradiology. Accordingly, the article is formulated with the general radiologist in mind and will introduce and explain key MR physics/technology concepts with this target audience in mind. It will also summarize key literature both in terms of physics concepts and the practical realization of these concepts for the clini- cal radiological examination. A variety of synonymous terms for MRSI, including Chemical Shift Imaging (CSI), Spectroscopic Imaging (SI) and Multivoxel Spectroscopy (or Multivoxel MRS), have been used in the literature and by scanner ven- dors. This article will use a single term (MRSI) to denote all of these. To a large extent, MRSI technology is built upon earlier work developing localized single voxel MRS (SV-MRS). First described by Brown et al in 1982 (1) and further developed by Maudsley et al in 1983 (2), MRSI increasingly is supplanting SV-MRS for clinical applications and research due to its ability to rapidly and simultaneously assess tissue spatial heterogeneity of chemical concentrations. However, several technical challenges currently limit more 1 Department of Neurology, University of New Mexico School of Medicine, Albuquerque, New Mexico, USA. 2 Department of Electrical and Computer Engineering, University of New Mexico, Albuquerque, New Mexico, USA. 3 Department of Physics and Astronomy, University of New Mexico, Albuquerque, New Mexico, USA. 4 Bernard and Irene Schwartz Center for Biomedical Imaging, New York University School of Medicine, New York, New York, USA. 5 Department of Radiology, University of Washington School of Medicine, Seattle, Washington, USA. 6 Department of Neurology, Department of Radiological Sciences, Interdepartmental Program in Biomedical Engineering, David Geffen School of Medicine at UCLA, University of California, Los Angeles, California, USA. Contract grant sponsor: NIH; Contract grant number: 1 R01 DA14178-01, RO1 EB00822, R01 MH081864, RC1 MH088507, RO1 NS036524, ARRA-1R01HD065283, 1P50 HD055782; Contract grant sponsor: the MIND Research Network (DOE Grant); Contract grant number: DE-FG02-99ER62764; Contract grant sponsor: the University of New Mexico School of Medicine Brain and Behavioral Illness Signature Program. *Address reprint requests to: S.P., Department of Neurology, The Uni- versity of New Mexico School of Medicine, 1 University of New Mexico, MSC 105620, Albuquerque, NM. E-mail: [email protected] Received January 24, 2012; Accepted October 11, 2012. DOI 10.1002/jmri.23945 View this article online at wileyonlinelibrary.com. JOURNAL OF MAGNETIC RESONANCE IMAGING 37:1301–1325 (2013) CME V C 2012 Wiley Periodicals, Inc. 1301
Transcript of MR Spectroscopic Imaging: Principles and Recent...

Invited Review
MR Spectroscopic Imaging: Principles andRecent Advances
Stefan Posse, PhD,1–3* Ricardo Otazo, PhD,4 Stephen R. Dager, MD,5
and Jeffry Alger, PhD6
MR spectroscopic imaging (MRSI) has become a valuabletool for quantifying metabolic abnormalities in humanbrain, prostate, breast and other organs. It is used in rou-tine clinical imaging, particularly for cancer assessment,and in clinical research applications. This article describesbasic principles of commonly used MRSI data acquisitionand analysis methods and their impact on clinical applica-tions. It also highlights technical advances, such as paral-lel imaging and newer high-speed MRSI approaches thatare becoming viable alternatives to conventional MRSImethods. Although the main focus is on 1H-MRSI, theprinciples described are applicable to other MR-compatiblenuclei. This review of the state-of-the-art in MRSI method-ology provides a framework for critically assessing the clin-ical utility of MRSI and for defining future technical devel-opment that is expected to lead to increased clinical use ofMRSI. Future technical development will likely focus onultra-high field MRI scanners, novel hyperpolarized con-trast agents using metabolically active compounds, andultra-fast MRSI techniques because these technologiesoffer unprecedented sensitivity and specificity for probingtissue metabolic status and dynamics.
Key Words: MR spectroscopic imaging; chemical shiftimaging; spatial and spectral encoding; spatial prelocali-
zation; spectral quantification; echo-planar spectroscopicimaging; parallel imaging; compressed sensing; human;brain; breastJ. Magn. Reson. Imaging 2013;37:1301–1325.VC 2012 Wiley Periodicals, Inc.
MR SPECTROSCOPIC IMAGING (MRSI) is a widelyavailable routine clinical imaging tool and clinicalresearch tool for spatially mapping multiple tissuemetabolites signals in vivo to characterize neurologi-cal, psychiatric and metabolic disease. This technol-ogy, which is available on many clinical MR scanners,has reached a remarkable degree of maturity in recentyears and has stimulated considerable interest inclinical applications. The purpose of this article is tointroduce the technological features of MRSI in amanner that can be readily understood and appreci-ated by the practicing radiologist who is not a physi-cist or MRS specialist. As most MRSI developmentand applications have been focused on the brain,MRSI (as well as MRS in general) is sometimes viewedas having importance only within the neuroradiologi-cal community. This article includes the descriptionof MRSI applications that extend beyond the field ofneuroradiology. Accordingly, the article is formulatedwith the general radiologist in mind and will introduceand explain key MR physics/technology concepts withthis target audience in mind. It will also summarizekey literature both in terms of physics concepts andthe practical realization of these concepts for the clini-cal radiological examination.
A variety of synonymous terms for MRSI, includingChemical Shift Imaging (CSI), Spectroscopic Imaging(SI) and Multivoxel Spectroscopy (or Multivoxel MRS),have been used in the literature and by scanner ven-dors. This article will use a single term (MRSI) todenote all of these. To a large extent, MRSI technologyis built upon earlier work developing localized singlevoxel MRS (SV-MRS). First described by Brown et alin 1982 (1) and further developed by Maudsley et alin 1983 (2), MRSI increasingly is supplanting SV-MRSfor clinical applications and research due to its abilityto rapidly and simultaneously assess tissue spatialheterogeneity of chemical concentrations. However,several technical challenges currently limit more
1Department of Neurology, University of New Mexico School ofMedicine, Albuquerque, New Mexico, USA.2Department of Electrical and Computer Engineering, University ofNew Mexico, Albuquerque, New Mexico, USA.3Department of Physics and Astronomy, University of New Mexico,Albuquerque, New Mexico, USA.4Bernard and Irene Schwartz Center for Biomedical Imaging, New YorkUniversity School of Medicine, New York, New York, USA.5Department of Radiology, University of Washington School ofMedicine, Seattle, Washington, USA.6Department of Neurology, Department of Radiological Sciences,Interdepartmental Program in Biomedical Engineering, David GeffenSchool of Medicine at UCLA, University of California, Los Angeles,California, USA.
Contract grant sponsor: NIH; Contract grant number: 1 R01DA14178-01, RO1 EB00822, R01 MH081864, RC1 MH088507, RO1NS036524, ARRA-1R01HD065283, 1P50 HD055782; Contract grantsponsor: the MIND Research Network (DOE Grant); Contract grantnumber: DE-FG02-99ER62764; Contract grant sponsor: theUniversity of New Mexico School of Medicine Brain and BehavioralIllness Signature Program.
*Address reprint requests to: S.P., Department of Neurology, The Uni-versity of New Mexico School of Medicine, 1 University of New Mexico,MSC 105620, Albuquerque, NM. E-mail: [email protected]
Received January 24, 2012; Accepted October 11, 2012.
DOI 10.1002/jmri.23945View this article online at wileyonlinelibrary.com.
JOURNAL OF MAGNETIC RESONANCE IMAGING 37:1301–1325 (2013)
CME
VC 2012 Wiley Periodicals, Inc. 1301

widespread clinical acceptance of MRSI. Furthermore,MRSI historically has required a high degree of usertraining and integration into clinical routine is nontri-vial. This article is specifically focused on MRSI technol-ogy. It does not summarize either the backgroundphysics or use of localized SV-MRS except where thereare important shared features or noteworthy differen-ces. It assumes that the reader is familiar with basicMRS concepts, such as chemical shift, J-coupling andmultiplet spectral patterns. It is also not feasible topresent a detailed review of the biological or clinicalrelevance of the detectable metabolite signals that canbe quantitatively mapped by MRSI, and which has beenextensively reviewed elsewhere (3). In addition to pre-senting basic principles, this article highlights recentadvances such as high-speed MRSI methods and MRSIwith parallel receiver array coils, which are becomingincreasingly relevant for clinical research applications.The main focus is on brain proton (1H)-MRSI, which iswell established, but the methods are applicable forother MR-compatible nuclei and tissue types and recentexamples of these applications are also presented.
GENERAL FEATURES OF MRSI
In general terms, MRSI uses the same phase encodingprocedures that are used in MRI to map the spatialdistribution of MR signals. In the case of 1H-MRSI,proton MR signals produced by metabolites within thetissue produce the signals that are imaged. The mo-lecular concentrations of these metabolites are atleast 10,000 times lower than water and metabolitesproduce correspondingly much lower signal strengthsthan does water, which is used to form conventionalMR images. To detect enough signal above noise forquantification 1H-MRSI must use much larger voxelsizes in comparison to MRI. Voxel volumes on the orderof 0.3 cc can be readily measured at 3T (4,5) and theuse of surface coils and array coils allows muchsmaller voxel volumes on the order of 0.1 cc (6), orsmaller. The lower spatial resolution of MRSI comparedwith anatomical imaging makes consideration of thespatial point spread function (PSF), correspondinglymore important. The PSF expresses the fact that thecombination of the phase-encoded imaging processand the image reconstruction process cause metabolitesignals that are produced by one tissue voxel to bleedinto the surrounding voxels, producing a blurringeffect. This is conceptually not different from conven-tional MRI, but is expressed on a larger spatial scale.The PSF can be responsible for spectral artifacts andsignificant partial volume effects. Spatial filtering isused in the reconstruction process to reduce between-voxel signal bleeding and to increase the signal-to-noise ratio (SNR), but increases the effective voxel size.MRSI can be time consuming to acquire, making itsensitive to motion artifacts, which in contrast to MRIare distributed across all acquired spatial dimensions.
MRSI is also highly sensitive to macroscopic mag-netic field inhomogeneity within a voxel and acrossthe volume of interest, which introduces regionallyvarying spectral line broadening. Typically, a spectralline width of less than 0.1 part per million (ppm) is
required for quantifiable MRSI data. Accordingly,MRSI studies may require sacrificing coverage of someanatomical regions having strong magnetic field inho-mogeneity. Unacceptable field homogeneity is usuallypresent at tissue-bone or tissue-air interfaces andsuch regions are difficult to study with MRSI. In theseregions SV-MRS may be the only choice.
In 1H-MRSI there are often artifacts related to waterand lipid signals that are related to field inhomogeneityand the PSF. Water produces a much larger signalthan the target metabolites. 1H-MRSI pulse sequencesuse frequency selective RF pulses to presaturate thewater signal, but magnetic field homogeneity associ-ated with interfaces can produce water signal that isfrequency shifted and the water suppression processwill not suppress water signal being produced by inter-face regions. Furthermore, water signal produced bysuch regions is broadened as well, which makes signalcontamination due to the blurring effect difficult toidentify. Lipid signals that are as much as 1000 timesstronger than metabolite signals can be produced bytissues that have a large fraction of adipocytes. Lipidsignals produced by such regions can also be problem-atic in terms of bleeding into nearby voxels. Becausethe problem of lipid and water signal bleeding can beso significant in 1H-MRSI, very precise spatial localiza-tion methods are required. Most 1H-MRSI pulsesequences use volume excitation procedures analo-gous to those used in SV-MRI to select a box shapedtissue region over which the field homogeneity is excel-lent and that does not contain adipose tissue. Alterna-tives are to presaturate regions that would producelarge lipid signal or have unacceptable field homogene-ity, or to use lipid nulling using the Short T1 InversionRecovery (STIR) (7). While improving overall resultsquality, prelocalization of a box-shaped region insidethe organ of interest can result in considerable loss ofvolume coverage in peripheral regions of the organ.
Furthermore, the majority of 1H-MRSI studies todate are still performed using intermediate to longecho time (TE) to attenuate lipid signals due to shortlipid signal T2 values. This is in part due to the diffi-culties of quantifying strongly overlapping multipletresonances at short TE. However, the use of long TEresults in substantially decreased sensitivity to themetabolite signals due to T2 loss and J-modulation ofmultiplet resonances. Improved localization perform-ance now allows MRSI mapping at much shorter TE,to measure J-coupled metabolites that have tradition-ally been measurable only with SV-MRS (8).
MRSI studies that involve nuclei other than protons,usually do not have problems corresponding to thelipid and water problems present in 1H-MRSI, but sig-nal strength in these studies is usually lower than in1H-MRSI and the volume resolution must be evenmore coarse and this engenders more concern regard-ing voxel signal bleeding.
SPECTROSCOPIC IMAGING ACQUISITIONAND RECONSTRUCTION
Conventional phase-encoded MRSI, in which thephase encoding gradient amplitude is incremented
1302 Posse et al.
once per TR, is the most commonly used MRSImethod and still represents the gold standard for sen-sitivity and for localization performance. This sectionprovides an overview of conventional phase-encodedand newer high-speed MRSI methods, compares theirperformance (acceleration, signal-to-noise per unitvolume and square root of unit measurement time,spectral width, spectral resolution, and point spreadfunction) and discusses technical challenges at highfield strength. A simplified description of methods ispresented without the k-space formalism to providean intuitive understanding that is fully adequate forclinical applications. The k-space formalism, whichprovides an overarching framework for linking thedifferent MRSI methodologies, will be added whereappropriate to provide a deeper understanding.
Phase-Encoded Spectroscopic Acquisition
As with all MRI methods, MRSI uses a modular pulsesequence design. Frequency encoding of spatial loca-tion using gradient application during the signaldetection period in the pulse sequence is not used inconventional MRSI, because doing so mixes the spa-tial and chemical shift information in a manner thatis difficult to disentangle. The use of phase encodingonly to obtain location information ensures completetemporal separation of spatial encoding from spectralencoding to avoid possible line broadening due to theapplication of gradients (except for effects from possi-ble eddy currents). Phase encoding merely modulatesthe signal phase and amplitude of the MR signalbefore detection of signal frequency (spectral encod-ing), which ensures that subsequent phase andamplitude modulation due to chemical shift is inde-pendent of spatial encoding. Data reconstruction is,therefore, straightforward using Fourier transforma-tions along the orthogonal spatial and spectral dimen-sions of the raw data matrix. Localization by phaseencoding (using constant phase encoding gradientduration) is also unaffected by chemical shift andmagnetic field inhomogeneity unlike readout encod-ing. In other words, image shape distortions due tofield inhomogeneity or chemical shift (e.g., fat–watershift) are not present in MRSI.
However, phase encoding must be performed in allspatial dimensions and is very time consuming. Thenumber of phase encoding steps corresponds to thetotal number of voxels in the spectroscopic image. Forexample, to acquire a 32 � 32 � 16 three-dimensional(3D) matrix using a TR of 2 s would require 32,768 s,or more than 9 h of encoding time, which is quiteunacceptable for human studies. Typical raw data 2Dmatrix sizes used in clinical research studies aremuch smaller: 16 � 16, 24 � 24, or 32 � 32 datapoint points, but still require substantial acquisitiontime using conventional MRSI.
To gain a deeper understanding of phase encoding,it is instructive to take a closer look at the relation-ship to readout (frequency) encoding. Readout encod-ing is a familiar concept that is straightforward toconceive of as a projection image along the directionof the readout gradient that is obtained by Fourier
transformation of the acquired signal. The readoutsignal consists of a series of data points that recordstepwise changes of signal phase and amplitude dur-ing the application of the readout gradient. Phaseencoding can be viewed as being equivalent to acquir-ing the readout signal on a data point by data pointbasis from separate measurements. This equivalenceis illustrated in Figure 1, which shows the transitionfrom readout to phase encoding. To center the ‘‘phaseencoding echo’’ in data space, the phase encodinggradient starts with negative amplitude and steps topositive amplitudes, which is comparable to using adephasing gradient to center the readout echo in MRI.Indeed, the gradient moment (¼ amplitude x duration)of the minimum (i.e., most negative) phase encodinggradient corresponds to the moment of the dephasinggradient. The difference between the moments ofthe maximum and the minimum phase encoding
Figure 1. Principles of MRSI. a–c: Equivalence of readout andphase encoding illustrated by stepwise transformation of read-out encoding into phase encoding. (b) Segmentation of the read-out gradient ‘‘G’’ into gradient pulses with interleaved collectionof single data points (red arrows). c: Collection of the same datapoints in separate experiments using phase encoding. d: Phaseencoding with constant gradient duration. e: Spatially periodicspin phase distribution along the direction of the phase encod-ing gradients; the spatial periodicity of the spin phase, which ischaracterized by the wavelength l, increases with the stepwiseincrease in the phase encoding gradient amplitude. f: Spectro-scopic imaging by combining phase encoding with a spectro-scopic readout; the amplitude and phase of the initial datapoint (red arrow) represents the spatial information embeddedin the spectroscopic signal. [Color figure can be viewed in theonline issue, which is available at wileyonlinelibrary.com.]
MR Spectroscopic Imaging 1303

gradients corresponds to the moment of the readoutgradient and determines spatial resolution. The incre-ment in gradient moment between phase encodinggradient steps corresponds to the increase in gradientmoment between digitization steps of the readout sig-nal and determines the encoded field-of-view (FOV).
K-t-Space in MRSI
The k-space formalism is an elegant description ofraw data space, which provides a unified frameworkfor the comparison of different spatial encoding meth-ods and which facilitates the analysis of localizationproperties and artifacts. K-space is formed by a set ofspatially periodic rotations of the spin phase acrossthe object that is generated in successive experimentsby the application of the phase encoding gradients(referred to as spin warp imaging) (9) (Fig. 1e). Theperiodic spin phase rotations, which are characterizedby the wavelength l, increase with the moment (am-plitude G � duration t) of the applied phase encodinggradients and range from infinity (no phase modula-tion at the center of k-space) to very rapid periodici-ties corresponding to the smallest features that arepresent in the object. The spatial frequency of thespin periodicities (¼ 1/l) is characterized as:
k ¼ 2p
l¼ gGt ½1�
The k-space formalism describes the structure ofthe spatially encoded data in form of a set of spatialfrequencies (the inverse of object space), which afterFourier transformation represents the image of theobject. Each data point in k-space corresponds to thesignal from the entire sensitive volume of the receivercoil and represents a unique spatial modulation of thespin phases of the entire object along the directions ofthe phase encoding gradients. The moment of thephase encoding gradients determines the phase rota-tion each spin experiences relative to the magnet cen-ter. It is this spatial distribution of spin phases gener-ated by the phase encoding gradients thatunambiguously identifies each point in the object andallows spatial reconstruction of an image. In MRSI,the time dimension corresponding to spectral encod-ing is encoded orthogonal to k-space to form k-t-space, which for 2-dimensional spatial encodingforms a 3-dimensional data space (ky-kx-t). Each k-t-space slice at a particular time point (a time slice) canbe reconstructed into an ‘‘image’’ by Fourier transfor-mation. Fourier transformation along the series ofconsecutive images generates localized spectra.
The MRSI signal of a chemical species with fre-quency v after the application of a phase encodinggradient is defined as:
Sðk; tÞ ¼Z
sðxÞeivtei2pkxdx ½2�
where s(x) is the spin density of the object along thevector direction x of the applied phase encoding gra-dients and k is the encoded spatial frequency. TheMR signals obtained with different phase encoding
steps completely characterize the spin density distri-bution of the object (a simple analogue is the opticalinterference pattern of a phonographic record thatunambiguously defines the music piece that isencoded in the groves of the record) and the spectralinformation content.
There are five simple rules that describe k-spaceencoding: (i) The extent of k-space determines spatialresolution. (ii) The spacing between successivesampled points (phase encoding increment, or stepsize) along a given k-space direction corresponds tothe encoded FOV along the corresponding spatialdirection. (iii) Coarse features of the object areencoded close to the center of k-space (low spatial fre-quencies). (iv) Details of the object are encoded at theperiphery of k-space (high spatial frequencies). (v) K-space in a spin echo experiment is (hermitian) sym-metric with respect to the center, i.e., data points onopposite sides of the center have identical amplitude,but complex conjugate phase. Encoding the entire k-space is thus redundant and partial Fourier encodingmight be considered to accelerate encoding, althoughmagnetic field inhomogeneities and other imperfec-tions limit this approach, as we will see below.
PSF and Acceleration of Phase Encoding
Spatial localization in MRSI cannot be characterizedwithout discussing the PSF, which describes thespread of signal from a point source into adjacentvoxels as a result of the finite extent of the encoded k-space, a direct consequence of the coarse spatial reso-lution of MRSI. For uniform k-space sampling, thePSF is a sinc (¼ sinx/x) function (the Fourier trans-form of the boxcar sampling window) with the fullwidth at half maximum being the linear voxel dimen-sion. For a point source in the center of the voxel thezero crossings of the PSF are exactly in the centers ofthe adjacent voxels, i.e., there is no signal spread toadjacent voxels and the image of the point source is asingle bright voxel (Fig. 2a). The situation is very dif-ferent for a point source located at the edge of a voxel,which leads to considerable spread of signals intoadjacent voxels (Fig. 2b). Note that the signal contami-nation has positive and negative contributionsdepending on the distance from the origin of the PSF,which can lead to very complex signal interference.For example, in 1H-MRSI the signal spread from aperipheral fat layer in the scalp that is located at theinterface of two adjacent voxels can leads to strongbaseline distortions in nonadjacent, even central,brain voxels. This so-called Gibbs ringing is also pres-ent in conventional MRI, in particular affecting edgeswith large image contrast, but it is less conspicuousthan in MRSI due to the considerably higher spatialresolution. To reduce Gibbs ringing for MRSI it is nec-essary to apply rather aggressive k-space filters in theimage reconstruction that suppress the outer regionsof k-space and correspondingly reduce spatial resolu-tion. Sinebell, Fermi and Hamming filter functions areexamples of commonly used k-space filters to controlspatial signal contamination. For a rectangulark-space matrix the extent of k-space along the
1304 Posse et al.

diagonals isffiffiffi2
plarger than along the principal axes,
which results in a narrower point spread function andincreased spatial resolution along the diagonals. As aconsequence, Gibbs ringing is stronger along the prin-cipal axes compared with the diagonals.
A frequently used strategy to accelerate phase-encoded MRSI is to sacrifice the higher spatial resolu-tion along the diagonal and to cut the k-space cornersto encode a spherical or an elliptical k-space, whichcan reduce measurement time by as much as 50% for3D encoding. The PSF for elliptical sampling is uniformalong all directions, but overall spatial contaminationand voxel size are increased compared with rectangularsampling. A further increase in encoding speed can beachieved when signal averaging is necessary for sensi-tivity reasons. Weighted averaging, in which fewer aver-ages are collected at peripheral k-space points com-pared with central k-space points, further reduces scantime, albeit at the expense of having increased high fre-quency noise relative to low frequency noise in thereconstructed spectroscopic image.
Magnetic Field Inhomogeneity and Effecton k-t-Space Encoding
It is instructive to consider the effects of magneticfield inhomogeneity, shimming and spatial resolutionon k-t-space encoding to understand the measuredsignal distribution in the acquired data space. Thek-space acquired at the center of the spin echo isperfectly (hermitian) symmetric on lines through theorigin of k-space. In a perfectly shimmed sphere,k-space is invariant along the time domain, i.e., theencoded k-space is identical for each time-slice andorthogonal to the time domain. However, a local gradi-
ent interferes with the phase encoding gradients andprogressively shifts the origin of k-space along thedirection of the local gradient during spectral encod-ing, as shown in Figure 3. The corresponding signalshifts in data space, which have been described asgroup spin-echo shifts in gradient echo imaging (10),shorten the measured signal decay along the spectraldimension and result in broadening of the recon-structed spectral lines. Linear gradients move the sig-nal (and the origin of the encoded k-space) along astraight line toward the edge of the encoded dataspace whereas nonlinear gradients disperse the signalin data space. As a result of local gradients, k-spaceencoding is no longer orthogonal to spectral encodingand becomes a function of space and spectral-encod-ing time. Shimming aims at reversing the effects oflocal gradients by reversing the signal shifts in dataspace to restore time-invariant k-space encoding.Increasing spatial resolution increases the extent ink-space, which allows divergent signals from regionswith magnetic field inhomogeneity to remain longerwithin the acquired data space, thus extending themeasured signal decay and narrowing the spectralline width in these regions.
High-Speed MRSI
Acceleration of 1H-MRSI is highly desirable to increasevolume coverage, reduce motion sensitivity anddecrease scan time, if SNR permits. High-speed MRSImethods are also advantageous for integrating highresolution MRS methods, such as correlation spec-troscopy (COSY) (11) and J-resolved spectroscopy
Figure 2. Point spread function in MRSI for (a) a point sourcelocated in the center of the voxel (x ¼ 0), which results in per-fect localization without any signal contamination in adjacentvoxels and (b) a point source located at the right edge of thevoxel (x ¼ 0.5), which results in a significant signal contamina-tion into adjacent voxels. [Color figure can be viewed in theonline issue, which is available at wileyonlinelibrary.com.]
Figure 3. K-t-space in MRSI and effect of magnetic fieldinhomogeneity. a: K-space is invariant along the time axis ina homogeneous magnetic field. The decay of the encoded sig-nals follows the time axis. b: K-space and the encoded signalmove outside of the encoded data space due to a global gra-dient along the y-direction, which accelerates the signaldecay and broadens spectral lines.
MR Spectroscopic Imaging 1305

(12), for 3D spatial mapping of gamma-amino-butyric-acid (GABA) using spectral editing (13) and for imple-menting elaborate phase cycling schemes into MRSI.The rapidly expanding field of hyperpolarized MRI hasinvigorated the development of ultra-fast MRSI encod-ing schemes with the goals of minimizing imageblurring and maximizing efficient use of the rapidlydecaying magnetization (14,15). Many of the fastMRSI methods are based on high-speed MRI methodsand largely fall into the following categories:
(i) Interleaving a series of repeated spatial readoutmodules during the spectral acquisition enables
simultaneous encoding of spatial and spectral
information with considerable increase in over-
all acquisition speed. The duration of the spa-tial readout modules determines the spectral
with and the duration of the train of readout
modules determines the spectral resolution.
Echo planar spectroscopic imaging (EPSI),which uses interleaving of 1D, 2D, and 3D spa-
tial echo-planar encoding into the spectroscopic
acquisition, was one of the earliest high-speed
MRSI approaches, originally developed byMansfield (16) and later adapted for human
applications (17–20). Advantages of EPSI
include an adequate spectral width at fieldstrengths up to 3 Tesla in the case of 1D echo-
planar encoding, a high spectral resolution and
high sensitivity comparable to conventional
MRSI, and the relative ease of data reconstruc-tion. Spiral MRSI, which uses interleaving of
2D or 3D spiral encoding during the acquisi-
tion, offers faster acceleration than EPSI due to
the higher efficiency of the spiral trajectory (21)and provides flexibility in shaping the point
spread function. However, data reconstruction
is more demanding than for EPSI and requirescorrection for stronger off-resonance effects.
Furthermore, the long duration of 2D and 3D
encoding modules limits the spectral width that
can be achieved in a single shot. Combinationwith echo time shifting (see below) can be used
to expand the spectral width.(ii) Shifting of the readout module position relative
to the spin echo time (echo time shifting) in sep-arate acquisitions is an alternate method forencoding of spectral information. The most ba-sic application of echo shifting is the Dixonmethod, which separates water and fat (22).High-speed 2D imaging methods, such as EPI,rapid acquisition with relaxation enhancement(RARE) or spiral MRI, have been combined withecho time shifting to rapidly map brain metabo-lites (23,24). This approach is time efficient forapplications that require only limited spectralresolution. However, achieving high spectral re-solution and large spectral bandwidth is timeconsuming and decreases SNR per unit time.
(iii) Multiple spin echo acquisition with separatephase encoding of individual spin echoes has
been developed to accelerate conventional MRSI(25,26). However, spectral resolution is reduceddue to the shortened readout, and k-spaceweighting due to T2 signal relaxation betweenthe individual spin echo acquisitions needs tobe corrected to minimize spatial blurring.
(iv) Parallel imaging using phased array coils hasbeen applied to conventional (27) and high-speed MRSI (28,29) to achieve considerableacceleration of spatial encoding, including sin-gle-shot 2D encoding (30). However, increasesin encoding speed need to be balanced withincreases in noise due to the reduced acquisi-tion time and g-factor related reconstructionerrors that can compromise spatial localizationand spectral quality. Recent developmentsusing compressed sensing (15), and the combi-nation of parallel imaging with compressedsensing (31), exploit the sparsity of spectralinformation to achieve even faster encodingspeed, but the increase in encoding speedneeds to be balanced with increases in g-factorrelated reconstruction errors.
(v) Steady-state free precession (SSFP) MRSI offersfast acceleration and high sensitivity per unittime, but the short spectroscopic readoutrequires sacrificing spectral resolution at 1.5Tand 3T (32,33). SSFP methods are also sensi-tive to off-resonance effects, which may limitvolume coverage. Recent studies combiningSSFP-MRSI with echo-planar or spiral encodingand with parallel imaging have demonstratedvery fast encoding speeds (34).
(vi) Sparse image-based k-space encoding schemes,such as spectral localization by imaging (SLIM)(35), and related approaches, have been pro-posed for situations where localization of asmall number of arbitrarily shaped compart-ments is desired. These methods can be timeefficient depending on the allowable amount ofspatial crosstalk between these compartments.However, typical applications are aimed at min-imizing cross-talk, which increases the numberof encoding steps required.
(vii) Hadamard encoding has been introduced forapplications where minimum voxel crosstalk isrequired (36,37). It makes use of multi-slice ra-diofrequency pulses with 0� or 180� phaseshifts for each slice that change from encodingstep to encoding step. A simple hadamard-encoded experiment that localizes two slicesconsists of one experiment in which the phasesof the two slices are both 0� and a secondexperiment in which the phases of the two sli-ces are 0� and 180�. Addition of the two datasets generates the signal of the first slice andsubtracting the two data sets generates the sig-nals of the second slice. However, the RF powerrequirements for multi-slice excitation limit thisapproach to small spatial matrix sizes.
To summarize, echo-planar and spiral encoding arethe most commonly used high-speed MRSI methods
1306 Posse et al.

due to their high spectral quality and sensitivity perunit time and unit volume that are comparable toconventional phase-encoded MRSI, but with substan-tially enhanced temporal resolution (19,38). As echo-planar MRSI is of considerable interest for clinicalapplications, we now discuss this method in moredepth.
Echo-Planar MRSI
1H-MRSI using echo-planar encoding is increasinglyused for brain research applications due to its robustlocalization performance and large volume coveragewith much improved spatial and temporal resolutioncompared with conventional phase-encoded MRSI.The advent of echo-planar imaging (EPI) has greatlyfacilitated the implementation of echo-planar MRSI onconventional clinical MRI scanners. Echo-planarMRSI has been implemented at field strengths rangingfrom 1.5 to 7 Tesla (39,40). The feasibility of wholebrain coverage has been demonstrated at intermedi-ate and long TE (5,41–43). Proton echo planarspectroscopic imaging (PEPSI) is a development ofecho-planar MRSI that enabled very short TE (e.g., 11ms) for 2D and 3D spatial mapping of singlet andJ-coupled metabolites in human brain with clinicallyfeasible acquisition times of less than 5 min(8,18,19,29,39).
Echo-planar encoding can be conceptualized asfollows: The relatively narrow spectral width of theproton spectrum (most resonances are within a 1 kHzrange at 3 Tesla) is typically sampled with a spectro-scopic dwell time on the order of 500 ms to 1 ms. Thisdwell time allows interleaving of echo-planar readoutgradients with alternating polarity between spectro-scopic data acquisition points (Fig. 4) to encodelocalized spectra that are spatially resolved in onedimension in a single excitation. Conventional phaseencoding is used for the 2nd and 3rd spatial dimen-sions. The echo-planar readout gradient train, which
encodes a zigzag trajectory in k-t-space, creates aseries of gradient echoes that are modulated by chem-ical shift evolution and relaxation. Reformatting thesedata into a 2-dimensional matrix creates a data for-mat that is equivalent to that of conventional phase-encoded MRSI. In practice, the even and odd echodata are not equivalent due to asymmetries in gradi-ent switching, eddy current induced signal distortionsand other factors, and direct Fourier transformationacross even and odd echoes would lead to ghostingartifacts in the spectral domain. Although correctionschemes for the shifts of the even and odd echoeshave been developed to minimize ghosting in thefrequency domain (20,40), separate reconstruction ofthe data from even and odd echo acquisitions hasemerged as the preferred reconstruction method thatavoids ghosting altogether (18). The flyback gradientscheme, which uses only the even gradients for spa-tial encoding and short gradient pulses with maxi-mum slew rate for refocusing, has been proposed asan alternative approach to avoid eddy current effectsand ghosting (41), but sensitivity is reduced due togaps in data acquisition during the flyback gradient.
The PSF and the manifestations of magnetic fieldinhomogeneity in k-t-space are similar to those withconventional phase-encoded MRSI. Geometrical dis-placement artifacts due to the interference of localgradients with the echo-planar readout gradients aretypically quite small due to the high amplitudes of thereadout gradients. However, inhomogeneity-relatedsignal displacements in k-t-space alternate along thereadout direction for positive and negative echo-pla-nar readout gradients, which leads to a zig–zag dis-placement of k-space along the time axis. Separationof even- and odd-echo data or the use of a flybackmethod avoids possible interference due to this zig–zag trajectory. EPSI is remarkably resilient againsteddy current artifacts that predominantly manifest asdistortions at the base of the spectral peaks. However,EPSI is sensitive to frequency drifts and spectral linebroadening due to gradient heating, which mayrequire frequency drift compensation (42).
Concerns have been raised regarding the sensitivityof EPSI, wherein the increase in acquisition band-width BW, which corresponds to the number of voxelsX in the readout dimension, introduces noise (�
ffiffiffiffiffiffiffiffiffiBW
p)
that reduces the SNR compared with conventionalMRSI. While this is true for an individual data trace,it must be borne in mind that the acquisition is accel-erated by a factor of N. Increasing the acquisitiontime to that of conventional MRSI by using signalaveraging increases SNR to that of conventional MRSI.In fact, sensitivity per unit time is similar to conven-tional phase encoding, provided that ramp samplingis used (38,43).
Volume Prelocalization
For most MRSI applications it is necessary to restrictthe volume selection for the following reasons: (i) Toavoid regions with strong static and radiofrequencymagnetic field inhomogeneity that distort spectrallines and create distant spectral artifacts due to Gibbs
Figure 4. Echo-planar spatial-spectral encoding. a: Conven-tional MRSI acquisition with sampling points indicated byred lines. The spacing between sampling points is the spec-troscopic dwell time (dt). b: Interleaving of pairs of echo-pla-nar readout gradients into the spectroscopic acquisitioncreates a series of even and odd gradient echoes.
MR Spectroscopic Imaging 1307

ringing. (ii) Constraining the acquired matrix size, inparticular with conventional phase encoding, may benecessary to achieve clinically acceptable scan times.(iii) For brain MRSI, it is necessary to suppress over-whelming peripheral lipid and water signals to preventspectral contamination inside the volume of interest,which requires robust prelocalization methods.
Single-shot selection of a rectangular volume of in-terest using point resolved spectroscopy (PRESS) (44)or stimulated echo acquisition mode (STEAM) (45) isthe most robust and frequently used form of volumeprelocalization. However, the positioning of a rectan-gular box selection within the brain prevents meas-urements in the lateral cortices and requires skill,because it does not conform to anatomical areas of in-terest. Outer volume suppression outside of the vol-ume selection may be added to improve suppressionof outside signals and to reduce the effects of chemi-cal shift displacement and flip angle variation in thetransition region at the edges of the volume selection,which for PRESS are particularly strong along thedirections selected by the refocusing RF pulses. Adia-batic refocusing RF pulses, which are used in thelocalized adiabatic spin-echo refocusing (Laser) andsemi-LASER MRSI pulse sequences (46,47), reducechemical shift displacement artifacts and B1-sensitiv-ity compared with conventional refocusing RF pulses,although at the expense of increased RF power depo-sition and longer minimum TE.
Localization methods that are more comparable toconventional MRI, and extend volume coverage intothe lateral cortices, include multi-slice acquisition (48)and slab selection with 3D encoding (18,49). Thesemethods enable very short TE when using spin echo orstimulated echo excitation (8,18). For 1H MRSI it isnecessary to add outer volume suppression, frequencyselective lipid suppression, lipid nulling, or a combina-tion thereof, to suppress lipid signals from the periph-ery (see below). Multi-slice acquisition is oftenadequate for studies of the upper cerebrum, but thelong spectroscopic readout at 1.5 and 3T limits thenumber of slices that can be measured within typicalTRs of 2–3 s unless spectral resolution is sacrificed(50). Multi-slice acquisition is attractive at 7T, becausethe duration of the spectroscopic signal acquisition isshorter and slice-specific dynamic shimming can beintegrated (51). Selection of a thick slab with 3D encod-ing enables greater volume coverage, higher spatial re-solution in the slice direction and at 1.5 and 3T it isSNR efficient compared with multi-slice acquisition.However, chemical shift displacement and flip anglevariation in the transition region at the edges of theslab leads to chemical shift dependence of the reso-nance amplitudes and complex J-modulation patterns,which reduces the number of useable slices. Due to RFpower constraints, the RF bandwidth of the excitationRF pulse is usually larger than that of the refocusingRF pulse, which further complicates J-modulation atthe edges of the slab. In regards of this consideration,the use of adiabatic refocusing RF pulses is advanta-geous, because they reduce chemical shift displace-ment artifacts and also minimize the effects of B1-inho-mogeneity across large volumes.
Outer volume suppression (OVS) using spatial pre-saturation (52–56) provides flexibility in shaping thevolume of interest and for the brain allows measure-ment of the lateral cortices, which is not feasible withPRESS or STEAM prelocalized MRSI. Overall lipidsuppression, although less efficient than with PRESSor STEAM prelocalization, is adequate for most MRSIapplications, if a sufficiently high spatial resolution isused to limit lipid contamination due to the pointspread function to voxels in the periphery (8). Fur-thermore, model-based spectral fitting, for exampleusing a linear combination of model spectra (LCMo-del) (57), is quite tolerant to baseline distortions dueto residual lipid signals. However, chemical shift dis-placement and flip angle variation in the transitionregion at the edges of the OVS slices need to be con-sidered when positioning the OVS slices, which favorsnarrow OVS slices for suppressing peripheral lipidcontaining regions. Challenges of outer volume sup-pression include compensation of T1 related signalrecovery during the application of a large number ofsuppression RF pulses, compensation of B1 sensitivityand minimization of signal refocusing due to second-ary echoes at the intersection of the suppression sli-ces. OVS can also be applied during the mixing time(TM) period in a STEAM pulse sequence (18) and inthe form of Spatially Selective Echo-Dephasing(SSED) RF pulses that are inserted around the refo-cusing RF pulse(s) in a spin echo or PRESS pulsesequence (58). These approaches reduce sensitivity toT1 dispersion among lipid signals and B1 inhomogene-ity. When combined with presaturation they providestrongly enhanced overall lipid suppression perform-ance. State-of-the-art OVS method development hasfocused on improving the suppression efficiency byoptimizing RF pulse design (59), gradient switchingschemes and timing of OVS modules, and localizedtuning of individual OVS RF pulses (19). Recently,Henning et al developed powerful T1- and B1-insensi-tive outer volume suppression methods with highlyselective broadband RF pulses to minimize chemicalshift displacement artifacts at high field (60,61).
A major challenge of spatial lipid suppressionapproaches is that precise (manual) placement of alarge number of OVS slices to cover peripheral regionswhile minimizing loss of cortical signals is required,which can also introduce operator-dependent andinter-subject variability of the VOI. Manual placementof OVS slices requires considerable skill and time tobalance the needs of completely covering peripheralbrain regions with a limited number of OVS slices (toconstrain T1-related losses in suppression) and mini-mizing the loss of lateral cortical brain regions whiletaking into consideration the OVS slice transitionbandwidth and chemical shift artifacts. Semi-auto-mated and automated methods for OVS placementthat are based on anatomical landmarks or segmenta-tion of high resolution MRI have been developed(Duyn et al [48], Venugopal et al [62], Ozhinsky et al[63]). We have proposed an iterative optimizationapproach to automatically place up to sixteen OVS sli-ces in peripheral regions using image segmentation(64). These automatic methods are capable of
1308 Posse et al.

accurate placement of OVS slices on a subject-by-subject basis, but they are sensitive to brain segmen-tation errors and local minima in optimization, whichaffects reliability and consistency, and they are stilltime consuming to apply in the clinical setting. Moti-vated by the increasing availability of statistical brainatlases for automated positioning of MR imaging sli-ces, and the proven high efficiency, robustness andprecision of this methodology (65,66), we recentlyintroduced a brain atlas-based approach for auto-mated positioning of up to 16 OVS slices that uses anaffine transformation of optimally positioned OVS sli-ces and the MRSI slab in atlas space (4) (Fig. 5),which is comparable in lipid suppression performanceto the iterative optimization approach, but faster. Inthe future, a nonplanar geometry of automated OVSslice prescription from nonlinear transformation maybe feasible using curved slice excitation with multi-dimensional RF pulses (67) to improve volume cover-age in lateral brain regions.
The STIR method (7) avoids the complications ofvolume preselection in whole brain 1H-MRSI and ena-bles encoding of metabolite signals in the lateral corti-ces in close proximity to peripheral lipid-containingregions (68). However, an approximately 30% sensitiv-ity loss in all metabolites is incurred at 3T and ele-vated lipid and macromolecular resonances that arevaluable for assessing brain lesions are not measura-ble. Furthermore, the efficiency of lipid nulling is lim-ited by the T1 dispersion between lipid resonances,which makes this method most suitable for intermedi-ate and long echo time (TE) acquisitions, althoughimplementations for short TE acquisition are underdevelopment (see Integration into Clinical Routine).The signal losses in the major metabolite resonancescan be minimized using a frequency-selective inver-sion recovery method that selectively inverts the majorlipid peaks (69). Frequency-selective suppression
using RF band selective inversion with gradientdephasing (BASING) (70) has been proposed as analternative and implementations have shown powerfulsuppression performance. However, disadvantagesof these techniques include a substantial increasein minimum TE, suppression of lactate and macromo-lecular signal originating from brain tissue andincreased sensitivity to static magnetic field (B0)- andRF field (B1) inhomogeneity that limit volumecoverage.
Standardization of volume prelocalization betweenmanufacturers is necessary to increase clinicalacceptance of MRSI. Reproducible and automatedprelocalization of major parts of the cerebrum and thecerebellum with negligible contamination from periph-eral lipids and acceptable spectral line width shouldbe the focus of such standardization.
Water Suppression in 1H MRSI
T1- and B1-compensated multi-pulse water suppres-sion schemes, such as water suppression enhancedthrough T1 effects (WET) (71) and water suppressionwith variable power RF pulses and optimized relaxa-tion delays VAPOR (72), are necessary to reduce thebroad baseline of the water signal, to minimize gradi-ent sideband artifacts and to avoid Gibbs ringing offrequency shifted water signals from regions withstatic magnetic field inhomogeneity. Static magneticfield inhomogeneity across large volumes requiresincreases in the water suppression bandwidth andleads to local frequency-shift dependent suppressionof resonances in the vicinity of the water peak. Inpractice, the residual water peak is distorted andvaries spatially in amplitude, which leads to substan-tial baseline variability that impairs metabolite quan-tification. Spatial-spectral water suppression pulsesthat can be applied in a slice selective manner allowfor narrower water suppression bandwidth for appli-cations using multi-slice MRSI sequences (73). Simul-taneous measurement of signals from unsuppressedwater and metabolites, a recent development whichhas been demonstrated for SV-MRS using highdynamic range digital receivers (74–76), would be de-sirable to avoid the complications of spectrally-selec-tive water suppression and to enable direct spectralquantification without a reference scan, but the tech-nical challenges are considerable.
SPECTRAL QUANTITATION
This section summarizes general approaches forquantifying MRSI data; there are recent reviews avail-able that provide detailed assessments of SV-MRSand MRSI analytic approaches (3,77). The goal is totransform the signal intensity measurement into ameasure of tissue metabolite concentration referencedto the volume (mol/mL) or the mass (mol/g) of tissuebeing studied. It could also refer to the volume, massor amount of water in the tissue being studied. Tissuequantification typically requires a tissue content anal-ysis (78). For instance it is usually assumed that cell-
Figure 5. Automated prelocalization of the MRSI volume ofinterest in reference to a brain atlas. The MRSI slab andouter volume suppression slices are optimally positioned inthe Montreal Neurological Institute brain atlas. An affinetransformation based on the spatial normalization of thesubject’s brain into the atlas space enables automated place-ment of the MRSI slab and outer volume suppression slicesin subject space.
MR Spectroscopic Imaging 1309

free body fluids (e.g., ventricles or sulci in the brain)produce no metabolite signal and such regions shouldnot be included in the concentration estimation. Par-tial volume correction, based on tissue masks fromhigh resolution MRI that are convolved with the MRSIPSF to determine the water fraction of a particularvoxel, is used to compute metabolite concentrations.
MRSI quantitation is typically performed separatelyfor each voxel in the reconstructed data set as astraightforward extension of techniques developed forSV-MRS. With MRSI the number of voxel spectra areso large that automated methods for spectral prepro-cessing and spectral fitting are required (79). Forinstance, local frequency shifts due to inhomogeneousB0 field require correction to avoid errors in spectralassignment, which is challenging in the presence ofregionally varying spectral patterns and low SNR. Theproblem is exacerbated when there are lesions presentthat produce uncharacteristic spectra and when nui-sance signals, such as poorly suppressed water signalor lipid signal in 1H-MRSI, distort the spectrum. For1H-MRSI, an unsuppressed ‘‘water reference’’ MRSIscan is usually obtained as a reference for spectralquantification and to measure the spatial distributionof the B0 field, which can be used to correct the fre-quency offsets of each of the voxel spectra in thewater suppressed MRSI measurement. The phase ofthe water reference MRSI can also be used to correctthe zero order phase in the water suppressed spectra.However, the water signal may not be usable as a ref-erence in all tissue compartments. For instance, inthe breast the water signal in adipose tissue may bevery small.
The use of array coils introduces coil dependentsignal strength and phase characteristics in eachspectrum. It remains somewhat controversial how tooptimally recombine the spectral information arrivingfrom each of the array elements although severalapproaches have been proposed (80–83). Knowledgeof what combination procedure was used can be im-portant if measures of different voxels from an MRSIdata array are being compared or if the study involvesacross-subject quantitation. Spectral quantificationshould also take into consideration chemical shiftdependent signal attenuation due to chemical shiftdisplacement at the edges of the volume selection,and flip angle variations across the volume selection,which change J-coupling patterns, but this is techni-cally challenging.
Quantitation must include correction for T1 relatedsignal saturation and T2 relaxation of the metabolitesignals and the water reference signal in the differenttissue compartments, which is derived from the pulsesequence timing and RF pulse characteristics thatthe pulse sequence uses (8,84). The MRSI PSF is usedfor correcting relaxation effects in different tissuecompartments within a voxel. Ideally, T1 and T2 of therelevant metabolite signal should be measured onan individual basis to avoid a biased metabolite con-centration determination (85–87), but this is rarelyperformed in clinical MRSI studies due to time con-straints. Some calibration approaches report onlynormalized concentration, which is equivalent to the
true concentration multiplied by a relaxation factor(68,79). An alternate strategy is to reduce the impactof T1 relaxation correction by using long TR, which isfeasible with high-speed MRSI at the expense of onlyminor reduction in sensitivity, and to use short TE toreduce the effects of T2 relaxation.
Absolute concentration estimates are usuallyobtained by calibration of the measured metabolitesignal against a reference signal produced by a mate-rial having a known concentration because MRI scan-ners are generally not designed to measure absolutesignal levels. The reference signal for spectral quanti-tation may be generated by a metabolite, by water orby some other chemical compound in a phantomobject (88). Calibration using near-tissue phantoms(i.e., phantoms that are outside the subject’s bodyand imaged together with the subject) is usedinfrequently due to several practical implementationproblems related to B0 inhomogeneity and B1 inhomo-genity. Calibration using a signal produced by areplacement phantom object, which is imaged beforeor after the subject examination, avoids some of thepractical problems associated with using near-tissuephantoms, but can also have pitfalls related to differ-ences in coil loading and to relaxation time differencesbetween the metabolite signal and the reference sig-nal. Calibration against an internal signal (i.e., onethat is produced by the tissue but has a reasonablywell known concentration or is assumed to beunchanging) is, therefore, used in most studies. Typi-cally, the internal reference signal used in 1H-MRSI iseither the principal Creatine (Cr) signal (3.05 ppm) orthe water signal (4.69 ppm). However, disease relatedchanges in Cr and tissue water might bias quantifica-tion. If the water signal is used as a calibration signal,its amplitude must be measured by performing a sep-arate MRSI study without water suppression, which istime consuming with conventional MRSI, or by inter-leaving the reference scan into the water-suppressedscan. Fast MRSI acquisition technology enables rapidacquisition of reference scans for both long TE MRSI(79,89) and short TE MRSI (8). One useful feature ofMRSI is that the reference signal can come from anytissue region from within the imaged field of view,provided that transmit and receive sensitivities arespatially uniform or known from prior sensitivitymeasurements. This enables the investigator to, forinstance, calibrate the entire data set against a refer-ence signal measurement made in a tissue region thatappears normal on MRI and is not involved in the dis-ease process under study. More accurate quantifica-tion also requires correction for differences in NMRvisibility of tissue water in different tissue types usingtissue segmentation based on high resolution MRI(e.g., gray and white matter regions in the brain).
The choice of method to determine the signal ampli-tude in MRSI studies has typically depended on thedegree of spectral complexity, the signal overlapwithin individual voxel spectra and the degree of spec-tral artifacts. For long-TE 1H-MRSI, J-modulationand T2 signal decay tend to produce a situation inwhich only the prominent singlet signals can bedetected above noise and straightforward signal
1310 Posse et al.

integration can be used to obtain signal amplitude.For carbon-13 (13C)-MRSI, the signals of interest areusually well enough separated due to the excellentchemical shift dispersion of 13C-MRS that straightfor-ward signal integration can also be used. For shortTE 1H-MRSI and phosphorus-31 (31P)-MRSI, it hasbecome commonplace to assume that the tissue spec-trum is represented by a ‘‘spectrum model’’, which isthe sum of many complex-valued signals arising frommany metabolites. ‘‘Optimization’’ or ‘‘fitting’’ softwareis then used to repetitively adjust the frequencies,phases and amplitudes of the signals until a simu-lated model that agrees with the observed data isfound. Typically, spectral fitting techniques make useof well-established least squares optimization proce-dures that are used to solve analogous optimizationproblems in other scientific and engineering fields.The spectral models used by these software packagesfall into two broad categories (90). The model may bea group of individual signals each of which has itsown signal frequency, peak width, phase and ampli-tude. An alternative approach, which was first imple-mented by LCModel for in vivo 1H-MRS, uses a modelthat recognizes that the individual metabolites aremost correctly modeled as a singlet and multiplet pat-tern of signals produced by each proton in the mole-cule (57). Spectral fitting approaches operate either inthe time domain (79,91–95) or the frequency domain(96–99). Most of these software packages were devel-oped for SV-MRS at a time before MRSI was widelyavailable. The most popular spectral fitting software iscurrently LCModel (57). It uses a Bayesian approachto include prior information (e.g., soft constraints forlipids and macromolecules) and regularization ofbaseline estimation to stabilize fitting results in thepresence of spectral artifacts from residual water andlipid signals. It also uses Bayesian learning to getstarting estimates and ‘‘soft constraints’’ for the first-order phase correction and the frequency shift fromthe preceding (often better) central voxels or the (oftenpoorer) outer voxels.
Region-of-interest analysis using averaging of singlevoxel results, which capitalizes upon the large num-ber of voxels obtained using MRSI, can substantiallyimprove sensitivity. It has been shown that averagingthe raw data from individual voxels before applyingLCModel fitting provides improvement in SNR com-pared with averaging concentration values from indi-vidual voxels, which is a result of reduced bias inbaseline estimation and spectral fitting of J-coupledresonances when increasing the SNR in the raw data(100). However, spatial correlations between spectraas a result of the point spread function and spatial fil-ters may limit actual gains in SNR.
The results of MRSI quantification are thus oftenstill examined by visual inspection of the localizedspectra on a voxel-by-voxel basis, which is time con-suming and may create bias. This approach alsomakes interpretation of regional differences in metab-olite concentration and referencing to anatomy diffi-cult. Recent advances in high-speed 1H-MRSI providesufficient spatial resolution to allow reconstruction ofmetabolite images with coarse anatomical features
that can be referenced to high resolution MRI. Forbetween-group studies it is necessary to spatiallytransform metabolite images into a common anatomi-cal reference frame represented by a brain atlas (101),which requires the use of 3D MRSI.
Color-coded metabolite images can be overlaid onhigh-resolution MRI for visualization. Image interpola-tion is usually applied to make the metabolite mapsacceptable for viewing, but the introduced spatialsmoothing may be misleading. Furthermore, metabo-lite maps may have a very large dynamic range, whichis difficult to display. Standardization of spectral proc-essing and display of metabolite maps between manu-facturers is necessary to increase clinical acceptanceof MRSI. Deconvolution of the baseline and fitting ofoverlapping multiplet resonances at short echo timesare particularly challenging and critical processingsteps. These processing steps are handled differentlyby the various MRS processing packages and shouldbe the focus of such standardization.
Quality control is an important aspect of MRSI.Physiological motion may produce variations in signalphase and frequency, which reduces the expectedSNR enhancement during signal averaging due to de-structive averaging, and it creates ghosting in thephase encoding direction(s) that may lead to unex-pected spectral artifacts anywhere in the spectro-scopic images. Efforts to address this problem usingmotion correction based on navigator signals haverecently been published (102–104).
INTEGRATION INTO CLINICAL ROUTINE
Spatial Resolution, Volume Coverage, andSpectral Specificity in the Brain at 3T
MRSI has been most successful in the brain due tofavorable field homogeneity conditions, the ease ofimmobilizing the head and highly sensitive signaldetection using close fitting volume coils and surfacecoil arrays. We highlight advances in echo-planarMRSI using PEPSI and related techniques, becausethese are representative for the current state-of-the-art of 1H MRSI techniques at 3T.
The high sensitivity of 1H-MRSI and use of sensitivesurface coil arrays in combination with high-speedMRSI enables metabolite mapping with the spatialresolution approaching that of functional MRI todelineate gray–white matter differences in metaboliteconcentration. Figure 6 shows examples of mappingJ-coupled resonances with 4.5 mm in-plane resolu-tion using PEPSI at short echo time (15 ms) in ahealthy volunteer. The combined Glutamateþ Gluta-mine (Gluþ Gln) map shows gray–white mattercontrast, which follows the sulcal pattern seen in thecorresponding high resolution MRI. The Cr map alsoshows gray–white matter contrast and the Choline(Cho) map shows an inverse contrast as well as higherCho concentration in anterior brain regions comparedwith the posterior brain.
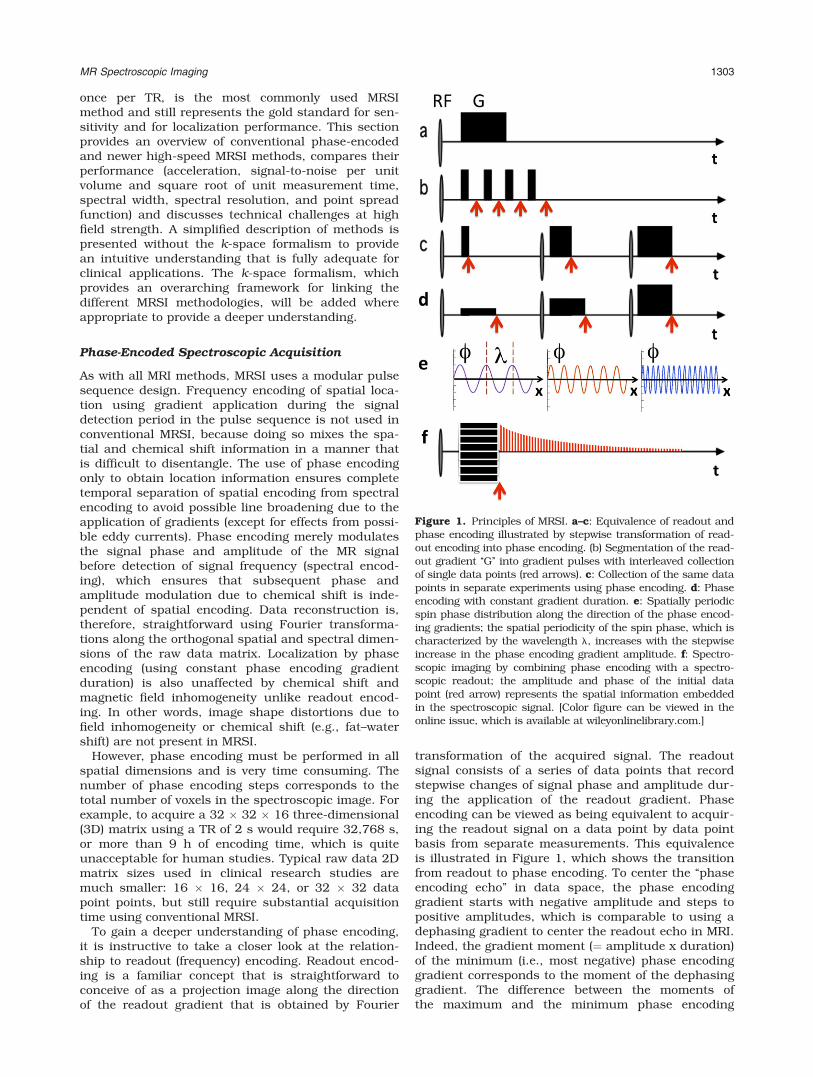
Maudsley and colleagues have developed clinicallyfeasible whole brain metabolite mapping for brainusing 3D EPSI at intermediate echo times (70 ms)with scan times of 26 min (68,101). Figure 7 shows
MR Spectroscopic Imaging 1311

examples of metabolite maps measured in a singlesubject at intermediate TE and averaged results froma group study, which dramatically increases sensitiv-ity and reveals previously unattainable tissue contrastin metabolite maps. Figure 7 also shows preliminaryresults from the same laboratory that demonstratethe feasibility of whole brain mapping at short TE(20 ms).
Mapping of neurotransmitters, such as Glu andGABA, is of considerable interest for characterizingneurological and psychiatric disease. The Glu multip-let is strongly overlapping with the Gln multiplet at3T, and even at 4T, when line broadening is present,which makes it difficult to obtain independent con-centration estimates for each of these molecules,although their sum (labeled Glx) can be estimated.
Figure 6. High spatial resolution mapping of J-coupled metabolites in human brain at 3 Tesla using short TE (15 ms) pro-ton-echo-planar-spectroscopic-imaging (PEPSI). a: Localized spectrum in central gray matter with spectral fit using LCModelsoftware (red). b: High-resolution MRI, partial volume and relaxation-corrected metabolite images, and signal-to-noise-ratiomap (SNR). Data were acquired with 4.5 mm in-plane resolution and 15 mm slice thickness (0.3 cc voxel size) in a supraven-tricular slice location using a 32-channel array coil and 32 min acquisition time. [Color figure can be viewed in the onlineissue, which is available at wileyonlinelibrary.com.]
1312 Posse et al.
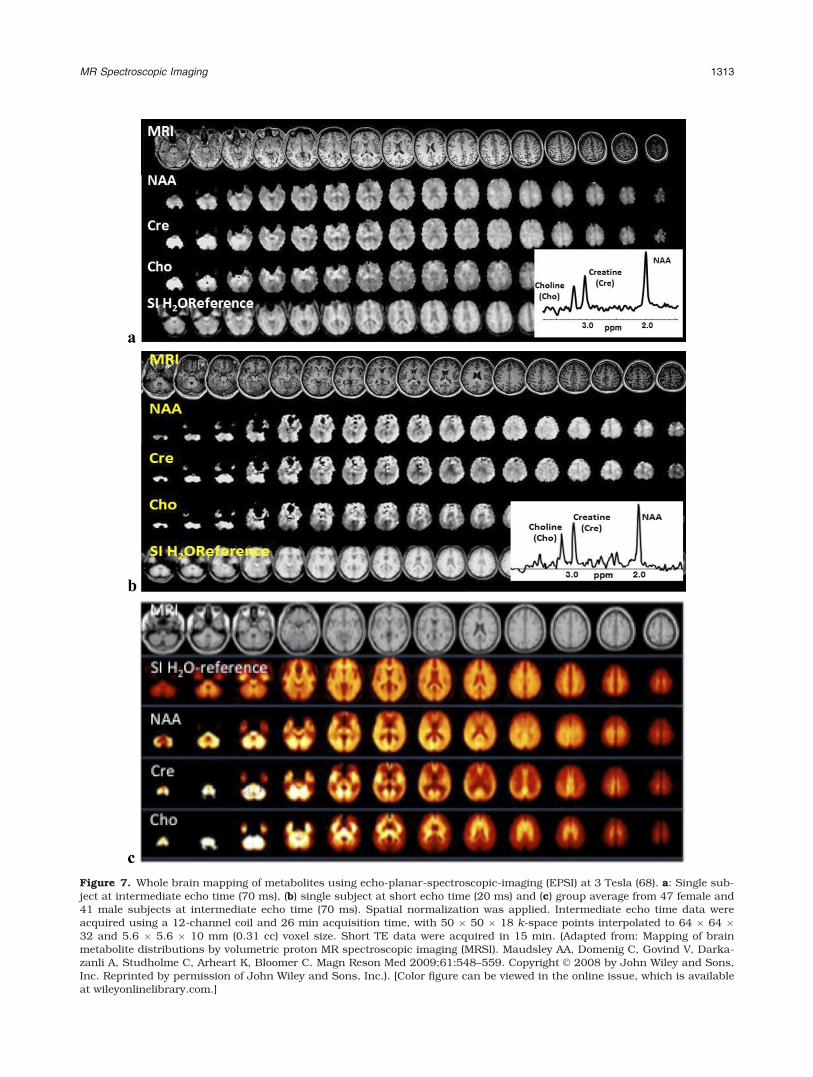
Figure 7. Whole brain mapping of metabolites using echo-planar-spectroscopic-imaging (EPSI) at 3 Tesla (68). a: Single sub-ject at intermediate echo time (70 ms), (b) single subject at short echo time (20 ms) and (c) group average from 47 female and41 male subjects at intermediate echo time (70 ms). Spatial normalization was applied. Intermediate echo time data wereacquired using a 12-channel coil and 26 min acquisition time, with 50 � 50 � 18 k-space points interpolated to 64 � 64 �32 and 5.6 � 5.6 � 10 mm (0.31 cc) voxel size. Short TE data were acquired in 15 min. (Adapted from: Mapping of brainmetabolite distributions by volumetric proton MR spectroscopic imaging (MRSI). Maudsley AA, Domenig C, Govind V, Darka-zanli A, Studholme C, Arheart K, Bloomer C. Magn Reson Med 2009;61:548–559. Copyright VC 2008 by John Wiley and Sons,Inc. Reprinted by permission of John Wiley and Sons, Inc.). [Color figure can be viewed in the online issue, which is availableat wileyonlinelibrary.com.]
MR Spectroscopic Imaging 1313

MRSI studies of Glu have used spectral fitting at shortTE (105), J-refocused coherence transfer (106), andmore recently, 2D J-resolved MRSI using TE-averag-ing (12), which enables selective mapping of Glu.However, the wide range of echo times in TE-averagedMRSI limits the sensitivity gains at high field, asmetabolite T2 values decrease with field strength, andthey are time consuming to perform with conventionalphase-encoded MRSI. Echo-planar MRSI techniqueshave emerged as the preferred approach to reduce thelong encoding times of TE-averaged MRSI (12,107).Figure 8 shows a comparison of TE-averaged 3DPEPSI with short TE 3D PEPSI at 3T. A 3D acquisitionwith slab-selection was chosen, because selecting acentral slice within the slab avoids chemical shift dis-placement and flip angle variation at the edge of theMRSI slab that change J-coupling patterns andreduce sensitivity for detecting Glu. Data wereacquired using identical voxel size (1 cc), but 2 timeslonger acquisition time for TE-averaged PEPSI due tothe large number of TE averaging steps required. De-spite the longer acquisition time of TE-averagedPEPSI, the Cramer-Rao lower bounds (CRLBs) for Gluwere significantly larger than for short TE PEPSI and
the number of voxels with Glu above threshold in theTE-averaged data was significantly smaller than forshort TE data. Short TE acquisition thus provideshigher sensitivity for mapping Glu in clinical studies,but spectral overlap with Gln in regions with spectralline broadening can compromise spectral specificity.TE-averaged acquisition is complementary to short TEacquisition for selectively mapping Glu, albeit at lowerspatial resolution and/or longer measurement times.
Noninvasive and quantitative mapping of regionalGABA concentrations in human brain by means ofMRSI is an important development for noninvasivestudy of biochemical pathways in neuropsychiatricand neurological disorders and mechanisms of treat-ment. On clinical 3 T MRI systems, single voxelMEGA-PRESS has gained in popularity over the pastyears as an editing technique and has become avail-able as a research package on most MR scanners.Feasibility of spectroscopic imaging with multi-quan-tum filtering (MQF) (108), two-dimensional J-spec-troscopy (109) and J-difference editing has been dem-onstrated (110). However, these approaches havebeen limited to a single slice due to the use of conven-tional phase-encoding. Recently, using a combining
Figure 8. The 3D glutamate mapping in human brain comparing TE-averaging versus short TE acquisition at 3 Tesla. a:MRI, metabolite maps and central spectra with spectral fit using LCModel software. b: Quantification of metabolites in centralslice showing slice averages of metabolite ratio with respect to Cr, Cramer-Rao lower bounds (CRLB), number of voxels abovea CRLB threshold of 50%, spectral line width and signal-to-noise-ratio. TE averaged 3D PEPSI data were acquired with TR:1.5 s and 8 echo times ranging from 15 to 165 ms with 20 ms steps using 27-min 30-s scan time. Short TE (15 ms) 3DPEPSI data were acquired with TR: 1.5 s, 4 averages and 13 min 48-s scan time. Spectral fitting was performed with simu-lated basis sets. [Color figure can be viewed in the online issue, which is available at wileyonlinelibrary.com.]
1314 Posse et al.

the MEGA editing scheme with the PEPSI spatial-spectral encoding method enabled 3D GABA mappingwith a 3.4 cc voxel size and 18 min of scan time, dem-onstrated in Figure 9 (13).
Clinical MRSI Applications in Brain
There are substantial benefits from using MRSI meth-ods for clinical investigations that include rapidity ofdata acquisition from multiple anatomical regionssimultaneously that allows both systematic appraisalof anatomical relationships to symptom expressionand ease of application for difficult to examine clinicalpopulations. Rapid 1H-MRSI methods, such as PEPSI,enabled 2D and 3D regional mapping of dynamic met-abolic changes in human brain in response to robustphysiological challenges such as hyperventilation (39)or the more subtle metabolic effects of caffeine inges-tion (111) on a time scale of minutes.
1H-MRSI has been extensively used for diagnosisand treatment-follow up of brain tumors. Most of thepublished studies have used 2D MRSI at short andlong TE, and 3D-MRSI at long TE. Figure 10 showspreliminary results of 3D metabolite mapping at shortTE (15 ms) in a patient with an oligodendrogliomausing the PEPSI technique with 7 mm isotropic spa-tial resolution and 10-min scan time including thewater reference scan. The data show a typical tumorspectrum in the anterior part of the lesion, stronglipid signals in a more posterior section of the lesion,and edema characterized by high water concentrationand narrow spectral line width further posterior to the
lesion. The short scan time of the PEPSI methodenabled integration into a multi-modal presurgicalmapping protocol that included high resolution MRI(MPRAGE and T2-TSE), diffusion tensor imaging,task-activation fMRI, resting state fMRI and a GABAedited 2D PEPSI scan.
Brain MRSI studies have sought to investigate theunderlying pathophysiology for a variety of neurologi-cal and psychiatric disorders, as recently reviewed(112). One such investigation, currently underway, isthe application of 3D MRSI techniques to characterizethe changing pattern of regional brain tissue metabo-lite levels longitudinally in infants at high genetic riskfor autism spectrum disorder (ASD). ASD is a com-mon developmental disorder estimated to affect up to1 percent or more of individuals worldwide (113). It iscurrently diagnosed on the basis of behavioral mani-festations of severe social and communication deficitsand ritualistic-repetitive behaviors that are typicallydetectable in early childhood and continue through-out the lifespan. There is substantial interest inapplying imaging modalities to understand the neuro-pathology underlying symptom expression and toidentify biomarkers for early diagnosis that mightallow targeted early intervention, shown to be usefulfor altering the course of ASD. An intriguing MRI find-ing from studies of preschool-aged children with ASDis the identification of cerebral enlargement of 9–12%as the most characteristic brain structural finding atthat early age. In conjunction with cerebral enlarge-ment, widespread anatomical distribution of metabo-lite alterations are observed, primarily reduced brainchemical concentrations per unit tissue volume, andprolonged metabolite T2 relaxation, that are inconsis-tent with earlier theoretical models of abnormal apo-ptotic mechanisms that would predict diffuselyincreased neuronal packing density in young childrenwith ASD (114,115). As reviewed recently (116), MRSpatterns of abnormal chemical levels found in manystudies of ASD, particularly reduced n-acetyl-aspar-tate (NAA), suggest differences in neuronal integrity ordensity that could reflect pathological process, suchas intracellular inflammation, that may impact synap-tic function, potentially in conjunction with specificgenetic vulnerabilities. An example short TE 3D PEPSIdata set (32 � 32 � 8 matrix - acquisition time of 5.5min) and a 2D GABA-edited PEPSI data set (32 � 32matrix – acquisition time of 8.5 min) measured in a13-month-old at high-risk for ASD are shown inFigure 11.
Metabolite Mapping in the Breast
The addition of a total Choline (tCho) measurementusing SV-MRS to a standard MRI workup of breastcancer was reported to improve lesion characteriza-tion, thus improving the limited specificity ofdynamic contrast enhanced (DCE) MRI (117). SV-MRS has also been used in patients undergoing neo-adjuvant chemotherapy to predict treatmentresponse (118). MRSI has the potential advantageover SVS of assessing lesion heterogeneity and re-gional treatment response, which is advantageous in
Figure 9. The 3D mapping of GABA in human brain usingPEPSI with MEGA-editing at 3 Tesla. a: Difference spectrumfrom supraventricular gray matter with spectral assign-ments. b: GABA maps from 3 slices within the MRSI slaband representative spectra from voxel locations shown in theaxial MRIs. Acquisition parameters: TR/TE: 2 s/68 ms, spa-tial matrix: 32 � 32 � 8, voxel size: 1.5 � 1.5 � 1.5 cm3,scan time: 18 min. [Color figure can be viewed in the onlineissue, which is available at wileyonlinelibrary.com.]
MR Spectroscopic Imaging 1315
multi-focal and multi-centric disease. However, thestrong magnetic field inhomogeneity in the breastand the small water peak in adipose tissue makeshimming across the entire breast challenging. Moststudies using MRSI have, therefore, used PRESS vol-ume preselection around the lesion(s) to maximizespectral quality, which, however, limits volume cov-erage. Furthermore, magnetic field inhomogeneitychanges due to respiration introduce periodic fre-quency shifts that create ghosting artifacts, necessi-tating the use of navigator-based correction of fre-quency changes. Using PEPSI and a custom-designed spectral quantification method at 3 Tesla,Figure 12 shows an example of 3D mapping of tChoin a patient with biopsy confirmed multi-focal inva-sive ductal carcinoma grade 3 (119).
A recent study using heteronuclear MRS at 7 Teslademonstrated the feasibility of monitoring neoadju-vant chemotherapy using 3D 31P MRSI to map adeno-sine and other nucleoside triphosphates, inorganicphosphate, phosphocholine, phosphoethanolamineand their glycerol diesters, which were detected inglandular tissue as well as in tumor, over the entirebreast (120), as shown in Figure 13.
Metabolite Mapping in Prostate and Other Organs
Over the past few years, MRSI has emerged as a use-ful complement to structural MRI for evaluation ofprostate cancer (121). MRS-detectable cancer bio-markers and biochemicals in the prostate include ci-trate, creatine, polyamines, and choline. In spectra
Figure 10. The 3D metabolite mapping in a patient with a brain tumor at 3 Tesla using short TE (15 ms) PEPSI. a: Localizedspectra in the periphery of the tumor show elevated Choline and lipid peaks. Decreased Creatine and NAA, and strongly ele-vated lipid peaks are measured in the center of the tumor. b: T2-weighted MRI, metabolite maps and water reference scandemonstrate spatial heterogeneity of the lesion. Data were acquired in 10 min including water reference scan using 32 � 32� 8 spatial matrix and 7 mm isotropic voxel dimensions (0.34 cc voxel size). [Color figure can be viewed in the online issue,which is available at wileyonlinelibrary.com.]
1316 Posse et al.

taken from regions containing a significant mass ofcancer cells, citrate and polyamines are significantlyreduced or absent, while choline is elevated. The 3DMRSI enables efficient mapping of the entire prostateat high spatial resolution with scan times of less than10 min using elliptical sampling (122). MRSI is usuallyperformed with PRESS volume selection and outer vol-ume suppression to avoid strong lipid signals from tis-sues around the prostate. The use of an endorectal coil
is preferred over the body array for sensitivity reasonsand because it immobilizes the prostate.
Applications of MRSI in the heart are challengingdue to motion artifacts. 1H-MRSI is particularly chal-lenging due to poor shimming conditions andunavoidable heart movement during the long spectro-scopic readout. 31P-MRSI has been applied for morethan two decades to measure cardiac energy metabo-lism (123). Applications of MRSI in muscle are
Figure 11. shows a PEPSIstudy at 3 Tesla in a 13-month-old infant at high-riskfor Autism Spectrum Disorder.a: 3D short TE (15 ms) acqui-sition encompassing the cere-bellum with voxel size ¼ 0.34cc acquired in 5.5 min. The3D spectral array on the left isa subregion from a singleslice, as shown in red in themiddle figure, with the entire3D volume shown on theright. b: GABA-edited 2-DPEPSI MRSI acquired from thecerebrum in 8.5 min withvoxel size ¼ 4 cc, showing aclearly resolved GABA peak at3ppm. [Color figure can beviewed in the online issue,which is available atwileyonlinelibrary.com.]
Figure 12. The 3D mapping of choline,a biomarker of breast cancer, in apatient with multifocal invasive ductalcarcinoma grade 3 using PEPSI withMEGA lipid suppression and PRESSvolume selection at 3 Tesla. a: Spec-trum from the lesions in slice 4 withelevated choline and residual lipid sig-nals. b: Corresponding voxel locationsuperimposed on high resolution MRI.The white box indicates the PRESS vol-ume selection. c: Dynamic contrastenhanced subtraction images and chol-ine maps. Data acquisition parameters:TR/TE: 2 s/136 ms, matrix size: 32 �8 � 8 voxels, voxel size: 1 cc, acquisi-tion time including water referencescan: 10 min. [Color figure can beviewed in the online issue, which isavailable at wileyonlinelibrary.com.]
MR Spectroscopic Imaging 1317

primarily aimed at mapping lipids using short TE 1H-MRSI and at measuring energy metabolism using 31PMRSI. A recent study combined COSY with echo-pla-nar encoding to improve spectral specificity by sepa-rating cross peaks arising from the skeletal muscleintramyocellular lipids and extramyocellular lipidssaturated and unsaturated pools (124).
ADVANCED TOPICS
Field Strength Dependence
The SNR and spectral resolution of MRSI increasewith increasing field strength. For in vivo applicationsusing the 1H nucleus, a linear gain of SNR theoreti-cally predicted with increasing field strength (125) hasbeen experimentally demonstrated in vivo (43,126–129). Improved spectral resolution can be observed athigher field strengths due to increased chemical shiftdispersion and reduced higher-order coupling effects(130). Coupled metabolites in the human brain, suchas Glu and Gln, are more easily resolved at 4 Teslaand 7 Tesla compared with 1.5 Tesla and 3Tesla(8,131,132). The spectral linewidth in ppm decreaseslinearly with respect to the field strength using PEPSIat 1.5, 3, 4, and 7 Tesla (43).
Increased SNR and spectral resolution in MRSI canimprove the performance of metabolite quantification,or may be traded for shorter acquisition times or higherspatial resolutions. There are, however, many factorsthat may reduce the expected SNR and spectral resolu-tion improvements at higher field, such as longer T1
relaxation times that lead to saturation-related signal
losses, line broadening due to magnetic susceptibilityeffects, shorter T2 relaxation times that require shorterTE acquisition to maintain sensitivity, constrained RFpower deposition and limitations in the design of homo-geneous RF coils. Implementation of high-speed MRSIat ultra-high field (7 Tesla and beyond) is challengingdue to limitations in gradient slew rate, which affectssensitivity and limits spectral width. Spatial prelocaliza-tion becomes a major challenge at high field due toincreased B1 inhomogeneity, limited B1 amplitudes andincreased specific absorption rate (SAR), which con-strains RF pulse performance and elongates the mini-mum TE and TR compared with 3 Tesla. The increase inB0 inhomogeneity at ultra-high field (i.e., at 7 Tesla andbeyond) is a challenge for shimming that limits the sen-sitive volume. Some of these limitations were addressedin a recent MRSI study at 7 Tesla, which used multi-slice FID-based localization to minimize sensitivitylosses due to limitations in RF pulse performance andSAR constraints (51). Using slice-specific B0- and B1-shimming to optimize spectral line width and outer vol-ume suppression performance this study demonstratedhigh sensitivity and considerable improvement in spec-tral quality compared with previous MRSI studies at 7Tesla (Fig. 14). Slice- and slab-specific higher-order B0
shimming and B1 shimming are thus expected tobecome indispensible for ultra-high field MRSI.
Figure 13. A 31P MRSI obtained from a patient with breastcancer during chemotherapy (120). Phosphomonoesters (PE),phosphodiesters (GPE, GPC), and inorganic phosphate (Pi) canbe mapped in 3D over the breast at a spatial resolution of 10cc in an acquisition time of 20 min at 7 Tesla (a). The elevatedPE levels in the tumor before treatment (b) return to similar lev-els as in glandular tissue (b) during chemotherapy as reflectedby the colored overlay of the PE level over the lipid suppressedMRI of the human breast (b–d). Only one slice of the 3D dataset is shown (Courtesy: Dr. Dennis Klomp and Dr. Vincent O.Boer - University Medical Center Utrecht, Utrecht, the Nether-lands). [Color figure can be viewed in the online issue, which isavailable at wileyonlinelibrary.com.]
Figure 14. Multi-slice spectroscopic imaging of the humanbrain at 7 Tesla with an eight-element transmit coil (51). a: MRIwith overlaid slice locations and one of the five slices with voxellocations. b: Corresponding spectra, where differences in theglutamate and choline and creatine ratios are apparent. In theWM the NAAG signal can be seen as a small shoulder on theright side of the NAA peak. The stable macromolecular signalindicates the high degree of lipid suppression even without in-plane volume selection and at a very short TE (2.75 ms). c:Supraventricular slice. d: Corresponding Glu/NAA map show-ing GM/WM contrast. Five slices with a 25 � 25 matrix wereacquired in 18 min (Courtesy: Dr. Dennis Klomp and Dr. Vin-cent O. Boer - University Medical Center Utrecht, Utrecht, theNetherlands). [Color figure can be viewed in the online issue,which is available at wileyonlinelibrary.com.]
1318 Posse et al.

Ultimately, the development of RF hardware and acqui-sition methods that account for these limitations will beneeded to more fully reap the benefits of high-fieldMRSI. Already, parallel transmission techniques, whichcombine multi-coil excitation and RF pulse design, haveemerged as powerful tools to deal with B1 inhomogene-ities while controlling SAR at high field (133,134).
Coil Arrays and Parallel Imaging
The use of multiple receiver coils increases signal sensi-tivity and introduces additional spatial encoding capa-bilities, which enable image acquisition to be acceler-ated by reducing the number of required phase-encoding points. Parallel imaging techniques, such assimultaneous acquisition of spatial harmonics (SMASH)(135), sensitivity encoding (SENSE) (136) and general-ized autocalibrating partially parallel acquisitions(GRAPPA) (137), exploit the difference in spatial sensi-tivity among receiver coils to reconstruct an unaliasedimage from regularly undersampled k-space data frommultiple coils. Parallel imaging has been successfullyapplied to accelerate conventional phase-encodedMRSI (27), turbo-spin-echo MRSI (26), and PEPSI(28,29,138). Acceleration in parallel imaging is limitedby noise amplification due to reduced number ofphase-encoding points and instability in the inversereconstruction produced by overlapped coil sensitivities(i.e., the so-called g-factor). Several approaches areavailable to decrease the SNR penalty and thusincrease the acceleration capability, such as the use ofhigh-field systems, coil arrays with large numbers ofelements, and regularization of the inverse reconstruc-tion problem. High-field systems increase the baselineSNR and reduce g-factor noise amplification due to thestronger spatial modulation of the coil reception profiles(139). The performance of parallel imaging increaseswith the number of coil elements, particularly for 3Dimaging where multiple dimensions are available foracceleration, at least up to the g-factor limits imposedby electrodynamic constraints (140,141). Accelerationfactors of 2–3 were reported for 2D MRSI using stand-ard coil arrays with 8–12 elements (28,138), and up to8 for 3D MRSI using a 32-element coil array (29).
The acceleration offered by parallel imaging techni-ques can be used to reduce total scan times and thusincrease patient comfort and reduce sensitivity tomotion, or can be exchanged for increased volumetriccoverage and/or higher spatial resolutions dependingon the available SNR. Figure 15 shows 2D metaboliteconcentration maps using PEPSI data acquired withacquisition times as short as 12 s using 5-fold SENSEacceleration. Parallel imaging techniques have alsoenabled single-shot MRSI based on the PEPSI tech-nique, where echo-planar spatial-spectral encodingwas combined with interleaved phase-encoding andSENSE reconstruction to perform 2D metabolic map-ping within a single excitation (30).
The increased encoding capabilities of many-ele-ment coil arrays have enabled the use of alternativek-space undersampling patterns that are not feasiblewith standard few-element coil arrays. MRSI using asingle phase-encoding step was proposed in the
inverse-PEPSI technique by performing an imagereconstruction similar to that in magnetoencephalog-raphy (MEG) (142). The price to pay for these extremelevels of acceleration is reconstruction with low spa-tial resolution as dictated by the degree of variation ofthe coil sensitivity maps. An intermediate approachbetween standard parallel imaging and inverse imag-ing was presented in the superresolution SENSE(SURE-SENSE) method (140,141,143), where intra-voxel coil sensitivity variations were exploited toincrease the spatial resolution of low-resolutionacquisitions. Acquiring a low-resolution image insteadof a single phase-encoding point reduces the severeill-conditioning in the inverse imaging method andreconstruction with higher spatial resolution is feasi-ble with SURE-SENSE at the expense of decreasingthe high acceleration factor. SURE-SENSE enablesacceleration along the readout dimension for echo-planar trajectories, which is not feasible with stand-ard parallel imaging techniques, and it is particularlyuseful for reducing lipid contamination, which is oneof the main challenges in short-TE MRSI.
Compressed Sensing
In vivo MRSI data are characterized by limited spectralinformation, which is in part due to line broadeningand signal relaxation. For example, long TE data andhyperpolarized MRSI data contain only a small numberof spectral components that can be described with fewparameters. Such spectra are called sparse and can beacquired with fewer data points than traditional meth-ods using under-sampled acquisition and reconstruc-tion methods such as compressed sensing. Com-pressed sensing is a recently developed fast imagingmethod that exploits sparsity of medical images toreconstruct under-sampled data (144). Instead ofacquiring the fully-sampled image and compressing itafterward (standard compression), compressed sensingapplies the fact than an image is usually sparse underan appropriate basis and reconstructs this sparse rep-resentation from undersampled data. The number ofrequired samples in practice is approximately 3–5times the number of sparse coefficients, which repre-sents a substantial acceleration if the number ofsparse coefficients is much less than the total numberof points (144). The same principle can be applied inthe spectral domain.
13C-MRSI is a promising technique for testing differ-ent metabolic pathways to study normal metabolismand characterize disease physiology (145). However,13C-MRSI suffers in a particularly acute manner fromlow signal sensitivity, resulting in long acquisitiontimes due to the need to perform averaging, and largevoxel sizes to obtain spectra with adequate SNR. Theuse of hyperpolarized compounds has been demon-strated to boost signal sensitivity for 13C-MRSI (146).For example, SNR gains of over 40,000 were demon-strated for [1-13C]-pyruvate. However, highly acceler-ated acquisitions are required to measure metabolicinformation during the short decay period of enhancedpolarization, which is on the order of tens of seconds.One powerful constraint that can be exploited to
MR Spectroscopic Imaging 1319

further accelerate data acquisition is the sparsity of13C spectra. Compressed sensing was applied toincrease the spatial resolution of 13C-MRSI data usingan echo-planar trajectory with random sampling alongthe phase-encoding dimensions (15,147).
The application of compressed sensing in MRSI isnot limited to 13C and can also be used to accelerate1H-MRSI, given an appropriate sparsifying transformand randomized undersampling pattern to generatethe required incoherent aliasing artifacts. Moreover,compressed sensing can be combined with otheracceleration techniques to further increase theacceleration rate. For example, the combination ofcompressed sensing and parallel imaging was demon-strated to provide higher acceleration rates for PEPSI(31), which in turn can be exploited to enable previ-ously not possible combinations of total scan time,volumetric coverage and spatial resolution.
CONCLUSIONS
MRSI has benefitted from the rapid development ofclinical MRI technology that introduced techniquessuch as prospective motion correction, higher-orderdynamic B0 shimming, B1-shimming, parallel imagingwith large scale array coils and compressed sensing,all of which have been or are in the process of beingadapted for MRSI. High-speed MRSI in combinationwith high field strengths and sensitive array RF coilsnow enable shorter acquisition times and increasedspatial resolution, along with improved anatomicalcoverage compared with conventional phase-encodedMRSI methods. Conventional phase-encoded MRSIwill continue to be the standard for clinical MRSI forsome time, but it is restricted to applications in whichlimited volume coverage or low spatial resolution areacceptable.
Figure 15. Simulated SENSE accelera-tion of 2D PEPSI data acquired at 3Tesla using a 32-channel array. a: Slicelocalization. b: Spectra with LCModel fitfrom central gray matter with up to5-fold acceleration (Ry), which corre-sponds to an effective acquisition timeof 12 s. c: Metabolite maps of Choline,Creatine and Glutamate with up to 5-fold acceleration. Acquisition parame-ters: TE: 15 ms, TR: 2 s, 32 � 32 ma-trix, voxel size: 1.1 cc, acquisition time:64 s. [Color figure can be viewed in theonline issue, which is available atwileyonlinelibrary.com.]
1320 Posse et al.

High-speed 1H-MRSI is well suited to replace con-ventional 1H-MRSI in the brain where acceptablemagnetic field homogeneity can be achieved and largevolume coverage and high spatial resolution are desir-able. Echo-planar based techniques enable 3D map-ping with whole brain coverage in scan time on theorder of 15 min, and partial brain coverage in scantimes of less than 10 min. Combining high-speedMRSI with parallel imaging enables whole brain cover-age with scan times of less than 10 min. Integrationof recently developed motion and dynamic shim cor-rection methods is desirable to reduce motion arti-facts that are often underestimated in clinical MRSI.Fully automated and reproducible setup of MRSI vol-ume selection and outer volume suppression slices isnow feasible for brain MRSI studies and adaptationfor other organs should be explored. Further improve-ments of the performance of outer volume suppres-sion RF pulses for application in the brain arerequired to achieve consistent lipid suppression in pe-ripheral areas and to enable short TE acquisition,which is desirable at high field to maximize sensitiv-ity. It is also desirable to automatically reconstructand quantify spectroscopic images on the scanner im-mediately after the scan to enable online quality con-trol and to facilitate integration into clinical routine.
MRSI can be used at any field strength, but the lin-ear increase in sensitivity with field strength favorsthe highest field strength that is suitable for clinicalstudies. The 3 Tesla scanners, which are widely avail-able and technologically mature, are currently thepreferred platform for MRSI. 4 Tesla and 4.7 Tesla arefield strengths that offer substantial gains in sensitiv-ity compared with 3 Tesla, they are quite compatiblewith the current state-of-the-art in clinical hardware,and B1-inhomogeneity is moderate, but the clinicalmanufacturers unfortunately do not support thesefield strengths. 7 Tesla scanners are developing rap-idly to overcome the technical challenges of B0 and B1
inhomogeneity and gradient performance limitations.It is expected that volumetric mapping of J-coupledmetabolites in the brain with improved spatial resolu-tion comparable to that of PET scanning in clinicallyacceptable measurement times will become feasible.These advances have the potential to significantlychange the clinical impact of MRSI and stimulatenovel research applications.
Most 1H-MRSI studies in the brain focus on quanti-fication of myo-Inositol, Cho, Cr, and NAA (and Lac),which are the most easily measured brain metabo-lites. In the future, it is anticipated that a much widerrange of J-coupled metabolites will be robustly meas-ured, such as GABA, Glutamate, and Glutamine,reflecting the continuing improvements in scannerhardware technology at high field strength. Novel met-abolic contrasts available with hyperpolarized MRIthat enable real-time mapping of enzymatic reactionrates will have considerable impact on future applica-tions of MRSI and technology development. We antici-pate that while spectral quantification will remain animportant goal for clinical MRSI, increases in spatialresolution approaching that of fMRI and coregistra-tion with anatomical MRI will have considerable
impact on clinical acceptance. Single voxel spectros-copy will remain an important tool for measuringmetabolites that are not detectable with MRSI for sen-sitivity reasons and for measurements in regionswhere magnetic field inhomogeneity degrades spectralquality in MRSI.
MRSI has been most successful for characterizingbrain diseases. The strong metabolic changes in braintumors and multiple sclerosis are striking examples ofMRSI applications, which are useful for guiding ther-apy (e.g., presurgical mapping or chemotherapy). Stud-ies of psychiatric disease are perhaps the most chal-lenging applications of MRSI, because they requireextremely stable and reproducible measurements ofminute changes in metabolite concentration. It is alsoimportant to remember that MRSI should not be seenin isolation, but as part of a multi-modal imagingapproach that maximizes information per unit time. Assuch, an MRSI protocol is complementary to other mo-lecular imaging techniques, including PET.
However, barriers remain that hamper the accep-tance of MRSI as a clinical modality. For example, thewide range of MRSI techniques that are used for clini-cal applications, which makes comparisons betweenstudies difficult and reflects a situation that is similarto the early days of single voxel MRS. Consensusregarding the preferred encoding and prelocalizationmethods is only slowly emerging. There is a lack ofstandardization of quantification methods, which isnot uncharacteristic for a methodology that reliesheavily on modeling and on a priori information. Moregenerally, MRSI is technically challenging in mostclinical settings and requires special training, whichlimits widespread acceptance. For some time theseperceived limitations and the perceived lack of innova-tive ideas to move the field forward have impacted fed-eral funding in the US for MRSI method developmentand clinical applications, and discouraged young sci-entist to make a career in MRSI. Increased standardi-zation facilitated by the technical advances describedabove will encourage large-scale controlled studies todocument the clinical impact of MRSI on diagnosisand treatment outcome, requisite for MRSI becomingreimbursable by major insurance carriers.
ACKNOWLEDGMENT
We gratefully acknowledge the contributions of ourcolleagues, and former and present team memberswho participated in the development and applicationof high-speed MRSI: Elena Ackley, Dr. Patrick Bolan,Dr. Linda Casey, Dr. Muhammad Omar Chohan,Dr. Zoneddy Dayao, Dr. Ulrike Dydak, Dr. StephenEberhardt, Dr. Bruce Fisch, Dr. Pierre-Gilles Henry,Dr. Sang-Joon Lee, Dr. Fa-Hsuan Lin, Dr. LesleyLomo, Susan Lopez, Dr. Malgorzata Marjanska,Dr. Manel Martinez Ramon, Dr. Ashwani Rajput,Dr. Melanie Royce, Dr. John Russell, Dr. Laurel Sil-lerud, Dr. Shang-Yueh Tsai, Dr. Jun S. Xu,Dr. Howard Yonas, Akio Yoshimoto, Dr. Guang DiYung, Dr. Chenguang Zhao, Dr. Tongsheng Zhang,and Dr. Weili Zheng. We thank Dr. Andrew Maudsleyand Dr. Mohammed Sabati from the Department of
MR Spectroscopic Imaging 1321

Radiology, Miller School of Medicine University ofMiami, FL, and Dr. Dennis Klomp and Dr. Vincent O.Boer from the University Medical Center Utrecht,Utrecht, the Netherlands for contributing figures andsharing preliminary results.
REFERENCES
1. Brown TR, Kincaid BM, Ugurbil K. NMR chemical shift imagingin three dimensions. Proc Natl Acad Sci U S A 1982;79:3523–3526.
2. Maudsley AA, Hilal SK, Perman WH, Simon HE. Spatiallyresolved high resolution spectroscopy by ‘‘four-dimensional’’NMR. J Magn Reson (1969) 1983;51:147–152.
3. Alger JR. Quantitative proton magnetic resonance spectroscopyand spectroscopic imaging of the brain: a didactic review. TopMagn Reson Imaging 2011;21:115–128.
4. Yung KT, Zheng W, Zhao C, Martinez-Ramon M, van der KouweA, Posse S. Atlas-based automated positioning of outer volumesuppression slices in short-echo time 3D MR spectroscopicimaging of the human brain. Magn Reson Med 2011;66:911–922.
5. Maudsley AA, Domenig C, Sheriff S. Reproducibility of serialwhole-brain MR spectroscopic imaging. NMR Biomed 2010;23:251–256.
6. Noworolski SM, Nelson SJ, Henry RG, et al. High spatial resolu-tion 1H-MRSI and segmented MRI of cortical gray matter andsubcortical white matter in three regions of the human brain.Magn Reson Med 1999;41:21–29.
7. Bydder GM, Young IR. MR imaging: clinical use of the inversionrecovery sequence. J Comput Assist Tomogr 1985;9:659–675.
8. Posse S, Otazo R, Caprihan A, et al. Proton echo-planar spectro-scopic imaging of J-coupled resonances in human brain at 3and 4 Tesla. Magn Reson Med 2007;58:236–244.
9. Edelstein WA, Hutchison JM, Johnson G, Redpath T. Spin warpNMR imaging and applications to human whole-body imaging.Phys Med Biol 1980;25:751–756.
10. Posse S. Direct imaging of magnetic field gradients by groupspin-echo selection. Magn Reson Med 1992;25:12–29.
11. Mayer D, Dreher W, Leibfritz D. Fast echo planar based correla-tion-peak imaging: demonstration on the rat brain in vivo. MagnReson Med 2000;44:23–28.
12. Srinivasan R, Cunningham C, Chen A, et al. TE-averaged two-dimensional proton spectroscopic imaging of glutamate at 3 T.Neuroimage 2006;30:1171–1178.
13. Dydak U, Xu JS, Marjanska M, Posse S. 3D GABA spectroscopicimaging using MEGA-PEPSI. In: Proceedings of the 19th AnnualMeeting of ISMRM, Montreal, Canada, 2011. (abstract 1428).
14. Mayer D, Levin YS, Hurd RE, Glover GH, Spielman DM. Fastmetabolic imaging of systems with sparse spectra: applicationfor hyperpolarized 13C imaging. Magn Reson Med 2006;56:932–937.
15. Hu S, Lustig M, Chen AP, et al. Compressed sensing for resolu-tion enhancement of hyperpolarized 13C flyback 3D-MRSI.J Magn Reson 2008;192:258–264.
16. Mansfield P. Spatial mapping of the chemical shift in NMR.Magn Reson Med 1984;1:370–386.
17. Webb P, Spielman D, Macovski A. A fast spectroscopic imagingmethod using a blipped phase encode gradient. Magn ResonMed 1989;12:306–315.
18. Posse S, DeCarli C, Le Bihan D. Three-dimensional echo-planarMR spectroscopic imaging at short echo times in the humanbrain. Radiology 1994;192:733–738.
19. Posse S, Tedeschi G, Risinger R, Ogg R, Lebihan D. High-speedH-1 spectroscopic imaging in human brain by echo-planar spa-tial-spectral encoding. Magn Reson Med 1995;33:34–40.
20. Metzger G, Hu XP. Application of interlaced Fourier transform toecho-planar spectroscopic imaging. J Magn Reson 1997;125:166–170.
21. Adalsteinsson E, Irarrazabal P, Topp S, Meyer C, Macovski A,Spielman DM. Volumetric spectroscopic imaging with spiral-based k-space trajectories. Magn Reson Med 1998;39:889–898.
22. Dixon WT. Simple proton spectroscopic imaging. Radiology1984;153:189–194.
23. Guimaraes AR, Baker JR, Jenkins BG, et al. Echoplanar chemi-cal shift imaging. Magn Reson Med 1999;41:877–882.
24. Norris DG, Dreher W. Fast proton spectroscopic imaging usingthe sliced k-space method. Magn Reson Med 1993;30:641–645.
25. Duyn JH, Moonen CT. Fast proton spectroscopic imaging ofhuman brain using multiple spin-echoes. Magn Reson Med1993;30:409–414.
26. Dydak U, Pruessmann KP, Weiger M, Tsao J, Meier D, BoesigerP. Parallel spectroscopic imaging with spin-echo trains. MagnReson Med 2003;50:196–200.
27. Dydak U, Weiger M, Pruessmann KP, Meier D, Boesiger P. Sensi-tivity-encoded spectroscopic imaging. Magn Reson Med 2001;46:713–722.
28. Lin FH, Tsai SY, Otazo R, et al. Sensitivity-encoded (SENSE)proton echo-planar spectroscopic imaging (PEPSI) in the humanbrain. Magn Reson Med 2007;57:249–257.
29. Otazo R, Tsai SY, Lin FH, Posse S. Accelerated short-TE 3D pro-ton echo-planar spectroscopic imaging using 2D-SENSE with a32-channel array coil. Magn Reson Med 2007;58:1107–1116.
30. Posse S, Otazo R, Tsai SY, Yoshimoto AE, Lin FH. Single-shotmagnetic resonance spectroscopic imaging with partial parallelimaging. Magn Reson Med 2009;61:541–547.
31. Otazo R, Sodickson D, Yoshimoto A, Posse S. Accelerated protonecho-planar spectroscopic imaging using parallel imaging andcompressed sensing. In: Proceedings of the 18th Annual Meet-ing of ISMRM, Honolulu, Hawaii, 2009. (abstract 331).
32. Dreher W, Geppert C, Althaus M, Leibfritz D. Fast proton spec-troscopic imaging using steady-state free precession methods.Magn Reson Med 2003;50:453–460.
33. Schuster C, Dreher W, Geppert C, Leibfritz D. Fast 3D 1H spec-troscopic imaging at 3 Tesla using spectroscopic missing-pulseSSFP with 3D spatial preselection. Magn Reson Med 2007;57:82–89.
34. Dreher W, Erhard P, Leibfritz D. Fast three-dimensional protonspectroscopic imaging of the human brain at 3 T by combiningspectroscopic missing pulse steady-state free precession andecho planar spectroscopic imaging. Magn Reson Med 2011;66:1518–1525.
35. Hu X, Levin DN, Lauterbur PC, Spraggins T. SLIM: spectrallocalization by imaging. Magn Reson Med 1988;8:314–322.
36. Goelman G, Subramanian VH, Leigh JS. Transverse Hadamardspectroscopic imaging technique. J Magn Reson (1969) 1990;89:437–454.
37. Gonen O, Hu J, Stoyanova R, Leigh JS, Goelman G, Brown TR.Hybrid three dimensional (1D-Hadamard, 2D-chemical shiftimaging) phosphorus localized spectroscopy of phantom andhuman brain. Magn Reson Med 1995;33:300–308.
38. Pohmann R, von Kienlin M, Haase A. Theoretical evaluation andcomparison of fast chemical shift imaging methods. J MagnReson 1997;129:145–160.
39. Posse S, Dager SR, Richards TL, et al. In vivo measurement ofregional brain metabolic response to hyperventilation usingmagnetic resonance: proton echo planar spectroscopic imaging(PEPSI). Magn Reson Med 1997;37:858–865.
40. Hanson LG, Schaumburg K, Paulson OB. Reconstruction strat-egy for echo planar spectroscopy and its application to partiallyundersampled imaging. Magn Reson Med 2000;44:412–417.
41. Cunningham CH, Vigneron DB, Chen AP, et al. Design of fly-back echo-planar readout gradients for magnetic resonancespectroscopic imaging. Magn Reson Med 2005;54:1286–1289.
42. Ebel A, Maudsley AA. Detection and correction of frequencyinstabilities for volumetric 1H echo-planar spectroscopic imag-ing. Magn Reson Med 2005;53:465–469.
43. Otazo R, Mueller B, Ugurbil K, Wald L, Posse S. Signal-to-noiseratio and spectral linewidth improvements between 1.5 and 7Tesla in proton echo-planar spectroscopic imaging. Magn ResonMed 2006;56:1200–1210.
44. Ordidge RJ, Bendall MR, Gordon RE, Connelly A. Volume selec-tion for invivo biological spectroscopy. In: Govil G, KhetrapalCL, Saran A, editors. Magnetic resonance in biology and medi-cine. New Delhi: Tata McGraw-Hill Publishing Company Ltd;1985. p 387–397.
45. Frahm J, Merboldt K-D, Hanicke W. Localized proton spectros-copy using stimulated echoes. J Magn Reson (1969) 1987;72:502–508.
1322 Posse et al.

46. McNab JA, Bartha R. Quantitative short echo-time 1H LASER-CSI in human brain at 4 T. NMR Biomed 2006;19:999–1009.
47. Scheenen TW, Klomp DW, Wijnen JP, Heerschap A. Short echotime 1H-MRSI of the human brain at 3T with minimal chemicalshift displacement errors using adiabatic refocusing pulses.Magn Reson Med 2008;59:1–6.
48. Duyn JH, Gillen J, Sobering G, Vanzijl PCM, Moonen CTW. Mul-tisection proton MR spectroscopic imaging of the brain. Radiol-ogy 1993;188:277–282.
49. Ebel A, Maudsley AA. Improved spectral quality for 3D MR spec-troscopic imaging using a high spatial resolution acquisitionstrategy. Magn Reson Imaging 2003;21:113–120.
50. Mathiesen HK, Tscherning T, Sorensen PS, et al. Multi-sliceecho-planar spectroscopic MR imaging provides both global andlocal metabolite measures in multiple sclerosis. Magn ResonMed 2005;53:750–759.
51. Boer VO, Klomp DW, Juchem C, Luijten PR, de Graaf RA. Multi-slice (1) H MRSI of the human brain at 7 T using dynamic B(0)and B(1) shimming. Magn Reson Med 2012;68:662–670.
52. Singh S, Rutt BK, Henkelman RM. Projection presaturation - afast and accurate technique for multidimensional spatial local-ization. J Magn Reson 1990;87:567–583.
53. Singh S, Rutt BK, Napel S. Projection presaturation. 2. Single-shot localization of multiple regions of interest. J Magn Reson1990;90:313–329.
54. Singh S, Brody WR. Projection presaturation. 3. Accurate selec-tive excitation or presaturation of the regions of tailored shapein the presence of short-T(1) species. J Magn Reson Ser B 1993;101:52–62.
55. Duijn JH, Matson GB, Maudsley AA, Weiner MW. 3D phaseencoding 1H spectroscopic imaging of human brain. MagnReson Imaging 1992;10:315–319.
56. Posse S, Schuknecht B, Smith ME, van Zijl PC, Herschkowitz N,Moonen CT. Short echo time proton MR spectroscopic imaging.J Comput Assist Tomogr 1993;17:1–14.
57. Provencher SW. Estimation of metabolite concentrations fromlocalized in vivo proton NMR-spectra. Magn Reson Med 1993;30:672–679.
58. Chu A, Alger JR, Moore GJ, Posse S. Proton echo-planar spec-troscopic imaging with highly effective outer volume suppres-sion using combined presaturation and spatially selective echodephasing. Magn Reson Med 2003;49:817–821.
59. Tran TK, Vigneron DB, Sailasuta N, et al. Very selective sup-pression pulses for clinical MRSI studies of brain and prostatecancer. Magn Reson Med 2000;43:23–33.
60. Henning A, Fuchs A, Murdoch JB, Boesiger P. Slice-selectiveFID acquisition, localized by outer volume suppression(FIDLOVS) for (1)H-MRSI of the human brain at 7 T with mini-mal signal loss. NMR Biomed 2009;22:683–696.
61. Henning A, Schar M, Schulte RF, Wilm B, Pruessmann KP, Boe-siger P. SELOVS: brain MRSI localization based on highly selec-tive T1- and B1- insensitive outer-volume suppression at 3T.Magn Reson Med 2008;59:40–51.
62. Venugopal N, McCurdy B, Hovdebo J, et al. Automatic confor-mal prescription of very selective saturation bands for in vivo (1)H-MRSI of the prostate. NMR Biomed 2012;25:643–653.
63. Ozhinsky E, Vigneron DB, Nelson SJ. Improved spatial coveragefor brain 3D PRESS MRSI by automatic placement of outer-vol-ume suppression saturation bands. J Magn Reson Imaging2011;33:792–802.
64. Martinez-Ramon M, Gallardo-Antolin A, Cid-Sueiro J, et al.Automatic placement of outer volume suppression slices in MRspectroscopic imaging of the human brain. Magn Reson Med2010;63:592–600.
65. van der Kouwe AJ, Benner T, Fischl B, et al. On-line automaticslice positioning for brain MR imaging. Neuroimage 2005;27:222–230.
66. Benner T, Wisco JJ, van der Kouwe AJ, et al. Comparison ofmanual and automatic section positioning of brain MR images.Radiology 2006;239:246–254.
67. Bornert P, Schaffter T. Curved slice imaging. Magn Reson Med1996;36:932–939.
68. Maudsley AA, Domenig C, Govind V, et al. Mapping of brainmetabolite distributions by volumetric proton MR spectroscopicimaging (MRSI). Magn Reson Med 2009;61:548–559.
69. Balchandani P, Spielman D. Fat suppression for 1H MRSI at 7Tusing spectrally selective adiabatic inversion recovery. MagnReson Med 2008;59:980–988.
70. Star-Lack J, Nelson SJ, Kurhanewicz J, Huang LR, VigneronDB. Improved water and lipid suppression for 3D PRESS CSIusing RF band selective inversion with gradient dephasing (BAS-ING). Magn Reson Med 1997;38:311–321.
71. Ogg RJ, Kingsley PB, Taylor JS. WET, a T1- and B1-insensitivewater-suppression method for in vivo localized 1H NMR spec-troscopy. J Magn Reson B 1994;104:1–10.
72. Tkac I, Starcuk Z, Choi IY, Gruetter R. In vivo 1H NMR spectros-copy of rat brain at 1 ms echo time. Magn Reson Med 1999;41:649–656.
73. Spielman D, Meyer C, Macovski A, Enzmann D. H-1 Spectro-scopic Imaging Using a Spectral Spatial Excitation Pulse. MagnReson Med 1991;18:269–279.
74. Hurd RE, Gurr D, Sailasuta N. Proton spectroscopy withoutwater suppression: the oversampled J-resolved experiment.Magn Reson Med 1998;40:343–347.
75. Dong Z, Dreher W, Leibfritz D. Experimental method to elimi-nate frequency modulation sidebands in localized in vivo 1H MRspectra acquired without water suppression. Magn Reson Med2004;51:602–606.
76. Dong Z, Dreher W, Leibfritz D. Toward quantitative short-echo-time in vivo proton MR spectroscopy without water suppression.Magn Reson Med 2006;55:1441–1446.
77. Mandal PK. In vivo proton magnetic resonance spectroscopicsignal processing for the absolute quantitation of brain metabo-lites. Eur J Radiol 2012;81:e653–e664.
78. Weber-Fahr W, Ende G, Braus DF, et al. A fully automatedmethod for tissue segmentation and CSF-correction of protonMRSI metabolites corroborates abnormal hippocampal NAA inschizophrenia. Neuroimage 2002;16:49–60.
79. Maudsley AA, Darkazanli A, Alger JR, et al. Comprehensiveprocessing, display and analysis for in vivo MR spectroscopicimaging. NMR Biomed 2006;19:492–503.
80. Dong Z, Peterson B. The rapid and automatic combination ofproton MRSI data using multi-channel coils without water sup-pression. Magn Reson Imaging 2007;25:1148–1154.
81. Maril N, Lenkinski RE. An automated algorithm for combiningmultivoxel MRS data acquired with phased-array coils. J MagnReson Imaging 2005;21:317–322.
82. Rodgers CT, Robson MD. Receive array magnetic resonancespectroscopy: whitened singular value decomposition (WSVD)gives optimal Bayesian solution. Magn Reson Med 2010;63:881–891.
83. Brown MA. Time-domain combination of MR spectroscopy dataacquired using phased-array coils. Magn Reson Med 2004;52:1207–1213.
84. Gasparovic C, Song T, Devier D, et al. Use of tissue water as aconcentration reference for proton spectroscopic imaging. MagnReson Med 2006;55:1219–1226.
85. Kreis R, Slotboom J, Hofmann L, Boesch C. Integrated data ac-quisition and processing to determine metabolite contents,relaxation times, and macromolecule baseline in single exami-nations of individual subjects. Magn Reson Med 2005;54:761–768.
86. Liu S, Fleysher R, Fleysher L, et al. Brain metabolites B1-cor-rected proton T1 mapping in the rhesus macaque at 3 T. MagnReson Med 2010;63:865–871.
87. Tsai SY, Posse S, Lin YR, et al. Fast mapping of the T2 relaxa-tion time of cerebral metabolites using proton echo-planar spec-troscopic imaging (PEPSI). Magn Reson Med 2007;57:859–865.
88. Bagory M, Durand-Dubief F, Ibarrola D, Confavreux C, Sappey-Marinier D. ‘‘Absolute’’ quantification in magnetic resonancespectroscopy: validation of a clinical protocol in multiple sclero-sis. Conf Proc IEEE Eng Med Biol Soc 2007;2007:3458–3461.
89. Ebel A, Soher BJ, Maudsley AA. Assessment of 3D proton MRecho-planar spectroscopic imaging using automated spectralanalysis. Magn Reson Med 2001;46:1072–1078.
90. Hofmann L, Slotboom J, Jung B, Maloca P, Boesch C, Kreis R.Quantitative 1H-magnetic resonance spectroscopy of humanbrain: influence of composition and parameterization of the ba-sis set in linear combination model-fitting. Magn Reson Med2002;48:440–453.
MR Spectroscopic Imaging 1323

91. Laudadio T, Selen Y, Vanhamme L, Stoica P, Van Hecke P, VanHuffel S. Subspace-based MRS data quantitation of multipletsusing prior knowledge. J Magn Reson 2004;168:53–65.
92. Provencher SW. Estimation of metabolite concentrations fromlocalized in vivo proton NMR spectra. Magn Reson Med 1993;30:672–679.
93. Provencher SW. Automatic quantitation of localized in vivo 1Hspectra with LCModel. NMR Biomed 2001;14:260–264.
94. Ratiney H, Sdika M, Coenradie Y, Cavassila S, van Ormondt D,Graveron-Demilly D. Time-domain semi-parametric estimationbased on a metabolite basis set. NMR Biomed 2005;18:1–13.
95. Vanhamme L, Van Huffel S, Van Hecke P, van Ormondt D.Time-domain quantification of series of biomedical magneticresonance spectroscopy signals. J Magn Reson 1999;140:120–130.
96. Gillies P, Marshall I, Asplund M, Winkler P, Higinbotham J.Quantification of MRS data in the frequency domain using awavelet filter, an approximated Voigt lineshape model and priorknowledge. NMR Biomed 2006;19:617–626.
97. Mierisova S, Ala-Korpela M. MR spectroscopy quantitation: areview of frequency domain methods. NMR Biomed 2001;14:247–259.
98. Naressi A, Couturier C, Devos JM, et al. Java-based graphicaluser interface for the MRUI quantitation package. MAGMA2001;12:141–152.
99. Slotboom J, Boesch C, Kreis R. Versatile frequency domain fit-ting using time domain models and prior knowledge. MagnReson Med 1998;39:899–911.
100. Corrigan NM, Richards TL, Friedman SD, Petropoulos H, DagerSR. Improving 1H MRSI measurement of cerebral lactate forclinical applications. Psychiatry Res 2010;182:40–47.
101. Maudsley AA, Darkazanli A, Alger JR, et al. Comprehensiveprocessing, display and analysis for in vivo MR spectroscopicimaging. NMR Biomed 2006;19:492–503.
102. Posse S, Cuenod CA, Lebihan D. Motion artifact compensationin H-1 spectroscopic imaging by signal tracking. J Magn ResonSer B 1993;102:222–227.
103. Lin JM, Tsai SY, Liu HS, et al. Quantification of non-water-sup-pressed MR spectra with correction for motion-induced signalreduction. Magn Reson Med 2009;62:1394–1403.
104. Hess AT, Andronesi OC, Tisdall MD, Sorensen AG, van derKouwe AJ, Meintjes EM. Real-time motion and B0 correction forlocalized adiabatic selective refocusing (LASER) MRSI usingecho planar imaging volumetric navigators. NMR Biomed 2012;25:347–358.
105. Mason GF, Pan JW, Ponder SL, Twieg DB, Pohost GM, Hether-ington HP. Detection of brain glutamate and glutamine in spec-troscopic images at 4.1 T. Magn Reson Med 1994;32:142–145.
106. Pan JW, Mason GF, Pohost GM, Hetherington HP. Spectroscopicimaging of human brain glutamate by water-suppressed J-refo-cused coherence transfer at 4.1 T. Magn Reson Med 1996;36:7–12.
107. Yung K, Tsai SY, Lin FH, Henry PG, Yoshimoto A, Posse S. Com-parison of TE-averaged with short TE Proton-Echo-Planar-Spec-troscopic-Imaging (PEPSI) for mapping glutamate in humanbrain at 3T. In: Proceedings of the 18th Annual Meeting ofISMRM, Honolulu, Hawaii, 2009. (abstract 4314).
108. Shen J, Shungu DC, Rothman DL. In vivo chemical shift imag-ing of gamma-aminobutyric acid in the human brain. MagnReson Med 1999;41:35–42.
109. Jensen JE, Frederick BD, Wang L, Brown J, Renshaw PF. Two-dimensional, J-resolved spectroscopic imaging of GABA at 4Tesla in the human brain. Magn Reson Med 2005;54:783–788.
110. Zhu H, Edden RA, Ouwerkerk R, Barker PB. High resolutionspectroscopic imaging of GABA at 3 Tesla. Magn Reson Med2011;65:603–609.
111. Dager SR, Layton ME, Strauss W, et al. Human brain metabolicresponse to caffeine and the effects of tolerance. Am J Psychia-try 1999;156:229–237.
112. Dager SR, Corrigan NM, Richards TL, Posse S. Research appli-cations of magnetic resonance spectroscopy to investigate psy-chiatric disorders. Top Magn Reson Imaging 2008;19:81–96.
113. Kuehn BM. CDC: autism spectrum disorders common. JAMA2007;297:940.
114. Friedman SD, Shaw DW, Artru AA, et al. Regional brain chemi-cal alterations in young children with autism spectrum disorder.Neurology 2003;60:100–107.
115. Friedman SD, Shaw DW, Artru AA, Dawson G, Petropoulos H,Dager SR. Gray and white matter brain chemistry in young chil-dren with autism. Arch Gen Psychiatry 2006;63:786–794.
116. Dager S, Corrigan, NM, Richards, TL, Shaw, DWW. Autism spec-trum disorders. In: Amaral D, Geshwind D, Dawson G, editors.Brain chemistry: magnetic resonance spectroscopy. Cambridge:Oxford University Press; 2011. p 576–592.
117. Huang W, Fisher PR, Dulaimy K, Tudorica LA, O’Hea B, ButtonTM. Detection of breast malignancy: diagnostic MR protocol forimproved specificity. Radiology 2004;232:585–591.
118. Danishad KK, Sharma U, Sah RG, Seenu V, Parshad R, Jagan-nathan NR. Assessment of therapeutic response of locallyadvanced breast cancer (LABC) patients undergoing neoadju-vant chemotherapy (NACT) monitored using sequential magneticresonance spectroscopic imaging (MRSI). NMR Biomed 2010;23:233–241.
119. Zhao C, Bolan P, Royce M, Lakkadi L, Lee S-J, Eberhardt S,Posse S. High-speed MR spectroscopic imaging of total cholinein breast cancer and healthy controls at 3T: a feasibility study.In: Proceedings of the 19th Annual Meeting of ISMRM, Montreal,Canada. 2011. (abstract 513).
120. Klomp DW, van de Bank BL, Raaijmakers A, et al. (31) P MRSIand (1) H MRS at 7 T: initial results in human breast cancer.NMR Biomed 2011;24:1337–1342.
121. Kurhanewicz J, Vigneron DB. Advances in MR spectroscopy ofthe prostate. Magn Reson Imaging Clin N Am 2008;16:697–710,ix-x.
122. Verma S, Rajesh A, Futterer JJ, et al. Prostate MRI and 3D MRspectroscopy: how we do it. AJR Am J Roentgenol 2010;194:1414–1426.
123. Meyerhoff DJ, Maudsley AA, Schaefer S, Weiner MW. Phospho-rus-31 magnetic resonance metabolite imaging in the humanbody. Magn Reson Imaging 1992;10:245–256.
124. Lipnick S, Verma G, Ramadan S, Furuyama J, Thomas MA.Echo planar correlated spectroscopic imaging: implementationand pilot evaluation in human calf in vivo. Magn Reson Med2010;64:947–956.
125. Hoult DI, Lauterbur PC. Sensitivity of the zeugmatographicexperiment involving human samples. J Magn Reson 1979;34:425–433.
126. Barker PB, Hearshen DO, Boska MD. Single-voxel proton MRSof the human brain at 1.5T and 3.0T. Magn Reson Med 2001;45:765–769.
127. Gonen O, Gruber S, Li BS, Mlynarik V, Moser E. Multivoxel 3Dproton spectroscopy in the brain at 1.5 versus 3.0 T: signal-to-noise ratio and resolution comparison. AJNR Am J Neuroradiol2001;22:1727–1731.
128. Kantarci K, Reynolds G, Petersen RC, et al. Proton MR spectros-copy in mild cognitive impairment and Alzheimer disease: com-parison of 1.5 and 3 T. AJNR Am J Neuroradiol 2003;24:843–849.
129. Ugurbil K, Adriany G, Andersen P, et al. Ultrahigh field magneticresonance imaging and spectroscopy. Magn Reson Imaging2003;21:1263–1281.
130. Hetherington HP, Pan JW, Chu WJ, Mason GF, Newcomer BR.Biological and clinical MRS at ultra-high field. NMR Biomed1997;10:360–371.
131. Tkac I, Andersen P, Adriany G, Merkle H, Ugurbil K, Gruetter R.In vivo H-1 NMR spectroscopy of the human brain at 7 T. MagnReson Med 2001;46:451–456.
132. Gruetter R, Weisdorf SA, Rajanayagan V, et al. Resolutionimprovements in in vivo 1H NMR spectra with increased mag-netic field strength. J Magn Reson 1998;135:260–264.
133. Katscher U, Bornert P, Leussler C, van den Brink JS. TransmitSENSE. Magn Reson Med 2003;49:144–150.
134. Zhu Y. Parallel excitation with an array of transmit coils. MagnReson Med 2004;51:775–784.
135. Sodickson DK, Manning WJ. Simultaneous acquisition of spatialharmonics (SMASH): fast imaging with radiofrequency coilarrays. Magn Reson Med 1997;38:591–603.
136. Pruessmann KP, Weiger M, Scheidegger MB, Boesiger P. SENSE:sensitivity encoding for fast MRI. Magn Reson Med 1999;42:952–962.
1324 Posse et al.

137. Griswold MA, Jakob PM, Heidemann RM, et al. Generalizedautocalibrating partially parallel acquisitions (GRAPPA). MagnReson Med 2002;47:1202–1210.
138. Tsai SY, Otazo R, Posse S, et al. Accelerated proton echo planarspectroscopic imaging (PEPSI) using GRAPPA with a 32-channelphased-array coil. Magn Reson Med 2008;59:989–998.
139. Wiesinger F, Van de Moortele PF, Adriany G, De Zanche N,Ugurbil K, Pruessmann KP. Parallel imaging performance as afunction of field strength–an experimental investigation usingelectrodynamic scaling. Magn Reson Med 2004;52:953–964.
140. Ohliger MA, Grant AK, Sodickson DK. Ultimate intrinsic signal-to-noise ratio for parallel MRI: electromagnetic field considera-tions. Magn Reson Med 2003;50:1018–1030.
141. Wiesinger F, Boesiger P, Pruessmann KP. Electrodynamics andultimate SNR in parallel MR imaging. Magn Reson Med 2004;52:376–390.
142. Lin F, Tsai SY, Lin YR, et al. Single-shot proton MR spec-troscopic inverse imaging. In Proceedings of the 16th An-
nual Meeting of ISMRM, Toronto, Canada, 2008. (abstract595).
143. Otazo R, Lin FH, Wiggins G, Jordan R, Sodickson D, Posse S.Superresolution parallel magnetic resonance imaging: applica-tion to functional and spectroscopic imaging. Neuroimage 2009;47:220–230.
144. Lustig M, Donoho D, Pauly JM. Sparse MRI: the application ofcompressed sensing for rapid MR imaging. Magn Reson Med2007;58:1182–1195.
145. Gruetter R, Adriany G, Choi IY, Henry PG, Lei H, Oz G. Local-ized in vivo 13C NMR spectroscopy of the brain. NMR Biomed2003;16:313–338.
146. Ardenkjaer-Larsen JH, Fridlund B, Gram A, et al. Increase insignal-to-noise ratio of > 10,000 times in liquid-state NMR. ProcNatl Acad Sci U S A 2003;100:10158–10163.
147. Larson PE, Hu S, Lustig M, et al. Fast dynamic 3D MR spectro-scopic imaging with compressed sensing and multiband excita-tion pulses for hyperpolarized 13C studies. Magn Reson Med2011;65:610–619.
MR Spectroscopic Imaging 1325