
Mr Gradgrind in Hard Times, Charles Dickens
19
Chapter 2 2 G G o o v v e e r r n n m m e e n n t t i i n n P P r r a a c c t t i i c c e e Now, what I want is, Facts. Facts alone are wanted in Life. Mr Gradgrind in Hard Times, Charles Dickens The Legal Basis of Government ♦ Measures of Government Size ♦ Government Regulation ♦ Government Expenditure and Revenue ♦ Government Budgets: Deficits, Debt and Assets ♦ International Comparisons ♦ Determinants of Government Expenditure ew economists would agree with Mr Gradgrind that all we need to know is facts. However, theory without facts is of little use. To understand the role of government, we need to know the legal basis of government, concepts of government size, the nature of government regulation, and the nature of government expenditure and revenue. Central to understanding government is an understanding of the annual budget. This chapter addresses these and related issues. We start by outlining the legal basis of government in Australia. We then discuss concepts of government size and regulation. The central part of the chapter describes government expenditure, revenue and debt in Australia. Some international comparisons of government expenditure are also provided. The last part of the chapter discusses the major drivers of government expenditure. The Legal Basis of Government 1 The Australian Constitution, as laid out in the Commonwealth of Australia Constitution Act 1900, provides the legal basis for government in Australia. 2 The Constitution created a federation of the six then British colonies. It created the Commonwealth government (now known as the Australian government) and established the rules governing relations between the Commonwealth and the states (as the colonies became). It also established the powers of the Commonwealth parliament, the executive and the judicature. Unlike many other constitutions, the Constitution does not provide a formal bill of rights for individuals. Individual rights were assumed to be protected by common law and the exercise of democracy. 3 Box 2.1 describes some other important features of the Australian Constitution. 1 This section draws on Saunders (1997). 2 The Act came into force on 1 January 1901. 3 T he Constitution declares some individual rights, including freedom of religion and just compensation for property acquired by the Commonwealth. Parliament has now passed laws against racial and sexual discrimination. Australia is also a signatory to the Universal Declaration of Human Rights (United Nations). F
Transcript of Mr Gradgrind in Hard Times, Charles Dickens
20 Part 1 Nature of Government
CChhaa pptteerr
22 GGoovveerrnnmmeenntt
iinn PPrraaccttiiccee
Now, what I want is, Facts. Facts alone are wanted in Life.
Mr Gradgrind in Hard Times, Charles Dickens
The Legal Basis of Government ♦ Measures of Government Size ♦ Government Regulation ♦ Government
Expenditure and Revenue ♦ Government Budgets: Deficits, Debt and Assets ♦ International Comparisons ♦
Determinants of Government Expenditure
ew economists would agree with Mr Gradgrind that all we need to know is facts.
However, theory without facts is of little use. To understand the role of government,
we need to know the legal basis of government, concepts of government size, the
nature of government regulation, and the nature of government expenditure and revenue.
Central to understanding government is an understanding of the annual budget.
This chapter addresses these and related issues. We start by outlining the legal basis of
government in Australia. We then discuss concepts of government size and regulation. The
central part of the chapter describes government expenditure, revenue and debt in Australia.
Some international comparisons of government expenditure are also provided. The last part of
the chapter discusses the major drivers of government expenditure.
The Legal Basis of Government1 The Australian Constitution, as laid out in the Commonwealth of Australia Constitution Act
1900, provides the legal basis for government in Australia.2 The Constitution created a
federation of the six then British colonies. It created the Commonwealth government (now
known as the Australian government) and established the rules governing relations between
the Commonwealth and the states (as the colonies became). It also established the powers of
the Commonwealth parliament, the executive and the judicature. Unlike many other
constitutions, the Constitution does not provide a formal bill of rights for individuals.
Individual rights were assumed to be protected by common law and the exercise of
democracy.3 Box 2.1 describes some other important features of the Australian Constitution.
1 This section draws on Saunders (1997).
2 The Act came into force on 1 January 1901.
3 The Constitution declares some individual rights, including freedom of religion and just compensation for property
acquired by the Commonwealth. Parliament has now passed laws against racial and sexual discrimination.
Australia is also a signatory to the Universal Declaration of Human Rights (United Nations).
F

Chapter 2 Government in Practice 21
Box 2.1 Features of the Australian Constitution
The Australian Constitution responded to local political is sues
and drew on UK, US and Swiss practices. It drew the system of
parliamentary government from the United Kingdom. The
elected parliament would be responsible for appointing the
government (because government must have the confidence of
the parliament). Parliament would determine public policies
and budgets, which would be implemented by the executive
arm of government.
From the United States, the Constitution drew the concept
of two elected parliamentary houses. The House of
Representatives (the ‘Lower House’) is elected by direct
popular vote on the principle of one person, one vote. The
Senate (the ‘Upper House’) would provide the states with
power by providing each state with equal representation in the
Senate. As in the United States, the judiciary is formally
independent and responsible for interpreting and protecting
the Constitution.
From Switzerland was drawn the idea of a referendum to
approve changes in the constitution.
Changes to the constitution require the approval of a
majority of electors nationally and a majority in at leas t four
of the six states.
In practice, government does not always reflect these
principles. Parliament exercises limited control over the
executive arm of government. Although the Constitution
requires that parliament impose taxation, the executive
branch prepares the all-important annual budget.4 The
executive initiates most policies, which are usually appr oved
by parliament, at least by the Lower House. It decides when
elections will be held (within a maximum three-year period)
and when parliament will meet.5 The executive is sometimes
constrained by the Senate where it may not hold a majority.
But, contrary to the intentions of the Constitution, the Senate
is generally dominated by political parties rather than by t he
states. Sometimes small parties with two or three elected
members representing minority views (often quite strongly)
hold the balance of power in the Senate and require special
concessions in return for agreeing to pass bills.
Under the constitutional process, the states granted powers to the Commonwealth but
retained residual (ungranted) powers. For example, the states initially controlled income
taxes. They also controlled economic activities and labour markets that took place entirely
within their area. As nationhood became more important, particularly in wartime, the states
ceded important powers to the Commonwealth, notably the income tax in 1942 following a
national referendum. In 1946, another referendum greatly extended the Commo nwealth's
power to redistribute monies to individuals and so to create a welfare state. Commonwealth
powers over the economy also increased as trade and labour markets crossed state borders.
Although the Commonwealth government is increasingly powerful because of its ownership
of most tax revenues, the federal nature of the country introduces political competition
between the Commonwealth and the states which provides some constraint on the power of
the Commonwealth.
The Constitution devotes little space to economic issues. But what it does say about them
has important consequences. The main sections dealing with economic matters are Chapter 1
(Section 51), and Chapter 4. Section 51 describes the economic powers of the Commonwealth
government. Chapter 4 describes the main principles governing finance and trade in the
federation.
Some main economic points of the Constitution inclusive of amendments are:
• Monetary policy. The Commonwealth government has exclusive power to issue coins and
currency in Australia.
• Taxation. In effect, following the 1942 referendum, the Commonwealth controls income
taxes because the Commonwealth can withhold financial assis tance to the states if they
levy income tax. Also, under Section 90, only the Commonwealth can raise customs and
4 The Senate has limited powers to amend money bills.
5 Formally, the Governor General makes these decisions, but he (or she) normally acts on the advice of the Prime
Minister.

22 Part 1 Nature of Government
excise taxes. In 1997 the High Court interpreted ‘excise’ widely to mean any tax imposed
up to and including point of sale.6
• Borrowing. Both the Commonwealth and the states have the right to borrow to finance
budget deficits.
• External trade. There would be a single external tariff for any good.
• Trade between states shall be free and unrestricted.
• A uniform law for commerce across Australia. The Commonwealth has the power to make
laws for trading and financial corporations. This has paved the way for most trade practices
legislation and substantial workplace legislation.
• Labour markets. The Commonwealth can conciliate and arbitrate for the preven tion and
settlement of industrial disputes extending beyond the limits of any one state.
• Redistribution of public monies to the states. Following some transition arrangements, the
Commonwealth would determine the distribution of its revenues to the states.
• Redistribution of public monies to individuals. The Constitution initially gave the
Commonwealth very limited power over social security for invalid and old age pensions.
By a referendum in 1946, the Commonwealth gained greatly increased social security
powers, including provisions for unemployment, sickness, families and students.
Measures of Government Size The size of government (GS) is measured most often by the ratio of general government
expenditure to gross domestic product (GDP).
GS1 = Total general government expenditure/GDP (2.1)
Total general government expenditure is the sum of current and capital government
expenditure on goods and services and transfer payments by all levels of government
(Commonwealth, state and local government) that are financed through the annual budgets
(see Table 2.1). Current expenditure includes the cost of publicly produced goods (mainly
wages) and the purchase of goods from the private sector (e.g. medical supplies) that are used
for current consumption. It also includes contributions to statutory authorities and subsidies to
some public trading enterprises. Capital expenditure is expenditure on physical capital
formation, such as hospitals and school buildings. Of course, intra-governmental flows must
be netted out. Transfer payments are cash transfers from taxpayers to recipients. They include
personal income benefits such as unemployment benefits and pensions, personal subs idies in
kind for example for housing, business subsidies and interest payments.
Expenditure is related to GDP because GDP represents the productive capacity of the
economy.7 In 2016−17, general government expenditure in Australia totalled 34.6 per cent of
GDP. GS1 is a popular measure of the size of government because it can be readily estimated,
includes all goods and services and transfers financed by government, and largely determines
taxation requirements. It is also convenient for international comparisons.
Another expenditure measure of government size is:
GS2 = General government expenditure on goods and services/GDP (2.2)
GS2 excludes transfer payments. This measure is consistent with the concept of GDP,
which also excludes transfer payments. In 2016−17, GS2 was 22.0 per cent of GDP.
Expenditure on goods and services is sometimes described as exhaustive expenditure because
it exhausts the purchasing power of the money spent. In contrast, transfer payments
redistribute resources; they do not use them.
6 Ha v New South Wales (1997)
7 For this purpose, GDP is usually measured at factor cost, which excludes indirect taxes and subsidies.

Chapter 2 Government in Practice 23
Table 2.1 General government expenditure in Australia in 2016–17
General government expenditures $billion % of GDP
Expenditure on goods and services
Current expenditure 325.0 18.5
Capital expenditure 60.8 3.5
Total 385.8 22.0
Transfer payments
Personal benefits 130.3 7.4
Interest paymentsa 26.7 1.5
Business subsidies 23.0 1.3
Other transfersb 42.0 2.4
Total 222.2 12.7
Total general government expenditure 607.9 34.6
Gross domestic product 1754.7 100.0
(a) Including interest on unfunded superannuation liabilities
(b) For example subsidies for expenses such private housing rents, private health insurance, child car e
etc.
Source: ABS, 2017, Australian System of National Accounts 2016—17, Tables 2, 30 and 32, Cat. No. 5204.0.
Thus, GS2 shows how government influences directly the use of resources. However, this
measure omits slightly over a third of government expenditure and does not show
government’s financing requirements.
General government expenditure does not include expenditure by public trading enterprises
(PTEs). Inclusion would involve some double counting because PTEs sell goods to
government as well as to private firms. To avoid double counting, national income accounts
identify PTE capital expenditure plus dividend and interest payments as a separate item.8
Accordingly, for a more comprehensive measure of the size of the public sector than GS1 or
GS2, we can adopt a third measure:
GS3 = (Total general government expenditure + PTE capital outlays)/GDP (2.3)
The GS3 measure is not often used. Although PTEs are part of the public sector they
generally act commercially and are similar in some ways to private firms. Problems of
definition arise when government is part owner of an enterprise. Also, consistent international
comparisons are hard to obtain.
A fourth measure of government size (GS4) focuses on the role of government as a
producer of goods. A common measure is the ratio of government employment to total
employment.
GS4 = Total government employment/total employment (2.4)
Because government purchases various goods and services from the private secor, GS4 is
generally lower than GS2. In Australia, government at all levels employs about 16 per cent of
the total workforce, including employees in welfare administration. Unlike expenditure
measures of government size, employment measures do not show the extent to which
economic resources are subject to government control.
8 In the Government Finance Statistics (ABS), PTE outlays include fixed capital expenditure outlays, interest and
other property income payments, capital grants and advances and net expenditure on stocks, land and intangible
assets.

24 Part 1 Nature of Government
Finally, government size is sometimes measured by the ratio of tax revenue to GDP.
GS5 = Total tax revenue/GDP (2.5)
GS5 shows the size of the tax burden. However, tax revenue is generally less than general
government expenditure, with the gap met by other revenue measures, such as user charges,
or by borrowing. Indeed, the gap between taxation and expenditure may be several percentage
points of GDP. Therefore, tax revenue gives only a partial picture of government activity.
Government Regulation Government spending is only a partial measure of government control over an economy.
Even a low-spending government can regulate almost any area of private business activity. In
Australia the government has long exercised significant control over the economy (see Box
2.2). The Economist (19 March 2011) noted that while President Bush was in office in the
United States from 2000 to 2008 over 1000 pages of federal regulations were added each year
and that a quarter of a million Americans have jobs devising and implementing federal rules.9
Japan is another country where public expenditure is low and regulation is high.
Box 2.2 Government regulation in Australia
Government has played a major role in the development of
Australia. In the 19th century the public sector was mainly
instrumental in developing energy, transport and comm-
unications across the continent.
Following federation in 1901, government regulations
increased. Government adopted a high-tariff protectionist
stance along with an industrial welfare policy designed to
ensure payment of adequate wages. In 1907, in the Harves ter
judgement, Justice Higgins laid down that the basic wage
should be sufficient to provide for the basic needs of a family
of five, estimated at 42 shillings a week. Australia was one of
the few countries in the world with compulsory arbitration of
wages and key work conditions. The government also
introduced various welfare policies, including age pensions,
workers’ compensation for injury and some unemployment
relief. Australians generally looked on government to pr ovide
social justice and ‘to soften’ market forces in the form of
international prices or to ‘elude them or master them’.10 After
the Second World War, the role of government increased
further. The 1945 White Paper committed the Commonwealt h
government to guarantee full employment and to intervene as
necessary to achieve that guarantee.
In the 1950s, government introduced import controls to
respond to balance of payments difficulties and to maintain
employment. It a lso provided subsidies to many import -
competing manufacturing businesses. The 1972—75 Labor
government further expanded the role of government by
greatly increasing public expenditure, especially in health and
education, control of foreign investment and protection of the
environment. Despite advocating smaller government, the
Liberal government (1975—83) did little to reduce public
expenditure or regulations. In 1984 the Brookings Institute
concluded its review of the Australian economy with the
observation that ‘Australia’s public policies are greatly
influenced by the national mistrust of market outcomes’
(Caves and Krause, 1984, p. 400).
Since the mid-1980s there has been substantial liberalisation
of the economy. Capital markets were liberalised by the
floating of the dollar, the lifting of controls over foreign
exchange transactions and deregulation of the domestic
banking sector. Effective tariffs have been reduced from 35
per cent in the 1970s to 5 per cent today. Many public
enterprises have been privatised and many public services
contracted out. Telecommunications and airlines have been
largely deregulated.
Today both major political parties are committed to
promoting market competition. However, as we see in Chapter
14, maintenance of competitive markets requires r egulat or y
policies. And Chapter 29 (Box 29.3) describes ongoing
regulation in labour markets.
9 Under President Trump, many regulations are being undone. At this point, the verdict on this is an open one. 10
Hancock (1961, p. 67). This classic study, Australia, was first published in 1930.

Chapter 2 Government in Practice 25
Regulations are diverse and numerous. They include price and quantity controls, product
standards, regulations of medicines and foods, occupational health and safety regulations in
labour markets, environmental and urban planning controls, as well as public safety measures
such as closed-circuit cameras related to the wars on terror and drugs.
There is no simple measure of the extent of government regulation. It is hard even to count
the number of regulations without defining what counts and what does not. The World Bank
(1997) suggested three indicators of the amount of government intervention in an economy:
the openness of the economy (the share of trade in GDP), the overvaluation of the currency
(based on the black-market exchange rate) and the gap between local and international prices.
Other authorities, such as the influential journal The Economist, advocate that the estimated
cost of government regulations should be published in an annual regulatory budget. This
would be a very complex exercise especially if benefits are included. Although economists
can estimate the price and output impacts of individual regulations and their welfare costs and
benefits, it is difficult to estimate the total gross or cost of regulation in any country.
Public expenditure substitutes
Often government requires the private sector to make certain expenditures that substitute for
public expenditure. These expenditures are known as coerced private expenditures . For
example, governments in Australia require private firms to contribute to employee retirement
schemes, provide redundancy payments, pay workers compensation for injury and invest in
pollution control. An extreme example of coercion is military conscription where government
pays conscripted labour far less than its economic opportunity cost. Jury service is another
example. When there are large coerced private expenditures, public expenditure becomes a
poor measure of the real influence of government on the economy.
Tax expenditures are another major form of expenditure substitute. Tax expenditures are
tax concessions. These concessions create revenue losses that have a similar effect on the
budget as government expenditures. Suppose that some farmers spend $100 million on plant
and equipment and that their marginal tax rate is 30 per cent. Government could assist the
farmers by (1) giving them a grant of, say, $30 million or (2) allowing them to deduct their
capital expenditure against current income, reducing their combined taxable income by $100
million and their tax payments by $30 million. Either way, the farmers would gain $30
million, and the cost to government (i.e. to other taxpayers) is $30 million. Alternatively,
instead of providing allowances to families with dependent children, government could allow
an equivalent amount in tax deductions. There are many forms of tax concessions, including
tax exemptions or deferrals, expenditure deductions, accelerated depreciation and so on. Any
such concession represents a call on the budget similar to direct ou tlays.
To assess the size of a tax concession, it is necessary first to establish what constitutes
‘normal tax’. This can be difficult. In a detailed review. the Australian Treasury (2017)
estimated that large Commonwealth tax expenditures totalled $149 billion in 2016-17, equal
to a third of Commonwealth outlays or some 8.5 per cent of GDP. This included an estimated
$61.5 billion for exempting homes from capital gains tax (CGT) and discounting CGT for
investment housing properties , and $32.9 billion on concessions to superannuation
contributions and earnings.
Government Expenditure and Revenue As shown in Figure 2.1 overleaf, government spending by all levels of government rose from
less than 25 per cent of GDP in the mid-1960s to about 37 per cent of GDP in the late 1980s.
Between then and 2007, general government expenditure oscillated but tended down to about
33 per cent of GDP. Following the global financial crisis, it moved sharply upwards to 35 per
cent of GDP in 2009–10 and it has remained about that level in each year since then.
Tax expenditures
A term for tax
concessions

26 Part 1 Nature of Government
Figure 2.2 shows the main components of general government expenditure: consumption,
income transfers, capital expenditure and interest payments. Consumption expenditure, the
largest component, rose from 12 per cent of GDP in the mid-1960s to 20 per cent of GDP in
the mid-1980s, but fell back to about 18 per cent in recent years. Personal income benefits,
the second largest component, have increased from 4 per cent of GDP in the mid -1960s to
about 8 per cent of GDP today. This does not include in-kind transfers tied to housing, health,
child care and so on (see Table 2.1). Since the early 1980s, government fixed capital
expenditure has generally been between 2 and 3 per cent of GDP. On the other hand, interest
payments have fallen from a high of 5 per cent of GDP in the late 1980s to less than 2 per
cent today due to government policies due mainly to lower interest rates and partly to a
reluctance to borrow.
Source: ABS, Time Series Spreadsheets , Cat. No. 5204.0
Figure 2.1 General government expenditure and revenue (as a percentage of GDP)
Source: ABS, Time Series Spreadsheets, Cat. No. 5204.0
Figure 2.2 General government expenditure components (as a percentage of GDP)

Chapter 2 Government in Practice 27
Traditionally, public trading enterprises supplied most infrastructure services in Australia,
including power, water, transport and communications services. Also, the states owned many
banking and insurance businesses. In the early 1980s, PTE gross capital expenditure was over
6 per cent of GDP. Following the sale of many PTEs to the private sector, PTE capital outlays
have fallen to-day to only about 1.5 per cent of GDP. Thus, public sector expenditure overall
in 2016-17, including PTE capital expenditure, was 36.1 per cent of GDP.
Table 2.2 shows general government expenditure by function in 2015–16. The largest
government programs are social security and welfare, health and education, which account for
28.1 per cent, 19.4 per cent and 14.6 per cent of total expenditure respectively. Within social
security and welfare, there are several large programs including assistance to families, the
unemployed, people with disabilities and the elderly (see Chapter 23). Other major
expenditure areas are transport and communications, defence, public order and safety, and
housing and community amenities, as well as general public services.
Table 2.2 General government expenditure by function 2015–16 ($billion)
Expenditure category Commonwealtha State and local
governmentb
Total % of total
expenditure
Social security and welfare 152.0 20.1 168.8 28.1
Health 69.3 68.0 116.4 19.4
Education 32.3 58.4 87.9 14.6
General public services 22.7 13.1 34.8 5.8
Public debt transactions 16.0 8.6 38.2 6.4
Transport and communications 7.2 29.7 29.2 4.9
Other economic affairs 9.2 5.3 14.2 2.4
Defence 26.2 0 26.2 4.4
Public order and safety 4.8 25.1 29.3 4.9
Housing and community amenities 7.3 18.9 22.9 3.8
Recreation and culture 3.4 10.4 13.6 2.3
Other 80.5 13.8 19.4 3.2
Total 430.9 271.6 600.8 100.0
(a) Excludes GST payments to the states.
(b) The sum of Commonwealth and state and local government expenditures exceeds total government expenditure due to transfers
between jur isdictions.
(c) Total slightly different from Table 2.1 with data from later source.
Source: ABS, Government Finance Statistics , Cat. No. 5512.0, 2015–16.
Table 2.3 Sources of general government revenue in 2015–16
Sources of revenue Total government ($billion) % of total revenue
Taxation revenue 464.7 80.5
Sales of goods and services 55.0 9.5
Interest income 8.5 1.5
Dividend income 11.7 2.0
Other 37.6 6.5
Total 577.7 100.0
Source: ABS, Government Finance Statistics , Cat. No. 5512.0, 2015–16.
28 Part 1 Nature of Government
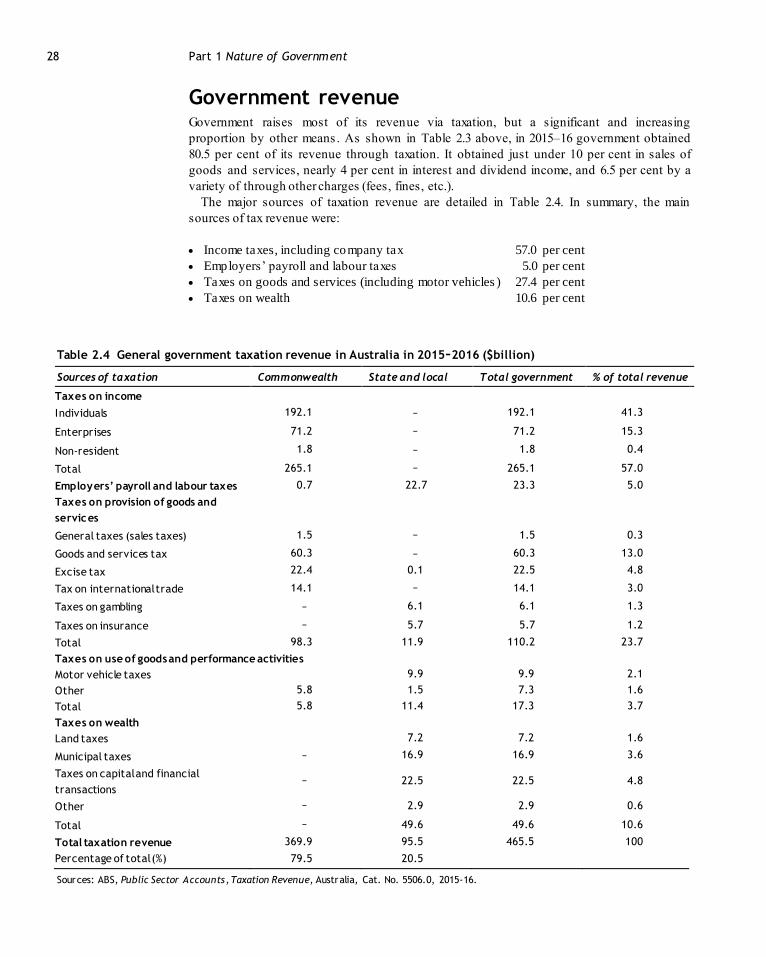
Government revenue Government raises most of its revenue via taxation, but a significant and increasing
proportion by other means . As shown in Table 2.3 above, in 2015–16 government obtained
80.5 per cent of its revenue through taxation. It obtained just under 10 per cent in sales of
goods and services, nearly 4 per cent in interest and dividend income, and 6.5 per cent by a
variety of through other charges (fees, fines, etc.).
The major sources of taxation revenue are detailed in Table 2.4. In summary, the main
sources of tax revenue were:
• Income taxes, including company tax 57.0 per cent
• Employers’ payroll and labour taxes 5.0 per cent
• Taxes on goods and services (including motor vehicles ) 27.4 per cent
• Taxes on wealth 10.6 per cent
Table 2.4 General government taxation revenue in Australia in 2015–2016 ($billion)
Sources of taxation Commonwealth State and local Total government % of total revenue
Taxes on income
Individuals 192.1 – 192.1 41.3
Enterprises 71.2 – 71.2 15.3
Non-resident 1.8 – 1.8 0.4
Total 265.1 – 265.1 57.0
Employers’ payroll and labour taxes 0.7 22.7 23.3 5.0
Taxes on provision of goods and
services
General taxes (sales taxes) 1.5 – 1.5 0.3
Goods and services tax 60.3 – 60.3 13.0
Excise tax 22.4 0.1 22.5 4.8
Tax on international trade 14.1 – 14.1 3.0
Taxes on gambling – 6.1 6.1 1.3
Taxes on insurance – 5.7 5.7 1.2
Total 98.3 11.9 110.2 23.7
Taxes on use of goods and performance activities
Motor vehicle taxes 9.9 9.9 2.1
Other 5.8 1.5 7.3 1.6
Total 5.8 11.4 17.3 3.7
Taxes on wealth
Land taxes 7.2 7.2 1.6
Municipal taxes – 16.9 16.9 3.6
Taxes on capital and financial
transactions – 22.5 22.5 4.8
Other – 2.9 2.9 0.6
Total – 49.6 49.6 10.6
Total taxation revenue 369.9 95.5 465.5 100
Percentage of total (%) 79.5 20.5
Sources: ABS, Public Sector Accounts, Taxation Revenue, Australia, Cat. No. 5506.0, 2015-16.

Chapter 2 Government in Practice 29
A major feature of the tax revenue is the high proportion levied by the Commonwealth. The
Commonwealth collects just under 80 per cent of all taxes, but its own purpose spending
accounts for little over half of all government expenditure. The state and local government
deficit is funded mainly by revenue from the goods and services tax (GST), which the
Commonwealth passes on to the states, and by other grants from the Commonwealth. The
imbalance of expenditure and revenue at each level of government is known as vertical fiscal
imbalance (for further discussion see Chapter 33).
Government Budgets: Deficits, Debt and Assets As we saw in Figure 2.1 total government expenditure usually exceeds current revenue. This
creates a budget deficit. That deficits often occur is not surprising. Expenditure includes
current and capital expenditure. Naturally governments may borrow to fund some or all
capital expenditure, with repayments made as the capital assets provide services, rather than
pay for capital assets out of current revenue. This means creating debt as well as assets. To
understand what is happening, the key financial terms (expenditure, revenue, deficit, debt and
assets) need to be defined.
Expenditure and revenue are flow concepts that apply to a given period. However, there is
an important distinction between cash and accrual accounts. Cash accounts are based on
payments made or received in an accounting period. Accrual accounts are based on expenses
incurred and revenue earned in that period regardless of whether payment has been made or
received. Most private companies use accrual accounts. Australian governments changed
from cash to accrual budgeting in the financial year 1999–2000, as did the UK government.
Five key accrual terms. We now define five key terms in an accrual framework, including
two definitions of budget outcomes.
Current expenditures are expenses incurred to provide services and transfers in a
designated accounting period such as a financial year. Employee expenses include
entitlements such as superannuation and long-service leave that are accrued as well as wages
and salaries paid out in the year. Other operating expenses include depreciation of all assets,
including previously purchased assets, but not expenditure on purchase of new assets.
Transfer payments include personal benefit payments and interest payments.
Current revenue is the revenue due in an accounting period from taxes, sales of goods and
services, interest and dividends, and fees and fines. It also includes operating grants from
another level of government.
The net operating balance equals current operating revenue minus current expenses. It is
broadly similar to a company’s net income (i.e. its profit or loss ).
Net capital investment is capital expenditure on new physical assets and inventories less
depreciation. In an accrual budget, net capital investment does not include the purchase or
sale of financial assets.
The overall budget balance equals the net operating balance minus net capital investment
This is the budget that is commonly referred to as being in deficit or surplus. The balance is
also described sometimes as the net borrowing or lending balance. This measure of budget
balance is not strictly an accrual concept because it includes all capital expenditure and does
not include depreciation.11
Two key cash terms. In addition, there are two important cash-based measures of the overall
budget balance. The underlying cash balance is the budget balance based on cash payments
11 Some experts (e.g. Gruber, 2016, Chapter 4) contend that it is too difficult, and not practical, to distinguish
between consumption and capital expenditure. Our view is that this is a critically important expenditure distinction
with major policy implications (see Chapter 29 below).
Accrual accounting
Expenses and income
are recorded when
they are incurred not
when they are paid
Net operating
balance
Current operating
revenue minus current
expenses
Overall budget balance
Net operating balance
minus net capital
expenditure

30 Part 1 Nature of Government
and receipts rather than on accrued payments and receipts. It includes expenditure on new
assets such as schools, but not the purchase or sale of financial or existing physical assets. It
ignores accrued financial liabilities, such as pensions, and depreciation of plant and
equipment.
The headline cash balance equals the underlying cash balance plus sales and purchases of
financial and physical assets. This allows for the sale of physical assets to fund and apparently
avoid a budget deficit. However, from the perspective of the government’s balance sheet, it is
immaterial whether government sells a physical asset worth $x million or takes on a financial
liability of $x million.
Summary. The main budgetary concepts along with the Commonwealth government’s (then)
estimated budgets for 2016-17 and 2017–18 are shown in Table 2.5. These figures exclude
GST revenue, which the Commonwealth counts as a state tax (though this is contrary to law
and the view of the Australian Bureau of Statis tics). In these years all four estimated measures
of budget balance were in deficit. This is not always the case. In some years one or more of
the four measures of budget balance may be in surplus and the others in deficit. This provides
politicians with a perfect opportunity to confuse the public!
Accrual measures generally provide a more informative picture of the budget than do cash
budgets because they reflect real economic activity over a period and they exclude financial
transactions that have no effect on the net worth of government. Therefore, the preferred
measures of budgetary outcome are the (accrual) net operating balance or budget balance.
However, cash flow forecasts are required, especially for short -term management of the
budget, to establish working capital needs.
The government's balance sheet: assets and liabilities (debts)
We turn now to the government’s balance sheet. The main components for the whole
Australian public sector are defined and shown in Box 2.3. On the one hand, government (on
behalf of the state) owns various financial and non-financial assets. Financial assets include
equity assets. Non-financial assets include produced and non-produced assets (land). On the
other hand, borrowing to fund a budget deficit creates a financial debt (liability).12
Table 2.5 Summary of Commonwealth government budget estimates for 2016-17 ($billion)
Budget figure Basis 2016-17 2017-18 Comments
Total current revenuea Accrual 412.1 444.4 Includes all current revenues
Total current expenses Accrual 450.8 464.3 Real operating expenses
Net operating balance (NOB) Accrual -38.7 -19.8 Current revenue − current expenses
Net capital investment (NCI)b Accrual 2 0.5 Capital expenditure − depreciation
Budget (fiscal) balance Accrual -40.7 −20.3 NOB − NCI = net lending/borrowing balance
Underlying cash balance (UCB) Cash -37.6 -29.4 Budget balance on a cash basis
Headline cash balance Cash -51.1 -48.4 UCB + financial purchases and sales
(a) Includes expected earnings from Future Fund.
(b) Equals net acquisition of non-financial assets.
Source: Treasurer, Budget Strategy and Outlook, 2016–17, Budget Paper No.1, Statement 3, Table 3.
12
Government can fund a deficit by printing money, which is known as an inflation tax (Chapter 25).

Chapter 2 Government in Practice 31
Box 2.3 Key balance sheet concepts and numbers for Australian public sector at 30 June 2016
Assets/liabilities Definition/components $billion
Assets Are controlled and provide future economic benefits
Financial assets Cash, deposits, investments, loans, accounts receivable, equity assets 761.9
Non-financial assets Produced assets and non-produced assets (land), other non-financial assets 1716.7
Total assets Financial plus non-financial assets 2478.7
Liabilities Amounts owed to other parties
Financial liabilities Deposits held, advances received, borrowing, accounts payable 908.9
Other liabilities Unfunded employee entitlements, other provisions 720.2
Total liabilities Financial plus other liabilities 1703.4
Net measures
Net public debt Sum of deposits held, borrowing and advances received less sum of cash,
financial assets (excluding equity) and advances paid 380.4
Net financial liability Total liabilities minus financial assets -941.4
Net public worth Total assets less total liabilities 775.3
Source: ABS, Government Finance Statistics, Cat No 5512, 2015-16.
Table 2.6 Public net worth and net debt as percentage of GDP
Measure 2007-08 2008-09 2009-10 2010-11 2011-12 2012-13 2013-14 2014-15 2015-16
Net public worth 75.6 74.7 72.6 64.6 48.9 55.3 52.8 52.2 46.7
Net public debt -7.3 -3.5 2.3 9.5 15.2 16.1 18.1 20.3 19.1
Source: ABS, Government Finance Statistics, Cat No 5512, 2015–16.
Total financial debt is the stock of liabilities that accrue from running deficit budgets.
These liabilities include deposits received, advances paid, accounts receivable, bo rrowings,
unfunded employee entitlements and various provisions (insurance technical reserves).
There are three important summary measures. One which gets a lot of attention is the net
public debt: this is the sum of deposits held, borrowing and advances received less the sum
of cash, financial assets (excluding equity) and advances paid. The net public debt, combined
with the interest rates attached to the liabilities and assets, determines the net interest payment
to be funded from current revenue.
However, net public debt is only a partial picture of government liabilities and assets. Net
financial liability provides a fuller picture. Net financial liability equals total government
liabilities less financial assets including equity assets. Equivalently, financial assets less total
liabilities are called net financial worth.
The third and most comprehensive measure of government’s financial position is net
public worth, which equals total assets less total liabilities. This is the most important
measure. If government has high net public worth, it should be able t o reconfigure the
components of the balance sheet to provide safe levels of net public debt and net financial
liability.
Table 2.6 shows recent trends in the net debt and net public worth of Australian
governments. Over the decade before the global financial crisis (GFC) in 2007-08, net debt
fell substantially as Commonwealth and state governments sold PTEs and often adopted
overall budget surpluses. Thus, at end 2008-09, general government net debt was negative
(relevant assets exceeded relevant liabilities). Following the GFC, net public debt rose to
around 20% of GDP. By international standards these are still very low amounts of public
Net public debt
Financial liabilities
minus financial assets
(excluding equity)
Net public worth
Total assets less total
liabilities
32 Part 1 Nature of Government
debt. On the other hand, with the rise in debt, the net public worth fell from around 75% of
GDP before the GFC to around 50% of GDP at end 2016-17.
These totals conceal major differences between different levels of government. The states
collectively have high net public wealth (in land, fixed assets and PTEs) and very low debt.
On the other hand, at end 2015-16, the Commonwealth had a negative net worth of $403
billion, including a net debt of $300 billion due to recent budget deficits as well as large
unfunded superannuation liabilities. Thus, the Commonwealth net debt was over 90% of all
government debt and equivalent to 18.1% of GDP. Some policy implications are discussed in
Chapter 29.
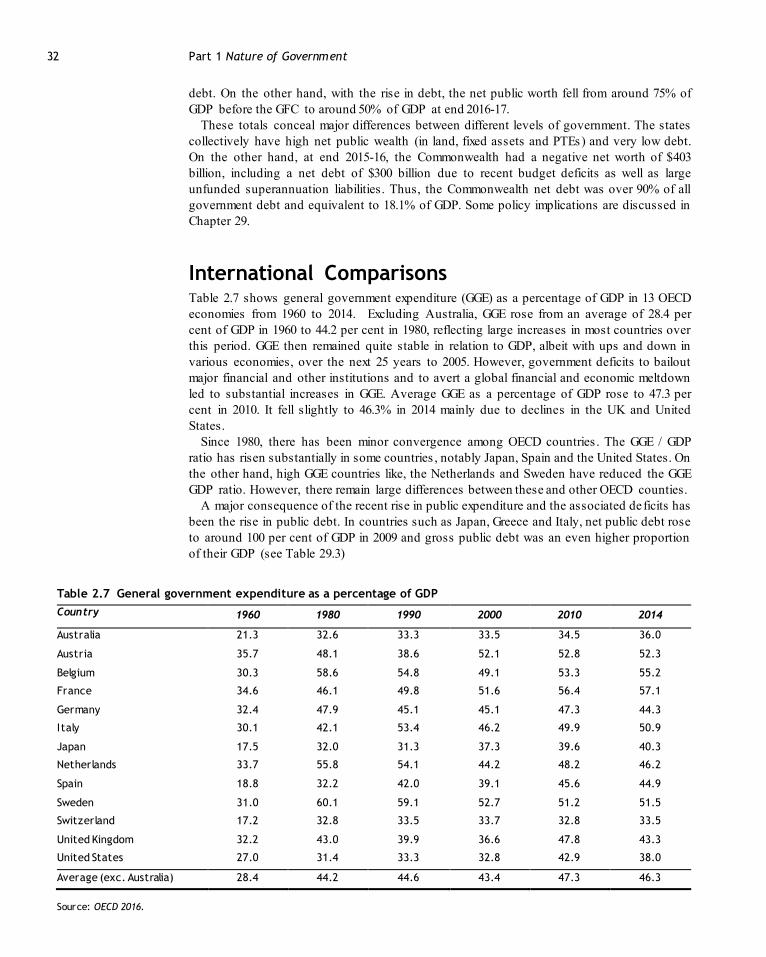
International Comparisons Table 2.7 shows general government expenditure (GGE) as a percentage of GDP in 13 OECD
economies from 1960 to 2014. Excluding Australia, GGE rose from an average of 28.4 per
cent of GDP in 1960 to 44.2 per cent in 1980, reflecting large increases in most countries over
this period. GGE then remained quite stable in relation to GDP, albeit with ups and down in
various economies, over the next 25 years to 2005. However, government deficits to bailout
major financial and other institutions and to avert a global financial and economic meltdown
led to substantial increases in GGE. Average GGE as a percentage of GDP rose to 47.3 per
cent in 2010. It fell slightly to 46.3% in 2014 mainly due to declines in the UK and United
States.
Since 1980, there has been minor convergence among OECD countries . The GGE / GDP
ratio has risen substantially in some countries , notably Japan, Spain and the United States. On
the other hand, high GGE countries like, the Netherlands and Sweden have reduced the GGE
GDP ratio. However, there remain large differences between these and other OECD counties.
A major consequence of the recent rise in public expenditure and the associated deficits has
been the rise in public debt. In countries such as Japan, Greece and Italy, net public debt rose
to around 100 per cent of GDP in 2009 and gross public debt was an even higher proportion
of their GDP (see Table 29.3)
Table 2.7 General government expenditure as a percentage of GDP
Country 1960 1980 1990 2000 2010 2014
Australia 21.3 32.6 33.3 33.5 34.5 36.0
Austria 35.7 48.1 38.6 52.1 52.8 52.3
Belgium 30.3 58.6 54.8 49.1 53.3 55.2
France 34.6 46.1 49.8 51.6 56.4 57.1
Germany 32.4 47.9 45.1 45.1 47.3 44.3
Italy 30.1 42.1 53.4 46.2 49.9 50.9
Japan 17.5 32.0 31.3 37.3 39.6 40.3
Netherlands 33.7 55.8 54.1 44.2 48.2 46.2
Spain 18.8 32.2 42.0 39.1 45.6 44.9
Sweden 31.0 60.1 59.1 52.7 51.2 51.5
Switzerland 17.2 32.8 33.5 33.7 32.8 33.5
United Kingdom 32.2 43.0 39.9 36.6 47.8 43.3
United States 27.0 31.4 33.3 32.8 42.9 38.0
Average (exc. Australia) 28.4 44.2 44.6 43.4 47.3 46.3
Source: OECD 2016.

Chapter 2 Government in Practice 33
Table 2.8 Structure of general government expenditures (as percentages), 2015
Country General public
services
Defence Public order
and safety
Economic
affairs
Health Education Social security
and welfare
Othera
Australia 12.5 4.4 4.9 10.0 19.4 14.6 28.2 6.1 Denmark 13.5 2.0 1.8 6.7 15.6 12.8 43.0 4.5
France 11.0 3.1 2.9 10.0 14.3 9.6 43.1 6.0 Germany 13.5 2.3 3.6 7.1 16.3 9.6 43.1 4.6
Italy 16.6 2.4 3.7 8.1 14.1 7.9 42.6 4.6 Japan 10.4 2.3 3.2 9.5 19.4 8.7 40.7 5.6 Spain 14.9 2.2 4.6 10.0 14.2 9.3 39.1 5.7
Sweden 14.1 2.3 2.6 8.4 13.8 13.0 41.6 4.2 United Kingdom
10.6 5.0 4.7 7.1 17.8 12.0 38.4 4.5
United States
13.8 8.8 5.4 8.7 24.2 16.2 20.8 2.1
OECD 13.2 5.1 4.3 9.3 18.7 12.6 32.6 4.2
(a) Includes environment protection, housing and community amenities, and recreation, culture and religion.
(b) Based on 2015–16 expenditure.
Source: OECD Statistics, General Government Accounts , Government Expenditure by Function, 2015–16.
Table 2.8 shows the shares of the major components of general government expenditure in
various OECD countries in 2015. Because classifications may vary between countries, too
much should not be inferred from minor differences. However, clearly, inter-country
differences in GGE result more from differences in income transfers (social security and
welfare payments) than from differences in expenditure on goods and services. Australian
expenditure on goods and services was broadly in line with international practice , but
expenditure on social security and welfare was significantly lower than in most other
countries except for the United States.
The reasons for the low level of social security payments in Australia include smaller
proportions of elderly and unemployed people than in Europe, more reliance on the private
sector for retirement incomes and workers’ compensation, and a more means -tested approach
to social assistance than is common in many other countries. These issues are discussed in
more detail in Chapters 22 and 23 below.
Determinants of Government Expenditure What drives the levels of general government expenditure that we have observed? As we have
noted, the major components of government expenditure are expenditure on consumption
goods and services and welfare (transfer) payments. We focus mainly on these below but also
discuss briefly transfer payments other than welfare payments and capital expenditure.
But, to start, we make two preliminary observations. First, expenditure is a product of the
quantity of goods or services supplied and their unit costs. Therefore, we need to consider
what drives both quantities and costs. Second, quantities may be driven by normal demand
factors, broadly by individual preferences, or by social preferences (views on equity and
social justice). Individual preferences are easier to measure and forecast and we can draw on
conventional economic studies and explanations. Social preferences can be explained and
understood but are harder to measure and forecast.
On the other hand, a more political approach to explaining public expenditure emphasises
the role of politicians, bureaucrats and special interest groups in influencing government
expenditure. These factors are examined in Chapter 10.

34 Part 1 Nature of Government
Government consumption expenditure
To explain government spending on consumption goods , we need therefore to consider the
quantity and unit cost of government consumption goods . Holding other public expenditure
constant, government expenditure rises in relation to GDP if either (1) the quantity of publicly
provided goods rises faster than the output of market goods or (2) the cost of publicly
provided goods rises relative to the cost of other goods.
As discussed in Chapter 4 (see Table 4.1), governments supply a wide range of goods,
including pure public goods that are necessary for the functioning of the state, a range of
goods associated with market failures of some kind, including various health, education and
infrastructure services, and many goods for social purposes, again often health and education
services, but also housing and family support services of various kinds, to name just a few
examples. Clearly the demand for many of these services depends on both individual and
social preferences.
Individual preferences are primarily a function of income, demographics, external
circumstances and relative prices. Demand for public goods may rise faster than GDP if the
income elasticity of demand for public goods is greater than 1.0, demographic changes
increase the demand for major public services like health or education or increased population
density and urban congestion increase demand for environmental and urban services. As we
see below, there is no clear answer whether this demand does grow faster then GDP.
In a review of the evidence from cross -sectional studies of state and local government data
in the United States, Mueller (2003) found that most estimates of the income elasticity of
demand for public goods are less than 1.0 and that few estimates of the income elasticity are
substantially greater than 1.0.
On the other hand, several studies (e.g., OECD, 2003; Villanyi et al., 2010; Australian
Treasury, 2010) have shown that an ageing population is likely to increase the GGE/GDP
ratio. The OECD (2003) estimated that the increasing proportion of over 65s in the population
will increase public expenditure on health care and long-term care by between 1.5 and 4.0
percentage points of GDP up to 2050. An ageing population also reduces the workforce
participation rate which raises the GGE/GDP ratio.
Circumstances, such as increased urban densities, congestion and environmental pressures ,
may also raise the demand for some government services, for example public transport and
waste disposal services. Some, but not all, such pressures may be dealt with by regulation
rather than by increased public services.
Turning to social preferences, similar factors drive the provision of welfare services as
drive the provision of cash transfers that are discussed below. Fundamental to this is society’s
perception and acceptance of social needs. However, there may well be social preferences to
provide services, including health, education and s ocial services of various kinds for those
who cannot afford them and to do so in preference to income transfers. These issues are
discussed at many points in this book.
It may be supposed as a default assumption that the costs of public production would rise
approximately in a similar fashion to the costs of private production. In that case, relative
quantities of production rather than relative prices would drive the contribution of public
production to GDP.
In a classic article, Baumol (1967) argued that costs of public production would rise faster
than costs of private production because government mostly provides labour intensive
services. He argued that opportunities for productivity improvements in government are low
because of the small role of technology and the relatively few opportunities for substituting
capital for labour. If wages in government employment rise with market wages, as they are
likely to, unit costs would rise faster in government than in private firms. Mueller (2003) cites
various studies that found a relative rise in the price of government-provided goods and that
this explained part of the rise in general government expenditure.
Chapter 2 Government in Practice 35
However, it is not clear that this phenomenon is due to technical constraints or that
productivity must rise more slowly in the public sector. Computers and other innovations
provide many opportunities for increased productivity in provision of services, which is now
the dominant part of the private sector in most OECD countries including Australia. If
productivity does rise by less, and unit costs by more, in the public sector than in the private,
this may be due to bureaucratic inertia and constraints rather than to the inherent technology
of supplying public services. Tunny (2000) found that, in so far as the cost effect exists, the
causes of rising costs appear to be political rather than technical.
Personal transfer payments
Personal transfer payments depend on (1) the number of beneficiaries and (2) the levels of
benefits provided. Clearly, government determines both eligibility for benefits and benefit
levels. Ideally these decisions would be a result of social preferences taking account of both
the ability to pay of the better-off in society and the needs of the less well-off, as well as to
any disincentives arising from income transfers. Of course, in some cases, the decisions are
arbitrary or self-promoting political decisions rather than an outcome of social preferences.
However, given the eligibility criteria, the number of beneficiaries depends on economic,
social and demographic circumstances. Government transfer payments rise with increased
numbers of age-based (young and old) dependants in society, families and single parents,
unemployment and earnings inequalities. Widespread demographic and social changes have
increased the proportions of elderly persons and single-parent households in many societies.
Market forces along with globalisation have greatly increased economic inequality within
countries (see Chapters 20 and 34). In most OECD economies, transfer payments have risen
in proportion to GDP because governments have extended eligibility for personal benefits, for
example to single parents and for maternity leave, and because they have increased personal
benefit levels. However, the proportions of unemployed and elderly persons have also risen,
reflecting economic and social factors.
In Australia, in the 1960s under 1 million people (about 10 per cent of the population)
received benefits from the Commonwealth government. Today, out of a population of 24.3
million, some 2.5 million receive public pensions, 2 million families receive family support
payments, over 0.7 million receive disability allowances and another 0.7 million receive
unemployment benefits. Ignoring other smaller categories of recipients and counting families
as one individual, there are some 6 million people in these major benefit categories or about
24 per cent of the population. This reflects social or economic changes as well as social
preferences and political determinations.
Other transfer payments
As we observed above, other transfer payments have fallen significantly relative to GDP in
Australia in recent years due principally to declines in government borrowing and lower
nominal interest rates. Government subsidies to business have also fallen. However,
government borrowing and interest rates may of course rise.
Government capital expenditure
Early theories suggested that government capital expenditure would rise as a proportion of
GDP with increased demand for the transport, communications and energy infrastructure
necessary for economic development.13 In so far as these are public goods (associated with
some form of market failure) the government would have a major role in the supply of these
goods. In developed economies it is sometimes argued that public investment is required to
cope with high-density urban systems and environmental degradation. While there is casual
13
This is sometimes called Wagner’s law of expanding state activity (named after the 19th century economist).

36 Part 1 Nature of Government
observation that this investment is required and is being undertaken in Australia’s large st
cities (Sydney and Melbourne), we are not aware of empirical studies of the interaction
between government capital expenditure and urbanisation. Indeed, in Australia it is often
argued that low population density creates higher demands on public expenditure.
Summary
Economic factors explain some changes in government consumption expenditure and transfer
payments. The demand for public consumption goods rises with income, but it does not
appear to be income elastic. Demand also changes with changes in demographic structure.
Government expenditure may also rise relatively fast because of low increases in productivity
in the public sector, but this may reflect bureaucratic and political inefficiency rather than
technical factors of production.
Economic and demographic factors can also explain some increases in transfer payments
associated with increased dependants and income inequality. Moreover, some commentators
have observed that technical changes, such as increased cash transactions in developing
countries and electronic innovations in developed economies, have facilitated the means by
which governments can collect tax and fund desired expenditures.
In a study of the determinants of the growth in public expenditure, Borcherding (1985)
estimated that economic factors (income and cost changes) explained 38 per cent of the
growth in US public budgets. Most of the balance would be explained by an increase in
transfer payments. This is, of course, a very dated study and based on the US economy. But it
seems likely to-day that public expenditure, especially the large component involved in
transfer payments, reflects to a large extent social preferences or political factors.
Summary
• The Commonwealth of Australia Constitution Act 1900
(with amendments) establishes the main powers of the
Commonwealth and state governments, including their
economic powers.
• The most common measure of government size is the ratio
of general government expenditure to GDP.
• Government also regulates the private sector in many
ways, including by coerced private expenditures which may
substitute for public expenditure.
• General government expenditure in Australia is about 35
per cent of GDP. The largest components are government
consumption expenditure and personal benefit transfers.
• Australian governments raise nearly 80 per cent of current
revenue via taxation, with most of the rest raised by s ale
of goods and services, receipts of interest and dividend
payments, fees and fines.
• Commonwealth taxes account for over 80 per cent of all
taxes collected but the Commonwealth accounts for only
half of own purpose expenditures.
• The overall budget balance equals current revenue less
operating expenses and capital expenditure.
• The net operating balance equals current revenue less
current expenses.
• The two key balance sheet concepts are net public debt
and net public worth. Net public debt is broadly financial
liabilities less financial assets (excluding equity holdings).
Net public worth is total assets less total liabilities.
• Compared with other developed economies, Australian
government expenditure is low. This reflects mainly a
lower level of income transfers due to means testing of
benefits. It also reflects a relatively high level of mandated
private expenditure for welfare purposes.
• Government expenditure on goods and services can be
explained partly by market failures and by socioeconomic
factors such rising income, the relative unit costs of
government production and demographic factors. Socio-
economic factors, such as demographic changes, also
explain some of the growth in transfer payments.
• However, social preferences relating to household needs
and political decisions are the main drivers of transfer
payments and also impact on government capital and
consumption expenditures.

Chapter 2 Government in Practice 37
Questions
1. If government size is measured by the ratio of general
government expenditure to GDP, what happens to the
size of government if:
i. government increases welfare payments to unemployed persons, when such transfer payments
are not recorded as part of GDP?
ii. unemployment rises?
iii. interest rates fall?
iv. government increases income tax rates?
v. government requires all households with more than
a certain level of income to hold private health insurance?
vi. government subsidises private health insurance?
vii. the terms of trade improve?
2. Explain why tax expenditures can have the same real
effects as actual government expenditures. Give an
example.
3. Explain the difference between cash and accrual accounting.
4. What is the distinction between current and capital
expenditure? What are the arguments for and against
treating capital expenditure differently in the government’s accounts?
5. The headline cash budget balance is a common
measure of budget outcomes. What are the main
weaknesses of this measure?
6. Are student university fees included in Commonwealth government revenue? And are HECS repayment
obligations included in the net worth of the
Commonwealth?
7. The Australian government has established a Future
Fund with revenues from past budget surpluses and
asset sales quarantined in the Fund to pay for unfunded superannuation liabilities. What are the
main arguments for and against such a fund?
8. How can the income elasticity of demand for public
goods be estimated from cross-sectional data for different jurisdictions, such as US states and local
governments? What difficulties might arise in
estimating this income elasticity?
9. Does Baumol’s theory of low public sector productivity growth partly explain the increase in
government expenditure as a percentage of GDP?
10. Personal benefit payments as a percentage of GDP
have doubled since the 1960s. What factors explain the increase in personal benefit payments? Is this
trend likely to continue in the future?
11. What are
i. the major government expenditure benefits in kind
to Australian households?
ii. the major business subsidies provided by the Australian government?
12. In presenting the 2011–12 budget, the Australian
government announced provision of $3.1 billion to the
National Broadband Network Company which it owns, but it did not include this amount in the
estimated expenditure or in the budget deficit of $22.6
billion. How could the government justify excluding this payment from the budget? Is this exclusion
appropriate?
Further Reading
Australian Bureau of Statistics (2005) Australian System of
Government Finance Statistics: Concepts, Sources and
Methods, ABS, Cat. No. 5514.0, Canberra.
Australian Bureau of Statistics (2017) Government Finance
Statistics: Australia ABS, Cat. No. 5512.0, Canberra.
Borcherding, T.E. (1985) ‘The causes of government
expenditure growth: a survey of the U.S. evidence’,
Journal of Public Economics, 28, 359–382.
Gruber, J. (2016) Public Finance and Public Policy, 5th ed.,
Chapter 4, Worth Publishers, New York.
Mueller, D.C. (2003) Public Choice III, Chapter 21, Cambridge
University Press, Cambridge.
Robinson, M. (2002) ‘Accrual accounting and Australian fiscal
policy’, Fiscal Studies, 23, 287–300.
Rosen H. and T. Gayer (2014), Public Finance, 10th ed.,
Chapter 1, McGraw-Hill, New York.
Treasurer (2010) Australia to 2050: Future Challenges,
Treasury, Canberra.
Treasurer (2011) Budget Strategy and Outlook 2011–12
(Australian Government budget
<http://www.budget.gov.au>).

38