Mr. Clout 2004
33
Colombia O P E R A T I O N S 2 0 0 3 - 2 0 0 4 Presented By Fernando R. Aceituno – B.O.M.
-
Upload
gabrielheidegger -
Category
Economy & Finance
-
view
196 -
download
1
Transcript of Mr. Clout 2004
ColombiaO P E R A T I O N S
2 0 0 3 - 2 0 0 4
Presented
By
Fernando R. Aceituno – B.O.M.

Acquisitions2 0 0 3 – 2 0 0 4

1,802
1,5921,485
1,433
1,052960
1,1171,209
1,680
0
200
400
600
800
1000
1200
1400
1600
1800
2000
2002: I 2002: II 2002: III 2002: IV 2003: I 2003: II 2003: III 2003: IV 2004: I
Vo
lum
eApplications Volume
Average in Quarters2 0 0 3 - YTD 2 0 0 4

Approved Qualified
Applications Breakdown 2 0 0 3
Rejected13%
Qualified20%
Approved67%
Applications Breakdown 2 0 0 2
Rejected13%
Qualified23%
Approved64%
Applications Breakdown First Quarter - 2 0 0 4
Approved73%
Qualified16%
Rejected11%
Rejected
Credit Decisions2002, 2003, YTD 2004

Credit Purchases: New & Used Average in Quarters2 0 0 3 - YTD 2 0 0 4
489 501570 550
758
232 185
235 254
216
0
100
200
300
400
500
600
700
800
900
1000
2003: I 2003: II 2003: III 2003: IV 2004: I
New Used

• Basel II’s Credit Risk Models attributed to S.I.B. normative have already been developed and implemented.
• Basel II’s credit risk guidelines (S.A.R.C.) will remain as GMAC Colombia’s credit cycle cornerstone.
• Re-structuring of Acquisitions Department into two specialised analysis and purchase operations areas:
• Risk evaluation and Control Practices were enhanced (Retail Credits and Commercial Lending)
• Service Standards were discussed with Dealers and are currently met at 100%• Purchases Area strengthened operational risk identification and control
• Strong Coordination between Operations Areas to administer and control credit risk events:
• 2 years in a row with negative losses. FPD’s reduced from 120 (2001) to 16 (2002) and 8 (2003)
• Integration between all Branch Operations Areas to evaluate and control losses: FPD’s, Dealers’ delinquency, Dealer losses, etc.
Achievements 2 0 0 2 - 2 0 0 3

• Act as One Company:
• Partner with GM to create retail and leasing plans aimed at increasing both GM & GMAC Market Share.
• GM shall remain as a partner and a customer.
• Basel II: In paralell with credit analysts, follow up on credit risk models. Bring out the best from Credit Risk Models, diminishing losses and strengthening sales.
• Service Standards: 100% compliance with credit analysis and service Standards already agreed with GM Dealers. DSS: 80% - 85%.
• Reciprocity Program: Support GMAC Operations – Sales/F & I Reciprocity Program providing differentiated added value financial services.
• Very Important... Normalise DSI to 80% - 90%!!!
Challenges 2 0 0 4 – 2 0 0 5

Collections & Salvage2 0 0 3 – 2 0 0 4

Branch’s Total DelinquencyDecember 2001 – March, 2004
6.3%
0
2
4
6
8
10
12
14
16
Dec 01 Jan Fe
bMar Ap
rMay Ju
nJu
lyAug Se
pOct Nov
Dec 02 Jan Fe
bMar Apr
May Jun Ju
lAu
gSe
pOct Nov
Dec 03 En
eFe
bMar
Dec 04
(T)
Per
cent
age
(%)
15-18’s
Over 90’s
61--90
31-60

Branch’s Total DelinquencyDecember 2001 – March, 2004
13.712.8
11.9
13.613.3
13.8
13.012.4
13.0
12.3
11.310.9
10.09.8 9.9 9.9 9.6
10.09.4 9.1 9.1
8.6 8.4 8.4 8.17.6 7.2 7.2
6.3
0
2
4
6
8
10
12
14
16
Dic-01 Jan Fe
bMar Apr
May Jun
July
Aug Sep
Oct NovDic-
02 Jan Feb
Mar AprMay Ju
n Jul
Aug Sep
Oct NovDic-
03 Ene
Feb
Mar
Trgt./2
004
Pe
rce
nta
ge
(%
)

Over 30’sDecember 2001 – March, 2004
6.8
6.2
5.8
6.66.4
7.1
6.6 6.6
7.3
6.7
6.3 6.35.9
5.65.8 5.8 5.8
6.1
5.45.2
5.3
4.64.4
4.6
4.2
3.8 3.7 3.63.5
0
1
2
3
4
5
6
7
8D
ec 0
1
Jan
Feb
Mar
Apr
May Jun
July
Aug Sep
Oct
Nov
Dec
02
Jan
Feb
Mar
Apr
May Jun Jul
Aug Sep
Oct
Nov
Dec
03
Ene
Feb
Mar
Dec
'04
(T)
Pe
rce
nta
ge
(%
)

Over 60’sDecember 2001 – March, 2004
1.0
1.31.3
1.61.6
1.51.6
1.7
1.4
1.61.7
1.51.5
1.7
1.9
1.7
1.51.5
1.8
2.32.22.2
2.52.52.6
2.9
2.3
2.5
2.7
0
0.5
1
1.5
2
2.5
3D
ic-0
1
Jan
Feb
Mar Apr
May Jun
July
Aug
Sep
Oct
Nov
Dic
-02
Jan
Feb
Mar Apr
May Jun Jul
Aug
Sep
Oct
Nov
Dic
-03
Ene
Feb
Mar
Trgt
./20
04
Per
cent
age
(%)

Over 90’s and 15-18’sDecember 2001 – March, 2004
1.92.1
1.72.0
2.42.1 2.0 2.0 2.0 2.0 2.0 1.9
1.51.3 1.2 1.3 1.3 1.4 1.3
1.61.8 1.8 2.0
1.8 1.7 1.7 1.6 1.71.3
2.4 2.1
2.2
2.1
2.1
2.1
1.91.7
1.5 1.31.2
1.2
1.11.2
1.11.1 1.0
1.01.0
0.80.6 0.5
0.40.5
0.6 0.60.6
0.6
0.5
0
0.5
1
1.5
2
2.5
3
3.5
4
4.5
Dec 01 Jan Fe
bMar Ap
rMay Ju
nJu
lyAu
gSe
pOct Nov
Dec 02 Jan Fe
bMar Ap
rMay Ju
n Jul
Aug
Sep
Oct Nov
Dec 03 En
eFe
bMar
Dec 04
(T)
Pe
rce
nta
ge
(%
)
Over 90`s 15'18's
15-18’s
Over 90’s

Transfers to 15-182001 – YTD April, 2004
267M
1.1MM1.1MM
2.0MM
62Accounts
174Accounts
190Accounts
736Accounts
0
500
1000
1500
2000
2500
2001 2002 2003 YTD 03/ 04
Am
ount
in U
S$
/ Acc
ount
s N
o.
Amount Transferred (US$) Accts. transferred to 15-18
Exchange Rates:
•12/2001: 2,291:1•12/2002: 2,816:1•12/2003: 2,650:1•04/2004: 2,670:1

15-18 Outstanding v/s 15-18 Recoveries2001 – April, 2004
642M526M
632M
2.1MM
52M
361M
642M 759M
0
500
1,000
1,500
2,000
2,500
2001 2002 2003 YTD 03/ 04
Am
ount
in U
S$
15-18 O/S (Principal) 15-18 Recoveries
Exchange Rates:
•12/2001: 2,291:1•12/2002: 2,816:1•12/2003: 2,650:1•04/2004: 2,670:1

Transfers to 51 v/s 51 Recoveries2001 – March, 2004
128M
901M836M
3.6MM
291M
1.8MM1.8MM
1.4MM
0
500
1,000
1,500
2,000
2,500
3,000
3,500
4,000
2001 2002 2003 YTD 03/ 04
Am
ount
in U
S$
Transfers to 51 51 Recoveries
Exchange Rates:
•12/2001: 2,291:1•12/2002: 2,816:1•12/2003: 2,650:1•04/2004: 2,670:1

Repos’ InventoryBy Legal Status
In Vol. Custody
1%
Captured42%
In Process to be Repo3%
Ready for Sale1%
Sold to 3rd. Party
3%
Offered to GMAC
1%
Court Auction
19%
In Legal Custody
30%
In Legal Custody
25%
Court Auction
15%Offered to
GMAC 1%
Sold to 3rd. Party
3%
Ready for Sale2%
In Process to be Repo3%
Captured49%
Vol. Custody
2%
2002 2003

Repos’ Inventory Rotation
120
240
142138
0
50
100
150
200
250
300
Stat us
2002 2003
2002 240 120
2003 138 142
Captured Sold

Total Inventory
450 494 438
260263
355
0
100
200
300
400
500
600
700
800
900
2002 2003 03/31/2004
Country Bodega GMAC

Repossession Process
II: Capture of the Vehicle
1: Debtor Sued by GMAC
III: Court Legal Custody
IV: Court Auction
Sold to 3rd. Party
Legally Offered to GMAC
Vehicle Paid to GMAC
Vehicle Ownership Transfer to GMAC Ready for Sale
II. Involuntary Surrenders
I. Voluntary Surrenders
Account Past Due
Account Not Past Due CS Contacts Branch – Offers vehicle as Payment of Obligation
Customer is Contacted by Branch Collections-Salvage Representatives
Ready for Sale
Ready for Sale

< 6 Pmts > 6 PmtsNo. No. Total
2003 8 134 1422002 17 103 1202001 25 133 158
New % Used % Total Repos Portfolio2003 111 0.63 31 0.17 142 17,672
2002 105 0.62 17 0.1 120 16,822
2001 151 0.93 7 0.04 158 16,205
Repos Add’l Information

Achievements & Challenges
• Collections and Salvage became Profit Center Units.
• Positive results in losses contributed to implement a more flexible credit policy and increased GMAC competitiveness.
• Two years achieving stretch targets in... Over 30’s, Over 60’s, Over 90’s ranges and 15-18 Outstandings, transfers to 15-18’s, Collection expenses (–80%) and Salvage and Repo Recoveries.
• Main Challenge: Maintain positive results re-inventing periodically Branch’s Collections and Salvage Strategies.
Wholesale2 0 0 3 – 2 0 0 4

Wholesale Department As of March 31th 2004
May 12, 2004
W/S Penetration increased from 88% (2002) to 94.5% (As YTD ’04)
Approved Credit Lines represent Col$136,663MM (US$51MM)
Total W/S Outstanding represents Col$110,180MM (US$41MM) (As of 03/31/04)
34 GMAC Commercial Accounts (Active GM Dealers)
Wholesale Credit Lines established at all 34 authorized GM Dealers

Dealer Network Overview
Dealers Dealers Total CreditlinesClassification Number US$(M) 2002 2003 YTD 2004 2002 2003 YTD 2004
Satisfactory 20 34,611 148 140 24 25 23 1Limited 13 16,372 141 138 38 23 24 6
Programmed 1 130 10 12 3 1 2 0Totals 34 51,113 299 290 65 49 49 7
ReviewsAudits
• “Gutierrez Dangond” remains as the only “P” Dealer, whose conversion (04/03) was effectively closed as of 30/07/2002.
• In 2002, 21 audits were conducted to Motrix Car, GM Dealer converted as of Feb 15, 2002. This Dealer adhered to local bankruptcy law “Ley 550”, equivalent to US Chapter 11. Motrix Car was eliminated from the list of active Dealers in the same year.

Branch’s Largest ExposuresAs of March 31, 2004
May 12, 2004
Dealer W/S Credit Line
Name Classification US$,MM Reported Adjusted Reported Adjusted 2001 2002 2003 YTD '04 2001 2002 2003 2004
Los Coches S 6.4 5.2 1.4 16 9.7 6 6 8 2 0 0 0 0
Autoniza S 3.7 2.8 2.5 1.2 0.9 14 12 12 1 30 70 16 0
La Floresta L 3.7 5.3 5.1 0.7 0.5 14 14 13 3 52 116 8 6
Autolarte S 2.9 2.9 2.4 2.9 2.5 6 6 6 1 13 4 9 1Internacional S 2.7 3.1 2.5 4.3 3.7 4 4 4 1 0 0 2 0
IrregularitiesAuditsNW NWC
2000 2001 2002 2003 YTD '04Audits Taken 385 348 299 290 65Irregularities 269 172 289 114 32Ret. Checks 48 54 25 6 0 (1)
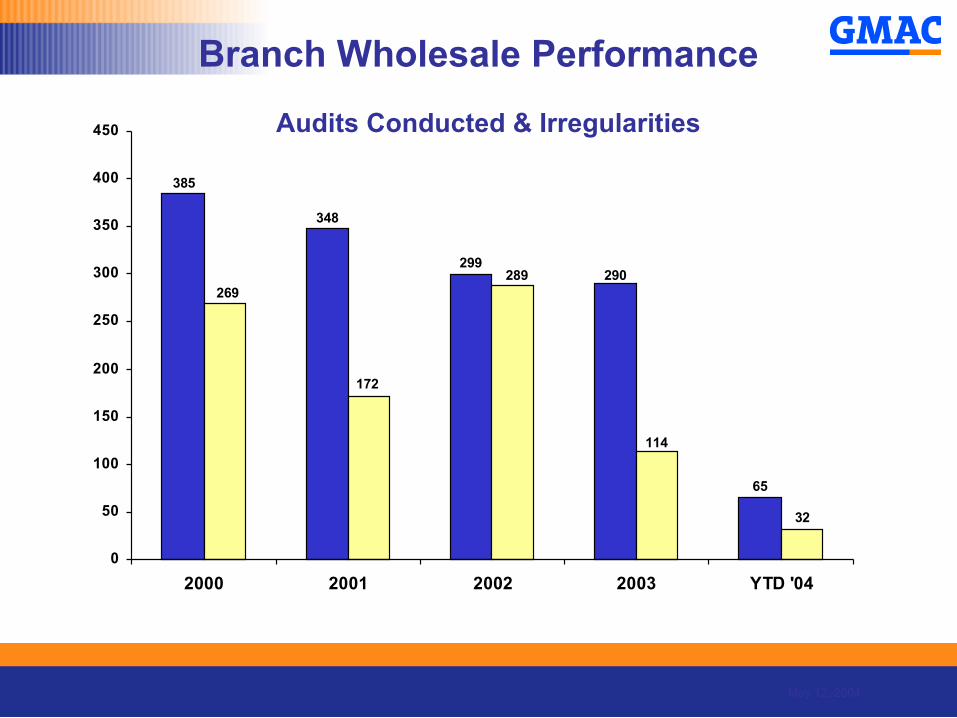
Branch Wholesale Performance
May 12, 2004
385
348
299290
65
289
172
269
114
32
0
50
100
150
200
250
300
350
400
450
2000 2001 2002 2003 YTD '04
Audits Conducted & Irregularities

Branch Wholesale Performance:
6
25
54
48
00
10
20
30
40
50
60
2000 2001 2002 2003 YTD '04
Returned Checks (NSF)

Working Capital Loans
Branch Wholesale Performance
May 12, 2004
Col$,MM US$,MM
IV Quarter 2003 3,362 1.21 1,761 630
I Quarter 2004 3,968
1.48
1,534 570
Dealer Loans Loans’ Outstanding
Col$,MM US$,M

Branch Wholesale Performance
7.7MM9.0MM
21.1MM 21.4MM
0
5
10
15
20
25
Prime R.E. Securities (US$,MM)U
S$
2001 2002 2003 YTD 2004
• Dealer inventories are growing as GM pressures for Market Share (36% market-share as YTD 12 ’03).
• GM has realised importance of partnering with GMAC as strategic source of funds to support Dealers’ purchases.
• GMAC is strongly supporting GM. Even GMAC W.I.P. is based on GM objectives.
• GMAC made GM aware of having a strong, secured and financially slacked Dealer Network and works together with GMAC to negotiate guarantees to further securitise the Dealer Network.
• All Colombian Dealers are profitable with booming new car sales. This positive business environment represents the right time to protect the Branch’s future negotiating additional guarantees from Dealers.

• W.I.P. implementation affected positively GMAC Colombia retail penetration
• D.S.S.: Wholesale area best service rank ever – 93%
• Interest Free Wholesale was successfully negotiated with GM, representing GMAC US$3.8MM, in annual terms.
• Collateralization Plan continued, representing GMAC US$10MM in additional RE securities.
• Area Re-structuring program strengthened credit risk evaluation and control
• Wholesale Credit Risk Model was developed and implemented to meet S.A.R.C. guidelines (Basel II)
Achievements2 0 0 4 – 2 0 0 5

Challenges2 0 0 4 – 2 0 0 5
• Offer GM continuos support and excel in service level to GMAC’s No.1 customer and strategic partner.
– Partner with GM to increase GMAC w/s penetration and to closely monitor all Dealer's risk & exposure in order to offer sufficient credit lines to support GM’s most demanding market share targets.
• Negotiate maintenance of Interest Free Wholesale • Negotiate additional incentives from GM to implement mutually
beneficial retail and leasing plans.• Support GMAC sales, bringing out the best from W.I.P. Make
W.I.P. benefits attainable through attractive plans and consultative practices.
• Maintain current level of Dealer Satisfaction Index of 93% (previous survey (2001): 88%)
END OF PRESENTATION
ColombiaO P E R A T I O N S
2 0 0 3 - 2 0 0 4
May 12, 2004: Fernando R. Aceituno – Branch Operations Manager