MPU September 2011 110906. Figures Figure 1. Repo rate with uncertainty bands Per cent, quarterly...
27
MPU September 2011 110906
-
Upload
jennifer-maxwell -
Category
Documents
-
view
214 -
download
0
Transcript of MPU September 2011 110906. Figures Figure 1. Repo rate with uncertainty bands Per cent, quarterly...
MPU September 2011
110906

Figures

Figure 1. Repo rate with uncertainty bandsPer cent, quarterly averages
-1
0
1
2
3
4
5
6
7
8
-1
0
1
2
3
4
5
6
7
8
04 05 06 07 08 09 10 11 12 13 14
90%75%50%OutcomeForecast
Source: The RiksbankNote. The uncertainty bands for the repo rate are based on the ability of risk-adjusted market rates to forecast the future repo rate. The uncertainty bands do not take into account the fact that there may be a lower bound for the repo rate.

Figure 2. GDP with uncertainty bandsAnnual percentage change, seasonally-adjusted data
-8
-6
-4
-2
0
2
4
6
8
10
-8
-6
-4
-2
0
2
4
6
8
10
04 05 06 07 08 09 10 11 12 13 14
90%
75%
50%
Outcome
Forecast
Sources: Statistics Sweden and the Riksbank
Note. The uncertainty bands are based on the Riksbank’s historical forecasting errors. There is also uncertainty for the outcomes for GDP, as the figures in the National Accounts are revised several years after the preliminary publication.

Figure 3. CPI with uncertainty bandsAnnual percentage change
-2
-1
0
1
2
3
4
5
6
-2
-1
0
1
2
3
4
5
6
04 05 06 07 08 09 10 11 12 13 14
90%75%50%OutcomeForecast
Sources: Statistics Sweden and the Riksbank
Note. The uncertainty bands are based on the Riksbank’s historical forecasting errors.
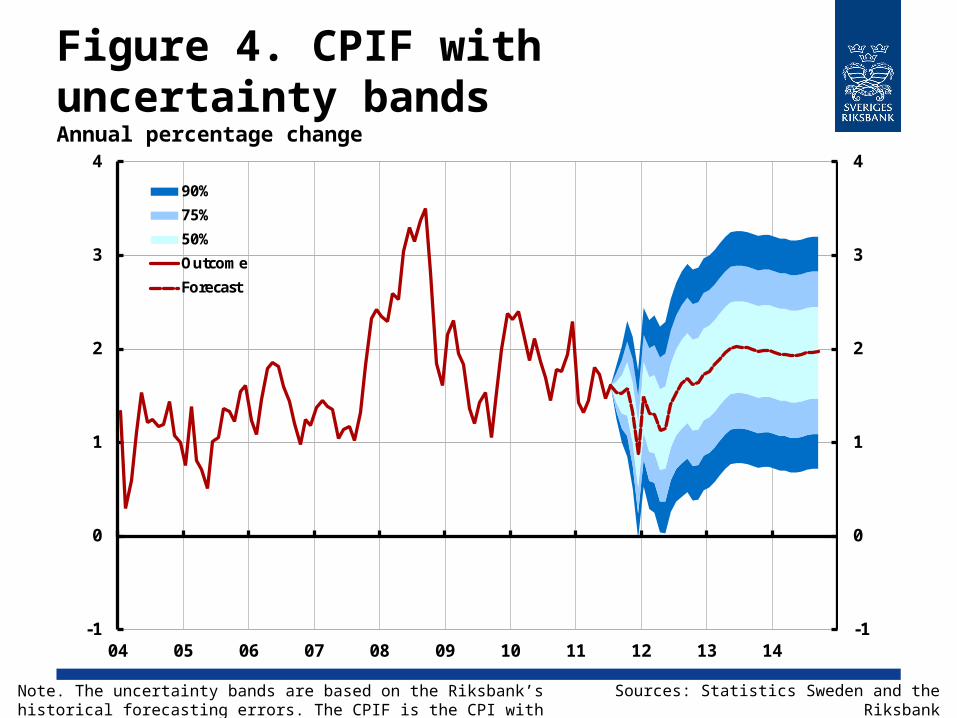
Figure 4. CPIF with uncertainty bandsAnnual percentage change
-1
0
1
2
3
4
-1
0
1
2
3
4
04 05 06 07 08 09 10 11 12 13 14
90%
75%
50%
Outcome
Forecast
Sources: Statistics Sweden and the Riksbank
Note. The uncertainty bands are based on the Riksbank’s historical forecasting errors. The CPIF is the CPI with a fixed mortgage rate.
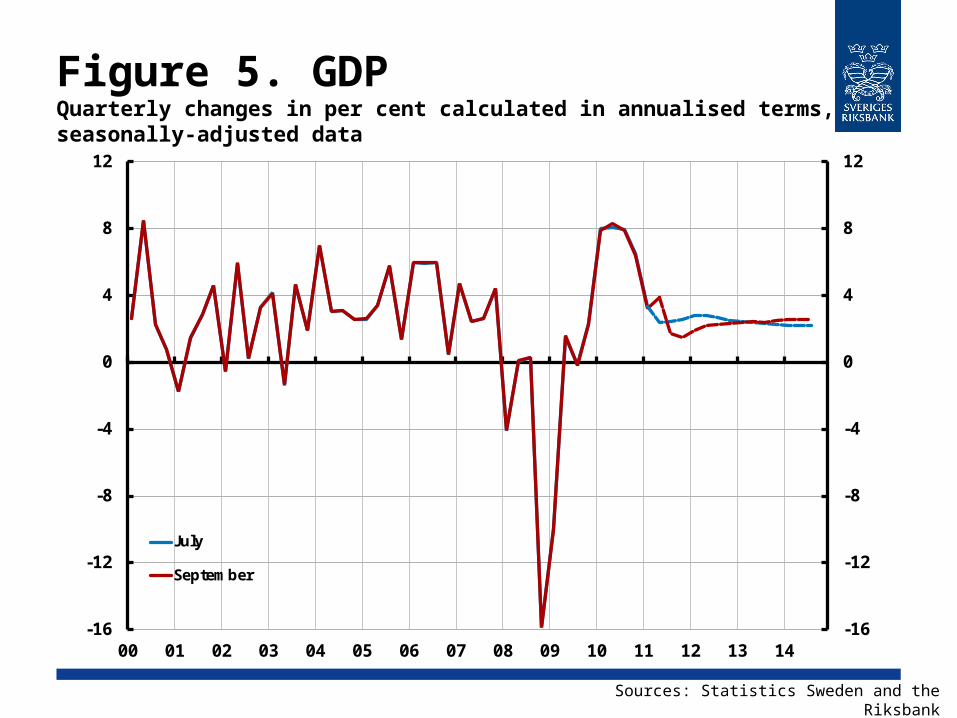
Figure 5. GDPQuarterly changes in per cent calculated in annualised terms, seasonally-adjusted data
-16
-12
-8
-4
0
4
8
12
-16
-12
-8
-4
0
4
8
12
00 01 02 03 04 05 06 07 08 09 10 11 12 13 14
July
September
Sources: Statistics Sweden and the Riksbank

Figure 6. UnemploymentPercentage of the labour force, seasonally-adjusted data
Sources: Statistics Sweden and the Riksbank
Note. Pre-1987 data have been spliced by the Riksbank. The forecast represent aged 15-74.
0
2
4
6
8
10
12
0
2
4
6
8
10
12
80 85 90 95 00 05 10
Unemployment, aged 16-64
Unemployment, aged 15-74
September
July

Figure 7. Labour force and number of employedThousands, seasonally-adjusted data
3800
4000
4200
4400
4600
4800
5000
5200
3800
4000
4200
4400
4600
4800
5000
5200
80 85 90 95 00 05 10
Employed, aged 16-64
Labour force, aged 16-64
Employed, aged 15-74
Labour force, aged 15-74
Sources: Statistics Sweden and the Riksbank
Note. Pre-1987 data have been spliced by the Riksbank.

Figure 8. CPI and CPIFAnnual percentage change
-2
-1
0
1
2
3
4
5
-2
-1
0
1
2
3
4
5
04 05 06 07 08 09 10 11 12 13 14
CPI, September
CPI, July
CPIF, September
CPIF, July
Sources: Statistics Sweden and the Riksbank
Note. The CPIF is the CPI with a fixed interest rate.
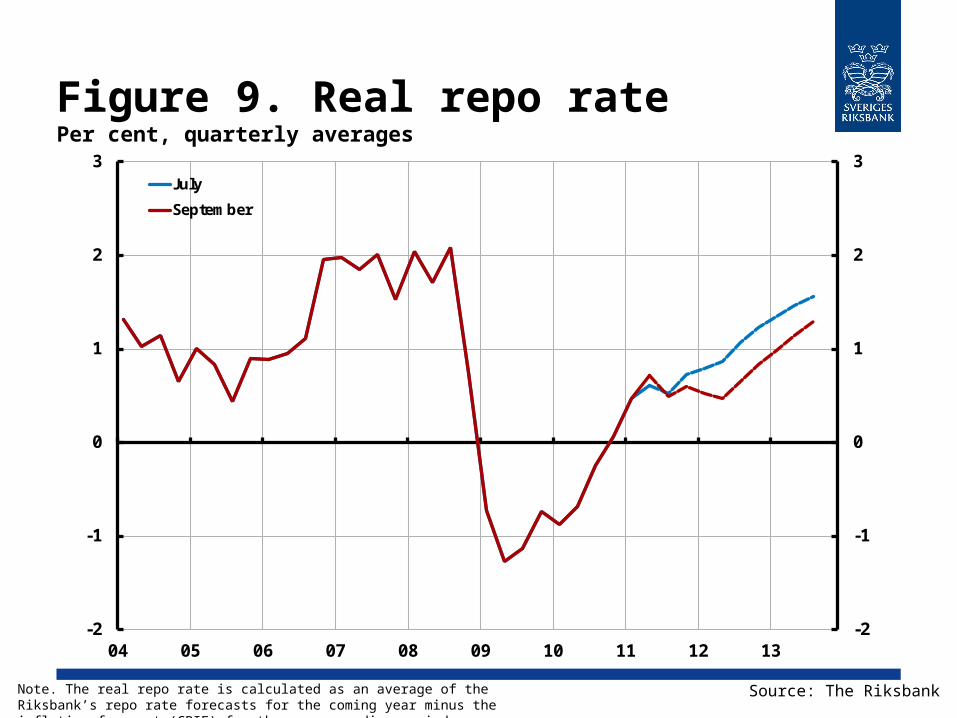
Figure 9. Real repo ratePer cent, quarterly averages
-2
-1
0
1
2
3
-2
-1
0
1
2
3
04 05 06 07 08 09 10 11 12 13
July
September
Source: The RiksbankNote. The real repo rate is calculated as an average of the Riksbank’s repo rate forecasts for the coming year minus the inflation forecast (CPIF) for the corresponding period.

Figure 10. TCW-weighted exchange rate Index, 18 November 1992 = 100
Source: The RiksbankNote. Outcome data are daily rates and forecasts are quarterly averages.
115
120
125
130
135
140
145
150
155
160
115
120
125
130
135
140
145
150
155
160
04 05 06 07 08 09 10 11 12 13 14
September
July

Figure 11. Oil price, Brent crudeUSD per barrel
Sources: Intercontinental Exchange and the Riksbank
Note. Futures are calculated as a 15-day average. Outcomes represent monthly averages of spot prices.
0
20
40
60
80
100
120
140
0
20
40
60
80
100
120
140
00 01 02 03 04 05 06 07 08 09 10 11 12 13 14
Outcome
Futures, average up to and including 1 September 2011
Futures, average up to and including 29 June 2011

GDP in different regions and countriesQuarterly changes in per cent, annual rate, seasonally-adjusted data
-16
-12
-8
-4
0
4
8
12
-16
-12
-8
-4
0
4
8
12
00 01 02 03 04 05 06 07 08 09 10 11 12 13 14
Sweden
Euro area
USA
Sources: Bureau of Economic Analysis, Eurostat, Statistics Sweden and the Riksbank
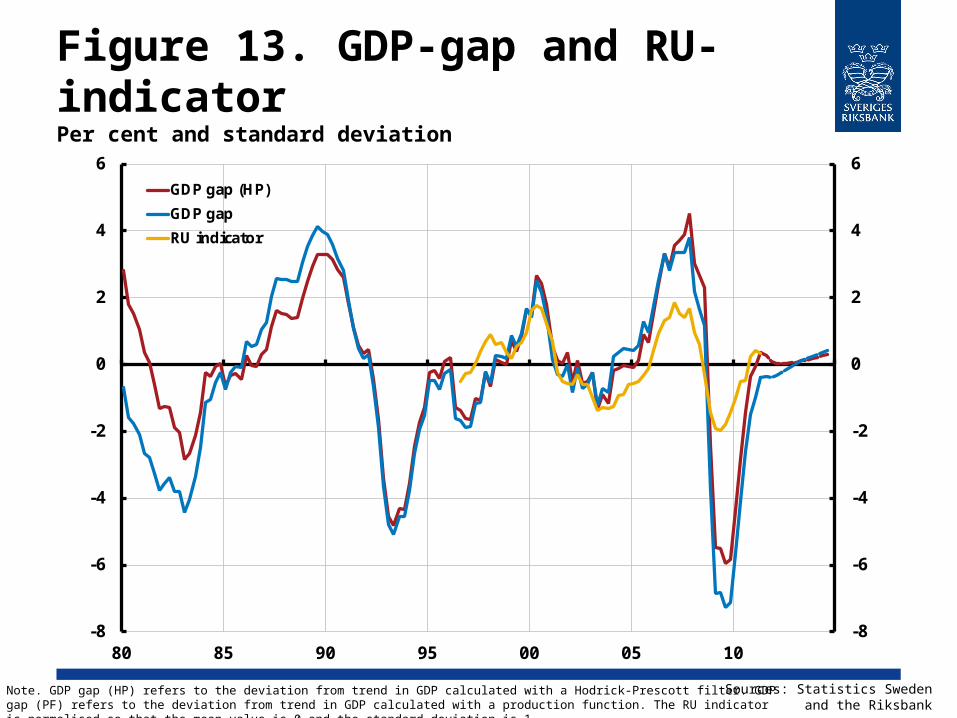
Figure 13. GDP-gap and RU-indicatorPer cent and standard deviation
-8
-6
-4
-2
0
2
4
6
-8
-6
-4
-2
0
2
4
6
80 85 90 95 00 05 10
GDP gap (HP)
GDP gap
RU indicator
Sources: Statistics Sweden and the Riksbank
Note. GDP gap (HP) refers to the deviation from trend in GDP calculated with a Hodrick-Prescott filter. GDP gap (PF) refers to the deviation from trend in GDP calculated with a production function. The RU indicator is normalised so that the mean value is 0 and the standard deviation is 1.
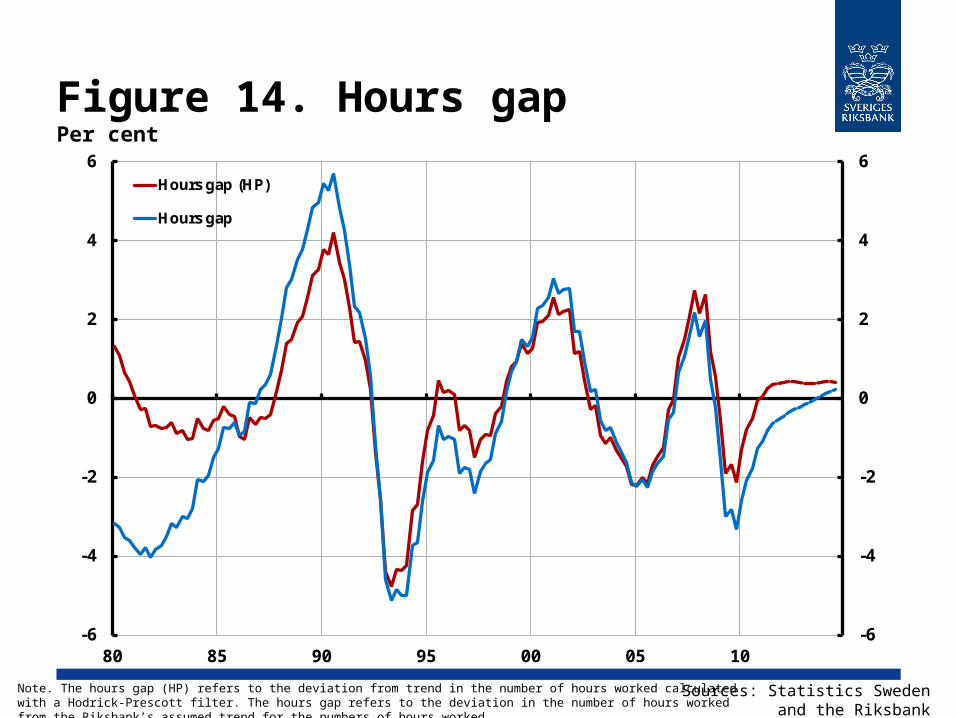
Figure 14. Hours gapPer cent
-6
-4
-2
0
2
4
6
-6
-4
-2
0
2
4
6
80 85 90 95 00 05 10
Hours gap (HP)
Hours gap
Sources: Statistics Sweden and the Riksbank
Note. The hours gap (HP) refers to the deviation from trend in the number of hours worked calculated with a Hodrick-Prescott filter. The hours gap refers to the deviation in the number of hours worked from the Riksbank’s assumed trend for the numbers of hours worked.

Figure 15.Stock market movementsIndex, 3 January 2006 = 100
40
60
80
100
120
140
160
180
40
60
80
100
120
140
160
180
04 05 06 07 08 09 10 11
Sweden (OMXS)
Euro area (Euro Stoxx)
USA (S&P 500)
Emerging markets (MSCI)
Source: Reuters EcoWin

Figure 16. Purchasing managers' index, manufacturing sectorIndex, over 50 indicates growth
30
35
40
45
50
55
60
65
70
30
35
40
45
50
55
60
65
70
00 01 02 03 04 05 06 07 08 09 10 11
Sweden
Euro area
USA
Sources: Institute for Supply Management, Markit Economics and Swedbank

Figure 17. Repo ratePer cent, quarterly averages
Source: The Riksbank
0
1
2
3
4
5
0
1
2
3
4
5
04 05 06 07 08 09 10 11 12 13 14
September
July
TablesThe figures in parentheses show the forecast in the previous Monetary Policy Report (July 2011).

Table 1. Repo rate forecastPer cent, quarterly average values
Source: The Riksbank
Q2 2011 Q3 2011 Q4 2011 Q3 2012 Q3 2013 Q3 2014
Repo rate 1.7 2.0 (2.0) 2.1 (2.3) 2.4 (2.9) 3.0 (3.4) 3.6 (3.8)

Table 2. Inflation, annual averageAnnual percentage change
Note. The rate of change in the CPI is based on revised index figures, which may differ from the established index figures. CPIF is CPI with fixed interest rate. HICP is an EU harmonised index of consumer prices.
Sources: Statistics Sweden and the Riksbank
2010 2011 2012 2013
CPI 1.2 (1.2) 3.0 (3.1) 2.1 (2.7) 2.6 (2.8)
CPIF 2.0 (2.0) 1.5 (1.6) 1.5 (1.7) 2.0 (2.1)
CPIF excl. energy 1.5 (1.5) 1.0 (1.1) 1.6 (1.8) 2.0 (2.1)
HICP 1.9 (1.9) 1.4 (1.6) 1.4 (1.7) 1.9 (2.0)

Table 3. Summary of financial forecastsAnnual average, per cent, unless otherwise specified
* Per cent of GDP
Sources: Statistics Sweden and the Riksbank
2010 2011 2012 2013
Repo rate 0.5 (0.5) 1.8 (1.8) 2.4 (2.8) 2.9 (3.4) 10-year rate 2.8 (2.8) 2.8 (3.2) 2.9 (3.8) 3.7 (4.3) Exchange rate, TCW-index, 1992-11-18=100 129.3 (129.3) 121.8 (120.8) 120.4 (120.2) 119.4 (120.2) General government net lending* -0.2 (-0.2) 0.5 (0.9) 0.8 (1.2) 1.0 (1.4)
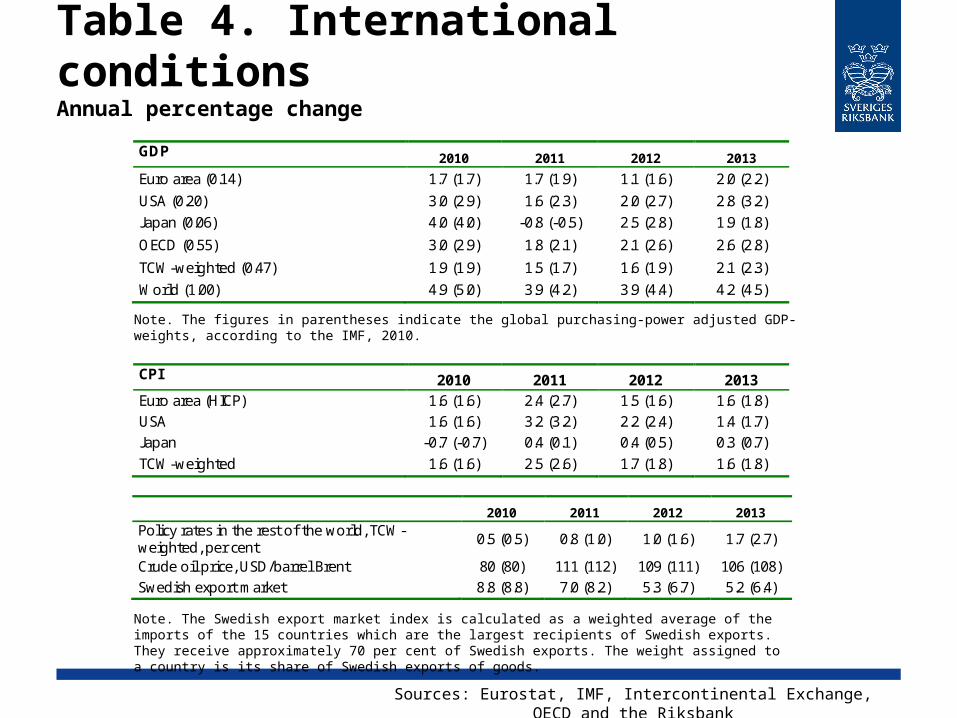
Table 4. International conditionsAnnual percentage change
Note. The figures in parentheses indicate the global purchasing-power adjusted GDP-weights, according to the IMF, 2010.
Note. The Swedish export market index is calculated as a weighted average of the imports of the 15 countries which are the largest recipients of Swedish exports. They receive approximately 70 per cent of Swedish exports. The weight assigned to a country is its share of Swedish exports of goods.
Sources: Eurostat, IMF, Intercontinental Exchange, OECD and the Riksbank
GDP 2010 2011 2012 2013
Euro area (0.14) 1.7 (1.7) 1.7 (1.9) 1.1 (1.6) 2.0 (2.2)
USA (0.20) 3.0 (2.9) 1.6 (2.3) 2.0 (2.7) 2.8 (3.2) Japan (0.06) 4.0 (4.0) -0.8 (-0.5) 2.5 (2.8) 1.9 (1.8)
OECD (0.55) 3.0 (2.9) 1.8 (2.1) 2.1 (2.6) 2.6 (2.8)
TCW-weighted (0.47) 1.9 (1.9) 1.5 (1.7) 1.6 (1.9) 2.1 (2.3)
World (1.00) 4.9 (5.0) 3.9 (4.2) 3.9 (4.4) 4.2 (4.5)
CPI 2010 2011 2012 2013 Euro area (HICP) 1.6 (1.6) 2.4 (2.7) 1.5 (1.6) 1.6 (1.8) USA 1.6 (1.6) 3.2 (3.2) 2.2 (2.4) 1.4 (1.7) Japan -0.7 (-0.7) 0.4 (0.1) 0.4 (0.5) 0.3 (0.7) TCW-weighted 1.6 (1.6) 2.5 (2.6) 1.7 (1.8) 1.6 (1.8)
2010 2011 2012 2013
Policy rates in the rest of the world, TCW-weighted, per cent
0.5 (0.5) 0.8 (1.0) 1.0 (1.6) 1.7 (2.7)
Crude oil price, USD/barrel Brent 80 (80) 111 (112) 109 (111) 106 (108) Swedish export market 8.8 (8.8) 7.0 (8.2) 5.3 (6.7) 5.2 (6.4)
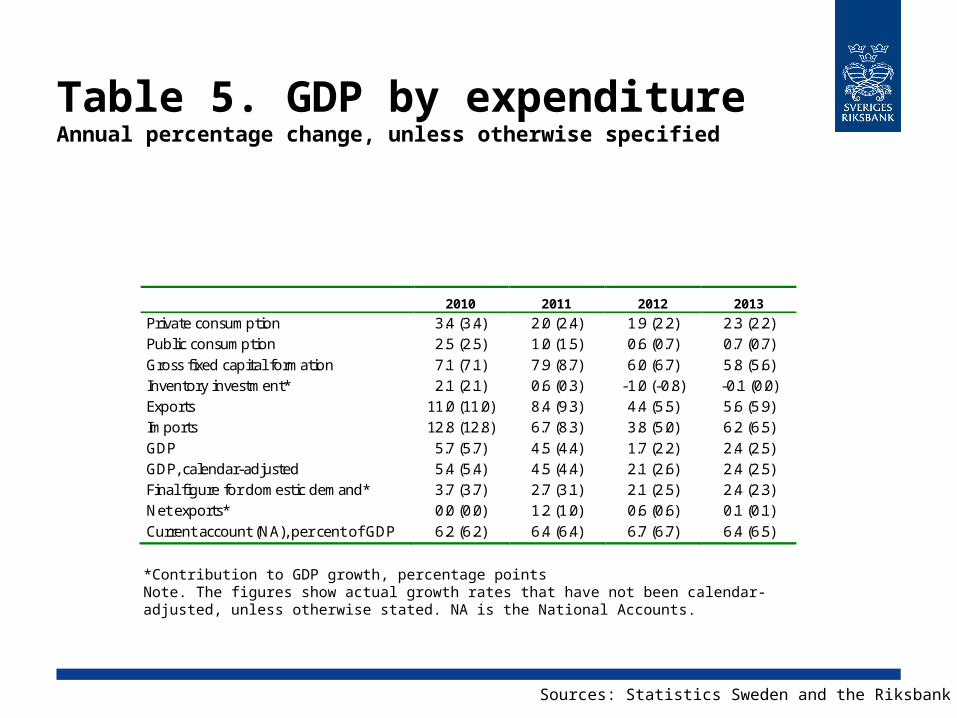
Table 5. GDP by expenditureAnnual percentage change, unless otherwise specified
*Contribution to GDP growth, percentage pointsNote. The figures show actual growth rates that have not been calendar-adjusted, unless otherwise stated. NA is the National Accounts.
Sources: Statistics Sweden and the Riksbank
2010 2011 2012 2013
Private consumption 3.4 (3.4) 2.0 (2.4) 1.9 (2.2) 2.3 (2.2) Public consumption 2.5 (2.5) 1.0 (1.5) 0.6 (0.7) 0.7 (0.7) Gross fixed capital formation 7.1 (7.1) 7.9 (8.7) 6.0 (6.7) 5.8 (5.6) Inventory investment* 2.1 (2.1) 0.6 (0.3) -1.0 (-0.8) -0.1 (0.0) Exports 11.0 (11.0) 8.4 (9.3) 4.4 (5.5) 5.6 (5.9) Imports 12.8 (12.8) 6.7 (8.3) 3.8 (5.0) 6.2 (6.5) GDP 5.7 (5.7) 4.5 (4.4) 1.7 (2.2) 2.4 (2.5) GDP, calendar-adjusted 5.4 (5.4) 4.5 (4.4) 2.1 (2.6) 2.4 (2.5) Final figure for domestic demand* 3.7 (3.7) 2.7 (3.1) 2.1 (2.5) 2.4 (2.3) Net exports* 0.0 (0.0) 1.2 (1.0) 0.6 (0.6) 0.1 (0.1) Current account (NA), per cent of GDP 6.2 (6.2) 6.4 (6.4) 6.7 (6.7) 6.4 (6.5)
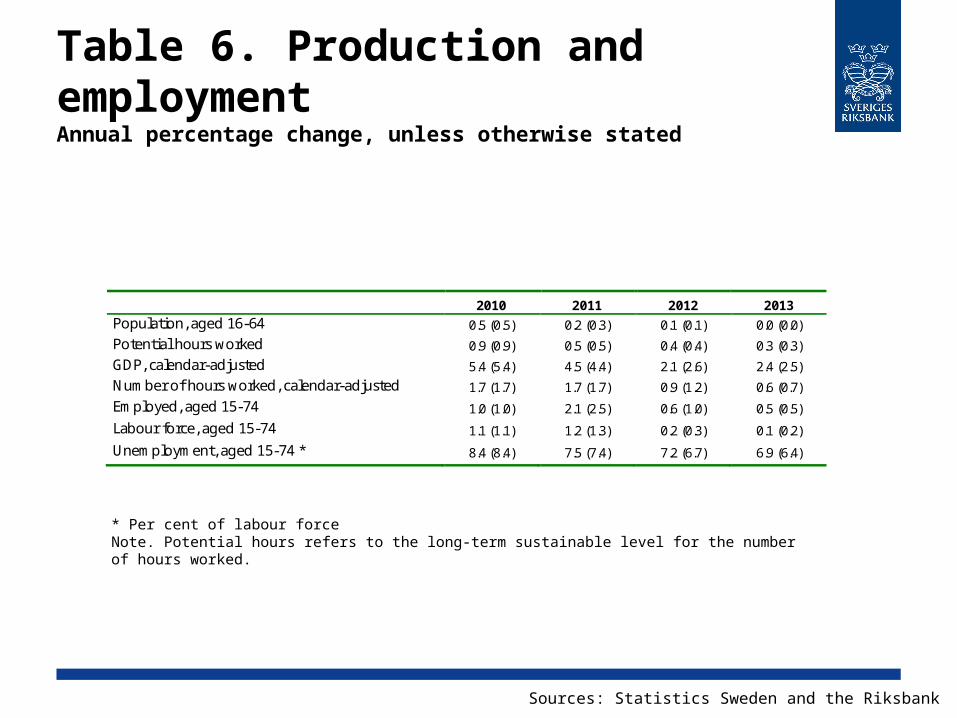
Table 6. Production and employmentAnnual percentage change, unless otherwise stated
* Per cent of labour forceNote. Potential hours refers to the long-term sustainable level for the number of hours worked.
Sources: Statistics Sweden and the Riksbank
2010 2011 2012 2013 Population, aged 16-64 0.5 (0.5) 0.2 (0.3) 0.1 (0.1) 0.0 (0.0)
Potential hours worked 0.9 (0.9) 0.5 (0.5) 0.4 (0.4) 0.3 (0.3)
GDP, calendar-adjusted 5.4 (5.4) 4.5 (4.4) 2.1 (2.6) 2.4 (2.5)
Number of hours worked, calendar-adjusted 1.7 (1.7) 1.7 (1.7) 0.9 (1.2) 0.6 (0.7)
Employed, aged 15-74 1.0 (1.0) 2.1 (2.5) 0.6 (1.0) 0.5 (0.5)
Labour force, aged 15-74 1.1 (1.1) 1.2 (1.3) 0.2 (0.3) 0.1 (0.2)
Unemployment, aged 15-74 * 8.4 (8.4) 7.5 (7.4) 7.2 (6.7) 6.9 (6.4)

Table 7. Wages and unit labour cost for the economy as a wholeAnnual percentage change, calendar-adjusted data
* Contribution to the increase in labour costs, percentage points.Note. NMO is the National Mediation Office’s short-term wage statistics and NA is the National Accounts. Labour cost per hour is defined as the sum of actual wages, collective charges and wage taxes divided by the seasonally adjusted total number of hours worked. Unit labour cost is defined as labour cost divided by seasonally adjusted value added at constant prices.
Sources: National Mediation Office, Statistics Sweden and the Riksbank
2010 2011 2012 2013
Hourly wage, NMO 2.6 (2.6) 2.7 (2.9) 3.1 (3.3) 3.4 (3.5)
Hourly wage, NA 1.3 (1.3) 3.8 (3.9) 3.3 (3.6) 3.6 (3.8)
Employer’s contribution* -0.3 (-0.3) -0.4 (-0.1) 0.1 (0.1) 0.0 (0.0)
Hourly labour cost, NA 1.0 (1.0) 3.4 (3.8) 3.3 (3.6) 3.6 (3.8)
Productivity 3.6 (3.6) 2.8 (2.6) 1.2 (1.5) 1.7 (1.8)
Unit labour cost -2.5 (-2.5) 0.7 (1.1) 2.1 (2.1) 1.9 (1.9)


![Cecilia Skingsley: Should the Riksbank issue e-krona? · 1 [10] Should the Riksbank issue e-krona?1 Should the Riksbank issue electronic means of payment in the same way as we now](https://static.fdocuments.us/doc/165x107/5ec82f088662860afc5de461/cecilia-skingsley-should-the-riksbank-issue-e-krona-1-10-should-the-riksbank.jpg)