
MPSA-Sol
88
SOLUTIONS MANUAL TO ACCOMPANY MODERN POWER SYSTEM ANALYSIS 3 rd Edition D P Kothari Professor, Centre of Energy Studies Deputy Director (Admin.) Indian Institute of Technology Delhi I J Nagrath Adjunct Professor, and Former Deputy Director, Birla Institute of Technology and Science Pilani Tata McGraw-Hill Publishing Company Limited NEW DELHI McGraw-Hill Offices New Delhi New York St Louis San Francisco Auckland Bogotá Caracas Kuala Lumpur Lisbon London Madrid Mexico City Milan Montreal San Juan Santiago Singapore Sydney Tokyo Toronto
-
Upload
ahmad-masood -
Category
Documents
-
view
22 -
download
3
description
modern power system analysis solution
Transcript of MPSA-Sol

SOLUTIONS MANUAL TO ACCOMPANY
MODERN POWERSYSTEM ANALYSIS3rd Edition
D P Kothari
Professor, Centre of Energy StudiesDeputy Director (Admin.)Indian Institute of TechnologyDelhi
I J Nagrath
Adjunct Professor, and Former Deputy Director,Birla Institute of Technology and SciencePilani
Tata McGraw-Hill Publishing Company LimitedNEW DELHI
McGraw-Hill Offices
New Delhi New York St Louis San Francisco Auckland Bogotá CaracasKuala Lumpur Lisbon London Madrid Mexico City Milan MontrealSan Juan Santiago Singapore Sydney Tokyo Toronto

2 Modern Power System Analysis
���������
��� ���
2.1
Fig. S-2.1
Assume uniform current density
2� y Hy = Iy
Iy =y r
r r
212
12
22
�
�
���
���
I
� Hy =y r
r r y
212
22
12
12
�
�
���
���
��
I
d� = � Hy dy
d� =y r
r r
212
22
12
�
�
���
���
Id�
= � y r
r r
I
y
212
22
12
2
2
�
�
���
��� �
dy
=�
�
I y r y r y
r r2
2312
14
22
12 2�
� �
�
/
� � dy
Integrating
�int =�
�
I
r r2 22
12 2( )�
y r y r y dyr
r3
12
142
1
2
� � /
=�
�
I
r r
yr y r y
r
r
r
r
r
r
2 422
12 2
4
12 2
14
1
2
1
2
1
2
( )ln
�� �
��
�
���
��

Solutions 3
=�
�
I
r rr r r r r r
r
r2142
212 2 2
414
12
22
12
14 2
1( )( ) ( ) ln
�� � � �
�
���
�0 = 4� × 10–7 H/m �r = 1
Lint =
12
104 4
7
22
12 2 2
414
12
22
12
14 2
1
�
�
� � � ����
���
���
���
�
r rr r r r r r
r
r� �� �) ln
Lext (1) = 2 � 10–7 ln Dr2
= Lext (2); assuming D >> r2
Line inductance = 2 (Lint + Lext (1)) H/m.
2.2.
Fig. S-2.2
Diameter of nonconducting core = 1.25 – 2 � (0.25) = 0.75 cmNote: Core is nonconducting.
D12 = sin 15º = 0.259 cm D13 = sin 30º = 0.5 cmD14 = sin 45º = 0.707 cm D15 = sin 60º = 0.866 cmD16 = sin 75º = 0.965 cm D17 = sin 90º = 1.0 cmD11 = r� = (0.25/2) � 0.7788 = 0.097 cmDs = {(0.097 � 1) � (0.259)2 � (0.5)2 � (0.707)2
� (0.866)2 � (0.965)2}1/12
= 0.536 cmDm � 1 m
L = 2 × 0.461 log 1000.536
= 2.094 mH/km
X = 314 × 2.094 × 10–3 = 0.658 �/km

4 Modern Power System Analysis
2.3 Hy = I/2�y
d� =�
�
I
y2dy
d� = 1 × d� = �
�
I
y2dy
� =�
��
�2 2I
dy
yI R
rr
R
� ln
L =�
�2ln R
r H/m
2.4 Flux linkage of sheath loop due to cable current = 2 � 2 � 10–7 � 800 �
ln 0 2007
.5.5
� Wb-T/m
Voltage induced in sheath = 314 � 0.32 ln 1007.5
V/km
= 260.3 V/km
Fig. S-2.4
2.5 HP = Id
Id
Id
Id2 3 2 2
13
13
2
� � � ��� � ��
��� � � AT/m
(direction upwards)2.6
Fig. S-2.6
V = j X1 I1 + j X12 I2 = j X2 I2 + j X12 I1
I = I1 + I2 ; I1 = V
j X X( )1 12�; I2 =
Vj X X( )2 12�
Fig. S-2.3

Solutions 5
I = Vj X X X X
Vj X
1 1
1 12 2 12��
�
���
���
�
� X =( ) ( )X X X X
X X X1 12 2 12
1 2 122
� �
� �
2.7
Fig. S-2.7
�t1 = 2 � 10–7 I Iln.5
ln1
221
20�
��
��
= 2 � 10–7 � 150 ln 2022.5
= – 0.353 � 10–5 Wb-T/m
�t2 = 2 � 10–7 � 150 ln.
ln.
123 1
120 6
���
��
= – 0.343 � 10–5 Wb-T/m�t = �t1 – �t2 = – 0.01 � 10–5 Wb-T/m
Mutual inductance = (0.01 � 10–5/150) � 103 � 103 mH/km= 0.00067 mH/km
Induced voltage in telephone line = 314 � 0.01 � 10–5 � 103
= 0.0314 V/km2.8 Ia = 400 �0º, Ib = 400�–120º, Ic = 400�120º
Using Eq. (2.40)
�t = 2 �10–7� 400 ln º ln º ln
2625
1 1202120
1 1201615
� �� � � ���
�� Wb-T/m
= 0.0176 � 10–4 �140º Wb-T/m
Mutual inductance = 0 0176 10 140400
4. º� ��
� 106
= 1 76400.
�140º mH/km
= 0.0044�140º mH/km
Voltage induced in telephone line = 314 � 0.0176 � 10–4 � 103�140º
= 0.553�140º V/km2.9 Here d = 15 m, s = 0.5 m
Using method of GMD

6 Modern Power System Analysis
Dab = Dbc = [d (d + s) (d – s)d]1/4
= (15 � 15.5 � 14.5 � 15)1/4 = 15 mDca = [2d (2d + s) (2d – s) 2d]1/4
= (30 � 30.5 � 29.5 � 30)1/4 = 30 mDeq = (15 � 15 � 30)1/3 = 18.89 mDs = (r � sr � s)1/4 = (r� s)1/2
= (0.7788 � 0.015 � 0.5)1/2
= 0.0764 m
Inductive reactance/phase
XL = 314 � 0.461 � 10–3 log 18 890 0764
..
= 0.346 �/km
2.10 XL = 314 � 0.921 � 10–3 log D0 01.
= 31.4/50
� D = 1.48 m (maximum permissible)
2.11
Fig. S-2.11
In section 1 of transposition cycle
Dab = 119 9 62. .� = 6.35; Dbc = 4 19 9 62. .� = 6.35
Dca = 7 8.5 � = 7.746
Deq = 6.35 6.35 7 7463� � . = 6.78
Dsa = 0 01 10. .97� = 0.3312 = Dsc
Dsb = 0 01 10. � = 0.3162
Ds = 0 3312 0 3312 0 31623 . . .� � = 0.326 m
X = 0.314 × 0.461 log 6.780 326.
= 0.191 /km/phase
2.12 r� = 0.7788 � 1.5 � 10–2 = 0.0117 m
Dab = 1 4 1 24� � � ; Dbc = 1 4 1 24
� � � ; Dca = 2 1 2 54� � �

Solutions 7
Dm = D D Dab bc ca3 12 1280� = 1.815 m
Dsa = Dsb = Dsc = 0 0117 3. � = 0.187� Ds = 0.187 m
L = 0.461 log 1 8150 187..
= 0.455 mH/km/phase
2.13
Fig. S-2.13
D13 = 2D12 = 2D23 = 2d
23 d d d� � = 3
23 d = 3 � d = 2.38 m
2.14 Refer to Fig. 2.16 of the text book.
Case (i) 2�r2 = Ar = (A/2�)1/2
� r � = 0.7788 (A/2�)1/2
Self G.M.D = r d d A� � ( . ) ( / ) /0 7788 2 1 2�
= 0.557 d1/2 A1/4
Case (ii) 3�r2 = A � r = A/3�
Self GMD = (r�dd)1/3 = ( . ) ( / )/ / /0 7788 31 3 1 6 2 3A d�
= 0.633 d2/3 A1/6
Case (iii) 4�r2 = A � r = A/4�
Self GMD = r dd d� 21 24 /
= 1.09 r d�34
= 1.09 (0.7788)1/4 A4
1 8
�����
/
d3/4
= 0.746 d3/4 A1/8

8 Modern Power System Analysis
��������
3.1 Va = 13
|V| �0º
Vab = |V| �30ºVbc = |V| �– 90ºVca = |V| �150ºDab = Dbc = DDac = 2D
Vab = 12 2� k
q Dr
q rD
q DDa b cln ln ln� ��
���
Vac = 12
22�k
qDr
qDD
qrDa b cln ln ln� ��
���
Vab = 12
12�k
qDr
qrD
qa b cln ln ln� ���
�� = |V | �30º (i)
Vac = 12
22�k
qDr
qrDa cln ln��
��� = |V | �–30º (ii)
qa + qb + qc = 0 (iii)
Eliminating qb from (i) with the help of (iii)
2qa ln Dr
+ qc ln D
r2 = 2�k |V | �30º (iv)
Eliminating qc between (ii) and (iv)
2qa ln Dr
ln rD2
– qa 22
Dr
Dr
ln = 2�k |V| ln º ln ºrD
Dr2
302
30� � �����
�
� qa =2
230
230
22 2
�k V rD
Dr
Dr
rD
Dr
Dr
| | ln º ln º
ln ln ln ln
� � � ����
�
��
F/m (v)
Ia = 2�f qa �90º A (with qa given in v) (vi)
3.2 Mutual GMD (calculated from the firsttransposition cycle)
r = 0.01 m
Dab = 2 6.32� = 3.555 = Dbc
Dca = 4 6� = 4.899
Deq = D D Dab bc ca3 = 3.955 m
Self GMD (calculated from thefirst transposition cycle)
Fig. S-3.1
Fig. S-3.2

Solutions 9
Dsa = 0 01 7. .21� = 0.2685 = Dsc
Dsb = 0 01 6.00. � = 0.2449; Ds = ( .2685) .24490 023 � = 0.261
Cn = 0 024230
.
log .955.261
= 0.0204 �F/km
3.3 0 02424
.log ( / )r
= 0.01 �F/km
log (4/r) = 2.42; r = 42 421log .�
= 0.015 m
In new configuration, Deq = 4 4 83 � � = 5.04
C = 0 02425 04
0 015
.
log ..
= 0.0096 �F/km.
3.4 Here d = 15 m, s = 0.5 m, r = 0.015 m
Deq = 15 15 303 � � = 18.89
Ds = 0 015 0. .5� = 0.0866
C = 0 024218 89
0 0866
.
log ..
= 0.0103 �F/km to neutral
3.5
Fig. S-3.5
At a certain instant qa = qb = q
� qa + qb + qc = 0 � qc = – 2q
Vab = 12
20 0025
0 00252
224�k
q q qln.
ln.
ln� ���
�� = 775
q = ��
� �� � � �775
1 2775 8 85 10
1 2
12� �k
ln /.
ln ( / ) � 1000
= 3.08 � 10–5 coulomb/km
3.6 D = 7 m r = 0.0138 m
Dab = 7 28 7 144 � � � =11.772; Dbc = 11.772

10 Modern Power System Analysis
Dca = 14 7 14 354 � � � = 14.803; Deq = ( . ) .11 772 14 80323 �
= 12.706
Dsa = 0 0138 21. � = 0.538 = Dsb = Dsc � Ds = 0.538
C = 0 024212 7060
.
log ..538
= 0.0176 �F/km
Susceptance B = 314 � 0.0176 � 10–6 = 5.53 � 10–6 /km
3.7 � = qky2�
V/m
V12 = q
k yr
R
2�� dy
V12 = q
kRr2�
ln
C = q
Vk
R r12
122 2 3 8 8 85 100 005780 00328
� �� � � �
� �
ln /. .
ln ..
= 373 � 10–12 F/m
Xc = 1 10
314 373 1000
12
� C�
� � = 8.54 � 103 /km
3.8 r = 0.01 m
Deq = 5 6 73 � � = 5.943
C = 0 024250 01
.
log .943.
= 8.72 � 10–3 �F/km
3.9
Fig. S-3.9
The expression for capacitance is derived in Sec. 3.4 [see Eq. (3.4 c)].
r = 0.003 mD = 0.35 m
Electric stress is maximum at conductor surface.
Emax = qkr2�
Fig. S-3.7

Solutions 11
qmax = 25 � 105 � 2� � 8.85 � 10–12 � 0.003= 150 � � � 8.85 � 10–10 coulombs/m
Cab = 0 01210 35
0 003
.
log ..
= 5.854 � 10–3 �F/km
Vab (max) = q
Cab
max .
.�
� � �
� � �
�
� � �
150 8 85 10
5 854 10 10 10
10
3 6 3�
= 71.24 kV

12 Modern Power System Analysis
��������
4.1 Choose Base: 100 MVA11 kV in generator circuit220 kV transmission line66 kV load bus
Reactance T1 = 0.1 puReactance T2 = 0.08 pu
Reactance transmission line = 150 100
220 2�
( )
= 0.31 pu
Load: 60100
= 0.6 pu MW; 0.9 pf lagging
Voltage V2 = 6066
= 0.909 �0º
Current I2 = 0 61 0
..9�
� �–25.8º = 0.6667�–25.8º pu
Generator terminal voltage
V1 = V2 + j (0.1 + 0.08 + 0.31) � 0.6667 �–25.8º
= 0.909 + 0.327 �64.2º
= 1.09 �15.6º
|V1| (line) = 1.09 � 11 = 12 kV
4.2
Fig. S-4.2
Base: 100 MVA220 kV in line
220 � 33220
= 33 kV in generator

Solutions 13
220 � 11220
= 11 kV in motor
Per unit reactances are:
X�g = 0.2 10040
2533
2��
�� ����� = 0.287
X�m = 0.3 � 10050��
�� = 0.6
XT1 = 0.15 � 10040
= 0.375
XT2 = 0.15 � 10030��
�� = 0.5
XL = 50 100220 2
�
( ) = 0.103

14 Modern Power System Analysis
��������
5.1 |VR | = 11 3/ = 6.351 kV
(a) �R = cos–1 0.707 = 45º; � = tan–11210
= 50.2º
|Z | = 10 122 2� = 15.62Using Eq. (5.10)
|I| = 2 | |
| |
V
ZR sin (�R + �� – 90º)
= 2 6.35115 62�
. sin 5.2º = 73.7 A
P = 3 � 11 � 73.7 � 0.707 = 992.75 kW(b) �R = cos–1 0.85 = 31.8º
�R + � – 90º = 31.8º + 50.2º – 90º = – 8ºSince it is negative, no solution for P is possible which would givezero voltage regulation.
5.2 a = 1 A = 0.9 �1.5ºb = ZT = 100 �67� B = 150 �65ºc = 0 C = ?d = 1 D = 0.9 �1.5º
AD – BC = 1 (i) � C = ADB
��
� �
�
1 0 81 3 1150 65. º
º = 0.001 �102.6º
A� = Aa + Bc B� = Ab + BdC� = Ca + Dc D� = C b + Dd
� A� = 0.9 �1.5º � 1 = 0.9 �1.5º
B� = 0.9 �1.5º � 100 �67º + 150 �65º × 1 = 239.9 �66.3º
C� = 0.001�102.6º × 1 + 0.9�1.5º × 0 = 0.001�102.6º
D� can be calculated using relation (i)
D� = (1 + B�C� )/A� = 0.85 �1.96º
5.3 (a) L = 0.461 log 4 5 60 7788 10
3
2� �
� �. = 1.29 mH/km
C = 0 02424 5 610
3
2
.
log � ��
= 0.009 F/km
R = 200 � 0.16 = 32 �; X = 314 � 1.29 � 10–3 � 200 = 81 �

Solutions 15
Z = 32 + j 81 = 87.1 �68.4ºY = j 314 � 0.009 � 10–6 � 200 = 0.00056 �90ºA = 1 + YZ/2 = 1 + 0.024 �158.4º = 0.978 �0.5º = D
B = ZY
= YZ 16
�����
yz = Z (1 + YZ/6) = 86.4 �68.6º
C = YZ
YZ (1 + YZ/6) = Y(1 + YZ/6) = 0.00056 �90.2º
(b) IR = 503 132 0 8� � .
�–36.9º = 0.2734 �–36.9º kA
VR = 132 3/ �0º kV = 76.21 �0º kV
VS = AVR + BIR
= 0.978 �0.5º � 76.21 �0º + 86.4 �68.6º � 0.2734 �–36.9º= 95.52 �7.8º kV
|VS| (line) = 3 � 95.52 = 165.44 kVIS = CVR + DIR
= 0.00056 �90.2º � 76.21 �0º + 0.978 �0.5º � 0.2734�– 36.9º= 0.244 �–28.3º kA
Sending-end power factor = cos (28.3º + 7.8º) = 0.808 lagging
Sending-end power = 3 � 165.44 � 0.224 � 0.808 = 56.49 MW(c) Efficiency of transmission = 50 � 100/56.49 = 88.5%
|VR| (no load) = 165.44/0.978 = 169.16 kV(d) Per cent regulation = (169.16 – 132) � 100/132 = 28.15%Note: As both efficiency and line regulation are poor, compensatingcapacitors must be installed at the receiving-end to transmit this amountof power.
5.4
Fig. S-5.4 a
|VS | = |VR | = 230/ 3 = 132.8 kV; sin �R = 18 12 132 8
�
� . = 0.068

16 Modern Power System Analysis
IR = 998 + j 68 A cos �R = 0.998
IL(load) = 998 – j (998 tan cos–1 0.85) = 998 – j 618.5
IC (syn cap) = j (618.5 + 68) = j 686.5
Fig. S-5.4 b
(a) Rating of syn cap = 3 � 230 � 0.6865 = 273.5 MVA(b) |IL| = 1,174 A
(c) Load = 3 � 230 � 1.174 = 467.7 MVA
5.5.
Fig. S-5.5
Is = 40
3 1200
�� º = 0.1925 �0º kA
VM = VS – 150 �75º IS = 69.3–150 � 0.1925 �75º = 67.83 �–24.3º kVIC = 0.0025 � 67.83 �65.7º = 0.17 �65.7º
|IL| = 103 67 83� .
� IL = 0.049 �24.3º kA
IR = IS – IC – IL = 0.193 – 0.17�65.7º–0.049�–24.3º= 0.149�7.7º kA
VR = VM – 150�75º IR= 67.83 �–24.3º – 28.8 �9.2º= 77.32�–4.28º kV
|VR| (line) = 3 � 77.32 = 133.92 kVpf = cos (40.28 + 7.73) = 0.669 leading
Load = 3 � 133.92 � 0.149 � 0.669 = 23.12 MW5.6 Given
|Vs| (line) = 220 kV, A = 0.93 + j 0.016 = 0.93 �1º

Solutions 17
B = 20 + j140 = 141.4 �81.9º; PR = 60 � 0.8 = 48 MWQR = 60 � 0.6 = 36 MVAR;
After substituting these values in Eqs (5.61) and (5.62), we get
48 = 220
141 4
| |
.
VR cos (81.9º – � ) – 0141 4
.93.
|VR|2 cos 80.9º (i)
36 = 220
141 4
| |
.
VR sin (81.9º –� � ) – 0141 4
.93.
|VR|2 sin 80.9º (ii)
or |VR| cos (81.9º – �� ) = 30.85 + 6.69 � 10–4 |VR|2 (iii)
|VR | sin (81.9º – � ) = 23.14 + 4.17 � 10–3 |VR|2 (iv)Squaring and adding (iii) and (iv)
|VR| 2 = 1487 + 0.2343 |VR |2 + 1784 � 10–8 |VR| 4
0.1784 � 10–4 |VR|4 – 0.7657 |VR|2 + 1487 = 0
Solving |VR|2 = 4.088 � 104 (Taking the higher value)
� |VR| = 202.2 kV
5.7 From Problem 5.3: Y = 0.00056 �90º, Z = 87.1�68.4º
VR = 76.21 �0º kV; IR = 0.2734 �– 36.9º kA
Zc = Z Y/ ..
�87 1
0 00056 � – 21.6º = 394.4 �–10.8º
� = 1 1200
87 1 0 00056 158 4l
YZ � � �. . . º
= 1.104 � 10–3 �79.2º
� � = 0.206 � 10–3, � = 1.084 � 10–3
(VR/Zc + IR)/2 = 76.21394 4
10 8 0 36.9 2.
. º .2734 º� � � ���
��
= 0.222 �–21.7º
(VR/Zc – IR)/2 = 0.083 �109º
At the receiving-end (x = 0)
Incident wave, ix1 = 22
V Z IR c R�cos ( t + �1)
= 0.314 cos ( t – 21.7º)
Reflected wave, ix2 = 22
V Z IR c R�cos ( t + �2)
= 0.117 cos( t + 109º)At 200 km from the receiving-end (x = 200)

18 Modern Power System Analysis
ix1 = 22
V Z IR c R� e�x cos ( t + � x + �1)
ix2 = 22
V Z IR c R� e–�x cos ( t – �x + � 2)
e�x = e0.0412 = 1.042; e–�x = e–0.0412 = 0.9596
�x = 1.084 � 10–3 � 200 = 0.2168 rad = 12.4º
� ix1= 0.327 cos (� t – 9.3º)
ix2 = 0.112 cos (� t + 96.6º )
5.8 A = cos h � l = cos h �l cos �l + j sin h �l sin � l = 0.93 + j 0.016� cos h �� l cos � l = 0.93; sinh � l sin � l = 0.016
or 1 = ( . )
cos
( . )
sin
0 93 0 0162
2
2
2h h� �l l�
[Exact solution can be obtained numerically]Let us approximate cos h � l = 1 + �2 l2/2; sinh �l = � l
� 1 = ( .93) ( . )0
12
0 0162
2 2 2
2
2 2
����
���
�� �l l
Since � l will be very small for l = 200 km; 12
2 2 2
����
���
�� l 1.
� �2l2 = ( . )
( .93)0 016
1 0
2
2�or �l = 0.0435
� � = 0.0435/200 = 0.218 � 10–3 rad
(It is a fair approximation)
Now cos � l = 0 93.cos h �l
cos h � l = (e� l + e–� l)/2 = 1 0445 02
. .9574� = 1
cos � l = 0.93 � � = cos–1 0.93/200 = 1.882 � 10–3 radB = Zc sin h � l = 20 + j 140 = 141.4 �81.9º
sin h � l � � l = (� + j� )l = (0.218 + j 1.882) � 0.2 = 0.379 �83.4º
Zc = B
rlsin.
..9º. ºh
��
�
141 40 379
8183 4
= 373.1 �–1.5°

Solutions 19
Wave length = 2�/� = 2�/1.882 � 10–3 = 3,338 kmVelocity of propagation, v = f = 50 � 3,338 = 166,900 km/secNow A = 0.93 �1º, B = 141.4 �81.9º
C = ADB
��
� �
�
1 0 865 2 1141 4 81
. º. .9º
= 0.001 �85.7º
VR = 220/ 3 �0º = 127 �0º kV
IR = 503 220 0 8� � .
�–36.9º = 0.164 �–36.9º kA
VS = 0.93 �1º � 127 �0º + 141.4 �81.9º � 0.164 �–36.9º= 135.8 �7.8º kV
IS = 0.001 �85.7º � 127 �0º + 0.93 �1º � 0.164 �–36.9º= 0.138 �15.6º kA
Sending-end power factor = cos (15.6º – 7.8º) = 0.99 leadingSending-end power = 3 � 135.8 � 0.138 � 0.99 = 55.66 MWTransmission efficiency = 50 � 100/55.66 = 89.8%
5.9 Z � = Z sin h �
�
l
l���
���
; � �/2 = � �
�
�
�2
2
21 1tan /
/
cos
sin
l
l Z
l
lc
���
���
���
�����
h
h
Zc = Z Y/ .2 . º/10 º� � ��131 72 3 903 = 362.2 �–8.85º �
As already computed in Example 5.7 (see Text)
� l = 0.362 �81.20º; cos h � l = 0.938 + j 0.02 = 0.938 �1.2º
sin h � l = 0.052 + j 0.35 = 0.354 �81.5º
Z� = 131.2 �72.3º � 0.354 �81.5º/0.362 �81.2º = 128.3�72.6º
Y �
2= 1
362 8 850 0 02 1
0 354 81.2 . º.938 .
. .5º� ��
� �
�
j = 0.00051 �89.5º
5.10
Fig. S-5.10
PD1 + j QD1 = 40 + j 40 tan cos–1 0.8 = 40 + j 30; |V1| = |V2| = 22 kV
PD2 + j QD2 = 20 + j 20 tan cos–1 0.6 = 20 + j 26.67
PS = PR = 22 226�
sin � = 10 � sin � = 60/484

20 Modern Power System Analysis
� � = 7.12º
QS = – QR = |V2|2/X –
| || |V V
X1 2 cos �
= 22 226
22 226
��
� cos 7.12º = 0.622 MVAR
At bus 1QG1 = 30 + 0.622 = 30.622
pf1 = cos tan–1 30 62230.
= 0.7 lagging
At bus 2
QG2 = 26.67 + 0.622 = 27.292
pf2 = cos tan–1 2730.292
= 0.74 lagging
5.11 R = 400 � 0.035 = 14 �; X = 314 � 10–3 � 400 = 125.6 �
Z = R + jX = 14 + j 125.6 = 126.4 �83.6ºY = 314 � 0.01 � 10–6 � 400 �90º = 1.256 � 10–3 �90ºUsing nominal-�
A = 1 + 12
YZ = 1 + 12
� 1.256 � 10–3 �90º � 126.4 �83.6º = 0.921�0.6º
B = Z = 126.4�83.6ºFrom Eq. (5.61) we can write
PR = 0 = ( )275126.4
2
cos (83.6º – � ) – 0126.4
.921 � (275)2 cos (83.6º – 0.6º)
� cos (83.6º – �) = 0.921 cos 83º = 0.112 � � = 0.05ºFrom Eq. (5.62)
� QR = ( )275126.4
2
sin 83.55º – 0 275
126.4
2.921 ( )� sin 83º
= 47.56 MVAR lagging5.12 PD + jQD = 2.0 + j 2 tan cos–1 0.85 = 2.0 + j 1.24
�
�
jQ
P jQC
R R
= – j 2.1
= 2.0 – j 0.86= 2.18 MVA, 23.3° leading
pf = 0.918

Solutions 21
Z = 3 + j10 = 10.44 �73.3°
IR = ( / )2 18 3 11 � �23.3° = 0.1144 �23.3° kA
VS = VR + Z IR
= 11 3/ + 10.44 �73.3° � 0.1144 �23.3°
= 6.33 �10.8°
|VS| (line) = 3 � 6.33 = 10.97 kVIS = IR = 0.1144 �23.3° kA
Sending-end pf = cos 12.50° = 0.98 leading
Sending-end power = 3 � 10.97 � 0.1144 � 0.98 = 2.13 MW
� =2
2 130 � 100 = 93.9%
Voltage regulation = (10.97 – 11) � 100/11 = – 0.27%
5.13 PD + j QD = 30 + j 30 tan cos–1 0.85 = 30 + j 18.59
IR =30
3 33 0 85� � . �– 31.8°
= 0.6175 �– 31.8° kAZ = 5 + j 20 = 20.62 �76°
VS = 33 3/ + 20.62 �76° � 0.6175 �– 31.8°
= 29.54 �17.5°
|VS| (line) = 3 � 29.54 = 51.16 kVFrom Eq. (5.66) [|VS| = 33 kV]
PD = PR = 30
= ( )
.
33
20 62
2
cos (76° – �) – ( )
.
33
20 62
2
cos 76°
Solving, we get � = 40.1°From Eq. (5.67)
QR =( )
.
33
20 62
2
sin (76° – 40.1°)
– ( )
.
33
20 62
2
sin 76° = – 20.28
QC = – (18.59 + 20.28) = – 38.87= 38.87 MVAR leading
From Eq. (5.66) with (� – �) = 0°
PR(max) =( )
.
33
20 62
2
(1 – cos 76°) = 40 MW
Fig. S-5.13

22 Modern Power System Analysis
5.14 A = 0.938 �1.2° B = 131.2 �72.3°
Receiving-end circle OCR = 0 938 220
131 2
2. ( )
.
� = 346.0 MVA
PD + j QD = 50 + j 50 tan cos–1 0.8 = 50 + j 37.5; �R = 36.9°� – � = 72.3° – 1.2° = 71.1°
Fig. S-5.14 (a)
Sending-end circle
OCS =0 938131 2
..
� (238.5)2 = 406.6 MVA
� + � = 6.7° + 1.2° = 7.9°
PS + j QS = 53 – j 10
pf = cos tan–1 10
53= 0.983 leading

Solutions 23
Fig. S-5.14 (b)
5.15 Z = 5 + j 25 = 25.5 �78.7°
PD + j QD = 15 + j 15 tan cos–1 0.8 = 15 + j 11.25
PR = PD = 15 = ( )
.
33
25 5
2
cos (78.7° – �) ( )
.
33
25 5
2
cos 78.7°
cos (78.7° – �) =25 5
33 2
.
( ) � 15 + cos 78.7°
� � = 21.9°
QR =( )
.
33
25 5
2
sin (78.7° – 21.9°) – ( )
.
33
25 5
2
sin 78.7°
=( )
.
33
25 5
2
[sin 56.8° – sin 78.7°] = – 6.14
� QC = 17.39 MVAR leading
Fig. S-5.15
Now |VR| = 28 kVPD + j QD = PD (1 + j tan cos–1 0.8)
= PD (1 + j 0.75)PR + j QR = PD + j (0.75 PD – 17.39)

24 Modern Power System Analysis
PR = PD = 33 28
25 5
�
. cos (78.7° – � ) –
( )
.
28
25 5
2
cos 78.7°
0.75 PD – 17.39 =33 28
25 5
�
. sin (78.7° – �) =
( )
.
28
25 5
2
sin 78.7°
or cos (78.7° – �) =25 5
33 28
.
� PD +
28
33 cos 78.7° = 0.0276 PD + 0.1663
sin (78.7° – �) =25 5 0 75
33 28
. .�
� PD –
25 5 17 39
33 28
. .�
� +
28
33 sin 78.7°
= 0.0207 PD + 0.352Squaring and adding
1 = 1.19 � 10–3 P2D + 23.7 � 10–3 PD + 0.1516
or P2D + 19.92 PD – 0.713 � 103 = 0
PD =� � � �19 92 19 92 2 852 10
2
2 3. ( . ) .
= 18.54 MW (negative solution is rejected)
Extra power transmitted = 18.54 – 15 = 3.54 MW
Note: It is assumed in this problem that as the receiving-end voltage drops, thecompensating equipment draws the same MVAR (leading).

Solutions 25
��������
6.1
Fig. S-6.1(a)
Fig. S-6.1(b) Linear graph of the circuit of Fig. S-6.1 a
For this network tree is shown in Fig. 6.3 (a) and hence A is given by Eq.(6.17).This matrix is not unique. It depends upon the orientation of the elements.
1 2 36.2
Y
j j
j j j j
j j
BUS �
�
�
�
�
� ��
�
�
�
�
� �
�
�
������
�
�
������
10 04 0 06
10 04 0 06
0
10 04 0 06
10 04 0 06
10 02 0 03
10 02 0 03
01
0 02 0 031
0 02 0 03
. . . .
. . . . . . . .
. . . .
� YBUS = 27.735 �– 56.3°
0 5 0 5 0
0 5 1 5 1
0 1 1
. .
. .
�
� �
�
�
�
���
�
�
���
From Eq. (6.45)
V12 =
A
V2
20( )* – B21 V1 – B23 V0
3

26 Modern Power System Analysis
Here A2 =P j Q
Y2 2
22
� =
� �
� � �
5 96 1 46
41 602 56 3
. .
. .
j
B21 =Y
Y21
22
= � � � �
� � �
13 867 56 3
41 602 56 3
. .
. .; B23 =
Y
Y23
22
= �27 735
41 602
.
.
� V21 =
� �
� � �� �
5 96 1 46
41 602 56 3
13 867
41 602
27 735
41 602
. .
. .
.
.
.
.
j � 1.02
= 0.963 – j 0.138 = 0.972 �– 8.15°
6.3
Fig. S-6.3
YBUS =0 1445 1 56 0 1445 1 56
0 1445 1 56 0 1445 1 56
. . . .
. . . .
� � �
� � �
�
���
��j j
j j; � = 1/1.04
Modified YBUS =
11 04
0 1445 156 11 04
01445 156
11 04
0 1445 156 01445 156
2( . )( . . )
.( . . )
.( . . ) . .
� � �
� � �
�
�
����
�
�
����
j j
j j
V12 =
� �
�
2 0 80 1445 1 56
j
j
.. .
– 1
1 040 1445 1 56
0 1445 1 56( . ). .
. .� �
�
j
j
= 0.335 – j 1.222 = 1.26 �– 74.66°6.4 Z (series) = 0.1 + j 0.7 �/km
(a) Y (shunt) = j 0.35 � 10–5 /km
Fig. S-6.4 (a)

Solutions 27
A =
(b) Base MVA = 100, Base kV = 220
Ypu
2 (shunt) = j
0 35
2
. � 10–5 �
( )220100
2
= j 84.7 � 10–5/km
Zpu (series) = (0.1 + j 0.7) � 100
220 2( ) = (2.066 + j 14.463) � 10–4/km
Ypu (series) =1
Zpu (series) = (96.8 – j 677.6)/km
The permitive admittance matrix (diagonal matrix) for the system willbe
y10 = j 84.7 � 10–5 (100 + 110 + 150) = j 0.3049y20 = j 84.7 � 10–5 (100 + 100) = j 0.1694y30 = j 84.7 � 10–5 (110 + 120) = j 0.1948y40 = j 84.7 � 10–5 (100 + 120 + 150) = j 0.3134
Y �
�
�
������������
y34 = (96.8 – j 677.6)/120 = 0.807 – j 5.65
�
�
������������
y14 = (96.8 – j 677.67)/150 = 0.645 – j 4.517y12 = (96.8 – j 677.6)/100 = 0.968 – j 6.776y24 = (96.8 – j 677.6)/100 = 0.968 – j 6.776y13 = 96.8 – j 677.6/110 = 0.880 – j 6.160
Fig. S-6.4 (b) Linear Graph Fig. S-6.4 (c) TREE

28 Modern Power System Analysis
YBUS = ATYA
=
1 2 3 4
1
2
3
4
2 493 17 148 0 968 6 776 0 880 6 16 0 645 4 517
0 968 6 776 1 936 13 383 0 0 968 6 776
0 880 6 160 0 1 687 11 615 0 807 5 65
0 645 4 517 0 968 6 776 0 807 5 650 2 42 16 63
. . . . . . . .
. . . . . .
. . . . . .
. . . . . . . .
� � � � � � �
� � � � �
� � � � �
� � � � � � �
�
�
����
�
�
����
j j j j
j j j
j j j
j j j j
6.5 PG1 = 0.6; unknowns are �2, �3, QG1, QG2 and QG3.
YBUS =
�
�
�
�
�
���
�
�
���
j j j
j j j
j j j
10 5 5
5 10 5
5 5 10
From Eq. (6.37) after substituting the relevant data (�1 = 0) we get
1.4 = 10 �2 – 5�3 ; – 1 = – 5�2 + 10�3
which give
�2 = 0.12 rad = 6.87°, �3 = – 0.04 rad = – 2.29°
Substituting the various values and values of �2 and �3 in Eq. (6.38) andsolving we get
Q1 = 0.040 pu, Q2 = 0.100 pu; Q3 = 0.068 pu
� Reactive power generations at the three buses are
QG1 = Q1 + 0.6 = 0.640 puQG2 = Q2 = 0.100 pu; QG3 = Q3 + 1 = 1.068 pu
Reactive losses on the three lines are
QL =i��
1
3
QGi – i��
1
3
QDi = 1.808 – 1.6 = 0.208 pu
Using Eq. (5.71) we can find real power flows as:
P12 =1
0 2. sin (– 6.87°) = – 0.598 pu
P13 =1
0 2. sin 2.29° = 0.200 pu (Notice Pik = – PRi)
P23 =1
0 2. sin 9.16° = 0.796 pu
For reactive power flows Eq. (5.69) is used.
Q12 = Q21 = 1 6 87
0 2� � �cos ( . )
. = 0.036 pu

Solutions 29
Q13 = Q31 = 1 2 29
0 2
� cos .
. = 0.004 pu
Q23 = Q32 = 1 9 16
0 2� �cos .
. = 0.064 pu
Various line flaws are indicated in Fig. S-6.5.
Fig. S-6.5 Load flow solution for the sample system
6.6 (a) |V1| = 1 pu, |V2| = 1.04 pu |V3| = 0.96 pu; PG1 = 0.6 pu
�1 = 0 Substituting the data in Eq. (6.37) we get1.4 = 1.04 � 5 �2 + 1.04 � 0.96 � 5 (�2 – �3)– 1 = 0.96 � 5 �3 + 1.04 � 0.96 � 5 (�3 – �2)
Simplifying, and solving we get
�2 = 0.1164 rad = 6.66°; �3 = – 0.0427 rad = – 2.45°
Substituting the values of various quantities in Eq. (6.38) and solving
Q1 = 0.0395 pu, Q2 = 0.722 pu, Q3 = – 0.508 pu� QG1 = 0.64, QG2 = 0.722, QG3 = 0.492 pu
QL = � QGi – � QDi = 1.854 – 1.6 = 0.254 pu
Real line flows
Pik = – Pki = | | | |V V
Xi k
ik
sin �ik
P12 =1
0 2. sin (– �2) = – 0.58 pu = – 5 sin 6.66°
P13 =1
0 2. sin (– �3) = 5 sin 2.45° = 0.214 pu

30 Modern Power System Analysis
P23 =1
0 2. sin (�2 – �3) = 5 sin 9.11° = 0.792 pu
Qik =| |V
Xi
ik
2
– | | | |V V
Xi k
ik
cos �ik
� Reactive power flows:
Q12 =1
0 2. –
1 1 040 2� .
. cos (– 6.66°) = – 0.165 pu
Q21 = 0.243 pu; Q13 = 0.204 puQ31 = – 0.188 pu; Q23 = 0.479 pu; Q32 = – 0.321 pu
Fig. S-6.6 (a) Load flow solution for the sample system of Problem 6.6 a
It immediately follows from the load flows of Problems 6.5 and 6.6(a) that there is no significant change in real power flows but thereactive power flows have changed significantly.
(b) |V1| = |V2| = |V3| = 1.0 pu; PG1 = PG2 = 1.0 pu, PG3 = 0
�1 = 0, From Eq. (6.37), substitutingP2 = 1.0 and P3 = – 1, we get1 = 10 �2 – 5 �3 and – 1 = – 5 �2 + 10 �3
Solving �2 = – 0.0667 rad = 3.82°�3 = – 0.0667 rad = – 3.82°
Substituting the values of �2 and �3 in Eq. (6.38) we getQ1 = – 0.022 pu; Q2 = 0.055 pu
QG1 = Q1 + 0.6 = 0.622 pu, QG2 = Q2 = 0.055 puQG3 = Q3 + 1 = 1.055 pu, QL = 1.732 – 1.6 = 0.132 pu

Solutions 31
Real line flows
P12 = – 0.333 pu, P13 = 0.333 puP23 = 0.664 pu
Reactive line flows
Q12 = Q21 = 1 3 82
0 2� � �cos ( . )
. = 0.011 pu
Q13 = Q13 = 1 3 82
0 2� cos .
. = 0.011 pu
Q23 = Q32 = 0.044 pu
Fig. 6.6 (b) Load flow solution for the sample system
It is noticed from the load flows of Problems 6.5 and 6.6 (b) thatwhile there are significant changes in real power flows, the changesin reactive power flows are much smaller.
6.7 (a) (i) V1/V1 = 0.99 or � = 1/0.99
YBUS, modified =
� �
� � �
�
�
�
�
�����
�
�
�����
j
j
j
jj
j j j
j j j
5 1 1 0 99
101015
5 0 99
5 05055
5 0505 10 5
5 5 10
2[ /( . ) ]
.
/ .
..
(ii) � = e–j3°
YBUS, modified =
� � �
� �
�
�
�
���
�
�
���
�
� �
j j e j
j e j j
j j j
j
j
10 5 5 93 5
5 5 87 10 5
5 5 10
3
3 º

32 Modern Power System Analysis
(b) P2 = 1.4 = 5.0505 �2 + 5 (�2 – �3)
P3 = – 1 = 5 �3 + 5 (�3 – �2)Solving we get
�2 = 0.119 rad = 6.82°;�3 = – 0.0405 rad = – 2.32°
Q1 = – 5.0505 cos (– 6.82°) – 5 cos 2.32° +10.10152= 0.091 pu
Q2 = – 5.0505 cos 6.82° – 5 cos 9.14° + 10 = 0.049 puQ3 = – 5 cos (– 2.32°) – 5 cos 9.14° + 10 = 0.068 pu
QG1 = 0.691 pu, QG2 = 0.049 pu, QG3 = 1.068 puQL = 1.808 – 1.6 = 0.208 puP12 = 0.600 pu, P13 = 0.202 pu, P23 = 0.794 pu
Q12 =( / . )
.
/ .
.
1 0 99
0 2
1 0 99
0 2
2
� cos – 6.82° = 0.087 pu
Q21 =1
0 21 0 99
0 2./ .
.� cos 6.82° = – 0.014 pu
Q13 = Q31 = 0.004 pu; Q23 = Q32 = 0.064 pu
Fig. S-6.7 (a) Load flow solution for � = 1/0.99
Remark: Only the reactive flow on the line withregulating transformer is changed.
Case (ii) � = e–j3°
� 1 = – 3° or – 0.0523 rad.
P2 = |Y21| (�2 – �1 + 3°) (0.0523 rad)) + |Y23| (�2 – �3)
P3 = |Y31| (�3 – �1) + |Y32| (�3 – �2)

Solutions 33
1.4 = 5 (�2 + 0.0523) + 5 (�2 – �3)
– 1 = 5 �3 + 5 (�3 – �2)
Solving we get
�2 = 0.0852 rad = 4.88°; �3 = – 0.057 rad = – 3.29°
Q1 = – |Y12| cos (�1 – �2 – 3°) – |Y13| cos (�1 – �3) + |Y11|
= – 5 cos (– 7.88°) – 5 cos 3.29° + 10 = 0.055 pu
Q2 = – |Y21| cos (�2 – �1 + 3°) – |Y23| cos (�2 – �3) + |Y22|
= 0.098 pu
Q3 = 0.059 pu
QG1 = 0.655 pu, QG2 = 0.098 pu,
QG3 = 1.059 Pu, QL = 0.212 pu
Real line flows
P12 = 5 sin (� 1 – �2) = – 5 sin 7.88° = – 0.685 pu
P13 = 5 sin (�1 – �3) = 5 sin 3.29° = 0.287 pu
P23 = 5 sin (�2 – �3) = 5 sin 8.17° = 0.711 pu
Reactive line flows
Q12 = 5 – 5 cos (� 1 – �2) = 5 (1 – cos 7.88°) = 0.047 pu
Q13 = 5 – 5 cos (�1 – �3) = 0.008 pu; Q23 = 0.051 pu
Fig. S-6.7 (b) Load flow solution for the sample system � = je–3°
Remark: With introduction of phase shifting transformer in line 1–2, the realload flow changes much more than the changes in reactive load flows.

34 Modern Power System Analysis
6.8
Fig. S-6.8
Refer to Ex. 6.4
V13 =
1
33
3 3
30 31 1 32 2
034 4
0
Y
P j Q
VY V Y V Y V
�� � �
��
��( )*
=1 1 0 5
1 01 04 1 3 0 666 2 2 6
33Y
jj j j
� �
�� � � � � � � � �
��
��
.. ( ) ( . ) ( )
=1
3 666 112 706 11 62
.. .
��
��
��j
j
= 1.025 – j 0.095 pu= 1.029 �– 5.3° pu

Solutions 35
��������
7.1 Data of Ex. 7.2; PG1 = PG2 = 110 MWFrom Table 7.1 of the text, for a load of 220 MW optimum schedule isPG1 = 100 MW, PG2 = 120 MWIncrease in cost for unit 1 is
100
110
� (0.2 PG1 + 40) dPG1 = (0.1 PG21 + 40 PG1)
100
110
= 610 Rs/hr
For unit 2
120
110
� (0.25 PG2 + 30) dPG2 = – 587.5
� Extra cost incurred in Rs/hr = 610 – 587.5 = 22.57.2 (a) PG1 + PG2 = 300 (i)
0.1 PG1 + 20 = 0.12 PG2 + 15 (ii)Solving (i) and (ii) we get,
PG1 = 310/2.2 = 140.9 MW
PG2 = 300 – 140.9 = 159.1 MW
(b) Equal load sharing results in PG1 = PG2 = 150 MWIncrease in cost for unit 1
140 9
150
.� (0.1 PG1 + 20) dPG1 = 314.36 Rs/hr
Increase in cost for unit 2
159 1
150
.� (0.12 PG2 + 15) dPG2 = – 305.27 Rs/hr
Net saving = (314.36 – 305.27) � 24
= Rs 218.16/day
7.3 (i) Gen. A will share more load than Gen. B.(ii) Gen. A and Gen. B will share load of PG each.
(iii) Gen. B will share more load then Gen. A.7.4 PG1 + PG2 + PG3 = 400
PG1 = – 100 + 50 (IC) – 2 (IC)2 (i)PG2 = – 150 + 60 (IC) – 2.5 (IC)2 (ii)PG3 = – 80 + 40 (IC) – 1.8 (IC)2 (iii)
Adding (i), (ii) and (iii), we get400 = – 330 + 150 (IC) – 6.3 (IC)2
or 6.3 (IC)2 – 150 (IC) + 730 = 0� IC = 6.821; 16.989For IC = 6.821, � PG1 = 148.0,
PG2 = 142.9, PG3 = 109.1 MW

36 Modern Power System Analysis
For IC = 16.989 � PG1 = 172.2,
PG2 = 147.8, PG3 = 80.0 MW
One of the solutions will be rejected in accounting for the upper and lowerlimits of machine loading. Here we reject the second solution.Note: Since the equations are quadratic in (IC), exact solution is possiblehere.
7.5 Fuel cost = Rs 2/million kilocalories� C = 0.0002 P3
G + 0.06 P2G + 24.0 PG + 300
�dC
dPG
= 0.0006 P2G + 0.12 PG + 24
A plot of dC
dPG
Vs PG shows a good linear approximation between 0 and
80 MW to bedC
dPG
= 0.175 PG + 23
7.6 Equation (7.31) for plant 1 becomes(a) 0.02 PG1 + 2� B11 PG1 + 2� B12 PG2 = � – 16
For � = 26, 0.02 PG1 + 52 � 0.001 PG1 = 10 � PG1 = 138.89 MWSimilarly for plant 2, 0.04 PG2 = 6 or PG2 = 150 MWNow PL = 0.001 � (138.89)2 = 19.29 MW� PD = PG1 + PG2 – PL = 269.60 MW
(b) 0.02 PG1 + 16 = 0.04 PG2 + 20
PG1 + PG2 = 0.001 P2G1 + 269.61
Solving, PG1 = 310.8 MW; PG2 = 55.4 MW
(c) For part (a)
CT = 0.01 (138.89)2 + 16 � 138.89+ 250 + 0.02 (150)2 + 20 � 150 + 350
= Rs 6,465.14/.hr
For part (b)
CT = 0.01 (310.8)2 + 16 � 310.8 + 250+ 0.02 (55.4)2 + 20 � 55.4 + 350
= Rs 7,708.15/hr
7.7 Ia = 2 – j 0.5 pu, Ib = 1.6 – j 0.4 pu, Ic = 1.8 – j 0.45 pu
Za = 0.06 + j 0.24 pu, Zb = Zc = 0.03 + j 0.12 pu
I
I IC
b c� =
1 8 0 453 4 0 85. .. .�
�
j
j = 0.5294
� Ma1 = – 0.5294, Mb1 = 0.4706, Mc1 = 0.5294Ma2 = 0.4706, Mb2 = 0.4706, Mc2 = 0.5294

Solutions 37
V1 = 1.0 �0° puV2 = 1 + (2 – j 0.5) (0.06 + j 0.24) = 1.319 �20°
The current phase angles at the plants are(I1 = Ib – Ia, I2 = Ia + Ic)
�1 = tan–1 (0.1/– 0.4) = 166°; �2 = tan–1 � 0 95
3 8
.
. = – 14°
cos (�2 – �1) = – 1The plant power fractors are
pf1 = cos 166° = – 0.97; pf2 = cos (20° + 14°) = 0.829From Eq. (7.42)
B11 =0 06 0 5294 0 03 0 4706 0 5294
0 97)
2 2 2
2
. ( . ) . [( . ) ( . ) ]
( .
� �
� = 0.03387 pu
B22 =0 06 0 4706 0 03 0 4706 0 5294
1 319 0 829
2 2 2
2 2
. ( . ) . [( . ) ( . ) ]
( . ) ( . )
� � �
� = 0.0237 pu
B12 =� � � � � �
� � � �
1 0 06 0 5294 0 4706 0 03 0 4706 0 5294
1 1 319 0 97) 0 829
2 2{ . . . . [( . ) ( . ) ]}
. ( . .
= 9.6073 � 10–5 puFor a base of 100 MVA
B11 = 0.03387 � 10–2 MW–1; B22 = 0.0237 � 10–2 MW–1
B12 = 9.6073 � 10–7 MW–1
7.8 Economically optimum unit commitment is obtained below by referring toTable 7.3.
Time Load MW Unit number
1 2 3 4
0–4 20 1 1 1 14–8 14 1 1 1 08–12 6 1 1 0 012–16 14 1 1 1 016–20 4 1 0 0 020–24 10 1 1 0 0
Optimal and secure UC TableIn the above table the modification will take place in the last but one row asfollows:
16–20 4 1 1* 0 0
* = unit started due to security considerations.7.9 Load cycle 6 AM – 6 PM � 220 MW
6 PM – 6 AM � 40 MWFor 220 MW, referring to Table 7.1 we get PG1 = 100; PG2 = 120 MW.

38 Modern Power System Analysis
Total fuel cost for this period is = Rs 1,27,440 = 00 (See Ex. 7.3) If bothunits operate in the light load period also, then Table 7.1 gives PG1 = 20MW; PG2 = 20 MW
CT = (0.1 � 202 + 40 � 20 + 120+ 0.125 � 202 + 30 � 20 + 100) � 12
= Rs 20,520.00Total fuel cost when both units are operating throughout = Rs 1,47,960.If only one of the units is run during the light load period, it is easilyverified that it is economical to run unit 2 and to put off unit 1. When thetotal fuel cost during this period = (0.125 � 402 + 30 � 40 � 100) � 12= Rs 18,000Total fuel cost = Rs 1,45,440Total operating cost for this case = 1,45,440 + 400 = Rs 1,45,840Comparing, we can say it is economical to remove unit 1 from service forthe 12 hours of light load period.
7.10 Inequality constraints are considered employing penalty functions. Modi-fied Lagrangian of Eq. (7.77) becomes
� =m� [C (Pm
GT) + W (PmGT) + W(Xm) + W(Pm
GH)
– �1m (Pm
GT + PmGH – Pm
L – PmD) + �m
2 (Xm – Xm – 1 – Jm + qm)
+ �m3 {Pm
GH – h0 (1 + 0.5 e (Xm + Xm – 1)) (qm – e)] (i)
where W(X) is a Powell’s penalty function of X.
The dual variables are obtained from the equations
�
�
�
PGHm =
dc P
d PGTm
GTm
( ) + W (Pm
GT) – �m1 1 �
�
�
�
���
��P
PLm
GTm = 0 (ii)
�
�
�
PGTm = W (Pm
GH) + �m3 – �m
1 111
��
�
�
���
��P
PLm
Gm = 0 (iii)
�
�
���
���
�
�m m M0
= W (Xm) + �m2 – �2
m+1 – �m3 {0.5h0 e (qm – �)}
– �3m+1 {0.5 h0 e (qm+1 – �)} = 0 (iv)
�
�
���
���
�
q1 = ��2 – ��3 h0 {1 + 0.5 e (2X° + J – 2q + �)} = 0 (v)
The gradient vector is given by Eq. (7.82)

Solutions 39
��������
8.1
Fig. S-8.1 (a)
Generator 1 = 200 MW, 4% droop2 = 400 MW, 5% droop
As the load is reduced to 400 MW, let
load on gen 1 = x MW� load on gen 2 = (400 – x) MW
Rise in freq. = �fNow �f /(200 – x) = 0.04 � 50/200 (i)
�f /x = 0.05 � 50/400 (ii)Equating �f in Eqs (i) and (ii), we get
x = 123 MW (load on gen 1)� 400 – x = 277 MW (load on gen 2)
System freq. = 50 + 0 05 50
400. �
� 123 = 50.77 Hz
Fig. S-8.1 (b)
f10 50400 3
�
/ =
0 04 50
200
. � or f10 = 51
13
Hz

40 Modern Power System Analysis
f20 50
800 3
�
/ =
0 05 50
400
. � or f20 = 51
23 Hz
8.2
Fig. S-8.2
Ksg Kt = 1
11 � T seq
=1
1 0 9� . s;
K
T sps
ps1 � =
100
1 20� s;
1
R =
1
3
�F(s) =100 1 20
1100
1 2013
11 0 9
0 01/( )
.
.�
��
� ��
�s
s ss
=0 056 1 0 9
116 1 912
. ( . )
( . . )
�
� �
s
s s s
s = ( . ( . ) . )� � �116 116 7 64 22 = – 0.58 ± j 1.254
�F(s) = ��
� � � �
0 056 1 0 9
0 58 1 254 0 58 1 254
. ( . )
( . . ) ( . . )
s
s s j s j
�f (t) = – 0.029 – 2 Re 0 056 1 0 9
0 58 1 2540 58 1 254
0 58 1 254
. ( . )
( . . )( . . )
( . . )
�
� �
���
��
���
��� � �
� �
s
s s j s j
e j t
= – 0.029 – 0.04 e–0.58 t cos (1.254 t + 137.8°)
�f(t) vs t can be plotted from this equation. The response has now becomeoscillatory and is therefore closer to the exact response.
8.3 �F(s) = ��
�� �
� ��
� �
�
�
�
�
K
T s
T s T s R
K
s
K
s T
s
ps
ps
sg t
i ps
ps
( )
( ) ( )
1
1 11 1
11
1
0lim t
t
�
� �f (t) dt = lims �0
�F(s) = 1Ki
cycles = 1 150Ki
� sec.

Solutions 41
Error in cycles is inversely proportional to Ki, the gain of integralcontroller.
8.4 Due to integral action of the block 2 12� T
s, [�f1(t) – �f2(t)] would go to
zero as t � i.e. �f1 () = �f2 () = �fUnder steady condition substitute s = 0 for all other blocks (these are timeconstants).For area 1
�f = {– (b1 �f + � Ptie, 1) Ki1 – 1
1R �f – �Ptie, 1 – 1} Kps1
For area 2
�f = {– (b2 �f – a12 �Ptie, 1) Ki2 – 1
1R �f + a12 �Ptie, 1 – 1} Kps2
Reorganising we get
1 1
11 1
1KK b
Rp si� �
�
�
� �f + (Ki1 + 1) �Ptie,1 = – 1
1 1
22 2
2KK b
Rp si� �
�
�
� �f – a12 (Ki2 + 1) �Ptie, 1 = – 1
Solving we get
�f = �� � �
� � ��
�
� � � � �
�
�
�
a K K
a KK
K bR
KK
K bR
i i
ips
i ips
i
12 2 1
12 21
1 11
12
2 22
1 1
1 1 1 1 1 1
( ) ( )
( ) ( )
�Ptie, 1 =
1 1 11
1 1 1 1 1 1
1 11
2 2 22
12 21
1 11
12
2 22
KK b
R K K bR
a KK
K bR
KK
K bR
psi
ps i
ips
i ips
i
� ��
�
� �
� �
�
���
�
� � ��
�
� � � � �
�
�
� ( ) ( )
8.5. For area 1
– [�Ptie, 1 (s) + b �F1 (s)] � K K
s T s T s T si ps
sg t ps( ) ( ) ( )1 1 1� � �
� �� � �
11 1 1R
K
T s T s T sps
gs t ps( ) ( ) ( ) �F1 (s) –
K
T sps
ps( )1 � �Ptie, 1(s)
– K
T sps
ps( )1 � �PD1 (s) = �F1 (s)

42 Modern Power System Analysis
142 5
1 0 4 1 0 5 1 20
33 3
1 0 4 1 0 5 1 20�
� � ��
� � �
�
��
�
��
.
( . ) ( . )( )
.
( . ) ( . )( )s s s s s s s �F1 (s)
+ 42 5
1 0 4 1 0 5 1 20
100
1 20
.
( . ) ( . ) ( ) ( )s s s s s� � ��
�
�
��
�
�� �Ptie, 1 (s) = �
��
100
1 20
1
( )s s
[s (1 + 0.4 s) (1 + 0.5 s) (1 + 20 s) + 42.5 + 33.3 s] �F1 (s)+ [42.5 + 100 s (1 + 0.4 s) (1 + 0.5 s] �Ptie, 1 (s) = – 100(1 + 0.4 s) (1 + 0.5 s) (i)For area 2[s (1 + 0.4 s) (1 + 0.5 s) (1 + 20 s) + 42.5 + 33.3 s1] �F2 (s)– [42.5 + 100 s (1 + 0.4 s) (1 + 0.5 s)] �Ptie, 1 (s) = 0
[�F1 (s) – �F2 (s)] � 2 12� T
s = �Ptie, 1 (s) = 0 (ii)
�F1 (s) = �F2 (s) + 20s �Ptie, 1 (s) (iii)(4s4 + 18.2s3 + 20.9s2 + 34.3s + 42.5) �F1(s) + (20s3 + 90s2
+ 100s + 42.5) �Ptie, 1 (s) = – 100 (0.2 s2 + 0.9 s + 1) (iv)(4s4 + 18.2 s3 + 20.9 s2 + 34.3 s + 42.5) �f2 (s) – (20s3+ 90s2
+ 100s + 42.5) �Ptie, 1 (s) = 0 (v)�F1 (s) = �F2 (s) + 20s �Ptie, 1 (s) (vi)
(4s4 + 18.2s3 + 20.9s2 + 34.3s + 42.5) �F2 (s) + (80s5 + 364s4
+ 438s3 + 776s2 + 950s + 42.5) �Ptie, 1 (s)= – 100 (0.2 s2 + 0.9s + 1)
(4s4 + 18.2s3 + 20.9s2 + 34.3s + 42.5) �F2(s) – (20s3 + 90s2
+ 100s + 42.5) �Ptie, 1 (s) = 0From which we get
�Ptie, 1 (s) = �� �
� � � � �
100 0 2 0 9 1
80 364 458 866 1050 85
2
5 4 3 2
( . . )s s
s s s s s
To check stability apply Routh’s criterion to the characteristic equation
80s5 + 364s4 + 458s3 + 866s2 + 1,050s + 85 = 0
s5 80 458 1,050
s4 364 866 85
s3 267.7 1031
s2 – 536.9
s1
s0
Clearly, the system is found to be unstable.

Solutions 43
��������
9.1 Z = 5 + j 314 � 0.1 = 5 + j 31.4 = 31.8 �81°; L/R = 0 1
5
. = 0.02 sec.
Substituting in Eq. (9.1)
iz =100
31 8. sin (314t + 15° – 81°) +
100
31 8. sin (81° – 15°)e–50t
= 3.14 sin (314 t – 66°) + 2.87e–50t
First current maximum of symmetrical s.c. current occurs at
57.3 � 314t – 66° = 90°; � t = 0.00867 sec
First current maximum
imm = 3.14 + 2.87 e–50 � 0.00867 = 5 A
9.2 For dc off-set current to be zero: � – � = 81°(b) For dc offset current to be maximum: � – � = 90° � � = � – 90° = –9°
9.3
Fig. S-9.3
All voltages before fault are 1 pu as the system is operating on no load.(i) Fault at P
Current to be interrupted by circuit breaker A,
IA =�
� � �
j
0 2 0 1 0 15 0 1. . . .
(Base current in gen circuit = 25 3 11/ � = 1.312 kA) IA = – j 1.818 pu
� IA = 2.386 kA
Current to be interrupted by circuit breaker B,
IB =1
1 25j . = – j0.8 pu
Base current in motor circuit = 25 3 6 6/ .� = 2.187 kA
� IB = 1.75 kA
44 Modern Power System Analysis
(ii) Fault at Q
IA =�
�
j
0 2 0 1. . = – j 3.33 pu = 4.373 kA
IB =1
1 25j . = – j 0.8 pu = 1.75 kA
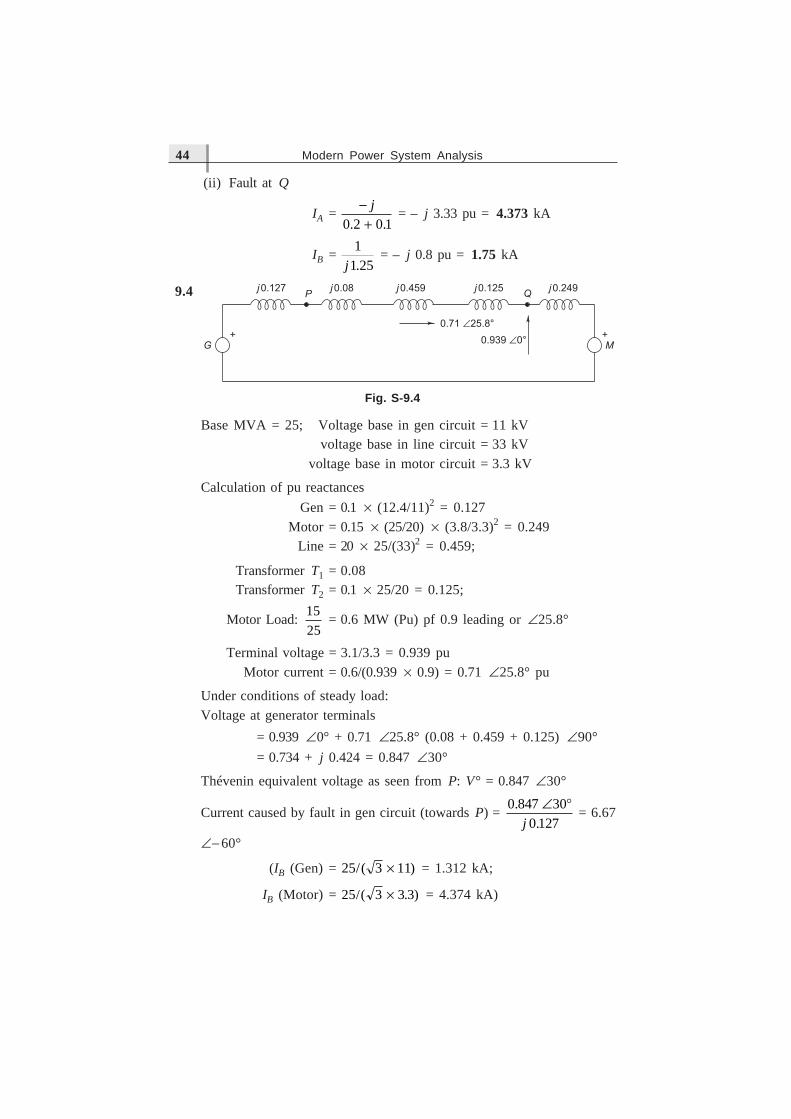
9.4
Fig. S-9.4
Base MVA = 25; Voltage base in gen circuit = 11 kVvoltage base in line circuit = 33 kV
voltage base in motor circuit = 3.3 kV
Calculation of pu reactances
Gen = 0.1 � (12.4/11)2 = 0.127Motor = 0.15 � (25/20) � (3.8/3.3)2 = 0.249
Line = 20 � 25/(33)2 = 0.459;
Transformer T1 = 0.08Transformer T2 = 0.1 � 25/20 = 0.125;
Motor Load: 15
25 = 0.6 MW (Pu) pf 0.9 leading or �25.8°
Terminal voltage = 3.1/3.3 = 0.939 puMotor current = 0.6/(0.939 � 0.9) = 0.71 �25.8° pu
Under conditions of steady load:Voltage at generator terminals
= 0.939 �0° + 0.71 �25.8° (0.08 + 0.459 + 0.125) �90°
= 0.734 + j 0.424 = 0.847 �30°
Thévenin equivalent voltage as seen from P: V° = 0.847 �30°
Current caused by fault in gen circuit (towards P) = 0 847 30
0 127.
.� �
j = 6.67
���60°
(IB (Gen) = 25 3 11/( )� = 1.312 kA;
IB (Motor) = 25 3 3 3/( . )� = 4.374 kA)

Solutions 45
Current caused by fault in motor circuit (towards P) = 0 847 30
0 913
.
.
� �
j
= 0.93 �– 60°
Motor current during fault = – 0.71 �25.8° + 0.93 �– 60°
= – 0.174 – j 1.114 pu = 4.93 kA
9.5 Base: 1 MVA, 0.44 kV; Line reactance = 0 05 1
0 44 2
.
( . )
� = 0.258 pu
Reactance of large system = 1/8 = 0.125 pu
Operating voltage at motor bus before fault = 0 4
0 44..
= 0.909 pu
Short circuit current fed to fault at motor bus = 0.909 1
0 125 0 258. .�
���
+
21
0 1�
���.
= 20.55 pu
Base current = 1 3 0 44/( . )� = 1.312 kA
� Short circuit current = 26.96 kA
9.6 Base: 0.5 MVA, 0.44 kV,
Base current =0 5
3 0 44
.
.� = 0.656 kA
Load =0 4
0 5
.
. = 0.8 MW (pu)
pf = 0.8 lagging or �– 36.9°
Load current before fault = 0 80 8
.
. �– 36.9° = 1 �– 36.9° pu
Thévenin voltage V � = 1 �0° pu; Thévenin, reactance = j = 0.1 pu
Gen current caused by fault = 1
0 1j . = – j 10 pu
Post fault current at gen terminals = – j 10 + 1 �– 36.9° = 0.8 – j 10.6
= 10.63 �– 85.7° = 6.97 kA
9.7 Bus: 10 MVA, 6.6 kV (Gen), 6.6/31.56 kV (transformer)
Base current = 10/( 3 � 31.56) = 0.183 kAGen reactances: x�d = 0.1, xd = 0.2, xd = 0.8 puTransformer reactance: 0.08 � (6.9/6.6)2 = 0.0874 pu

46 Modern Power System Analysis
No load voltage before fault = 30/31.56 = 0.95 pu
(a) Initial symmetrical rms current = 0 95
0 1 0 0874
.
. .� = 5.069 pu
= 0.9277 kA
(b) Max. possible dc off-set current = 2 � 0.9277 = 1.312 kA(c) Momentary current (rms) rating of the breaker = 1.6 � 0.9277
= 1.4843 kA(d) Current to be interrupted by the breaker (5 cycle) = 1.1 � 0.9277
= 1.0205 kA; Interrupting MVA = 3 � 30 � 1.0205 = 53.03 MVA
(e) Sustained short circuit current in breaker = 0 95
0 8 0 0874
.
. .� � 0.183
= 0.1959 k/a
9.8
Fig. S-9.8
Base: 100 MVA; 12 kV (Gen. ckt), 66 kV (line)
Base current (gen ckt) = 100 3 12/( )� = 4.81 k/A
Base current (line) = 100 3 66/( )� = 0.875 kA
Component reactances
Gen: 0.35 � (100/60) = 0.583 pu;
Line: =12 100
66 2
�
( ) = 0.275 pu
Transformer: 0.08 � (100/80) = 0.1 pu
Load: 50/100 = 0.5 pu,
11/12 = 0.917 pu,
pf = 0.8 lag; �– 36.9°
Load current = 0.5/0.917 = 0.545 pu
Thévenin voltage at F before fault, V � = 0.917 �0°

Solutions 47
Current through breaker A due to fault = 0 917
0 583 0 1 0 275
.
( . . . )j � �
= 0.957 �– 90°
Post fault current through breaker A = 0.957 �– 90° + 0.545 �– 36.9°
= 0.436 – j 1.284 = 1.356 pu = 6.522 kA
Current through breaker B due to fault = 0.917/j 0.1 = 9.17 �– 90°
Post fault current through breaker B = 9.17 �– 90° + 0.545 �– 36.9°
= 0.436 – j 9.497 = 9.507 pu
= 8.319 kA
9.9
Fig. S-9.9
Assumption: All reactances are given on appropriate voltage bases.Prefault no load voltage = 1puBase: 100 MVA
SC rupturing capacity of breaker = 333
100 = 3.33 pu
Equivalent system reactance = 1/3.33 = 0.3 puEquivalent system reactance at gen bus = 0.3 – 0.08 = 0.22 puNow
1
0 22. =
1
0 6
1
0 4
1
0 25. . .� �
�x � X = 2.39 pu

48 Modern Power System Analysis
9.10
Fig. S-9.10
Base: 100 MVA, 110 kV on linesComponent reactances (pu):
G1 = 0.3
G2 = 0.18 � 100
60 = 0.3
Transformer (each): 0.2Inductive reactor: 0.2
Line (each):80 100
110 2
�
( ) = 0.66
Converting delta to star (shown dotted)
X1 =1 59 0 2
2 32. .
.�
= 0.137;
X2 =0 2 0 53
2 32. .
.�
= 0.046
X3 =0 53 1 59
2 32
. .
.
� = 0.363
Equivalent reactance = (0.3 + 0.137) || (0.3 + 0.046) + 0.363 = 0.556
Fault current I f =1
0 556j . = – j 1.8

Solutions 49
Let us now determine the part of I f that flows through A and the part thatflows through B
I fG1 = – j 1.8 �
0 3460 783..
= – j 0.795
I fG2 = – j 1.8 �
0 437
0 783
.
. = – j 1.005
V2 = 1 – (– j 1.005) � j 0.3 = 0.6988 0.7V1 = 1 – (– j 0.795) � j 0.3 = 0.7615 0.762IA
f = 0.7/j 0.53 = – j 1.321SC MVA through A = 1.321 � 100 = 132.1
IBf = 0.762/j1.59 = – j 0.479
SC MVA through B = 0.479 � 100 = 47.9If reactor X is eliminatedEquivalent reactance = (0.3 // 0.3) + (1.59 // 0.53) = j 0.5475
I f = – j 1.826
IAf = j 1.826 �
1 592 12..
= – j 1.369 SC MVA = 136.9
IBf = – j 1.826 �
0 53
2 12
.
. = – j 0.456 SC MVA = 45.6
There is no significant change in SC MVA through A and B caused by X.9.11
Fig. S-9.11
Fault current contribution by generator = 1
0 25j . = – j 4
Fault current contribution by power network
= – j 1 = 1
0 12 0 28j j j X. .� �
� X + 0.4 = 1� X = 0.6 pu
9.12 From the network of Fig. P-9.12, we can write
YBUS =�
�
�
�
�
���
j j jj j jj j j
26 67 10 1010 26 67 1010 10 20
..

50 Modern Power System Analysis
Inverting,
� ZBUS =
j j j
j j j
j j j
0 0885 0 0613 0 0749
0 0613 0 0885 0 0749
0 0749 0 0749 0 1249
. . .
. . .
. . .
�
�
�
���
Using Eq. (9.26), V1f = V1
0 – (Z13/Z23) V30
The prefault condition being no load, V10 = V2
0 = V30 = 1 pu
� V1f = 1.0 –
j
j
0 0749
0 1249
.
. � 1 = 0.4004 pu // ly
V2f = 0.4004; V3
f = 0From Eq. (9.25) If = 1.0/j 0.1249 = – j 8.006 puS.C. current in line 1–3
I f13 =
V V
z
f f1 3
13
� =
0 4004 0
01
.
.
�
j = – j 4.094 pu
The fault current for a fault on bus 1 (or bus 2) will be
I f =1 00
11 22
.
( )Z Zor
=1 00
0 0885
.
.j = – j 11.299 pu.

Solutions 51
��������
10.1
Fig. S-10.1
(i) �2 – 1 = – 1.5 – j 0.866 = 1.732 �210°(ii) 1 – � – �2 = 1 – (– 0.5 + j 0.866) – (– 0.5 – j 0.866) = 2�0°
(iii) 3�2 + 4� + 2 = 3 (– 0.5 – j 0.866) + 4 (– 0.5 + j 0.866) + 2= 1.732 �150°
(iv) j� = 1 �90° �� 1 �120° = 1 �210°10.2
Fig. S-10.2 a
Base: 750 kVA, 2,500 V; Load: 1 pu kVA, 1 pu V
Load voltages |Vab| = 0.8, |Vbc| = 1.16, |Vca| = 1.0Choosing phase angle of Vbc to be – 90°
(0.8)2 = (1.16)2 + (1)2 – 2 � 1.16 cos �� � = 42.7°
Vca = 1.0 �132.7°(1.16)2 = (1)2 + (0.8)2 – 2 � 0.8 cos �
� = 79.4° � Vab = 0.8 � 32.1� ; Vbc = 1.16 � – 90�
Vab1 =1
3 [0.8 �32.1° + 1.16 �30° + 1 �12.7°]
= 0.975 �24.7°
Vab2 =1
3 [0.8 �32.1° + 1.16 �150° + 1 �– 107.3°]
= 0.21 �175.3°(line-to-line voltage base)
Va1 = Vab1 �– 30° = 0.975 �– 5.3°(line-to-neutral voltage base)

52 Modern Power System Analysis
Va2 = Vab2 �30° = 0.21 �205.3°(line-to-neutral voltage base)
Assuming + 90° connectionVA1 = Va1 �90° = 0.975 �84.7°;VA2 = Va2 �– 90° = 0.21 �115.3°
Load resistance = 1 pu to both positive and negative sequence cur-rents.� IA1 = 0.975 �84.7° pu;
IA2 = 0.21 �115.3° puIA = IA1 + IA2
= 0.975 �84.7° + 0.21 �115.3°= 0.0003 + j1.16 = 1.16 �90° pu
Similarly IB and IC can be found.VAB1 = VA1 �30° = 0.975 �114.7°VAB2 = VA2 �– 30° = 0.21 �85.3°VAB = VAB1 + VAB2 = 0.975 �114.7° + 0.21 �85.3°
= 1.17 �109.5° puVBC = �2 VAB1 + �VAB2
= 0.975 �– 53° + 0.21 �– 154.7°= 0.953 �� –65.4° pu
VCB = � VAB1 + �2 VAB2
= 0.975 �–125.3° + 0.21 �– 34.7°= 0.995 �–113.1° pu
10.3 Va1 =13
[200 + 200 �5° + 200 �– 15°]
= 197.8 �– 3.3° V
Va 2 =1
3 [200 + 200 �125° + 200 �– 135°]
= 20.2 �158.1° V
Va 0 =1
3 [200 + 200 �245° + 200 �105°]
= 21.61 �10.63° V
10.4
Fig. S-10.4

Solutions 53
Ib =100
3 �– 120° = 33.3 �– 120° A;
Ic = 33.3 �60° A; Ia = 0Ia0 = 0
Ia1 =1
3 [33.3 + 33.3 �– 60°] = 19.23 �– 30° A
Ia2 =1
3 [33.3 �120° + 33.3 �180°]
= 19.23 �150° A
10.5
Fig. S-10.5
Iab =400
20 = 20 �0° A
Ibc =400
250 �– 120° = 1.6 �– 120° A
Ica =400
15 �120° = 26.7 �120° A
IA = Iab – Ica = 20 – 26.7 �120°= 40.58 �– 34.7°
IB = Ibc – Iab = 1.6 �– 120° – 20= 20.84 �183.8°
Ic = Ica – Ibc = 26.7 �120° – 1.6 �– 120°= 27.54 �117.1°
IA1 =1
3 [40.58 �– 34.7° + 20.84 �– 56.2° + 27.54 �– 2.9°]
= 27.87 �– 30°
IA2 =13
[40.58 �– 34.7° + 20.84 �63.8° + 27.54 �– 122.9°]
= 13 �– 44.93°IA0 = 0

54 Modern Power System Analysis
Iab1 =1
3 [Iab + �Ibc + a2Ica]
=1
3 [20 + 1.6 + 26.7] = 16.1 A
Iab2 =1
3 [20 + 1.6 �120° + 26.7 �240°]
= 7.5 �– 74.94° A
Iab0 =1
3 [20 + 1.6 �– 120° + 26.7 �120°]
= 7.5 �74.94°
10.6 Obviously Ia1 = 0
Va1 = Z11 Ia1 + Z12 Ia2 (i)Va2 = Z21 Ia1 + Z22 Ia2 (ii)
Now Va1 = 200 �0°; Va2 = 0(a balanced 3� supply is assumed)
Z11 =1
3 (10 + 15 + 20) = 15 �0°
Z12 =1
3 (10 + 15 �– 120° + 20 �120°)
= – 2.5 j 1.44 = 2.89 �150°
Z21 =1
3 (10 + 15 �120° + 20 �– 120°)
= – 2.5 – j 1.44 = 2.89 �– 150°
Z22 =1
3 (10 + 15 + 20) = 15 �0°
Substituting in (i) and (ii) we get200 = 15 Ia1 + 2.89 �150° Ia2 (iii)
0 = 2.89 �– 150° Ia1 + 15 Ia2 (iv)Solving (iii) and (iv) for Ia1 and Ia2, we have
Ia2 = 2.67 �30°; Ia1 = 13.85 �0°Currents in load branches
Ia = 13.85 + 2.67 �30° = 16.16 + j 1.335 AIb = 13.85 �– 120° + 2.67 �150° = – 9.24 – j 10.66 A
Ic = 13.85 �120° + 2.67 �– 90° = – 6.93 + j 9.32 AVa0 = Z01 Ia1 + Z02 Ia2
From Eq. (10.40)Z01 = Z12 = 2.89 �150°Z02 = Z21 = 2.89 �– 150°

Solutions 55
� Va0 = 2.89 �150° � 13.85 �0° + 2.89 �– 150° � 2.67 �30°= 40.75 �160.9°
|VNn| = |Va0| = 40.75 volts
10.7
Fig. S-10.7
VAB = 200 �0°, VBC = 100 �255.5°,VCA = 200 �151°
Check VAB + VBC + VCA = 0
VAB1 =1
3 [200 + 100 �15.5° + 200 �31°]
= 161.8 �15.5°
VAB2 =1
3 [200 + 100 �135.5° + 200 �����–89°]
= 61.8 �– 44.5°
VA1 =161 8
3
. �– 14.5° = 93.4 �– 14.5°
VA2 =61 8
3
. �– 14.5° = 35.7 �– 14.5°
IA1 =93 420
. = 4.67 �– 14.5°;
IA2 =35 720
. = 1.79 �– 14.5°
IA = 4.67 �– 14.5° + 1.79 �– 14.5°= 6.46 �– 14.5°
IB = 4.67 �225.5° + 1.79 �105.5°= 4.08 �– 156.8°
IC = 4.67 �105.5° + 1.79 �225.5°= 4.08 �127.8°
Positive sequence power = 3 � 93.4 � 4.67 = 1308.5
Negative sequence power = 3 � 35.7 � 1.79 = 191.7
Total power 1,500.2 Watts
Check P = 20 (6.462 + 4.082 + 4.082) = 1,500.4 Watts.

56 Modern Power System Analysis
10.8 Base: 50 MVA, 220 kV (in line), 11 kV (Gen. 1 and 2)
X�g1 = 0.2 � 50
25 = 0.4 X0 (each m/c) = 0.08 �
50
25 = 0.16
X�g2 = 0.4, XT (each) = 0.15 � 50
25 = 0.375
XL =50 50
220 2
�
( ) = 0.052 XL0 = 0.052 � 2.5 = 0.13
Grounding reactance (each) = 0.05 � 50
25 = 0.1
Fig. S-10.8

Solutions 57
10.9 Base: 50 MVA, 11 kV (Gen 1, 2, Motor), 120 kV (line)
Gen 1: X� = 0.4, X2 = 0.3, X0 = 0.06Gen 2: X� = 0.67, X2 = 0.5, X0 = 0.17Mot. 3: X� = 0.4, X2 = 0.4, X0 = 0.2Transf. 1: X = 0.2, Transf. 2: X = 0.4, Transf. 3: X = 0.5
Line (each) = 25 � 50/(120)2 = 0.086,XLO = 0.086 � 2.5 = 0.215
Neutral grounding reactance of G1 and M3 = 0.1 each
Fig. S-10.9

58 Modern Power System Analysis
��������
11.1 Ia1 = Ia2 = Ia0 = 1
0 2 0 3 0 1j ( . . . )� � = – j 1.667 pu
Base current =25
3 11� = 1.312 kA
� Ia1 = – j 2.187 kA; Ia = – j 6.56 kAVa1 = 1 – j 0.2 � (– j 1.667) = 0.667Va2 = – j 0.3 � (– j 1.667) = – 0.5Va0 = – j 0.1 � (– j 1.667) = – 0.1667Va = 0Vb = �
2 � Va1 + � Va2 + Va0
= 0.667 �– 120° – 0.5 �120° – 0.1667= – 0.25 – j 1.01
Vc = 0.667 �120° – 0.5 �– 120° – 0.1607= – 0.25 + j 1.01
Vbc = Vb – Vc = – j 2.02 pu |Vbc| = 2.02 � 11
3 = 12.83 kV
Vab = Va – Vb = 0.25 + j 1.01 pu |Vab| = 1.04 � 11
3 = 6.61 kV
Vca = Vc – Va = – 0.25 + j 0.101 pu |Vca| = 1.04 � 11
3 = 6.61 k/V
Fig. S-11.1

Solutions 59
11.2 (a) LL fault
Ia0 = 0; Ia1 = – Ia2 = 10 5j .
= – j2
Ib = – Ic = �2 Ia1 + � Ia2
= (�2 – �) (– j2) = � 2 3 pu
Va1 = 1 – j 0.2 (– j2) = 0.6 = Va2
Vab = Va – Vb
= (Va1 + Va2 + Va0) – (�2 Va1 + � Va2 + Va0)= (2 – � – �2) � 0.6
= 1.8 pu = 1.8 � 11 3/ = 11.43 kV = Vac
Fig. S-11.2 (a)
(b) LLG fault
Ia1 =1
0 2 0 3 0 1j j j. ( . | | . )� = – j 3.64
Ia2 = j 3.64 � 0.1/0.4 = j 0.91
Ia0 = j 3.64 � 0.3/0.4 = j 2.73
Va1 = Va2 = Va0
= 1 – ( j 0.2) (– j 3.64) = 0.272
Va = 3 Va1 = 0.816;
Vb = 0; Vab = Va – Vb = 0.816 = Vac
Ib = �2 Ia1 + � Ia2 + Ia0
= 3.64 �150° + 0.91 �–150° + j 2.73
= – 3.94 + j 4.1
|Ib| = 5.69 pu
Ic = 3.64 �30° + 0.91 �– 30° + j 2.73
= 3.94 + j 4.1� |Ic| = 5.69 pu

60 Modern Power System Analysis
Fig. S-11.2 (b)
11.3 (i) LG fault If = Ia = 3
0 2 0 2 0 08j ( . . . )� � = – j 6.25 pu
(ii) LL fault If = Ib = – Ic = � �j
j
3 1
0 4. = – 4.33 pu
(iii) LLG fault (Ref. Fig.S-11.2 b)
Ia1 =1
0 2 0 211 0 08j j j. ( . . )� = – j 3.89
Ia2 = j 3.89 � 0.08/0.28 = j 1.11Ia0 = j 3.89 � 0.2/0.28 = j 2.78Ib = 3.89 �150° + 1.11 �– 150° + j 2.78
= – 4.33 + j 4.17� |Ib| = 6.01 pu,
Ic = 3.89 �30° + 1.11 �– 30° + j 2.78
= 4.33 + j 4.17
(iv) 3 phase fault If = 1/j 0.2 = – j 5 puIn order of decreasing magnitude of line currents the faults can be listed:(a) LG (b) LLG (c) 3 phase (d) LL
11.4 Let the neutral grounding resistance be Xn.
Ia = 30 2 0 2 0 08 3j Xn( . . . )� � �
= – j 5
� Xn = 0.04 puBase Z = 121/25 = 4.84 �
� Xn = 4.84 � 0.04 = 0.1936 �If grounding resistance is used (Rn)
|Ia| =3
0 48 3j Rn. � = 5 or
9
9 0 232Rn � . = 25
� Rn = 0.12 pu = 0.12 � 4.84 = 0.581 �With Xn = 0.04 included in generator neutral to ground:
Z0 = j 0.08 + j 0.12 = j 0.2

Solutions 61
LL fault
If = Ib = – Ic = � �j
j
3 1
0 4. = – 4.33 pu
LLG fault Ia1 =1
0 2 0 2 0 2j j j. ( . | | . )� = – j 3.334
Ia2 = + j 1.667 = Ia0
Ib = 3.334 �150° + 1.667 �– 150° + j 1.667= – 4.33 + j 2.5
|Ib| = 5 pu If = 3Ia0 = j 5 pu
11.5
Fig. S-11.5 (a)
Base 25 MVA, 11 kV
Feeder reactances: Pos. sequence j 0 4 25
121
. � = j 0.083 pu
Neg. sequence = j 0.083 puZero sequence = j 0.166 pu
Grounding resistance =1 25
121
� = 0.207 pu, 3Rn = 0.621
Positive sequence network
Fig. S-11.5 (b)

62 Modern Power System Analysis
LG fault at feeder end
(a) I f = Ia = 3
0 621 0 587. .� j or |I f | = 3.51 pu
(b) Ia1 = Ia2 = Ia0 = 1
0 621 0 587. .� j = 1.17 �– 43.4°
Va1 = 1 – j 0.183 � 1.17 �– 43.4° = 0.872 �– 10.3°Va2 = – j 0.158 � 1.17 �– 43.4° = – 0.184 �46.6°Va0 = – 0.668 �21.6° � 1.17 �– 43.4° = – 0.782 �– 21.8°Vb = 0.872 �– 130.3° – 0.184 �166.6° – 0.782 �– 21.8°
= 1.19 �– 159.5°Vc = 0.872 �109.7° – 0.184 �– 73.4° – 0.782 �– 21.8°
= 1.68 �129.8°
(e) Voltage of star point w.r.t. ground = 3Ia0 � 0.207
= 3 � 1.17 � 0.207= 0.726 pu
11.6 Since the star point is isolated from ground LLG fault is just like LL fault.
Ib = – Ic = � �
�
j
j j
3 1
0 35 0 25. . = – 2.887 pu
11.7
Fig. S-11. 7
VR1 =11
3 �0° kV = 6351 volts
Neutral solidly grounded (See Fig. S-11.2 b)
IR1 =6 351
1 0 0 4,
( .8|| . )j j j� = – j 5,013 A
IR2 = j 5,013 � 0 41 2..
= j 1,671

Solutions 63
IR0 = j 5,013 � 0 8
1 2
.
. = j 3,342
IY = �2 IR1 + � IR2 + IR0
= 5013 �150° + 1671 �– 150°+ j 3,342 = – 5.79 + j 5.01 kA
IB = � IR1 + �2 IR2 + IR0 = 5013 �30°+ 1671 �– 30° + j 3,342
= 5.79 + j 5.01 kAIG = IY + IB = j 10.02 kA; IR = 0
(b) This is equivalent to LL case
IB = – IY = ( , )/ .� �j j3 6 351 1 8 = – 6.111 kA
IG = 0 A.
11.8 Base: 10 MVA, 3.3 kV (gen and line), 0.6 kV (motors)
Motor MVA = 5
0 9. = 5.56 (Total). Let there be n motors.
� Rating of each motor = 5 56.
n MVA, 0.6 kV;
X� = X2 = 20%, X0 = 5%.
Rating of eqv. motor = 5.56 MVA, 0.6 kV, X� = X2 = 20 5 56
5 56nn
�..
= 20%
Motor reactance to base of 10 MVA
X0 = 5% Xn = 2.5% on eqv. motor rating
X� = X2 = 0.2 � 10
5 56. = 0.36 pu;
X0 = 0.05 � 10
5 56. = 0.09 pu
Xn = 0.025 � 10
5 56. = 0.045
Motor load: 4/10 = 0.4 pu (MW): 1 pu voltage, 0.8 lag pf
Prefault motor current = 0 4
0 9 0 8 1.
. .� � = 0.556 �– 36.9° pu
Generator reactance X� = X2 = 0.1 pu, X0 = 0.05 puTransformer reactance X = 0.1 � 10/7.5 = 0.133 pu

64 Modern Power System Analysis
Fig. S-11.8(a) Connection of sequence networks to simulate the fault (LG)
E�g = 1 + j 0.233 � 0.556 �– 36.9°= 1 + 0.13 �53.1° = 1.08 �5.5°
E�m = 1 – j 0.36 � 0.556 �– 36.9° = 0.89 �– 10.3°
Connection of sequence networks to simulate the fault (LG)It immediately follows from sequence network connection that
Ia1 = Ia2 = Ia0 = 1
0 1414 0 1414 0 225j ( . . . )� �
= – j 1.97I f = 3 � – j 1.97 = – j 5.91 pu
Iag1 = – j 1.97 � 0 36
0 593
.
. = – j 1.20
Iag2 = – j 1.2; Iag0 = 0
Positive sequence and negative sequence currents on star side are shiftedby + 90° and – 90° respectively from delta side.
� Iag1 = 1.20 Iag2 = – 1.2, Iag0 = 0
Iam1 = – j 1.97 � 0 2330 593..
= – j 0.77

Solutions 65
Fig. S-11.8 (b)
Iam2 = – j 0.77; Iam0 = – j 1.97
Iam = – j 3.51 pu
Ibm = (�2 + �) (– j 0.77) – j 1.97 = – j 1.20 pu
Icm = (� + �2) (– j 0.77) – j 1.97 = – j 1.20 pu
Iag = 0 pu
Ibg = (�2 – �) � 1.2 = – j 2.08 pu
Icg = (� – �2) � 1.2 = j 2.08 pu
11.9 Equivalent seq. reactances are
X1 = j 0.105 puX2 = j 0.105 pu
X0 = j 0 05 0 45
0 5
. .
.
� = j 0.045 pu
Ia1 =1
0 105 0 105 0 045j j j. ( . || . )�
= – j 7.33

66 Modern Power System Analysis
Ia2 = j 7.33 � 0 045
0 15
.
. = j 2.20
Ia0 = j 5.13
I1a1 = – j 7.33 �
0 35
0 5
.
. = – j 5.131
I1a2 = j 2.2 �
0 35
0 5
.
. = j 1.54; I1
a0 = 0
In the generatorI1a1 = j (– j 5.131) = 5.131; I1
a2 = – j ( j 1.54) = 1.54I1
c1 = � I1a1 = – 2.566 + j 4.443;
I1c2 = �
2 I1a2 = – 0.77 – j 1.333
� I1c = I1
c1 + I1c2 = – 3.336 + j 3.11
� |I1c| = 4.56 pu; Base current =
1200 1000
3 600
�
� = 1,155 A
� |I1c| = 4.56 � 1,155 = 5,266 A
Fig. S-11.9

Solutions 67
11.10
Fig. S-11.10 (a)
Equivalent Sequence reactances are
X1 =0 65 0 4
1 05
. .
.
� = 0.248;
X2 =0 55 0 3
0 85. .
.�
= 0.194; X0 = j 0.55
Ia1 =1
0 248 0 194 0 55j j j. ( . || . )� = – j 2.55
Ia2 = j 2.55 � 0 55
0 744.
.
= j 1.885
Fig. S-11.10 (b)

68 Modern Power System Analysis
Ia0 = j 0.665Ib = 2.55 �150° + 1.885 �– 150° + j 0.665
= – 3.84 + j 1.0Ic = 2.55 �30° + 1.885 �– 30° + j 0.665
= 3.84 + j 1.0If = Ib + Ic = j 2.0 pu
11.11
Fig. S-11.11
Equivalent sequence reactances are:
X1 = 0.1638X2 = 0.1638X0 = 0.118
Ia1 = Ia2 = Ia0 = 1
0 4456j .
= – j 2.244� I f = 3Ia1 = – j 6.732
Sequence currents through transformer A

Solutions 69
Ia1 (A) = Ia2 (A) = – j 2.244 � 0 5
0 744
.
. = – j 1.508
Ia0 (A) = – j 2.244 � 0 55
0 7
.
. = – j 1.763
Ia (A) = – j 1.508 – j 1.508 – j 1.763 = – j 4.779 puIb (A) = 1.508 �150° + 1.508 �30° – j 1.763 = – j 0.225 puIc (A) = 1.508 �30° + 1.508 �150° – j 1.763 = – j 0.255 pu
11.12.
Fig. S.11.12 a
Fig. S.11.12 b
3 phase short at bus 2 (F):
10 62
1.
�X
= 4
X = 0.42 pu

70 Modern Power System Analysis
LG fault at bus 1:Equivalent sequence reactance are:
X1 =0 2 0 84
1 04
. .
.
� = 0.1615
X2 =0 15 0 84
0
. .
.99
� = 0.1273
X0 =0 05 0 12
0 17
. .
.
� = 0.0353
If = 3 Ia1 = 3 10 3241�
j . = – j 9.256 pu
11.13
Fig. S-11.13 (a)
ZBUS1 = ZBUS2 = j jj j X0 1 0 10 1 0 2 1
. .
. ( . )�
���
���
Fig. S-11.13 (b)
ZBUS0 =j 0 069 0
0
.
�
��
�
��
The fault current with LG fault on bus 1 is
I1f =
3 10 1 0 1 0 069
�
� �j j j. . . = – j 11.152 pu
From Fig. S-11.13 c, it is clear that all Ia1 and Ia2 flow towards bus 1from the generator only. The component of Ia0 flowing towards bus 1 fromgenerator is

Solutions 71
���
�
�
j j
j j
111523
0 220 11 0 22
. .. .
= – j 3.717 � 2/3 = – j 2.478 pu
and the component of Ia0 flowing towards bus 1 from transformer is
– j 3.717 � j
j j
0 11
0 11 0 22
.
. .� = – j 1.239 pu
Fig. S-11.13 (c)
11.14 Equivalent Seq. reactances are:
X1 =0 4445 0 3105
0 755. .
.�
= j 0.1828
X2 = j 0.1828
Ia1 = – Ia2 = 1
0 3656j . – j 2.735
Ib = – Ic = � �j
j
3 1
0 3656. = – 4.737 pu
|If | = 4.737 puVa2 = – Ia2 z2 = – j 2.735 � j 0.1828
= 0.5 pu
� Va1 = 0.5 pu and Va0 = 0 (� Ia0 = 0)

72 Modern Power System Analysis
� Voltage of healthy phase
Va = Va1 + Va2 + Va0 = 1 pu
Fig. S-11.14
11.15 From Example 9.6, we have
Z1BUS = Z2BUS = j
0 0903 0 0597 0 0719 0 0780
0 0597 0 0903 0 0780 0 0719
0 0719 0 0780 0 1356 0 0743
0 0780 0 0719 0 0743 0 1356
. . . .
. . . .
. . . .
. . . .
�
�
����
�
�
����
From the data given, zero sequence reactance diagram is drawn below.
Fig. S-11.15

Solutions 73
Y0BUS =
�
�
�
�
�
�
����
�
�
����
j j j j
j j j j
j j j j
j j j j
22 2 2 667 4
2 22 4 2 667
2 667 4 6 667 0
4 2 667 0 6 667
.
.
. .
. .
Z0BUS = j
0 0585 0 0164 0 0332 0 0417
0 0164 0 0585 0 0417 0 0332
0 0332 0 0417 0 1883 0 0366
0 0417 0 0332 0 0366 0 1883
. . . .
. . . .
. . . .
. . . .
�
�
����
�
�
����
From Eq. (11.47)
I2f =
3 1
0 0903 0 0903 0 0585
�
� �j j j. . . = – j 12.547 pu
I f1–2 = If
2–2 = I f0–2 = – j 4.182
From Eq. (11.49)V f
1–1 = V01–1 – Z1 – 12 If
1–2
= 1 – j 0.0597 � – j 4.182 = 0.7503V f
1–2 = V01–2 – Z1–22 I f
1–2
= 1 – j 0.0903 � – j 4.182 = 0.6224V f
2–1 = V02–1 – Z2–12 I f
2–2
= 0 – j 0.0597 � – j 4.182 = – 0.2497V f
2-2 = V 02–2 – Z2–22 I f
2–2
= 0 – j 0.0903 � – j 4.182 = – 0.3776V f
0–1 = V 00–1 – Z0–12 I f
0–2
= 0 – j 0.0164 � – j 4.182 = – 0.0686V f
0–2 = V 00–2 – Z0–22 I f
0–2
= 0 – j 0.0585 � – j 4.182 = – 0.2446V f
1 (a) = 0.7503 – 0.2497 – 0.0686 = 0.432V f
2 (a) = 0.6224 – 0.3776 – 0.2446 = 0(LG fault is on bus 2 phase a)
I f12 (a) = 0.864
V1f (b) = 0.7503 �– 120° – 0.2497 �120° – 0.0686
= – 0.3189 – j 0.866 V2
f (b) = 0.6224 �– 120° – 0.3776 �102° – 0.2446= – 0.367 – j 0.866
I f12 (b) =
V b V b
j
f f1 2
0 5
( ) ( )
.
�
=0 0481
0 5.
.j = – j 0.0962 pu
Similarly other voltages and currents can be calculated.

74 Modern Power System Analysis
��������
12.1 Moment of inertia of rotor = 10,000 kg –m2
Rotor speed = 3,000 rpm = 3 000 2
60
, � � = 100 � rad/sec
GH =12
I�2; 100
0 85. � H
=1
2 � 104 � 104 � �2 � 10–6
� H =100 0 85
100 2
2� �
�
� . = 4.19 MJ/MVA
M = GH/180f = 4 19 100
180 50 0 85
.
.
�
� � = 0.0547 MJ-sec/elec. deg
12.2 m/c 1 : � = 1,500 rpm = 50 � rad/sec
600 8.
� H1 =1
2 � 3 � 104 � 2,500 � �2 � 10–6
� H1 = 4.93 MJ/MVAm/c 2: � = 3,000 rpm = 100 � rad/sec.
800 85.
� H2 =1
2 � 104 � 104 × �2 × 10⁻⁶
� H2 = 5.24 MJ/MVA
� Heq =4 93 60
0 8 200
5 24 80
0 85 200
.
.
.
.
�
��
�
� = 4.315 MJ/MVA
(Base: 200 MVA)
12.3 Heq = 4 � 7 80
100
� + 3 �
3 200
100
� = 40.4 MJ/MVA (Base: 100 MVA)
12.4 R = 0.11 � 500 = 55 �; X = 1.45 � 10–3 � 314 � 500 = 227.7 �
Z = 55 + j 227.7 = 234.2 �76.4°;Y = 314 � 0.009 � 10–6 � 500 �90° = 0.0014 �90°
A = 1 + 1
2 YZ = 1 +
1
2 � 0.0014 � 234.2 �166.4°
= 0.841 �2.6°
B = Z 11
6�
��
��YZ
= 234.2 �76.4° + 1
6 � 0.0014 � (234.2)2 �– 117.2°
= 221.7 �77.2°

Solutions 75
Pe,max =| | | |
| |
E V
B –
| | | || |
A V
B
2
cos (� – �)
=( )
.
. ( )
.
200
221 7
0 841 200
221 7
2 2
��
cos 74.6°
= 140.1 MWCapacitance neglected
A = 1�0, B = 234.2 �76.4°;
Pe, max =( )
.
200
234 2
2
(1 – cos 76.4°)
= 130.63 MWCapacitance and resistance neglected
A = 1�0° B = 227.7 �90°
Pe, max =( )
.
200
227 7
2
(1 – cos 90°] = 175.67 MW
12.5
Fig. S-12.5
Pe = 100 sin �
Max. load that can be suddenly switched on = Pes = 100 sin �1
By equal area criterion
0
1�
� (Pes – 100 sin �) d� =�
� �
1
1�
� (100 sin � – Pes) d�
Pes �1 + 100 cos ��
01 = – 100 cos �
�
� �
1
1� – Pes �
�
� �
1
1�
100 �1 sin �1 + 100 cos �1 – 100 = 200 cos �1 – 314 sin �1
+ 200 �1 sin �1
100
180
� � �1 sin �1 + 100 cos �1 – 314 sin �1 + 100 = 0

76 Modern Power System Analysis
It is a nonlinear eqn. which has to be solved numerically or graphically.
1.745 �1 sin �1 + 100 cos �1 – 314 sin �1 + 100 = 0
� �1 = 46.5° � Pes = 100 sin 46.5° = 72.54 MW
12.6
Fig. S-12.6
Pi0 = 0.3 = sin �1
� �1 = 17.5°Pi1 = 0.6; �2 = 36.9°
A1 = 0 6 2 11
2. ( ) sin� � � ��
�� � � d = 0.049
A2 = z sin . ( )� � � ��
�d
2
3 0 6 3 2� � �
A2 – A1 = sin . .� � � ��
�d
1
3 0 6 0 63 1� � �
��
�
1
3� sin � d� – 0.6 (�3 – �1) = 0
� cos �3 + 0.6 �3 = cos 17.5° + 0 6 17 5
180
. .� � �
cos �3 + 0.6 �3 = 0.954 + 0.183 = 1.137
By trial and error procedure, we find �3 = 58°Synchronism will not be lost.
�max = 180° – �2
= 180 – 36.9= 143.1º
A2, max =�
�
2
max
� sin � d� – 0.6 (�max–�2)
= – cos ��
�
2
max – 0.6 (�max – �2)

Solutions 77
= – cos 143.1° + cos 36.9° – 0.6 (143.1 – 36.9) � �
180= 0.487
� A2, max > A1
� System is stableExcursion about the new steady state rotor position
= �3 – �2 = 58 – 36.9 = 21.1°
12.7 PeI (prefault) =( )200
150
2
sin �
= 266.7 sin �
PeII (during fault) =( )200
400
2
sin �
= 100 sin �
PeIII (post fault) =( )200
200
2
sin �
= 200 sin �
Max. load transfer corresponds to A1 = A2
A1 =�
�
1
1 60� �
� (Pi – 100 sin �) d� = Pi � �
180 � 60° + 100
[cos (�1 + 60°) – cos �1]Now Pi = 266.7 sin �1
� A1 = (�/3) � 266.7 sin �1 + 100 cos (�1 + 60°) – 100 cos �1
= 279.3 sin �1 + 100 cos (�1 + 60°) – 100 cos �1
Now �2 = 180° – sin–1 (Pi /200) = 180° – sin–1 266 7
200 1.
sin ���
��
A2 =�
�
1
2
60�� (200 sin � – Pi) d�
= – 200 cos ��
�
1
2
60� – Pi (�2 – �1 – 60°) � �/180
= – 200 cos �2 + 200 cos (�1 + 60°)= 4.65 (�2 – �1 – 60°) sin �1
A1 = A2
279.3 sin �1 + 100 cos (�1 + 60°) – 100 cos �1 = – 200 cos �2 +200 cos (�1 + 60°) – 4.65 (�2 – �1 – 60°) sin �1
where �2 = 180° – sin–1 (1.334 sin �1)

78 Modern Power System Analysis
279.3 sin �1 – 100 cos (�1 + 60°) – 100 cos �1 + 200 cos �2 + 4.65
(�2 – �1 – 60°) � sin �1 = 0Solving �1 = 28.5°
� Pi(max) = 266.7 sin 28.5° = 127.3 MW
Fig. S-12.7
12.8 �1 = sin–1 250
500 = 30°
�2 = sin–1 250
350 = 45.6°
� �m = 180° – 45.6° = 134.4°
A1 =�
180 � (�c� – 30°) � 250
= 4.36 �c – 130.9
A2 =�
�
c
m
� (350 sin � – 250) d�
= 350 cos �c + 4.36 �c – 341.5For �c
4.36 �c – 130.9 = 350 cos �c + 4.36 �c – 341.5cos �c = 210.6/350 � �c = 53°
Swing eqn. upto critical clearing angle is
d
dt
2
2
� = 250/M or
d
dt
� =
250
Mt
� � =1
2
250
M t 2 + �1

Solutions 79
�c – �1 = (�/180) 23° = 125
M t 2
c
t2c (critical clearing time) =
23180 125
�
�
� M
� tc = 0 0032. M = 0.056 M sec
We need to know the inertia constant M to determine tc.
Fig. S-12.8
12.9
Fig. S-12.9
I. Prefault XI = 0.15 + 0.3 + 0.2 = 0.65
PeI =1 1 05
0 65� .
. sin � = 1.615 sin � ; Prefault power = 1
�0 = sin–1 1
1 615. = 38.3°
II. During fault PeII = 0
III. Post fault PeIII = Pe I = 1.615 sin �
Time to clear the fault = 0.1 sec; M = GH
f180 =
1 4
180 50
�
� = 4.44 � 10–4
sec2/elec degLet us choose �t = 0.025 sec.
( )�t
M
2
=( . )
.
0 025
4 44 10
2
4�
� = 1.41;
�m = � – sin–1 (1/1.615) = 141.7°

80 Modern Power System Analysis
t Pm Pe = Pm sin � Pa = 1 – Pe 1.41 Pa �� deg � degsec
0– 1.615 1.0 0 0 – 38.30+ 0 0 1.0 1.41 – 38.30av – – 0.5 0.705 0.705 38.30.025 0 0 1.0 1.41 2.115 39.0050.05 0 0 1.0 1.41 3.525 41.120.075 0 0 1.0 1.41 4.935 44.6451.0– 0 0 1.0 – – 49.581.0+ 1.615 1.23 – 0.23 49.581.0av 0.385 0.543 5.478 49.581.025 1.615 1.324 – 0.324 – 0.456 5.022 55.0581.05 1.615 1.4 – 0.4 – 0.564 4.458 60.081.075 1.615 1.46 – 0.46 – 0.649 3.809 64.5382.0 1.615 1.501 – 0.501 – 0.706 3.103 68.3472.025 1.615 1.531 – 0.531 – 0.750 2.353 71.452.05 1.615 1.551 – 0.551 – 0.777 1.576 73.8032.075 1.615 1.563 – 0.563 – 0.794 0.782 75.3793.0 1.615 1.568 – 0.568 – 0.8 – 0.018 76.1613.025 1.615 1.568 – 0.568 – 0.8 – 0.818 76.1433.05 1.615 1.562 – 0.562 – 0.792 – 1.61 75.3253.075 1.615 1.55 – 0.55 – 0.776 – 2.386 73.71
After fault clearance � goes through a maximum and then begins to reduce, thesystem is stable.12.10 From Eq. (12.67)
cos �c =�
180141 7 38 3 1 615 141 7( . . ) . cos .� �
���
�
1.615 = 0.333
� �c = 70.54°
For sustained faultt Pm Pe = Pm sin � Pa = 1 – Pe 1.41 Pa �� � deg
sec pu pu pu
0– 1.615 1.0 0 0 – 38.30+ 0 0 1.0 1.41 – 38.30av – – 0.5 0.705 0.705 38.30.025 0 0 1 1.41 2.115 39.0050.05 0 0 1 1.41 3.525 41.1200.075 0 0 1 1.41 4.935 44.6451.0 0 0 1 1.41 6.345 49.581.025 0 0 1 1.41 7.755 55.9251.05 0 0 1 1.41 9.165 63.681.075 0 0 1 1.41 10.575 72.8451.1 83.42

Solutions 81
Fig. S-12.10 Swing curve for Prob 12.10 for sustained fault
12.11
Fig. S-12.11 (a)
PeI (prefault) =115 1
0
.
.5
� sin� = 2.3 sin �
PeII (during fault) =115 1
3
. � sin� = 0.383 sin �
PeII =115 1
6
. � sin� = 0.192 sin �
Fig. s-12.11 (b)
PeIII (B opens) =115
0 6
.
. sin � = 1.92 sin �

82 Modern Power System Analysis
Pi = 2.3 sin 30° = 1.15,
�m = 180° – sin–1 115
1 92
.
. = 143.2°
For the system to be stable �1 < �m and A1 + A2 + A3 = A4
A1 =30
60
�
�
� (Pi – 0.383 sin �) d� = 1.15 �
180 � 30°
+ 0.383 (cos 60° – cos 30°) = 0.462
A2 =60
75
�
�
� (– 0.192 sin � + Pi) d� = 0.25
A3 =75
90
�
�
� (Pi – 0.383 sin �) d� = 0.202
A4 =90
1
��
�
(1.92 sin � – Pi) d� = – 1.92 cos �1
– 0.02 �1 + 1.806A1 + A2 + A3 = A4
0.462 + 0.202 + 0.250 = – 1.92 cos �1 – 0.02 �1 + 1.8061.92 cos �1 + 0.02 �1 – 0.892 = 0
By solving this equation, we can not obtain�1 < �m hence the system is Unstable. Alternatively, if the axes areplotted on a graph paper, it can be immediately seen that
A1 + A2 + A3 > A4
hence the system is unstable.12.12
Fig. S-12.12
M =GH
f180 =
1 2 5180 50
�
�
. = 2.78 � 10–4 sec2/elect deg.
I =0 8
0 8 1.
. � = 1 �– 36.9° = 0.8 – j 0.6
E = 1 + j 0.45 (0.8 – j 0.6) = 1.32 �15.83°
I Prefault PeI = 1 32 1
0 45.
.�
sin � = 2.93 sin � � �0 � = sin–1 0 8
2 93.
. = 15.83°
II During fault PeII = 0 Choose �t = 0.05 sec
III Post fault PeIII = PeI;( )�t
M
2
= ( . )
.
0 05
2 78 10
2
4�
� = 9.00

Solutions 83
t Pm Pe = Pm sin � Pa = 0.8 – Pe 9 Pa �� day � degsec
0– 2.93 0.8 0 0 0 15.83°0+ 0 0 0.8 7.2 15.83°0av 3.6 3.6 15.83°0.05 0 0 0.8 7.2 10.8 19.430.10 0 0 0.8 7.2 18.0 30.230.15– 0 0 0.8 7.2 48.230.15+ 2.93 2.216 – 1.416 – 12.744 48.230.15av – 0.308 – 2.772 15.228 48.230.2 2.93 2.651 – 1.851 – 16.659 – 1.431 63.4580.25 2.93 63.362
62.027
Torque angle � = 62.0270 at 250 milisecs.12.13 50 Hz, 500 MVA, |E| = 450 kV, |V| = 400 kV, �t = 0.05 sec, t1 = 0.15
sec, H = 2.5 MJ/MVA, Load = 460 MW, XI = 0.5 pu, XII = 1.0 pu, XIII= 0.75 pu; M = (1 � 2.5)/(180 � 50) = 2.778 � 10–4 sec2/elect. deg.
Base MVA = 500Base kV = 400
G = 1pu
PeI = 1 1125
0 5� .
. sin � = 2.25 sin �;
Prefault power transfer = 460
500 = 0.92 pu
2.25 sin �0 = 0.92 � �0 = 24.14°
During fault: PeII =1 1125
1
� . sin � = 1.125 sin �
Post fault PeIII =1 1125
0 75� .
. sin � = 1.5 sin �;
( )�t
M
2
=( . )
.
0 05
2 778 10
2
4�
� = 9
t Pm Pe = Pm sin � Pa = 0.92 – Pe 9Pa �� � degsec deg
0– 2.25 0.92 0 0 0 24.140+ 1.125 0.46 0.46 4.14 24.140av 2.07 2.07 24.140.05 1.125 0.496 0.424 3.816 5.886 26.210.1 1.125 0.597 0.323 2.907 8.793 32.10.15– 1.125 0.737 0.183 1.647 40.9
(Contd.)

84 Modern Power System Analysis
t Pm Pe = Pm sin � Pa = 0.92 – Pe 9Pa �� � degsec deg
0.15+ 1.5 0.982 – 0.062 – 0.56 40.90.15av 1.5 0.543 9.336 40.90.2 1.5 1.15 – 0.23 – 2.07 7.27 50.240.25 1.5 1.265 – 0.345 – 3.105 4.16 57.500.3 1.5 1.32 – 0.4 – 3.6 0.56 61.660.35 1.5 1.327 – 0.407 – 3.663 – 3.1 62.220.4 1.5 1.287 – 0.357 – 3.213 – 6.313 59.120.45 1.5 1.194 – 0.274 – 2.466 – 8.779 52.810.5 1.5 44.04
System is STABLE
12.14 From Example 12.8I Prefault PeI = 2 sin � � �0 = sin–1 1/2 = 30°
II During fault PeII = 0.5 sin �III Post fault (after opening of circuit breakers)
PeIII = 1.5 sin �; M = 1 3 5
180 50�
�
. = 3.89 � 10–4 sec2/elec deg
Time to circuit breaker opening (3 cycles) = 3
50 = 0.06 sec
Time to circuit breaker opening (8 cycles) = 8
50 = 0.16 sec
�t = 0.05 sec; (�t)2/M = (0.05)2/ (3.89 � 10–4) = 6.426
Fault clears at 3 cycles
t Pm Pe = Pm sin � Pa = 1 – Pe 6.426 Pa �� �deg
0– 2.0 1.0 0.0 30.00+ 0.5 0.25 0.75 30.00av 0.375 2.41 2.41 30.00.05 0.5 0.268 0.732 4.70 7.11 32.410.10 1.5 0.954 0.046 0.296 7.406 39.5200.15 1.5 1.095 – 0.095 – 0.61 6.796 46.9260.20 1.5 1.209 – 0.209 – 1.343 5.453 53.7220.25 1.5 1.288 – 0.288 – 1.850 3.603 59.1750.30 1.5 1.333 – 0.333 – 2.139 1.464 62.7780.35 1.5 1.350 – 0.350 – 2.249 – 0.785 64.2420.40 1.5 1.341 – 0.341 – 2.191 – 2.976 63.4510.45 1.5 1.305 – 0.305 – 1.959 – 4.935 60.4810.50 1.5 1.236 – 0.236 – 1.516 – 6.451 55.5460.55 1.5 1.133 – 0.133 – 0.854 – 7.305 49.0950.60 1.5 1.0 0 0 – 7.305 41.79
34.485

Solutions 85
� System is STABLE.
Fault clears at 8 cyclestsec Pm Pe = Pm sin � 1 – Pe 6.426 Pa �� � deg
0– 2 1 0 300+ 0.5 0.25 0.750av 0.375 2.41 2.41 300.05 0.5 0.268 0.732 4.7 7.11 32.410.10 0.5 0.318 0.682 4.383 11.493 39.520.15 0.5 0.389 0.611 3.926 15.419 51.013�
0.2 1.5 1.374 – 0.374 – 2.403 13.016 66.4320.25 1.5 1.474 – 0.474 – 3.045 9.971 79.4480.30 1.5 1.5 – 0.5 – 3.213 6.758 89.410.35 1.5 1.491 – 0.491 – 3.155 3.603 96.1770.4 1.5 1.478 – 0.478 – 3.072 0.531 99.780.45 1.5 1.475 – 0.475 – 3.052 – 2.521 100.3110.5 1.5 1.486 – 0.486 – 3.123 – 5.644 97.790.55 1.5 1.5 – 0.5 – 3.623 – 9.267 92.1460.6 1.5 1.488 – 0.488 – 3.136 – 12.403 82.8790.65 70.476
� System is STABLE.
SUSTAINED FAULT0– 2.0 1.0 0.0 30.00+ 0.5 0.25 0.750av 0.3750 2.41 2.41 30.00.05 0.5 0.268 0.732 4.7 7.11 32.410.1 0.5 0.318 0.682 4.383 11.493 39.520.15 0.5 0.389 0.611 3.926 15.419 51.0130.2 0.5 0.458 0.542 3.482 18.901 66.4320.25 0.5 0.498 0.502 3.226 22.127 85.3330.3 0.5 0.477 0.523 3.361 25.488 107.460.35 0.5 0.37 0.63 4.05 29.538 132.9480.4 0.5 0.15 0.85 5.462 35.0 162.4860.45 0.5 – 0.1502 1.1502 7.391 42.391 197.4860.5 0.5 239.877

86 Modern Power System Analysis
12.15
Fig. S-12.15 (a) Connection of sequence networkswith both faulted lines switched off
Fig. S-12.15 (b) Connection of sequence networks for LIG fault as P
Transfer reactances are:
X12 (2 LG fault) = 0.4 + 0.4 + 0 4 0 4
0 0574
. .
.
� = 3.59
X12 (both faulted lines open) = 0.8 + 0.65 + 1.2 = 2.65
X12 (line healthy) = 0.8
Prefault PeI =1 2 1
0 8
.
.
� sin � = 1.5 sin �

Solutions 87
� �0 = sin–1 1
1 5. = 41.8°
During fault PeII =1 2 1
3
.
.59
� sin � = 0.334 sin �
During three-pole switching PeIII = 0
During single pole switching
PeIII =1 2 1
2 65
.
.
� sin � = 0.453 sin �
Post fault PeIV = PeI = 1.5 sin �
Swing curve calculations:
H = 4.167 MJ/MVA,
M =4 167
180 50�
� = 4.63 � 10–4 sec2/elect. deg
Taking �t = 0.05 sec
( )�t
M
2
= (0.05)2/(4.65 � 10–4) = 5.4
Time when single/three pole switching occurs = 0.075 sec(during middle of �t)
Time when reclosing occurs = 0.325 (during middle of �t).(i) Swing curve calculations—three-pole switching
t Pm Pe Pa = 1 – Pe 5.4Pa �� �degsec.
0– 1.500 1.0 0 0 41.80+ 0.334 0.223 0.777 4.198 41.80av 2.099 2.1 41.80.05 0.334 0.232 0.768 4.147 6.25 43.9�
0.10 0 0 1.0 5.4 11.65 50.150.15 0 0 1.0 5.4 17.05 61.800.20 0 0 1.0 5.4 22.45 78.850.25 0 0 1.0 5.4 27.85 101.300.30 0 0 1.0 5.4 33.25 129.15�
0.35 1.5 0.454 0.546 2.951 36.201 162.40.4 1.5 – 0.478 1.478 7.981 44.18 198.600.45 1.5 – 1.333 2.333 12.598 56.778 242.780.5 299.56
The system is OBVIOUSLY UNSTABLE

88 Modern Power System Analysis
(ii) Swing curve calculations—single-pole switching
0– 1.5 1.0 0 0 41.80+ 0.334 0.223 0.777 4.198 41.80av 2.099 2.1 41.80.05 0.334 0.232 0.768 4.147 6.25 43.9�
0.10 0.453 0.348 0.652 3.522 9.776 50.150.15 0.453 0.392 0.608 3.283 13.05 59.920.20 0.453 0.433 0.567 3.061 16.11 72.970.25 0.453 0.453 0.547 2.954 19.06 89.080.30 0.453 0.430 0.57 3.08 22.14 108.14�
0.35 1.50 1.144 – 0.144 – 0.8 21.34 130.280.4 1.50 0.713 0.287 1.550 22.89 151.620.45 1.50 0.1435 0.856 4.622 27.51 174.510.5 1.50 – 0.562 1.562 8.43 35.94 202.020.55 1.50 – 1.271 2.271 12.26 48.20 237.96
286.16
The System is UNSTABLE
Note: In this problem in case of LLG fault in spite of single pole switching thesystem is found to be UNSTABLE.


![MPSA Teks 1 V1 2020 pptx [Auto-saved]](https://static.fdocuments.us/doc/165x107/61574107dd9cc97b1415390a/mpsa-teks-1-v1-2020-pptx-auto-saved.jpg)