MPROVING ADC RESOLUTION BY OVERSAMPLING AND … · noise ratio for “white” noise. ... the...
21
Rev. 1.3 7/13 Copyright © 2013 by Silicon Laboratories AN118 AN118 I MPROVING ADC R ESOLUTION BY O VERSAMPLING AND A VERAGING 1. Introduction Many applications require measurements using an analog-to-digital converter (ADC). Such applications will have resolution requirements based in the signal’s dynamic range, the smallest change in a parameter that must be measured, and the signal-to-noise ratio (SNR). For this reason, many systems employ a higher resolution off-chip ADC. However, there are techniques that can be used to achieve higher resolution measurements and SNR. This application note describes utilizing oversampling and averaging to increase the resolution and SNR of analog-to-digital conversions. Oversampling and averaging can increase the resolution of a measurement without resorting to the cost and complexity of using expensive off-chip ADCs. This application note discusses how to increase the resolution of analog-to-digital (ADC) measure- ments by oversampling and averaging. Addition- ally, more in-depth analysis of ADC noise, types of ADC noise optimal for oversampling techniques, and example code utilizing oversampling and aver- aging is provided in appendices A, B, and C respectively at the end of this document. 2. Key Points Oversampling and averaging can be used to increase measurement resolution, eliminating the need to resort to expensive, off-chip ADCs. Oversampling and averaging will improve the SNR and measurement resolution at the cost of increased CPU utilization and reduced throughput. Oversampling and averaging will improve signal-to- noise ratio for “white” noise. 2.1. Sources of Data Converter Noise Noise in ADC conversions can be introduced from many sources. Examples include: thermal noise, shot noise, variations in voltage supply, variation in the reference voltage, phase noise due to sampling clock jitter, and noise due to quantization error. The noise caused by quantization error is commonly referred to as quantization noise. Noise power from these sources can vary. Many techniques that may be utilized to reduce noise, such as thoughtful board layout and bypass capacitance on the refer- ence voltage signal trace. However, ADCs will always have quantization noise, thus the best SNR of a data converter of a given number of bits is defined by the quantization noise with no oversam- pling. Under the correct conditions, oversampling and averaging will reduce noise and improve the n-bit ADC x(t) Input Signal Sample Frequency (fs) e[n] (Noise) x[n] x[n]+e[n] OSR Low-Pass Filter Downsample Oversample and Average (Software Accumulate and Dump) (n+w) bit Output Data Figure 1. Oversampling and Averaging to Increase Measurement Resolution By “w” Bits
-
Upload
duongduong -
Category
Documents
-
view
219 -
download
0
Transcript of MPROVING ADC RESOLUTION BY OVERSAMPLING AND … · noise ratio for “white” noise. ... the...

Rev. 1.3 7/13 Copyright © 2013 by Silicon Laboratories AN118
AN118
IMPROVING ADC RESOLUTION BY OVERSAMPLING AND AVERAGING
1. Introduction
Many applications require measurements using ananalog-to-digital converter (ADC). Suchapplications will have resolution requirementsbased in the signal’s dynamic range, the smallestchange in a parameter that must be measured, andthe signal-to-noise ratio (SNR). For this reason,many systems employ a higher resolution off-chipADC. However, there are techniques that can beused to achieve higher resolution measurementsand SNR. This application note describes utilizingoversampling and averaging to increase theresolution and SNR of analog-to-digitalconversions. Oversampling and averaging canincrease the resolution of a measurement withoutresorting to the cost and complexity of usingexpensive off-chip ADCs.
This application note discusses how to increase theresolution of analog-to-digital (ADC) measure-ments by oversampling and averaging. Addition-ally, more in-depth analysis of ADC noise, types ofADC noise optimal for oversampling techniques,and example code utilizing oversampling and aver-aging is provided in appendices A, B, and Crespectively at the end of this document.
2. Key Points
Oversampling and averaging can be used to increase measurement resolution, eliminating the need to resort to expensive, off-chip ADCs.
Oversampling and averaging will improve the SNR and measurement resolution at the cost of increased CPU utilization and reduced throughput.
Oversampling and averaging will improve signal-to-noise ratio for “white” noise.
2.1. Sources of Data Converter Noise
Noise in ADC conversions can be introduced frommany sources. Examples include: thermal noise,shot noise, variations in voltage supply, variation inthe reference voltage, phase noise due to samplingclock jitter, and noise due to quantization error. Thenoise caused by quantization error is commonlyreferred to as quantization noise. Noise power fromthese sources can vary. Many techniques that maybe utilized to reduce noise, such as thoughtfulboard layout and bypass capacitance on the refer-ence voltage signal trace. However, ADCs willalways have quantization noise, thus the best SNRof a data converter of a given number of bits isdefined by the quantization noise with no oversam-pling. Under the correct conditions, oversamplingand averaging will reduce noise and improve the
n-bitADC
x(t)
Input Signal
SampleFrequency (fs)
e[n] (Noise)
x[n] x[n]+e[n]OSR
Low-PassFilter
Downsample
Oversample and Average
(Software Accumulate and Dump)
(n+w) bitOutput Data
Figure 1. Oversampling and Averaging to Increase Measurement Resolution By “w” Bits

AN118
2 Rev. 1.3
SNR. This will effectively increase the number ofbits of a measurement’s resolution. Such a systemis shown in Figure 1 on page 1, and can be imple-mented with Silicon Lab’s on-chip ADC and a soft-ware routine that takes a set of samples andaverages (filters) them for the result.
Increasing the Resolution of an ADC MeasurementMany applications measure a large dynamic rangeof values, yet require fine resolution to measuresmall changes in a parameter. For example, anADC may measure a large temperature range, yetstill require the system to respond to changes ofless than one degree. Such a system could require ameasurement resolution of 16 bits. Rather thanresorting to an expensive, off-chip 16-bit ADC,oversampling and averaging using Silicon Lab’son-chip, 12-bit ADC can measure a parameter with16 bits of resolution.
Some applications will use an ADC to analyze asignal with higher frequency components. Such asystem will also benefit from oversampling andaveraging. The required sampling frequency inaccordance with the Nyquist Theorem is theNyquist Frequency:
Sampling frequencies (fs) above fn is oversam-pling, and will increase the resolution of a measure-ment. Please see Appendix A for a discussion ofhow this works.
Calculating the Oversampling Requirements To Increase ResolutionTo increase the effective number of bits (ENOB),the signal is oversampled, or sampled by the ADCat a rate that is higher than the system’s requiredsampling rate, fs. The required sampling rate maybe determined by how often a system requires aparameter be measured (output word rate), or itmay be the Nyquist frequency, fn.
For each additional bit of resolution, the signalmust be oversampled by a factor of four:
A derivation of Equation 2 is presented inAppendix A.
Assume a system is using a 12-bit ADC to output atemperature value once every second (1 Hz). Toincrease the resolution of the measurement to 16-bits, we calculate the oversampling frequency asfollows:
Thus, if we oversample the temperature sensor atfs=256 Hz, we will collect enough samples withinthe required sampling period to average them andcan now use 16-bits of the output data for a 16-bitmeasurement. To do so, we accumulate (add 256consecutive samples together), then divide the totalby 16 (or right shift the total by 4-bits). Such a pro-cess is commonly referred to as decimation. This
fn 2 fm=
where fm is the highest frequency compo-nent of interest in the input signal
Equation 1. Nyquist Frequency
fos 4w
fs=
where w is the number of additional bits ofresolution desired, fs is the original sam-pling frequency requirement, and fos is theoversampling frequency
Equation 2. Oversampling Frequency To Add Measurement Resolution
fos 44
1 Hz 256Hz= =

AN118
Rev. 1.3 3
results in 16-bits of useful data. Such an operationis referred to as accumulate and dump. Once wecalculate the result of 256 samples (in this exam-ple), we store or process the data and begin collect-ing data for the next output word.
Note: The memory location used to accumulate theoversampled data and perform the divide musthave enough bytes to prevent overflow and trunca-tion error.
An example of such oversampling and averaging isprovided in Appendix C. In this example, SiliconLab’s on-chip temperature sensor is sampled usingthe on-chip 12-bit ADC to make a 16-bit measure-ment. For a more formal discussion of how over-sampling affects noise and increases resolution,please see Appendix A.
Calculating the Oversampling Requirements To Increase SNRThe theoretical limit of the SNR of an ADC mea-surement is based on the quantization noise due tothe quantization error inherent in the analog-to-dig-ital conversion process when there is no oversam-pling and averaging. Because quantization errordepends on the number of bits of resolution of theADC (see Equation 5), the best case SNR is calcu-lated as a function of the Effective Number of Bitsof a data conversion as follows:
Note Equation 3 is valid for a full-scale input. Thatis, the dynamic range of the input signal mustmatch the reference voltage of the ADC. If not, theSNR will be lower than that calculated usingEquation 3.
If the ADC used to measure a parameter is 12-bitsand not oversampled, then the best SNR (calculatedusing Equation 3) is 74 dB. If we desire a betterSNR, then we could calculate the ENOB neededusing Equation 3 for a specified SNR. Once weknow the required ENOB, we can then useEquation 2 to calculate the oversampling require-ments.
For example, if the required SNR for an applicationis 90 dB, then we will need at least 16-bits of reso-lution. Using and 12-bit ADC and Equation 2, weknow we must oversample by a factor of 256.
When Oversampling and Averaging Will WorkThe effectiveness of oversampling and averagingdepends on the characteristics of the dominantnoise sources. The key requirement is that the noisecan be modeled as white noise. Please seeAppendix B for a discussion on the characteristicsof noise that will benefit from oversampling tech-niques. Key points to consider are [2] [3]:
• The noise must approximate white noise with uniform power spectral density over the fre-quency band of interest.
• The noise amplitude must be sufficient to cause the input signal to change randomly from sam-ple to sample by amounts comparable to at least the distance between two adjacent codes (i.e., 1 LSB - please see Equation 5 in Appendix A).
• The input signal can be represented as a ran-dom variable that has equal probability of exist-ing at any value between two adjacent ADC codes.
Note: Oversampling and averaging techniques willnot compensate for ADC integral non-linearity(INL).
Noise that is correlated or cannot be modeled aswhite noise (such as noise in systems with feed-back) will not benefit from oversampling tech-niques. Additionally, if the quantization noisepower is greater than that of natural white noise
SNR dB 6.02 ENOB 1.76+=
where ENOB is the effective number of bitsof the measurement
Equation 3. SNR Calculation as a Function of ENOB

AN118
Rev. 1.3 4
(e.g., thermal noise), then oversampling and aver-aging will not be effective. This is often the case inlower resolution ADCs. The majority of applica-tions using 12-bit ADCs can benefit from oversam-pling and averaging.
Please see Appendix B for a further discussion onthis topic.
ExampleAn example that utilizes oversampling and averag-ing is provided in this application note inAppendix C. This code uses Silicon Lab’s on-chip,100 ksps, 12-bit ADC to perform a 16-bit measure-ment of the on-chip temperature sensor, then out-puts this data via the hardware UART.
Using Equation 2, the oversampling ratio is 256.The provided code (in “AN018_SW.c”) adds 256consecutive ADC samples to the variable accumu-lator. After 256 samples have been added, it shiftsaccumulator right 4 bits and places the result in thevariable result. This gives 16-bits of useful data.After the result is calculated, accumulate is then“dumped” (cleared) for the next calculation. Theaccumulation of the ADC samples are performed inan ADC end-of-conversion interrupt service rou-tine (ADC_isr).
For more information concerning configuring andusing the on-chip temperature sensor, please seeapplication note “AN003 - Using the On-ChipTemperature Sensor.”
Resolution ImprovementWe oversample and average the temperature sensorto increase the measurement resolution from 12-bits to 16-bits. Let’s compare the improvement inthe temperature measurement.
The full-scale output of the on-chip temperaturesensor is slightly less than 1 volt. Assuming a refer-ence voltage (Vref) of 2.4 volts, we can calculatethe code width and temperature resolution (small-
est measurable change in temperature) for both 12-bit and 16-bit measurements.
12-bit Temperature Resolution
Without oversampling, we will get a 12-bit resultfrom the temperature measurement. The on-chiptemperature sensor voltage will change 2.8 mV foreach change in degrees Celsius. The voltage reso-lution for a 2.4 volt Vref and a PGA gain of 2 is(using Equation 5 in Appendix A):
Thus, the temperature resolution in a 12-bit mea-surement (the number a degrees C per ADC code)is:
So for each ADC code, the minimum temperaturechange we may measure is 0.104 degrees C orabove one-tenth of a degree. Perhaps we need bet-ter temperature resolution that will allow us to dis-play closer to one-hundredth of a degree. We canachieve this resolution by using the same 12-bitADC with oversampling and averaging.
2.4
212
2---------------- 293V/C= =
is the code width as defined inEquation 5 on page 7. The factor of 2 in thedenominator is to account for a PGA gainof 2.
res12293Vcode
------------------=C
2.8mV------------------ 0.1046 C cod=
Tres12 is the temperature resolution for a 12-bit measurement.

AN118
Rev. 1.3 5
16-Bit Temperature Resolution
Increasing the effective number of bits (ENOB) to16-bits through oversampling and averaging, a newresolution is calculated as follows:
Thus, the smallest temperature change we can mea-sure is:
We can now measure a 0.007 degree C change intemperature using the same, on-chip, 12-bit ADCwith oversampling and averaging. This now allowsus to measure temperature to an accuracy of betterthan one-hundredth of a degree.
Reduced Throughput
Throughput refers to the number of output datawords we obtain per unit time. If an ADC has amaximum sample rate of 100 ksps, we wouldobtain a 100 ksps output word rate without over-sampling and averaging. However, if we oversam-ple and average (decimate) to achieve higherresolution, throughput will be reduced by a factorof the oversampling ratio, OSR (see Equation 7).Oversampling by a factor of 256 as we do in theprovided example, our output word rate will be100 ksps/256 = 390 samples per second (390 Hz).Thus, there is a trade-off between resolution andthroughput for a given sampling rate. Anothertrade-off is the reduced CPU bandwidth duringeach sampling period (1/fs) due to the additional
sampling and computations required to achieve theadditional resolution.
SummaryIf ADC noise can be approximated as white noise,oversampling and averaging can be used toimprove the SNR and effective resolution of themeasurement. This can be done for static dc mea-surements and for input signals with higher fre-quency components. Equation 2 shows that eachadditional required bit of resolution can beachieved via oversampling by a factor of four, andeach additional bit will add approximately 6 db ofSNR (Equation 3) at the cost of reduced throughputand increased CPU bandwidth.
1.2
216
-------- 18.3V/C= =
es1618.3Vcode
-------------------=C
2.8mV------------------ 0.0065 C co=
Tres16 is the temperature resolution for a 16bit measurement.

AN118
6 Rev. 1.3
Appendix A - Theory of Noise and OversamplingThis section discusses how oversampling and aver-aging affects in-band noise, and how to calculatethe oversampling requirements to obtain a desiredSNR or measurement resolution.
How Oversampling and Averaging Improves PerformanceOversampling and averaging is done to accomplishtwo things: improve SNR and increase the effectiveresolution (i.e., increase the effective number ofbits of the ADC measurement). Both of these arereally the same entities. For example, if we have a12-bit ADC and want to generate codes with 16-bits of resolution, then we can use oversamplingand averaging to get the same SNR of a 16-bitADC. This will increase the effective number ofbits (ENOB) of the measured data, which is anothermeasure of SNR. Producing a lower noise floor inthe signal band, the oversampling and averagingfilter allows us to realize 16-bit output words.
How Oversampling Affects In-Band Noise
A sampling frequency fs will allow signals of inter-est to be reconstructed at one-half of the samplingfrequency (Nyquist Theorem). Thus, if the sam-pling rate is 100 kHz, then signals below 50 kHzcan be reconstructed and analyzed reliably. Alongwith the input signal, there will be a noise signal(present in all frequencies as white noise) that will
fold or alias into the measured frequency band ofinterest (frequencies less than one-half of fs)
Equation 4 shows that the Energy Spectral Density(ESD), or noise floor of the sampled noise willdecrease in the signal band as the sampling fre-quency is increased.[3]
The Relationship Between Oversampling and Increased Resolution
Given the fixed noise power due to quantizationnoise, we may calculate the amount of oversam-pling required to increase the effective resolution.For example, if we want to increase the effectivenumber of bits of a parameter measured with a 12-bit ADC to a 16-bit measurement, then we willwant to establish a relationship that allows us tocalculate the oversampling requirement. To do so,we first define the characteristics of the noise.
Noise Analysis
To understand the effects of oversampling andaveraging on noise, we must first define what thequantization noise will be.
The distance between adjacent ADC codes deter-mines the quantization error. Because the ADC will
E f erms2fs----- 1 2/=
Equation 4. Energy Spectral Density of In-Band Noise
where erms is the average noise power, fsis the sampling frequency, and E(f) is thein-band ESD.
AN118
Rev. 1.3 7
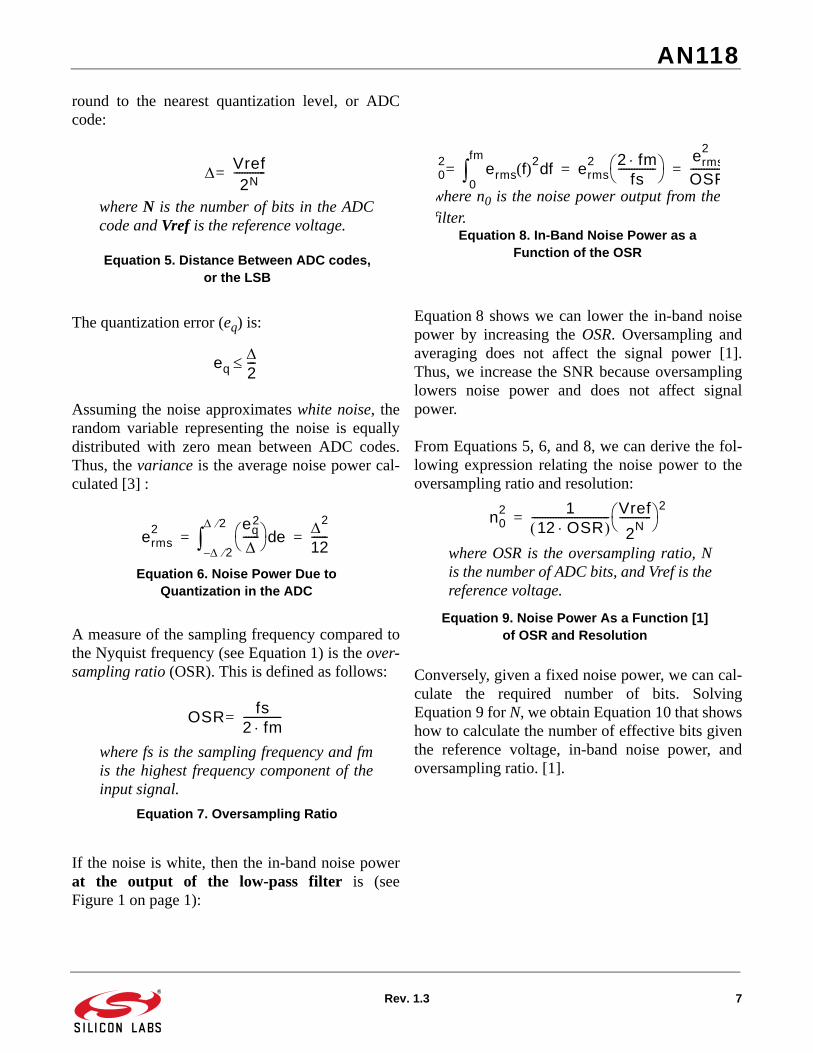
round to the nearest quantization level, or ADCcode:
The quantization error (eq) is:
Assuming the noise approximates white noise, therandom variable representing the noise is equallydistributed with zero mean between ADC codes.Thus, the variance is the average noise power cal-culated [3] :
A measure of the sampling frequency compared tothe Nyquist frequency (see Equation 1) is the over-sampling ratio (OSR). This is defined as follows:
If the noise is white, then the in-band noise powerat the output of the low-pass filter is (seeFigure 1 on page 1):
Equation 8 shows we can lower the in-band noisepower by increasing the OSR. Oversampling andaveraging does not affect the signal power [1].Thus, we increase the SNR because oversamplinglowers noise power and does not affect signalpower.
From Equations 5, 6, and 8, we can derive the fol-lowing expression relating the noise power to theoversampling ratio and resolution:
Conversely, given a fixed noise power, we can cal-culate the required number of bits. SolvingEquation 9 for N, we obtain Equation 10 that showshow to calculate the number of effective bits giventhe reference voltage, in-band noise power, andoversampling ratio. [1].
Vref2N
------------=
where N is the number of bits in the ADCcode and Vref is the reference voltage.
Equation 5. Distance Between ADC codes, or the LSB
eq2---
erms2 eq
2
------ ed
– 2
2
2
12------= =
Equation 6. Noise Power Due to Quantization in the ADC
OSRfs
2 fm--------------=
Equation 7. Oversampling Ratio
where fs is the sampling frequency and fmis the highest frequency component of theinput signal.
02
erms f( )2
fd0
fm
= erms2 2 fm
fs-------------- erms
2
OSR------------= =
Equation 8. In-Band Noise Power as a Function of the OSR
where n0 is the noise power output from thefilter.
n02 1
12 OSR ----------------------------- Vref
2N
------------ 2
=
Equation 9. Noise Power As a Function [1] of OSR and Resolution
where OSR is the oversampling ratio, Nis the number of ADC bits, and Vref is thereference voltage.

AN118
8 Rev. 1.3
From Equation 10, we observe:
Each doubling of the sampling frequency will lowerthe in-band noise by 3 dB, and increase the resolu-tion of the measurement by 1/2 bit. [3]
In a practical sense, we measure a signal band-lim-ited to less than 1/2*fs, then oversample that signalwith an oversampling ratio (OSR). The resultingsamples are then averaged (or decimated) for theresulting output data. For each additional bit of res-olution or 6dB of noise reduction, we oversampleby a factor of four:
Equation 11 is Equation 2 presented at the begin-ning of this application note. If we are using the 12-bit on-chip ADC and wish to have the accuracy of a16-bit ADC, we need an additional 4 bits of resolu-tion. Four factors of four (using Equation 11) is256. Thus, we need to oversample by a factor of256 times the Nyquist rate. If the desired signal isband-limited to 60 Hz (fm=60 Hz), then we mustoversample at 120 Hz * 256 = 30.7 kHz. Weimprove the effective resolution by improving theSNR in our frequency band of interest.
Increasing the sampling rate, or OSR, lowers thenoise floor in the signal band of interest (all fre-quencies less than 1/2 of fs). The frequency profilesof the quantization noise and input signal areshown in Figure 2. Note when oversamplingoccurs, less of the noise profile overlaps the inputsignal profile. Thus, a low-pass filter may be moreselective without affecting the input signal, and fil-ter more of the in-band noise. The noise power atthe output of the filter is calculated usingEquation 8. This is the noise level lowered due tothe oversampling and averaging filter. This isdepicted in Figure 3.
Equation 10. Number of Effective Bits As a Function of Reference Voltage, In-Band Noise Power, and Oversampling Ratio
N12--- OSR 2
12--- 12 2log–
12--- n0
2 2 Vref 2log+log–log–=
fos 4w
fs=
where w is the number of additional bits ofresolution desired, fs is the original sam-pling frequency requirement, and fos is theoversampling frequencyEquation 11. Oversampling Frequency To
Add Measurement Resolution

AN118
Rev. 1.3 9
f
Noise Power()
Input SignalFrequency ProfileWhen Sampled at
Nyquist Frequency (fn)
fnfnOSR
fn
fnOSR
Input SignalFrequency Profile
Oversampled (WithOversampling Ratio
OSR)
-fn/OSR-fn
Figure 2. Frequency Profiles of Input Signals Sampled at Nyquist Frequency, Oversampled Frequency, and the Quantization Noise Floor
f
Noise Power()
fnfnOSR
fnOSR
Input SignalFrequency Profile
Oversampled (WithOversampling Ratio
OSR)
-fn/OSR-fn
Frequency Profile ofan Ideal Low-Pass
Filter
Noise Outside Low-Pass filter is Removed
From Signal
Figure 3. Frequency Profile Of Oversampled Signal and an Ideal Low-Pass Filter Removing Noise

AN118
10 Rev. 1.3
The noise that is filtered between fm, and fm/OSR.Without oversampling, the filter would not haveremoved this noise. The output is also downsam-pled (decimated) by a factor of the OSR (seeFigure 1) to the original Nyquist frequency, fn. Thiswill give the input signal its frequency profile as ifsampled at the Nyquist frequency, and the noiseprofile a lower value (if filtered) of erms/OSR (seeFigure 4).
Calculating Signal To Noise RatioSignal-to-noise ratio is defined as the ratio of therms signal power to the rms noise power in deci-bels (dB). No matter how carefully we work toremove sources of ADC noise, quantization noisewill always be present. Thus, ideal SNR is calcu-lated based on quantization noise with no oversam-pling and averaging. Equation 5 shows that thehigher the resolution of the ADC, the lower thequantization error and therefore, the lower thequantization noise. The more bits in the ADC, thebetter the SNR can be. As shown in the previoussections, oversampling and averaging lowers thein-band noise, improving the SNR and increasing
the effective number of bits (ENOB). ENOB isanother measure of SNR, and both can be calcu-lated to determine specifications and oversamplingrequirements needed to meet these specifications.
In order to get the best case SNR, the dynamicrange of the input signal must match the referencevoltage (Vref). If we assume the best case input sig-nal to be a full-scale sine wave, then it’s rms valueas a function of Vref will be:
From the noise power calculation in Equation 9, wedetermine the rms noise power as a function of thenumber of bits, N (not oversampled) to be:
f
Noise Power BeforeOversample and Filter
(e)
Unaffected InputSignal FrequencyProfile Of Signal
Downsampled At theFilter Output
fn
fn
-fn
New Noise Floor After Filterand Downsample, Reduced
by a factor of 1/OSR (e/OSR)
Figure 4. Oversampled Signal After Filter and Downsampled to the Nyquist Frequency Showing Lowered Noise Floor
Vrms
Vref
2 2-----------=
Equation 12. Input Signal RMS Value as a Full-Scale Sine Wave
n0
Vref
2N
12------------------=
Equation 13. RMS Noise Power Value

AN118
Rev. 1.3 11
The SNR in dB is then calculated as follows:
When oversampling, we may substitute the effec-tive number of bits (ENOB) for N in Figure 14.Simplifying Equation 14 and substituting the termENOB for N we obtain the well known result indecibels:
Averaging To Increase the Effective Resolution of a dc MeasurementThus far, we have considered measuring signalswithin some frequency band of interest, fm. How-ever, our goal may be to measure a relatively staticdc signal (such as a temperature or strain gaugeoutput). If we wish to measure a signal that is rela-tively static, that is, the dominant frequency is neardc, we can still improve the effective resolution byoversampling and averaging [2].
Applications Measuring a Static Voltage
If a weigh scale must measure a wide range ofweights, yet still be able to discern small changes inweight, then oversampling and averaging canincrease the effective resolution of the measure-
ment. As another example, if the ADC must mea-sure the output of a temperature sensor, thetemperature range may be large, yet the systemapplication may have to respond to small changes.
Oversampling and Averaging as an Interpolative Filter
Averaging data from an ADC measurement isequivalent to a low-pass digital filter with subse-quent downsampling (see Figure 1 on page 1). Dig-ital signal processing that oversamples and low-pass filters a parameter is often referred to as inter-polation. In this sense, we use oversampling tointerpolate numbers between the 12-bit ADCcodes. The higher the number of samples averaged,the more selective the low-pass filter will be, andthe better the interpolation.
NR 20Vrms
n0------------ log 20
2N
12
2 2------------------
log= =
Equation 14. SNR as a Function of the Numberof Bits, N
SNR dB 6.02 ENOB 1.76+=
where ENOB is the effective number of bitsof the measurementEquation 15. SNR Calculation as a Function
of ENOB

AN118
12 Rev. 1.3
Appendix B - When Oversampling and Averaging Will WorkThis section discusses guidelines to determine ifoversampling and averaging will be effective for agiven application.
The analog-to-digital data conversion processintroduces noise. Oversampling and averaging canreduce certain types of noise, thereby increasingthe SNR and effective resolution of the data con-version. Not all applications will benefit from over-sampling and averaging. To understand whichADC measurements will benefit from oversam-pling, we must understand the type and characteris-tics of the noise present in a given system.
Noise Requirements For Effective OversamplingOversampling and averaging can improve the SNRand increase the effective resolution of the analog-to-digital data measurement. However, this willwork only if the ADC noise can be approximatedas white noise [2] [3]. If the input signal changesrandomly from sample to sample, by amounts(amplitude) comparable to the code size (1 LSB),and the input signal has equal probability of beinganywhere between two adjacent codes, then thenoise can be modeled as approximating whitenoise. White noise is characterized as having a uni-form power spectral density over the frequencyband of interest. When the noise can be approxi-mated as white noise, then oversampling and aver-aging can improve the SNR and increase theeffective resolution of the data.
If the overall noise is not stationary, (e.g., systemsthat have some correlation due to feedback), thenoversampling and averaging may not be effective.Additionally, if the quantization noise is compara-ble to sources of white noise (i.e., thermal and shotnoise is small compared to the quantization noise),then oversampling and averaging may not be effec-
tive. This situation is typical when using lower res-olution ADCs (e.g., 8-bit ADCs). In this case, thethermal noise does not have sufficient amplitude tocause the input signal to change randomly withequal probability between codes, because the codewidth Equation 5, is too large. Some applica-tions will inject noise into the signal or processintentionally to overcome this effect. This isreferred to as dithering.
Histogram AnalysisMost applications that measure a signal using a 12-bit ADC will benefit from oversampling and aver-aging techniques. A practical means of determiningif the noise characteristics are appropriate is to ana-lyze the ADC output data using a histogram (seeFigure 5 below).[2] This histogram shows howmany samples in a set from an ADC resulted ineach ADC code. If the input signal is a constant dcvoltage value, the histogram will approximate agaussian probability distribution function (PDF) ifthe noise is white, as shown in Figure 5.[2] Due tothe input voltage, the “bin” for code 1024 receivedthe greatest number of samples, while surroundingcodes received some samples due noise. Becausethe histogram approximates a Gaussian PDF(shown as a blue dotted line in Figure 5), the noiseapproximates white noise, and this system can ben-efit from oversampling and averaging techniques.

AN118
Rev. 1.3 13
A system with insufficient noise (besides the quan-tization noise) will result in a histogram with allsamples going to only one bin, or code. Oversam-pling and averaging may not be helpful in such asystem.
If the noise is correlated or the ADC’s transferfunction is non-linear (e.g., power supply noise,poor INL, etc.), the histogram may not approximatea Gaussian PDF, such as the one in Figure 6). Inthis case, oversampling and averaging may nothelpful.
In summary, if the combined sources of noise in theresultant ADC codes approximates white noise, ahistogram of the samples will approximate aGaussian PDF, and oversampling and averagingwill improve the SNR and increase the effectivenumber of bits of the signal measurement.
Num
ber
of S
ampl
es
12-bit ADC Codes
"Bin" that has highestnumber of samples
and is closest to inputsignal
Other "bins" receivesamples due to noise
......
Histogram has ashape that
approximates aGaussian PDF (shownas dashed line) due towhite noise mixed withdc input signal voltage
0 4095102410231022102110201019 1025 1026 1027 1028 1029
Figure 5. Histogram of ADC samples: dc Input With White Noise

AN118
14 Rev. 1.3
Num
ber
of S
ampl
es
12-bit ADC Codes
"Bin" that shouldreceive the highestnumber of samples
and is closest to inputsignal
......
Histogram does nothave a shape that
approximates aGaussian PDF (shownas dashed line) due to
possible correlationand poor INL
0 4095102410231022102110201019 1025 1026 1027 1028 1029
Figure 6. Histogram of ADC Samples Not Optimal For Oversampling and Averaging Techniques

AN118
Rev. 1.3 15
Appendix C - Example Code//-----------------------------------------------------------------------------// AN018_SW.c//-----------------------------------------------------------------------------// Copyright 2001 Cygnal Integrated Products, Inc.//// AUTH: BW//// This program outputs the C8051Fxxx die temperature out the hardware // UART at 115.2kbps. Assumes an 18.432MHz crystal is attached between // XTAL1 and XTAL2.//// The ADC is configured to look at the on-chip temp sensor. The sampling// rate of the ADC is determined by the constant <SAMPLE_RATE>, which is given// in Hz. The maximum value of <SAMPLE_RATE> is limited to ~86kHz due to// the choice of 18.432MHz crystal (SAR clock = SYSCLK / 16 = 1.152MHz. One// conversion takes 16 SAR clocks --> 72kHz sampling rate).// // The ADC End of Conversion Interrupt Handler retrieves the sample// from the ADC and adds it to a running accumulator. Every 256 // samples, the ADC updates and stores its result in the global variable// <result>. The sampling technique of adding a set of values and// decimating them (posting results every 256th sample) is called accumulate// and dump. It is easy to implement and requires very few resources.//// For each power of 4, you gain 1 bit of effective resolution.// For a factor of 256, gain you 4 bits of resolution: 4^4 = 256.// Also, to properly scale the result back to 16-bits, perform a right// shift of 4 bits.//// Target: C8051F00x or C8051F01x// Tool chain: KEIL C51 6.03 / KEIL C51 EVAL version//
//-----------------------------------------------------------------------------// Includes//-----------------------------------------------------------------------------
#include <stdio.h>
#include <c8051f000.h> // SFR declarations
//-----------------------------------------------------------------------------// 16-bit SFR Definitions for F00x, F01x//-----------------------------------------------------------------------------
sfr16 DP = 0x82; // data pointersfr16 TMR3RL = 0x92; // Timer3 reload valuesfr16 TMR3 = 0x94; // Timer3 countersfr16 ADC0 = 0xbe; // ADC0 datasfr16 ADC0GT = 0xc4; // ADC0 greater than windowsfr16 ADC0LT = 0xc6; // ADC0 less than windowsfr16 RCAP2 = 0xca; // Timer2 capture/reloadsfr16 T2 = 0xcc; // Timer2sfr16 DAC0 = 0xd2; // DAC0 data

AN118
16 Rev. 1.3
sfr16 DAC1 = 0xd5; // DAC1 data
//-----------------------------------------------------------------------------// Global CONSTANTS//-----------------------------------------------------------------------------
#define SYSCLK 18432000 // SYSCLK frequency in Hz#define BAUDRATE 115200 // Baud rate of UART in bps#define SAMPLE_RATE 100000 // Sample frequency in Hz
#define LED P1.6 // LED=1 means ON
//-----------------------------------------------------------------------------// Function PROTOTYPES//-----------------------------------------------------------------------------
void SYSCLK_Init (void);void PORT_Init (void);void UART_Init (void);void ADC_Init (void);void TIMER3_Init (int counts);void ADC_ISR (void);
//-----------------------------------------------------------------------------// Global VARIABLES//-----------------------------------------------------------------------------
long result; // Output result from oversmapling and // averaging 256 samples from the ADC for // 16-bit measurement resolution
//-----------------------------------------------------------------------------// MAIN Routine//-----------------------------------------------------------------------------
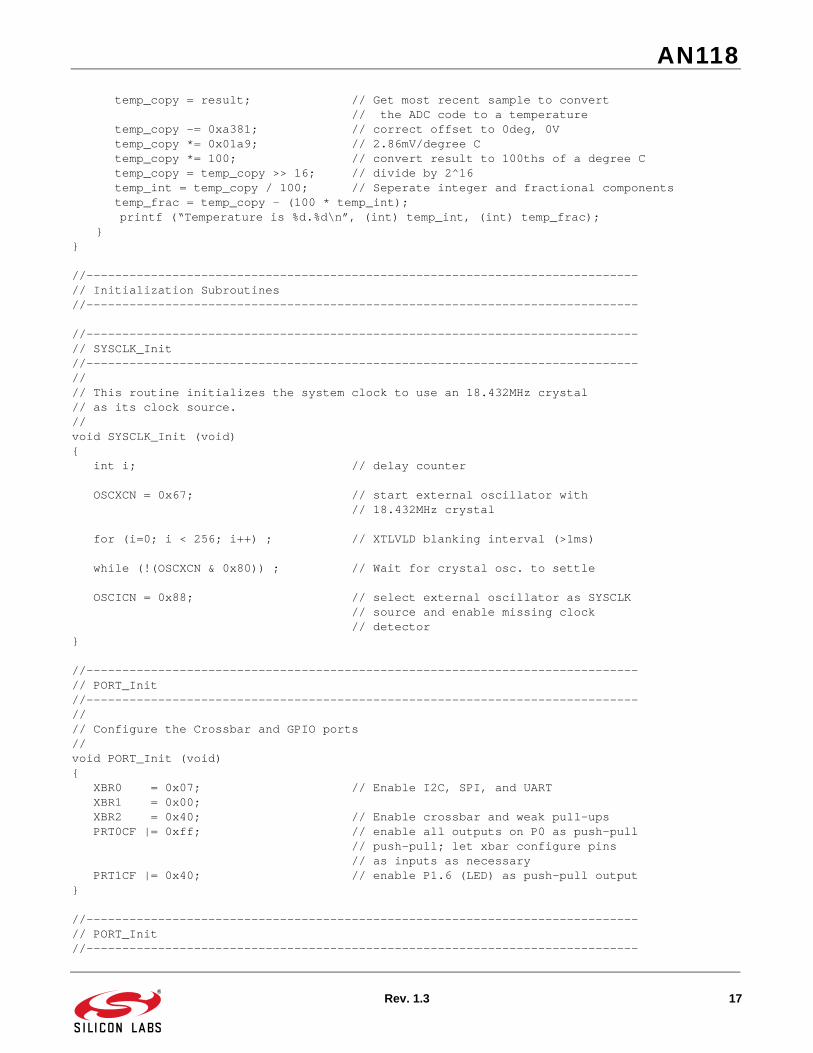
void main (void) { long temp_copy; int temp_int; // integer portion of temperature int temp_frac; // fractional portion of temperature (in // hundredths of a degree)
WDTCN = 0xde; // disable watchdog timer WDTCN = 0xad;
SYSCLK_Init (); // initialize oscillator PORT_Init (); // initialize crossbar and GPIO UART_Init (); // initialize UART TIMER3_Init (SYSCLK/SAMPLE_RATE); // initialize Timer3 to overflow at // sample rate ADC_Init (); // init ADC
ADCEN = 1; // enable ADC
result = 0L; // initialize temperature variable
EA = 1; // Enable global interrupts
while (1) {
AN118
Rev. 1.3 17
temp_copy = result; // Get most recent sample to convert // the ADC code to a temperature temp_copy -= 0xa381; // correct offset to 0deg, 0V temp_copy *= 0x01a9; // 2.86mV/degree C temp_copy *= 100; // convert result to 100ths of a degree C temp_copy = temp_copy >> 16; // divide by 2^16 temp_int = temp_copy / 100; // Seperate integer and fractional components temp_frac = temp_copy - (100 * temp_int);
printf (“Temperature is %d.%d\n”, (int) temp_int, (int) temp_frac);}
}
//-----------------------------------------------------------------------------// Initialization Subroutines//-----------------------------------------------------------------------------
//-----------------------------------------------------------------------------// SYSCLK_Init//-----------------------------------------------------------------------------//// This routine initializes the system clock to use an 18.432MHz crystal// as its clock source.//void SYSCLK_Init (void){ int i; // delay counter
OSCXCN = 0x67; // start external oscillator with // 18.432MHz crystal
for (i=0; i < 256; i++) ; // XTLVLD blanking interval (>1ms)
while (!(OSCXCN & 0x80)) ; // Wait for crystal osc. to settle
OSCICN = 0x88; // select external oscillator as SYSCLK // source and enable missing clock // detector}
//-----------------------------------------------------------------------------// PORT_Init//-----------------------------------------------------------------------------//// Configure the Crossbar and GPIO ports//void PORT_Init (void){ XBR0 = 0x07; // Enable I2C, SPI, and UART XBR1 = 0x00; XBR2 = 0x40; // Enable crossbar and weak pull-ups PRT0CF |= 0xff; // enable all outputs on P0 as push-pull // push-pull; let xbar configure pins // as inputs as necessary PRT1CF |= 0x40; // enable P1.6 (LED) as push-pull output}
//-----------------------------------------------------------------------------// PORT_Init//-----------------------------------------------------------------------------

AN118
18 Rev. 1.3
//// Configure the UART using Timer1, for <baudrate> and 8-N-1.//void UART_Init (void){ SCON = 0x50; // SCON: mode 1, 8-bit UART, enable RX TMOD = 0x20; // TMOD: timer 1, mode 2, 8-bit reload TH1 = -(SYSCLK/BAUDRATE/16); // set Timer1 reload value for baudrate TR1 = 1; // start Timer1 CKCON |= 0x10; // Timer1 uses sysclk as time base PCON |= 0x80; // SMOD = 1 TI = 1; // Indicate TX ready}
//-----------------------------------------------------------------------------// ADC_Init//-----------------------------------------------------------------------------//// Configure A/D converter to use Timer3 overflows as conversion source, to// generate an interrupt on conversion complete, and to use right-justified// output mode. Enables ADC end of conversion interrupt. Leaves ADC disabled.//void ADC_Init (void){ ADC0CN = 0x04; // ADC disabled; normal tracking // mode; ADC conversions are initiated // on overflow of Timer3; ADC data is // right-justified REF0CN = 0x07; // enable temp sensor, on-chip VREF, // and VREF output buffer AMX0SL = 0x0f; // Select TEMP sens as ADC mux output ADC0CF = 0x61; // ADC conversion clock = sysclk/8
EIE2 |= 0x02; // enable ADC interrupts}
//-----------------------------------------------------------------------------// TIMER3_Init//-----------------------------------------------------------------------------//// Configure Timer3 to auto-reload at interval specified by <counts> (no // interrupt generated) using SYSCLK as its time base.//void TIMER3_Init (int counts){ TMR3CN = 0x02; // Stop Timer3; Clear TF3; // use SYSCLK as timebase TMR3RL = -counts; // Init reload values TMR3 = 0xffff; // set to reload immediately EIE2 &= ~0x01; // disable Timer3 interrupts TMR3CN |= 0x04; // start Timer3}
//-----------------------------------------------------------------------------// Interrupt Service Routines//-----------------------------------------------------------------------------
//-----------------------------------------------------------------------------// ADC_ISR

AN118
Rev. 1.3 19
//-----------------------------------------------------------------------------//// ADC end-of-conversion ISR // Here we take the ADC sample, add it to a running total <accumulator>, and// decrement our local decimation counter <int_dec>. When <int_dec> reaches// zero, we calculate the new value of the global variable <result>,// which stores the accumulated ADC result.//void ADC_isr (void) interrupt 15{ static unsigned int_dec=256; // integrate/decimate counter // we post a new result when // int_dec = 0 static long accumulator=0L; // heres where we integrate the // ADC samples
ADCINT = 0; // clear ADC conversion complete // indicator
accumulator += ADC0; // read ADC value and add to running // total int_dec--; // update decimation counter
if (int_dec == 0) { // if zero, then decimate int_dec = 256; // reset counter result = accumulator >> 4; // Shift to perform the divide operation accumulator = 0L; // dump accumulator }}
AN118
20 Rev. 1.3
References[1] A. Oppenheim and R. Schafer, Discrete-Time Signal Processing, New Jersey: Prentice Hall, 1999 ed.
[2] J. Lis, Noise Histogram Analysis, Cirrus Logic Application Note AN37
[3] J.C. Candy and G.C. Temes, Oversampling Methods for A/D and D/A Conversion, IEEE Transactionson Circuits and Systems, June 1987 (Beginning discussion on the effects of oversampling on in-bandnoise).

http://www.silabs.com
Silicon Laboratories Inc.400 West Cesar ChavezAustin, TX 78701USA
Simplicity Studio
One-click access to MCU and wireless tools, documentation, software, source code libraries & more. Available for Windows, Mac and Linux!
IoT Portfoliowww.silabs.com/IoT
SW/HWwww.silabs.com/simplicity
Qualitywww.silabs.com/quality
Support and Communitycommunity.silabs.com
DisclaimerSilicon Labs intends to provide customers with the latest, accurate, and in-depth documentation of all peripherals and modules available for system and software implementers using or intending to use the Silicon Labs products. Characterization data, available modules and peripherals, memory sizes and memory addresses refer to each specific device, and "Typical" parameters provided can and do vary in different applications. Application examples described herein are for illustrative purposes only. Silicon Labs reserves the right to make changes without further notice and limitation to product information, specifications, and descriptions herein, and does not give warranties as to the accuracy or completeness of the included information. Silicon Labs shall have no liability for the consequences of use of the information supplied herein. This document does not imply or express copyright licenses granted hereunder to design or fabricate any integrated circuits. The products are not designed or authorized to be used within any Life Support System without the specific written consent of Silicon Labs. A "Life Support System" is any product or system intended to support or sustain life and/or health, which, if it fails, can be reasonably expected to result in significant personal injury or death. Silicon Labs products are not designed or authorized for military applications. Silicon Labs products shall under no circumstances be used in weapons of mass destruction including (but not limited to) nuclear, biological or chemical weapons, or missiles capable of delivering such weapons.
Trademark InformationSilicon Laboratories Inc.® , Silicon Laboratories®, Silicon Labs®, SiLabs® and the Silicon Labs logo®, Bluegiga®, Bluegiga Logo®, Clockbuilder®, CMEMS®, DSPLL®, EFM®, EFM32®, EFR, Ember®, Energy Micro, Energy Micro logo and combinations thereof, "the world’s most energy friendly microcontrollers", Ember®, EZLink®, EZRadio®, EZRadioPRO®, Gecko®, ISOmodem®, Precision32®, ProSLIC®, Simplicity Studio®, SiPHY®, Telegesis, the Telegesis Logo®, USBXpress® and others are trademarks or registered trademarks of Silicon Labs. ARM, CORTEX, Cortex-M3 and THUMB are trademarks or registered trademarks of ARM Holdings. Keil is a registered trademark of ARM Limited. All other products or brand names mentioned herein are trademarks of their respective holders.