1 COREQUISITE REMEDIATION Too many students start college in remediation. 50% 2 Remediation.


PINEY POINT POND WATER REMEDIATION USING REVERSE OSMOSIS
FINAL REPORT
Kenneth J. Jardine, William N. Futch and Dennis H. Michalski
The Mosaic Co. (formerly IMC Phosphates)
Vaughn V. Astley, Ph.D.,
(formerly IMC Phosphates, currently Dr. Phosphate, Inc.)
Prepared for
FLORIDA INSTITUTE OF PHOSPHATE RESEARCH 1855 West Main Street
Bartow, Florida 33830 USA
Project Manager: G. Michael Lloyd, Jr. FIPR Project Number: 03-01-183
November 2005

DISCLAIMER
The contents of this report are reproduced herein as received from the contractor. The report may have been edited as to format in conformance with the FIPR Style Manual. The opinions, findings and conclusions expressed herein are not necessarily those of the Florida Institute of Phosphate Research, nor does mention of company names or products constitute endorsement by the Florida Institute of Phosphate Research. © 2005, Florida Institute of Phosphate Research
iii
PERSPECTIVE While the abandonment of the Piney Point facility by its bankrupt owner, Mulberry Phosphates, has been about as bad an event as anything that could happen in the phosphate industry, it has provided a unique opportunity for full-scale testing of techniques to treat process water that could prove to be the answer to future process water problems both at operating plants and at plants that have been shut down. The problems at operating plants are not the same as those encountered at Piney Point, but it was still possible to learn a great deal from the experiences there. Reverse osmosis (R.O.) does offer an opportunity to produce very high-quality water that could be used for almost any purpose, including boiler feed water, in an operating phosphate complex. One problem that still needs to be resolved for Piney Point-type situations is what to do with the reject stream when the final volume of water is treated. Even in an operating plant, the question of how best to utilize the reject stream needs additional study. It is to be hoped that some of the ongoing studies will provide acceptable answers to these questions. G. Michael Lloyd, Jr. Research Director, Chemical Processing

v
ABSTRACT
Phosphate plant pond water or process water can pose significant environmental risks and economic liabilities. Double liming has been the traditional treatment method for remediation of pond water. However, double liming suffers from several disadvantages, not the least of which are that the treated water often barely meets discharge criteria and that post-treatment air stripping is often required to attain acceptable ammonia concentrations. Reverse osmosis (R.O.) has long been viewed as an attractive alternative for pond water remediation. However, to be successful, the use of R.O. in the processing of pond water requires some form of pretreatment.
In 2001, IMC developed an R.O. pretreatment process in anticipation of having to
treat and discharge water from their Uncle Sam, Louisiana, plant. While water discharge at the Uncle Sam plant was ultimately not needed, the situation at Piney Point provided a unique opportunity to prove the process at a large scale, while aiding the State of Florida in closing the Piney Point gypsum stack.
In early 2004 a large-scale plant, using IMC technology, was built at Piney Point,
operated for 4½ months and produced approximately 46 million gallons of high quality water for discharge. Several process improvements were tested and implemented and real-world process economics determined.

vi
ACKNOWLEDGMENTS
The authors acknowledge the participation of Mobile Process Technology of Memphis, Tennessee, for the design, construction and operation of the Piney Point demonstration plant. In particular, thanks are extended to Vann Raley, Director of Technical Services; Sean Kelly, Project Manager; and Guy Yoe, Field Service Manager. Thanks are also extended to Tony Lazanowski and our core group of highly skilled technicians: Flint Barnes, Ron Layne and Mike Melanson.
vii
TABLE OF CONTENTS
PERSPECTIVE.................................................................................................................. iii ABSTRACT.........................................................................................................................v ACKNOWLEDGMENTS ................................................................................................. vi EXECUTIVE SUMMARY .................................................................................................1 INTRODUCTION ...............................................................................................................5 Background..............................................................................................................5 Initial Process Development ....................................................................................6 Literature Review.....................................................................................................8 Piney Point Project Chronology...............................................................................8 PROCESS DESCRIPTION ...............................................................................................11 Piney Point Demonstration Plant ...........................................................................13 RESULTS ..........................................................................................................................17 Preliminary Batch Pretreatment and Small Scale R.O. Tests ................................17 Pilot Pretreatment and Extended Duration R.O. Tests ..........................................21 Piney Point Demonstration Plant Results ..............................................................33
Demonstration Plant Construction.............................................................33 Demonstration Plant Start-Up and Phase II Milestone Attainment ...........36 Demonstration Plant Phase III Operation ..................................................41 Operating and Project Costs.......................................................................48 CONCLUSIONS................................................................................................................53 REFERENCES ..................................................................................................................55 APPENDIX: U.S. Filter Treatability Test Report for Uncle Sam Pond Water

viii
LIST OF FIGURES Figure Page 1. Block Flow Diagram of Standard Pretreatment Process and Two-Pass
R. O. System...............................................................................................12 2. Piney Point Pretreatment P&ID ......................................................................14 3. Piney Point Pretreatment P&ID ......................................................................15 4. Piney Point 2nd Pass R.O. and Final Treatment P&ID ....................................16 5. Block Flow Diagram of Piney Point Pretreatment Pilot Plant ........................22 6. Recovery and Flux Rate for December 11, 2003 R.O. Test............................26 7. Recovery and Flux Rate for December 22, 2003 R.O. Test............................28 8. Recovery and Flux Rate for January 13, 2004 R.O. Test................................30 9. Recovery and Flux Rates for January 19-23, 2004 R.O. Test.........................33 10. Piney Point Demonstration Plant from South End..........................................35 11. Piney Point Demonstration Plant from North East End ..................................35 12. Piney Point Demonstration Plant Equipment Arrangement............................36 13. Florida Pines Permeate Production – March 2004..........................................39 14. Florida Pines Permeate Production – February 19-June 30, 2004 ..................45

ix
LIST OF TABLES
Table Page 1. Phosphate Plant Pond Water Composition .........................................................5 2. Sample Analyses for U.S. Filter Reverse Osmosis Test .....................................7 3. Preliminary Pretreatment Test Summary..........................................................18 4. Preliminary 1st Pass R.O. Test Summary..........................................................19 5. Preliminary 2nd Pass R.O. Test Summary .........................................................20 6. Post-Treated R.O. Permeate Analysis...............................................................21 7. Pretreatment Pilot Test Summary Dec. 8, 2003................................................23 8. R.O. Feed Analysis – December 11, 2003........................................................24 9. R.O. Summary Data, December 11, 2003 R.O. Test ........................................25 10. Pretreatment Pilot Test Summary Dec. 19, 2003..............................................27 11. R.O. Summary Data, December 22, 2003 R.O. Test ........................................28 12. R.O. Summary Data, January 13, 2004 R.O. Test ............................................29 13. Pretreatment Pilot Test Summary Jan. 19, 2004...............................................31 14. R.O. Summary Data, January 19-23, 2004 R.O. Test.......................................32 15. Piney Point Estimated Costs, Actual Costs and Accelerated Construction Related Costs................................................................................................34 16. Florida Pines Permeate Production – February 2004........................................37 17. Florida Pines February 2004 Permeate Composite Analysis............................38 18. Florida Pines March 2004 Permeate Composite Analyses ...............................40 19. March Raw Material Consumption and Recovery............................................41 20. April Estimated Raw Material Consumption and Recovery.............................42 21. 1st Pass R.O. Operation Comparison for Dry Flocculant Test ..........................43 22. May Estimated Raw Material Consumption and Recovery..............................44 23. June Estimated Raw Material Consumption and Recovery..............................44 24. Florida Pines April-June Permeate Analyses.............................................. 45-47 25. Reject Sample Analyses....................................................................................47 26. Feed Pond Water Sample Analyses ..................................................................48 27. Operating and Project Cost Summary...............................................................51 28. Projected Operating Costs.................................................................................51
1
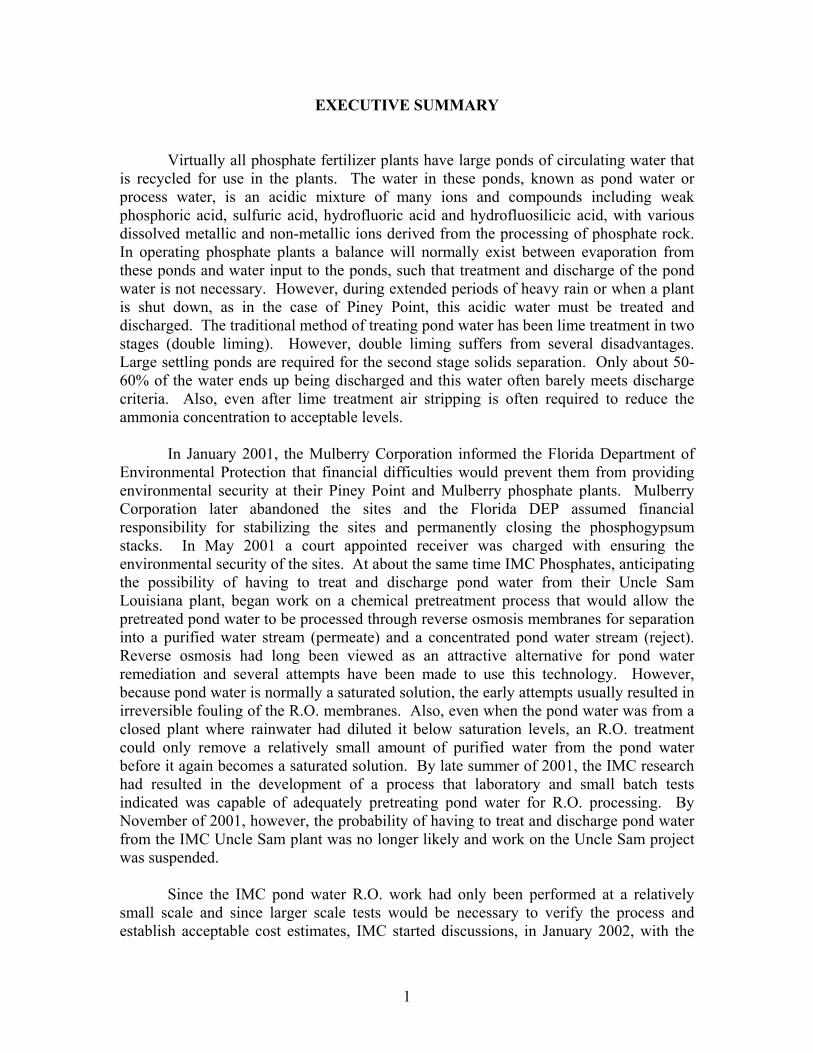
EXECUTIVE SUMMARY
Virtually all phosphate fertilizer plants have large ponds of circulating water that is recycled for use in the plants. The water in these ponds, known as pond water or process water, is an acidic mixture of many ions and compounds including weak phosphoric acid, sulfuric acid, hydrofluoric acid and hydrofluosilicic acid, with various dissolved metallic and non-metallic ions derived from the processing of phosphate rock. In operating phosphate plants a balance will normally exist between evaporation from these ponds and water input to the ponds, such that treatment and discharge of the pond water is not necessary. However, during extended periods of heavy rain or when a plant is shut down, as in the case of Piney Point, this acidic water must be treated and discharged. The traditional method of treating pond water has been lime treatment in two stages (double liming). However, double liming suffers from several disadvantages. Large settling ponds are required for the second stage solids separation. Only about 50-60% of the water ends up being discharged and this water often barely meets discharge criteria. Also, even after lime treatment air stripping is often required to reduce the ammonia concentration to acceptable levels.
In January 2001, the Mulberry Corporation informed the Florida Department of
Environmental Protection that financial difficulties would prevent them from providing environmental security at their Piney Point and Mulberry phosphate plants. Mulberry Corporation later abandoned the sites and the Florida DEP assumed financial responsibility for stabilizing the sites and permanently closing the phosphogypsum stacks. In May 2001 a court appointed receiver was charged with ensuring the environmental security of the sites. At about the same time IMC Phosphates, anticipating the possibility of having to treat and discharge pond water from their Uncle Sam Louisiana plant, began work on a chemical pretreatment process that would allow the pretreated pond water to be processed through reverse osmosis membranes for separation into a purified water stream (permeate) and a concentrated pond water stream (reject). Reverse osmosis had long been viewed as an attractive alternative for pond water remediation and several attempts have been made to use this technology. However, because pond water is normally a saturated solution, the early attempts usually resulted in irreversible fouling of the R.O. membranes. Also, even when the pond water was from a closed plant where rainwater had diluted it below saturation levels, an R.O. treatment could only remove a relatively small amount of purified water from the pond water before it again becomes a saturated solution. By late summer of 2001, the IMC research had resulted in the development of a process that laboratory and small batch tests indicated was capable of adequately pretreating pond water for R.O. processing. By November of 2001, however, the probability of having to treat and discharge pond water from the IMC Uncle Sam plant was no longer likely and work on the Uncle Sam project was suspended.
Since the IMC pond water R.O. work had only been performed at a relatively
small scale and since larger scale tests would be necessary to verify the process and establish acceptable cost estimates, IMC started discussions, in January 2002, with the

2
newly formed FIPR Process Water Technical Advisory Committee on the possibility of funding a pilot scale pond water R.O. treatment project. While the Piney Point pond water was significantly different from the Uncle Sam pond water, due to several years of rain water dilution, Piney Point provided a unique opportunity to prove the process at a large scale, while aiding the State of Florida in closing the Piney Point gypsum stack. During the remainder of 2002 and the first half of 2003 IMC conducted test work specifically on R.O. processing of the Piney Point pond water and continued negotiations with FIPR for partial funding of the Piney Point project. During this time period IMC also conducted discussions with various third party companies that could assist with the actual operation of the Piney Point plant and eventually negotiated an agreement with Mobile Process Technology of Memphis Tennessee to manage and operate the plant.
On October 7, 2003, a contract was finally signed between the court-appointed
receiver and Florida Pines (a joint venture between Pure Water Technology Holding Company, a subsidiary of IMC, and Mobile Process Technology) for water treatment at Piney Point. The contract specified a Phase I pilot program in which Florida Pines had to produce 5000 gallons of pretreated pond water suitable for R.O. processing. This was to be followed, after the completion and commissioning of the full scale plant, by a Phase II segment, during which Florida Pines had to produce and discharge 400,000 gallons per day of R.O. permeate for five consecutive days. Operation would then move to Phase III, for a total operating time of 105 days, or until June 30, 2004. At this point a contract was also in place for FIPR to supply $900,000 in capital to assist in construction of the water treatment plant that was to be reimbursed at the rate of $16.33 per thousand gallons of water discharged. The agreement with FIPR was later renegotiated such that reimbursement to FIPR amounted to approximately one third of the original $900,000.
From the onset, the construction schedule was extremely aggressive and various
factors caused delays. Of significant impact was that the initial plan was to use a slip stream from the existing liming facilities to provide a feed for the IMC pretreatment process. However, as a result of the barging operations, the first stage liming facilities would not be available for our use. In addition, the resultant lack of a large clarifier resulted in many process and equipment changes necessary to accommodate the significantly revised process and the clarification had now to be carried out in tanks. While some schedule slippage was due to these process changes resulting from simultaneous piloting of the pretreatment process the most significant delays were caused by vendors not being able to deliver some of the larger tanks when promised. While the original contract called for the plant to be operational by the end of December 2003, the plant did not start up until February 19, 2004.
The first step of the pretreatment process used at Piney Point consisted of sulfuric
acid addition to the pond water to a pH of approximately 2.5. This was done to kill algae and allow it to be removed during subsequent clarification. Caustic (NaOH solution) was then added to the pond water to raise the pH to about 7.0 and precipitate the calcium in the pond water in the form of hydroxyapatite. A flocculant was next added to the pond water slurry and it was sent to clarifiers for sludge separation. One of the compromises made at the Piney Point plant, due to space and time limitations, was the use of four

3
clarifiers operating in parallel for sludge separation. The clarifier overflow was then collected in the R.O. feed tank, where sulfuric acid was again added to reduce the pH to 2.5-3.0. This step was necessary to increase the solubility of the calcium and other ions remaining in the pond water to keep them in solution when the water was processed through the 1st pass R.O. unit. The water was then sent to the 1st pass R.O., operating at about 400 psi, for separation into a reject stream, that was returned to the Piney Point pond system, and a permeate stream. The 1st pass R.O. unit removed the majority of all contaminants from the pond water with the exception of fluorides. Fluorides were not removed in the 1st pass because their ionic size, at acid pH, is very close to that of water. Permeate from the 1st pass R.O. was then treated with a small amount of caustic (1.0-1.5 lbs. NaOH/1000 gallons) to raise the pH to about 7.5 to 8.0 and fed to the 2nd pass R.O. In the 2nd pass R.O. fluorides are removed from the water along with most of the remaining contaminants that pass through the 1st pass R.O. Initially, reject from the 2nd pass R.O. was returned to the Piney Point pond system. Later it was recycled to the 1st pass R.O. to increase overall recovery. With the exceptions of ammonia nitrogen and (occasionally) pH, permeate from the 2nd pass R.O. met and generally exceeded all requirements for discharge. To remove the last traces of ammonia nitrogen the 2nd pass-permeate was processed through an ion exchange water softening resin. For final pH adjustment a very small amount (<1%) of well water was added to the permeate stream.
From initial start-up, on February 19, 2004 until expiration of the water treatment
contract on June 30, 2004, the Piney Point demonstration plant produced and discharged 46,015,799 gallons of water, with over 99.7% of the water within contract specifications (pH 6.0-8.5; F <5 mg/L as ion; Total NH3 <1 mg/L; Total N <2mg/L; P <0.5 mg/L; TDS <50 mg/L). The average production rate, over the entire operating period, was 368,000 gallons per day with an overall permeate recovery of 43.3% and an operating factor of 91.2%. Several process improvements and equipment up-grades were instituted during the operation period to improve permeate recovery and increase capacity. Taken as a whole the improvements increased permeate recovery from 41.7% to 44.6% and increased average permeate production from 314,000 to 412,000 gallons per day.
Operating costs for the demonstration plant, during the 4 ½ months of operation,
were $17.71 per thousand gallons of permeate discharged and projected future operating costs, taking into account the equipment up-grades and process improvements, were $14.81 per thousand gallons of permeate. While even the projected future R.O. operating cost for Piney Point is about twice the cost of double liming (estimated at $7.47/1000 gallons discharged), it is highly probable that operating costs could be reduced further, to about $8/1000 gallons permeate, with additional refinements to the pretreatment chemistry, adequate clarification area and the use of 600 psi 1st pass R.O. units.
Overall, the Piney Point project demonstrated that, with adequate pretreatment,
R.O. based pond water treatment is possible with reasonable purified water recovery. The primary strength of the process in the high quality of water produced. The primary weakness of the process is higher cost than double liming. However, with future development, it is probable that the cost can be reduced.

5
INTRODUCTION
BACKGROUND
Phosphate plant pond water or process water is an acidic mixture of many ions and compounds. In an operating wet process phosphoric acid plant, the pond water is used for washing the calcium sulfate (gypsum) filter cake produced as a result of phosphoric acid production, cooling and scrubbing process vapors, conveying the gypsum to the stacking area and other purposes that do not require fresh water. The major acidic components of pond water are phosphoric acid, sulfuric acid, hydro-fluorosilicic acid (H2SiF6), and hydrofluoric acid (HF). Table 1 shows the major chemical components found in pond water and their concentration ranges. Table 1. Phosphate Plant Pond Water Composition.
Chemical Component Concentration Range P 1700-12,000 ppm
SO4 4300-9600 ppm F 200-15,000 ppm Si 100-4100 ppm
(ammoniacal) N 40-1500 ppm Na 1200-2500 ppm Mg 160-510 ppm Ca 450-3500 ppm K 80-370 ppm Fe 5-350 ppm Al 10-430 ppm Cl 10-300 ppm
Since, in an operating phosphoric plant, the pond water is continuously recycled and used for cooling, the heat input and resulting evaporation is normally sufficient to balance the fresh water additions to the pond (rain water and other fresh water inputs from the plant). Thus remediation and discharge of the pond water is normally not required. However, there are circumstances under which treatment and discharge of the contaminated pond water is necessary. One such circumstance could be an extended period of abnormally heavy rainfall. Another such circumstance would be when the phosphoric acid plant has ceased operation ether for an extended period of time or permanently.

6
INITIAL PROCESS DEVELOPMENT In 1999 the IMC phosphoric acid plant in Uncle Sam, Louisiana suspended operations due to market conditions. While the suspension in operations was intended to be temporary, subsequent heavy rainfall along with reduced evaporation due to the lack of heat input to the pond made it evident that pond water remediation and discharge might soon be required. At the time the standard industry method of treating pond water for discharge was double liming. This method consists of adding a calcium compound (such as CaCO3, Ca(OH)2 or CaO) to the pond water, in two stages, such that the phosphate and other impurities form solid precipitates that settle and are separated from the liquid phase. During the first stage lime treatment, to a pH of about 5.5, fluorides are precipitated as CaF2 and/or CaSiF6. During this stage it is also thought that the hydro-fluorosilicic acid present dissociates to HF and SiF4, with the SiF4 hydrolyzing to HF and SiO2. Some phosphate is also precipitated at this stage as Ca3(PO4)2 (tri-calcium phosphate). The sludge (CaF2, CaSiF6, Ca3(PO4)2 and other compounds) produced at this stage is a granular, crystalline material that settles fairly rapidly and can be de-watered to about 30% solids in a gravity thickener. The sludge can be sent to the plant gypsum stack or recycled to the phosphoric acid plant, if operating, for recovery of the phosphorus. In the second stage, additional lime is added to the clear liquid from the first stage to a pH of about 10-12. In this stage the remaining phosphates and fluorides are precipitated along with some sulfate and many of the metals. The sludge in this stage has poor settling and thickening properties, due to the hydroxide nature of many of the compounds, and rarely achieves more than 5%-7% solids by weight. The sludge from this stage is normally deposited in large lagoons to allow for additional de-watering. Typically, however, the clarified water from the 2nd liming stage is still not capable of being released to the environment due to a high conductivity and the presence of ammonia. Thus, common practice is to airstrip the ammonia by spraying the water into the air and allowing it to fall back into the ponds. This process is slow and results in the ammonia being released into the environment. The water from the spray ponds is then blended with well water to reduce the conductivity before discharge. Overall, the quantity of water suitable for discharge from a double liming process is about 50%-70% of the feed volume.
Reverse osmosis had been considered as an attractive alternative for pond water remediation and several attempts had been made to use this technology. However, because pond water is a saturated solution, the early attempts almost always resulted in relatively rapid, irreversible fouling of the R.O. membranes. Also, even when the pond water was from a closed plant, where rainwater had diluted it below saturation levels, an R.O. system could only remove a relatively small amount of purified water from the pond water before it again became a saturated solution. Thus, it was recognized that successful R.O. treatment of pond water would require some form of pretreatment.
The Technology Development Group of IMC Phosphates began work on a
pretreatment process that would allow pond water to be fed to an R.O. in the last quarter of 2000. The pretreatment research concentrated on removing only those ions that would cause solids precipitation in the pond water as it was concentrated and on keeping as

7
much of the phosphate as possible in solution. By about May of 2001 a potential pretreatment process had been developed and U.S. Filter was contracted to run several pilot scale R.O. tests with pretreated Uncle Sam pond water. Two 110 gallon samples of pretreated Uncle Sam pond water were prepared in May of 2001 and shipped to the U.S. Filter laboratories in Warrendale PA for the R.O. tests. The R.O. system used for the tests was a small pilot scale unit that included a 5-micron cartridge filter, a 5-HP high pressure positive displacement pump and a single seawater element (Filmtec SW 2530). The test procedure consisted of first passing the pretreated pond water through a sand filter. The filtered pond water was then fed through the R.O. system in a “first pass.” The pH of the “first pass” R.O. permeate was then adjusted to 9.0 with sodium hydroxide and this material fed through the (same) R.O. system in a “second pass.” The primary objective of the second pass is to reduce the fluoride concentration in the final permeate. The U.S. Filter tests demonstrated first pass permeate recoveries as high as 85% at 850 psig feed pressure while maintaining flux rates greater than 8 GFD (gallons/day/square foot of membrane area) and second pass recoveries as high as 95% at 150 psig feed pressure while maintaining flux rates greater than 20 GFD. The complete U.S. Filter test report is included as Appendix A. Table 2 shows the sample analyses for the U.S. Filter test with one of the pretreated Uncle Sam pond water samples. Table 2. Sample Analyses for U.S. Filter Reverse Osmosis Test.
Parameter Raw Pond Water R.O. 1st Pass Reject R.O. 2nd Pass PermeateP2O5 1.61% 5.65% 0.23 ppm CaO 0.167% 0.060% 0.1 ppm
F 0.470% 0.038% 0.83 ppm SiO2 0.440% 0.079% 1.0 ppm Na2O 0.310% 2.85% 8.1 ppm SO4 0.440% 2.83% 12 ppm
NH3 - N 0.200% -- 0.80 ppm Conductivity (µmho/cm) 19,800 -- 59
At the conclusion of this work, preliminary design work was started on a 2MM
GPD reverse-osmosis-based pond water treatment plant for the Uncle Sam, Louisiana, site. This work included developing a mass balance, estimating operating costs, developing an equipment list and estimating capital costs. This work was later suspended when normal production operations resumed at the Uncle Sam site and water balance modeling projections indicated there would be no need to treat and release pond water.
However, IMC continued R.O. pretreatment research work with pond water
samples from various other locations, with both higher and lower concentrations of dissolved ions. This additional work led to a better understanding of phosphate plant pond water chemistry and produced several additional pieces of information. All of this work resulted in the filing of two U.S. patent applications during February 2002 for the pond water pretreatment technology and the issue of the two patents (US 6,758,976 and 6,758,977) on July 6, 2004.

8
LITERATURE REVIEW The majority of technical literature relating to the phosphate industry gives little attention to the pond or process water system. Furthermore, when pond water is mentioned it is usually in the context of gypsum disposal (Becker 1989). Mooney, Nogueira and Thompson (1977) performed a laboratory and pilot study of the double liming process in which they identified the precipitating compounds and pH relationships for the two-stage process. This work provided some useful information in the development of our R.O. pretreatment process in terms of pH values at which fluorides have a minimum solubility in pond water. Other relevant references relating to pond water treatment or remediation consist mainly of patents concerned with variations of, or improvements to the conventional double liming process (Baumann and Bird 1970; Legal 1973; Murray and Weston 1992). PINEY POINT PROJECT CHRONOLOGY
IMC began independent test work with the Piney Point pond water in January
2002. At this time the pH of the pond water sample provided was 2.86, with a fluoride concentration of 455 ppm and a calcium concentration of 582 ppm. After some initial screening tests a pretreatment process was selected and a larger sample of pond water was obtained for large-scale batch pretreatment tests and small-scale pilot R.O. tests. These larger scale batch pretreatment tests and pilot R.O. tests were conducted from July through December of 2002. Approximately 900 gallons of Piney Point pond water were pretreated and approximately 800 gallons of the pretreated water were processed through a single membrane, pilot scale, 1st pass R.O. system. At an average feed pressure of 600 psig permeate recovery was 76% at an average flux rate of 15.4 GFD. Average R.O. feed conductivity was about 9000 µmho/cm and average permeate conductivity was 415 µmho/cm. Approximately 310 gallons of the 1st pass R.O. permeate were then used for 2nd pass R.O. tests. These tests were run at several feed pH values and at pressures from 200 psig to 350 psig. These tests indicated that, at optimum conditions, permeate recoveries approaching 95% could be obtained, at flux rates greater than 14 GFD. At the conclusion of this test work we could reliably produce 2nd pass permeate with a P2O5 concentration less than 0.5 mg/L and a fluoride concentrations less than 1 mg/L. However, the ammonia nitrogen concentration was still between 5 and 10 mg/L. Thus, a final test was run with about 55 gallons of the 2nd pass permeate and a water softening resin. This test indicated that it was possible to lower the ammonia nitrogen concentration in the 2nd pass permeate to less than 0.1 mg/L.
After the conclusion of the above pilot scale work, IMC independently started
some engineering work on an 800,000 GPD reverse-osmosis-based pond water treatment plant for the Piney Point site. This work consisted of developing flow sheets, P&ID’s, operating and capital cost estimates and specific equipment lists, with long lead time items identified. At this time IMC also purchased four skid mounted R.O. modules for potential use at Piney Point. One of the novel features considered during the preliminary

9
design, both to reduce costs and speed construction time, was the use of some of the existing double liming equipment at the Piney Point site.
IMC approached the newly formed FIPR Process Water Technical Advisory
Committee in January 2002 on the possibility of funding a pilot scale pond water R.O. treatment project. During the next several months discussions continued with FIPR and FDEP and the scope of the project expanded from pilot scale to large demonstration scale (initially ~800,000 GPD). A financial commitment was obtained from FIPR in May 2002 and discussions began with the Piney Point receiver. At this time detailed engineering for the plant also started. During the remainder of 2002 and into the first half of 2003 discussions continued with FDEP and the Piney Point receiver while IMC explored various options to limit liability by forming a subsidiary that would joint venture with an operator. Several operating partners for the Piney Point project were explored, but by July 2003 Mobile Process Technology of Memphis Tennessee had been selected to manage and operate the plant as a joint venture partner with IMC under the name of Florida Pines LLC. The final contract, with the Piney Point receiver, for water treatment services was signed on October 7, 2003.
Florida Pines started operation at Piney Point on November 6, 2003 with a 20
gpm pretreatment pilot plant. The purpose of the pilot plant was to fulfill a contractual obligation of producing 5000 gallons of pretreated pond water containing low enough fluoride and calcium concentrations to be deemed acceptable for feeding to a reverse osmosis system. This contractual obligation was achieved on November 20. Pretreatment pilot operations continued through January of 2004 to fine tune pretreatment process parameters for the full scale plant. This work was needed due to the significant changes that had occurred in the chemical composition of the Piney Point pond water since the initial testing that was conducted in 2002, and due to the lack of availability of the liming station together with its associated clarification equipment. At this time it was also determined that the full size skid mounted R.O. modules that were to be used for the 1st pass were only capable of operating at a maximum feed pressure of 400 psig, rather than the 600 psig originally anticipated.
Starting December 8, 2003, large samples of the pretreated pond water from the
pilot plant were transported to the IMC Technology Development laboratory near Mulberry FL for processing through a single element pilot scale reverse osmosis system. This system was set up as the 1st pass R.O. The objectives of this work were to obtain extended operating time with the R.O. to check for potential membrane fouling and to determine the production penalties that would result from operating the 1st pass R.O. at a feed pressure of 400 psig rather than 600 psig. The pilot R.O was operated for approximately 10 days, with no evidence of irreversible membrane fouling. Water quality from the pilot scale R.O. was indeed excellent; with an average 1st pass permeate conductivity of less than 515 µmho/cm.
Concurrently with the pilot operations design and construction of the full scale plant was in progress. As a result of the pilot testing several pretreatment process changes were needed to accommodate the different pond water composition (compared to

10
2002). Thus, some design changes were required in the full scale plant causing some construction delays.
From initial start-up on February 19, 2004, until contractual shut down on June 30, 2004, the Florida Pines reverse-osmosis-based water treatment plant produced 46.02 million gallons of permeate, of which 45.89 million gallons (99.74%) met specifications for discharge. All off-spec water was produced during the first two days of operation, with 67,500 gallons from February 19 being outside pH limits and 53,500 gallons from February 20 being discounted due an instrument malfunction. Permeate from several other days was initially contested as being out of specification in terms of the ammonia concentration. However, subsequent analyses of back-up 24 hour composite samples by an EPA accredited laboratory indicated that the ammonia concentration in all disputed samples was within the contract limit.
Of the 133 days between February 19 and June 30, the Piney Point plant was
scheduled to operate 124 days. Nine days of scheduled down time were taken from April 11 through April 19 to upgrade some piping and several pumps to permit increased production in the 1st pass R.O. modules. During the 124 days of scheduled production, the operating factor of the plant was 92% with an average daily permeate production of 402.6M gallons, while operating. Average daily production after the retrofit was 412M GPD.

11
PROCESS DESCRIPTION
The primary purpose of pretreating pond water before processing through a reverse osmosis system is to avoid solids precipitation and scale formation on and within the R.O. membranes. Previous attempts at processing pond water through a reverse osmosis system without pretreatment resulted in irreversible fouling of the membranes within hours. Phosphate plant pond water is normally saturated with respect to calcium, fluorine and silica and they are the primary components that must be removed during pretreatment.
The general pretreatment methodology consists of first adding a calcium compound to the pond water to form insoluble calcium fluoride (CaF2). The calcium compound is typically quick lime (CaO) or hydrated lime (Ca(OH)2) and it is added as a 10% slurry to promote a more complete reaction. The quantity of calcium added can be as low as 100% of the stoichiometric quantity required by the fluoride in the pond water (neglecting the calcium initially present), but economics favor a higher calcium addition rate within the range of 110% to 130% of the stoichiometric requirement. Since a small amount of calcium phosphates also start precipitating and re-dissolving at these calcium addition levels, the solution pH is unstable and should not be used for process control. The above step assumes the initial calcium concentration in the pond water is relatively low; less than about 15% of the stoichiometric requirement (for CaF2) of the fluoride in the pond water. If the initial calcium concentration of the pond water is greater than or equal to about 120% of the stoichiometric requirement of the fluoride in the pond water calcium addition may not be required (although may still be desirable for economic reasons). At initial calcium concentrations between these two levels, the calcium added is reduced by an amount proportional to the calcium initially present in the pond water.
Next, a second base is added to pond water slurry to raise the pH to the value of minimum fluoride solubility. For “normal” pond water (with a low Ca to F ratio) this pH is approximately 5.7. For pond water with a high initial calcium concentration (relative to the fluoride), this pH can be as high as 6.4. Since it is desirable to keep as much of the P2O5 as possible in solution, the second base is selected such that the phosphate salts thereof remain soluble. Typical bases are sodium hydroxide (NaOH) or ammonia (NH3), with economics greatly favoring ammonia. However, when it is desirable to minimize the ammonia concentration of the final permeate from the reverse osmosis system, sodium hydroxide is preferred.
The pond water slurry is then transferred to a clarifier. Sixty minutes settling time is generally sufficient, although 90 minutes is preferred. The sludge produced in the clarifier is about 8.5% or less of the feed volume at about 40% solids. The overflow from the clarifier is directed to a lined aging pond of sufficient size to provide 36 hours aging time. The purpose of the aging is to allow the silicic acid present in the liquid to decompose into hydrated silicon dioxide.

12
The pond water is now treated with a flocculant to remove the hydrated silicon dioxide. The best results have been obtained using a two stage flocculant system. In the first stage a cationic flocculant is added to the pond water at a dosage of about 150 ppm. Next, a “collector” flocculant is added at a dosage of about 8 ppm. The pond water is then directed to a settler for separation of the silica sludge. Preferably the underflow from the silica settler is centrifuged. This significantly increases the volume of pond water that can be fed forward and provides the opportunity for recovering the silica as a useful byproduct.
If the initial silica concentration in the pond water is sufficiently low (~200 ppm as SiO2), the aging/hydration step and the use of a flocculant for silica removal are unnecessary. In such cases the pond water can be fed directly from the sludge clarifier to the acidification step below.
At this point the pond water is still saturated with respect to Ca, F and possibly SiO2. Thus, a small quantity of sulfuric acid is added to the pond water to increase the solubility of the ions remaining in solution. Typically about 160 ppm of sulfuric acid is sufficient to decrease the pH to 3. This pH is acceptable for the R.O. membranes and is low enough to prevent precipitate formation in the R.O. reject (concentrate) stream. The pond water can now be processed through an R.O. system. To achieve acceptable fluoride concentrations in the permeate a two pass R.O. system is used. In this system the pH of the permeate from the first pass is raised to about 8-9 (via sodium hydroxide addition) and then fed to the second pass. Figure 1 shows a block flow diagram of the general pretreatment process and the two-pass R.O. system. Figure 1. Block Flow Diagram of Standard Pretreatment Process and Two-Pass
R. O. System.
Clarification
P. W. Aging
Hydrated Silica
Separation
pH Adjustment
pH Adjustment
2nd Pass R.O.
1st Pass R.O.
H2SO4
Solids
Silica Sludge
50% NaOH
Reject Reject Final Permeate
1st StagePermeate
Lime Addition
Caustic Addition
Lime Slurry
50% NaOH
Pond Water

13
While the above process would be applicable to pond water from most operating or recently closed phosphoric acid plants, the pond water at Piney Point presented a special case. At the start of the initial test work with the Piney Point pond water in 2002, it was evident, due to the low SiO2 concentration in the pond water, that the hydrated silica removal step would not be required. Later, at the start of pilot pretreatment tests at Piney Point, it was determined that the fluoride concentration in the pond water had decreased significantly. Thus, lime addition would no longer be needed. However, since the pH of the pond water had also increased from an initial value of 2.86 to more than 3.4, alga growth had accelerated and a control method was needed. As a result of the on-site pilot tests the pretreatment process was modified and consisted of the following steps:
(1) Sulfuric acid was added to reduce the pH to about 2.5. This effectively killed the algae.
(2) Caustic was then added to increase the pH to about 7.0 and precipitate hydroxyapatite. This reduced the calcium concentration to less than 100 mg/L.
(3) Flocculant was added to aid in solids settling and the solution was sent to a clarifier for solids separation.
(4) The pH of the clarifier overflow was reduced to about 2.5 again by the addition of more sulfuric acid. This increased the solubility of the calcium remaining in solution and stabilized the pond water with respect to further precipitation.
At this point, the pretreated pond water would be fed to the 1st pass R.O. unit. PINEY POINT DEMONSTRATION PLANT
As mentioned above, during the preliminary design phases for the Piney Point R.O. plant, use of some of the existing double liming equipment was contemplated. The main equipment that was to be used was one of the lime addition tanks and one of the large in-ground clarifiers. However, as the project progressed, it was determined that this equipment would not be available, since both clarifiers were being used for double liming. Thus, design changes were required in the demonstration plant to provide clarifiers for the pond water and hydroxyapatite solids. Also, since time and budgetary constraints precluded the field fabrication of an adequately sized single clarifier, four small clarifiers, operating in parallel, were used for the solids separation. Two of these tanks were flat bottom tanks that had previously been intended for the lime addition function. The other two tanks were cone bottom tanks purchased specifically as clarifiers. Unfortunately, all four smaller clarifiers provided only about 16% of the settling area of the single in-ground clarifier. Thus, based on the pilot plant data, it was anticipated that overall, sustainable, plant rates would be limited to about 1050 GPM feed to the clarifiers. Figures 2, 3 and 4 show piping and instrument diagrams for the R.O. demonstration plant as originally built at Piney Point.

14
Figure 2. Piney Point Pretreatment P&ID.

15
Figure 3. Piney Point 1st Pass R.O. System P&ID.

16
Figure 4. Piney Point 2nd Pass R.O. and Final Treatment P&ID.

17
RESULTS PRELIMINARY BATCH PRETREATMENT AND SMALL-SCALE R.O. TESTS
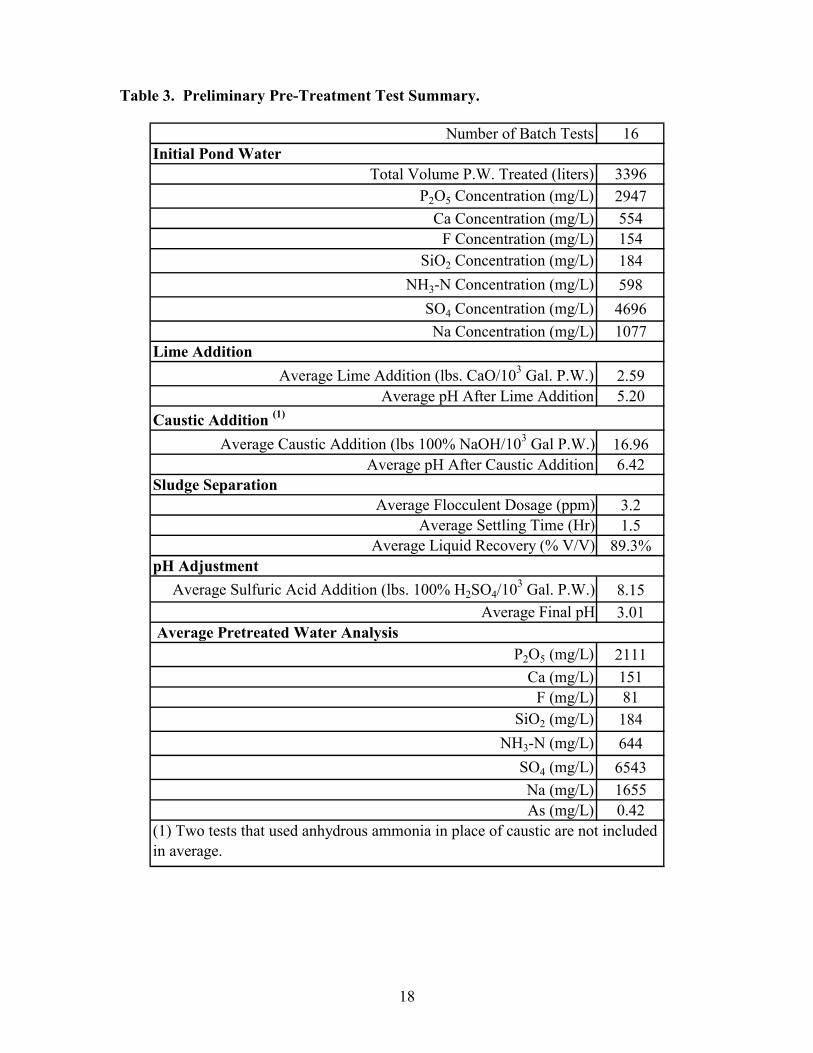
The initial batch pretreatment and small-scale R.O. tests conducted with the Piney Point pond water in early 2002, were used primarily to determine the overall feasibility of the project and to develop initial cost estimates. Thus, the results of these tests will not be covered in any significant detail. Tables 3 and 4 show the average results from all pretreatment tests and all 1st pass R.O. tests respectively. Most of these tests were run at similar conditions. Thus the averages present a valid picture of the results. Table 5 shows the results for the 2nd pass R.O. tests. For the 2nd pass R.O. tests conditions were varied significantly from one test to the next, mainly to determine the minimum pH needed for effective fluoride removal. Thus Table 5 contains a column with the range of conditions and results in addition to the averages. One factor worth noting with regard to the 1st pass R.O. tests is that all the preliminary first pass R.O. tests were run at a membrane feed pressure of 600 psig to match the maximum allowable pressure for the brackish water membranes used. Later 1st pass R.O. tests were run at a membrane feed pressure of 400 psig, to match the maximum allowable pressure of the large-scale R.O. modules that were used at the Piney Point demonstration plant. Based on the data, for the 600 psig and 400 psig test, it appears that the higher pressure had the effect of boosting the permeate recovery by about 10% and the permeate flux rate by about 5-6 gallons per day per square foot of membrane area (GFD).
Since it was known, based on these preliminary tests and the earlier U.S. Filter R.O. tests, that even a two pass R.O. process could not reduce the nitrogen concentration (mainly NH3 nitrogen) to the level required for discharge at Piney Point, a “quick and dirty” test was run with 55 gallons of the 2nd pass permeate from the above tests and a water softener ion exchange resin. The unit used was a conventional, household type unit, containing about 1 ft3 of resin and the permeate was pumped through the unit at about 1.5 GPM. The analysis of the final permeate is shown in Table 6.
18
Table 3. Preliminary Pre-Treatment Test Summary.
Number of Batch Tests 16
Total Volume P.W. Treated (liters) 3396P2O5 Concentration (mg/L) 2947
Ca Concentration (mg/L) 554F Concentration (mg/L) 154
SiO2 Concentration (mg/L) 184NH3-N Concentration (mg/L) 598
SO4 Concentration (mg/L) 4696Na Concentration (mg/L) 1077
Average Lime Addition (lbs. CaO/103 Gal. P.W.) 2.59Average pH After Lime Addition 5.20
Average Caustic Addition (lbs 100% NaOH/103 Gal P.W.) 16.96Average pH After Caustic Addition 6.42
Average Flocculent Dosage (ppm) 3.2Average Settling Time (Hr) 1.5
Average Liquid Recovery (% V/V) 89.3%
Average Sulfuric Acid Addition (lbs. 100% H2SO4/103 Gal. P.W.) 8.15Average Final pH 3.01
P2O5 (mg/L) 2111Ca (mg/L) 151
F (mg/L) 81SiO2 (mg/L) 184
NH3-N (mg/L) 644SO4 (mg/L) 6543Na (mg/L) 1655As (mg/L) 0.42
Initial Pond Water
Average Pretreated Water Analysis
pH Adjustment
Sludge Separation
Caustic Addition (1)
(1) Two tests that used anhydrous ammonia in place of caustic are not included in average.
Lime Addition

19
Table 4. Preliminary 1st Pass R.O. Test Summary.
Number of Tests1 12Total R.O. Operating Time (Hr:Min) 78:37
Average Feed Pressure (psig) 599Average Permeate Recovery (% V/V) 79.0%Average Permeate Flux Rate (GFD)2 15.48
Average Permeate Conductivity (µmho/cm) 310
P2O5 (mg/L) 15.3Ca (mg/L) 0.8
F (mg/L) 44.3SiO2 (mg/L) 2.2
NH3-N (mg/L) 14.6SO4 (mg/L) 55.3Na (mg/L) 16.6As (mg/L) 0.01
P2O5 (mg/L) 8885Ca (mg/L) 574
F (mg/L) 309SiO2 (mg/L) 671
NH3-N (mg/L) 2891SO4 (mg/L) 26166Na (mg/L) 6770As (mg/L) 1.61
(1) Two additional tests run with physically damaged membrane. Data not included.(2) Gallons per day per square foot of membrane area.
Average Permeate Analysis
Average Reject Analysis

20
Table 5. Preliminary 2nd Pass R.O. Test Summary.
Number of TestsTotal R.O. Operating Time (Hr:Min)
Average RangeLbs 100% NaOH/103 Gal. 1st Pass Permeate 0.92 0.48 - 1.73
Feed pH 9.10 7.97 - 9.52Feed Pressure (psig) 300 200 - 350
Permeate Recovery (% V/V) 93.7% 89% - 96%Permeate Flux Rate (GFD)1 19.08 10.5 - 28.4
Permeate Conductivity (µmho/cm) 40 32 - 74
P2O5 (mg/L) 0.36 0.21 - 0.46Ca (mg/L) 0.10 0.1
F (mg/L) 2.55 0.46 - 5.61SiO2 (mg/L) 1.94 0.7 - 3.0
NH3-N (mg/L) 8.24 2.61 - 23.6SO4 (mg/L) 1.0 1.0Na (mg/L) 5.53 3.6 - 8.1As (mg/L) <MDL <MDL
P2O5 (mg/L) 383 196 - 952Ca (mg/L) 45.2 5.0 - 186
F (mg/L) 558 397 - 821SiO2 (mg/L) 53.3 0.7 - 3.0
NH3-N (mg/L) 212 123 - 309SO4 (mg/L) 896 548 - 2049Na (mg/L) 1001 680 - 1710As (mg/L) 0.062 0.062
838:06
Permeate Analysis
Reject Analysis
(1) Gallons per day per square foot of membrane area.
21
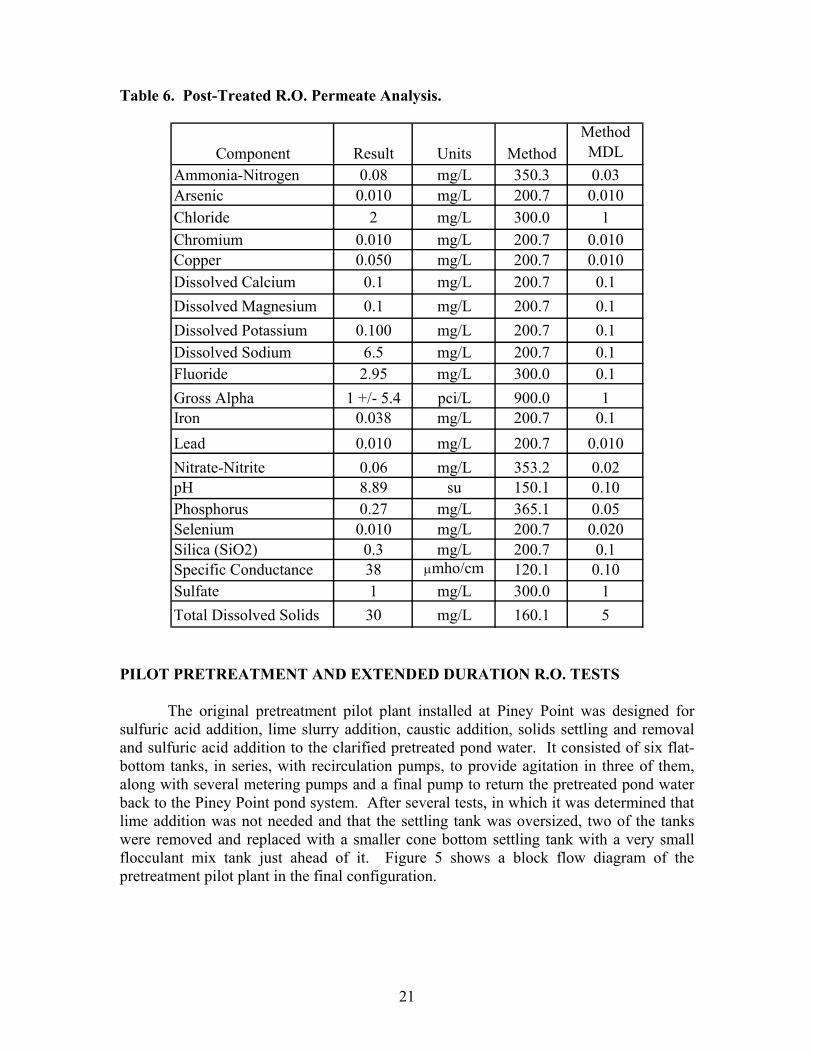
Table 6. Post-Treated R.O. Permeate Analysis.
Component Result Units MethodMethod MDL
Ammonia-Nitrogen 0.08 mg/L 350.3 0.03Arsenic 0.010 mg/L 200.7 0.010Chloride 2 mg/L 300.0 1Chromium 0.010 mg/L 200.7 0.010Copper 0.050 mg/L 200.7 0.010Dissolved Calcium 0.1 mg/L 200.7 0.1Dissolved Magnesium 0.1 mg/L 200.7 0.1Dissolved Potassium 0.100 mg/L 200.7 0.1Dissolved Sodium 6.5 mg/L 200.7 0.1Fluoride 2.95 mg/L 300.0 0.1Gross Alpha 1 +/- 5.4 pci/L 900.0 1Iron 0.038 mg/L 200.7 0.1Lead 0.010 mg/L 200.7 0.010Nitrate-Nitrite 0.06 mg/L 353.2 0.02pH 8.89 su 150.1 0.10Phosphorus 0.27 mg/L 365.1 0.05Selenium 0.010 mg/L 200.7 0.020Silica (SiO2) 0.3 mg/L 200.7 0.1Specific Conductance 38 µmho/cm 120.1 0.10Sulfate 1 mg/L 300.0 1Total Dissolved Solids 30 mg/L 160.1 5
PILOT PRETREATMENT AND EXTENDED DURATION R.O. TESTS
The original pretreatment pilot plant installed at Piney Point was designed for sulfuric acid addition, lime slurry addition, caustic addition, solids settling and removal and sulfuric acid addition to the clarified pretreated pond water. It consisted of six flat-bottom tanks, in series, with recirculation pumps, to provide agitation in three of them, along with several metering pumps and a final pump to return the pretreated pond water back to the Piney Point pond system. After several tests, in which it was determined that lime addition was not needed and that the settling tank was oversized, two of the tanks were removed and replaced with a smaller cone bottom settling tank with a very small flocculant mix tank just ahead of it. Figure 5 shows a block flow diagram of the pretreatment pilot plant in the final configuration.

22
Figure 5. Block Flow Diagram of Piney Point Pretreatment Pilot Plant.
Pilot plant operation at Piney Point commenced on November 6, 2003, and continued until January 19, 2004. As with most pilot operations, there was considerable refinement of equipment and process during the early tests. However, by December 8, 2003, the process configuration had been finalized and control was judged adequate to justify collecting a large sample of the pretreated water and processing it through our small-scale (~0.15 GPM) pilot R.O. system. Table 7 shows summary data for the December 8 pretreatment test.
Tank 4 Sludge Settler
Tank 6 Final pH
Adjustment Mix Tank
Sludge SolidsReturn
H2SO
Pretreated Pond Water Return
Tank 1 H2SO4
Mix Tank
Tank 2 Surge Tank
(Former CaO
Addition)
Tank 3 Caustic
Mix Tank
Floc. Addition
Tank
This tank equipped with external mixer
H2SO4
Circulation, Mixing Loop
(Typ.) 25% NaOH
0.5% FlocculantSolution
Raw Pond Water
Solids Recycle

23
Table 7. Pretreatment Pilot Test Summary Dec. 8, 2003.
Test Date 12/8/2003 Average Pond Water Feed Rate (GPM) 18.6
Total Gallons Pond Water Fed 5425 Feed Pond water pH 3.40
H2SO4 Tank Average pH 2.51 lbs. 100% H2SO4/103 Gal. PW 5.78
Caustic Tank Average pH 6.44 lbs. 100% NaOH/103 Gal. PW 13.62
Average Flocculant Rate (ppm) 2.44 Average Clarifier U/F Rate (GPM) 2.45 Clarifier Loading GPM/Ft2 (Feed) 1.93
Final pH Adjustment Tank pH 2.89 Final pH Adjustment – lbs. 100% H2SO4/103 Gal. PW 9.79
Total Sulfuric Acid – lbs. 100% H2SO4/103 Gal. PW 15.56 Average Product Water Flow (GPM) 17.2 Total Gallons Pretreated Pond Water 4711
Pretreatment Recovery (% V/V) 87% Product Water Analysis
Sp. Gr. 1.0087 pH 2.89
Conductivity µmhos 12,200 mg/L Ca 159
mg/L P 858 mg/L F 50.8
mg/L SO4 6256 mg/L Na 2070
Cost Data H2SO4 98% (Tank 1) $0.10
NaOH $1.99 Flocculant $0.13
H2SO4 (Tank 6) $0.14 Total ($/1000 Gal. Pretreated Water) $2.36
H2SO4 cost $25/ton; NaOH cost $225/ton; Floc. cost $0.7535/lb.
24
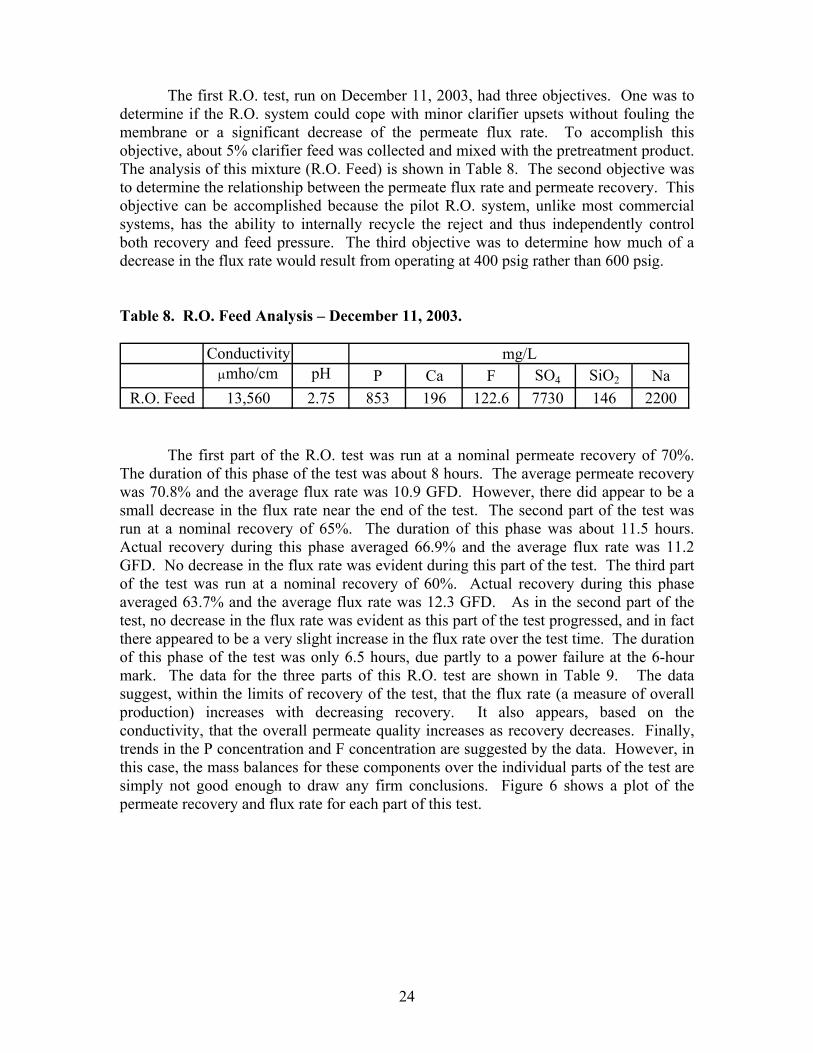
The first R.O. test, run on December 11, 2003, had three objectives. One was to determine if the R.O. system could cope with minor clarifier upsets without fouling the membrane or a significant decrease of the permeate flux rate. To accomplish this objective, about 5% clarifier feed was collected and mixed with the pretreatment product. The analysis of this mixture (R.O. Feed) is shown in Table 8. The second objective was to determine the relationship between the permeate flux rate and permeate recovery. This objective can be accomplished because the pilot R.O. system, unlike most commercial systems, has the ability to internally recycle the reject and thus independently control both recovery and feed pressure. The third objective was to determine how much of a decrease in the flux rate would result from operating at 400 psig rather than 600 psig. Table 8. R.O. Feed Analysis – December 11, 2003.
Conductivityµmho/cm pH P Ca F SO4 SiO2 Na
R.O. Feed 13,560 2.75 853 196 122.6 7730 146 2200
mg/L
The first part of the R.O. test was run at a nominal permeate recovery of 70%. The duration of this phase of the test was about 8 hours. The average permeate recovery was 70.8% and the average flux rate was 10.9 GFD. However, there did appear to be a small decrease in the flux rate near the end of the test. The second part of the test was run at a nominal recovery of 65%. The duration of this phase was about 11.5 hours. Actual recovery during this phase averaged 66.9% and the average flux rate was 11.2 GFD. No decrease in the flux rate was evident during this part of the test. The third part of the test was run at a nominal recovery of 60%. Actual recovery during this phase averaged 63.7% and the average flux rate was 12.3 GFD. As in the second part of the test, no decrease in the flux rate was evident as this part of the test progressed, and in fact there appeared to be a very slight increase in the flux rate over the test time. The duration of this phase of the test was only 6.5 hours, due partly to a power failure at the 6-hour mark. The data for the three parts of this R.O. test are shown in Table 9. The data suggest, within the limits of recovery of the test, that the flux rate (a measure of overall production) increases with decreasing recovery. It also appears, based on the conductivity, that the overall permeate quality increases as recovery decreases. Finally, trends in the P concentration and F concentration are suggested by the data. However, in this case, the mass balances for these components over the individual parts of the test are simply not good enough to draw any firm conclusions. Figure 6 shows a plot of the permeate recovery and flux rate for each part of this test.

25
Table 9. R.O. Summary Data, December 11, 2003 R.O. Test.
Test Part 1 2 3Test Time (Hr:Min) 8:05 11:30 5:45
Average Feed Pressure (psig) 400 400 400Average Permeate Recovery (% V/V) 70.8% 66.1% 63.7%Average Permeate Flux Rate (GFD)1 10.9 11.2 12.3
Average Permeate Conductivity (µmho/cm) 747 616 585Composite Permeate Analysis
P (mg/L) 2.9 1.9 1.6Ca (mg/L) 0.4 0.3 0.3
F (mg/L) 26.8 32.3 109.1SiO2 (mg/L) 1.2 0.8 0.6SO4 (mg/L) 25.0 12.0 28.0Na (mg/L) 6.5 3.9 3.7
Average Reject AnalysisConductivity (µmho/cm) 35,900 32,617 30,600
P (mg/L) 3135 2613 2638Ca (mg/L) 651 610 575
F (mg/L) 150 100 87SiO2 (mg/L) 224 348 384SO4 (mg/L) 25,569 20,900 18,797Na (mg/L) 6620 5370 5420
(1) Gallons per day per square foot of membrane area.

26
50%
55%
60%
65%
70%
75%
80%
85%
90%
95%
100%
0:00:00 0:04:48 0:09:36 0:14:24 0:19:12 1:00:00 1:04:48
Operating Time (d:hh:mm)
Rec
over
y (%
)
0
2
4
6
8
10
12
14
16
Flux
Rat
e (G
FD)
Recovery (Perm/Total)Flux Rate (GFD)
70.8% Recovery 66.1% Recovery 63.7% Recovery
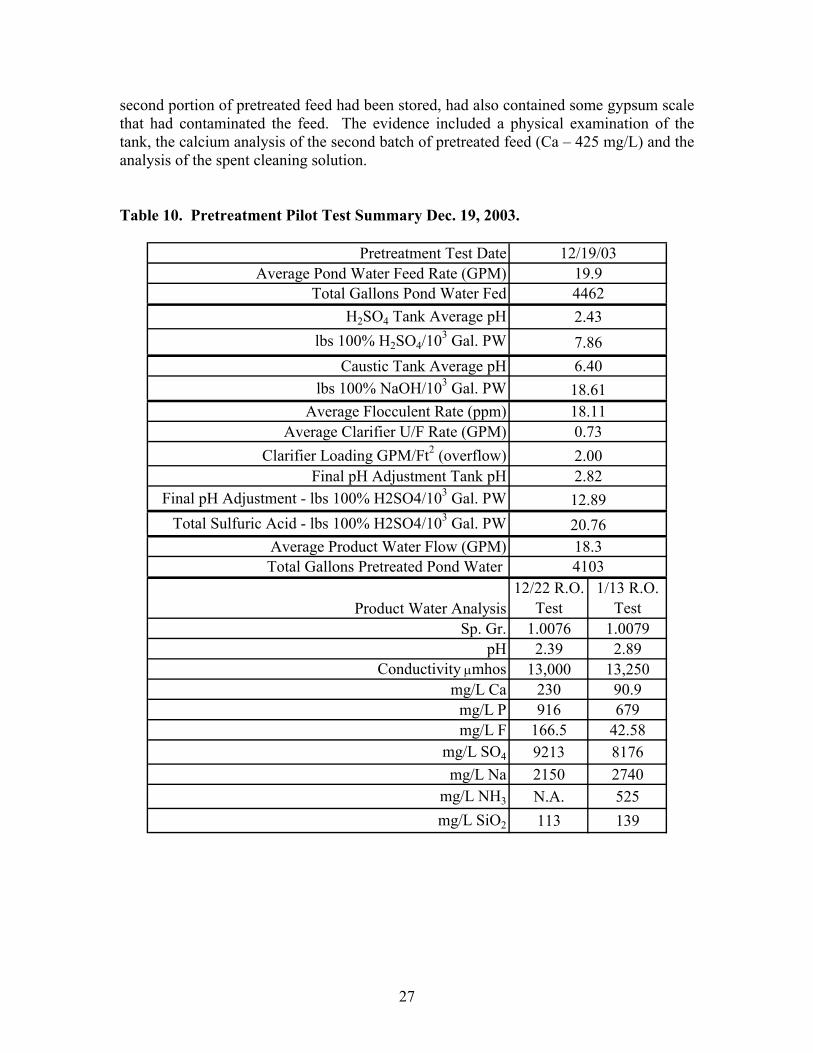
Figure 6. Recovery and Flux Rate for December 11, 2003 R.O. Test. A second R.O. test was run on December 22, 2003 with pretreated pond water produced at the Piney Point pilot plant on December 19. Two large (~600 gallon) samples of pretreated water were collected during the pretreatment test, with the first being processed through the R.O. system on December 22, 2003. Table 10 shows the pretreatment test conditions and the analyses of the two samples collected for R.O. testing. The December 22 test is of interest because the calcium concentration in the pretreated feed was 230 ppm. This is somewhat higher than would normally be considered acceptable for feeding to the R.O. and about 17% higher than the previous test where the pretreated pond water was intentionally contaminated with some clarifier feed. Figure 7 shows a plot of the permeate recovery and flux rate for this test. As can be seen in this figure, after about 10 hours’ operation the flux rate started a gradual decline. Recovery was intentionally reduced in an effort to restore, or at least halt, the decrease in the flux rate. At about the 19-hour mark the flux rate again stabilized at about 7.8 GFD with a recovery of about 57%-58%. At about the 25-hour mark, the membrane was flushed (i.e., the reject valve opened completely) for about 1 minute with DI water and then for about 6 minutes with permeate. This restored the flux rate to about 9.2 at a recovery of about 61%. At the 33-hour mark the R.O. unit was shut down, with a brief membrane flush, to refill the feed tanks. The new feed was from the same pretreatment sample, but had been stored in a separate utility tank. When the R.O. system was re-started the flux rate and recovery immediately started falling rapidly. After about 2½ hours with the flux rate at 4.1 GFD and the recovery at 40.9%, the unit was again shut down and the test terminated. Table 11 shows the average permeate recovery and flux rate for the R.O. system while on the original feed and after the switch to the new feed. Several days after the end of the test, the membrane was subjected to a high pH cleaning cycle. In a postmortem of this test it was determined that the utility tank, in which the
27
second portion of pretreated feed had been stored, had also contained some gypsum scale that had contaminated the feed. The evidence included a physical examination of the tank, the calcium analysis of the second batch of pretreated feed (Ca – 425 mg/L) and the analysis of the spent cleaning solution. Table 10. Pretreatment Pilot Test Summary Dec. 19, 2003.
Pretreatment Test DateAverage Pond Water Feed Rate (GPM)
Total Gallons Pond Water FedH2SO4 Tank Average pH
lbs 100% H2SO4/103 Gal. PWCaustic Tank Average pH
lbs 100% NaOH/103 Gal. PWAverage Flocculent Rate (ppm)
Average Clarifier U/F Rate (GPM)Clarifier Loading GPM/Ft2 (overflow)
Final pH Adjustment Tank pHFinal pH Adjustment - lbs 100% H2SO4/103 Gal. PW
Total Sulfuric Acid - lbs 100% H2SO4/103 Gal. PWAverage Product Water Flow (GPM)Total Gallons Pretreated Pond Water
Product Water Analysis12/22 R.O.
Test1/13 R.O.
TestSp. Gr. 1.0076 1.0079
pH 2.39 2.89Conductivity µmhos 13,000 13,250
mg/L Ca 230 90.9mg/L P 916 679mg/L F 166.5 42.58
mg/L SO4 9213 8176mg/L Na 2150 2740
mg/L NH3 N.A. 525mg/L SiO2 113 139
12/19/0319.944622.437.866.4018.6118.11
20.7618.34103
0.732.002.8212.89

28
40%
45%
50%
55%
60%
65%
70%
75%
80%
85%
90%
0:00:00 0:04:48 0:09:36 0:14:24 0:19:12 1:00:00 1:04:48 1:09:36
Time (d:hh:mm)
Rec
over
y (%
)
0.0
2.0
4.0
6.0
8.0
10.0
12.0
14.0
Flux
Rat
e (G
FD)
RecoveryFlux (GFD) New Feed StartMembrane Flush
With Permeate
Figure 7. Recovery and Flux Rate for December 22, 2003 R.O. Test. Table 11. R.O. Summary Data, December 22, 2003 R.O. Test.
Original Feed
Contaminated Feed
Test Time (Hr) 33 2 1/2Average Feed Pressure (psig) 400 400
Average Permeate Recovery (% V/V) 62.0% 55.6%Average Permeate Flux Rate (GFD)1 9.4 7.4
(1) Gallons per day per square foot of membrane area.
A third R.O. test was started on January 13, 2004. This test was run with the same R.O. membrane (after cleaning) as the previous test and with the second large sample of pretreated pilot plant pond water produced on December 19, 2003. This was intended to be an extended duration test with the R.O. being run for three days with no membrane flush or cleaning cycles. The summary data for this test are shown in Table 12 and a plot of the permeate recovery and flux rate is shown in Figure 8. Based on the permeate flux rate, it was evident that the membrane cleaning performed after the fouling caused by the high calcium feed water was only partially successful. The initial flux rate was lower than the initial flux rate during the December 22 test and over the first 12 hours decreased further. However, after 12 hours the flux rate stabilized and continued at an essentially constant level for the remainder of the test.

29
Table 12. R.O. Summary Data, January 13, 2004 R.O. Test.
Test Time (Hr) 72Average Feed Pressure (psig) 401
Average Permeate Recovery (% V/V) 59.6%Average Permeate Flux Rate (GFD)1 8.5
Average Permeate Conductivity (µmho/cm) 490Average Permeate Analysis
P (mg/L) 7.2Ca (mg/L) 0.5
F (mg/L) 44.6NH3 (mg/L) 12.0SiO2 (mg/L) 2.5SO4 (mg/L) 59.4Na (mg/L) 44.7
Average Reject AnalysisConductivity (µmho/cm) 29,125
P (mg/L) 1671Ca (mg/L) 217
F (mg/L) 143NH3 (mg/L) 1255SiO2 (mg/L) 343SO4 (mg/L) 19,117Na (mg/L) 6352
(1) Gallons per day per square foot of membrane area. An incident that occurred during the January 13 R.O. test is worth noting and illustrates the handicap that the Piney Point demonstration plant was forced to operate under by being limited to a feed pressure of 400 psig. The small R.O. used for these tests does not have any automatic controls and requires fairly constant operator attention to regulate the feed pressure. At a point about 12 hours after the start of the test, the feed pressure was inadvertently allowed to briefly increase to 650 psig. During this episode, the reject rate remained constant but the permeate rate increased dramatically. Recovery increased to 74.9% and the flux rate increased to 16.5 GFD, with no change in the permeate conductivity. Thus, it is reasonable to expect that recovery would have been significantly higher at the demonstration plant if a higher pressure R.O. were available, particularly since the membrane in use during this test was already somewhat compromised by the fouling from the previous test.
30
30%
40%
50%
60%
70%
80%
90%
0:00:00 0:12:00 1:00:00 1:12:00 2:00:00 2:12:00 3:00:00
Operating Time (d:hh:mm)
Rec
over
y (%
)
4
6
8
10
12
14
16
Flux
Rat
e (G
FD)
RecoveryFlux Rate
Pressure Excersion (to 650 psi)
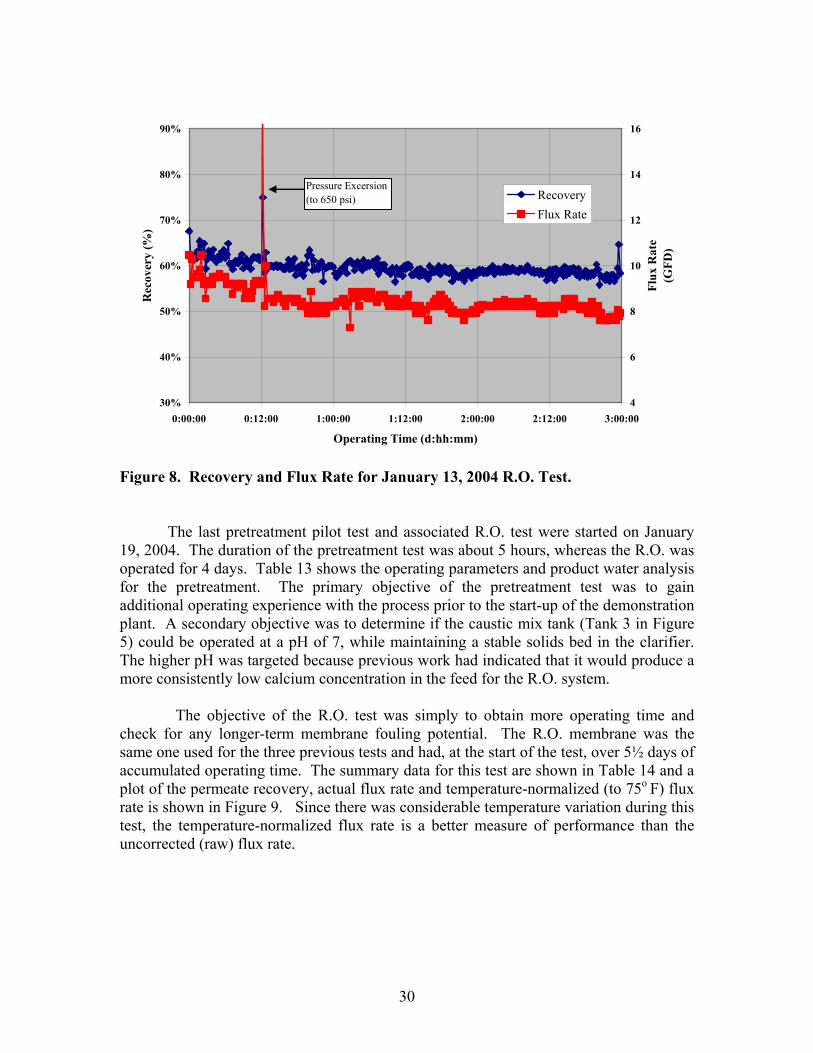
Figure 8. Recovery and Flux Rate for January 13, 2004 R.O. Test.
The last pretreatment pilot test and associated R.O. test were started on January 19, 2004. The duration of the pretreatment test was about 5 hours, whereas the R.O. was operated for 4 days. Table 13 shows the operating parameters and product water analysis for the pretreatment. The primary objective of the pretreatment test was to gain additional operating experience with the process prior to the start-up of the demonstration plant. A secondary objective was to determine if the caustic mix tank (Tank 3 in Figure 5) could be operated at a pH of 7, while maintaining a stable solids bed in the clarifier. The higher pH was targeted because previous work had indicated that it would produce a more consistently low calcium concentration in the feed for the R.O. system.
The objective of the R.O. test was simply to obtain more operating time and
check for any longer-term membrane fouling potential. The R.O. membrane was the same one used for the three previous tests and had, at the start of the test, over 5½ days of accumulated operating time. The summary data for this test are shown in Table 14 and a plot of the permeate recovery, actual flux rate and temperature-normalized (to 75o F) flux rate is shown in Figure 9. Since there was considerable temperature variation during this test, the temperature-normalized flux rate is a better measure of performance than the uncorrected (raw) flux rate.

31
Table 13. Pretreatment Pilot Test Summary Jan. 19, 2004.
Test Date 1/19/2004Average Pond Water Feed Rate (GPM) 23.0
Total Gallons Pond Water Fed 6959H2SO4 Tank Average pH 2.45
lbs 100% H2SO4/103 Gal. PW 9.84Caustic Tank Average pH 7.00
lbs 100% NaOH/103 Gal. PW 22.20Average Flocculent Rate (ppm) 20.6
Average Clarifier U/F Rate (GPM) 4.6Clarifier Loading GPM/ft2 (overflow) 1.91
Clarifier Overflow Solids (Wt. %) 0.014%Clarifier Underflow Solids (Wt. %) 1.37%
Final pH Adjustment Tank pH 3.04Final pH Adjustment - lbs 100% H2SO4/103 Gal. PW 7.22
Total Sulfuric Acid - lbs 100% H2SO4/103 Gal. PW 17.06Average Product Water Flow (GPM) 18.21Total Gallons Pretreated Pond Water 5529
Product Water AnalysisSp. Gr. 1.0065
pH 3.07Conductivity µmhos 11,900
mg/L Ca 115mg/L P 776mg/L F 36
mg/L SO4 7612mg/L Na 2510
During approximately the first 38 hours of the test the normalized flux rate and recovery remained relatively stable. The normalized flux rate then started to drop gradually and reached a value about 7% below the earlier average after 45 hours of operation. This also occurred in the early morning hours during the coldest part of the day. At this time the recovery was reduced in an effort to compensate for the lower flux rate. This action restored the flux rate but resulted in a 2.7% decrease in recovery. The decision was then made to flush the R.O. membrane with permeate (as an alternative to a conventional high pH cleaning cycle). The membrane flush resulted in about 1 hour of “down time.” After the membrane flush, both the permeate recovery and flux rate were restored to the former values. The R.O. system was then operated for an additional 48 hours. During this latter portion of the test the recovery remained relatively constant, but there was a slight decrease in the flux rate. Thus, it was concluded that some form of membrane flush or cleaning would be required every 2 days.

32
Table 14. R.O. Summary Data, January 19-23, 2004 R.O. Test.
Test Time (Hr) 97Average Feed Pressure (psig) 400
Average Permeate Recovery (% V/V) 60.4%Average Permeate Flux Rate (GFD)1 8.7
Average Permeate Conductivity (µmho/cm) 409Average Permeate Analysis
P (mg/L) 6.1Ca (mg/L) 0.5
F (mg/L) 35.3NH3 (mg/L) 11.0
SO4 (mg/L) 47.6Na (mg/L) 33.5
Average Reject AnalysisConductivity (µmho/cm) 26,981
P (mg/L) 1763Ca (mg/L) 337
F (mg/L) 37NH3 (mg/L) 1299
SO4 (mg/L) 18,261Na (mg/L) 6010
(1) Gallons per day per square foot of membrane area.

33
30%
40%
50%
60%
70%
80%
0:00:00 0:12:00 1:00:00 1:12:00 2:00:00 2:12:00 3:00:00 3:12:00 4:00:00Operating Time (d:hh:mm)
Rec
over
y (%
)
4
6
8
10
12
14
16
Flux
Rat
e (G
FD)
RecoveryRaw Flux RateNormalized Flux Rate
Permeate Flush
Figure 9. Recovery and Flux Rates for January 19-23, 2004 R.O. Test. PINEY POINT DEMONSTRATION PLANT RESULTS Demonstration Plant Construction The contract between Florida Pines LLC and Louis Timchak, the court-appointed receiver of the Piney Point phosphogypsum stack, for water treatment at Piney Point was executed on October 7, 2003. Detail design work for the plant started immediately and a 20 GPM pretreatment pilot plant was on-site by end of October. The contract specified that Florida Pines must demonstrate acceptable water quality for discharge, at a rate of 400,000 GPD, for five consecutive days (Phase II) by December 30. This milestone was not met and, in fact the plant did not start up until February 17, 2004. Among the many factors that delayed construction and start-up, one of the primary factors was that the fabricator of many of the tanks did not meet the promised delivery schedule. This held up piping and electrical work on a large percentage of the project due to the location of these tanks. In an effort to compensate for the delivery delay, once the tanks were delivered virtually all construction work proceeded on a 12 hour-per-day, 6 day-per-week schedule. However, this accelerated construction schedule was very costly. Table 15 shows a comparison of the original estimated costs, actual costs and the portion of actual costs due to the accelerated construction schedule. Other causes of the construction delay and cost over-run were changes in the process necessitated by changes in the pond water chemistry and unanticipated repairs required by the 2nd pass R.O. pumps. Figures 10 and

34
11 are two photographs showing the plant near the end of construction. The completed plant consisted of a single-train pretreatment system, two 1st pass R.O. units, two 2nd pass R.O. units and five parallel post-treatment ion exchange vessels. Figure 12 shows a block flow diagram of the plant, with the various tanks and equipment in the same relative locations as originally installed at Piney Point. Table 15. Piney Point Estimated Costs, Actual Costs and Accelerated Construction Related Costs.
ItemOriginal Estimate Actual Cost
Accelerated Construction
CostsEngineering Services $250,000 $80,800Pretreatment and Storage Tanks $175,000 $305,030Secondary Containment for Sulfuric Acid Storage $0 $12,000Miscellaneous Pumps $100,000 $141,310Agitators $100,000 $88,560Bag Filter Units and Filters $23,179RO Units $3,717RO Membranes $100,000 $122,208RO Pumps $0 $42,704
Ion Exchange System $26,900Ion Exchange Media $5,825Electrical Controls, Panels, Instrumentation $100,000 $46,268Safety Equipment $0 $10,300Miscellaneous Supplies and Equipment $10,000 $10,910Installation of Tank Stands, Stillwells, Baffles, Agitator Supports, and Mountings and Placement of Tanks
$100,000 $136,025 $36,025
Installation of Piping and Pumps $200,000 $638,282 $438,282Installation of Electrical Infrastructure and Control $100,000 $395,247 $295,247Refurbishing of RO Units $0 $93,230Pretreatment Chemicals $166,844Flocculant $12,086Utilities $590Totals $1,235,000 $2,362,015 $769,554

35
Figure 10. Piney Point Demonstration Plant from South End.
Figure 11. Piney Point Demonstration Plant from Northeast End.

36
Figure 12. Piney Point Demonstration Plant Equipment Arrangement. Demonstration Plant Start-Up and Phase II Milestone Attainment The pretreatment section of the demonstration plant was started up about February 15, 2004 and run for several days to establish control and verify operating procedures. Intermittent R.O. operation was started on February 18, 2004. During the first several days of operation various start-up problems were identified, and, where possible, corrected. With a new process being run mainly by inexperienced operators, some start-up problems are to be anticipated. By February 23, operation was essentially continuous using one of the two R.O. trains. Only one R.O. train was operated at any one time due to pumping limitations (insufficient flow) of the R.O. feed pump. Other problems that contributed to the limited rates included the inability to operate the plant feed water flow and caustic addition in automatic mode, pumping problems with the clarifier underflow streams and limited surge capacity between pretreatment and the R.O. system. On February 25, the first R.O. membrane cleaning cycle was performed. The unit was flushed with permeate and cleaned with HCl and NaOH solutions. Analysis of the cleaning solutions indicated that only the short permeate flush would have been
RejectDischarge
Well Water& H2SO4
T-205Permeate
pH Control
T-204Permeate
pH Control
To T-203A
IX-100IX
Media
IX-200IX
Media
T-208Brine
Storage
IX-300IX
Media
IX-500IX
Media
IX-400IX
MediaT-107
CausticStorage
Not Shown - H2SO4
Storage TankT-207
IX MediaFeed
T-103A & BUnderflow
Permeate
T-105ARaw Water
pH Adjustment
T-203BFinal
Permeate
T-203AFinal
Permeate
T-206RejectTank
R.O. 2B2nd Pass
H2SO4
2nd Pass R.O. Feed
Reject
DischargePermeate
Raw P.W.
T-201pH Adjust2nd R.O.
Feed
R.O. 2A2nd Pass
Reject
PermeateR.O. 1A1st Pass
R.O. 1B1st Pass Permeate
NaOH from T-107
Reject
1st Pass R.O. Feed
Bag Filters - 4
H2SO4 T-104
pH AdjustmentR.O. Feed
T-106Clarifier
Flat Bottom
T-105BRaw Water
pH Adjustment
T-102Caustic
Addition
T-101 Underflow
T-110FlocculentAdditionT-106 Underflow
NaOH
T-103BClarifier
Cone Bottom
T-103AClarifier
Cone Bottom
T-101Clarifier
Flat Bottom
Underflow
Clarifier Overflows
NaOH

37
sufficient. Table 16 shows the daily and total permeate production from initial start-up through the end of February and Table 17 shows February permeate composite analysis. Table 16. Florida Pines Permeate Production – February 2004.
Date 2004
Daily Production
Gallons
Monthly Total
Gallons Notes
19-Feb 255,195 255,195Reported production 187,682 gallons due to 67,513 gallons being off spec.
20-Feb 53,529 308,724Production not counted due to error in chart recorder alignment.
21-Feb 30,876 339,600
22-Feb 0 339,600R.O.s down to allow instrument tuning in pretreatment.
23-Feb 225,900 565,500
24-Feb 358,454 923,954
25-Feb 289,227 1,213,181
26-Feb 366,868 1,580,049
27-Feb 322,178 1,902,227
28-Feb 7,166 1,909,393
29-Feb 315,584 2,224,977

38
Table 17. Florida Pines February 2004 Permeate Composite Analysis.
Component Result Units MethodMethod MDL
Aluminum 0.033 mg/L 6010 0.0033Ammonia-Nitrogen 0.090 mg/L 350.3 0.040Antimony 0.0050 mg/L 6010 0.0050Arsenic 0.0032 mg/L 6010 0.0032Asbestos <0.182 mf/L TEM 0.182Barium 0.0012 mg/L 6010 0.0012Beryllium 0.00054 mg/L 6010 0.00054Cadmium 0.00071 mg/L 6010 0.00071Calcium 5.1 mg/L 6010 0.044Chromium 0.0017 mg/L 6010 0.0017Copper 0.00090 mg/L 6010 0.00090Cyanide 0.010 mg/L 335.3 0.0050Fluoride 2.0 mg/L 340.2 0.044Gross Alpha 0.0421 +/- 0.41 pci/L 900.0Lead 0.0015 mg/L 6010 0.0015Magnesium 2.2 mg/L 6010 0.11Manganese 0.0014 mg/L 6010 0.0014Nickel 0.0047 mg/L 6010 0.0047Nitrate-N 0.36 mg/L 353.2 0.010Nitrite-N 0.47 mg/L 353.2 0.010Ortho Phosphorus 0.56 mg/L 365.2 0.0090Phosphorus - Total 0.65 mg/L 365.2 0.017pH 6.9 su 150.1Potassium 0.19 mg/L 6010 0.19Selenium 0.0042 mg/L 6010 0.0042Silica (SiO2) 1.2 mg/L 6010 0.10Sodium 12 mg/L 6010 0.31Specific Conductance 110 µmho/cm 120.1 5.0Sulfate as SO4 19 mg/L 375.4 1.7Thallium 0.0049 mg/L 6010 0.0049
Operations continued through March 2004 with generally higher permeate volumes discharged and more consistent operation. The Phase II milestone (average 400,000 gallons per day discharge for 5 consecutive days) was met on March 18. Total permeate production for March 2004 was 10.2 million gallons, with an average daily production of 329,088 gallons. Figure 13 shows the daily discharge permeate production for March, and Table 18 shows the composite permeate analysis. All permeate produced during March met all criteria for discharge.

39
050
100150200250300350400450500
3/1 3/4 3/7 3/10 3/13 3/16 3/19 3/22 3/25 3/28 3/31Date
Tho
usan
d G
allo
ns P
erm
eate
Phase II Milestone Achieved
Figure 13. Florida Pines Permeate Production – March 2004. During March several additional problem areas were identified and, where possible, addressed. A relatively minor problem was post-precipitation in the neutralized clarifier overflow pond water. However, since the clarifier overflow lines to the pH adjustment/R.O. feed tank were oversized, this problem did not cause any significant production problems. Scale formation in the clarifier underflow piping, underflow pumps, and in the line from the caustic addition tank to the flocculant mix tank was more severe and did cause production problems. The clarifier underflow line scale problem was addressed by installing spare underflow lines that allowed switching to clean lines and water blasting the scaled lines. Flush lines were installed to the clarifier underflow pumps and partially reduced mechanical problems caused by scale in this area. The problem of scale formation in the line from the caustic addition tank to the flocculant mix tank was addressed by taking a brief plant shut-down and water-blasting the line. During this operation it was determined that the 14” diameter had been reduced to 4-6” diameter by the scale build-up. Several other problems were identified that could not be addressed in the short term. One was pump and piping restrictions that prevented feeding a sufficient volume of pretreated water, at a sufficient pressure, to the 1st pass R.O. pressure pumps. This forced the choice of either operating only a single 1st pass R.O. unit at optimum recovery or running both 1st pass R.O. units at lower than optimum recovery. With either choice, overall permeate production was impacted. Another problem that prevented both 1st pass R.O. units from operating simultaneously was the inability to pump all of the reject (1st pass and 2nd pass reject plus clarifier solids) off-site. Part of this problem was due to an undersized pump and part was due to scale that had built up in the reject pipe line. Plant upgrades were planned for mid-April to address these problems. Another problem involved the oil-based carrier in the emulsion flocculant used in pretreatment. Evidence indicated that the oil was blinding the R.O. membranes.

40
Removing this blinding required a daily flush of the membranes with permeate. A plant test of dry flocculant was planned for early April to address this problem.
Table 19 shows the estimated raw material consumption and costs and unit recoveries for March 2004. Table 18. Florida Pines March 2004 Permeate Composite Analyses.
ComponentResults
3/1 - 3/15Results
3/16 - 3/31 Units MethodMethod MDL
Aluminum 0.033 0.046 mg/L 6010 0.033Ammonia-Nitrogen 0.110 0.15 mg/L 350.3 0.040Antimony 0.0050 0.0050 mg/L 6010 0.0050Arsenic 0.0032 0.0032 mg/L 6010 0.0032Asbestos <0.182 -- MFL TEM 0.182Barium 0.0012 0.0012 mg/L 6010 0.0012Beryllium 0.00054 0.00054 mg/L 6010 0.00054Cadmium 0.00071 0.00071 mg/L 6010 0.00071Calcium 4.1 2.9 mg/L 6010 0.044Chromium 0.0017 0.0017 mg/L 6010 0.0017Copper 0.00090 0.00090 mg/L 6010 0.00090Cyanide 0.010 0.010 mg/L 335.3 0.0050Fluoride 1.4 0.6 mg/L 340.2 0.044Gross Alpha 0.497 +/- 0.57 -- pci/L 900.0Mercury -- 0.000072 mg/L 7470.0 0.000072Lead 0.0015 0.0015 mg/L 6010 0.0015Magnesium 1.7 1.2 mg/L 6010 0.11Manganese 0.0014 0.0014 mg/L 6010 0.0014Nickel 0.0047 0.0047 mg/L 6010 0.0047Nitrate-N 0.28 0.016 mg/L 353.2 0.010Nitrite-N 0.33 0.045 mg/L 353.2 0.010Ortho Phosphorus 0.20 0.12 mg/L 365.2 0.0090Phosphorus - Total 0.20 0.11 mg/L 365.2 0.017pH 6.9 7.2 su 150.1Potassium 0.19 0.19 mg/L 6010 0.19Selenium 0.0042 0.0042 mg/L 6010 0.0042Silica (SiO2) 0.96 0.54 mg/L 6010 0.10Sodium 6.7 4.8 mg/L 6010 0.31Specific Conductance 78 51 µmho/cm 120.1 5.0Sulfate as SO4 11 5.5 mg/L 375.4 1.7Thallium 0.0049 0.0049 mg/L 6010 0.0049

41
Table 19. March Raw Material Consumption and Recovery.
Raw Materials Consumption
Lbs/1000 Gal. FeedCost
$/1000 Gal. Feed Caustic (100% Basis) 23 $ 2.70 Sulfuric Acid 19 $ 0.60 Flocculant 0.20 $ 0.15
Total Raw Material Cost $ 3.45 Recoveries
Pretreatment 75% 1st Pass R.O. 56% 2nd Pass R.O. 90%
Overall 38% Demonstration Plant Phase III Operation With the production and discharge of an average permeate volume of 400,000 gallons per day for 5 consecutive days, the Phase II milestone was achieved (on March 18) and the demonstration plant entered Phase III operation. During April, an eight-day plant shutdown was taken from April 11 through April 18 for plant retrofits and to clean out pipeline scale. The primary focuses of the plant retrofits were feed flow to the 1st pass R.O. system, the discharge of reject from the system, and removal of the solids in the clarification system.
The problem of feed flow to the 1st pass R.O. units was addressed by installing a
larger pump to feed the 1st pass pressure pumps, larger piping and cross connections on the bag filter skid, and additional surge capacity. The surge capacity ahead of the 1st pass R.O. system was essentially doubled by relocating a tank that was not being used (T-204) and connecting it with a 12” diameter pipe to the existing feed tank T-104. This was needed to allow the necessary volume to control the start-up and shutdown of both first pass R.O. systems.
The problem of pumping away reject was addressed by replacing the original
reject pump with the former 1st pass R.O. feed pump, modification to the pump suction piping and an increase in the discharge line size to the building boundary. These changes helped, but did not solve the reject pumping problem. While the line inside the building was replaced, the reject line installed by the receiver (outside the building) was scaled to the point that it would not allow full production flow. Compounding this issue, the line outside the building was not supported in an adequate manner and there are many dips that would prevent effective cleaning. Thus, plans were made to get the reject line adequately supported so that it could be cleaned, with the option of installing a duplicate reject line that would allow full production to continue while the line was being cleaned.

42
The problem of solids in the clarification system was addressed with several modifications. Scale in the existing pipelines was removed by water blasting. The sludge recycle lines from the two flat-bottom clarifiers were relocated to enter the flocculant addition tank below the liquid surface. This prevented short-circuiting of the solids and promoted better mixing of the sludge with the flocculant. The original underflow pump for the T-103A clarifier was replaced with the former reject pump, equipped with a VFD (variable frequency drive) to allow flow control. Also, the sludge underflow discharge line from T-103B was separated from the common line out of T-103A and a separate line to the reject tank was installed. This allowed independent control of each of the underflow streams going to the reject tank and improved overall clarification system control.
As a result of the retrofits, it was now possible to operate both 1st pass R.O. units simultaneously and, initially, dispose of all reject. This resulted in a production increase of about 30% and allowed a new one-day production record to be established on April 23, with 543,000 gallons of permeate produced and discharged. Unfortunately, as a result of the extended down-time taken for the retrofits, permeate production during April was down compared to March, with only 8.7MM gallons produced. In addition, as a result of increasing pH in the feed pond water and the use of sulfuric acid in an attempt to scrub out scale, raw material usage and costs were higher for April compared to March. Table 20 shows the estimated raw material consumption and costs and unit recoveries for April 2004. Table 20. April Estimated Raw Material Consumption and Recovery.
Raw Materials Consumption
Lbs/1000 Gal. FeedCost
$/1000 Gal. Feed Caustic (100% Basis) 27 $ 3.14 Sulfuric Acid 28 $ 0.86 Flocculant 0.20 $ 0.15
Total Raw Material Cost $ 4.15 Recoveries
Pretreatment 86% 1st Pass R.O. 59% 2nd Pass R.O. 90%
Overall 46% Several plant tests were also run during April in an effort to improve plant operation and increase recovery. Two of these tests were to evaluate dry flocculant as a replacement for the oil-emulsion-based flocculant. The first of these, run before the shutdown, appeared promising but could not be adequately evaluated because of limited plant capacity. The second test, run after the shutdown, was very successful and allowed an almost 100% increase in operating time of the 1st pass R.O. before cleaning was needed, and at a permeate production rate, for a single R.O. train, that was 5.3% higher than the previous record. During this test, more aggressive operation of the 1st pass R.O. also resulted in a 24-hour recovery of 64.6% at an average flux rate of 13.3 GFD. After

43
46 hours’ operation, the recovery was 62.6% at an average flux rate of 12.8 GFD. Table 21 shows summary data for the 1st pass R.O. during the dry flocculant test and two “baseline” periods during which the oil-emulsion-based flocculant was used. Table 21. 1st Pass R.O. Operation Comparison for Dry Flocculant Test.
Baseline Period 1
Baseline Period 2
Duration (Hr.) 15.6 17.6 24Average 1st Pass Feed Pressure (psig) 368 399 388
Average Permeate Rate (GPM) 374 355 406Average Permeate Conductivity (µmhos/cm) 362 339 369
Average Permeate Recovery (%) 61.3% 61.3% 64.6%Average Flux Rate (GFD) 12.3 11.7 13.3
Oil-Emulsion Floc.Dry Floc.
TestParameter
The third plant test run was to evaluate the feasibility of recycling the 2nd pass R.O. reject directly to the 1st pass R.O. feed. If successful, this mode of operation would produce at least a 5% increase in overall plant permeate recovery. The danger with this mode of operation is that all fluorides must be removed from the overall R.O. system in the 1st pass, where fluoride rejection is the poorest. While field fluoride analyses indicated that the test was successful and this mode of operation was viable, the decision was made to repeat this test in early May, with back-up samples sent to the IMC water lab for analysis. May permeate production of 10.5 MM gallons was slightly above the previous monthly record. Two agitator gear box failures and reject line scale limited production for much of the month. The plant was also down for two days due to lack of raw materials (caustic) and two more days for cleaning the reject line. By May 16, the entire reject line had been water-blasted and cleaned and bids were received to run a 2nd, parallel, reject line. Installation was scheduled to start June 1. Parallel lines would allow separate return of the 1st pass R.O. reject and clarifier underflow streams. The 1st pass R.O. reject stream is non-scaling and would actually scrub out scale already present in the line. Also, pond water can be added to the clarifier underflow stream to inhibit scaling. On May 28, the booster pump on the 1A R.O. failed due to lack of lubrication. Unfortunately, repairs could not be completed before June 3. The second plant test to recycle 2nd pass R.O. reject to the 1st pass R.O. feed tank was successfully repeated May 3. Final permeate fluoride concentrations never increased above 2.6 mg/L (maximum allowed is 5 mg/L). This mode of operation was adopted routinely on May 12. Based on the success of the dry flocculant test run in April, a permanent, automated dry flocculant system was installed and started May 25.
Table 22 shows the estimated raw material consumption and costs and unit recoveries for May 2004. As in April, the relatively high pH of the incoming pond water tended to keep raw material consumption and costs somewhat high. On May 21 a new single-day production record was set at 768,000 gallons.

44
Table 22. May Estimated Raw Material Consumption and Recovery.
Raw Materials Consumption
Lbs/1000 Gal. FeedCost
$/1000 Gal. Feed Caustic (100% Basis) 23 $ 3.20 Sulfuric Acid 22 $ 0.68 Flocculant 0.20 $ 0.15
Total Raw Material Cost $ 4.03 Recoveries
Pretreatment 80% 1st Pass R.O. 58% 2nd Pass R.O. 94%
Overall 44% On June 11, the new reject line was put into service. First-pass reject was then pumped through the old reject line. The pressure drop on the old reject line indicated that the reject, as expected, had essentially cleaned the scale out of the old line. June permeate production of 14.4 MM gallons was significantly above the previous monthly record. A new daily record of 771,000 gallons was set on June 24. During the last half of June, the pretreatment clarifier sludge bed levels were intentionally run at lower levels than previous practice. This was done in an effort to maximize permeate production, but also had the effect of lowering the pretreatment recovery for the month. Table 23 shows the estimated raw material consumption and costs and unit recoveries for June 2004. Table 23. June Estimated Raw Material Consumption and Recovery.
Raw Materials Consumption
Lbs/1000 Gal. FeedCost
$/1000 Gal. Feed Caustic (100% Basis) 23 $ 3.16 Sulfuric Acid 19 $ 0.58 Flocculant 0.20 $ 0.15
Total Raw Material Cost $ 3.89 Recoveries
Pretreatment 72% 1st Pass R.O. 61% 2nd Pass R.O. 96%
Overall 45% During the approximately 4½ months of operation, the Piney Point plant produced and discharged a total permeate volume of 45.9 million gallons. Average permeate production was approximately 346,000 gallons per day. Figure 14 shows the daily permeate production over the life of the plant.

45
0
100
200
300
400
500
600
700
800
2/19/04 3/4/04 3/18/04 4/1/04 4/15/04 4/29/04 5/13/04 5/27/04 6/10/04 6/24/04
Date
Dai
ly P
rodu
ctio
n (1
000
Gal
lons
)
Figure 14. Florida Pines Permeate Production – February 19 – June 30, 2004.
During the latter stages of production, two permeate samples were collected and subjected to considerably more detailed analyses than had the previous samples. For the last sample (a grab sample on June 4), more sensitive methods were used for several components to extend the detection limits. The results for these two samples, along with the normal April 1-15 composite, are shown in Table 24.
Table 24. Florida Pines April-June Permeate Analyses.
ComponentApril 1-15
Comp.April 16-30
Comp. June 4 Grab Units MethodAlkalinity 10 10 mg/L 310.1Aluminum 0.033U mg/L 6010Ammonia-Nitrogen 0.220 0.17 0.83 mg/L 350.3Antimony 0.0029U 0.0029U 0.0029U mg/L 6010Arsenic 0.0038U 0.0038U 0.0038U mg/L 6010Beryllium 0.00074U 0.00074U 0.00074U mg/L 6010Cadmium 0.00071U 0.00071U 0.00071U mg/L 6010Calcium 3.6 mg/L 6010Chromium 0.0017U 0.0017U 0.0017U mg/L 6010Copper 0.0013U 0.0013U 0.0013U mg/L 6010Cyanide-Free 0.0050U mg/L 335.3Fluoride 0.62 4.2 6.3 mg/L 340.2Gross Alpha INS INS 0.103U pci/L 900.0

46
Table 24 (Cont.). Florida Pines April-June Permeate Analyses.
ComponentApril 1-15
Comp.April 16-30
Comp. June 4 Grab Units MethodIron 0.037U 0.037U mg/L 6010Mercury 0.072U 0.072U 0.00085 µg/L 7470/1631E4
Lead 0.0015U 0.0015U 0.0015U mg/L 6010Magnesium 1.4 mg/L 6010Manganese 0.0014U mg/L 6010MBAS (detergents)1 0.093I 0.14Q mg/L SM5540CNickel 0.0047U 0.0047U 0.0047U mg/L 6010Nitrate-N 0.016I mg/L 353.2Nitrite-N 0.44 mg/L 353.2Nitrogen - Total 0.74 1.9 mg/L 351.2+353.2Ortho Phosphorus 0.13 mg/L 365.2Oil and Greese2 0.73U 0.73U mg/L 1664Dissolved Oxygen 9.0 7.8 mg/L SM4500CPhosphorus - Total 0.15 0.40 0.20 mg/L 365.2pH 7.1 6.6 6.5 su 150.1Benzyl butyl phthalate 1.6U 0.41U µg/L 625bis(2-Ethylhexyl) phthalate 2.0U 1.0U µg/L 625Di-n-butylphthalate 1.4U 0.26U µg/L 625Diethylphthalate 1.5U 1.0U µg/L 625Dimethylphthalate 1.0U 0.39U µg/L 625Di-n-octylphthalate 2.0U 0.35U µg/L 625Potassium 0.19U mg/L 6010Radium 2263 0.0182U 0.07U pci/L 903.0Radium 228 0.453U 1.46J pci/L 904.0Residual Chlorine 0.10U 1.0U mg/L SM4500-Cl BSelenium 0.0048U 0.0048U 0.0048U mg/L 6010Silica (SiO2) 38 mg/L 6010Sodium 5.4 mg/L 6010Specific Conductance 64 110 71 µmho/cm 120.1Sulfate as SO4 7.3 mg/L 375.4Trihalomethanes 0.50U 26.39 µg/L 524.2Thallium 0.0066U 0.0066U 0.0020U mg/L 6010.0Turbidity 0.89 0.10U NTU 180.1Zinc 0.0059U 0.0059U mg/L 6010 Qualifiers and Notes: I = The reported value is between the laboratory method detection limit and the laboratory practical quantitation limit. U = Indicated that the compound was analyzed for but not detected. Q = Sample held beyond accepted holding time. J = No <U qualifier has been assigned and the result is below the Reporting Limit, RL (CDRL) or Report Value is Estimated.

47
Table 24. Qualifiers and Notes (Cont.). INS – Insufficient sample for analysis. 1 – MBAS, calculated as LAS, mol wt 340. 2 – Hexane extractable material. 3 – EPA Method 903.0 measures total soluble alpha-emitting isotopes of Radium, namely Radium – 223, 224 and 226 in drinking water, surface water and groundwater. 4 – Method 7470 used for April 1-15 and April 16-30 samples. Method 1631E (Low Level Hg) used for June 4 Grab sample. Table 25 shows the analysis of various composite reject samples collected over the course of the project. These samples represent the total reject and include the 1st pass R.O. reject, clarifier underflow sludge and, where applicable, the 2nd pass R.O. reject. The qualifiers used in Table 25 have the same meaning as those used in Table 24. Table 26 shows the analysis of composite samples of the pond water feed to the plant.
Table 25. Reject Sample Analyses.
Component Units
March 9 to
March 27
March 29 to
April 10
April 20 to
April 24 June 4 GrabpH su 5.7 5.9 5.1 5.7Specific Conductance µmho/cm 23,333 27,000Phosphorus - Total mg/L 1767 2550 2000 2700Fluoride mg/L 75.7 79.0 78.0 92.0Sulfate as SO4 mg/L 12,333 14,500 14,000 22,000Sodium mg/L 5367 5850Silica (SiO2) mg/L 280 370Ammonia-Nitrogen mg/L 1467 1500 1000 1300Calcium mg/L 863 930 770 970Arsenic mg/L 0.71 0.86Barium mg/L 0.015I 0.018ICadmium mg/L 0.060 0.063Lead mg/L 0.0075U 0.0075UMercury mg/L 0.000072U 0.000078ISelenium mg/L 0.024U 0.028ISilver mg/L 0.0095U 0.0095U

48
Table 26. Feed Pond Water Sample Analyses.
Component Units
March 19 to
March 27
March 29 to
April 10
April 20 to
May 1pH su 3.8 4.0 4.1Specific Conductance µmho/cm 12,500 13,500Phosphorus - Total mg/L 1250 2200 1450Fluoride mg/L 64.0 61.0 58.0Sulfate as SO4 mg/L 5,300 5,350 5,950Sodium mg/L 1600 1550Silica (SiO2) mg/L 170Ammonia-Nitrogen mg/L 1050 1350 635Calcium mg/L 665 705 550Arsenic mg/L 0.43
Operating and Project Costs
Many factors impacted the operating costs and overall project cost of the Piney Point demonstration plant, most of them in a negative manner. Some of these factors were due to the fact that the process was new and had never been run at anywhere near a commercial scale. Other factors were related to the accelerated construction schedule for the plant. Finally, there were factors that could be considered design compromises or design errors, although these too may have been related to the newness of the process.
As with any new process, there were some unknown factors that did not become
apparent until after the plant was built and had been operating for some time, and some known problems that were not addressed until after plant start-up. A problem seen during pilot tests was scale formation in the clarifier underflow sludge piping. Two unknown problems were the scale formation tendency of the clarifier underflow sludge when mixed with the 1st pass reject and the tendency of the oil-emulsion-based flocculant to build up in the 1st pass R.O. membranes. The problem of scale formation when the underflow sludge and 1st pass R.O. reject were mixed was essentially solved by the installation of a parallel return line that allowed each stream (sludge and reject) to be returned separately and the ability to alternate reject and sludge between the lines and thus scrub the sludge line with 1st pass R.O. reject. The problem of scale formation in the clarifier underflow piping was partially solved by the installation of flush connections and rerouting the piping (part of the retrofits during April). However, both of these solutions came at additional cost and the problems caused lower recoveries until they were solved. The problem with the oil-emulsion-based flocculant was the easiest to solve. Switching to a dry flocculant (mixed with water only) solved the problem and actually resulted in a slight improvement in terms of R.O. recovery and a significant improvement in the operating cycle between cleanings.

49
The more obvious additional capital costs due to the accelerated construction schedule are detailed above (Table 15) and were about $770,000. However, there were also other added costs that could be assigned to the accelerated construction schedule which were not discovered until after the plant had been operating. The accelerated construction schedule permitted no time for any detailed piping design. Thus, several of the piping runs were awkward and contained “dead spots” allowing scale build-up or were undersize, resulting in excessive pressure drops. The piping also had little or no provisions for clean-outs and bypassing out of service tanks. These factors caused production problems or resulted in excessive downtime that increased operating costs. Most of the piping problems were corrected during the April retrofit, but this came with additional capital costs and resulted in additional downtime. The accelerated construction schedule and desire to start up as soon as possible also left insufficient time for flushing of lines, water testing of equipment or calibrating instrument loops. The lack of line flushing resulted in construction debris being carried into pumps and the R.O. units. The debris in the pumps caused pumping problems and several pump failures, resulting in added maintenance costs and down time. The debris carried into the R.O. units collected in the membrane flow distribution plates and was responsible for the only membrane failures (four membranes) during the project. The lack of water testing resulted in several tank leaks (at nozzles) not being discovered until after start-up. Although the cost of repair was borne by the tank supplier, the time required for repair caused additional downtime. The lack of time to calibrate instrument loops resulted in the operation of several systems that were designed to be operated in automatic mode to be operated in manual mode for extended times, with some of them never capable of automatic operation. This caused process inefficiency and several process upsets. Also, when time was taken to calibrate some of the loops, parts of the plant had to be down, resulting in lost production. Design compromises and design errors included undersized pumps for 1st pass R.O. feed and reject return, lack of sufficient by-pass piping and cross connections in several locations, and the use four parallel clarifier tanks in pretreatment. The undersized pumps and piping issues were corrected during the April retrofit, but the clarification compromise remained. The use of four parallel tanks for pretreatment solids removal was the major bottleneck in the entire demonstration plant. Four clarifiers operating in parallel were used partly due to time constraints, partly due to cost and partly due to access limitations into the building where the demonstration plant was located. None of the clarifier tanks was equipped with overflow launders or rakes and two of them were flat-bottom. This necessitated separate sludge underflow pumps for each clarifier and presented obvious control problems in terms of balancing the flow to each of them. Combined, the clarifiers had a total area of about 408 ft.2 and were limited to a feed flow, based on pilot tests and plant experience, of about 1,050-1,100 GPM. Thus, using the best monthly average recoveries for pretreatment 1st pass R.O. and 2nd pass R.O. (not all from the same month), the plant could be expected to have a maximum capacity of about 802,000 GPD permeate. Based on the data collected during the dry flocculant test, where an effort was made to optimize the operation of a single 1st pass R.O., the maximum production using both 1st pass R.O. units would be about 1.1 million GPD. This would require a feed rate to the clarifiers of about 1500 GPM. If plant production could have
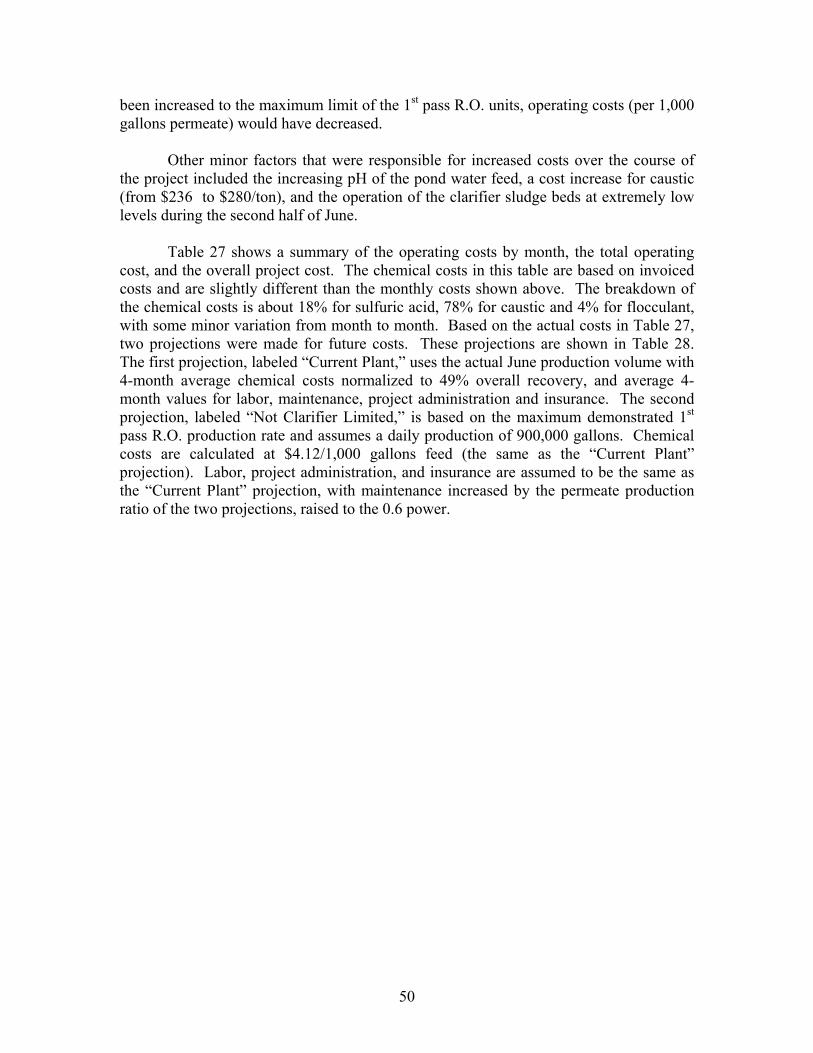
50
been increased to the maximum limit of the 1st pass R.O. units, operating costs (per 1,000 gallons permeate) would have decreased. Other minor factors that were responsible for increased costs over the course of the project included the increasing pH of the pond water feed, a cost increase for caustic (from $236 to $280/ton), and the operation of the clarifier sludge beds at extremely low levels during the second half of June. Table 27 shows a summary of the operating costs by month, the total operating cost, and the overall project cost. The chemical costs in this table are based on invoiced costs and are slightly different than the monthly costs shown above. The breakdown of the chemical costs is about 18% for sulfuric acid, 78% for caustic and 4% for flocculant, with some minor variation from month to month. Based on the actual costs in Table 27, two projections were made for future costs. These projections are shown in Table 28. The first projection, labeled “Current Plant,” uses the actual June production volume with 4-month average chemical costs normalized to 49% overall recovery, and average 4-month values for labor, maintenance, project administration and insurance. The second projection, labeled “Not Clarifier Limited,” is based on the maximum demonstrated 1st pass R.O. production rate and assumes a daily production of 900,000 gallons. Chemical costs are calculated at $4.12/1,000 gallons feed (the same as the “Current Plant” projection). Labor, project administration, and insurance are assumed to be the same as the “Current Plant” projection, with maintenance increased by the permeate production ratio of the two projections, raised to the 0.6 power.
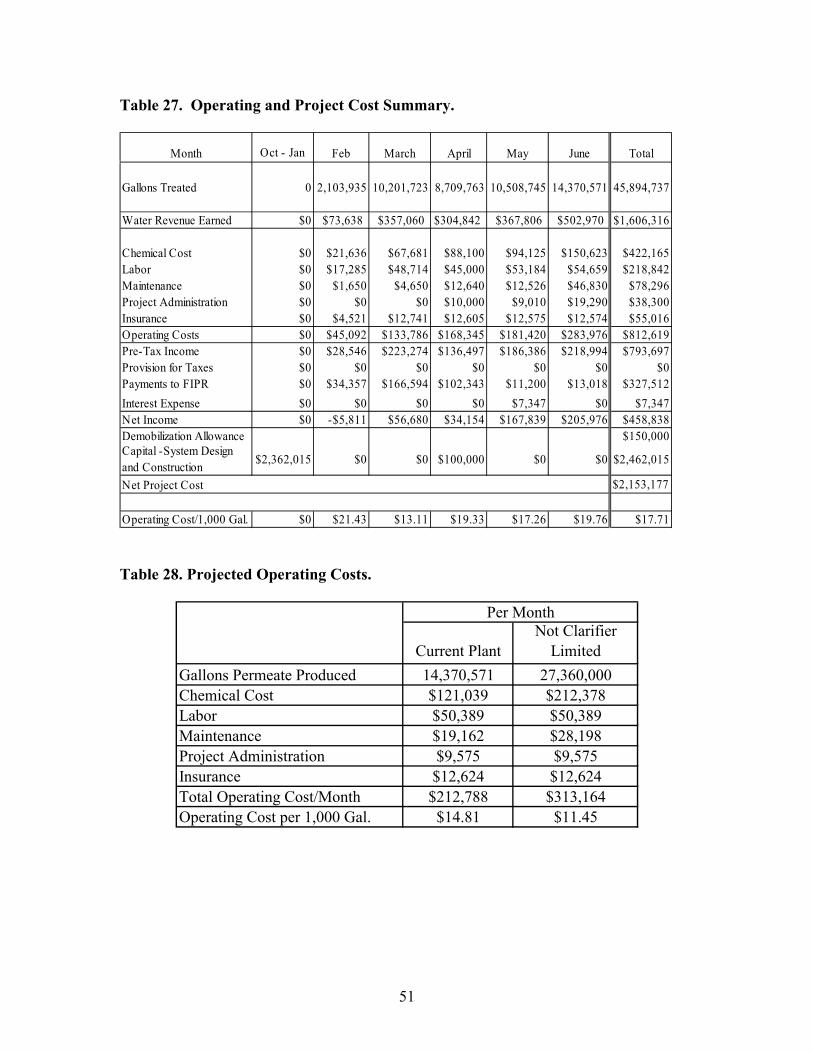
51
Table 27. Operating and Project Cost Summary.
Month Oct - Jan Feb March April May June Total
Gallons Treated 0 2,103,935 10,201,723 8,709,763 10,508,745 14,370,571 45,894,737
Water Revenue Earned $0 $73,638 $357,060 $304,842 $367,806 $502,970 $1,606,316
Chemical Cost $0 $21,636 $67,681 $88,100 $94,125 $150,623 $422,165Labor $0 $17,285 $48,714 $45,000 $53,184 $54,659 $218,842Maintenance $0 $1,650 $4,650 $12,640 $12,526 $46,830 $78,296Project Administration $0 $0 $0 $10,000 $9,010 $19,290 $38,300Insurance $0 $4,521 $12,741 $12,605 $12,575 $12,574 $55,016Operating Costs $0 $45,092 $133,786 $168,345 $181,420 $283,976 $812,619Pre-Tax Income $0 $28,546 $223,274 $136,497 $186,386 $218,994 $793,697Provision for Taxes $0 $0 $0 $0 $0 $0 $0Payments to FIPR $0 $34,357 $166,594 $102,343 $11,200 $13,018 $327,512Interest Expense $0 $0 $0 $0 $7,347 $0 $7,347Net Income $0 -$5,811 $56,680 $34,154 $167,839 $205,976 $458,838Demobilization Allowance $150,000
Net Project Cost $2,153,177
Operating Cost/1,000 Gal. $0 $21.43 $13.11 $19.33 $17.26 $19.76 $17.71
Capital -System Design and Construction $2,362,015 $0 $0 $100,000 $0 $0 $2,462,015
Table 28. Projected Operating Costs.
Current PlantNot Clarifier
LimitedGallons Permeate Produced 14,370,571 27,360,000Chemical Cost $121,039 $212,378Labor $50,389 $50,389Maintenance $19,162 $28,198Project Administration $9,575 $9,575Insurance $12,624 $12,624Total Operating Cost/Month $212,788 $313,164Operating Cost per 1,000 Gal. $14.81 $11.45
Per Month

53
CONCLUSIONS
Results from the Piney Point plant demonstrated that adequate pretreatment permits phosphate plant pond water to be processed through a two-pass reverse osmosis system, with reasonable purified water recovery and without fouling the R.O. membranes. During approximately 4½ months of operation, the Piney Point plant produced and discharged almost 46 million gallons of purified water with absolutely no evidence of irreversible membrane fouling. In terms of cost, reverse osmosis treatment is more expensive than the conventional double liming method of treating pond water. Based on laboratory double liming tests with Piney Point water, even a fully optimized R.O. water treatment process, with an operating cost of $11.45/103 gallons of discharged water, would still be about 50% more expensive than double liming. Also, while a higher pressure R.O. system could improve recovery and further development of pretreatment methods may reduce chemical costs, it is doubtful that R.O. treatment will ever provide a significant cost advantage compared to double liming for a situation where discharge of water is the only criterion. The major benefit of using reverse osmosis for pond water treatment is discharge water quality. In fact, water from the Piney Point plant was actually too pure to be released directly to the environment due to the almost total absence of mineral ions and required the addition of a small amount of ground water. However, where high-purity water is required or desired, such as for boiler feed, water from a reverse osmosis system has some value. While the reverse osmosis pretreatment process used at Piney Point was successful in terms of allowing the pretreated water to be processed through a reverse osmosis system, the Piney Point pond water is a unique case. The Piney Point phosphate plant had been inoperative for more than 10 years, during which time the pond water had received significant dilution from rain. Thus, the Piney Point pretreatment process can not be applied directly to pond water from other phosphate plants, particularly those that are still operating and where the pond water is more concentrated. Pretreatment processes for more concentrated pond waters can be, and have been, developed, but still require additional testing before implementation on a large scale.

55
REFERENCES
Baumann AN, Bird RE, inventors; International Minerals & Chemical Corporation, assignee. 1970 Dec 29. Purification of fluorine-containing industrial waste waters. US patent nr 3,551,332. Becker P. 1989. Phosphogypsum: waste or profitable by-product? In: Phosphates and phosphoric acid: raw materials, technology and economics of the wet process. New York: Marcel Dekker. Chapter 9, p 543-58. Casimer CL Jr., inventor; W. R. Grace & Co., assignee. 1973 Apr 3. Purification of waste water. US patent nr 3,725,265. Mooney GA, Nogueira AT, Thompson CG. 1977. Laboratory and pilot treatment of phosphoric acid wastewaters. In: 1977 Joint Meeting of Central Florida and Peninsular Florida Sections of the American Institute of Chemical Engineers. May 20-22, 1977. Clearwater, Florida. Murray MA, Weston CW, inventors; Freeport-McMoran Resource Partners, Limited Partnership, assignee. 1992 May 12. Process for treating pond water. US patent nr 5,112,499.

APPENDIX
U.S. FILTER TREATABILITY TEST REPORT FOR UNCLE SAM POND WATER
Report by Jeff Martin Note: Formats of Tables and Figures in original document were landscape. They have been altered to portrait for presentation in this appendix.

IMC Phosphates Treatability Report No. 20117 July 18, 2001
A-i
IMC PHOSPHATES
TABLE OF CONTENTS Page No.
Section I Background.....................................................................................................1 Section II Sample Description.........................................................................................2 Section III Treatment .......................................................................................................3 A. Sand Filtration........................................................................................3 B. Reverse Osmosis....................................................................................3 Figure 1 – Schematic of RO...................................................................4 1. First Pass .......................................................................................4 a. Operating Conditions ...........................................................4 c. Cleaning ...............................................................................5 d. Results..................................................................................5 Table 1 – Sample 1 Pass 1 - Operating Data ......................6 Table 2 – Sample 2 Pass 1 - Operating Data ......................7 Figure 2 – Sample 1 - Pressure vs. Time .............................8 Figure 3 – Sample 2 - Time vs. GFD...................................9 2. Second Pass.................................................................................10 a. Operating Conditions .........................................................10 b. Cleaning .............................................................................10 c. Results................................................................................10 Table 3 – Sample 1 Pass 2 - Operating Data ....................11 Table 4 – Sample 2 Pass 2 - Operating Data ....................12 Figure 4 – Sample 1 Pass 2 - Pressure vs. Time ...............13 Figure 5 – Sample 2 Pass 2 - Pressure vs. Time ...............14 Section IV Conclusions and Recommendations .............................................................15

IMC Phosphates Treatability Report No. 20117 July 18, 2001
A-1
SECTION I
BACKGROUND
Testing was conducted to determine the feasibility of a two-pass reverse osmosis (RO) treatment process to reduce fluoride concentration in wastewater while concentrating phosphate and other dissolved solids in the RO reject. Two samples were tested: the first sample was pretreated in a precipitation process which included sodium hydroxide, the second sample was pretreated in a precipitation process which included ammonia.
Objectives of the study included:
• Determine which (if any) of the two pretreated samples (sodium hydroxide or ammonia) exhibits the best RO performance as defined by %rejection, operating pressure and membrane fouling characteristics.
• First pass reverse osmosis – determination of RO permeate and
concentrate characteristics at different recovery rates. Determination of operating pressures at different recovery rates. Membrane fouling potential shall also be examined (indicated by an increase in feed pressure and membrane cleaning characteristics).
• Second pass reverse osmosis – determination of RO permeate quality
particularly as it applies to fluoride rejection and membrane fouling potential.

IMC Phosphates Treatability Report No. 20117 July 18, 2001
A-2
SECTION II
SAMPLE DESCRIPTION
Two sets of samples were used during this study.
A. Sample 1
The initial sample set was received on June 8, 2001, and consisted of two – 55 gallon drums labeled ‘Test 1’ and one - 55 gallon drum labeled ‘Test 1 – 3.’ These samples were pretreated in a precipitation process which included sodium hydroxide. The latter sample was taken deeper in a batch pretreatment tank and subsequently may have contained higher concentration of silica. All of the samples were gold-yellow in color with some fluffy gray-white solids, with the majority of the solids settled at the bottom of the drum.
B. Sample 2
The second sample set was received on June 8, 2001, and consisted of two – 55 gallon samples labeled ‘Test 2.’ These samples were pretreated in a precipitation process which included ammonia. The appearance was similar to the initial samples.

IMC Phosphates Treatability Report No. 20117 July 18, 2001
A-3
SECTION III
TREATMENT
The study was conducted in four phases. The first phase (pretreatment) which
was conducted at the IMC – Uncle Sam site. Samples were then shipped to US Filter for the remaining phases of treatment.
The second phase was to filter both of the samples (ammonia pretreated and the
sodium hydroxide pretreated) through a sand column to remove any gross particles. Both samples were filtered independently.
The third phase was 1st pass reverse osmosis - to determine the optimum
operating conditions for both phosphate concentration and permeate quality. This pass used a seawater RO membrane element because of the high conductivity (17,000 – 19,000 umhos) inherent with the sample. Seawater elements are more desirable to use with samples which are of high conductivity – due to their higher durability under elevated operating pressures.
The fourth phase was 2nd pass reverse osmosis - to determine the ability of the
reverse osmosis membrane to reject fluoride while maintaining a high water flux rate. A. Sand Filtration
Prior to reverse osmosis treatment, both samples were put through a sand filter to remove solids present. The following corresponds to the sand filtration.
Column Material....................................................................Clear PVC Column height ....................................................................... 60” Column Diameter .................................................................. 2 ½” Bed Depth.............................................................................. 36” Area ....................................................................................... 0.034 ft2
Flow rate................................................................................ 6 gpm/ ft2 (770 mls/minute) Pump...................................................................................... Peristaltic Service ...................................................................................Downflow
The pressure during the runs did not exceed 10 psi for filtering either the first or second samples. The column was backwashed prior to filtration of the second sample.
B. Reverse Osmosis The test was performed in two passes – the first pass was to concentrate the majority of the phosphate (as P2O5) in the reject while obtaining a suitable permeate for the second pass – fluoride removal step.

IMC Phosphates Treatability Report No. 20117 July 18, 2001
A-5
The Figure below is a schematic representation of the system used during the testing.
Figure 1 – Reverse Osmosis System
1. First Pass A pilot reverse osmosis system using a new seawater element (SW 2530) was used (Figure 1). The sand filter effluent was pumped through a 5-micron cartridge filter and into the reverse osmosis feed tank. The reverse osmosis system consisted of a 5-HP positive displacement high pressure pump and a single membrane element. The recycle rate was 3 gpm. The main objective in the first pass was to reject 95-98% of the soluble phosphate while determining the optimum membrane flux and % recovery. The ammonia treated sample was the first sample put through the system. After completely exhausting that sample, the sodium hydroxide-treated sample was put through the system. a. Operating Conditions
The RO system was operated at a water flux rate of 8 GFD and a recovery rate of 70 or 80%. Flux rates indicate the gallons of permeate water produced per square foot of membrane area. The recovery rate refers to the percent of permeate water produced. 70% recovery means that for every 100 gallons of feed, 70 gallons of permeate will
T
Permeate
Flow
Reject
Variable Speed Pump
R.O. Element
Feed Tank
P
P

IMC Phosphates Treatability Report No. 20117 July 18, 2001
A-6
be generated. It also indicates that the contaminants in the reject will be concentrated by a factor of 3.3. Temperature was maintain for the majority of the first pass test at about 100F using a chiller unit with cooling coils placed in the RO feed tank. In that membrane flux is relative to feed temperature (flux increases about 10% per 4C rise in temperature) it is important to note the temperature when reviewing operating pressure and flux data.
The first test performed used the ammonia pretreated sample. The Table below depicts the operating conditions.
Array ....................................................................1 Element ................................................................Seawater Dimensions ..........................................................2.5” dia. x 40” long Recycle flow rate .................................................3 gpm Flux ......................................................................8 gfd (maintained) Recovery rate .......................................................70 - 80% Filtration Area......................................................23 ft2
The recovery was altered from 70% to 80% midway through the run while maintaining 8 gfd water flux.
After the test on the ammonia pretreated sample was completed, the sodium hydroxide pretreated sample was put through the system (using the same element).
This second test was performed differently – the pressure was maintained at 850 psi inlet pressure and the recovery rate was maintained at 85%. The flow rate was monitored but not controlled.
b. Cleaning
At the completion of the test, the membrane was cleaned to determine if the flow rate could be recovered after use. Cleaning was done using permeate (2nd pass permeate) that was pH adjusted to 13 with sodium hydroxide, run for 20 minutes and allowed to soak for 2 additional hours. The flux was restored to 95% of the pre-test value.
c. Results
The results from the above testing can be viewed on Tables 1 and 2, as well as graphical representations Figures 2 and 3.

IMC Phosphates Treatability Report No. 20117 July 18, 2001
A-7
Table 1
Reverse Osmosis Run Data (Ammonia Pretreated Sample)
Run Influent Effluent Feed Permeate Reject ActualTime Pressure Pressure Conductivity Conductivity Conductivity Recovery Temperature Actual
Time (Hours) (psi) (psi) (umho/cm) (umho/cm) (umho/cm) ( % ) ( F ) GFD
10:20 0:00 340 310 70.2% 7.810:30 0:10 390 370 17,000 650 35,000 71.1% 100 7.910:40 0:20 390 370 65.7% 6.610:50 0:30 430 400 71.0% 7.711:00 0:40 450 410 71.1% 7.611:15 0:55 470 430 640 44,000 72.4% 105 7.712:00 1:40 490 450 71.7% 107 7.613:30 3:10 505 470 550 47,800 70.1% 102 7.714:00 3:40 510 470 70.7% 102 7.714:30 4:10 510 470 70.8% 103 7.915:00 4:40 510 470 70.2% 102 7.815:50 5:30 570 540 80.0% 102 8.316:00 5:40 610 580 80.8% 103 8.216:20 6:00 620 590 80.5% 102 8.216:30 6:10 640 610 525 48,000 80.4% 102 8.317:00 6:40 650 620 80.2% 102 8.517:30 7:10 650 620 80.4% 103 8.417:45 7:25 650 620 500 49,200 80.3% 103 8.4Shut downRestart 6-20-20017:30 7:25 550 520 80.6% 94 8.68:00 7:55 620 590 80.0% 100 8.38:15 8:10 660 630 80.2% 102 8.48:30 8:25 670 640 540 50,890 80.0% 102 8.39:00 8:55 670 640 80.5% 103 8.39:30 9:25 670 640 520 51,000 80.2% 103 8.410:00 9:55 670 640 490 51,000 80.2% 100 8.410:30 10:25 670 640 79.9% 100 8.411:00 10:55 670 640 80.2% 102 8.411:30 11:25 675 645 80.3% 103 8.212:00 11:55 670 640 470 51,800 80.3% 103 8.2
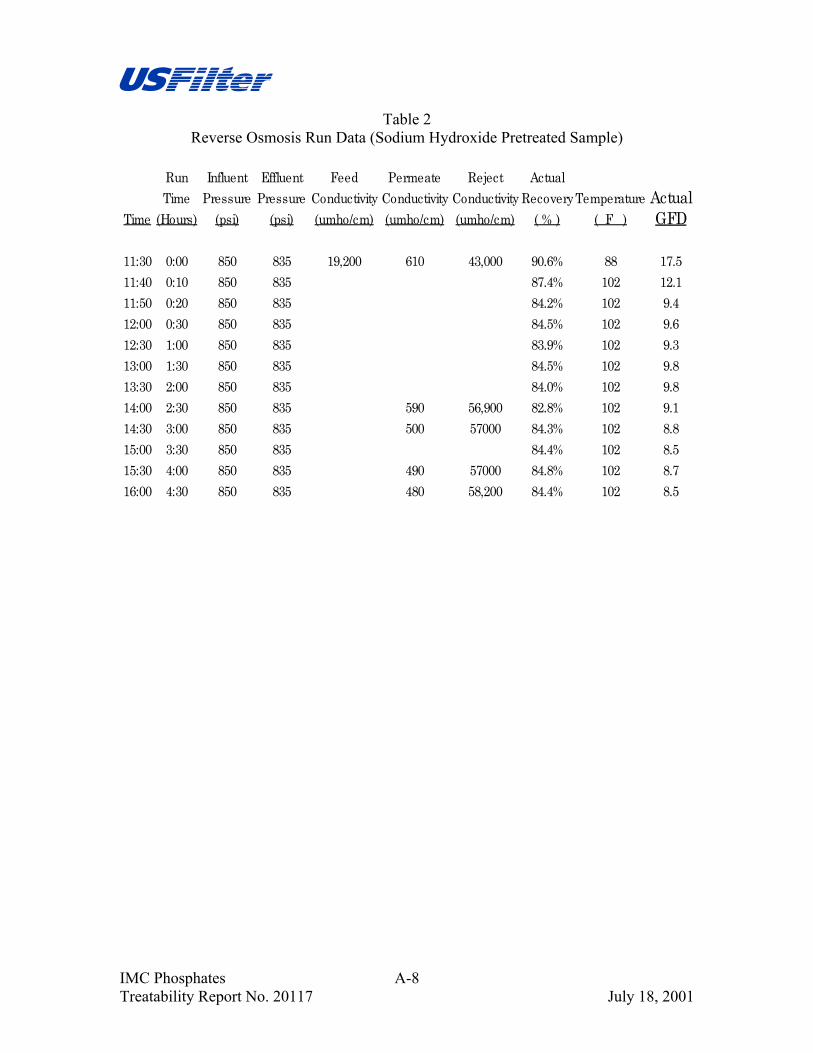
IMC Phosphates Treatability Report No. 20117 July 18, 2001
A-8
Table 2 Reverse Osmosis Run Data (Sodium Hydroxide Pretreated Sample)
Run Influent Effluent Feed Permeate Reject ActualTime Pressure Pressure Conductivity Conductivity Conductivity RecoveryTemperature Actual
Time (Hours) (psi) (psi) (umho/cm) (umho/cm) (umho/cm) ( % ) ( F ) GFD
11:30 0:00 850 835 19,200 610 43,000 90.6% 88 17.511:40 0:10 850 835 87.4% 102 12.111:50 0:20 850 835 84.2% 102 9.412:00 0:30 850 835 84.5% 102 9.612:30 1:00 850 835 83.9% 102 9.313:00 1:30 850 835 84.5% 102 9.813:30 2:00 850 835 84.0% 102 9.814:00 2:30 850 835 590 56,900 82.8% 102 9.114:30 3:00 850 835 500 57000 84.3% 102 8.815:00 3:30 850 835 84.4% 102 8.515:30 4:00 850 835 490 57000 84.8% 102 8.716:00 4:30 850 835 480 58,200 84.4% 102 8.5
IMC Phosphates Treatability Report No. 20117 July 18, 2001
A-9
Figure 2(Ammonia Pretreated Sample)
Pressure vs Time
0
100
200
300
400
500
600
700
800
0:00 1:12 2:24 3:36 4:48 6:00 7:12 8:24 9:36 10:48 12:00
Time (in Hours )
Influ
ent P
ress
ure
(PSI
)
70% Recovery
80% Recovery

IMC Phosphates Treatability Report No. 20117 July 18, 2001
A-10
Figure 3(Sodium Hydroxide Pretreated Sample)
GFD vs Time
0
2
4
6
8
10
12
14
16
18
20
0.0 0.5 1.0 1.5 2.0 2.5 3.0 3.5 4.0 4.5 5.0
Time (in Hours)
GFD
IMC Phosphates Treatability Report No. 20117 July 18, 2001
A-11
2. Second Pass
The same reverse osmosis system was used for the second pass of testing as was used during the first pass but in the second pass a single BW-2530 membrane element was used. Permeate from the first pass was collected to feed to the second pass. The pH was adjusted to 9.0 using sodium hydroxide (required 220 mg/l for the ammonia pretreated sample, and 240 mg/l for the sodium hydroxide treated sample). The main objective of the second pass was to reduce the fluoride concentration (which after the sodium hydroxide addition would be in the sodium fluoride state) to less than 35 mg/l while optimizing the pressures to achieve the greatest recovery while minimizing the pressure. Both samples were run using the same element, the main difference being the operating conditions. a. Operating Conditions
The first test run (using the ammonia-treated sample permeate from the previous test), the recovery was 85% and 20 GFD was maintained.
The second test run (using the sodium hydroxide treated sample) the recovery was 95% and 20 GFD was maintained.
Array ....................................................................1 Element ................................................................Brackish Water Dimensions ..........................................................2.5” dia. x 40” long Recycle flow rate .................................................3 gpm Flux ......................................................................20 gfd (maintained) Recovery rate .......................................................85 and 95% Filtration Area......................................................23 ft2
b. Cleaning
Cleaning was not required following the testing.
c. Results
The results from the above testing can be viewed on Tables 3 and 4, as well as graphical representations Figures 4 and 5.

IMC Phosphates Treatability Report No. 20117 July 18, 2001
A-12
Table 3 Reverse Osmosis Data (Ammonia Pretreated Sample)
Run Influent Effluent Feed Permeate Reject ActualTime Pressure Pressure Sp. Cond. Sp. Cond. Sp. Cond. RecoveryTemp. Actual
Time (Hours) (psi) (psi) (umho/cm) (umho/cm) (umho/cm) ( % ) ( F ) GFD
13:55 0:00 140 110 540 53 85.7% 88 20.814:05 0:10 145 115 85.7% 90 20.814:35 0:40 150 120 55 2,800 85.5% 90 20.515:05 1:10 150 120 54 2900 85.8% 90 20.415:35 1:40 150 120 52 2900 85.3% 90 20.316:05 2:10 150 120 85.7% 90 20.216:35 2:40 150 120 50 2900 85.7% 90 20.217:05 3:10 150 120 50 2,850 85.3% 90 20.3

IMC Phosphates Treatability Report No. 20117 July 18, 2001
A-13
Table 4 Reverse Osmosis Date (Sodium Hydroxide Pretreated Sample)
Run Influent Effluent Feed Permeate Reject ActualTime Pressure Pressure Sp. Cond. Sp. Cond. Sp. Cond. RecoveryTemp. Actual
Time (Hours) (psi) (psi) (umho/cm) (umho/cm) (umho/cm) ( % ) ( F ) GFD
10:40 0:00 180 150 500 68 3,200 93.8% 80 20.311:10 0:30 190 160 94.5% 85 20.311:40 1:00 190 160 94.4% 85 20.212:10 1:30 195 165 64 5,090 94.4% 85 20.012:40 2:00 195 165 60 5,100 94.4% 85 20.013:10 2:30 200 170 94.6% 85 20.113:40 3:00 200 170 94.6% 85 20.214:10 3:30 200 170 94.7% 85 20.214:40 4:00 200 170 59 5,200 94.4% 85 20.1
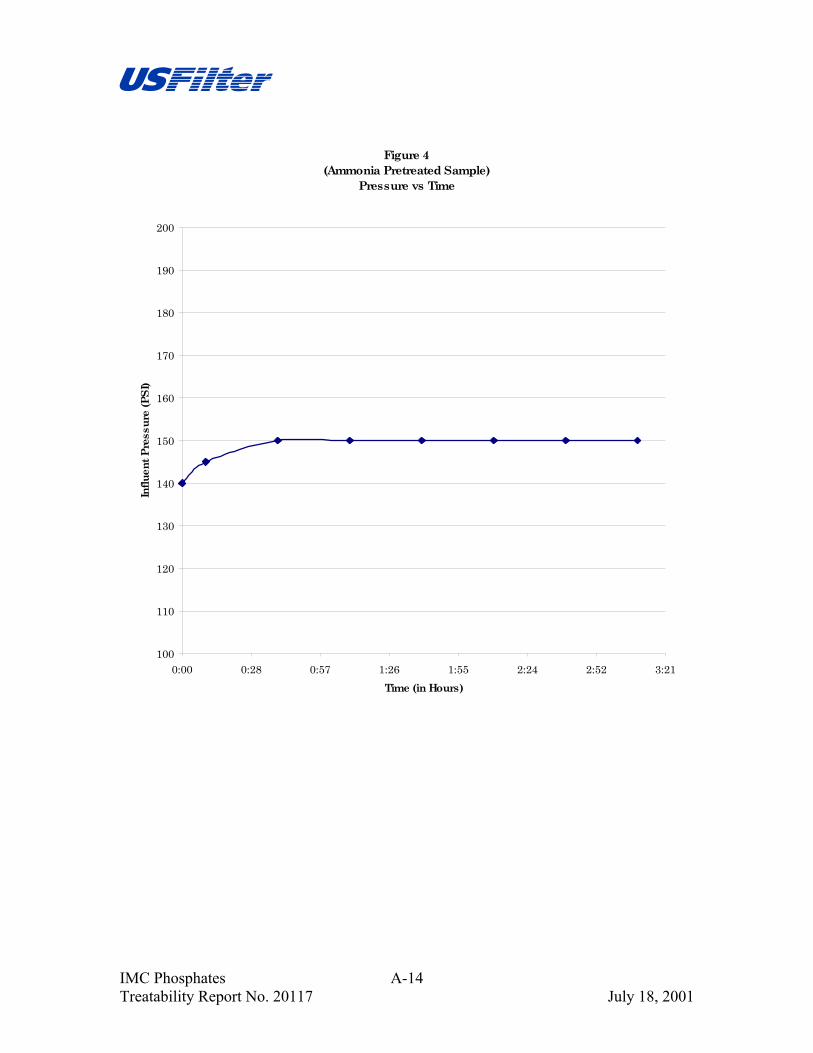
IMC Phosphates Treatability Report No. 20117 July 18, 2001
A-14
Figure 4(Ammonia Pretreated Sample)
Pressure vs Time
100
110
120
130
140
150
160
170
180
190
200
0:00 0:28 0:57 1:26 1:55 2:24 2:52 3:21Time (in Hours)
Influ
ent P
ress
ure
(PSI
)

IMC Phosphates Treatability Report No. 20117 July 18, 2001
A-15
Figure 5(Sodium Hydroxide Pretreated Sample)
Pressure vs Time
0
50
100
150
200
250
300
0 0.5 1 1.5 2 2.5 3 3.5 4 4.5
Time (in Hours )
Influ
ent P
ress
ure
(PSI
)

IMC Phosphates Treatability Report No. 20117 July 18, 2001
A-16
SECTION IV
CONCLUSIONS & RECOMMENDATIONS
• Based on the results achieved in Warrendale, it appears that a sand filtration / two pass reverse osmosis combination is a viable treatment option.
• The ammonia pretreated and sodium hydroxide pretreated samples showed
similar RO performance results.
• Phosphate concentration to greater than 6% as P2O5 was demonstrated in 1st pass RO treatment at 85% recovery (6.6:1).
• Fluoride concentration of < 35ppm as ion found in permeate from 2nd pass.
• First pass system operating pressures of 700 to 1200 psig can be expected
with feed temperature of 77F depending on system recovery.
• Second pass operating pressures of 165 to 220 psig can be expected.
• On-site pilot testing is recommended to determine long term effects and operating conditions
• Cleaning the element from the first pass of reverse osmosis testing required
soaking the element in permeate (generated from the second phase of RO testing) and pH adjusted with sodium hydroxide to pH 13 for two hours.

APPENDIX
U.S. FILTER TREATABILITY TEST REPORT FOR UNCLE SAM POND WATER
Report by Jeff Martin Note: Formats of Tables and Figures in original document were landscape. They have been altered to portrait for presentation in this appendix.

IMC Phosphates Treatability Report No. 20117 July 18, 2001
A-i
IMC PHOSPHATES
TABLE OF CONTENTS Page No.
Section I Background.....................................................................................................1 Section II Sample Description.........................................................................................2 Section III Treatment .......................................................................................................3 A. Sand Filtration........................................................................................3 B. Reverse Osmosis....................................................................................3 Figure 1 – Schematic of RO...................................................................4 1. First Pass .......................................................................................4 a. Operating Conditions ...........................................................4 c. Cleaning ...............................................................................5 d. Results..................................................................................5 Table 1 – Sample 1 Pass 1 - Operating Data ......................6 Table 2 – Sample 2 Pass 1 - Operating Data ......................7 Figure 2 – Sample 1 - Pressure vs. Time .............................8 Figure 3 – Sample 2 - Time vs. GFD...................................9 2. Second Pass.................................................................................10 a. Operating Conditions .........................................................10 b. Cleaning .............................................................................10 c. Results................................................................................10 Table 3 – Sample 1 Pass 2 - Operating Data ....................11 Table 4 – Sample 2 Pass 2 - Operating Data ....................12 Figure 4 – Sample 1 Pass 2 - Pressure vs. Time ...............13 Figure 5 – Sample 2 Pass 2 - Pressure vs. Time ...............14 Section IV Conclusions and Recommendations .............................................................15

IMC Phosphates Treatability Report No. 20117 July 18, 2001
A-1
SECTION I
BACKGROUND
Testing was conducted to determine the feasibility of a two-pass reverse osmosis (RO) treatment process to reduce fluoride concentration in wastewater while concentrating phosphate and other dissolved solids in the RO reject. Two samples were tested: the first sample was pretreated in a precipitation process which included sodium hydroxide, the second sample was pretreated in a precipitation process which included ammonia.
Objectives of the study included:
• Determine which (if any) of the two pretreated samples (sodium hydroxide or ammonia) exhibits the best RO performance as defined by % rejection, operating pressure and membrane fouling characteristics.
• First pass reverse osmosis – determination of RO permeate and
concentrate characteristics at different recovery rates. Determination of operating pressures at different recovery rates. Membrane fouling potential shall also be examined (indicated by an increase in feed pressure and membrane cleaning characteristics).
• Second pass reverse osmosis – determination of RO permeate quality
particularly as it applies to fluoride rejection and membrane fouling potential.

IMC Phosphates Treatability Report No. 20117 July 18, 2001
A-2
SECTION II
SAMPLE DESCRIPTION
Two sets of samples were used during this study.
A. Sample 1
The initial sample set was received on June 8, 2001, and consisted of two – 55 gallon drums labeled ‘Test 1’ and one - 55 gallon drum labeled ‘Test 1 – 3.’ These samples were pretreated in a precipitation process which included sodium hydroxide. The latter sample was taken deeper in a batch pretreatment tank and subsequently may have contained higher concentration of silica. All of the samples were gold-yellow in color with some fluffy gray-white solids, with the majority of the solids settled at the bottom of the drum.
B. Sample 2
The second sample set was received on June 8, 2001, and consisted of two – 55 gallon samples labeled ‘Test 2.’ These samples were pretreated in a precipitation process which included ammonia. The appearance was similar to the initial samples.

IMC Phosphates Treatability Report No. 20117 July 18, 2001
A-3
SECTION III
TREATMENT
The study was conducted in four phases. The first phase (pretreatment) which
was conducted at the IMC – Uncle Sam site. Samples were then shipped to US Filter for the remaining phases of treatment.
The second phase was to filter both of the samples (ammonia pretreated and the
sodium hydroxide pretreated) through a sand column to remove any gross particles. Both samples were filtered independently.
The third phase was 1st pass reverse osmosis - to determine the optimum
operating conditions for both phosphate concentration and permeate quality. This pass used a seawater RO membrane element because of the high conductivity (17,000 – 19,000 µmhos) inherent with the sample. Seawater elements are more desirable to use with samples which are of high conductivity – due to their higher durability under elevated operating pressures.
The fourth phase was 2nd pass reverse osmosis - to determine the ability of the
reverse osmosis membrane to reject fluoride while maintaining a high water flux rate. A. Sand Filtration
Prior to reverse osmosis treatment, both samples were put through a sand filter to remove solids present. The following corresponds to the sand filtration.
Column Material....................................................................Clear PVC Column height ....................................................................... 60” Column Diameter .................................................................. 2 ½” Bed Depth.............................................................................. 36” Area ....................................................................................... 0.034 ft2
Flow rate................................................................................ 6 gpm/ ft2 (770 mls/minute) Pump...................................................................................... Peristaltic Service ...................................................................................Downflow
The pressure during the runs did not exceed 10 psi for filtering either the first or second samples. The column was backwashed prior to filtration of the second sample.
B. Reverse Osmosis The test was performed in two passes – the first pass was to concentrate the majority of the phosphate (as P2O5) in the reject while obtaining a suitable permeate for the second pass – fluoride removal step.

IMC Phosphates Treatability Report No. 20117 July 18, 2001
A-4
The Figure below is a schematic representation of the system used during the testing.
Figure 1 – Reverse Osmosis System
1. First Pass A pilot reverse osmosis system using a new seawater element (SW 2530) was used (Figure 1). The sand filter effluent was pumped through a 5-micron cartridge filter and into the reverse osmosis feed tank. The reverse osmosis system consisted of a 5-HP positive displacement high pressure pump and a single membrane element. The recycle rate was 3 gpm. The main objective in the first pass was to reject 95-98% of the soluble phosphate while determining the optimum membrane flux and % recovery. The ammonia treated sample was the first sample put through the system. After completely exhausting that sample, the sodium hydroxide-treated sample was put through the system. a. Operating Conditions
The RO system was operated at a water flux rate of 8 GFD and a recovery rate of 70 or 80%. Flux rates indicate the gallons of permeate water produced per square foot of membrane area. The recovery rate refers to the percent of permeate water produced. 70% recovery means that for every 100 gallons of feed, 70 gallons of permeate will
T
Permeate
Flow
Reject
Variable Speed Pump
R.O. Element
Feed Tank
P
P

IMC Phosphates Treatability Report No. 20117 July 18, 2001
A-5
be generated. It also indicates that the contaminants in the reject will be concentrated by a factor of 3.3. Temperature was maintain for the majority of the first pass test at about 100F using a chiller unit with cooling coils placed in the RO feed tank. In that membrane flux is relative to feed temperature (flux increases about 10% per 4C rise in temperature) it is important to note the temperature when reviewing operating pressure and flux data.
The first test performed used the ammonia pretreated sample. The Table below depicts the operating conditions.
Array ....................................................................1 Element ................................................................Seawater Dimensions ..........................................................2.5” dia. x 40” long Recycle flow rate .................................................3 gpm Flux ......................................................................8 gfd (maintained) Recovery rate .......................................................70 - 80% Filtration Area......................................................23 ft2
The recovery was altered from 70% to 80% midway through the run while maintaining 8 gfd water flux.
After the test on the ammonia pretreated sample was completed, the sodium hydroxide pretreated sample was put through the system (using the same element).
This second test was performed differently – the pressure was maintained at 850 psi inlet pressure and the recovery rate was maintained at 85%. The flow rate was monitored but not controlled.
b. Cleaning
At the completion of the test, the membrane was cleaned to determine if the flow rate could be recovered after use. Cleaning was done using permeate (2nd pass permeate) that was pH adjusted to 13 with sodium hydroxide, run for 20 minutes and allowed to soak for 2 additional hours. The flux was restored to 95% of the pre-test value.
c. Results
The results from the above testing can be viewed on Tables 1 and 2, as well as graphical representations Figures 2 and 3.

IMC Phosphates Treatability Report No. 20117 July 18, 2001
A-6
Table 1
Reverse Osmosis Run Data (Ammonia Pretreated Sample)
Run Influent Effluent Feed Permeate Reject ActualTime Pressure Pressure Conductivity Conductivity Conductivity Recovery Temperature Actual
Time (Hours) (psi) (psi) (umho/cm) (umho/cm) (umho/cm) ( % ) ( F ) GFD
10:20 0:00 340 310 70.2% 7.810:30 0:10 390 370 17,000 650 35,000 71.1% 100 7.910:40 0:20 390 370 65.7% 6.610:50 0:30 430 400 71.0% 7.711:00 0:40 450 410 71.1% 7.611:15 0:55 470 430 640 44,000 72.4% 105 7.712:00 1:40 490 450 71.7% 107 7.613:30 3:10 505 470 550 47,800 70.1% 102 7.714:00 3:40 510 470 70.7% 102 7.714:30 4:10 510 470 70.8% 103 7.915:00 4:40 510 470 70.2% 102 7.815:50 5:30 570 540 80.0% 102 8.316:00 5:40 610 580 80.8% 103 8.216:20 6:00 620 590 80.5% 102 8.216:30 6:10 640 610 525 48,000 80.4% 102 8.317:00 6:40 650 620 80.2% 102 8.517:30 7:10 650 620 80.4% 103 8.417:45 7:25 650 620 500 49,200 80.3% 103 8.4Shut downRestart 6-20-20017:30 7:25 550 520 80.6% 94 8.68:00 7:55 620 590 80.0% 100 8.38:15 8:10 660 630 80.2% 102 8.48:30 8:25 670 640 540 50,890 80.0% 102 8.39:00 8:55 670 640 80.5% 103 8.39:30 9:25 670 640 520 51,000 80.2% 103 8.410:00 9:55 670 640 490 51,000 80.2% 100 8.410:30 10:25 670 640 79.9% 100 8.411:00 10:55 670 640 80.2% 102 8.411:30 11:25 675 645 80.3% 103 8.212:00 11:55 670 640 470 51,800 80.3% 103 8.2

IMC Phosphates Treatability Report No. 20117 July 18, 2001
A-7
Table 2 Reverse Osmosis Run Data (Sodium Hydroxide Pretreated Sample)
Run Influent Effluent Feed Permeate Reject ActualTime Pressure Pressure Conductivity Conductivity Conductivity RecoveryTemperature Actual
Time (Hours) (psi) (psi) (umho/cm) (umho/cm) (umho/cm) ( % ) ( F ) GFD
11:30 0:00 850 835 19,200 610 43,000 90.6% 88 17.511:40 0:10 850 835 87.4% 102 12.111:50 0:20 850 835 84.2% 102 9.412:00 0:30 850 835 84.5% 102 9.612:30 1:00 850 835 83.9% 102 9.313:00 1:30 850 835 84.5% 102 9.813:30 2:00 850 835 84.0% 102 9.814:00 2:30 850 835 590 56,900 82.8% 102 9.114:30 3:00 850 835 500 57000 84.3% 102 8.815:00 3:30 850 835 84.4% 102 8.515:30 4:00 850 835 490 57000 84.8% 102 8.716:00 4:30 850 835 480 58,200 84.4% 102 8.5

IMC Phosphates Treatability Report No. 20117 July 18, 2001
A-8
Figure 2(Ammonia Pretreated Sample)
Pressure vs Time
0
100
200
300
400
500
600
700
800
0:00 1:12 2:24 3:36 4:48 6:00 7:12 8:24 9:36 10:48 12:00
Time (in Hours )
Influ
ent P
ress
ure
(PSI
)
70% Recovery
80% Recovery

IMC Phosphates Treatability Report No. 20117 July 18, 2001
A-9
Figure 3(Sodium Hydroxide Pretreated Sample)
GFD vs Time
0
2
4
6
8
10
12
14
16
18
20
0.0 0.5 1.0 1.5 2.0 2.5 3.0 3.5 4.0 4.5 5.0
Time (in Hours)
GFD

IMC Phosphates Treatability Report No. 20117 July 18, 2001
A-10
2. Second Pass
The same reverse osmosis system was used for the second pass of testing as was used during the first pass but in the second pass a single BW-2530 membrane element was used. Permeate from the first pass was collected to feed to the second pass. The pH was adjusted to 9.0 using sodium hydroxide (required 220 mg/l for the ammonia pretreated sample, and 240 mg/l for the sodium hydroxide treated sample). The main objective of the second pass was to reduce the fluoride concentration (which after the sodium hydroxide addition would be in the sodium fluoride state) to less than 35 mg/l while optimizing the pressures to achieve the greatest recovery while minimizing the pressure. Both samples were run using the same element, the main difference being the operating conditions. a. Operating Conditions
The first test run (using the ammonia-treated sample permeate from the previous test), the recovery was 85% and 20 GFD was maintained.
The second test run (using the sodium hydroxide treated sample) the recovery was 95% and 20 GFD was maintained.
Array ....................................................................1 Element ................................................................Brackish Water Dimensions ..........................................................2.5” dia. x 40” long Recycle flow rate .................................................3 gpm Flux ......................................................................20 gfd (maintained) Recovery rate .......................................................85 and 95% Filtration Area......................................................23 ft2
b. Cleaning
Cleaning was not required following the testing.
c. Results
The results from the above testing can be viewed on Tables 3 and 4, as well as graphical representations Figures 4 and 5.

IMC Phosphates Treatability Report No. 20117 July 18, 2001
A-11
Table 3 Reverse Osmosis Data (Ammonia Pretreated Sample)
Run Influent Effluent Feed Permeate Reject ActualTime Pressure Pressure Sp. Cond. Sp. Cond. Sp. Cond. RecoveryTemp. Actual
Time (Hours) (psi) (psi) (umho/cm) (umho/cm) (umho/cm) ( % ) ( F ) GFD
13:55 0:00 140 110 540 53 85.7% 88 20.814:05 0:10 145 115 85.7% 90 20.814:35 0:40 150 120 55 2,800 85.5% 90 20.515:05 1:10 150 120 54 2900 85.8% 90 20.415:35 1:40 150 120 52 2900 85.3% 90 20.316:05 2:10 150 120 85.7% 90 20.216:35 2:40 150 120 50 2900 85.7% 90 20.217:05 3:10 150 120 50 2,850 85.3% 90 20.3

IMC Phosphates Treatability Report No. 20117 July 18, 2001
A-12
Table 4 Reverse Osmosis Date (Sodium Hydroxide Pretreated Sample)
Run Influent Effluent Feed Permeate Reject ActualTime Pressure Pressure Sp. Cond. Sp. Cond. Sp. Cond. RecoveryTemp. Actual
Time (Hours) (psi) (psi) (umho/cm) (umho/cm) (umho/cm) ( % ) ( F ) GFD
10:40 0:00 180 150 500 68 3,200 93.8% 80 20.311:10 0:30 190 160 94.5% 85 20.311:40 1:00 190 160 94.4% 85 20.212:10 1:30 195 165 64 5,090 94.4% 85 20.012:40 2:00 195 165 60 5,100 94.4% 85 20.013:10 2:30 200 170 94.6% 85 20.113:40 3:00 200 170 94.6% 85 20.214:10 3:30 200 170 94.7% 85 20.214:40 4:00 200 170 59 5,200 94.4% 85 20.1

IMC Phosphates Treatability Report No. 20117 July 18, 2001
A-13
Figure 4(Ammonia Pretreated Sample)
Pressure vs Time
100
110
120
130
140
150
160
170
180
190
200
0:00 0:28 0:57 1:26 1:55 2:24 2:52 3:21Time (in Hours)
Influ
ent P
ress
ure
(PSI
)

IMC Phosphates Treatability Report No. 20117 July 18, 2001
A-14
Figure 5(Sodium Hydroxide Pretreated Sample)
Pressure vs Time
0
50
100
150
200
250
300
0 0.5 1 1.5 2 2.5 3 3.5 4 4.5
Time (in Hours )
Influ
ent P
ress
ure
(PSI
)

IMC Phosphates Treatability Report No. 20117 July 18, 2001
A-15
SECTION IV
CONCLUSIONS & RECOMMENDATIONS
• Based on the results achieved in Warrendale, it appears that a sand filtration / two pass reverse osmosis combination is a viable treatment option.
• The ammonia pretreated and sodium hydroxide pretreated samples showed
similar RO performance results.
• Phosphate concentration to greater than 6% as P2O5 was demonstrated in 1st pass RO treatment at 85% recovery (6.6:1).
• Fluoride concentration of < 35ppm as ion found in permeate from 2nd pass.
• First pass system operating pressures of 700 to 1200 psig can be expected
with feed temperature of 77F depending on system recovery.
• Second pass operating pressures of 165 to 220 psig can be expected.
• On-site pilot testing is recommended to determine long term effects and operating conditions
• Cleaning the element from the first pass of reverse osmosis testing required
soaking the element in permeate (generated from the second phase of RO testing) and pH adjusted with sodium hydroxide to pH 13 for two hours.