
MOZAMBIQUE Livelihood Zone Descriptions July 2014 · A preliminary livelihood zone map with 32...
79
FEWS NET Mozambique [email protected] www.fews.net FEWS NET is a USAID-funded activity. The content of this report does not necessarily reflect the view of the United States Agency for International Development or the United States Government. MOZAMBIQUE Livelihood Zone Descriptions July 2014 MAP OF LIVELIHOOD ZONES IN MOZAMBIQUE
Transcript of MOZAMBIQUE Livelihood Zone Descriptions July 2014 · A preliminary livelihood zone map with 32...

FEWS NET Mozambique [email protected] www.fews.net
FEWS NET is a USAID-funded activity. The content of this report does not necessarily reflect the view of the United States Agency for International Development or the United States Government.
MOZAMBIQUE Livelihood Zone Descriptions July 2014
MAP OF LIVELIHOOD ZONES IN MOZAMBIQUE
2
MOZAMBIQUE Livelihood Zone Descriptions July 2014
Famine Early Warning Systems Network
TABLE OF CONTENTS
Map of Livelihood Zones in Mozambique ................................................................................................................... 1 Table of Contents ...................................................................................................................................................... 2 Acknowledgements ................................................................................................................................................... 4 Acronyms and Abbreviations ..................................................................................................................................... 5 Livelihood Zoning Methodology ................................................................................................................................. 6 Rural Livelihoods in Mozambique .............................................................................................................................. 8 Recent Events Affecting Food Security and Livelihoods............................................................................................. 10 Lakeshore Basic Staples and Fishing (Zone 1) ............................................................................................................ 11 Zone 1: Seasonal calendar .................................................................................................................................................. 12 Zone 1: Food access calendar for poor households ............................................................................................................ 12
Northern Highland Forest and Tourism (Zone 2) ....................................................................................................... 13 Zone 2: Seasonal calendar .................................................................................................................................................. 14 Zone 2: Food access calendar for poor households ............................................................................................................ 14
Northwestern Tobacco and Maize (Zone 3) .............................................................................................................. 15 Zone 3: Seasonal calendar .................................................................................................................................................. 16 Zone 3: Food access calendar for poor households ............................................................................................................ 16
Northern Cassava, Maize, and Forest (Zone 4) .......................................................................................................... 17 Zone 4: Seasonal calendar .................................................................................................................................................. 18 Zone 4: Food access calendar for poor households ............................................................................................................ 18
Northern Highland with Mixed Cropping (Zone 5) .................................................................................................... 19 Zone 5: Seasonal calendar .................................................................................................................................................. 20 Zone 5: Food access calendar for poor households ............................................................................................................ 20
Northeastern Highland Forest (Zone 6) .................................................................................................................... 21 Zone 6: Seasonal calendar .................................................................................................................................................. 22 Zone 6: Food access calendar for poor households ............................................................................................................ 22
Northeastern Cassava, Cashew, and Coconut (Zone 7) .............................................................................................. 23 Zone 7: Seasonal calendar .................................................................................................................................................. 24 Zone 7: Food access calendar for poor households ............................................................................................................ 24
North‐Central Coastal Fishing (Zone 08) ................................................................................................................... 25 Zone 8: Seasonal calendar .................................................................................................................................................. 26 Zone 8: Food access calendar for poor households ............................................................................................................ 26
Plains with Cassava, Rice, and Fishing (Zone 9) ......................................................................................................... 27 Zone 9: Seasonal calendar .................................................................................................................................................. 28 Zone 9: Food access calendar for poor households ............................................................................................................ 28
Zambezi Valley with Maize and Fishing (Zone 10) ..................................................................................................... 29 Zone 10: Seasonal calendar ................................................................................................................................................ 30 Zone 10: Food access calendar for poor households.......................................................................................................... 30
Northwestern Cropping and Cross‐Border Trade (Zone 11) ....................................................................................... 31 Zone 11: Seasonal calendar ................................................................................................................................................ 32 Zone 11: Food access calendar for poor households.......................................................................................................... 32
Coastal Sugarcane and Fishing (Zone 12) .................................................................................................................. 33 Zone 12: Seasonal calendar ................................................................................................................................................ 34 Zone 12: Food access calendar for poor households.......................................................................................................... 34
Tete Highland Mixed Cropping, Tobacco, and Cotton (Zone 13) ................................................................................ 35 Zone 13: Seasonal calendar ................................................................................................................................................ 36 Zone 13: Food access calendar for poor households.......................................................................................................... 36

3
MOZAMBIQUE Livelihood Zone Descriptions July 2014
Famine Early Warning Systems Network
Cahora Bassa Dam Sesame and Cotton (Zone 14) ..................................................................................................... 37 Zone 14: Seasonal calendar ................................................................................................................................................ 38 Zone 14: Food access calendar for poor households.......................................................................................................... 39
Central Semiarid Cotton and Minerals (Zone 15) ...................................................................................................... 40 Zone 15: Seasonal calendar ................................................................................................................................................ 41 Zone 15: Food access calendar for poor households.......................................................................................................... 41
Manica Highland Mixed Cropping, Cotton, and Tobacco (Zone 16) ............................................................................ 42 Zone 16: Seasonal calendar ................................................................................................................................................ 43 Zone 16: Food access calendar for poor households.......................................................................................................... 43
Central Manica and Sofala Mixed Cropping (Zone 17) ............................................................................................... 44 Zone 17: Seasonal calendar ................................................................................................................................................ 45 Zone 17: Food access calendar for poor households.......................................................................................................... 45
Cheringoma and Muanza Maize and Cassava (Zone 18) ............................................................................................ 46 Zone 18: Seasonal calendar ................................................................................................................................................ 47 Zone 18: Food access calendar for poor households.......................................................................................................... 47
Central Semiarid Pineapple and Cashew (Zone 19) ................................................................................................... 48 Zone 19: Seasonal calendar ................................................................................................................................................ 49 Zone 19: Food access calendar for poor households.......................................................................................................... 49
Southern Coastal Cassava, Coconut, and Fishing (Zone 20) ....................................................................................... 50 Zone 20: Seasonal calendar ................................................................................................................................................ 51 Zone 20: Food access calendar for poor households.......................................................................................................... 51
Southern Intermediate Mixed Cropping (Zone 21) .................................................................................................... 52 Zone 21: Seasonal calendar ................................................................................................................................................ 53 Zone 21: Food access calendar for poor households.......................................................................................................... 53
Southern Semiarid Cereals and Cattle (Zone 22) ....................................................................................................... 54 Zone 22: Seasonal calendar ................................................................................................................................................ 55 Zone 22: Food access calendar for poor households.......................................................................................................... 55
Southeastern Rice (Zone 23) .................................................................................................................................... 56 Zone 23: Seasonal calendar ................................................................................................................................................ 57 Zone 23: Food access calendar for poor households.......................................................................................................... 57
Limpopo and Elephant Rivers Mixed Cropping (Zone 24) .......................................................................................... 58 Zone 24: Seasonal calendar ................................................................................................................................................ 59 Zone 24: Food access calendar for poor households.......................................................................................................... 59
Southern Coastal Fishing, Cassava, and Maize (Zone 25) ........................................................................................... 60 Zone 25: Seasonal calendar ................................................................................................................................................ 61 Zone 25: Food access calendar for poor households.......................................................................................................... 61
Southern Highland Cattle and Mixed Cropping (Zone 26) .......................................................................................... 62 Zone 26: Seasonal calendar ................................................................................................................................................ 63 Zone 26: Food access calendar for poor households.......................................................................................................... 63
Bibliography and references .................................................................................................................................... 64 Administrative Areas and Demographics .................................................................................................................. 65 Population Growth Estimates by District .................................................................................................................. 75 List of Participants ................................................................................................................................................... 78
4
MOZAMBIQUE Livelihood Zone Descriptions July 2014
Famine Early Warning Systems Network
ACKNOWLEDGEMENTS Both the livelihood zoning workshop and the development of this report were led by James Acidri of Evidence for Development (EfD) and Daison Ngirazi of Famine Early Warning Systems Network (FEWS NET) Southern Africa Regional Office, with technical support from Olanda Bata and Antonio Mavie of FEWS NET Mozambique and Gary Sawdon of FEWS NET Washington. This activity was conducted in collaboration with the Government of Mozambique (GoM). Special thanks are extended to the Technical Secretariat for Food Security and Nutrition (SETSAN) and key development partners including the United Nations Development Programme (UNDP) and World Food Programme (WFP), without whose contribution this report could not have been developed. This report will form part of the knowledge base for food security analysis for the GoM, the Ministry of Agriculture Technical Secretariat for Food Security and Nutrition (SETSAN), National Institute of Disaster Management (INGC), and other government agencies, as well as for non‐government partners and FEWS NET’s food security monitoring activities in Mozambique.

5
MOZAMBIQUE Livelihood Zone Descriptions July 2014
Famine Early Warning Systems Network
ACRONYMS AND ABBREVIATIONS C Celsius EfD Evidence for Development FEWS NET Famine Early Warning Systems Network G Gathering, usually for wild foods or products GoM Government of Mozambique Ha Hectare HEA Household Economy Approach IK Payment for Services in Kind INGC National Institute of Disaster Management MAF Ministry of Agriculture and Fisheries Masl Meters above sea level MP Market Purchased food MZN Mozambique Cash United States Agency for International Development MVAC Mozambique Vulnerability Assessment Committee OP Own produced crops SETSAN Technical Secretariat for Food Security and Nutrition USAID United States Agency for International Development USG United States Government UN United Nations UNDP United Nations Development Programme WFP World Food Programme

6
MOZAMBIQUE Livelihood Zone Descriptions July 2014
Famine Early Warning Systems Network
LIVELIHOOD ZONING METHODOLOGY The Livelihood Zone Descriptions product, sometimes called livelihood zoning “Plus”, is based on the Household Economy Approach (http://www.feg‐consulting.com/resource/practitioners‐guide‐to‐hea/practitioners‐guide‐to‐hea/). It includes a traditional livelihoods zoning component (http://www.feg‐consulting.com/resource/practitioners‐guide‐to‐hea/2%20Livelihood%20Zoning.pdf). In addition, some key characteristics of socioeconomic status are explored through the juxtaposition of relatively poorer and relatively better‐off households. This product does not ignore the possible existence of other wealth groups in the zones, such as middle or very poor groups, though for the purpose of this study, we only describe two groups from each zone. The Livelihood Descriptions product provides basic information on livelihoods, including food sources and the main income sources for each group in each zone. A brief description of general livelihood characteristics is also included, along with seasonal and food access calendars for each zone. Finally, the zones most vulnerable to food insecurity are identified. HEA defines a livelihood zone as a geographic area in which households obtain their basic survival needs, notably food and cash income, in similar ways. This means that they typically have similar socio‐economic groupings with similar asset bases, as well as similar consumption patterns. These similarities apply to both good and bad years in that coping strategies in response to shocks within the same livelihood zone are also comparable. For more information on Household Economy Approach principles and analysis, visit the livelihood pages at http://www.fews.net or download “Application of the Livelihood Zone Maps and Profiles for Food Security Analysis and Early Warning.”1 The HEA does not use international or national socioeconomic measures to classify the population. First, because geography tends to define the options for households’ access to food and income, and, secondly, because of the ability to exploit these options and survive a crisis is largely determined by wealth; i.e., that what people have is determined by their productive assets (access to land, capital, livestock), along with their level of education and access to political and social networks, which determines the ways in which they will be able to obtain food and money or how they will address a sudden or long‐term change. Wealth groups have been identified for each livelihood zone based on the aforementioned considerations. Therefore, poor households with little land can work for better‐off households in order to obtain money to buy food, and these better‐off households can use benefits derived from agriculture as capital to participate in trade. It is worth highlighting that wealth can also affect household exposure to a hazard, particularly in conflict situations in which those with greater wealth may become targets of attack. In the event of a crisis, poor and better‐off households will be affected differently and, therefore, it is justified to study them separately, since the differences between households will be critical in an analysis of food security and vulnerability to different hazards. It should be noted that with the HEA approach, “poor” households are poor in relation to other families in their livelihood zone; however, they can find themselves in a better position than poor households of a different livelihood zone. The HEA approach has been set in this way because it aims to facilitate the understanding of differences in the community’s pattern of life, for these differences determine how people will be affected after shocks or changes in income and food access. Livelihood zone maps and descriptions form part of the knowledge base for government, development and co‐operating partners and FEWS NET’s food security monitoring activities. These tools, however, are not designed as a comprehensive analysis of food security or as a complete monitoring tool, but rather to provide points of reference and indicate whether the conditions reported at a given time justify a more in‐depth study. The results presented in this report describe how households may be affected by various shocks. They provide a geographic context for interpreting existing monitoring data on production, prices and other indicators in order to identify potential problems. Rapid assessment teams may be able to use the zoning as a basis for sampling in their studies. The methodology for elaborating the livelihood zone maps and descriptions in this document consisted of the following steps:
1 http://v4.fews.net/docs/Publications/Guidance_Application%20of%20Livelihood%20Zone%20Maps%20and%20Profiles_final_en.pdf
7
MOZAMBIQUE Livelihood Zone Descriptions July 2014
Famine Early Warning Systems Network
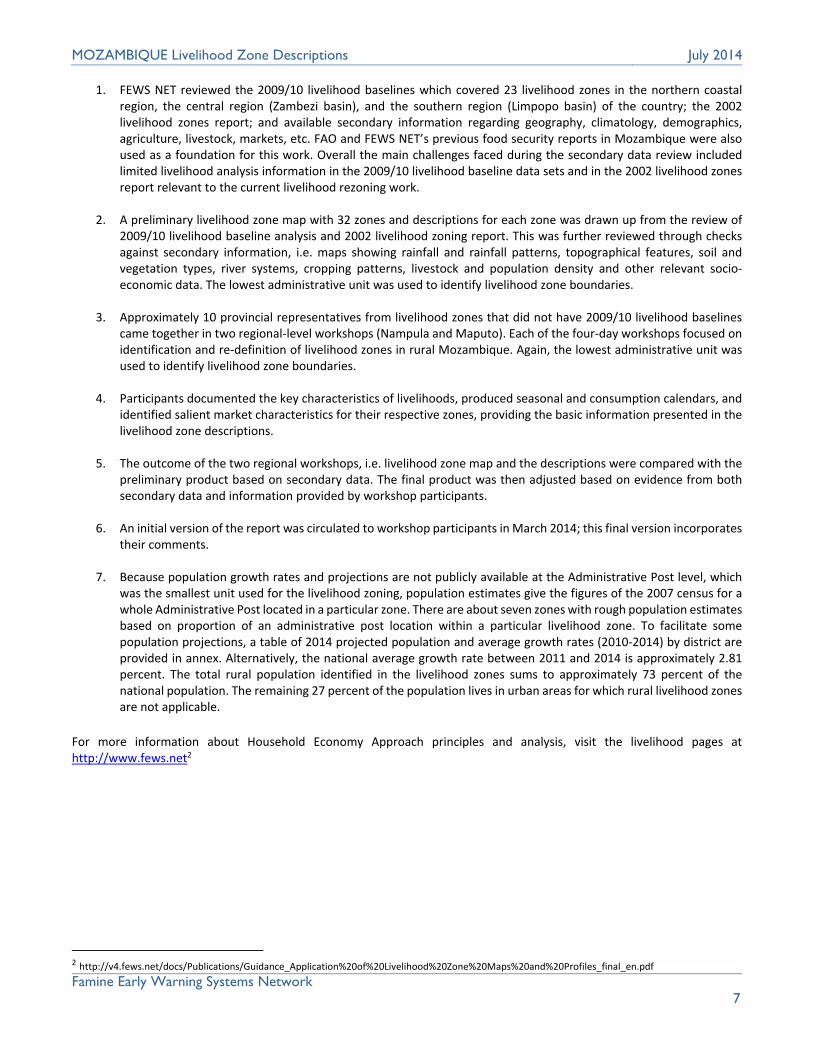
1. FEWS NET reviewed the 2009/10 livelihood baselines which covered 23 livelihood zones in the northern coastal region, the central region (Zambezi basin), and the southern region (Limpopo basin) of the country; the 2002 livelihood zones report; and available secondary information regarding geography, climatology, demographics, agriculture, livestock, markets, etc. FAO and FEWS NET’s previous food security reports in Mozambique were also used as a foundation for this work. Overall the main challenges faced during the secondary data review included limited livelihood analysis information in the 2009/10 livelihood baseline data sets and in the 2002 livelihood zones report relevant to the current livelihood rezoning work.
2. A preliminary livelihood zone map with 32 zones and descriptions for each zone was drawn up from the review of
2009/10 livelihood baseline analysis and 2002 livelihood zoning report. This was further reviewed through checks against secondary information, i.e. maps showing rainfall and rainfall patterns, topographical features, soil and vegetation types, river systems, cropping patterns, livestock and population density and other relevant socio‐economic data. The lowest administrative unit was used to identify livelihood zone boundaries.
3. Approximately 10 provincial representatives from livelihood zones that did not have 2009/10 livelihood baselines
came together in two regional‐level workshops (Nampula and Maputo). Each of the four‐day workshops focused on identification and re‐definition of livelihood zones in rural Mozambique. Again, the lowest administrative unit was used to identify livelihood zone boundaries.
4. Participants documented the key characteristics of livelihoods, produced seasonal and consumption calendars, and
identified salient market characteristics for their respective zones, providing the basic information presented in the livelihood zone descriptions.
5. The outcome of the two regional workshops, i.e. livelihood zone map and the descriptions were compared with the
preliminary product based on secondary data. The final product was then adjusted based on evidence from both secondary data and information provided by workshop participants.
6. An initial version of the report was circulated to workshop participants in March 2014; this final version incorporates
their comments.
7. Because population growth rates and projections are not publicly available at the Administrative Post level, which was the smallest unit used for the livelihood zoning, population estimates give the figures of the 2007 census for a whole Administrative Post located in a particular zone. There are about seven zones with rough population estimates based on proportion of an administrative post location within a particular livelihood zone. To facilitate some population projections, a table of 2014 projected population and average growth rates (2010‐2014) by district are provided in annex. Alternatively, the national average growth rate between 2011 and 2014 is approximately 2.81 percent. The total rural population identified in the livelihood zones sums to approximately 73 percent of the national population. The remaining 27 percent of the population lives in urban areas for which rural livelihood zones are not applicable.
For more information about Household Economy Approach principles and analysis, visit the livelihood pages at http://www.fews.net2
2 http://v4.fews.net/docs/Publications/Guidance_Application%20of%20Livelihood%20Zone%20Maps%20and%20Profiles_final_en.pdf

8
MOZAMBIQUE Livelihood Zone Descriptions July 2014
Famine Early Warning Systems Network
RURAL LIVELIHOODS IN MOZAMBIQUE Mozambique is one of the world's poorest countries. Despite its impressive economic growth rates in recent years, poverty continues to be severe and widespread. A substantial trade imbalance persists, despite the opening of the MOZAL aluminum smelter, the country's largest foreign investment project which has increased export earnings. Overall Mozambique remains dependent upon foreign assistance for much of its annual budget. Poverty is still predominantly a rural phenomenon in Mozambique, where more than 70 per cent of poor households are located. The vast majority of the rural poor still lives on less than 1.25 USD/day and lack basic services such as access to safe water, health facilities and education (National Household Survey‐2008‐2009). Agriculture is the mainstay of Mozambique’s economy and the sector has great potential for growth. Subsistence agriculture continues to employ the vast majority of the country's workforce. Agriculture employs more than 80 percent of the labor force and provides a livelihood for most of the country’s 23 million inhabitants. However despite favorable climatic conditions, with high potential for food self‐sufficiency and even food surplus, , Mozamzique is still a net importer of food. Total annual cereal import requirements average 0.89 million tons (0.14 million of maize, 0.39 of rice and 0.36 of wheat). Mozambique must also import substantial quantities of meat and livestock products. The country's low agricultural productivity results from of a lack of appropriate technology and support. In addition, produce markets are generally distant, unreliable, and uncompetitive for smallholder farmers, who depend on traditional farming methods, low‐yield seed varieties, and manual cultivation techniques. Alternative sources of income outside agriculture are few. Poor rural people have few options to cope with shocks. Mozambique is broadly differentiated by topography (especially altitude), rainfall and temperature, soil type, and texture and proximity to the coast, offering a wide range of production opportunities; agricultural potential is high despite frequent droughts and floods. The arid and semiarid areas (mostly in the south and south‐west) are characterized by poorer soils and scarce rainfall and are subject to recurrent droughts and floods. These areas – together with coastal communities, which suffer extreme isolation – are the poorest in the country. The sub‐humid zones (mostly in the centre and the north), the humid highlands (mostly the central provinces), and the good rainfall and fertility soils of northern and parts of central provinces are generally characterized by agricultural surpluses. Ten broad agro ecological zones are generally recognized, based on agro‐ecological conditions (Figure 1):
R1: The inland Maputo and South Gaza region predominantly a cassava, maize, and cattle producing zone;
R2: Coastal region south of Save River is mainly a cassava, cashew nut, and coconut production zone;
R3: Central and North Gaza and the West Inhambane zone, described as one of the most arid parts of Mozambique, is suitable for sorghum and millet production;
R4: The medium‐altitude region of Central Mozambique is a predominantly maize, sorghum, cassava, and cowpeas production zone;
R5: The low‐altitude region of Sofala and Zambezia is dominated by rice cultivation;
Figure 1. Agro-ecological zones of Mozambique
Source: FAO

9
MOZAMBIQUE Livelihood Zone Descriptions July 2014
Famine Early Warning Systems Network
R6: The semiarid Region of the Zambezi Valley and Southern Tete Province, inclusive of the driest parts of the Zambezi watershed is mainly a sorghum, millet, and cassava production zone;
R7: The medium‐altitude region of Zambezi, Nampula, Tete, Niassa, and Cabo Delgado is mainly dominated by cassava and differentiated into sub‐regions by maize and sorghum;
R8: The coastal littoral of Zambezi, Nampula, and Cabo Delgado is mainly characterized by cassava and millet production; R9: The northern region of Cabo Delgado, inclusive of the plateaus of Mueda and Macomia, is a maize, sorghum, cowpea,
and cassava producing zone; and R10: The high‐altitude region of Zambezi, Niassa, Angonia, and Maravia, including the planaltic regions, is known as a
maize, millet, common beans, and potato zone (IFAD, 2005). The above background information and the expert judgment of participants regarding livelihood activities in rural Mozambique led to identification of 26 broad livelihood zones named as follows:
1. Lakeshore Basic Staples and Fishing 2. Northern Highland Forest and Tourism 3. Northwestern Tobacco and Maize 4. Northern Cassava, Maize, and Forest 5. Northern Highland with Mixed Cropping 6. Northeastern Highland Forest 7. Northeastern Cassava, Cashew, and Coconut 8. North‐Central Coastal Fishing 9. Plains with Cassava, Rice, and Fishing 10. Zambezi Valley with Maize and Fishing 11. Northeastern Cropping and Cross‐Border Trade 12. Coastal Sugarcane and Fishing 13. Tete Highland Mixed Cropping, Tobbaco, and Cotton 14. Cahora Bassa Dam Sesame and Cotton 15. Central Semiarid Cotton and Minerals 16. Manica Highland Mixed Cropping, Cotton, and Tobacco 17. Central Manica and Sofala Mixed Cropping 18. Cheringoma and Muanza Maize and Cassava 19. Central Semiarid Pineapple and Cashew 20. Southern Coastal Cassava, Coconut, and Fishing 21. Southern Intermediate Mixed Cropping 22. Southern Semiarid Cereals and Cattle 23. Southeastern Rice 24. Limpopo and Elephant Rivers Mixed Cropping 25. Southern Coastal Fishing, Cassava, and Maize 26. Southern Highland Cattle and Mixed Cropping
The following zones were considered to be at greatest risk of food insecurity. In general, the risk of food insecurity is greatest in those areas in which there is a high risk of agricultural production failure and where the poorest households have limited opportunities to obtain income and the greatest difficulties in accessing markets; these characteristics are most acute in the interior of the country. Southern Semiarid Cereals and Cattle (Zone 22): This zone is located in the semiarid part of the country, characterized by poor soils with low productivity. It experiences unreliable rainfall and high temperature conditions. There are frequent drought and dry spell conditions, coupled with crop pests and diseases. These factors make it unsuitable for maize production, which is still attempted. Sorghum and millet predominate. Moisture conservation techniques are required in order to ensure reliable cereal production in this zone. The situation is exacerbated by poor access to food markets due to limited infrastructural development. This zone is chronically food insecure and frequently receives food assistance. Zambezi Valley with Maize and Fishing (Zone 10): This zone is also at great risk of food insecurity, due to annual flooding of the Zambezi River. The floods normally devastate crops, livestock and other productive household assets. The recurring floods

10
MOZAMBIQUE Livelihood Zone Descriptions July 2014
Famine Early Warning Systems Network
have reduced household resilience to cope with any natural hazards, constraining the ability of the local population to partially recover from the overall impact of previous floods.
RECENT EVENTS AFFECTING FOOD SECURITY AND LIVELIHOODS
2012/13 The cumulative impact of drought and dry spells over previous years, coupled with a mild drought in specific parts of the country and floods along major river basins, reduced household access to own crops, livestock products and cash income normally derived from crop and livestock sales.
2011/12 Overall rainfall patterns were irregular and below average across most parts of the country and aggravated by cyclones. This affected crop performance and access to local livelihood options in parts of the country. The overall impact on household food security included reduced access to own crops, livestock products, and cash income normally derived from crop and livestock sales.
2010/11 Seasonal river floods caused some crop and livestock destruction; however, the overall national food security situation was satisfactory. An estimated 250, 000 people from low‐income households in semiarid and arid areas of Tete, Gaza, Inhambane and parts of Sofala Provinces faced seasonal food insecurity during the August 2010‐ March 2011 period.
2009/10 Seasonal river floods coupled with dry spells led to poor harvests and above‐average food insecurity, especially in the central and southern regions.

11
MOZAMBIQUE Livelihood Zone Descriptions July 2014
Famine Early Warning Systems Network
LAKESHORE BASIC STAPLES AND FISHING (ZONE 1)
This zone includes the mountain plains of the Niassa region along Lake Niassa which lies within the Great Rift Valley along the border with Malawi. It lies at an altitude of about 1,000‐1,500 meters above sea level and boasts both broadleaf and evergreen forests and grassland. The main natural resources include the Lake Niassa and Lugenda wilderness reserve, which offers additional benefits such as fishing and hunting for local inhabitants of the area, who are predominantly Yao. Precipitation in this zone is among the highest in Mozambique. Average rainfall is about 1,000‐1,400 mm per annum falling from November until the end of March; the dry season runs from April to October. The soils are sandy in texture with moderate fertility, hence less suitable for cropping. The other factor limiting agriculture in this zone is the relatively dense population with an average of approximately 17 people per square kilometer immigration for access to fishing along Lake Niassa, is the perceived cause. The average arable land holding is about 1.6 hectares per household and cultivation is largely done through hand tilling with limited animal traction among better‐off group. Lake Niassa offers the main sources of livelihood through fishing and agriculture. Fishing is mainly concentrated in Lake Niassa (Mozambique side of Lake Malawi), as well as in Amaramba, Chiuta, and Chilwa towards southern part of the zone. This inland water resource provides catches of fish such as chambo (tilapia). Rainfed cassava and maize dominate agricultural production in the zone. Most households also have a few cattle (better‐off) or goats (others). Three main factors determine household wealth: ownership and access to fishing equipment, size of cultivated land, and ownership of livestock. Generally, most households depend on fishing in Lake Niassa and own production for food. Though, the better‐off are more self‐sufficient in agricultural production than the poor, all households complement own production with additional staple food purchases, particularly during the lean season. The poor also receive in kind payment for labor, especially during the peak of agricultural crop season. Most households also rely significantly on fish sales for much of their annual cash income. The poor also sell firewood and charcoal,
locally brewed alcohol, agricultural labor, poles, and bamboo from the natural forests in the zone. Meanwhile, the better‐off group sells cattle and surplus crops and engages in small‐scale or retail trade. Physical market access in this zone has improved significantly in recent years due to rehabilitation of roads and restoration of water transport across Lake Niassa. The main markets are located along the border with Malawi, Cuamba South, and Lichinga and are well stocked with a variety of local products. These markets also enjoy the privileges of dual currency; with both Malawian Kwacha and Mozambique Metical accepted in exchange for goods and services.
Food insecurity risk
Low risk of food insecurity due to diversified livelihood options
2007 population (percent of national population)
401,887 (1.98%)
Main productive assets
Poor Better‐off
Local canoe Net and hook < 1 ha land Goats Poultry Hand tools: hoe, axe, panga, and sickle
Motorboat, canoeNets > 1.5 ha land Cattle Goats Poultry Ox plough
Main foods consumed and sources
Poor Better‐off
Maize (OP, MP, IK) Sorghum (OP) Cassava (OP, MP) Rice (OP, MP) Fish (G)
Maize (OP) Rice (OP) Cassava (OP) Fish (G)
Main income sources
Poor Better‐off
Sale of fish Sale of local brew Sale of firewood and charcoal Sale of agricultural labor Sale of poles Sale of bamboo
Sale of fish Sale of maize Sale of cassava Sale of cattle Small‐scale trade
Main markets
Mozambique: Mecanhelas, Mandimba, Cuamba South, Metangula, and Lichinga Malawi: Namuera, Chiponde, Nayuchee, and Mangochi
Main hazards
Crop pests and diseases December‐April
Human‐wildlife conflicts March‐June
Livestock diseases December‐April
Main coping strategies for poor households
Increased fishing Migratory labor Increased reliance on wild foods
12
MOZAMBIQUE Livelihood Zone Descriptions July 2014
Famine Early Warning Systems Network
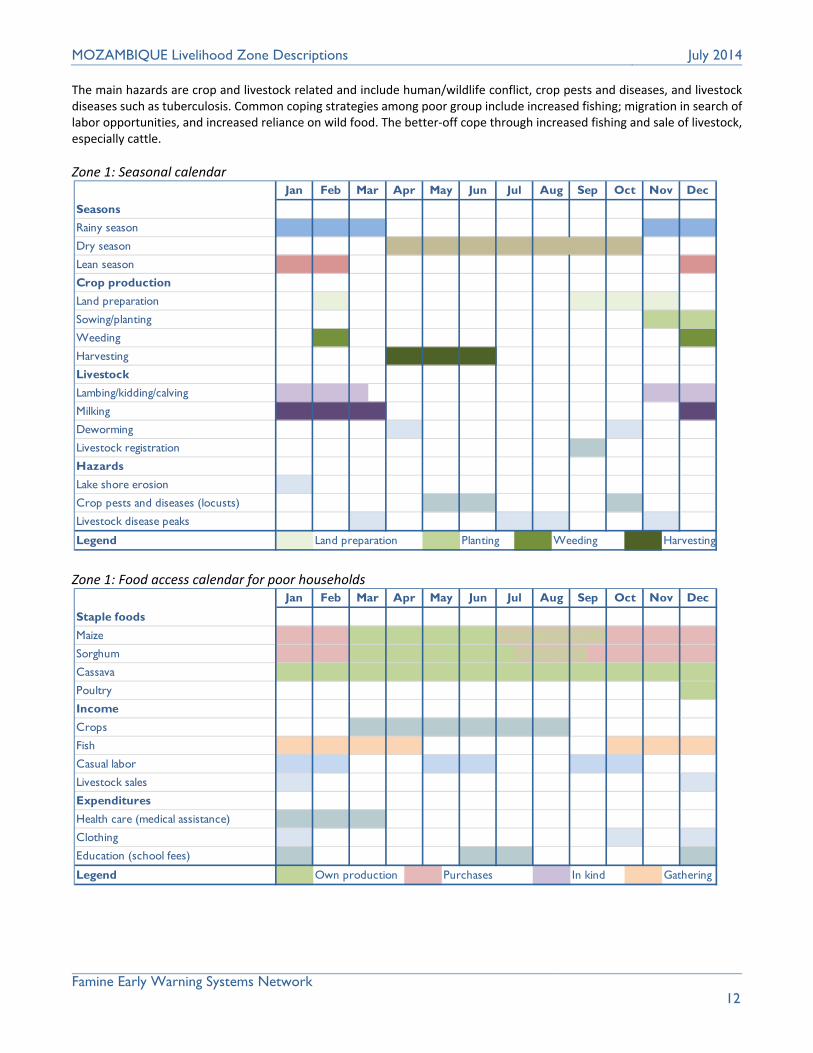
The main hazards are crop and livestock related and include human/wildlife conflict, crop pests and diseases, and livestock diseases such as tuberculosis. Common coping strategies among poor group include increased fishing; migration in search of labor opportunities, and increased reliance on wild food. The better‐off cope through increased fishing and sale of livestock, especially cattle.
Zone 1: Seasonal calendar
Zone 1: Food access calendar for poor households
Seasons
Rainy season
Dry season d d d d d d d d d d d d d d
Lean season l l l l
Crop production
Land preparation
Sowing/planting
Weeding
Harvesting
Livestock
Lambing/kidding/calving b b b b b b b b b
Milking
Deworming 2 2 2 2
Livestock registration 1 1
Hazards
Lake shore erosion 2 2
Crop pests and diseases (locusts) 1 1 1 1 1 1
Livestock disease peaks 2 2 2 2 2 2 2 2
Legend p p Land preparation s s Planting w w Weeding h h Harvesting
Sep Oct Nov DecJan Feb JulMar Apr May Jun Aug
Staple foods
Maize m m m m p p pm pm pm pm pm pm m m m m
Sorghum m m m m p p p p p pm pm pm pm m m m m m
Cassava
Poultry
Income
Crops 1 1 1 1 1 1 1 1 1 1 1 1
Fish c c c c c c c c c c c c c c
Casual labor
Livestock sales
Expenditures
Health care (medical assistance) 1 1 1 1 1 1
Clothing 2 2 2 2 2 2
Education (school fees) 1 1 1 1 1 1 1 1
Legend p p Own production m m Purchases k k In kind c c Gathering
Nov DecJun Jul Aug Sep OctJan Feb Mar Apr May

13
MOZAMBIQUE Livelihood Zone Descriptions July 2014
Famine Early Warning Systems Network
NORTHERN HIGHLAND FOREST AND TOURISM (ZONE 2)
This zone is located in the highland area of northern Mozambique along the border with Tanzania. Its climate is humid and temperate due to higher elevation (> 500 masl). Precipitation is regular with approximately 1000‐1,500 mm per annum, primarily from November until the end of March. The dry season is from April until October. Minimum temperatures range from 12‐18° C during the cold‐dry season months (June and July) and maximum of 30‐35° C between October and November. Soils are deep, red clay, rather fertile and generally suitable for crop farming. These conditions support dense savannah and grassland with pockets of dense broadleaf or evergreen forest. The area has a low population density averaging 2 people per km2 with average land holdings of about 2.7 ha per household. This zone is mainly inhabited by the Makonde people. Local livelihoods are also supported by hunting and gathering, sale of forest products and tourism related employment, all provided by the natural forest. Wildlife in the Niassa Game Reserve provides opportunities for game hunting, gathering, and tourism services. The zone is drained by the Rovuma and Lugenda rivers, which provide opportunities for subsistence fishing. The main food crops grown in this zone include maize, rice, cassava, cowpeas, and Boer beans. Poultry are mainly kept for consumption. The primary determinants of wealth are size of cultivated land, livestock holdings, and access to formal employment or larger‐scale trade. The poor consume own crop production but purchase food during lean period. The better‐off group is largely food self‐sufficient and mainly relies on own crops for consumption. Manual production predominates, creating a demand for labor during the agricultural season that is supplied primarily by poor households. Most households in this zone sell some crops for cash income during the harvest. In addition to selling their labor to middle‐income and wealthier households, the poor also rely on natural resources for cash through sale of firewood, charcoal, fish, and minerals. The better‐off rely on cross‐border trade with Tanzania and employment in tourism and hospitality services offered by Niassa Game Reserve.
Market access with other zones in Mozambique is very limited in this zone due to poor road conditions and the dispersed population. Instead, most households do their marketing in Tanzania. Common hazards include seasonal flooding of the Rovuma River during rainy season and attacks by elephants on household food storage facilities. There are also cases of hyenas attacking poultry and goats within homesteads. Wildfires during dry season pose a threat to local pasturelands. Tourism and cross‐border trade tend to increase the risk of HIV/AIDS in the zone as well. In the event of a shock, the poor cope through increased sale of natural products, casual labor, and borrowing against future harvests. They may also receive more gifts from the wealthy. Better‐off households cope through increased sale of goats and reducing non‐essential expenditures.
Food insecurity risk
Low risk due to reliable rainfall, high food production, and diverse livelihood options
2007 population (percent of national population)
62,176 (0.31%)
Main productive assets
Poor Better‐off
Small area cultivated Goats Hand tools: hoe, axe, panga, and sickle
Large area cultivatedCattle Goats
Main foods consumed and sources
Poor Better‐off
Maize (OP, MP) Cassava (OP) Cow peas (OP, MP) Boer bean (OP, MP) Vegetables (OP, MP) Rice (MP)
Maize (OP) Cassava (OP) Cow peas (OP) Boer bean (OP) Meat (OP, MP) Rice (MP) Vegetables (OP)
Main income sources
Poor Better‐off
Sale of maize Sale of cassava Sale of agricultural labor Sale of fish Sale of local brew Sale of handicrafts Sale of natural products (minerals)
Sale of maize Sale of cassava Sale of goats Sale of timber Informal trade Formal employment (tourism sector) Sale of fish
Main markets
Across the border in Tanzania
Main hazards
Human‐wildlife conflict March‐June
Bush fires July‐December
River floods December‐March
Main coping strategies for poor households
Increased sale of natural products Increased sale of agricultural labor Increased borrowing

14
MOZAMBIQUE Livelihood Zone Descriptions July 2014
Famine Early Warning Systems Network
Zone 2: Seasonal calendar
Zone 2: Food access calendar for poor households
Seasons
Rainy season
Dry season d d d d d d d d d d d d
Lean season
Crop production
Land preparation
Sowing/planting
Weeding
Harvesting
Livestock
Lambing/kidding/calving
Milking
Hazards
Human-wildlife conflict 1 1 1 1 1 1 1 1 1 1 1 1 1 1 1 1 1 1 1 1 1 1 1 1
Bushfires 2
Legend p p Land preparation s s Planting w w Weeding h h Harvesting
DecJan Feb Mar Apr May Jun Jul Aug Sep Oct Nov
Staple foods
Maize p pm pm pm pm pm
Cassava
Meat
Income
Labor 1 1 1 1 1 1 1 1
Fish 2 2 2 2 2 2 2 2 2 2
Minerals 1 1 1 1 1 1 1 1 1 1 1 1
Expenditures
Health care 2 2 2 2 2 2 2 2 2 2 2 2 2 2 2 2 2 2 2 2 2 2 2 2
Education (school fees) 1 1 1 1 1 1 1 1 1 1 1 1
Agricultural inputs 2 2 2 2 2 2 2 2 2 2 2 2
Legend p p Own production m m Purchases k k In kind c c Gathering
DecJan Feb Mar Apr May Jun Jul Aug Sep Oct Nov
15
MOZAMBIQUE Livelihood Zone Descriptions July 2014
Famine Early Warning Systems Network
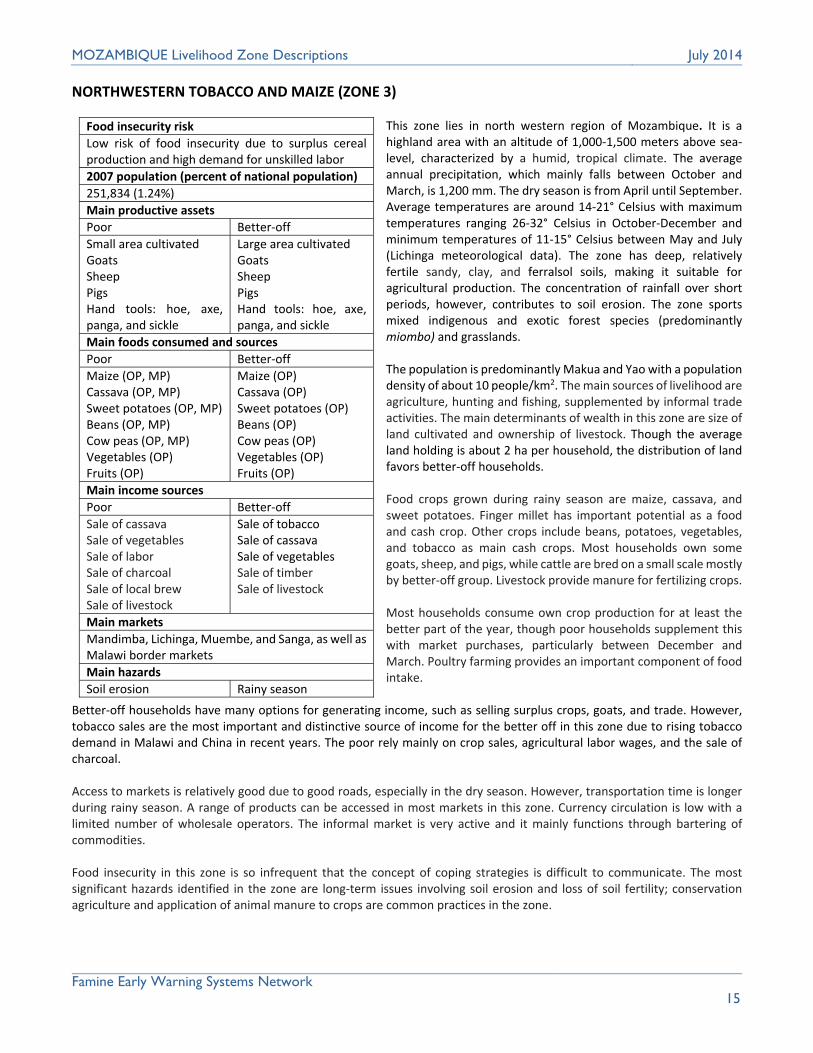
NORTHWESTERN TOBACCO AND MAIZE (ZONE 3)
This zone lies in north western region of Mozambique. It is a highland area with an altitude of 1,000‐1,500 meters above sea‐level, characterized by a humid, tropical climate. The average annual precipitation, which mainly falls between October and March, is 1,200 mm. The dry season is from April until September. Average temperatures are around 14‐21° Celsius with maximum temperatures ranging 26‐32° Celsius in October‐December and minimum temperatures of 11‐15° Celsius between May and July (Lichinga meteorological data). The zone has deep, relatively fertile sandy, clay, and ferralsol soils, making it suitable for agricultural production. The concentration of rainfall over short periods, however, contributes to soil erosion. The zone sports mixed indigenous and exotic forest species (predominantly miombo) and grasslands. The population is predominantly Makua and Yao with a population density of about 10 people/km2. The main sources of livelihood are agriculture, hunting and fishing, supplemented by informal trade activities. The main determinants of wealth in this zone are size of land cultivated and ownership of livestock. Though the average land holding is about 2 ha per household, the distribution of land favors better‐off households. Food crops grown during rainy season are maize, cassava, and sweet potatoes. Finger millet has important potential as a food and cash crop. Other crops include beans, potatoes, vegetables, and tobacco as main cash crops. Most households own some goats, sheep, and pigs, while cattle are bred on a small scale mostly by better‐off group. Livestock provide manure for fertilizing crops. Most households consume own crop production for at least the better part of the year, though poor households supplement this with market purchases, particularly between December and March. Poultry farming provides an important component of food intake.
Better‐off households have many options for generating income, such as selling surplus crops, goats, and trade. However, tobacco sales are the most important and distinctive source of income for the better off in this zone due to rising tobacco demand in Malawi and China in recent years. The poor rely mainly on crop sales, agricultural labor wages, and the sale of charcoal. Access to markets is relatively good due to good roads, especially in the dry season. However, transportation time is longer during rainy season. A range of products can be accessed in most markets in this zone. Currency circulation is low with a limited number of wholesale operators. The informal market is very active and it mainly functions through bartering of commodities. Food insecurity in this zone is so infrequent that the concept of coping strategies is difficult to communicate. The most significant hazards identified in the zone are long‐term issues involving soil erosion and loss of soil fertility; conservation agriculture and application of animal manure to crops are common practices in the zone.
Food insecurity risk
Low risk of food insecurity due to surplus cereal production and high demand for unskilled labor
2007 population (percent of national population)
251,834 (1.24%)
Main productive assets
Poor Better‐off
Small area cultivated Goats Sheep Pigs Hand tools: hoe, axe, panga, and sickle
Large area cultivatedGoats Sheep Pigs Hand tools: hoe, axe, panga, and sickle
Main foods consumed and sources
Poor Better‐off
Maize (OP, MP) Cassava (OP, MP) Sweet potatoes (OP, MP) Beans (OP, MP) Cow peas (OP, MP) Vegetables (OP) Fruits (OP)
Maize (OP) Cassava (OP) Sweet potatoes (OP) Beans (OP) Cow peas (OP) Vegetables (OP) Fruits (OP)
Main income sources
Poor Better‐off
Sale of cassava Sale of vegetables Sale of labor Sale of charcoal Sale of local brew Sale of livestock
Sale of tobacco Sale of cassava Sale of vegetables Sale of timber Sale of livestock
Main markets
Mandimba, Lichinga, Muembe, and Sanga, as well as Malawi border markets
Main hazards
Soil erosion Rainy season
16
MOZAMBIQUE Livelihood Zone Descriptions July 2014
Famine Early Warning Systems Network
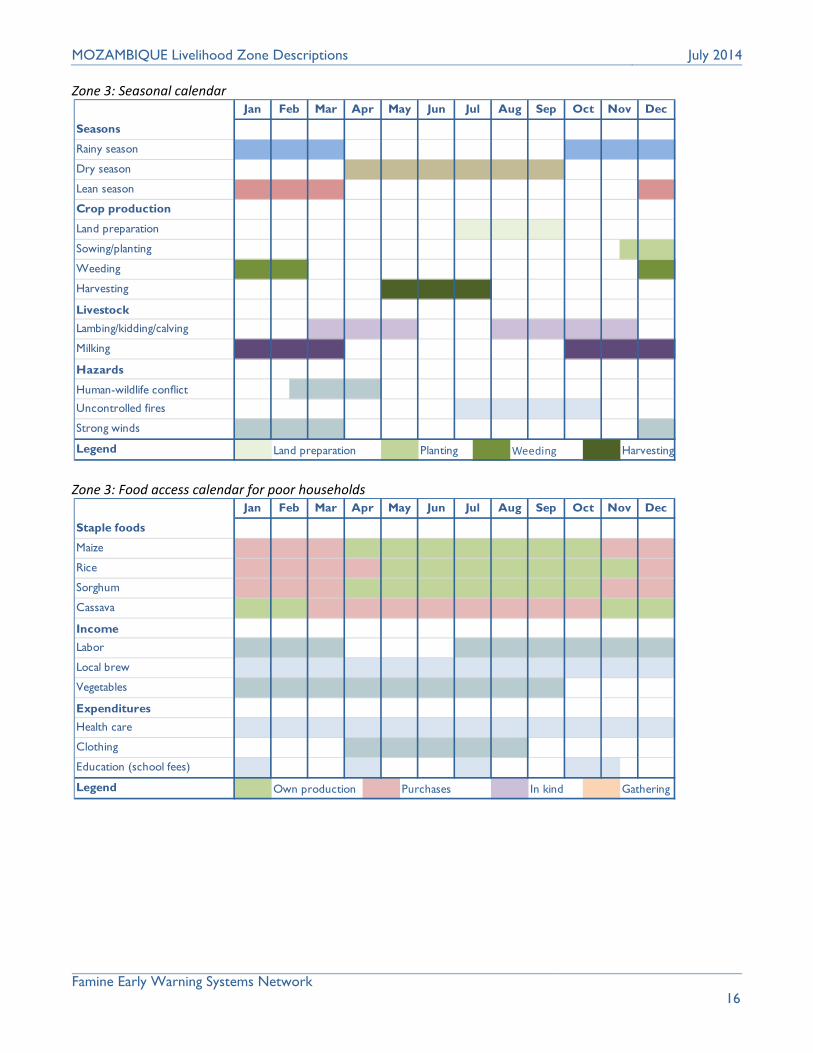
Zone 3: Seasonal calendar
Zone 3: Food access calendar for poor households
Seasons
Rainy season
Dry season
Lean season
Crop production
Land preparation
Sowing/planting
Weeding
Harvesting
Livestock
Lambing/kidding/calving
Milking
Hazards
Human-wildlife conflict 1 1 1 1 1
Uncontrolled fires 2
Strong winds 1 1 1 1 1 1 1 1
Legend p p Land preparation s s Planting w w Weeding h h Harvesting
Oct Nov DecJan Feb JulMar Apr May Jun SepAug
Staple foods
Maize
Rice
Sorghum
Cassava
Income
Labor 1 1 1 1 1 1 1 1 1 1 1 1 1 1 1 1 1 1
Local brew 2 2 2 2
Vegetables 1 1 1 1 1 1 1 1 1 1 1 1 1 1 1 1 1 1
Expenditures
Health care 2 2 2 2
Clothing 1 1 1 1 1 1 1 1 1 1
Education (school fees) 2 2 2 2 2 2 2 2 2
Legend p p Own production m m Purchases k k In kind c c Gathering
Jan Feb Mar Apr May Nov DecJun Jul Aug Sep Oct

17
MOZAMBIQUE Livelihood Zone Descriptions July 2014
Famine Early Warning Systems Network
NORTHERN CASSAVA, MAIZE, AND FOREST (ZONE 4)
This zone is located on the northern plateau of Mozambique and lies within the transitional front of the northeastern coast and interior, at an intermediate altitude of approximately 500‐1,200 masl. This zone is partly drained by the Lurio, Ligonha, and Lugela Rivers. Precipitation in this zone is relatively high at 800‐1,200 mm per annum from November through March. The dry season runs from April until October. The average temperature is around 25‐30 ° Celsius. With moderately fertile sandy and clay soils, the zone boasts mixed forests and savanna grassland, with open forest cover dominating in parts of the zone. The high population density of about 31 people per km2 contributes to relatively low average land holdings of 1‐2 ha per household. The main sources of livelihood include agriculture, hunting, and exploitation of forest products. The main determinants of wealth include; land area cultivated, ownership of livestock and access to other income sources. The main food crops are cassava, rice, sesame, sugarcane, maize, and beans. Some households may grow cotton using a credit scheme. Most households have at least a few poultry and pigs, goats, and poultry. Cattle are mainly kept by the better‐off group. The poor consume primarily maize and cassava from own production, which they supplement with purchases throughout the year but particularly between January and March. The main income sources for the poor include the sale of casual (agricultural) labor, handicrafts, and forest products. The better‐off group has the potential to be self‐sufficient, with food surpluses on an annual basis. However, they are inclined to sell a significant portion of own production for cash, but also in order to purchase preferred or higher‐value foods. Crop and cattle sales are the primary sources of income for the better‐off. Physical access to markets is poor due to distant location of strategic markets. The existence of local wholesalers operating in the zone adds some dynamic to markets in the zone. The major hazards in this zone are droughts or dry spells and
human‐wildlife conflict, particularly with respect to destruction of crops. Most households cope with shocks through increased collection (poor) and consumption (all households) of wild foods; the poor also intensify the search for employment and firewood and charcoal sales.
Food insecurity risk
Moderate risk of food insecurity due to limited access to markets
2007 population (percent of national population)
1,331,301 (6.57%)
Main productive assets
Poor Better‐off
> 1 ha Hand tools: hoe, panga, and axe
>1.5 ha Cattle Hired labor
Main foods consumed and sources
Poor Better‐off
Maize (OP, MP) Cassava (OP, MP) Beans (OP, MP) Vegetables (OP) Groundnuts (OP)
Maize (OP) Rice (OP, MP) Cassava (OP) Meat (OP, MP) Fish (OP, MP) Groundnuts (OP) Vegetables (OP)
Main income sources
Poor Better‐off
Sale of maize Sale of agricultural labor Sale of handicrafts Sale of charcoal and firewood
Sale of maize Sale of rice Sale of cassava Sale of cattle
Main markets
Nampula, Pemba, Mocimbo da Praia, and Quissanga
Main hazards
Human‐wildlife conflict March‐June
Drought December‐March, 1/10 years
Main coping strategies for poor households
Increased consumption of wild foods Increased search for agricultural labor Increased sale of natural products

18
MOZAMBIQUE Livelihood Zone Descriptions July 2014
Famine Early Warning Systems Network
Zone 4: Seasonal calendar
Zone 4: Food access calendar for poor households
Seasons
Rainy season
Dry season
Lean season
Crop production
Land preparation
Sowing/planting
Weeding
Harvesting
Livestock
Lambing/kidding/calving
Milking
Other
High retail food prices
Hazards
Drought/dry spell
Human-wildlife conflict
Legend p p Land preparation s s Planting w w Weeding h h Harvesting
Oct Nov DecJan Feb JulMar Apr May Jun SepAug
Staple foods
Maize m m m m m m p p p p p p p p p p p p p p p p p p
Manioc pm pm pm pm pm pm pm pm pm pm pm pm pm pm pm pm pm pm pm pm pm pm pm pm
Beans pm pm pm pm pm pm pm pm pm pm pm pm pm pm pm pm pm pm pm pm pm pm pm pm
Poultry
Income
Agricultural labor 1 1 1 1 1 1 1 1 1 1 1 1 1 1 1 1 1 1
Handicrafts
Charcoal/firewood 1 1 1 1 1 1 1 1 1 1 1 1 1 1 1 1 1 1 1 1 1 1 1 1
Maize
Game meat 1 1 1 1 1 1 1 1 1 1 1 1 1 1
Expenditures
Food 2 2 2 2 2 2
Batteries 1 1 1 1 1 1 1 1 1 1 1 1 1 1 1 1 1 1 1 1 1 1 1 1
Clothing
Legend p p Own production m m Purchases k k In kind c c Gathering
Jan Feb Mar Apr May Nov DecJun Jul Aug Sep Oct

19
MOZAMBIQUE Livelihood Zone Descriptions July 2014
Famine Early Warning Systems Network
NORTHERN HIGHLAND WITH MIXED CROPPING (ZONE 5)
This zone covers parts of Nampula, Cabo Delgado, Niassa, and Tete provinces. The climate is modified by altitude, which averages about 1,000‐1,500 masl. The average rainfall is this zone is 1,000‐1,500 mm, primarily from October until the end of February. The dry season is from March to September. The average temperature varies from 20 to 28° Celsius between November and February. The soil texture is generally ferrous, with sandy to clay characteristics, making it suitable for agriculture. The vegetation is mainly dense miombo forest with savannah grassland and bushes. This zone is moderately populated compared with neighboring zones and mainly inhabited by the Nyanza and Lomwe people. Suitable agro‐ecological conditions result in a heavy reliance on rainfed agriculture for own consumption, as a source of income from crop sales, and as a source of income from labor demand. The average land holding is about 0.5‐2 hectares per household, on which people grow maize, sweet potatoes, garlic, beans, and vegetables, fruits (orange and mango), as well as tobacco and cotton, which has been practiced over several decades. Maize is the predominant crop, and yields are relatively high compared to neighboring zones. The chief local determinants of wealth are land size cultivated, land area under cash crops, and ownership of livestock. The poor consume own production year‐round with supplements of maize or rice, particularly between October and February. All households earn a significant portion of income from the sale of various food and cash crops. Other sources of income available to the poor group include sale of goats, agricultural labor in the tea estates, firewood, charcoal, and cash remittances. The better‐off group mainly consumes their own crops; however they do purchase some non‐staple foods as well. While cash crop sales make up a significant portion of their income, the better‐off also sell surplus food crops and timber and minerals extracted from the zone and engage in formal trade. Access to markets is good, and there is considerable circulation of cash and other products. There are no wholesalers in this zone. The main highway linking the northern and southern regions of Mozambique provides additional opportunities particularly for the sale of fresh agriculture produce. This zone is the most productive of the entire northern region and experiences minimal hazards. The main challenges faced by communities include low producer prices for crops during the harvest between April and June. Variation in rainfall and
temperature occur, but conditions still sustain average production levels. Droughts are rare with a frequency of once in ten years. The majority of households cope through increased sale of livestock, though the poor also intensify firewood and charcoal sales.
Food insecurity risk
Low risk of food insecurity due to high yields, surplus production, and diverse income‐earning opportunities
2007 population (percent of national population)
2,970,512 (14.67%)
Main productive assets
Poor Better‐off
<1 ha cultivated Goats Poultry Hand tools: hoe, axe, panga, and sickle
>1 ha cultivated Cattle Goats Poultry
Main foods consumed and sources
Poor Better‐off
Maize (OP, MP) Cassava (OP) Sorghum (OP, MP) Sweet potatoes (OP, MP) Vegetables (OP, MP) Beans (OP, MP)
Maize (OP) Rice (OP, MP) Sweet potatoes (OP) Beans (OP) Meat (OP) Vegetables (OP)
Main income sources
Poor Better‐off
Sale of maize Sale of cotton Sale of tobacco Sale of goats Sale of agricultural labor Sale of handicrafts, firewood, and charcoal Sale of local brew Cash remittances
Sale of maize Sale of cotton Sale of tobacco Sale of cattle Sale of timber Sale of minerals Informal trade
Main markets
Nampula, Nacala Porto, Nacala Corridor and Mecuburi in the zone. Road side marketing of produce along the EN1 road.
Main hazards Approximate frequency
Drought December‐March, 1/10 years
Low producer prices for crops
April‐June
Main coping strategies for poor households
Increased sale of goats Increased search for agricultural labor Increased sale of firewood and charcoal

20
MOZAMBIQUE Livelihood Zone Descriptions July 2014
Famine Early Warning Systems Network
Zone 5: Seasonal calendar
Zone 5: Food access calendar for poor households
Seasons
Rainy season
Dry season d
Lean season
Crop production
Land preparation
Sowing/planting
Weeding
Harvesting
Livestock
Lambing/kidding/calving
Milking
Legend p p Land preparation s s Planting w w Weeding h h Harvesting
Sep Oct Nov DecJan Feb JulMar Apr May Jun Aug
Staple foods
Cassava
Maize m m m m p p p p p p p p pm pm pm pm pm pm pm m m m m m
Sorghum p p p p p p p p p p p p pm pm pm
Groundnuts p p p p p
Rice
Income
Cotton 1 1 1 1 1 1 1 1
Tobacco 2 2 2 2 2
Sesame 1 1 1 1
Cashew nuts 2 2 2 2
Expenditures
Education (school fees) 1 1 1 1 1 1
Health care 2 2 2 2 2 2 2 2 2 2 2 2 2 2 2 2 2 2 2 2 2
Legend p p Own production m m Purchases k k In kind c c Gathering
Jan Feb Mar Apr May Nov DecJun Jul Aug Sep Oct

21
MOZAMBIQUE Livelihood Zone Descriptions July 2014
Famine Early Warning Systems Network
NORTHEASTERN HIGHLAND FOREST (ZONE 6)
Three rivers cut through this transitional plateau (500‐1,200 masl) in Cabo Delgado bordering Tanzania: the Rovuma, Lugenda, and Messalo. Average rainfall in this area is 800‐1,200 mm per annum from December to end of April, and the dry season runs from May to November. Average temperatures are about 21 to 28° Celsius. The sandy‐clay soils support dense, open forests and savanna grassland. This zone is moderately populated with an average of eight people/km2 and land holding of 2.5 hectares per household. The main sources of livelihood include agriculture, fishing and forest products. The fishing is mainly in the Messalo and Rovuma rivers and other local products from natural forest cover within the zone. The main food crops grown are cassava, rice, sesame, sugar cane, maize, and beans. The main animals bred are pigs, goats, and poultry with cattle kept by mostly better‐off households. The key factors influencing wealth in this zone are land ownership and title, access to draught power for cultivation, and livestock ownership. Access to draught power enables the better‐off group to cultivate enough land to be self‐sufficient in food production. In addition to crop sales, the better‐off also earn income through timber and livestock sales, cross‐border trade, and formal employment. The poor may consume their own production or in‐kind payments for agricultural labor for about three‐fourths of the year, turning to markets primarily between January and March. Poor households are largely dependent on the sale of their labor to middle and wealthy households for income, though they also sell some crops, charcoal and firewood, handicrafts, etc. This zone is far from main markets and trade routes. Trade across the border in Tanzania is only possible during the dry season due to flooding during rainy season. The zone is mostly affected by flooding along three major rivers and by low post harvest producer prices for crops. Given difficulties in market access, the prices of manufactured products are relatively high, and producer prices for local crops are relatively low. In the event of a shock, the poor may increase the search for labor
opportunities or the sale of firewood and charcoal. They may also expect to receive gifts from the better‐off, who may increase the sale of goats and reduce non‐essential expenditures.
Food insecurity risk
Moderate risk of food insecurity caused by limited access to markets and diversified livelihood options
2007 population (percent of national population)
245,414 (1.21%)
Main productive assets
Poor Better‐off
Untitled land Goats Poultry Hand tools: hoe, axe, panga, and sickle Fishing net and hooks
Titled land Cattle Goats Poultry Ox plough
Main foods consumed and sources
Poor Better‐off
Cassava (OP) Maize (OP, MP) Rice (OP, MP) Sesame (OP) Beans (OP)
Cassava (OP) Maize (OP) Rice (OP, MP) Sesame (OP) Beans (OP)
Main income sources
Poor Better‐off
Sale of maize Sale of cassava Sale of agricultural labor Sale of charcoal Sale of firewood Sale of handicrafts Sale of local brew
Sale of maize Sale of cassava Sale of timber Sale of goats Cross border trade Formal employment
Main markets
Nampula, border markets in Tanzania, Nangade, Mueda, and Muidumbe
Main hazards
Floods along the river plains
December‐March
Livestock diseases December‐March
Low producer prices April‐June
Main coping strategies for poor households
Increased casual labor Increase sale of firewood and charcoal

22
MOZAMBIQUE Livelihood Zone Descriptions July 2014
Famine Early Warning Systems Network
Zone 6: Seasonal calendar
Zone 6: Food access calendar for poor households
Seasons
Rainy season
Dry season d d
Lean season
Crop production
Land preparation
Sowing/planting
Weeding
Harvesting
Livestock
Lambing/kidding/calving
Milking
Deworming 1 1 1 1 1 1 1 1
Hazards
Flooding 2 2 2 2 2 2 2 2
Livestock diseases 1 1 1 1 1 1 1 1
Legend p p Land preparation s s Planting w w Weeding h h Harvesting
Sep Oct Nov DecJan Feb JulMar Apr May Jun Aug
Staple foods
Maize m m m m m m m p p p p p p p m m m m m m
Cassava p p p p p p p p p p p p
Beans p p p p p p p p p p p p p p p p p p
Income
Cashew nuts 1 1 1 1 1 1
Sesame 2 2 2 2 2 2 2 2 2 2 2 2
Expenditures
Education (school fees) 1 1 1 1 1 1
Health care 2 2 2 2 2 2 2 2 2 2 2 2 2 2
Legend p p Own production m m Purchases k k In kind c c Gathering
Nov DecJun Jul Aug Sep OctJan Feb Mar Apr May
23
MOZAMBIQUE Livelihood Zone Descriptions July 2014
Famine Early Warning Systems Network
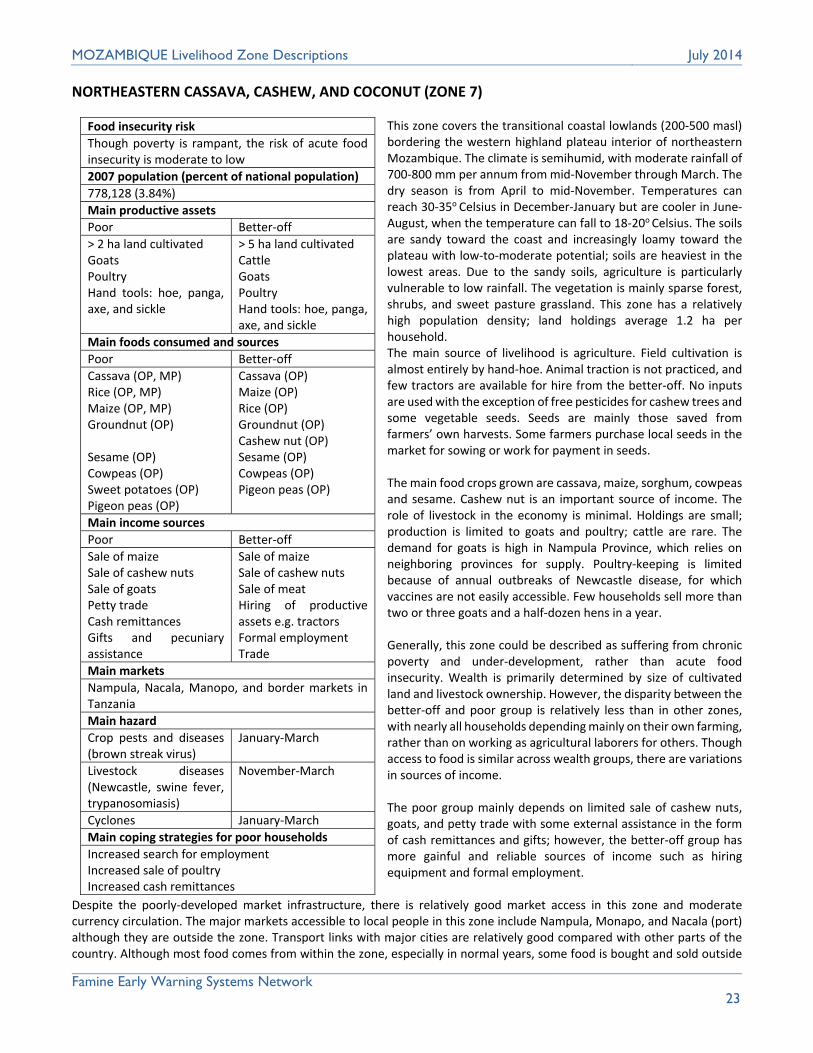
NORTHEASTERN CASSAVA, CASHEW, AND COCONUT (ZONE 7)
This zone covers the transitional coastal lowlands (200‐500 masl) bordering the western highland plateau interior of northeastern Mozambique. The climate is semihumid, with moderate rainfall of 700‐800 mm per annum from mid‐November through March. The dry season is from April to mid‐November. Temperatures can reach 30‐35o Celsius in December‐January but are cooler in June‐August, when the temperature can fall to 18‐20o Celsius. The soils are sandy toward the coast and increasingly loamy toward the plateau with low‐to‐moderate potential; soils are heaviest in the lowest areas. Due to the sandy soils, agriculture is particularly vulnerable to low rainfall. The vegetation is mainly sparse forest, shrubs, and sweet pasture grassland. This zone has a relatively high population density; land holdings average 1.2 ha per household. The main source of livelihood is agriculture. Field cultivation is almost entirely by hand‐hoe. Animal traction is not practiced, and few tractors are available for hire from the better‐off. No inputs are used with the exception of free pesticides for cashew trees and some vegetable seeds. Seeds are mainly those saved from farmers’ own harvests. Some farmers purchase local seeds in the market for sowing or work for payment in seeds. The main food crops grown are cassava, maize, sorghum, cowpeas and sesame. Cashew nut is an important source of income. The role of livestock in the economy is minimal. Holdings are small; production is limited to goats and poultry; cattle are rare. The demand for goats is high in Nampula Province, which relies on neighboring provinces for supply. Poultry‐keeping is limited because of annual outbreaks of Newcastle disease, for which vaccines are not easily accessible. Few households sell more than two or three goats and a half‐dozen hens in a year. Generally, this zone could be described as suffering from chronic poverty and under‐development, rather than acute food insecurity. Wealth is primarily determined by size of cultivated land and livestock ownership. However, the disparity between the better‐off and poor group is relatively less than in other zones, with nearly all households depending mainly on their own farming, rather than on working as agricultural laborers for others. Though access to food is similar across wealth groups, there are variations in sources of income. The poor group mainly depends on limited sale of cashew nuts, goats, and petty trade with some external assistance in the form of cash remittances and gifts; however, the better‐off group has more gainful and reliable sources of income such as hiring equipment and formal employment.
Despite the poorly‐developed market infrastructure, there is relatively good market access in this zone and moderate currency circulation. The major markets accessible to local people in this zone include Nampula, Monapo, and Nacala (port) although they are outside the zone. Transport links with major cities are relatively good compared with other parts of the country. Although most food comes from within the zone, especially in normal years, some food is bought and sold outside
Food insecurity risk
Though poverty is rampant, the risk of acute food insecurity is moderate to low
2007 population (percent of national population)
778,128 (3.84%)
Main productive assets
Poor Better‐off
> 2 ha land cultivated Goats Poultry Hand tools: hoe, panga, axe, and sickle
> 5 ha land cultivatedCattle Goats Poultry Hand tools: hoe, panga, axe, and sickle
Main foods consumed and sources
Poor Better‐off
Cassava (OP, MP) Rice (OP, MP) Maize (OP, MP) Groundnut (OP) Sesame (OP) Cowpeas (OP) Sweet potatoes (OP) Pigeon peas (OP)
Cassava (OP) Maize (OP) Rice (OP) Groundnut (OP) Cashew nut (OP) Sesame (OP) Cowpeas (OP) Pigeon peas (OP)
Main income sources
Poor Better‐off
Sale of maize Sale of cashew nuts Sale of goats Petty trade Cash remittances Gifts and pecuniary assistance
Sale of maize Sale of cashew nuts Sale of meat Hiring of productive assets e.g. tractors Formal employment Trade
Main markets
Nampula, Nacala, Manopo, and border markets in Tanzania
Main hazard
Crop pests and diseases (brown streak virus)
January‐March
Livestock diseases (Newcastle, swine fever, trypanosomiasis)
November‐March
Cyclones January‐March
Main coping strategies for poor households
Increased search for employment Increased sale of poultry Increased cash remittances

24
MOZAMBIQUE Livelihood Zone Descriptions July 2014
Famine Early Warning Systems Network
the zone. Some cassava is brought in from other parts of Nampula Province, and maize comes from northern Zambezia Province and Nampula town. Most food prices are inevitably higher in the lean season, although prices of the main staple, dried cassava, do not show too much seasonality. The main hazards are crop and livestock disease, as well as cyclones, particularly for parts of the zone in Nampula. The poor group normally copes through increased search for employment, increased reliance on cash remittances, and sale of poultry. They may also expect some gifts from better‐off households. The better‐off group sells goats and reduces on non‐essential expenditures.
Zone 7: Seasonal calendar
Zone 7: Food access calendar for poor households
Seasons
Rainy season
Dry season d d d d d d
Lean season l l l l l l
Crop production
Land preparation
Sowing/planting
Weeding
Harvesting
Livestock
Lambing/kidding/calving
Milking
Hazards
Crop pests, diseases 1 1 1 1 1 1
Livestock diseases
Legend p p Land preparation s s Planting w w Weeding h h Harvesting
Sep Oct Nov DecJan Feb JulMar Apr May Jun Aug
Staple foods
Rice m m m m m m p p p p p p p p p p p p p m m
Cassava m m m m m m p p p p p p p p p p p p p
Beans
Income
Cashew nut 1 1 1 1 1 1 1 1 1 1 1
Cash remittances 2 2
Petty trade 1 1 1 1 1 1 1 1 1 1 1 1 1 1 1 1 1 1 1 1 1 1 1 1
Expenditures
Education (school fees)
Health care 1 1 1 1 1 1 1 1 1 1 1 1 1 1 1 1 1 1 1 1 1 1 1 1
Legend p p Own production m m Purchases k k In kind c c Gathering
Jan Feb Mar Apr May Nov DecJun Jul Aug Sep Oct
25
MOZAMBIQUE Livelihood Zone Descriptions July 2014
Famine Early Warning Systems Network
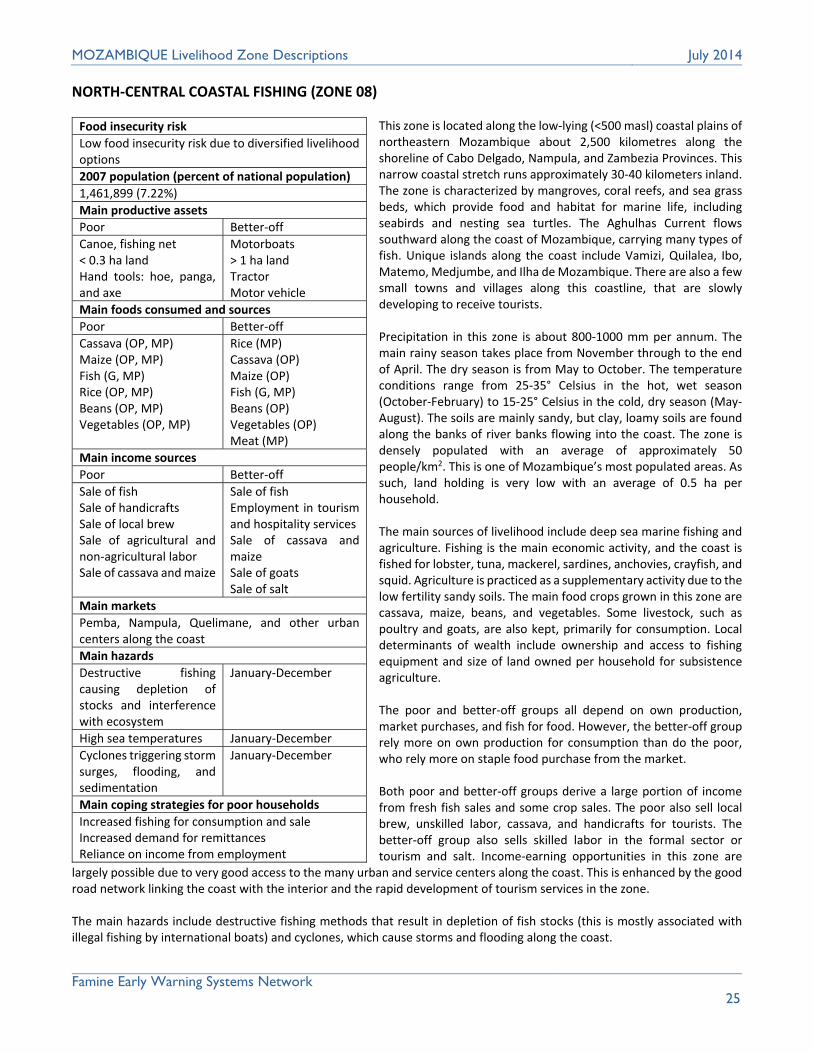
NORTH‐CENTRAL COASTAL FISHING (ZONE 08)
This zone is located along the low‐lying (<500 masl) coastal plains of northeastern Mozambique about 2,500 kilometres along the shoreline of Cabo Delgado, Nampula, and Zambezia Provinces. This narrow coastal stretch runs approximately 30‐40 kilometers inland. The zone is characterized by mangroves, coral reefs, and sea grass beds, which provide food and habitat for marine life, including seabirds and nesting sea turtles. The Aghulhas Current flows southward along the coast of Mozambique, carrying many types of fish. Unique islands along the coast include Vamizi, Quilalea, Ibo, Matemo, Medjumbe, and Ilha de Mozambique. There are also a few small towns and villages along this coastline, that are slowly developing to receive tourists. Precipitation in this zone is about 800‐1000 mm per annum. The main rainy season takes place from November through to the end of April. The dry season is from May to October. The temperature conditions range from 25‐35° Celsius in the hot, wet season (October‐February) to 15‐25° Celsius in the cold, dry season (May‐August). The soils are mainly sandy, but clay, loamy soils are found along the banks of river banks flowing into the coast. The zone is densely populated with an average of approximately 50 people/km2. This is one of Mozambique’s most populated areas. As such, land holding is very low with an average of 0.5 ha per household. The main sources of livelihood include deep sea marine fishing and agriculture. Fishing is the main economic activity, and the coast is fished for lobster, tuna, mackerel, sardines, anchovies, crayfish, and squid. Agriculture is practiced as a supplementary activity due to the low fertility sandy soils. The main food crops grown in this zone are cassava, maize, beans, and vegetables. Some livestock, such as poultry and goats, are also kept, primarily for consumption. Local determinants of wealth include ownership and access to fishing equipment and size of land owned per household for subsistence agriculture. The poor and better‐off groups all depend on own production, market purchases, and fish for food. However, the better‐off group rely more on own production for consumption than do the poor, who rely more on staple food purchase from the market. Both poor and better‐off groups derive a large portion of income from fresh fish sales and some crop sales. The poor also sell local brew, unskilled labor, cassava, and handicrafts for tourists. The better‐off group also sells skilled labor in the formal sector or tourism and salt. Income‐earning opportunities in this zone are
largely possible due to very good access to the many urban and service centers along the coast. This is enhanced by the good road network linking the coast with the interior and the rapid development of tourism services in the zone. The main hazards include destructive fishing methods that result in depletion of fish stocks (this is mostly associated with illegal fishing by international boats) and cyclones, which cause storms and flooding along the coast.
Food insecurity risk
Low food insecurity risk due to diversified livelihood options
2007 population (percent of national population)
1,461,899 (7.22%)
Main productive assets
Poor Better‐off
Canoe, fishing net < 0.3 ha land Hand tools: hoe, panga, and axe
Motorboats > 1 ha land Tractor Motor vehicle
Main foods consumed and sources
Poor Better‐off
Cassava (OP, MP) Maize (OP, MP) Fish (G, MP) Rice (OP, MP) Beans (OP, MP) Vegetables (OP, MP)
Rice (MP) Cassava (OP) Maize (OP) Fish (G, MP) Beans (OP) Vegetables (OP) Meat (MP)
Main income sources
Poor Better‐off
Sale of fish Sale of handicrafts Sale of local brew Sale of agricultural and non‐agricultural labor Sale of cassava and maize
Sale of fish Employment in tourism and hospitality services Sale of cassava and maize Sale of goats Sale of salt
Main markets
Pemba, Nampula, Quelimane, and other urban centers along the coast
Main hazards
Destructive fishing causing depletion of stocks and interference with ecosystem
January‐December
High sea temperatures January‐December
Cyclones triggering storm surges, flooding, and sedimentation
January‐December
Main coping strategies for poor households
Increased fishing for consumption and sale Increased demand for remittances Reliance on income from employment
26
MOZAMBIQUE Livelihood Zone Descriptions July 2014
Famine Early Warning Systems Network
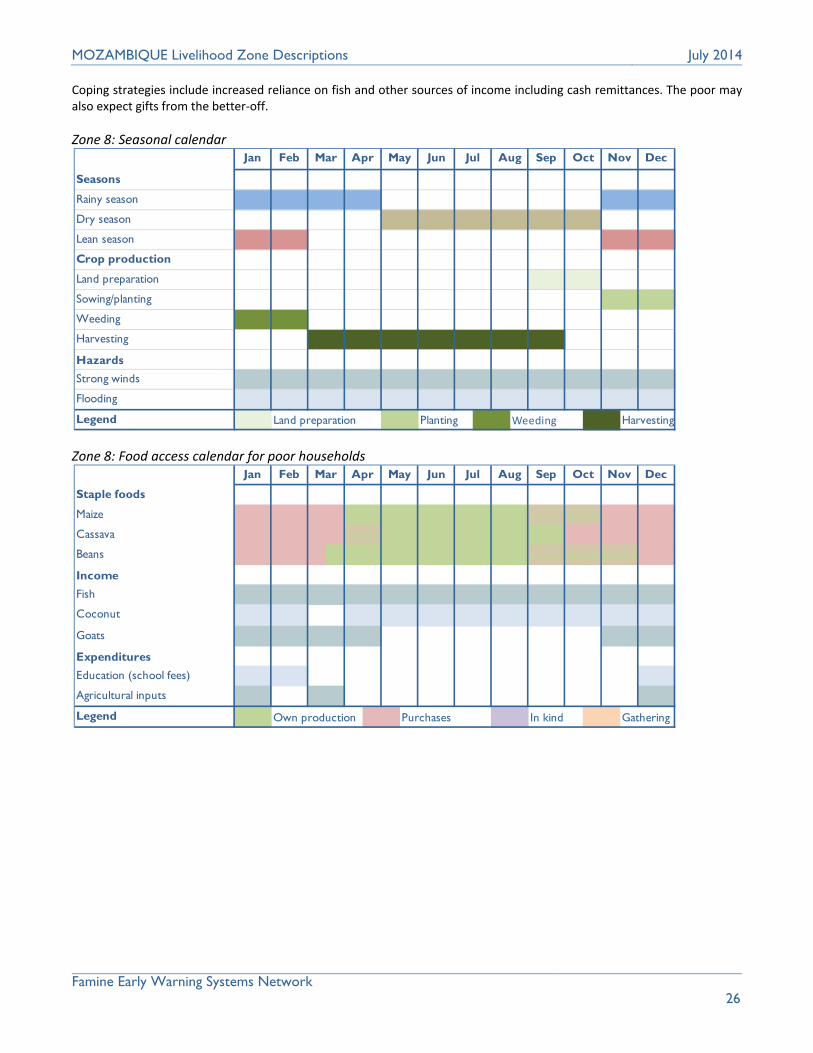
Coping strategies include increased reliance on fish and other sources of income including cash remittances. The poor may also expect gifts from the better‐off.
Zone 8: Seasonal calendar
Zone 8: Food access calendar for poor households
Seasons
Rainy season
Dry season d d d d d d d d d d d d
Lean season l l l l l l l l
Crop production
Land preparation p p p p
Sowing/planting s s s s
Weeding w w w w
Harvesting h h h h h h h h h h h h h h
Hazards
Strong winds 1 1 1 1 1 1 1 1 1 1 1 1 1 1 1 1 1 1 1 1 1 1 1 1
Flooding
Legend p p Land preparation s s Planting w w Weeding h h Harvesting
Sep Oct Nov DecJan Feb JulMar Apr May Jun Aug
Staple foods
Maize m m m m m m P P P P P P P P P P pm pm pm pm m m m m
Cassava m m m m m m pm pm p p p p p p p p p p m m m m m m
Beans m m m m m p p p p p p p p p p pm pm pm pm pm pm m m
Income
Fish 1 1 1 1 1 1 1 1 1 1 1 1 1 1 1 1 1 1 1 1 1 1 1 1
Coconut 2 2 2 2 2 2 2 2 2 2 2 2 2 2 2 2 2 2 2 2 2 2
Goats 1 1 1 1 1 1 1 1 1 1 1 1
Expenditures
Education (school fees) 2 2 2 2 2 2
Agricultural inputs 1 1 1 1 1 1
Legend p p Own production m m Purchases k k In kind c c Gathering
Nov DecJun Jul Aug Sep OctJan Feb Mar Apr May

27
MOZAMBIQUE Livelihood Zone Descriptions July 2014
Famine Early Warning Systems Network
PLAINS WITH CASSAVA, RICE, AND FISHING (ZONE 9)
This zone is located in the central part of Mozambique, towards the southern part of Zambezia province. The climate is tropical humid, and the topography is mainly lowland plains and plateaus about 200 masl. Overall precipitation is about 600‐1,300 mm per annum, mainly falling between November and April. The dry season is from May to early November. The average temperature range is 20‐28°C for most of the year. Soils are sandy to clayish (fluvisols and vertisols), making it suitable for crop farming. Vegetation cover in this area is mainly meadows, savannah, marshland with reeds and broadleaf trees, and grassland with mixed indigenous trees, shrubs, and bushes. This makes it suitable for rearing small stock. The zone is drained by a number of rivers such as the Mucelo, Licuar, Cuácua, Lucingo, Namacurra, and Phuade, which are a source of inland freshwater and subsistence fishing. Other natural resources include the large expanse of forest, where hunting is practiced and timber is exploited. It is a moderate‐ to densely‐populated area with an average of 32‐90 people/km2. The local inhabitants are mainly the Sena tribe. The main source of livelihood is rainfed agriculture, coupled with rearing of goats, pigs, and poultry. Other options for livelihoods include fishing and hunting in the expansive forests of the area. The main crops grown in this zone are rice, maize, sorghum, beans, cassava, and vegetables. Rice is mainly grown in the heavy soils, while well drained soils are predominantly used for maize, sorghum, millet, cassava, and cowpeas. Cashew nuts are an important cash crop. Cultivation is mainly done using hand hoes. Livestock are raised using free browsing or grazing. The number of large ruminants is insignificant. The main sources of water for livestock are small rivers and ponds in the wet season and major rivers in the dry season. The two main determinants of wealth are the size of land cultivated and number of livestock owned, coupled with level of access to gainful economic activities. Poor households consume own production for roughly nine months of the year, complementing this with market purchases and some in‐kind payment for labor mainly between December and January. The main sources of cash income among poor group include the sale of surplus crops, local brew, charcoal, and agricultural labor by both men and women. The source of seasonal agricultural work is mainly from within the community, where the poor are employed by the better‐off. The better‐off are self‐sufficient in food production, and they usually sell surpluses, especially during years of good rainfall. They
mainly depend on informal trade, sale of timber, and agricultural produce surpluses. Physical access to markets is good with a fair‐to‐good road network that links the zone with main towns and marketing centers, which service retail shops and traders in the zone, though there are no wholesalers per se. Currency circulation is moderate.
Food security risk
Low food security risk due to high agricultural productivity and unskilled labor demand
2007 population (percent of national population)
321,223 (1.59%)
Main productive assets
Poor Better‐off
Small area cultivated Goats Poultry Hand tools: hoe, panga, and axe
Large area cultivatedCattle Goats Poultry Hand tools: hoe, panga, and axe
Main foods consumed and sources
Poor Better‐off
Rice (OP, MP) Maize (OP, MP) Sorghum (OP, MP) Cassava (OP, MP) Beans (OP, MP) Vegetables (OP, MP)
Rice (OP) Maize (OP) Sorghum (OP) Cassava (OP) Beans (OP, MP) Vegetables (OP, MP)
Main income sources
Poor Better‐off
Sale of rice Sale of maize Sale of labor Sale of hand crafts Sale of charcoal Sale of firewood
Sale of rice Sale of maize Sale of cattle Sale of goats Informal trade
Main markets
Quelimane
Main hazard and approximate frequency
Floods November‐April: every 3 years
Drought December‐April: every 10 years
Livestock diseases such as swine pest and Newcastle disease
December‐March
Crop pest and disease such as red locusts
December‐April: every 2‐3 years
Main coping strategies for poor households
Use of local and traditional herbs such as fumes for pest control Migration to work in Marromeu sugar factory Wild food collection

28
MOZAMBIQUE Livelihood Zone Descriptions July 2014
Famine Early Warning Systems Network
Common hazards in this zone are livestock diseases, such as Newcastle disease and swine pest. Chickens are affected by Newcastle disease almost every year. The main crop pest is the red locust, which mainly attacks maize and sorghum. The poor group may respond to with pest‐ and disease‐related hazards using traditional methods (fumes). In the event of an actual shock to food or income sources, the poor may increase cash income by migrating to work in sugarcane plantations and by increasing the collection of wild foods. The better‐off group raises additional cash by increasing the sale of livestock, such as goats, in order to purchase food.
Zone 9: Seasonal calendar
Zone 9: Food access calendar for poor households
Seasons
Rainy season
Dry season d d d d
Lean season
Crop production
Land preparation
Sowing/planting
Weeding
Harvesting
Livestock
Lambing/kidding/calving
Milking
Hazards
Flooding 1 1 1 1 1 1 1 1 1 1 1
Drought/dry spell
Legend p p Land preparation s s Planting w w Weeding h h Harvesting
Sep Oct Nov DecJan Feb JulMar Apr May Jun Aug
Staple foods
Rice
Maize
Cassava
Beans
Income
Crop sales
Goats
Charcoal and firewood
Expenditures
Batteries 1 1 1 1 1 1 1 1 1 1 1 1 1 1 1 1 1 1 1 1 1 1 1 1
Clothing
Legend p p Own production m m Purchases k k In kind c c Gathering
Jan Feb Mar Apr May Nov DecJun Jul Aug Sep Oct

29
MOZAMBIQUE Livelihood Zone Descriptions July 2014
Famine Early Warning Systems Network
ZAMBEZI VALLEY WITH MAIZE AND FISHING (ZONE 10)
This zone is located along the lowland plains and riverine areas of the Zambezi, Cuácua, and Lualuaua Rivers, as well as Chinde and Chire secondary rivers. It lies at an average altitude of about 200 masl. Precipitation is high, ranging from 1,200 to 1,400 mm per annum, mainly from December to the end of April. The dry season is from May to November. The maximum temperatures range 27‐33°C in the hot, wet season (December‐February), while the minimum temperatures range from 20‐22°C in the cold, dry season months of June and July. The soil structures along the plains are formed of quaternary sediments. Soils are predominantly loamy and red sandy but fertile and suitable for crop production. The vegetation cover is mainly palm savannah forests and grasslands. This zone has moderate to dense population with an average of 12‐33 people/km2. The average land holding is about 1‐2 hectares per household. The local inhabitants are mainly of the Sena tribe. The main source of livelihood is largely rainfed agriculture, coupled with rearing of livestock. Other livelihood options include fishing, hunting, and timber extraction in the zone’s expansive forests. The main food crops grown in this zone are maize, sorghum, rice, sweet potatoes, fruit trees, cowpeas, cassava, and vegetables. The main livestock are goats, pigs and poultry, with cattle mostly found in the better‐off group. The local determinants of wealth are the size of land cultivated and the number of livestock owned, coupled with the level of access to gainful economic activities. The poor rely on markets only two to three months each year between January and March, relying on own production the rest of the year and in‐kind payment for labor particularly during harvesting of cereal crops. The main sources of cash income among poor include crop sales, agricultural labor, handicrafts, charcoal, and firewood. The better‐off produce enough food to meet consumption needs from their own crops. They earn income mainly from crop and livestock sales and informal trade. Overall physical access to markets is good with moderate currency circulation and no wholesalers. The main central market is Quelimane town.
Common hazards in this zone include flooding along the riverine flood plains during the rainy seasons. Though rainfall may vary at the start of the season or in the distribution or quantity of rain from one season to another, drought is rare with a frequency of once in ten years. In the event of a shock to food or income, the poor group copes through increased collection of wild foods and increased charcoal and firewood sales. The better‐off normally increase goat sales to purchase additional food if needed.
Food insecurity risk
High risk of food insecurity due to frequent, heavy flooding of the Zambezi River
2007 population (percent of national population)
85,766 (0.42%)
Main productive assets
Poor Better‐off
Small area cultivated Goats Poultry Hand tools: hoe, panga, axe, and sickle Fishing rod and hooks
Large area cultivatedCattle Goats Pigs Poultry Canoe or boat Ox plough
Main foods consumed and sources
Poor Better‐off
Rice (OP, MP) Maize (OP, MP) Sorghum (OP, MP) Cassava (OP, MP) Beans (OP, MP) Vegetables (OP, MP)
Rice (OP) Maize (OP) Sorghum (OP) Cassava (OP) Beans (OP) Vegetables (OP)
Main income sources
Poor Better‐off
Sale of rice Sale of maize Sale of labor Sale of hand crafts Sale of charcoal and firewood Sale of fish
Sale of rice Sale of maize Sale of goats Sale of cattle Petty trade Sale of fish
Main markets
Quelimane
Main hazard and approximate frequency
Floods December‐April: once every 3 years
Drought December‐April: once every 10 years
Main coping strategies for poor households
Gathering of wild foods Increased sale of small stock Increased sale of firewood and charcoal

30
MOZAMBIQUE Livelihood Zone Descriptions July 2014
Famine Early Warning Systems Network
Zone 10: Seasonal calendar
Zone 10: Food access calendar for poor households
Seasons
Rainy season
Dry season d d d d
Lean season
Crop production
Land preparation
Sowing/planting
Weeding
Harvesting
Livestock
Lambing/kidding/calving
Milking
Hazards
Flooding 1 1 1 1 1 1 1 1 1 1
Drought/dry spell
Legend p p Land preparation s s Planting w w Weeding h h Harvesting
DecJan Feb Mar Apr May Jun Jul Aug Sep Oct Nov
Staple foods
Rice m m m m pm p p p p p p p p p p p p p p p p p p
Maize p p p p p p p p p p p p
Cassava p p p p p p p p p p
Poultry
Income
Agricultural labor 1 1 1 1 1 1 1 1 1 1 1 1
Handicrafts
Charcoal, firewood 1 1 1 1 1
Crop sales
Expenditures
Food 1 1 1 1 1 1
Batteries
Clothing 1 1 1 1 1 1
Legend p p Own production m m Purchases k k In kind c c Gathering
DecJan Feb Mar Apr May Jun Jul Aug Sep Oct Nov

31
MOZAMBIQUE Livelihood Zone Descriptions July 2014
Famine Early Warning Systems Network
NORTHWESTERN CROPPING AND CROSS‐BORDER TRADE (ZONE 11)
This zone is located in northwestern highlands along the Malawi border. It lies at an altitude of 500‐1000 meters above sea level. The Shire and other rivers pass through the zone. Precipitation is relatively good and ranges from 1,200‐2,000 mm per annum from December to the end of April. The dry season is from May to November. The average temperature is a minimum of 14‐18°C in the cold, dry season period (June and July) rising to a maximum of about 29‐34°C in the hot, wet season (October to January). This zone is characterized by deep, fertile, red‐clay soils, which are some of the most suitable for crop farming in Mozambique. The vegetation cover is mainly forest woodlands, tropical savannah shrub, and grasslands. This zone has a moderate population density of approximately 28‐38 people per square kilometer. However, agriculture is limited with low average land cultivation of about 1‐2 ha per household mainly attributed to limited cash for production inputs. The favorable climatic condition makes this zone suitable for agriculture. The main livelihood of local inhabitants is rainfed agriculture with additional activities such as trade in Malawi, supplemented with livestock rearing within the zone. The main food crops grown are maize, cassava, beans, and vegetables. The animals bred are small ruminants and poultry using free browsing or grazing. The number of large ruminants is insignificant and mostly kept by the better‐off group. The chief drivers of wealth are size of land cultivated and planted with crops, number of livestock owned, and, to some extent, access to trade markets. However, the poor are specifically constrained by lack of cash for production inputs needed to scale up production.
The poor consume through own production for nine months of the year, relying on market purchases and in‐kind payment for labor in January and February. Although crop sales are an important source of income for all households in the zone, the poor also rely heavily on the sale of agricultural labor, local brew, and charcoal and firewood. The better‐off are self‐sufficient in food mainly from own crops
with surpluses sold almost every year with exception of bad or crisis years; they also engage in informal trade and livestock sales for additional income. Overall trade dynamics with Malawi facilitate marketing of local produce across the border, although trade bans sometimes reduce activities with markets in Malawi (a significant hazard for the zone). There is good circulation of both Mozambique and Malawian currency within the zone, making trade very flexible among local people in both countries. The zone exports cereal produce to Malawi and obtains some manufactured items from Malawi. Other hazards are mainly caused by rainfall variability on a year to year basis. Droughts are rare. The zone lies along the rift valley, and earthquakes/tremors are common. The most common coping strategies for the poor in the event of a shock to food or income sources include increased search for agricultural labor, collection of wild foods, and sale of firewood and charcoal. The better‐off group copes through increased sale of goats and cattle.
Food insecurity risk
The zone is self‐sufficient in food with low risk of acute food insecurity
2007 population (percent of national population)
700,685 (3.46%)
Main productive assets
Poor Better‐off
Small area cultivated Goats Pigs Poultry Hand tools: hoes, axes, sickle, panga
Large area cultivatedCattle Goats Hand tools: hoes, axes, sickle, and panga
Main foods consumed and sources
Poor Better‐off
Maize (OP, MP) Cassava (OP, MP) Beans (OP, MP) Vegetables (OP, MP) Meat (MP)
Maize (OP) Cassava (OP) Beans (OP) Meat (OP, MP) Vegetables (OP, MP)
Main income sources
Poor Better‐off
Sale of cassava Sale of maize Agricultural labor Sale of local brew Sale of firewood Sale of charcoal
Sale of cassava Sale of maize Sale of goats Sale of cattle Informal trade
Main markets
Limbe and Mulange in Malawi
Main hazards
Drought December‐April
Fluctuation in commodity prices
All year round
Earthquake ‐
Trade ban with Malawi ‐
Main coping strategies for poor households
Increased sale of agricultural labor Collection of wild foods Increased sale of charcoal/firewood
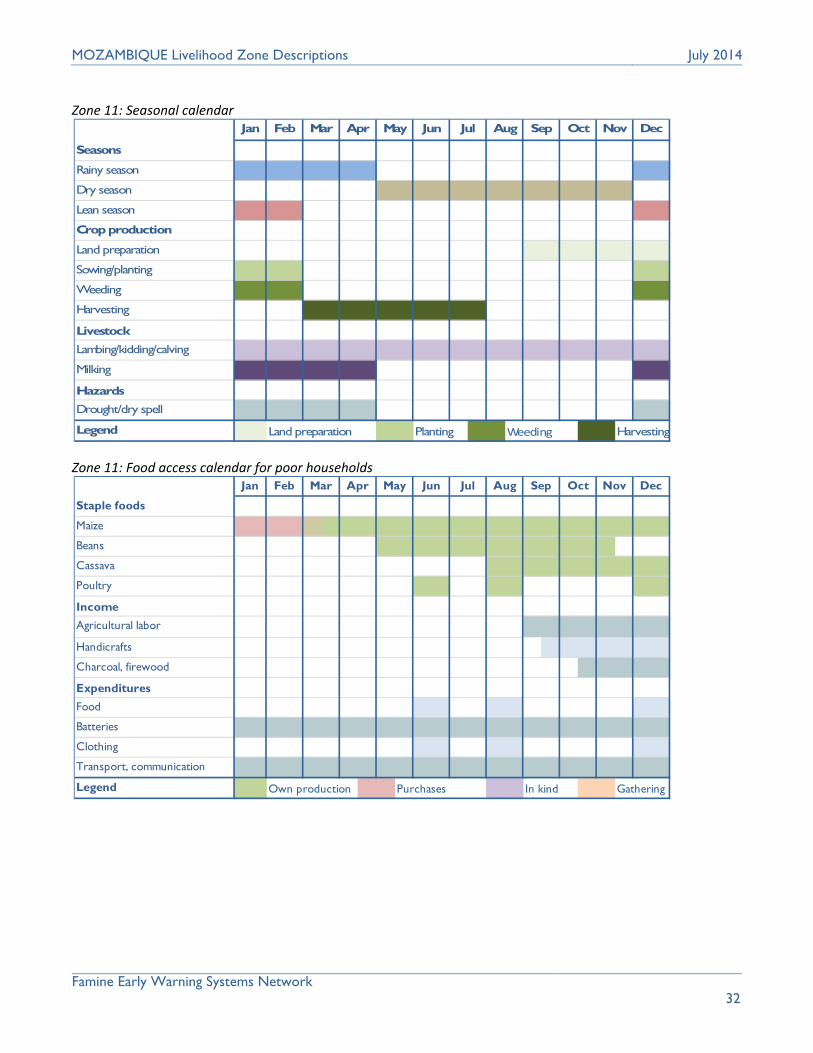
32
MOZAMBIQUE Livelihood Zone Descriptions July 2014
Famine Early Warning Systems Network
Zone 11: Seasonal calendar
Zone 11: Food access calendar for poor households
Seasons
Rainy season
Dry season d d d d
Lean season l l l l l l
Crop production
Land preparation
Sowing/planting
Weeding
Harvesting
Livestock
Lambing/kidding/calving
Milking
Hazards
Drought/dry spell 1 1 1 1 1 1 1 1 1 1
Legend p p Land preparation s s Planting w w Weeding h h Harvesting
DecJan Feb Mar Apr May Jun Jul Aug Sep Oct Nov
Staple foods
Maize m m m m pm p p p p p p p p p p p p p p p p p p
Beans p p p p p p p p p p p p
Cassava p p p p p p p p p p
Poultry
Income
Agricultural labor 1 1 1 1 1 1 1 1
Handicrafts
Charcoal, firewood 1 1 1 1 1
Expenditures
Food 2 2 2 2 2 2
Batteries 1 1 1 1 1 1 1 1 1 1 1 1 1 1 1 1 1 1 1 1 1 1 1 1
Clothing 2 2 2 2 2 2
Transport, communication 1 1 1 1 1 1 1 1 1 1 1 1 1 1 1 1 1 1 1 1 1 1 1 1
Legend p p Own production m m Purchases k k In kind c c Gathering
DecJan Feb Mar Apr May Jun Jul Aug Sep Oct Nov
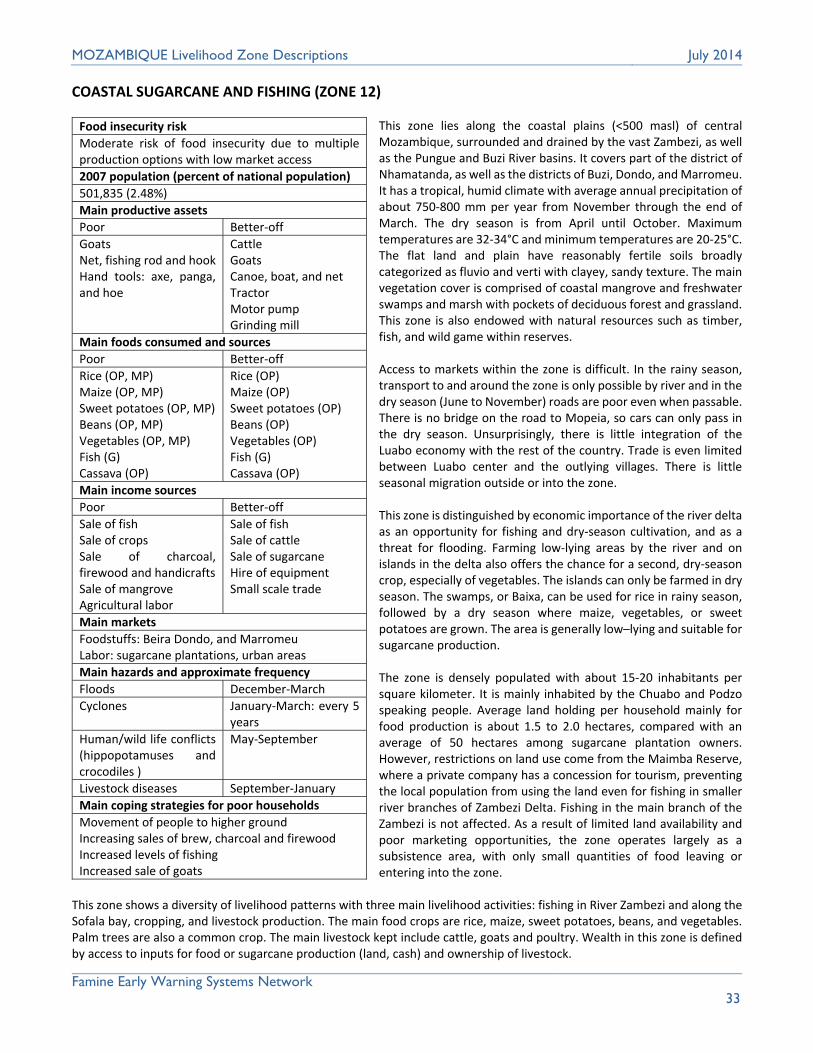
33
MOZAMBIQUE Livelihood Zone Descriptions July 2014
Famine Early Warning Systems Network
COASTAL SUGARCANE AND FISHING (ZONE 12)
This zone lies along the coastal plains (<500 masl) of central Mozambique, surrounded and drained by the vast Zambezi, as well as the Pungue and Buzi River basins. It covers part of the district of Nhamatanda, as well as the districts of Buzi, Dondo, and Marromeu. It has a tropical, humid climate with average annual precipitation of about 750‐800 mm per year from November through the end of March. The dry season is from April until October. Maximum temperatures are 32‐34°C and minimum temperatures are 20‐25°C. The flat land and plain have reasonably fertile soils broadly categorized as fluvio and verti with clayey, sandy texture. The main vegetation cover is comprised of coastal mangrove and freshwater swamps and marsh with pockets of deciduous forest and grassland. This zone is also endowed with natural resources such as timber, fish, and wild game within reserves. Access to markets within the zone is difficult. In the rainy season, transport to and around the zone is only possible by river and in the dry season (June to November) roads are poor even when passable. There is no bridge on the road to Mopeia, so cars can only pass in the dry season. Unsurprisingly, there is little integration of the Luabo economy with the rest of the country. Trade is even limited between Luabo center and the outlying villages. There is little seasonal migration outside or into the zone. This zone is distinguished by economic importance of the river delta as an opportunity for fishing and dry‐season cultivation, and as a threat for flooding. Farming low‐lying areas by the river and on islands in the delta also offers the chance for a second, dry‐season crop, especially of vegetables. The islands can only be farmed in dry season. The swamps, or Baixa, can be used for rice in rainy season, followed by a dry season where maize, vegetables, or sweet potatoes are grown. The area is generally low–lying and suitable for sugarcane production. The zone is densely populated with about 15‐20 inhabitants per square kilometer. It is mainly inhabited by the Chuabo and Podzo speaking people. Average land holding per household mainly for food production is about 1.5 to 2.0 hectares, compared with an average of 50 hectares among sugarcane plantation owners. However, restrictions on land use come from the Maimba Reserve, where a private company has a concession for tourism, preventing the local population from using the land even for fishing in smaller river branches of Zambezi Delta. Fishing in the main branch of the Zambezi is not affected. As a result of limited land availability and poor marketing opportunities, the zone operates largely as a subsistence area, with only small quantities of food leaving or entering into the zone.
This zone shows a diversity of livelihood patterns with three main livelihood activities: fishing in River Zambezi and along the Sofala bay, cropping, and livestock production. The main food crops are rice, maize, sweet potatoes, beans, and vegetables. Palm trees are also a common crop. The main livestock kept include cattle, goats and poultry. Wealth in this zone is defined by access to inputs for food or sugarcane production (land, cash) and ownership of livestock.
Food insecurity risk
Moderate risk of food insecurity due to multiple production options with low market access
2007 population (percent of national population)
501,835 (2.48%)
Main productive assets
Poor Better‐off
Goats Net, fishing rod and hook Hand tools: axe, panga, and hoe
Cattle Goats Canoe, boat, and net Tractor Motor pump Grinding mill
Main foods consumed and sources
Poor Better‐off
Rice (OP, MP) Maize (OP, MP) Sweet potatoes (OP, MP) Beans (OP, MP) Vegetables (OP, MP) Fish (G) Cassava (OP)
Rice (OP) Maize (OP) Sweet potatoes (OP) Beans (OP) Vegetables (OP) Fish (G) Cassava (OP)
Main income sources
Poor Better‐off
Sale of fish Sale of crops Sale of charcoal, firewood and handicrafts Sale of mangrove Agricultural labor
Sale of fish Sale of cattle Sale of sugarcane Hire of equipment Small scale trade
Main markets
Foodstuffs: Beira Dondo, and Marromeu Labor: sugarcane plantations, urban areas
Main hazards and approximate frequency
Floods December‐March
Cyclones January‐March: every 5 years
Human/wild life conflicts (hippopotamuses and crocodiles )
May‐September
Livestock diseases September‐January
Main coping strategies for poor households
Movement of people to higher ground Increasing sales of brew, charcoal and firewood Increased levels of fishing Increased sale of goats

34
MOZAMBIQUE Livelihood Zone Descriptions July 2014
Famine Early Warning Systems Network
The poor consume own production for 4‐6 months of the year, relying on markets and in‐kind payments for the other half of the year, particularly for beans and vegetables. Though the poor do sell some crops and fish, they also earn income from charcoal and mangrove exploitation and employment in Mafambisse and Buzi sugarcane plantations. The better‐off mainly consume own crops and fish with limited market purchases of non‐staple foods. The better‐off also derive much of their income from sale of fish and own crop surpluses, though they also sell cattle and sugarcane and may earn income from renting out equipment or retail trade.
Zone 12: Seasonal calendar
Zone 12: Food access calendar for poor households
Seasons
Rainy season
Dry season
Lean season
Crop production
Land preparation
Sowing/planting
Weeding
Harvesting
Wild foods 1 1 1 1 1 1 1 1
Livestock
Lambing/kidding/calving
Milking
Hazards
Human-wildlife conflict 1 1 1 1 1 1 1 1 1 1
Livestock diseases
Malaria 1 1 1 1 1 1 1 1
Legend p p Land preparation s s Planting w w Weeding h h Harvesting
DecJan Feb Mar Apr May Jun Jul Aug Sep Oct Nov
Staple foods
Maize
Beans
Vegetables
Fish
Income
Maize 1 1 1 1 1 1 1 1 1 1
Fish 2 2 2 2 2 2 2 2 2 2 2 2 2 2 2 2
Sugarcane labor 1 1 1 1 1 1 1 1 1 1 1 1
Expenditures
Health care 2 2 2 2 2 2 2 2
Education (school fees) 1 1 1 1 1 1 1 1
Legend p p Own production m m Purchases k k In kind c c Gathering
DecJan Feb Mar Apr May Jun Jul Aug Sep Oct Nov

35
MOZAMBIQUE Livelihood Zone Descriptions July 2014
Famine Early Warning Systems Network
TETE HIGHLAND MIXED CROPPING, TOBACCO, AND COTTON (ZONE 13)
This highland zone (>500 masl) is located in the northern part of Cahora Bassa dam, along the border with Malawi, Zambia, and includes the district of Angonia, Macanga, Chifunde, Tsangano and northern Zumbu. This is the wettest part of the Zambezi basin with regular precipitation averaging between 600‐1,500 mm per annum between November and April. The dry season is primarily from April/May to October. Temperatures range from a maximum of 25‐40o Celsius in summer to a minimum of 6‐25o Celsius in winter. The clay soils are fertile, allowing for relatively productive rainfed agriculture with some irrigation and supporting a moderately dense population of approximately 35 inhabitants/km2. Cash circulation and access to markets within the zone is good, and markets are open year‐round. Local markets hare strong links across the borders with Zambia and Malawi, for all local produce, but particularly for cash crops and labor. Zumbu and Maravia trade heavily with Zambia; Angonia trades heavily with Malawi. Tsangano Tete is another important market in the area. The primary commodities traded include maize, sorghum, tobacco, and cotton, and price trends follow the agricultural calendar with low prices between June to August and high prices from November to February. The most important crops are maize, root tubers (potatoes, cassava), beans, peanuts, vegetables, soy beans, sesame, sunflower, cucumber, pumpkin, and watermelon. Fruit trees are also common and include mangoes, banana, peach, guava, plum, apple, strawberry, lemon, pineapple and tangerine. The most important cash crops are tobacco and cotton. Cattle, goats and poultry are also important for local livelihoods. People source water for irrigation primarily from rainfall, rivers, and dams. Most households cultivate using hand tilling and animal traction, but the better‐off may use tractors. Given the high soil productivity, diverse cropping options and strong access to agricultural markets, the main local determinants of wealth are the land area cultivated and livestock ownership for both traction and as savings/investment.
Poor households depend primarily on own production for at least seven of the twelve months of the year (March‐ September). They rely primarily on market purchases with some in‐kind payment of labor for food between October and February. They earn cash to finance food and non‐food purchases primarily through agricultural labor to the better‐off primarily between May and July and through self employment, particularly the production and sale of charcoal or bricks. Most households in the zone sell at least some cereals (sorghum and maize) and cotton, regardless of their wealth; though, naturally, the better‐off, with access to more land, may sell large surpluses of cereals even after assuring self‐sufficiency in cereal production. The better‐off earn most additional income from cash crop sales.
Food insecurity risk
Low risk of food insecurity due to reliable rainfall and diverse incomes
2007 population (percent of national population)
870,220 (4.34%)
Main productive assets
Poor Better‐off
Small area cultivated Goats Pigs Poultry Hand tools: hoe, axe, and panga
Large area cultivatedCattle Goats Pigs Poultry Ox plough
Main foods consumed and sources
Poor Better‐off
Maize (OP, MP) Beans (OP, MP) Sesame (OP, MP) Vegetables (OP, MP) Meat (OP, MP)
Maize (OP) Rice (MP) Meat (OP) Vegetables (OP, MP)
Main income sources
Poor Better‐off
Sale of maize/sorghum Sale of cotton Sale tobacco Sale of poultry Sale of agricultural labor Sale of handicrafts
Sale of maize/sorghumSale of cotton Sale of tobacco Sale of vegetables including potatoes
Main markets
Tete and border markets in Malawi and Zambia
Main hazards and approximate frequency
Drought November‐January
Frost July
Hail At beginning or end of rainy season
Main coping strategies for poor households
Increased reliance on self‐employment such as sale of charcoal Labor migration across the border

36
MOZAMBIQUE Livelihood Zone Descriptions July 2014
Famine Early Warning Systems Network
Zone 13: Seasonal calendar
Zone 13: Food access calendar for poor households
Seasons
Rainy season
Dry season
Lean season
Crop production
Land preparation
Sowing/planting
Weeding
Harvesting
Livestock
Lambing/kidding/calving
Milking
Other
Fishing 1 1 1 1 1 1 1 1 1 1 1 1 1 1
Hazards
Drought/dry spell
Human-wildlife conflict 1 1 1 1 1 1 1 1 1 1 1 1 1 1
Legend p p Land preparation s s Planting w w Weeding h h Harvesting
DecJan Feb Mar Apr May Jun Jul Aug Sep Oct Nov
Staple foods
Maize
Beans
Vegetables
Income
Cotton 1 1 1 1 1 1
Maize
Agricultural labor 1 1 1 1 1 1 1 1 1 1 1 1 1 1 1 1
Expenditures
Health care 2 2 2 2 2 2 2 2
Education (school fees) 1 1 1 1 1 1 1 1
Legend p p Own production m m Purchases k k In kind c c Gathering
DecJan Feb Mar Apr May Jun Jul Aug Sep Oct Nov

37
MOZAMBIQUE Livelihood Zone Descriptions July 2014
Famine Early Warning Systems Network
CAHORA BASSA DAM SESAME AND COTTON (ZONE 14)
This zone comprises the lowlands and foothills (200‐1000 masl) running parallel to the Albufeira in Mphende within the main catchment areas of Cahora Bassa Basin and includes parts of the districts of Chifunde, Chiuta, Cahora Bassa, Magoe, Maravia, and Zumbu. The zone is drained by the Cahora Bassa Dam and the Zambezi River. It derives its name from the very extensive Albufeira de Cahora Bassa Lake to the North, which is formed by a dam on the Zambezi River. Many other rivers in the zone flow into this lake, including the Mussengezi River which originates in Zimbabwe. Rains can be unreliable in timing and volume, partly due to changes in air currents and cloud formation over the hills. Average precipitation is about 500‐800 mm per annum, falling from November through the end of March. The dry season is from April until October. The average temperatures range from a maximum of 25‐40°C in the hot, wet season to a minimum of 22‐30°C in the cold, dry season. Soils are mainly sandy clay with relatively moderate fertility. The vegetation is mostly savannah‐like with a wide variety of grass, shrubs, and tree species populating areas between villages. Due to its strategic location and the tarmac road along the border with Zimbabwe and Zambia, this zone has access to cross‐border markets, the provincial capital Tete, the district capital Chitima, and the central parts of Mphende. Mobile phone coverage is equally good and enhances communication and market linkages within the zone. This zone is a moderately populated area with an estimated 2‐6 people/km2; it is mainly inhabited by the Nhungue tribe. The main sources of livelihood are fishing, rainfed agriculture, livestock rearing, horticulture, hunting, and trade. The zone is a food deficit area with low production due to manual cultivation. Average land holding per household is approximately 0.8‐1.2 ha, most of which is manually cultivated with household labor (poor households) or hired labor (better‐off households). Fishing is an important source of livelihood, with significant contribution to household food and income. It is arguably as important to the livelihoods of the zone as agriculture. The main buyers of fish are from Zambia and DR Congo. Fish is sold fresh, smoked or salted and dried. Fishing is done exclusively by men. Maize and sorghum are most important food crops. The main cash crop is cotton. Other crops cultivated include millet, groundnuts, sweet potatoes, and vegetables. All crops are either rainfed or recession‐farmed (dry season) in moist soils adjacent
to the lake and rivers. Livestock reared include cattle, goats, pigs, donkeys, and chickens. Cattle and goats graze in areas outside the village. Pigs are fed on crop residues and allowed to forage for food. Compared to other, more agriculturally dominant zones, the poor in this semiarid zone rely relatively little (about three months) on own production as a source of food. Instead, they mainly rely on market purchases, fishing, and wild foods. The
Food insecurity risk
Moderate risk of food insecurity due to vulnerability to drought and heavy reliance on fishing
2007 population (percent of national population)
176,363 (0.87%)
Main productive assets
Poor Better‐off
Fishing net and hook Goats Pigs Poultry Hand tools: hoe, axe, and panga
Boat/canoe, fishing netCattle Goats Poultry Hand tools: hoe, axe, and panga
Main foods consumed and sources
Poor Better‐off
Maize (OP, MP) Sorghum (OP, MP) Millet (OP, MP) Rice (MP) Groundnuts (OP, MP) Beans (OP, MP) Sweet potatoes (OP, MP) Sesame (OP, MP) Vegetables (OP, MP)
Maize (OP, MP) Sorghum (OP, MP) Millet (OP, MP) Rice (MP) Groundnut (OP, MP) Beans (OP, MP) Sweet potatoes (OP, MP) Vegetables (OP)
Main income sources
Poor Better‐off
Sale of fish Sale of cotton Sale of sesame Sale of handicrafts, firewood, charcoal Sale of labor Sale of wild foods
Sale of fish Sale of cotton Sale of cattle Sale of goats Retail trade Formal employment
Main markets
Tete, Chitima, and Mphende, as well as cross‐border markets in Zambia, Zimbabwe, and Democratic Republic of Congo (DRC)
Main hazards
Drought or dry spell December‐February
Floods February‐March
Crop pests and diseases (including locusts)
January‐April
Main coping strategies for poor households
Increased self‐employment Migration into urban areas Barter trade

38
MOZAMBIQUE Livelihood Zone Descriptions July 2014
Famine Early Warning Systems Network
poor as well as the wealthy receive a significant amount of income from cotton and fish sales. However, the poor also rely heavily on the sale of agricultural labor to the better‐off and the sale of natural products such as handicrafts, firewood, and charcoal. The better‐off group is food self‐sufficient with surplus production, primarily due to their ability to hire labor. Though they earn income from fish and cotton sales, they also sell livestock and engage in trade and formal employment. The main hazards to crop production include drought, floods, and crop pests and diseases. Human‐wildlife conflict (elephants, hippopotami, others) also poses a threat to crop production as cultivation takes place near permanent water sources. Coping strategies in the event of a shock to food or income sources include increased reliance on natural resources such as charcoal and firewood, migration to urban areas in search of labor opportunities, and trade.
Zone 14: Seasonal calendar
Seasons
Rainy season
Dry season
Lean season l l l l l l l l
Crop production
Land preparation
Sowing/planting
Weeding
Harvesting
Livestock
Lambing/kidding/calving
Milking
Other
Fishing 1 1 1 1 1 1 1 1 1 1 1 1 1 1 1 1 1 1 1 1 1 1 1 1
Hazards
Drought/dry spell
Flooding 1 1 1 1
Crop pests, diseases
Legend p p Land preparation s s Planting w w Weeding h h Harvesting
DecJan Feb Mar Apr May Jun Jul Aug Sep Oct Nov
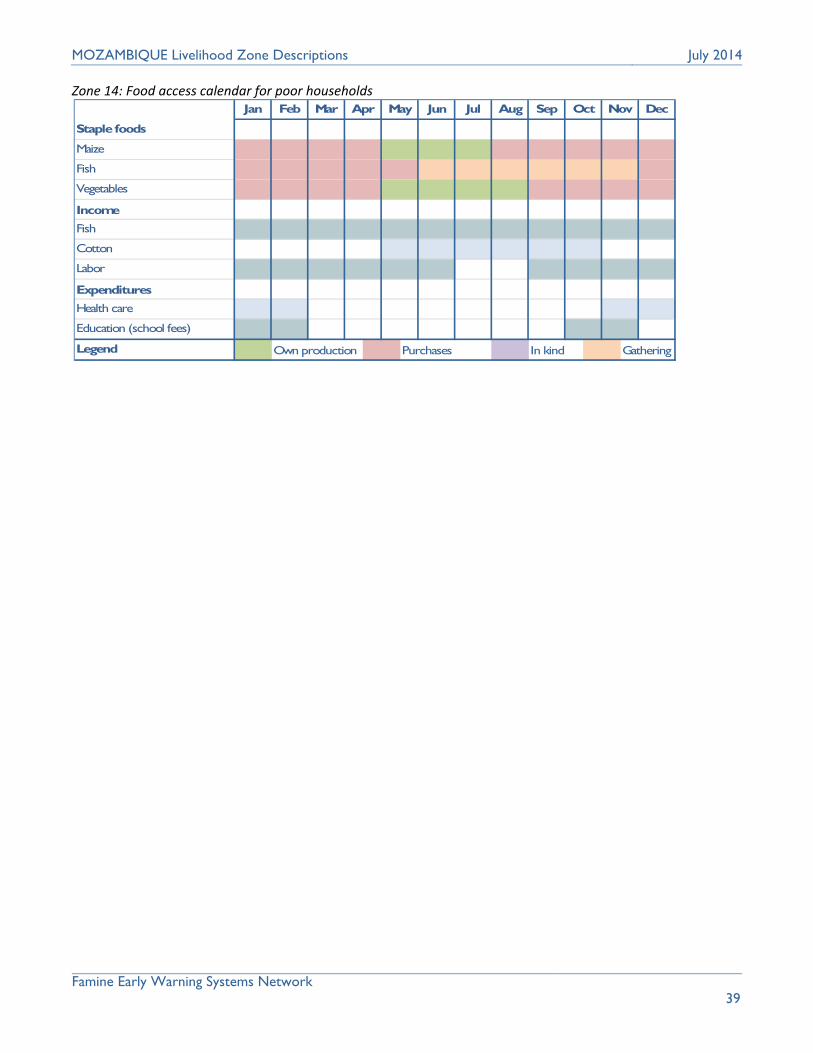
39
MOZAMBIQUE Livelihood Zone Descriptions July 2014
Famine Early Warning Systems Network
Zone 14: Food access calendar for poor households
Staple foods
Maize
Fish
Vegetables
Income
Fish 1 1 1 1 1 1 1 1 1 1 1 1 1 1 1 1 1 1 1 1 1 1 1 1
Cotton
Labor 1 1 1 1 1 1 1 1 1 1 1 1 1 1 1 1 1 1 1 1
Expenditures
Health care 2 2 2 2 2 2 2 2
Education (school fees) 1 1 1 1 1 1 1 1
Legend p p Own production m m Purchases k k In kind c c Gathering
DecJan Feb Mar Apr May Jun Jul Aug Sep Oct Nov
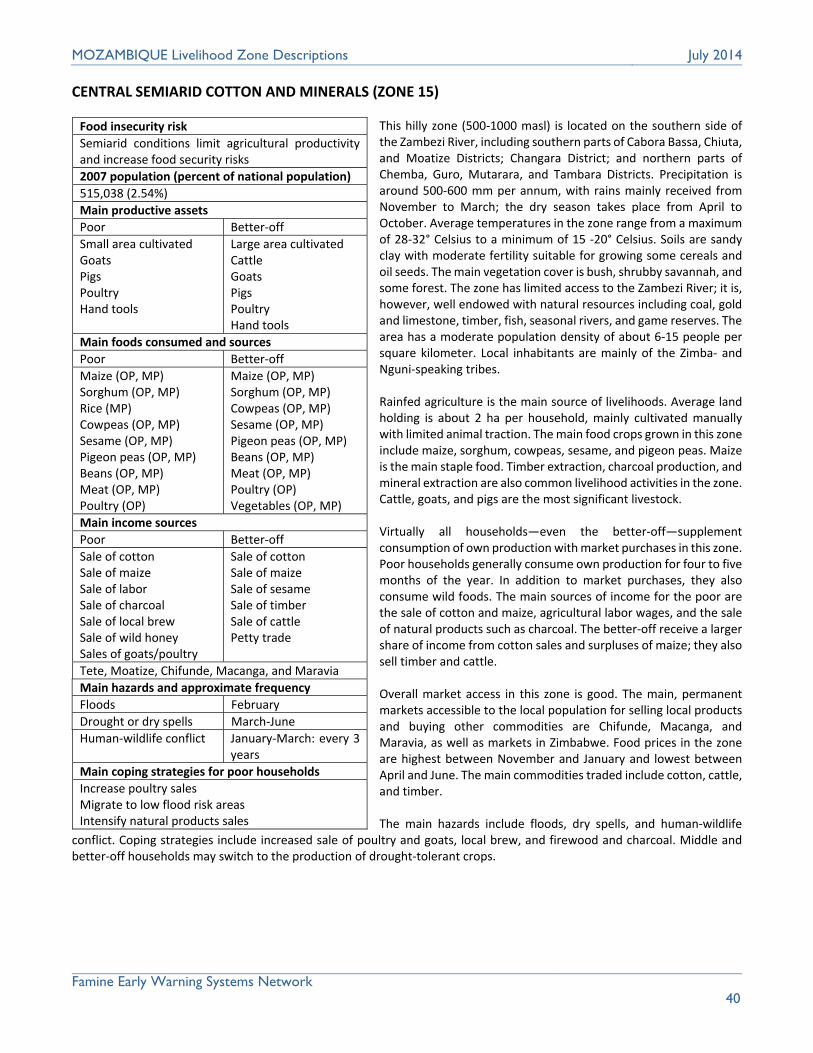
40
MOZAMBIQUE Livelihood Zone Descriptions July 2014
Famine Early Warning Systems Network
CENTRAL SEMIARID COTTON AND MINERALS (ZONE 15)
This hilly zone (500‐1000 masl) is located on the southern side of the Zambezi River, including southern parts of Cabora Bassa, Chiuta, and Moatize Districts; Changara District; and northern parts of Chemba, Guro, Mutarara, and Tambara Districts. Precipitation is around 500‐600 mm per annum, with rains mainly received from November to March; the dry season takes place from April to October. Average temperatures in the zone range from a maximum of 28‐32° Celsius to a minimum of 15 ‐20° Celsius. Soils are sandy clay with moderate fertility suitable for growing some cereals and oil seeds. The main vegetation cover is bush, shrubby savannah, and some forest. The zone has limited access to the Zambezi River; it is, however, well endowed with natural resources including coal, gold and limestone, timber, fish, seasonal rivers, and game reserves. The area has a moderate population density of about 6‐15 people per square kilometer. Local inhabitants are mainly of the Zimba‐ and Nguni‐speaking tribes. Rainfed agriculture is the main source of livelihoods. Average land holding is about 2 ha per household, mainly cultivated manually with limited animal traction. The main food crops grown in this zone include maize, sorghum, cowpeas, sesame, and pigeon peas. Maize is the main staple food. Timber extraction, charcoal production, and mineral extraction are also common livelihood activities in the zone. Cattle, goats, and pigs are the most significant livestock. Virtually all households—even the better‐off—supplement consumption of own production with market purchases in this zone. Poor households generally consume own production for four to five months of the year. In addition to market purchases, they also consume wild foods. The main sources of income for the poor are the sale of cotton and maize, agricultural labor wages, and the sale of natural products such as charcoal. The better‐off receive a larger share of income from cotton sales and surpluses of maize; they also sell timber and cattle. Overall market access in this zone is good. The main, permanent markets accessible to the local population for selling local products and buying other commodities are Chifunde, Macanga, and Maravia, as well as markets in Zimbabwe. Food prices in the zone are highest between November and January and lowest between April and June. The main commodities traded include cotton, cattle, and timber. The main hazards include floods, dry spells, and human‐wildlife
conflict. Coping strategies include increased sale of poultry and goats, local brew, and firewood and charcoal. Middle and better‐off households may switch to the production of drought‐tolerant crops.
Food insecurity risk
Semiarid conditions limit agricultural productivityand increase food security risks
2007 population (percent of national population)
515,038 (2.54%)
Main productive assets
Poor Better‐off
Small area cultivated Goats Pigs Poultry Hand tools
Large area cultivatedCattle Goats Pigs Poultry Hand tools
Main foods consumed and sources
Poor Better‐off
Maize (OP, MP) Sorghum (OP, MP) Rice (MP) Cowpeas (OP, MP) Sesame (OP, MP) Pigeon peas (OP, MP) Beans (OP, MP) Meat (OP, MP) Poultry (OP)
Maize (OP, MP) Sorghum (OP, MP) Cowpeas (OP, MP) Sesame (OP, MP) Pigeon peas (OP, MP) Beans (OP, MP) Meat (OP, MP) Poultry (OP) Vegetables (OP, MP)
Main income sources
Poor Better‐off
Sale of cotton Sale of maize Sale of labor Sale of charcoal Sale of local brew Sale of wild honey Sales of goats/poultry
Sale of cotton Sale of maize Sale of sesame Sale of timber Sale of cattle Petty trade
Tete, Moatize, Chifunde, Macanga, and Maravia
Main hazards and approximate frequency
Floods February
Drought or dry spells March‐June
Human‐wildlife conflict January‐March: every 3 years
Main coping strategies for poor households
Increase poultry sales Migrate to low flood risk areas Intensify natural products sales

41
MOZAMBIQUE Livelihood Zone Descriptions July 2014
Famine Early Warning Systems Network
Zone 15: Seasonal calendar
Zone 15: Food access calendar for poor households
Seasons
Rainy season
Dry season
Lean season l l l l
Crop production
Land preparation
Sowing/planting
Weeding
Harvesting
Wild foods 1 1 1 1 1 1 1 1 1 1 1 1 1 1 1 1 1 1
Livestock
Lambing/kidding/calving
Milking
Hazards
Flooding 1 1
Drought/dry spell
Human-wildlife conflict 1 1 1 1 1 1 1 1
Legend p p Land preparation s s Planting w w Weeding h h Harvesting
DecJan Feb Mar Apr May Jun Jul Aug Sep Oct Nov
Staple foods
Maize
Beans
Vegetables
Income
Agricultural labor 1 1 1 1 1 1 1 1
Charcoal 2 2 2 2 2 2 2 2 2 2 2 2 2 2 2 2
Honey 1 1 1 1 1 1 1 1 1 1 1 1
Expenditures
Health care 2 2 2 2 2 2 2 2
Education (school fees) 1 1 1 1 1 1 1 1
Legend p p Own production m m Purchases k k In kind c c Gathering
DecJan Feb Mar Apr May Jun Jul Aug Sep Oct Nov

42
MOZAMBIQUE Livelihood Zone Descriptions July 2014
Famine Early Warning Systems Network
MANICA HIGHLAND MIXED CROPPING, COTTON, AND TOBACCO (ZONE 16)
The Manica highlands are a plateau (>1000 masl) along the border with Zimbabwe that include various districts such as Barue, Manica, Sussundenga, and Mossurize. Precipitation in the area is regular with 600‐1,500 mm per annum between November and March with dry season from April until end of October. Temperatures range from a maximum of 25‐40o Celsius in the hot, wet season to a minimum of 6‐25o Celsius in the cold, dry season. Soils are predominantly clay with high fertility and productivity. The vegetation cover is mainly broadleaf and evergreen open forest and savannah grasslands. This zone has a medium population density of approximately 35 inhabitants per square kilometer. The main inhabitants are Manyika‐ and Teve‐speaking people. This area is most suitable for rainfed crop farming. Land cultivation is mostly through hand tilling and animal traction, though the better‐off can afford to own or hire tractors. The rainfed food crops grown are maize, root tubers (potatoes, cassava), beans, peanuts, vegetables, soya, sesame, and sunflower. Other crops include vegetables (cucumber and pumpkin) and fruits (watermelon, mangoes, banana, peach, guava, plum, apple, strawberry, lemon, pineapple, and tangerine). Overall, the most important cash crops are tobacco and cotton, which even the poor may cultivate over small areas. Cattle, goats, and poultry are also important for local livelihoods. These animals are mainly grazed on natural grass and crop residues. The local inhabitants rely on existing rivers and dams for domestic and livestock usage. Overall wealth in this zone is determined by the size of land cultivated and livestock ownership. The poor consume own production about six months of the year and consume market purchases and some in‐kind payment of labor for the remainder. Cash income sources of the poor group include sale of crops (maize, vegetables, and fruits) and remittances from migrant agricultural labor in Zimbabwe. The better‐off group is mainly self‐sufficient with the potential for marketable crop surpluses, especially during years of good rainfall. The better‐off are the primary tobacco and cotton producers, and they derive a significant portion of their annual cash income from sale of these cash crops. Informal trade and formal employment opportunities within Mozambique are common, alternative sources of income among the better‐off.
There is good physical access to markets especially in Zimbabwe for produce, cash crops, and unskilled migrant labor. Most of the markets are permanent and record high food prices from November to January and low food prices from June to August. There is general very good cash circulation in the zone. The most common hazards are drought or dry spells, frost, and hailstorms. These hazards may have a devastating impact on both food and cash crops. Poor households cope by intensifying the search for employment both locally and through migration and by increasing self employment and the sale of small ruminants.
Food insecurity risk
Highly food secure due to very good climatic conditions
2007 population (percent of national population)
606,113 (2.99%)
Main productive assets
Poor Better‐off
Small area cultivated Goats Pigs Poultry Hand tools: hoe, axe, and panga
Large area cultivatedCattle Goats Pigs Poultry Ox plough Tractor
Main foods consumed and sources
Poor Better‐off
Maize (OP, MP) Sorghum (OP, MP) Sweet potatoes (OP, MP) Cassava (OP, MP) Beans (OP, MP) Vegetables (OP)
Maize (OP) Sorghum (OP) Sweet potatoes (OP) Cassava (OP) Rice (MP) Meat (MP)
Main income sources
Poor Better‐off
Sale of maize Sale of sorghum Sale of tobacco Sale of cotton Sale of handicrafts Sale of poultry Cash remittances Retail trade
Sale of maize Sale of sorghum Sal of potatoes Sale of tobacco Sale of cotton Cash remittances Informal trade Formal employment
Main markets
Barue, Manica, Mossurize, and Sussundenga, as well as border markets in Zimbabwe and Malawi
Main hazards
Drought or dry spells November‐March
Frost July
Hailstorms December‐March
Main coping strategies for poor households
Local migration in search of labor Increased self‐employment Increased sale of goats and poultry

43
MOZAMBIQUE Livelihood Zone Descriptions July 2014
Famine Early Warning Systems Network
Zone 16: Seasonal calendar
Zone 16: Food access calendar for poor households
Seasons
Rainy season
Dry season
Lean season
Crop production
Land preparation
Sowing/planting
Weeding
Harvesting
Wild foods 1 1 1 1 1 1 1 1 1 1 1 1 1 1 1 1 1 1
Livestock
Lambing/kidding/calving
Milking
Hazards
Drought/dry spell 1 1 1 1 1 1 1 1 1 1
Frost 2 2
Legend p p Land preparation s s Planting w w Weeding h h Harvesting
DecJan Feb Mar Apr May Jun Jul Aug Sep Oct Nov
Staple foods
Maize
Sorghum
Beans
Income
Maize 1 1 1 1
Tobacco 2 2 2 2 2 2 2 2
Cotton 1 1 1 1 1 1
Expenditures
Health care 2 2 2 2 2 2 2 2
Education (school fees) 1 1 1 1 1 1 1 1
Legend p p Own production m m Purchases k k In kind c c Gathering
DecJan Feb Mar Apr May Jun Jul Aug Sep Oct Nov
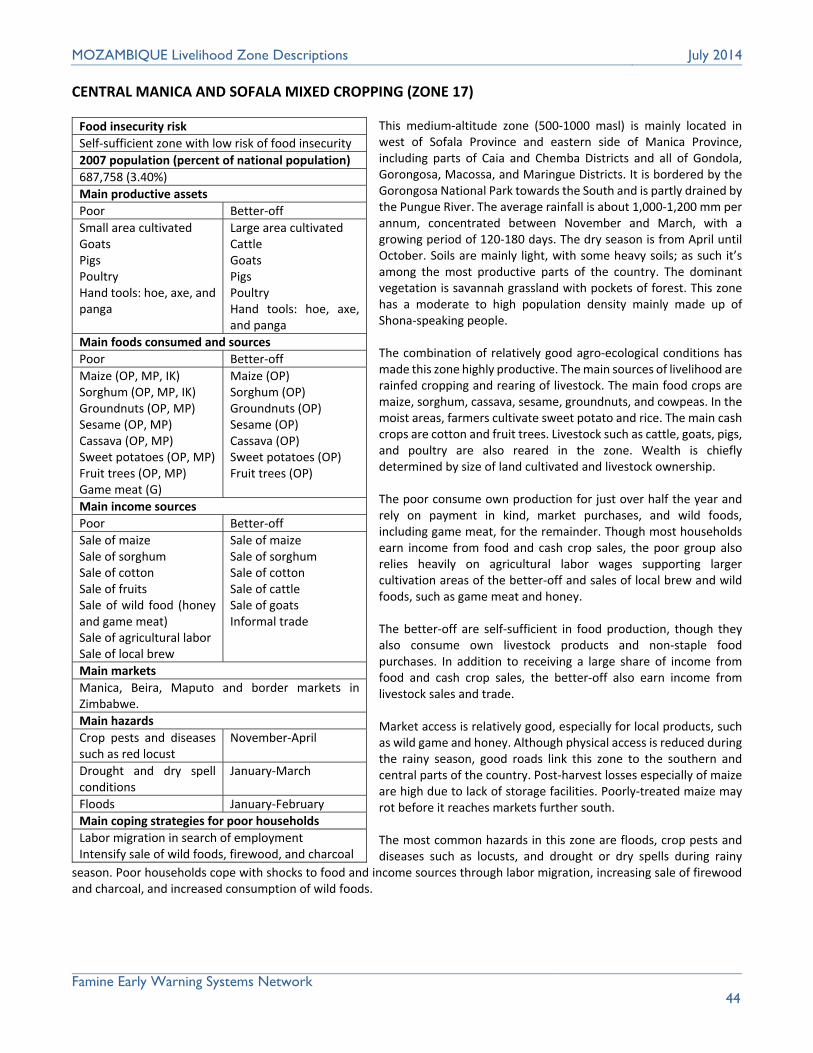
44
MOZAMBIQUE Livelihood Zone Descriptions July 2014
Famine Early Warning Systems Network
CENTRAL MANICA AND SOFALA MIXED CROPPING (ZONE 17)
This medium‐altitude zone (500‐1000 masl) is mainly located in west of Sofala Province and eastern side of Manica Province, including parts of Caia and Chemba Districts and all of Gondola, Gorongosa, Macossa, and Maringue Districts. It is bordered by the Gorongosa National Park towards the South and is partly drained by the Pungue River. The average rainfall is about 1,000‐1,200 mm per annum, concentrated between November and March, with a growing period of 120‐180 days. The dry season is from April until October. Soils are mainly light, with some heavy soils; as such it’s among the most productive parts of the country. The dominant vegetation is savannah grassland with pockets of forest. This zone has a moderate to high population density mainly made up of Shona‐speaking people. The combination of relatively good agro‐ecological conditions has made this zone highly productive. The main sources of livelihood are rainfed cropping and rearing of livestock. The main food crops are maize, sorghum, cassava, sesame, groundnuts, and cowpeas. In the moist areas, farmers cultivate sweet potato and rice. The main cash crops are cotton and fruit trees. Livestock such as cattle, goats, pigs, and poultry are also reared in the zone. Wealth is chiefly determined by size of land cultivated and livestock ownership. The poor consume own production for just over half the year and rely on payment in kind, market purchases, and wild foods, including game meat, for the remainder. Though most households earn income from food and cash crop sales, the poor group also relies heavily on agricultural labor wages supporting larger cultivation areas of the better‐off and sales of local brew and wild foods, such as game meat and honey. The better‐off are self‐sufficient in food production, though they also consume own livestock products and non‐staple food purchases. In addition to receiving a large share of income from food and cash crop sales, the better‐off also earn income from livestock sales and trade. Market access is relatively good, especially for local products, such as wild game and honey. Although physical access is reduced during the rainy season, good roads link this zone to the southern and central parts of the country. Post‐harvest losses especially of maize are high due to lack of storage facilities. Poorly‐treated maize may rot before it reaches markets further south. The most common hazards in this zone are floods, crop pests and diseases such as locusts, and drought or dry spells during rainy
season. Poor households cope with shocks to food and income sources through labor migration, increasing sale of firewood and charcoal, and increased consumption of wild foods.
Food insecurity risk
Self‐sufficient zone with low risk of food insecurity
2007 population (percent of national population)
687,758 (3.40%)
Main productive assets
Poor Better‐off
Small area cultivated Goats Pigs Poultry Hand tools: hoe, axe, and panga
Large area cultivatedCattle Goats Pigs Poultry Hand tools: hoe, axe, and panga
Main foods consumed and sources
Poor Better‐off
Maize (OP, MP, IK) Sorghum (OP, MP, IK) Groundnuts (OP, MP) Sesame (OP, MP) Cassava (OP, MP) Sweet potatoes (OP, MP) Fruit trees (OP, MP) Game meat (G)
Maize (OP) Sorghum (OP) Groundnuts (OP) Sesame (OP) Cassava (OP) Sweet potatoes (OP) Fruit trees (OP)
Main income sources
Poor Better‐off
Sale of maize Sale of sorghum Sale of cotton Sale of fruits Sale of wild food (honey and game meat) Sale of agricultural labor Sale of local brew
Sale of maize Sale of sorghum Sale of cotton Sale of cattle Sale of goats Informal trade
Main markets
Manica, Beira, Maputo and border markets in Zimbabwe.
Main hazards
Crop pests and diseases such as red locust
November‐April
Drought and dry spell conditions
January‐March
Floods January‐February
Main coping strategies for poor households
Labor migration in search of employment Intensify sale of wild foods, firewood, and charcoal

45
MOZAMBIQUE Livelihood Zone Descriptions July 2014
Famine Early Warning Systems Network
Zone 17: Seasonal calendar
Zone 17: Food access calendar for poor households
Seasons
Rainy season
Dry season
Lean season l l l l
Crop production
Land preparation
Sowing/planting
Weeding
Harvesting
Wild foods 1 1 1 1 1 1 1 1 1 1 1 1 1 1 1 1 1 1
Livestock
Lambing/kidding/calving
Milking
Hazards
Flooding 1 1 1 1
Drought/dry spell 2
Crop pests, diseases 1 1 1 1 1 1 1 1 1 1
Legend p p Land preparation s s Planting w w Weeding h h Harvesting
DecJan Feb Mar Apr May Jun July Aug Sept Oct Nov
Staple foods
Maize
Sorghum
Wild game meat c c c c c c c c c c c c c c c c
Income
Agricultural labor 1 1 1 1 1 1 1 1 1 1 1 1 1 1
Charcoal 2 2 2 2 2 2 2 2 2 2 2 2 2 2 2 2
Honey 1 1 1 1 1 1 1 1 1 1 1 1
Expenditures
Health care 2 2 2 2 2 2 2 2
Education (school fees) 1 1 1 1 1 1 1 1
Legend p p Own production m m Purchases k k In kind c c Gathering
DecJan Feb Mar Apr May Jun Jul Aug Sep Oct Nov

46
MOZAMBIQUE Livelihood Zone Descriptions July 2014
Famine Early Warning Systems Network
CHERINGOMA AND MUANZA MAIZE AND CASSAVA (ZONE 18)
This zone is located in mid central region of Mozambique in the litoral of Sofala Province, covering Cheringona and Muanza Districts. The average precipitation is around 750‐1,200 mm per annum from November through the end of March. The dry season is from April until October. The soils are heavy and sandy and suitable for crop production. The vegetation cover is mainly savannah grassland. Timber and calcareous rocks are abundant. This zone is moderately populated and mainly inhabited by the Danda‐ and Hlengwe‐speaking people. Overall favorable climatic conditions such as good rainfall and fertile soils complement rainfed crop farming, river and marine fishing, as well as livestock raising. The main food crops include sorghum, maize, and sesame. Cash crops grown in this area include cotton and sesame, though they are not predominant. Goats and poultry are also kept for consumption and sale. The local determinants of wealth are size of land cultivated, livestock ownership, and access to gainful economic activities. Poor households rely on own production for food about seven months of the year and markets for the remainder. Though they do sell some small quantities of own production (maize, cashews), they rely mainly on agricultural labor for income. The better‐off group is food self‐sufficient with surpluses normally sold for cash income, especially during years of good rainfall. The better‐off have access to inputs and markets for successful cash crop marketing (sesame, cashews, and cotton). In the course of a consumption year, the better‐off sell a few cattle to supplement annual income. Access to markets and trade is limited due to the remote location of this zone. Labor employment opportunities are mainly in South Africa and in sugar processing plants. Most local people trade their produce within the zone; however, they have to walk long distances to reach the nearest market due to poor transport networks and facilities. Other external markets include Beira and Dondo along the coast. Hazards include seasonal floods during the rainy season, crop
pests and diseases, and drought and dry spells. Common coping strategies among the poor include labor migration, increasing charcoal and firewood sales, increased consumption of wild foods, and increased sales of goats or poultry.
Food insecurity risk
Low risk of acute food insecurity due to rainfed agriculture mixed cropping
2007 population (percent of national population)
59,318 (0.29%)
Main productive assets
Poor Better‐off
Small area cultivated Goats Poultry Hand tools: hoe, axe, and panga
Large area cultivatedCattle Goats Poultry Hand tools: hoe, axe, and panga
Main foods consumed and sources
Poor Better‐off
Maize (OP, MP) Cassava (OP, MP) Sweet potatoes (OP, MP) Yams (OP) Beans (OP, MP) Groundnut (OP, MP) Fish (G)
Maize (OP) Cassava (OP) Sweet potatoes (OP) Yams (OP) Beans (OP) Fish Groundnut (OP)
Main income sources
Poor Better‐off
Sale of agricultural labor Sale of maize Sale of poultry Sale of cashew nuts
Sale of cattle Sale of sesame Sale of cotton Sale of maize Sale of cashew nuts Small‐scale trade
Main markets
Beira and Dondo
Main hazards
Floods November‐January
Crop pests and diseases December‐April
Drought or dry spell November‐January
Main coping strategies for poor households
Labor migration in search of employment Increased reliance on wild foods

47
MOZAMBIQUE Livelihood Zone Descriptions July 2014
Famine Early Warning Systems Network
Zone 18: Seasonal calendar
Zone 18: Food access calendar for poor households
Seasons
Rainy season
Dry season
Lean season
Crop production
Land preparation
Sowing/planting
Weeding
Harvesting
Livestock
Lambing/kidding/calving
Milking
Other
Fishing 1 1 1 1 1 1
Hazards
Flooding 2 2 2 2 2 2
Drought/dry spell 1 1 1 1 1 1
Legend p p Land preparation s s Planting w w Weeding h h Harvesting
DecJan Feb Mar Apr May Jun Jul Aug Sep Oct Nov
Staple foods
Maize
Cassava
Beans
Income
Maize 1 1 1 1 1 1
Agricultural labor 2 2 2 2 2 2 2 2 2 2 2 2 2 2
Poultry 1 1 1 1 1 1 1 1 1 1 1 1 1 1 1 1 1 1 1 1 1 1 1 1
Expenditures
Health care 2 2 2 2 2 2 2 2
Education (school fees) 1 1 1 1 1 1 1 1
Legend p p Own production m m Purchases k k In kind c c Gathering
DecJan Feb Mar Apr May Jun Jul Aug Sep Oct Nov

48
MOZAMBIQUE Livelihood Zone Descriptions July 2014
Famine Early Warning Systems Network
CENTRAL SEMIARID PINEAPPLE AND CASHEW (ZONE 19)
This zone is located in mid‐central Mozambique and includes Chibabava, Machanga, and Machaze Districts. This zone is drained by the Save River, which flows from Zimbabwe into Mozambique. Its topography includes both highland and lowlands with an average altitude greater than 500 meters above sea level. The average precipitation is around 600‐800 mm per annum with a rainy season from November through the end of March. The dry season is from April until October. Temperatures vary from a maximum of 30‐35° Celsius to a minimum of 15 ‐20° Celsius. Soils are largely sandy with stony texture and mainly moderate fertility, making it less suitable for crop farming. Vegetation cover is predominantly savannah grassland with open and mangrove forest towards the coastal areas. Natural resources include timber, fish, and salt along the coastal areas. Agriculture is rainfed with an average land holding of 2 ha per household. Land cultivation is primarily hand tillage with animal traction mainly practiced by the better‐off group. The zone has an average of 10‐25 inhabitants/km2 and is mainly occupied by Danda‐ and Hlengwe‐speaking people. The availability of natural resources such as rivers shapes livelihood patterns in this zone. The main sources of livelihood are agriculture, fishing, and rearing of livestock. The main food crops are sorghum and maize. Cash cropping is widespread and includes pineapple and cashew nuts with sesame produced mostly in Chibabava. Goats and poultry are also kept for consumption and sale. The local determinants of wealth are the size of land cultivated, livestock ownership, and the level of access to gainful economic activities. The poor consume own production for roughly seven months of the year and rely on market purchases for the remainder. The poor are also involved in vegetable production (for consumption and sale) along the riverine floodplains of the Save River and both river and marine fishing along Machanga coastal areas. Though the poor earn some income from food and cash crop sales, they rely primarily on agricultural labor wages supporting other wealth groups in the zone. Additional sources of income for the poor include seasonal fishing, labor in salt extraction industry, employment in South Africa (somewhat constrained by the cost of access), and the sale of poultry. Better‐off households are self‐sufficient in food production, and they produce a marketable surplus most years. The better‐off do purchase non‐staple foods and preferred foods to complement own production. In addition to food and—most importantly—cash crop sales, the better‐off group also sells a few cattle each year.
Access to markets is limited due to the remote location of this zone. Labor employment opportunities are mainly in South Africa and in sugar processing plants. Most local people trade their produce within the zone; however, they may have to walk long distances to reach the nearest market due to poor transport networks.
Food insecurity risk
Moderate risk to food insecurity due to average crop production.
2007 population (percent of national population)
234,613 (1.16%)
Main productive assets
Poor Better‐off
Small area cultivated Goats Poultry Hand tools Bicycle
Large area cultivatedCattle Goats Poultry Hand tools Motor cycle Irrigation pump Grinding mill
Main foods consumed and sources
Poor Better‐off
Maize (OP, MP) Sweet potatoes (OP) Sorghum Yam (OP) Beans (OP, MP) Meat (OP, MP) Groundnut (OP) Vegetables (OP)
Maize (OP) Sweet potatoes (OP) Sorghum Yam (OP) Beans (OP, MP) Meat (OP, MP) Groundnut (OP) Vegetables (OP)
Main income sources
Poor Better‐off
Sale of labor Sale of pineapples Sale of cashew nuts Sale of maize Sale of firewood and charcoal Sale of fish and salt Sale of poultry
Sale of cattle Sale of goats Sale of pineapples Sale of cashew nuts Sale of maize Sale of sesame Sale of fish Trade
Main markets
Agricultural labor: Beira, Vilanculos, and Massinga
Main hazards
Floods January‐February
Drought December‐February
Human‐wildlife conflict March‐June
Main coping strategies for poor households
Increased sale of goats and poultry Switch to drought‐tolerant crops Increased sale of firewood and charcoal Increased sale of local brew and salt
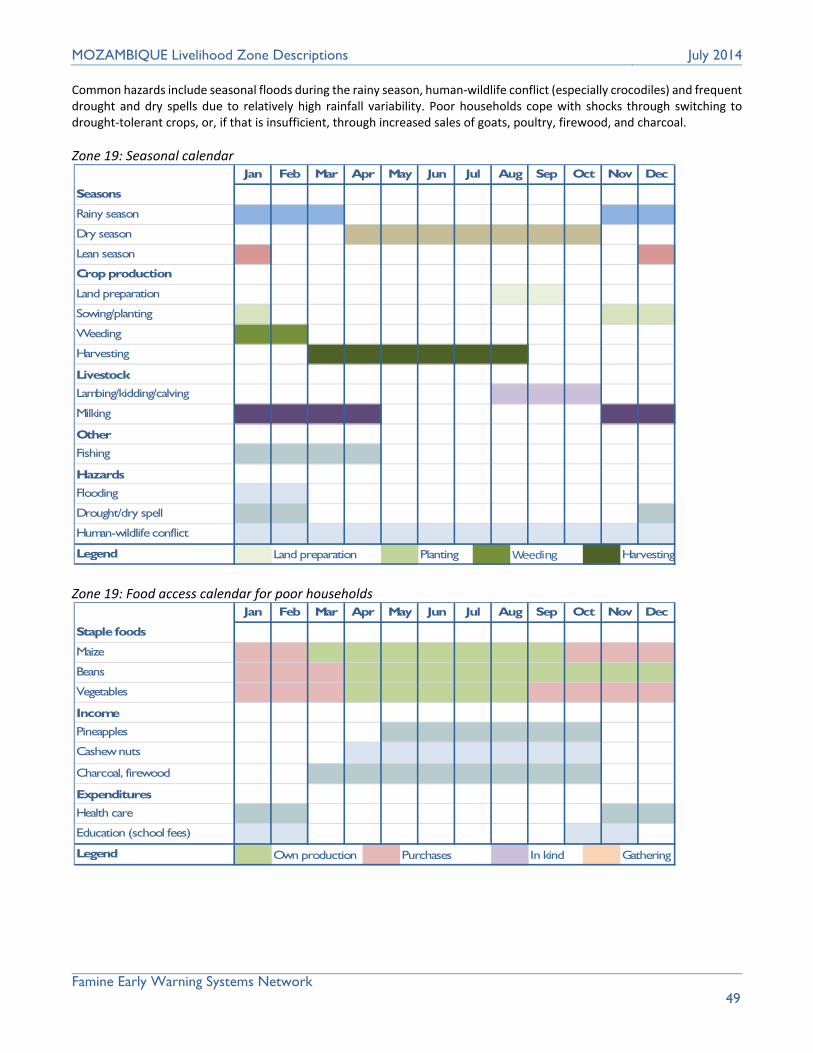
49
MOZAMBIQUE Livelihood Zone Descriptions July 2014
Famine Early Warning Systems Network
Common hazards include seasonal floods during the rainy season, human‐wildlife conflict (especially crocodiles) and frequent drought and dry spells due to relatively high rainfall variability. Poor households cope with shocks through switching to drought‐tolerant crops, or, if that is insufficient, through increased sales of goats, poultry, firewood, and charcoal.
Zone 19: Seasonal calendar
Zone 19: Food access calendar for poor households
Seasons
Rainy season
Dry season
Lean season
Crop production
Land preparation
Sowing/planting
Weeding
Harvesting
Livestock
Lambing/kidding/calving
Milking
Other
Fishing 1 1 1 1 1 1 1 1
Hazards
Flooding
Drought/dry spell 1 1 1 1 1 1
Human-wildlife conflict
Legend p p Land preparation s s Planting w w Weeding h h Harvesting
DecJan Feb Mar Apr May Jun Jul Aug Sep Oct Nov
Staple foods
Maize
Beans
Vegetables
Income
Pineapples 1 1 1 1 1 1 1 1 1 1 1 1
Cashew nuts
Charcoal, firewood 1 1 1 1 1 1 1 1 1 1 1 1 1 1 1 1
Expenditures
Health care 1 1 1 1 1 1 1 1
Education (school fees)
Legend p p Own production m m Purchases k k In kind c c Gathering
DecJan Feb Mar Apr May Jun Jul Aug Sep Oct Nov

50
MOZAMBIQUE Livelihood Zone Descriptions July 2014
Famine Early Warning Systems Network
SOUTHERN COASTAL CASSAVA, COCONUT, AND FISHING (ZONE 20)
This lowland, coastal zone (<200 masl) lies along the southern coastal line of Mozambique, mostly in Inhambane Province, covering the eastern part of Govuro, Jangamo, Inhassoro, Inharrime, Vilankulos, and Zavala Districts. Average rainfall is about 750‐1,250 mm per annum, with a warm rainy season from November to March in most of the zone. Rains can occur during the cool season, which has particular benefits for cassava and cashew nut production. The dry season is from April until October. Soils are sandy to clay, with pockets of open–table, fertile, alluvial soils capable of holding residual moisture and favorable for rice production and seasonal vegetables. The main vegetation cover is savannah grassland with mangrove swamps towards the extreme coastal areas. This zone is among the most densely populated parts of Mozambique and mainly inhabited by the Iswa‐ and Gwambe‐speaking people. Due to limited availability of land, there is a tendency to intercrop all major crops in the area. Generally the fallow period has declined due to land shortage, and it is expected that land productivity is declining significantly. Cashew nut production is one of the most important sources of income among all wealth groups. However, lowlands and river valleys with potential for rice production may be under‐utilized. The main sources of livelihood are agriculture, fishing, and livestock. The main food crops include cassava, sweet potatoes, maize, cowpeas, and groundnut. Cash crops such as citrus fruits, cashew nuts, coconut, pineapple, palm tree, sugarcane, and bananas are also produced mainly for commercial purposes. Livestock include cattle, goats, and poultry, with the latter mainly for consumption. Wealth is chiefly determined by size of land cultivated, livestock ownership and gainful economic activities along the coast. Poor households are nearly self‐sufficient in cassava production, though they complement own production with market purchase, particularly in January and February. They mainly derive income from sale of unskilled labor in Govuro salt extraction works, tourism and hospitality, as well as in the fishing sector. Smaller shares of income include coconut and seafood sales. The better‐off group mainly consume on own crops with limited
market purchases mainly during years of poor rainfall. The better‐off group mainly depend on own crop production for income, including cash crops (pineapple, palm trees, sugar, and bananas), as well as the sale of skilled labor in formal employment and informal trade along the National Road N1. Physical access to markets is very good in this zone due to easy access to the National Road N1 and good currency circulation. The presence of wholesalers, particularly in Massinga, Maxixe, and Xai Xai, adds value to marketing and trade dynamics in the zone. The main hazards in this zone are drought and dry spells, wind erosion due to its proximity to the coast, and cyclones. When these hazards result in significant shocks to food or income sources, poor households commonly increase coastal fishing and migrate in search of employment in urban centers and neighboring countries.
Food insecurity risk
Low‐to‐moderate risk of food insecurity due to diversified agriculture
2007 population (percent of national population)
475,117 (2.35%)
Main productive assets
Poor Better‐off
Small area cultivated Goats Poultry Fishing nets and canoes
Large area cultivatedCattle Goats Poultry Boats
Main foods consumed and sources
Poor Better‐off
Cassava (OP) Cowpeas (OP, MP)Groundnuts (OP, MP) Citrus fruits (OP) Fish (G) Coconut (OP, MP)
Cassava (OP) Cowpeas (OP) Groundnuts (OP)Cashew nuts (OP) Citrus fruits (OP) Fish (G) Coconut (OP)
Main income sources
Poor Better‐off
Sale of unskilled labor Sale of coconut Sale of cashew nuts Sale of seafood
Sale of cashew nutsSale of seafood Sale of coconuts Sale of cashew nuts Sale of citrus fruits Sale of skilled labor Informal trade
Main markets
Maxixe, Massinga, Xai Xai, and Maputo
Main hazards
Drought and dry spell conditions
December‐February
Wind erosion Throughout the year
Main coping strategies for poor households
Intensification of coastal fishing Migration in search of employment

51
MOZAMBIQUE Livelihood Zone Descriptions July 2014
Famine Early Warning Systems Network
Zone 20: Seasonal calendar
Zone 20: Food access calendar for poor households
Seasons
Rainy season
Dry season
Lean season
Crop production
Land preparation
Sowing/planting
Weeding
Harvesting
Livestock
Lambing/kidding/calving
Milking
Other
Fishing 1 1 1 1 1 1 1 1 1 1 1 1 1 1 1 1 1 1 1 1 1 1 1 1
Hazards
Drought/dry spell 2
Legend p p Land preparation s s Planting w w Weeding h h Harvesting
DecJan Feb Mar Apr May Jun Jul Aug Sep Oct Nov
Staple foods
Cassava
Cowpeas
Fish c c c c c c c c c c c c c c c c c c c c c c c c
Income
Salt extraction labor 1 1 1 1 1 1 1 1 1 1 1 1 1 1 1 1 1 1 1 1 1 1 1 1
Tourism labor 2 2 2 2 2 2 2 2 2 2 2 2 2 2 2 2 2 2 2 2 2 2 2 2
Seafood 1 1 1 1 1 1 1 1 1 1 1 1 1 1 1 1 1 1 1 1 1 1 1 1
Expenditures
Health care 2 2 2 2 2 2 2 2
Education (school fees) 1 1 1 1 1 1 1 1
Legend p p Own production m m Purchases k k In kind c c Gathering
DecJan Feb Mar Apr May Jun Jul Aug Sep Oct Nov

52
MOZAMBIQUE Livelihood Zone Descriptions July 2014
Famine Early Warning Systems Network
SOUTHERN INTERMEDIATE MIXED CROPPING (ZONE 21)
This zone is located along the transitional areas of south eastern Mozambique between the coastal plans and the inland highlands, in the middle of Inhambane Province. It includes parts of Govuro, Inhassoro, Massinga, Morrumbene and Vilanculos Districts. Average rainfall is about 500‐750 mm per annum, mainly from November through the end of March. The dry season is from April until October. The main vegetation is savannah grassland and bush scrubs. Forestry and natural gas are important resources in the zone. The population density is low and mainly comprised of Tonga‐ and Bargwe‐speaking people. Moderate rainfall coupled with low population density makes this zone suitable for rainfed agriculture. The main food crops are maize, sorghum, sweet potatoes, sesame, cowpeas, Bambara nuts, and cashew nuts. The few livestock kept are goats and chickens. Additional activities include hunting in the savannah and bush of the zone. Wealth in this zone is chiefly determined by the area cultivated and livestock ownership. Poor households consume primarily own production and wild game for most of the year but rely on markets between October and January. Though virtually all households in the zone sell some maize at harvest time, especially during good years, the poor also sell local brew and game meat and may occasionally receive cash remittances. Similar to other neighboring zones, better‐off group are self‐sufficient in staples for most of the year but also rely on the market in January/February. The better‐off also sell livestock and timber regularly. Access to trade and markets for sale of local products is very limited due to the interior location of the zone and under‐developed road infrastructure. Physical access to local markets is difficult. There are few local employment opportunities, resulting in heavy migration to South Africa among all wealth groups. The common hazards are agricultural related and include drought and dry spells, as well as floods, especially during the rainy season. Coping strategies include increased migration in search of labor and increased collection of wild foods, including hunting for game
meat.
Food insecurity risk
Low acute food insecurity risk due to diversified cropping and heavy migration to South Africa
2007 population (percent of national population)
225,206 (1.11%)
Main productive assets
Poor Better‐off
Small area cultivated Poultry Hand tools: hoe, axe, and panga
Large area cultivatedGoats Hand tools: hoe, axe, and panga
Main foods consumed and sources
Poor Better‐off
Maize (OP, MP) Sorghum (OP, MP) Sweet potatoes (OP) Sesame (OP, MP) Cowpeas (OP, MP) Bambara nut (OP, MP) Wild foods (G)
Maize (OP) Sorghum (OP) Sweet potatoes (OP) Sesame (OP) Cowpeas (OP) Bambara nut (OP) Wild foods (G)
Main income sources
Poor Better‐off
Sale of local brew Sale of game meat Sale of honey Sale of coconut Sale of cashew nuts Sale of maize Cash remittances
Sale of goats Sale of swine Sale of honey Sale of cashew nuts Sale of maize Cash remittances Timber
Main markets
Foodstuffs, produce: Massinga, Maxixe, Xai‐Xai, and Maputo Labor: mines and farms in South Africa
Main hazards
Drought or dry spells December‐February
Human wild life conflict April‐June
Wind erosion Throughout the year
Main coping strategies for poor households
Increased labor migration Increased collection of wild foods, hunting of game

53
MOZAMBIQUE Livelihood Zone Descriptions July 2014
Famine Early Warning Systems Network
Zone 21: Seasonal calendar
Zone 21: Food access calendar for poor households
Seasons
Rainy season
Dry season
Lean season
Crop production
Land preparation
Sowing/planting
Weeding
Harvesting
Livestock
Lambing/kidding/calving
Milking
Other
Fishing 1 1 1 1 1 1 1 1 1 1 1 1 1 1 1 1 1 1 1 1 1 1 1 1
Hazards
Drought/dry spell
Legend p p Land preparation s s Planting w w Weeding h h Harvesting
DecJan Feb Mar Apr May Jun Jul Aug Sep Oct Nov
Staple foods
Maize
Sorghum
Sesame
Income
Cashew nuts 1 1 1 1 1 1 1 1 1 1 1 1 1 1 1 1 1 1 1 1 1 1 1 1
Local brew 2 2 2 2 2 2 2 2 2 2 2 2 2 2 2 2 2 2 2 2 2 2 2 2
Maize 1 1 1 1 1 1 1 1
Expenditures
Health care 2 2 2 2 2 2 2 2
Education (school fees) 1 1 1 1 1 1 1 1
Legend p p Own production m m Purchases k k In kind c c Gathering
DecJan Feb Mar Apr May Jun Jul Aug Sep Oct Nov

54
MOZAMBIQUE Livelihood Zone Descriptions July 2014
Famine Early Warning Systems Network
SOUTHERN SEMIARID CEREALS AND CATTLE (ZONE 22)
This semiarid zone is located in southern Mozambique, in the interior of Gaza and Inhambane Provinces. The districts found in the zone are: Chigubo, Funhalouro, Mabote, Massangena, Panda, and parts of district of Chiculacula and Mabalane. Average precipitation is low, ranging from about 250‐600 mm per annum, mainly falling from November to March. The dry season is from April until October. During the hottest periods of the year, in the wet season, temperatures range from a maximum of 35 to 38° Celsius in December/January and minimum of 20‐25° Celsius in the dry season June/July. The soils are poor and sandy in texture with low fertility. Given the lack of soil moisture and poor water retention capacity, drought‐tolerant crops such as sorghum and millet are mainly grown in this zone. The main vegetation cover is savannah grasslands with pockets of broadleaf evergreen forest. This zone has forests and game reserves of high economic value. The population density is medium, mainly made up of Thonga‐ and Shangana‐speaking groups. Rainfed agriculture is the dominant activity, mainly practiced in one season. Given duration of the crop growing period, short cycle varieties and techniques of moisture conservation are needed to ensure successful crop production. Maize has limited potential. As such, the main food crops grown are millet, sorghum, pulses, watermelon, groundnuts, and cashew nuts (mainly grown for commercial purposes). Small to medium holdings of cattle, goats, and poultry are typical with annual transhumance particularly for cattle. Hunting is an important supplementary source of food for most households due to the proximity of forest and game reserves. The main local determinants of wealth are ownership of livestock and land area cultivated. The poor are largely dependent on own production for food consumption and consume market purchases about four months of the year. Wild foods (fish and wild game meat) are particularly common between September and December. The main sources of cash income for the poor are sale of wild game meat, charcoal, and firewood. They sell a small portion of own production, particularly legumes, at harvest time. The better‐off group is largely self‐sufficient in own crop production, even during years of poor rainfall and, in some cases, crop failure. The better‐off earn some income from crop sales and game meat, but cattle and timber sales represent larger shares of income. Additional sources of income among the better‐off include trade and tourism. Physical access to markets is poor during the rainy season. This is
a remote zone with poor currency circulation and without wholesale cereal traders. The main local markets for buying and selling commodities are Chibuto, Chigubo, Funhalouro, Guija, Mabalane, Mabote, and Panda. These link with intermediate markets such as Maxixe, Mandlakazi, Chokwe, Massinga, Chicualcuala, and Xai Xai, which in turn link with external, wholesale markets, such as Maputo.
Food insecurity risk
High risk of food insecurity due to low agricultural productivity
2007 population (percent of national population)
237,787 (1.17%)
Main productive assets
Poor Better‐off
Small area cultivated Goats Sheep Poultry
Large area cultivatedCattle Goats Sheep Poultry
Main foods consumed and sources
Poor Better‐off
Millet (OP, MP) Sorghum (OP, MP) Maize (OP, MP) Pumpkins (OP) Beans (OP) Groundnut (OP) Cassava (OP) Meat (OP, MP) Milk (OP, MP) Wild foods (G)
Millet (OP) Sorghum (OP) Maize (OP, MP) Pumpkins (OP) Beans (OP) Groundnut (OP) Cassava (OP) Meat (OP, MP) Milk (OP, MP) Wild foods (G)
Main income sources
Poor Better‐off
Sale of millet/sorghum Sale of goats/sheep Sale of charcoal Sale of firewood Sale of game meat Sale of milk and meat
Sale of millet/sorghumSale of cashew nut Sale of cattle Sale of goats/sheep Sale of timber Sale of game meat Trade Sale of milk and meat
Main markets
Massangene, Chigubo, Massingir, Guijá, Chibuto, Chigubo, Funhalouro, Guija, Mabalane, Mabote, Mandlakazi, and Panda
Main hazards
Drought or dry spells January‐May
Livestock diseases December‐March
Main coping strategies for poor households
Extend livestock movement (distance, duration)Increased sale of goats and sheep Increase exploitation of forestry products Increasing the collection of wild foods

55
MOZAMBIQUE Livelihood Zone Descriptions July 2014
Famine Early Warning Systems Network
The main hazards are drought and dry spells, as well as livestock disease. Poor households cope by intensifying firewood and charcoal sales and consumption of wild foods. Some households may increase the distance and duration of seasonal livestock movement and increase livestock sales. The better‐off may also increase livestock drug purchases.
Zone 22: Seasonal calendar
Zone 22: Food access calendar for poor households
Seasons
Rainy season
Dry season
Lean season
Crop production
Land preparation
Sowing/planting
Weeding
Harvesting
Wild foods 1 1 1 1 1 1 1 1
Livestock
Lambing/kidding/calving
Milking
Hazards
Drought/dry spell 1 1 1 1 1 1 1 1 1 1
Livestock diseases 2 2 2 2 2 2 2 2 2 2 2 2 2 2 2 2 2 2 2 2 2 2 2 2
Legend p p Land preparation s s Planting w w Weeding h h Harvesting
DecJan Feb Mar Apr May Jun Jul Aug Sep Oct Nov
Staple foods
Sorghum/millet
Maize
Beans
Income
Charcoal, firewood 1 1 1 1 1 1 1 1 1 1 1 1 1 1 1 1
Agricultural labor 2
Milk, meat 1 1 1 1 1 1 1 1 1 1
Expenditures
Health care 2 2 2 2 2 2 2 2
Education (school fees) 1 1 1 1 1 1 1 1
Legend p p Own production m m Purchases k k In kind c c Gathering
DecJan Feb Mar Apr May Jun Jul Aug Sep Oct Nov
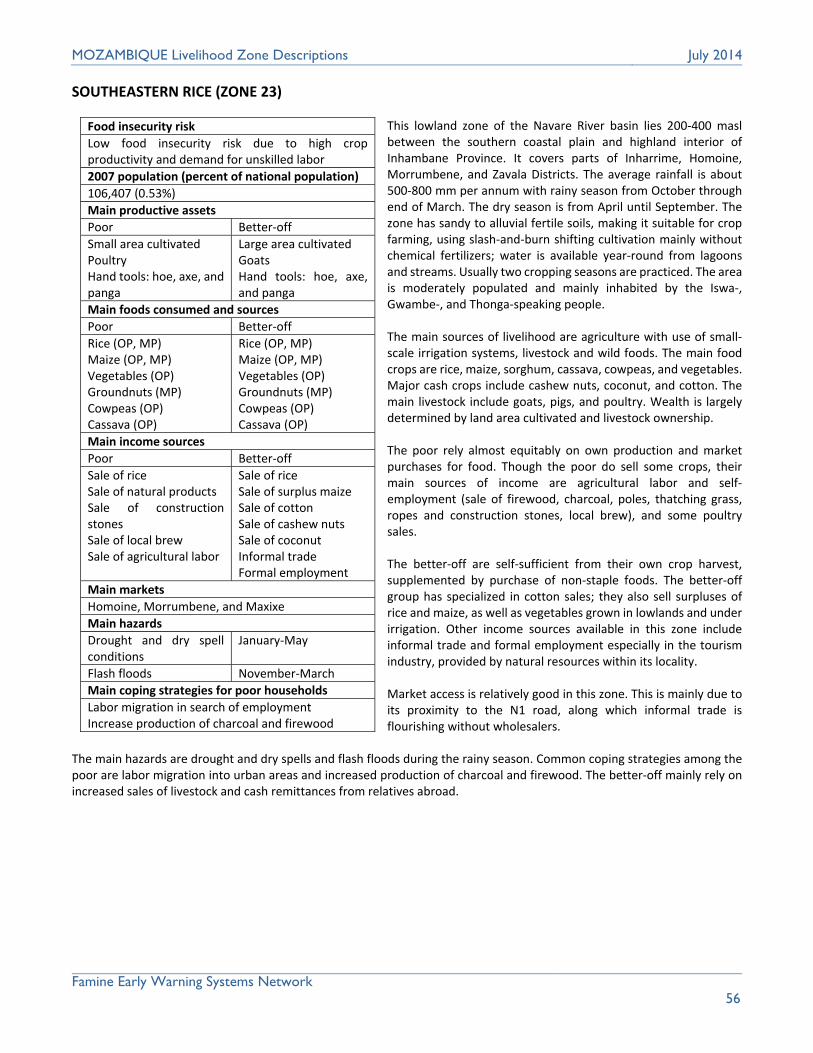
56
MOZAMBIQUE Livelihood Zone Descriptions July 2014
Famine Early Warning Systems Network
SOUTHEASTERN RICE (ZONE 23)
This lowland zone of the Navare River basin lies 200‐400 masl between the southern coastal plain and highland interior of Inhambane Province. It covers parts of Inharrime, Homoine, Morrumbene, and Zavala Districts. The average rainfall is about 500‐800 mm per annum with rainy season from October through end of March. The dry season is from April until September. The zone has sandy to alluvial fertile soils, making it suitable for crop farming, using slash‐and‐burn shifting cultivation mainly without chemical fertilizers; water is available year‐round from lagoons and streams. Usually two cropping seasons are practiced. The area is moderately populated and mainly inhabited by the Iswa‐, Gwambe‐, and Thonga‐speaking people. The main sources of livelihood are agriculture with use of small‐scale irrigation systems, livestock and wild foods. The main food crops are rice, maize, sorghum, cassava, cowpeas, and vegetables. Major cash crops include cashew nuts, coconut, and cotton. The main livestock include goats, pigs, and poultry. Wealth is largely determined by land area cultivated and livestock ownership. The poor rely almost equitably on own production and market purchases for food. Though the poor do sell some crops, their main sources of income are agricultural labor and self‐employment (sale of firewood, charcoal, poles, thatching grass, ropes and construction stones, local brew), and some poultry sales. The better‐off are self‐sufficient from their own crop harvest, supplemented by purchase of non‐staple foods. The better‐off group has specialized in cotton sales; they also sell surpluses of rice and maize, as well as vegetables grown in lowlands and under irrigation. Other income sources available in this zone include informal trade and formal employment especially in the tourism industry, provided by natural resources within its locality. Market access is relatively good in this zone. This is mainly due to its proximity to the N1 road, along which informal trade is flourishing without wholesalers.
The main hazards are drought and dry spells and flash floods during the rainy season. Common coping strategies among the poor are labor migration into urban areas and increased production of charcoal and firewood. The better‐off mainly rely on increased sales of livestock and cash remittances from relatives abroad.
Food insecurity risk
Low food insecurity risk due to high crop productivity and demand for unskilled labor
2007 population (percent of national population)
106,407 (0.53%)
Main productive assets
Poor Better‐off
Small area cultivated Poultry Hand tools: hoe, axe, and panga
Large area cultivatedGoats Hand tools: hoe, axe, and panga
Main foods consumed and sources
Poor Better‐off
Rice (OP, MP) Maize (OP, MP) Vegetables (OP) Groundnuts (MP) Cowpeas (OP) Cassava (OP)
Rice (OP, MP) Maize (OP, MP) Vegetables (OP) Groundnuts (MP) Cowpeas (OP) Cassava (OP)
Main income sources
Poor Better‐off
Sale of rice Sale of natural products Sale of construction stones Sale of local brew Sale of agricultural labor
Sale of rice Sale of surplus maize Sale of cotton Sale of cashew nuts Sale of coconut Informal trade Formal employment
Main markets
Homoine, Morrumbene, and Maxixe
Main hazards
Drought and dry spell conditions
January‐May
Flash floods November‐March
Main coping strategies for poor households
Labor migration in search of employment Increase production of charcoal and firewood

57
MOZAMBIQUE Livelihood Zone Descriptions July 2014
Famine Early Warning Systems Network
Zone 23: Seasonal calendar
Zone 23: Food access calendar for poor households
Seasons
Rainy season
Dry season
Lean season
Crop production
Land preparation
Sowing/planting
Weeding
Harvesting
Wild foods 1 1 1 1 1 1 1 1 1 1 1 1 1 1
Livestock
Lambing/kidding/calving
Milking
Hazards
Drought/dry spell
Flooding 1 1 1 1 1 1 1 1 1 1
Legend p p Land preparation s s Planting w w Weeding h h Harvesting
DecJan Feb Mar Apr May Jun Jul Aug Sep Oct Nov
Staple foods
Rice
Maize
Cowpeas
Income
Charcoal, firewood 1 1 1 1 1 1 1 1 1 1 1 1
Local brew
Agricultural labor 1 1 1 1 1 1 1 1 1 1 1 1 1 1 1 1
Expenditures
Health care 2 2 2 2 2 2 2 2
Education (school fees) 1 1 1 1 1 1 1 1
Legend p p Own production m m Purchases k k In kind c c Gathering
DecJan Feb Mar Apr May Jun Jul Aug Sep Oct Nov

58
MOZAMBIQUE Livelihood Zone Descriptions July 2014
Famine Early Warning Systems Network
LIMPOPO AND ELEPHANT RIVERS MIXED CROPPING (ZONE 24)
The semiarid lowland plains and undulating hills (200‐500 masl) of this zone lie within the Limpopo Basin in southwestern Mozambique along the Limpopo and Elephant Rivers. It includes parts of Chibuto, Chicualcuala, Chokwe, Guija, and Massingir Districts. The average precipitation of this zone is 400‐700 mm per annum, falling primarily from October through end March. Temperatures average from 20° Celsius in the cooler, dry‐season months of June to August and 28‐30° Celsius in hot, wet season (December‐ January). The soils are mainly sandy clay and have moderate crop production potential. This area has natural vegetation of bush scrub with mopane and other trees for poles and timber. Part of this area is covered by the Limpopo National Park. The population density is extremely low at <3 people/km2, but there is a concentration of people along the fertile, riverine areas. It is mainly inhabited by the Shangana‐speaking people. Agriculture with limited livestock is the main source of livelihood with crop cultivation mainly by hand‐hoe (poor), ox‐plough (middle and better‐off), and tractor to a more limited extent (better‐off). The main food crops other than maize are cowpeas, groundnuts, sweet potatoes, and Bambara nuts, normally intercropped with watermelons and pumpkins. Livestock include cattle, goats, and poultry, but no pigs. Maize and pluses are grown in the more fertile alluvial soils along Limpopo River banks, whereas cassava is mainly planted in sandy soils far from the river banks. The irrigated scheme of Chokwe also contributes to the overall dynamics of food production and agricultural employment opportunities in the zone. The two primary factors which determine wealth are size of cultivated and irrigated land and livestock ownership. Access to irrigated land and farming equipment such as tractors and water pumps are also critical in determining production and ultimately wealth status of households. Maize is staple food for all wealth groups. Cassava is a less‐preferred food and also an insurance crop, consumed in significantly larger quantities during below‐average years. Chicken and, in some cases, goats are used for consumption as well. Wild foods such as massala, mafurra, and canhu are widely found and consumed by all local inhabitants in the zone. Household cash income is dependent on level of production and sale of labor. The poor group depends on local casual work in farms and gold mines in South Africa, making and selling charcoal (a major income source), and brewing. The better‐off group relies on crop and livestock sales for cash income with some trade and formal employment.
Physical access to markets is relatively good, enhancing access to trade and markets, especially via the Zimbabwe‐Maputo railway, which runs through the zone from north to south, alongside the main road. This provides a single main artery for trade, linking the main towns. There is a poor internal road network for villages, often impassable in the rainy season, and,
Food insecurity risk
Low‐to‐moderate acute food insecurity risk due to access to irrigation and markets
2007 population (percent of national population)
362,991 (1.79%)
Main productive assets
Poor Better‐off
Small area cultivated Goats Poultry Hand tools: hoe, axe, and panga
Large area cultivatedCattle Goats/Sheep Tractor Irrigation pumps
Main foods consumed and sources
Poor Better‐off
Maize (OP, MP) Rice (OP, MP) Cassava (OP, MP) Cowpeas (OP, MP) Groundnuts (OP, MP) Bambara nut (OP, MP) Sweet potatoes (OP, MP)
Maize (OP) Rice (OP, MP) Cassava (OP) Cowpeas (OP) Groundnuts (OP) Bambara nut (OP) Sweet potatoes (OP, MP)
Main income sources
Poor Better‐off
Sale of maize Sale of vegetables Sale of charcoal Sale of local brew Sale of fish Sale of labor
Sale of maize Sale of rice Sale of vegetables Sale of cattle Sale of goats Sale of fish Trade
Main markets
Mabalane, Vila Eduardo, Xai‐Xai, Macia, Mandlakazi, Chókwè, Chibuto, Maputo
Main hazards
Floods October‐March
Strong winds and cyclones
December‐March
Human‐wildlife conflict March‐June
Crop pests and diseases December‐April
Livestock diseases November‐April
Main coping strategies for poor households
Movement to lower flood‐risk areas Increased search for employment opportunities Increased charcoal, firewood sales Increased migration into South Africa

59
MOZAMBIQUE Livelihood Zone Descriptions July 2014
Famine Early Warning Systems Network
on the whole this, zone is relatively isolated from commercial centers in the South of the country. The main local market towns are Chokwe and Guija, which are linked through the railroad from Maputo to Zimbabwe, the road to Chicualacuala, and the Macarratane Dam. The people in this zone also take advantage of good access to main roads and railway to sell charcoal and firewood and to access South Africa for additional employment. Combined with local agricultural labor, these activities provide the much needed cash income required for food purchase in years when crop production is low.
Zone 24: Seasonal calendar
Zone 24: Food access calendar for poor households
Seasons
Rainy season
Dry season
Lean season l l l l l l
Crop production
Land preparation
Sowing/planting
Weeding
Harvesting
Livestock
Lambing/kidding/calving
Milking
Hazards
Flooding 1 1 1 1 1 1 1 1 1 1 1 1
Crop pests, diseases
Legend p p Land preparation s s Planting w w Weeding h h Harvesting
DecJan Feb Mar Apr May Jun Jul Aug Sep Oct Nov
Staple foods
Maize
Rice
Cassava, sweet potatoes
Income
Maize 1 1 1 1 1 1 1 1 1 1 1 1
Local brew
Agricultural labor 1 1 1 1 1 1 1 1 1 1 1 1 1 1 1 1 1 1 1 1 1 1 1 1
Expenditures
Health care 2 2 2 2 2 2 2 2
Education (school fees) 1 1 1 1 1 1 1 1
Legend p p Own production m m Purchases k k In kind c c Gathering
DecJan Feb Mar Apr May Jun Jul Aug Sep Oct Nov

60
MOZAMBIQUE Livelihood Zone Descriptions July 2014
Famine Early Warning Systems Network
SOUTHERN COASTAL FISHING, CASSAVA, AND MAIZE (ZONE 25)
The lowland, coastal plains of the extreme southeastern part of Mozambique along the coastal areas of Gaza and Maputo Provinces comprise the Southern Coastal Fishing, Cassava, and Maize livelihood zone. Mandlakazi, Xai‐Xai, Bilene, Manhiça, Arracuene and part of Matutuine Districts are found in the zone. Precipitation in this zone averages about 750‐1,250 mm per annum from October through end of March. The dry season is from April until September. Temperatures range from a maximum of 30‐35°C in October to February to a minimum of 20‐25°C from March to September. Generally vegetation cover is savannah grassland and bushes and scrub with pockets of mangrove, fresh water swamp, and marsh, especially along the coastal areas. Maputo and Xai‐Xai cities have a significant influence on the local economy of this zone. This area is highly populated and traditionally inhabited by Lenge‐, Chopi‐, Tonga‐ and Ronga‐speaking people. In recent years, it has become cosmopolitan due to the influence of Maputo city. The main sources of livelihood are agriculture, livestock, fishing, and labor employment. There is increasing exploitation of forestry products for handicrafts and mats, and seasonal production of charcoal and firewood. The primary determinants of wealth are the land area cultivated, livestock ownership, ownership of fishing equipment, and access to economic activities. All households consume own‐produced maize, cassava, sweet potatoes, and rice. However, the better‐off group is more self‐sufficient due to higher food production. The poor group, with limited cultivable land, relies more heavily on market purchases between October and February. All wealth groups supplement their diet with consumption marine fish. While all households sell some food crops, the better‐off mainly sell cash crops such as sugarcane, cashew nuts, bananas, and citrus fruits. They may also trade in major urban centers such as Maputo city and Xai‐Xai. The poor rely instead on the sale of agricultural and non‐farm labor in urban centers. Physical access to markets in this zone is relatively good compared with the southern interior of the country due to its strategic location within the national road (N1) grid across the zone facilitating linkages and trade with Maputo city and neighboring countries such as South Africa and Swaziland. There is also good cash circulation with well‐developed trade and commercial networks due to availability of banks. The most common hazards are seasonal floods, drought and dry spells, and strong winds and coastal erosion, mainly during the
rainy season. The poor and better‐off group all cope through common strategies, such as relocation to low flood risk areas and migration into urban centers such as Maputo city and tourist areas in search of employment.
Food insecurity risk
Low food insecurity risk due to diversified livelihood options
2007 population (percent of national population)
875,011 (4.32%)
Main productive assets
Poor Better‐off
Small area cultivated Goats Poultry Fishing nets and hooks
Large area cultivatedCattle Goats Poultry Fishing boats, canoes, nets
Main foods consumed and sources
Poor Better‐off
Maize (OP, MP) Rice (OP, MP) Cassava (OP) Cowpea (OP, MP) Beans (OP, MP) Groundnuts (OP, MP) Sweet potatoes (OP, MP) Banana (OP, MP) Citrus fruits (OP)
Maize (OP) Rice (OP) Cassava (OP) Cowpea (OP) Beans (OP) Groundnuts (OP) Sweet potatoes (OP) Banana (OP) Cashew nut, citrus fruits (OP)
Main income sources
Poor Better‐off
Sale of labor Sale of maize Sale of cassava Sale of bananas Sale of cashew nut Sale of citrus and other fruits Sale of fish
Sale of cattle Sale of maize Sale of rice Sale of cassava Sale of bananas Sale of cashew nut Sale of citrus fruits Trade
Main markets
Zitundo, Belavista, Mugazine, Marracuene, Machubo, Maluana, Manhica, Plameira, and Calanga
Main hazards
Floods October‐March
Coastal erosion Throughout the year
Drought or dry spells January‐February
Main coping strategies for poor households
Relocation to low flood risk areas Increased reliance on fishing Migration into urban centers

61
MOZAMBIQUE Livelihood Zone Descriptions July 2014
Famine Early Warning Systems Network
Zone 25: Seasonal calendar
Zone 25: Food access calendar for poor households
Seasons
Rainy season
Dry season
Lean season
Crop production
Land preparation
Sowing/planting
Weeding
Harvesting
Wild foods 1 1 1 1 1 1 1 1 1 1 1 1 1 1 1 1 1 1 1 1
Livestock
Lambing/kidding/calving
Milking
Hazards
Flooding 1 1 1 1 1 1 1 1 1 1 1 1
Drought/dry spell 2 2 2 2
Legend p p Land preparation s s Planting w w Weeding h h Harvesting
DecJan Feb Mar Apr May Jun Jul Aug Sep Oct Nov
Staple foods
Maize p p p p p p p p p p
Sweet potatoes p p p p p p p p p p p p p p p p p p p p p p p p
Cassava p p p p p p p p p p
Income
Tubers 1 1 1 1 1 1 1 1 1 1 1 1 1 1 1 1 1 1 1 1 1 1 1 1
Migrant labor
Construction materials 1 1 1 1 1 1 1 1 1 1 1 1 1 1 1 1 1 1 1 1 1 1 1 1
Fish
Expenditures
Health care 1 1 1 1 1 1 1 1
Education (school fees)
Legend p p Own production m m Purchases k k In kind c c Gathering
DecJan Feb Mar Apr May Jun Jul Aug Sep Oct Nov

62
MOZAMBIQUE Livelihood Zone Descriptions July 2014
Famine Early Warning Systems Network
SOUTHERN HIGHLAND CATTLE AND MIXED CROPPING (ZONE 26)
This zone is located in the extreme southwestern part of Maputo province that includes districts of Magude, Moamba, Boane, and Namaacha, and part of Matutuine. It lies at an altitude of about 200‐500 meters, reaching higher altitudes of 500‐700 meters above sea level towards the border with South Africa and Swaziland. Precipitation is about 500‐750 mm per annum and highly variable in distribution. The main rainy season takes place from October through the end of February, but rains can also occur during the cool season. The dry season is from March to September. Temperatures during the growing season are moderately warm (20‐25° Celsius). The soils are sandy and clay with rocks and stones, limiting the use of arable land. The vegetation cover is savannah grassland with bushes and scrubs. The area has natural resources such as timber, game reserves, and minerals (limestone). This zone is moderately populated with approximately 7 inhabitants/km2 and predominantly Nguni‐ and Shangana‐speaking people. Average landholdings are about 1 ha per household. Land preparation is primarily manual, though a few better‐off farmers use animal traction and tractors for plowing. Farmers cultivate land year‐round, although they mostly rely on rainfed agriculture. Irrigated fields are common in this zone as well. Given the short duration of main growing season, short cycle crop varieties are normally used. There is scope to increase irrigated areas; however, this can only be achieved over the medium‐to‐long term due to high capital requirements. The main crops include maize, cassava, sweet potatoes, and groundnuts, supplemented with citrus fruits, sugarcane, and vegetables. Sweet potato is grown on the lowest land and along water courses where moisture is retained. The zone has large areas of pasture suitable for livestock rearing. As such, the majority of the population is highly dependent on livestock, especially cattle and goats, for income. The main sources of livelihoods are, therefore, livestock, rainfed cropping, and labor employment. All households consume own‐produced food most of the year and purchase some food from the market, particularly between November and January. The poor are more dependent on the market than the better‐off, who are able to produce greater quantities of food using hired labor. The better‐off group distinguishes itself with income from the sale
of cattle and formal and informal trade within and outside the zone; they also sell cash crops, such as sugarcane and citrus fruits. Though both the better‐off and the poor sell some food crops, the poor earn most of their income from the sale of labor, both locally and across the border to South Africa and Swaziland, as well as from the sale of natural products (firewood, charcoal, clay, stones). The strategic location of this zone close to Maputo city has enhanced access to markets and trade. The relatively well‐developed infrastructure (main roads and railway) helps to link local inhabitants to internal markets (Boane, Matola, Pessene, Moamba, and Panjane). However, most tertiary roads are in poor condition and become impassable during the rainy season. The main external market is Maputo with other lucrative border markets in South Africa and Swaziland, which provide
Food insecurity risk
Low risk food insecurity risk due to diversified livelihood options
2007 population (percent of national population)
226,645 (1.12%)
Main productive assets
Poor Better‐off
Small area cultivated Less cattle Goats Poultry Hand tools: hoe, panga, and axe
Large area cultivatedMore cattle Goats Poultry Hand tools: hoe, panga, and axe
Main foods consumed and sources
Poor Better‐off
Maize (OP, MP) Cassava (OP) Groundnuts (OP, MP) Cowpeas (OP, MP) Sweet potatoes (OP) Citrus fruits (OP) Vegetables (OP)
Maize (OP) Cassava (OP) Groundnuts (OP) Cowpeas (OP) Sweet potatoes (OP) Citrus fruits (OP) Vegetables (OP)
Main income sources
Poor Better‐off
Sale of agricultural labor Sale of migratory labor Sale of maize Sale of natural products (firewood, charcoal, clay and stones)
Sale of cattle Sale of maize Sale of game meat Formal and informal trade
Main markets
Boane, Matola, Pessene, Moamba, Magude,Panjane, and Maputo
Main hazards
Drought or dry spells January‐February
Floods December‐March
Main coping strategies for poor households
Shifting cultivation into higher ground Increased consumption of wild foods Intensify firewood, charcoal, clay, stone sales Increased in search of work in South Africa
63
MOZAMBIQUE Livelihood Zone Descriptions July 2014
Famine Early Warning Systems Network
significant migrant labor employment opportunities (farm and non‐farm activities). In this zone there is good cash circulation, and some wholesalers are present.
The most common hazards are drought or dry spells and floods, which all occur during rainy season. Common coping strategies among the poor include shifting cultivation to higher ground, increased consumption of wild foods, and increased sale of charcoal and firewood, together with increased search for agricultural labor employment.
Zone 26: Seasonal calendar
Zone 26: Food access calendar for poor households
Seasons
Rainy season
Dry season
Lean season
Crop production
Land preparation
Sowing/planting
Weeding
Harvesting
Wild foods 1 1 1 1 1 1 1 1 1 1 1 1 1 1 1 1 1 1 1 1
Livestock
Lambing/kidding/calving
Milking
Hazards
Livestock diseases 1 1 1 1 1 1 1 1 1 1 1 1 1 1 1 1 1 1 1 1
Crop pests, diseases 2 2 2 2
Legend p p Land preparation s s Planting w w Weeding h h Harvesting
DecJan Feb Mar Apr May Jun Jul Aug Sep Oct Nov
Staple foods
Maize
Sweet potatoes
Beans
Income
Maize 1 1 1 1 1 1 1 1 1 1
Cash remittances
Local brew 1 1 1 1 1 1 1 1 1 1 1 1 1 1 1 1 1 1 1 1 1 1 1 1
Charcoal
Expenditures
Health care 1 1 1 1 1 1 1 1
Education (school fees)
Legend p p Own production m m Purchases k k In kind c c Gathering
DecJan Feb Mar Apr May Jun Jul Aug Sep Oct Nov

64
MOZAMBIQUE Livelihood Zone Descriptions July 2014
Famine Early Warning Systems Network
BIBLIOGRAPHY AND REFERENCES Maria, Ricardo M. and Russell Yost. “A Survey of Soil Fertility Status of Four Agro‐ecological Zones in Mozambique”. Soil Science vol. 171, no. 11 (2006): 902‐914. Atlas for the Preparation for and Response to Disasters in the Zambezi River Basin. National Institute for Disaster Management (INGC), UEM Geography Department, and FEWS NET, 2011. Bangira, C. and A. Manyevere. “Baseline Report on the Soils of the Limpopo River Basin”. WaterNet Working Paper 8, July 2009. Special Report Crop and Food Security Assessment Mission to Mozambique. FAO and WFP, 12 August 2010. Mozambique Livestock Sector Brief. Livestock Information Sector Analysis and Policy Branch, FAO, March 2005. Food Economy Zones of Mozambique. Famine Early Warning Systems Network (FEWSNET), Ministry of Agriculture and Rural Development (MADER), National Directorate of Agriculture, 2002. Livelihood Baseline Profiles: Limpopo Basin, Mozambique. FEWS NET, May 2011. Livelihood Baselines Profiles: Zambezi Basin, Mozambique. FEWS NET, November 2010. Calane da Silva, Mário A., Tereza Alves, Jorge Tember, and Paulino Munisse. Mozambique: Country Report. International Technical Conference on Plant Genetic Resources, FAO, Leipzig 1996. Simler, Kenneth and Virgulino Nahate. “Poverty, Inequality, and Geographic Targeting: Evidence from Small‐Area Estimates in Mozambique”. International Food Policy Research Institute, Food Consumption and Nutrition Discussion Paper 192, June 2005. Walker, T., R. Pitoro, A. Tomo, I. Sitoe, C. Salência, R. Mahanzule, C. Donovan, and F. Mazuze. “Priority Setting for Public‐Sector Agricultural Research in Mozambique with the National Agricultural Survey Data”. Research Report No. 3E. Institute of Agricultural Research of Mozambique (IIAM), August 2006. “Promoting Integrated and Diversified Horticulture Production in Maputo Green Zones towards a Stable Food Security System”. FAO, July 2007. Mafalacusser, Jacinto. “The Status of Soil Resources in Mozambique”. Global Soil Partnership Launch Presentation, FAO, March 2013.

65
MOZAMBIQUE Livelihood Zone Descriptions July 2014
Famine Early Warning Systems Network
ADMINISTRATIVE AREAS AND DEMOGRAPHICS
Livelihood Zone 1 District Administrative Post 2007 Population Estimate Lakeshore Basic Staples and Fishing
Lago Cobue 17,289 Lago Metangula 44,301 Lichinga Meponda 11,742 Mandimba Mandimba P.A. 96,405 Mecanhelas Chiuta 75,410 Mecanhelas Insaca 135,231 Lago Maniamba 21,509
Estimated total 2007 population 401,887
Livelihood Zone 2 District Administrative Post 2007 Population Estimate Northern Highland Forest and Tourism
Montepuez Nairoto 8,582 Mueda Negomano 2,341 Sanga Macaloge 10,066 Marrupa Marangira 5,287 Mavago Mavago P.A. 15,788 Mavago M'sawize 4,453 Mecula Matondovela 746 Mecula Mecula P.A. 13,033 Sanga Matchedje 1,880
Estimated total 2007 population 62,176
Livelihood Zone 3 District Administrative Post 2007 Population Estimate Northwestern Tobacco and Maize
Lichinga Chimbonila 60,866 Majune Malanga 24,635 Muembe Chiconono 8,270 Muembe Muembe P.A. 20,375 Ngauma Itepela 8,544 Sanga Lussimbesse 29,278 Sanga Unango 14,941 Majune Muaquia 2,078 Majune Nairrubi 2,989 Mandimba Mitande 37,243 Marrupa Marrupa P.A. 42,615
Estimated total 2007 population 251,834

66
MOZAMBIQUE Livelihood Zone Descriptions July 2014
Famine Early Warning Systems Network
Livelihood zone 4 District Administrative Post 2007 Population Estimate Northern Cassava, Maize, and Forest zone
Ancuabe Ancuabe P.A. 40,989 Ancuabe Mesa 29,190 Ancuabe Metoro 37,059 Chiure Chiure P.A. 75,724 Chiure Chiure Velho 33,346 Chiure Katapua 19,411 Chiure Namogelia 24,883 Chiure Ocua 45,808 Meluco Meluco P.A. 14,479 Meluco Muaguide 10,158 Montepuez Mirate 38,777 Montepuez Namanhumbir 22,245 Meconta 7 de April 29,329 Meconta Corrane 52,394 Meconta Meconta P.A. 22,650 Meconta Namialo 50,470 Mogovolas Calipo 43,440 Monapo Monapo P.A. 132,265 Monapo Netia 111,021 Muecate Imala 37,884 Muecate Muculoene 10,273 Muecate Muecate P.A. 45,749 Nacaroa Nacaroa P.A. 53,320 Nacaroa Saua Saua 19,544 Namapa Erati Alua 88,218 Namapa Erati Namiroa 57,177 Nampula Rapale Anchilo 75,543 Nampula Rapale Namaita 52,464 Nampula Rapale Rapale 57,491
Estimated total 2007 population 1,331,301
Livelihood Zone 5 District Administrative Post 2007 Population Estimate Northern Highland with Mixed Cropping
Balama Balama P.A. 67,970 Balama Impiri 19,694 Balama Kuekue 21,748 Balama Mavala 14,688 Montepuez Mapupulo 47,859 Montepuez Montepuez P.A. 76,139 Namuno Hucula 12,294 Namuno Machoca 23,761 Namuno Meloco 26,367 Namuno Namuno P.A. 75,896 Namuno N'cumpe 30,024 Namuno Papai 11,066 Murrupula Chinga 13,584 Murrupula Murrupula P.A. 96,540 Murrupula Nihessiue 30,187 Lalaua Lalaua P.A. 55,971 Lalaua Meti 17,565 Malema Chihulo 14,433 Malema Malema P.A. 99,932 Malema Mutuali 50,533 Mecuburi Mecuburi P.A. 79,506 Mecuburi Milhana 15,179

67
MOZAMBIQUE Livelihood Zone Descriptions July 2014
Famine Early Warning Systems Network
Mecuburi Muite 30,653 Mecuburi Namina 30,286 Nampula Rapale Mutivasse 18,235 Ribaue Cunle 20,412 Ribaue Iapala 86,531 Ribaue Ribaue P.A. 79,307 Cuamba Cuamba P.A. 79,013 Cuamba Etarara 31,884 Cuamba Lurio 16,694 Marrupa Nungo 5,747 Maua Maiaca 13,355 Maua Maua P.A. 36,042 Metarica Metarica P.A. 18,924 Metarica Nacumua 10,515 Nipepe Muipite 9,617 Nipepe Nipepe P.A. 20,392 Alto Molocue Nauela 88,350 Alto Molocue Alto Molocue P.A. 184,132 Gurue Lioma 84,866 Gurue Mepuagiua 67,603 Lugela Muabanama 10,653 Namarroi Regone 36,946 Namarroi Namarroi 52,107 Gile Alto Ligonha 64,466 Ile Ile P.A. 163,676 Ile Mulevala (Namigonha) 74,665 Ile Socone 51,550 Lugela Lugela P.A. 43,496 Lugela Munhamade 62,264 Lugela Tacuane 19,072 Mocuba Mugeba 87,770 Namarroi Namarroi 52,107 Mocuba Namanjavira 44,122 Morrumbala Derre 72,662 Morrumbala Morrumbala P.A. 162,070 Mutarara Charre 35,272 Mutarara Inhangoma 63,627 Mutarara Nhamayabue 40,493
Estimated total 2007 population 2,970,512
Livelihood Zone 6 District Administrative Post 2007 Population Estimate Northeastern Highland Forest
Mocimboa da Praia Diaca 17,356 Mueda Chapa 10,459 Mueda Imbuo 17,488 Mueda Mueda P.A. 52,651 Mueda N'gapa 30,803 Muidumbe Miteda 20,649 Muidumbe Muidumbe P.A. 29,925 Nangade M'tamba 27,181 Nangade Nangade P.A. 35,553 Palma Pundanhar 3,349
Estimated total 2007 population 245,414
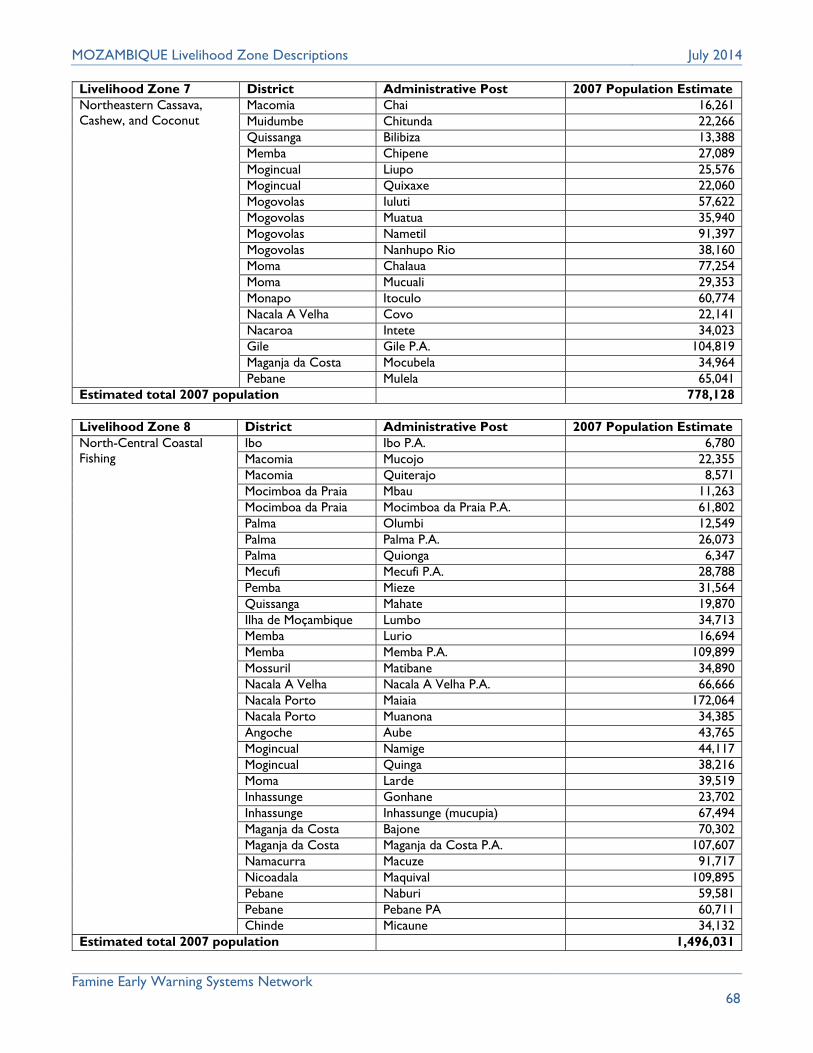
68
MOZAMBIQUE Livelihood Zone Descriptions July 2014
Famine Early Warning Systems Network
Livelihood Zone 7 District Administrative Post 2007 Population Estimate Northeastern Cassava, Cashew, and Coconut
Macomia Chai 16,261 Muidumbe Chitunda 22,266 Quissanga Bilibiza 13,388 Memba Chipene 27,089 Mogincual Liupo 25,576 Mogincual Quixaxe 22,060 Mogovolas Iuluti 57,622 Mogovolas Muatua 35,940 Mogovolas Nametil 91,397 Mogovolas Nanhupo Rio 38,160 Moma Chalaua 77,254 Moma Mucuali 29,353 Monapo Itoculo 60,774 Nacala A Velha Covo 22,141 Nacaroa Intete 34,023 Gile Gile P.A. 104,819 Maganja da Costa Mocubela 34,964 Pebane Mulela 65,041
Estimated total 2007 population 778,128
Livelihood Zone 8 District Administrative Post 2007 Population Estimate North-Central Coastal Fishing
Ibo Ibo P.A. 6,780 Macomia Mucojo 22,355 Macomia Quiterajo 8,571 Mocimboa da Praia Mbau 11,263 Mocimboa da Praia Mocimboa da Praia P.A. 61,802 Palma Olumbi 12,549 Palma Palma P.A. 26,073 Palma Quionga 6,347 Mecufi Mecufi P.A. 28,788 Pemba Mieze 31,564 Quissanga Mahate 19,870 Ilha de Moçambique Lumbo 34,713 Memba Lurio 16,694 Memba Memba P.A. 109,899 Mossuril Matibane 34,890 Nacala A Velha Nacala A Velha P.A. 66,666 Nacala Porto Maiaia 172,064 Nacala Porto Muanona 34,385 Angoche Aube 43,765 Mogincual Namige 44,117 Mogincual Quinga 38,216 Moma Larde 39,519 Inhassunge Gonhane 23,702 Inhassunge Inhassunge (mucupia) 67,494 Maganja da Costa Bajone 70,302 Maganja da Costa Maganja da Costa P.A. 107,607 Namacurra Macuze 91,717 Nicoadala Maquival 109,895 Pebane Naburi 59,581 Pebane Pebane PA 60,711 Chinde Micaune 34,132
Estimated total 2007 population 1,496,031
69
MOZAMBIQUE Livelihood Zone Descriptions July 2014
Famine Early Warning Systems Network

70
MOZAMBIQUE Livelihood Zone Descriptions July 2014
Famine Early Warning Systems Network
Livelihood Zone 9 District Administrative Post 2007 Population Estimate Plains with Cassava, Rice, and Fishing
Maganja da Costa Nante 64,008 Mopeia Campo 40,567 Nicoadala Nicoadala P.A. 121,955 Namacurra Namacurra P.A. 94,693
Estimated total 2007 population 321,223
Livelihood Zone 10 District Administrative Post 2007 Population Estimate Zambezi Valley with Maize and Fishing
Chinde Chinde P.A. 40,850 Chinde Luabo 44,916
Estimated total 2007 population 85,766
Livelihood Zone 11 District Administrative Post 2007 Population Estimate Northwestern Cropping and Cross-Border Trade
Lichinga Lione 22,364 Ngauma Massangulo 55,505 Milange Majaua 59,200 Milange Milange P.A. 256,963 Milange Molumbo 86,470 Milange Mongue 96,002 Morrumbala Chire 91,543 Morrumbala Megaza 32,638
Estimated total 2007 population 700,685
Livelihood Zone 12 District Administrative Post 2007 Population Estimate Coastal Sugarcane and Fishing
Caia Sena 36,568 Marromeu Chupanga 37,823 Marromeu Marromeu P.A. 75,596 Buzi Buzi P.A. 96,078 Dondo Mafambisse 53,067 Buzi Estaquinha 36,099 Buzi Nova Sofala 27,282 Nhamatanda Tica 68,505 Dondo Cidade de Dondo 70,817
Estimated total 2007 population 501,835
Livelihood Zone 13 District Administrative Post 2007 Population Estimate Tete Highland Mixed Cropping, Tobacco, and Cotton
Macanga Chidzolomondo 34,532 Macanga Furancungo 76,341 Angonia Domue 156,939 Angonia Ulongue 141,876 Tsangano Ntengo Wa Mbalame 113,882 Tsangano Tsangano 58,372 Chifunde Mualadze 68,960 Chifunde Nsadzu 19,601 Chiuta Kazula 21,230 Maravia Malowera 41,098 Moatize Zobue 107,160 Zumbo Muze 24,450 Zumbo Zambue 14,779
Estimated total 2007 population 879,220

71
MOZAMBIQUE Livelihood Zone Descriptions July 2014
Famine Early Warning Systems Network
Livelihood Zone 14 District Administrative Post 2007 Population Estimate Cahora Bassa Dam Sesame and Cotton
Magoe Chinthopo 24,860 Zumbo Zumbu P.A. 17,121 Cahora Bassa Songo 36,523 Chiuta Manje 54,180 Chifunde Chinfunde P.A 11,682 Maravia Chipera 10,554 Maravia Fingoe 21,443
Estimated total 2007 population 176,363
Livelihood Zone 15 District Administrative Post 2007 Population Estimate Central Semiarid Cotton and Minerals
Tambara Nhacolo 24,345 Guro Mandie 17,112 Guro Mungari 14,436 Guro Nhamassonge 8,452 Tambara Buzua 9,734 Tambara Nhacafula 7,696 Guro Guro P.A. 28,347 Chemba Chemba P.A. 21,051 Chemba Chiramba 17,820 Changara Kachembe (marara) 64,019 Moatize Kambulatsisi 29,298 Moatize Moatize P.A. 78,634 Mutarara Doa 67,618 Cahora Bassa Chintholo 3,480 Changara Chipembere (chioco) 61,277 Changara Luenha 31,249 Magoe Mukumbura 30,470
Estimated total 2007 population 515,038
Livelihood Zone 16 District Administrative Post 2007 Population Estimate Manica Highland Mixed Cropping, Cotton, and Tobacco
Barue Choa 11,984 Barue Nhampassa 33,006 Barue Catandica 92,362 Manica Machipanda 42,606 Manica Mavonde 25,592 Manica Messica 50,528 Manica Vanduzi 26,607 Mossurize Chiurairue 77,975 Mossurize Dacata 92,376 Mossurize Espungabera 24,211 Sussundenga Dombe 49,404 Sussundenga Rotanda 10,833 Sussundenga Muoha 17,936 Sussundenga Sussundenga P.A. 50,693
Estimated total 2007 population 606,113

72
MOZAMBIQUE Livelihood Zone Descriptions July 2014
Famine Early Warning Systems Network
Livelihood Zone 17 District Administrative Post 2007 Population Estimate Central Manica and Sofala Mixed Cropping
Macossa Macossa P.A. 10,953 Macossa Nguawala 2,250 Macossa Nhamagua 13,984 Gondola Cafumpe 36,915 Gondola Amatongas 40,599 Gondola Inchope 36,387 Gondola Macate 55,194 Gondola Matsinho 36,981 Gondola Zembe 18,595 Caia Caia P.A. 54,926 Caia Murraça 24,118 Chemba Mulima 25,110 Gorongosa Gorongosa P.A. 59,585 Gorongosa Nhamadze 30,937 Gorongosa Vanduzi 26,607 Maringue Canxixe 20,656 Maringue Maringue P.A. 39,984 Maringue Subwe 14,495 Nhamatanda Nhamatanda P.A. 139,482
Estimated total 2007 population 687,758
Livelihood Zone 18 District Administrative Post 2007 Population Estimate Cheringoma and Muanza Maize and Cassava
Cheringoma Inhamitanga 6,800 Cheringoma Inhaminga 27,293 Muanza Muanza P.A. 4,257 Muanza Galinha 20,968
Estimated total 2007 population 59,318
Livelihood Zone 19 District Administrative Post 2007 Population Estimate Central Semiarid Pineapple and Cashew
Machaze Chitobe (Machaze) 74,645 Machaze Save 15,860 Chibabava Chibabava P.A. 11,806 Chibabava Goonda 25,562 Chibabava Muxungue 64,638 Machanga Divinhe 14,585 Machanga Machanga P.A. 27,517
Estimated total 2007 population 234,613
Livelihood Zone 20 District Administrative Post 2007 Population Estimate Southern Coastal Cassava, Coconut, and Fishing
Inhassoro Bazaruto 2,593 Jangamo Cumbana 53,317 Jangamo Jangamo P.A. 40,085 Govuro Nova Mambone 18,634 Morrumbene Morrumbene P.A. 62,633 Massinga Massinga PA 149,835 Vilanculo Vilankulo P.A. 70,324 Zavala Quissico 77,696
Estimated total 2007 population 475,117

73
MOZAMBIQUE Livelihood Zone Descriptions July 2014
Famine Early Warning Systems Network
Livelihood Zone 21 District Administrative Post 2007 Population Estimate Southern Intermediate Mixed Cropping
Govuro Save 15,860 Inhassoro Inhassoro P. A. 45,597 Vilankulo Mapinhane 65,489 Massinga Chicomo 36,457 Morrumbene Mucodoene 61,803
Estimated total 2007 population 225,206
Livelihood Zone 22 District Administrative Post 2007 Population Estimate Southern Semiarid Cereals and Cattle
Massangena Massangena P.A. 9,404 Massangena Mavue 6,376 Chicualacuala Vila Eduardo Mondlane 16,189 Chicualacuala Mapai 17,616 Chigubo Chigubo P.A. 9,214 Chigubo Dindiza 11,511 Mabalane Combomune 9,641 Massingir Mavodze 8,366 Mabote Zinave 14,852 Mabote Mabote P.A. 22,587 Mabote Zimane 7,294 Panda Panda P.A. 33,851 Panda Urrene 8,629 Panda Mawayela 5,319 Homoine Pembe 19,082 Funhalouro Funhalouro P.A. 26,121 Funhalouro Tome 11,735
Estimated total 2007 population 237,787
Livelihood Zone 23 District Administrative Post 2007 Population Estimate Southeastern Rice Zavala Zandamela 61,449
Inharrime Mocumbi 25,876 Homoine Pembe 19,082
Estimated total 2007 population 106,407
Livelihood Zone 24 District Administrative Post 2007 Population Estimate Limpopo and Elephant Rivers Mixed Cropping
Chibuto Alto Changane 19,317 Chibuto Chaimite 31,846 Chibuto Godide 17,720 Chibuto Malehice 55,808 Mandlacaze Macuacua 14,358 Mabalane Ntlavene 8,891 Massingir Massingir P.A. 11,155 Massingir Zulo 9,180 Chokwe Macarretane 29,777 Chokwe Xilembene 58,492 Chokwe Lionde 42,200 Guija Canicado 5,689 Guija Chivongoene 28,492 Guija Mubangoene 30,066
Estimated total 2007 population 362,991

74
MOZAMBIQUE Livelihood Zone Descriptions July 2014
Famine Early Warning Systems Network
Livelihood Zone 25 District Administrative Post 2007 Population Estimate Southern Coastal Fishing, Cassava, and Maize
Bilene Macia 38,877 Bilene Makluane 7,956 Bilene Praia de Bilene 7,951 Bilene Chissano 52,376 Bilene Mazivila 22,917 Bilene Messano 21,471 Chibuto Malehice 55,808 Xai-Xai Chicumbane 80,181 Xai-Xai Chongoene 101,975 Xai-Xai Zongoene 27,278 Mandlakaze Chidenguele 55,028 Mandlakaze Nguzene 18,106 Mandlakaze Chibonzane 26,457 Mandlakaze Mandlakaze P.A. 26,122 Mandlakaze Mazucane 13,060 Mandlakaze Xhalala 11,940 Manhiça Xinavane 24,769 Manhiça Calanga 9,524 Manhiça Ilha Josina Machel 9,346 Manhiça Maluana 17,630 Manhiça Manhica P.A. 56,165 Manhiça Palmeira (3 de February) 40,208 Marracuene Machubo 4,723 Marracuene Marracuene P.A. 80,252 Matutuine Bela Vista 15,015 Matutuine Mugazine (catembe) 5,577 Matutuine Ndelane (machamgulo) 3,298 Matutuine Zitundo 6,191 Boane Matola Rio 34,810
Estimated total 2007 population 875,011
Livelihood zone 26 District Administrative Post 2007 Population Estimate Southern Highland Cattle and Mixed Cropping
Boane Boane P.A. 67,745 Magude Mahele 2,294 Magude Motaze 7,824 Magude Magude P.A. 37,153 Magude Panjane 4,124 Magude Mapulanguene 1,834 Moamba Ressano Garcia 8,997 Moamba Moamba P.A. 16,862 Moamba Pessene 14,659 Moamba Sabie 16,041 Matutuine Catuane 7,158 Namaacha Changalane 13,538 Namaacha Namaacha P.A. 28,416
Estimated total 2007 population 226,645
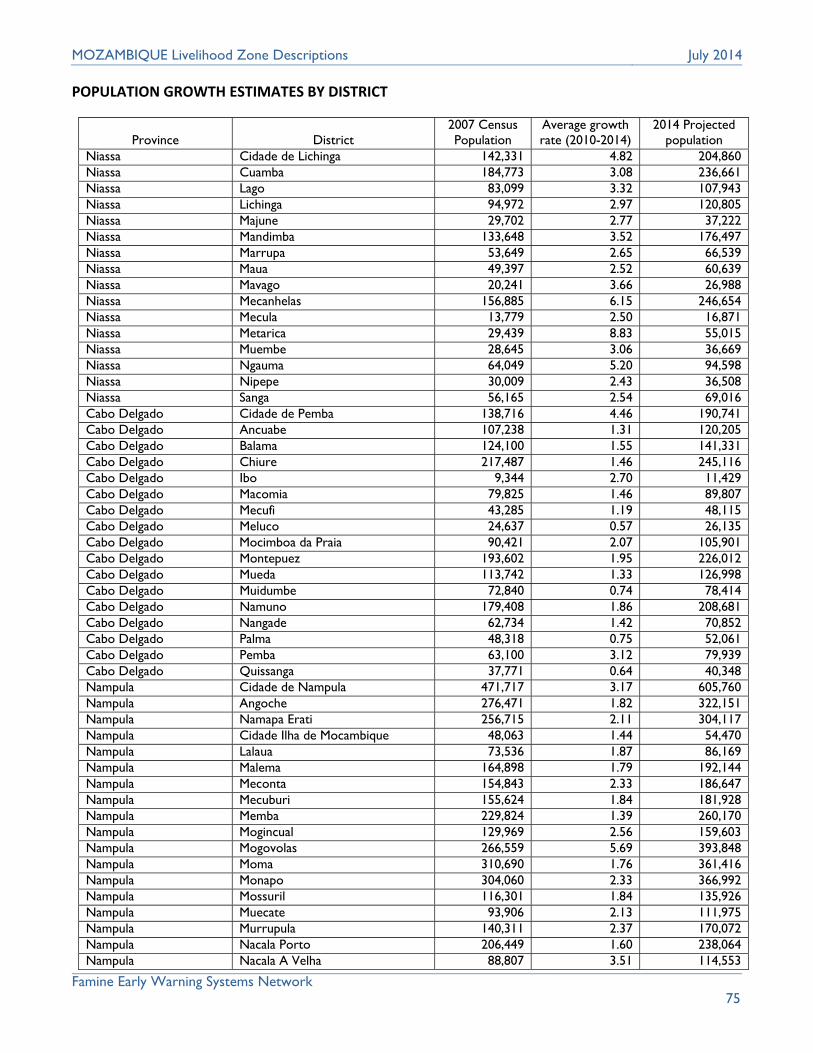
75
MOZAMBIQUE Livelihood Zone Descriptions July 2014
Famine Early Warning Systems Network
POPULATION GROWTH ESTIMATES BY DISTRICT
Province District 2007 Census Population
Average growth rate (2010-2014)
2014 Projected population
Niassa Cidade de Lichinga 142,331 4.82 204,860 Niassa Cuamba 184,773 3.08 236,661 Niassa Lago 83,099 3.32 107,943 Niassa Lichinga 94,972 2.97 120,805 Niassa Majune 29,702 2.77 37,222 Niassa Mandimba 133,648 3.52 176,497 Niassa Marrupa 53,649 2.65 66,539 Niassa Maua 49,397 2.52 60,639 Niassa Mavago 20,241 3.66 26,988 Niassa Mecanhelas 156,885 6.15 246,654 Niassa Mecula 13,779 2.50 16,871 Niassa Metarica 29,439 8.83 55,015 Niassa Muembe 28,645 3.06 36,669 Niassa Ngauma 64,049 5.20 94,598 Niassa Nipepe 30,009 2.43 36,508 Niassa Sanga 56,165 2.54 69,016 Cabo Delgado Cidade de Pemba 138,716 4.46 190,741 Cabo Delgado Ancuabe 107,238 1.31 120,205 Cabo Delgado Balama 124,100 1.55 141,331 Cabo Delgado Chiure 217,487 1.46 245,116 Cabo Delgado Ibo 9,344 2.70 11,429 Cabo Delgado Macomia 79,825 1.46 89,807 Cabo Delgado Mecufi 43,285 1.19 48,115 Cabo Delgado Meluco 24,637 0.57 26,135 Cabo Delgado Mocimboa da Praia 90,421 2.07 105,901 Cabo Delgado Montepuez 193,602 1.95 226,012 Cabo Delgado Mueda 113,742 1.33 126,998 Cabo Delgado Muidumbe 72,840 0.74 78,414 Cabo Delgado Namuno 179,408 1.86 208,681 Cabo Delgado Nangade 62,734 1.42 70,852 Cabo Delgado Palma 48,318 0.75 52,061 Cabo Delgado Pemba 63,100 3.12 79,939 Cabo Delgado Quissanga 37,771 0.64 40,348 Nampula Cidade de Nampula 471,717 3.17 605,760 Nampula Angoche 276,471 1.82 322,151 Nampula Namapa Erati 256,715 2.11 304,117 Nampula Cidade Ilha de Mocambique 48,063 1.44 54,470 Nampula Lalaua 73,536 1.87 86,169 Nampula Malema 164,898 1.79 192,144 Nampula Meconta 154,843 2.33 186,647 Nampula Mecuburi 155,624 1.84 181,928 Nampula Memba 229,824 1.39 260,170 Nampula Mogincual 129,969 2.56 159,603 Nampula Mogovolas 266,559 5.69 393,848 Nampula Moma 310,690 1.76 361,416 Nampula Monapo 304,060 2.33 366,992 Nampula Mossuril 116,301 1.84 135,926 Nampula Muecate 93,906 2.13 111,975 Nampula Murrupula 140,311 2.37 170,072 Nampula Nacala Porto 206,449 1.60 238,064 Nampula Nacala A Velha 88,807 3.51 114,553

76
MOZAMBIQUE Livelihood Zone Descriptions July 2014
Famine Early Warning Systems Network
Nampula Nacaroa 106,887 1.69 123,670 Nampula Nampula Rapale 203,733 3.83 272,366 Nampula Ribaue 186,250 3.72 245,798 Zambezia Cidade de Quelimane 193,343 2.62 235,910 Zambezia Alto Molocue 272,482 4.01 360,604 Zambezia Chinde 119,898 1.47 133,502 Zambezia Gile 169,285 1.85 195,349 Zambezia Gurue 297,935 3.72 390,419 Zambezia Ile 289,891 1.55 327,558 Zambezia Inhassunge 91,196 1.21 100,088 Zambezia Lugela 135,485 1.46 152,059 Zambezia Maganja da Costa 276,881 1.47 310,471 Zambezia Milange 498,635 3.06 624,013 Zambezia Mocuba 300,628 3.01 375,934 Zambezia Mopeia 115,291 3.79 151,570 Zambezia Morrumbala 358,913 2.99 446,976 Zambezia Namacurra 186,410 4.93 255,783 Zambezia Namarroi 89,053 1.91 145,798 Zambezia Nicoadala 231,850 1.28 256,362 Zambezia Pebane 185,333 2.28 220,040 Tete Cidade de Tete 155,870 3.83 205,630 Tete Angonia 298,815 2.91 369,612 Tete Cahora Bassa 86,641 4.51 119,253 Tete Changara 156,545 2.95 194,464 Tete Chifunde 100,243 6.16 154,951 Tete Chiuta 76,458 3.10 95,054 Tete Macanga 110,873 7.61 188,368 Tete Magoe 68,852 4.47 95,226 Tete Maravia 82,874 3.30 105,974 Tete Moatize 215,092 5.95 327,437 Tete Mutarara 207,010 3.46 267,528 Tete Tsangano 55,510 3.46 218,981 Tete Zumbu 56,350 4.11 76,103 Manica Cidade de Chimoio 237,497 3.34 304,871 Manica Barue 137,352 6.15 212,163 Manica Gondola 258,548 3.26 330,473 Manica Guro 68,347 3.69 90,097 Manica Machaze 102,839 3.17 130,582 Manica Macossa 27,187 6.43 42,930 Manica Manica 219,346 3.18 273,671 Manica Mossurize 194,562 4.31 267,338 Manica Sussundenga 128,866 2.92 161,341 Manica Tambara 41,775 3.13 52,834 Sofala Cidade da Beira 431,583 0.45 459,430 Sofala Buzi 159,459 1.99 187,086 Sofala Caia 115,612 2.75 143,326 Sofala Chemba 63,981 2.26 76,755 Sofala Cheringoma 34,093 7.69 57,637 Sofala Chibabava 102,006 2.95 128,358 Sofala Dondo 141,003 2.27 169,180 Sofala Gorongosa 117,129 3.58 153,861 Sofala Machanga 51,912 2.12 61,474 Sofala Maringue 75,135 2.37 90,871 Sofala Marromeu 117,795 4.30 163,146 Sofala Muanza 25,225 4.53 35,277

77
MOZAMBIQUE Livelihood Zone Descriptions July 2014
Famine Early Warning Systems Network
Sofala Nhamatanda 207,987 3.56 272,907 Inhambane Cidade de Inhambane 65,149 2.00 76,910 Inhambane Funhalouro 37,856 2.57 46,537 Inhambane Govuro 34,494 2.03 40,883 Inhambane Homoine 107,735 1.80 125,701 Inhambane Inharrime 97,950 2.88 122,907 Inhambane Inhassoro 48,190 2.57 58,767 Inhambane Jangamo 93,402 1.73 108,493 Inhambane Mabote 44,733 1.55 51,338 Inhambane Massinga 186,292 0.78 202,201 Inhambane Cidade de Maxixe 108,824 1.65 125,208 Inhambane Morrumbene 124,436 1.83 145,297 Inhambane Panda 47,799 0.82 52,094 Inhambane Vilankulo 135,813 2.05 161,262 Inhambane Zavala 139,145 1.39 157,719 Gaza Cidade de Xai Xai 115,752 1.27 127,351 Gaza Bilene 151,548 1.44 168,228 Gaza Chibuto 191,682 1.46 213,323 Gaza Chicualacuala 38,917 1.73 44,060 Gaza Chigubo 20,725 4.42 28,141 Gaza Chokwe 183,531 1.39 202,490 Gaza Guija 75,306 2.74 91,392 Gaza Mabalane 32,067 2.32 37,829 Gaza Mandlakaze 165,071 1.17 179,847 Gaza Massangena 15,780 1.75 17,906 Gaza Massingir 28,701 2.54 34,355 Gaza Xai Xai 209,434 2.32 247,152 Maputo Cidade da Matola 671,556 26.24 892,963 Maputo Boane 102,555 4.95 147,112 Maputo Magude 53,229 1.67 61,068 Maputo Manhica 157,642 6.62 245,829 Maputo Marracuene 84,975 6.35 133,922 Maputo Matutuine 37,239 0.99 40,701 Maputo Moamba 56,559 2.13 66,860 Maputo Namaacha 41,954 2.29 50,176 Cidade de Maputo Distrito Urbano 1 108,096 0.22 111,152 Cidade de Maputo Distrito Urbano 2 154,272 0.26 159,569 Cidade de Maputo Distrito Urbano 3 223,628 0.26 232,248 Cidade de Maputo Distrito Urbano 4 293,270 1.91 341,545 Cidade de Maputo Distrito Urbano 5 290,775 2.55 353,922 Cidade de Maputo Distrito de Catembe 19,371 1.45 21,858 Cidade de Maputo Distrito de Inhaca 5,216 0.66 5,574

78
MOZAMBIQUE Livelihood Zone Descriptions July 2014
Famine Early Warning Systems Network
LIST OF PARTICIPANTS
Participants Southern and South Central Regional Livelihood Zoning Plus Workshop – Maputo
No. Name Function or Post Institution
1. Manuel Sahale DPA Inhambane Province
2. Joaquim Constantine SDAE Govuro District
3. Gomes Raul Mafastela SDAE Vilanculos District
4. Gonçalo Tanda Bata SDAE Homoine District
5. Pedro Monteiro DPA Inhambane Province
6. Leonardo Protásio DPA Tete Province
7. Firmino Manico UPCT Tete Province/ ONG
8. Jerónimo Constantino Alaue SDAE Tsangano Province
9. Jorge Baptista Alguineiro SDAE Chifunde Province
10. Leonel Paulo Majimeja SDAE Zumbo Province
11. Marica Tomás SETSAN Maputo Province
12. Amiel Manuel Nito João SDAE Zavala District
13. Luís Osório Coimbra Magariro Chimoio/ONG
14. Rovai José Jamisse SDAE Bilene District
15. Orária Domingos Maurício SETSAN Manica Province
16. João Calisto Spiro DPA Sofala Province
17. Domingos Buramo Gimo UPCT Sofala Province
18. Ibrahimo Nuromamade Mahumude SDAE Manjacaze Province
19. José Gaspar SETSAN Central Province
20. Masozi Kachale Technical Advisor SADC/RVAA
21. Wellington Kafakalawa Technical Advisor SADC/RVAA
22. Domingos Guambe SDAE Matutuine Province
23. Velasco Mahanjane INGC
24. Raul Diogo Cumba Programme Officer WFP
26. Arlete José Macuacua SDAE Namaacha Province
27. Domingos Guambe SDAE Matutuine District
No. Name Function or Post Institution
28. Vernito Jeremias Gonga INGC Manica Province
29. Marcela Ricupero PNUD Central Government‐ Maputo
30. Leonildo Chamusse Banze INGC Central Government ‐ Maputo
31. Alina Lopes Programme Officer UNDP
32. Lourenço P. Manhiça SDAE Manhica District
33. Anatércia Dinis DPA Gaza Province
34. Eduardo Tembe SDAE Magude Province
35. Olanda Bata NTM FEWS NET‐Mozambique
36. James Acidri Consultant Evidence for Development/FEWSNET
37. Fabio Suazi Translator Independent Consulting Firm
38. Anabela Samuel Administrative Assistant FEWS NET‐Mozambique

79
MOZAMBIQUE Livelihood Zone Descriptions July 2014
Famine Early Warning Systems Network
Participants Northern and North Central Regional Livelihood Zoning Plus Workshop‐ Nampula
No. Name Function or Post Institution
1. Feliciano Puleque SDAE Mavago District
2. Rodolfo Francisco E.Kazula SDAE Maua District
3. Luis Gonzaga M. Roia SDAE Muembe District
4. Virgilio Lucas Manjate SDAE Lago District
5. Jaulane Paulo Bendzane SPA/DPA Niassa Province
6. Essiaca Nuro Rehane INGC Niassa Province
7. Salimo Amini UCA Niassa Province
8. Laura Antonio SDAE Balama Province
9. Celestino B. João Bandeira SDAE Mueda Province
10. Ovídio Domingos Nota SDAE Moc. Praia District
11. Marinho Latibo SDAE Meluco District
12. Catija Saria Paulo SETSAN CD
13. Ali Magido CD Helvetas District
14. Antonio Mavie Deputy NTM FEWS NET‐Mozambique
15. Evaristo Cumbane Translator Independent Consulting Firm
No. Name Function or Post Institution
16. Hiten Jantilal MINAG/DNSA
17. Danila Cumbane SETSAN Central Government‐ Maputo
18. Matias Balate Administrative Officer FEWS NET‐Mozambique
19. Daison Ngirazi Regional Livelihood Specialist
FEWSNET‐ Southern Africa Region
20. Clementino Mariano DPA Zambezia Province
21. Eugenia Raposo Programme Officer World Vision – Zambezi Province
22. Paulo Cordeiro Programme Officer SETSAN Zambezia
23. Jacinto Namvara SDAE Erati District
24. Alfredo Nampuio SDAE Mogovolas District
25. Momade Adamugi Omar Mucusse SDAE Ribaue District
26. Gastão Compta da Silva SDAE Meconta District
27. Luis Sapula Papusseco ODES Olipa District
28. Helder Carlos Vieira Diva Programme Officer SETSAN – Nampula Province
29. Maria Angelina Joaquim Da Costa INGC Nampula Province
30. Alson Banze DPA ‐ CD


