MOZAMBIQUE - African Fertilizer and Agribusiness ...
42
MOZAMBIQUE
Transcript of MOZAMBIQUE - African Fertilizer and Agribusiness ...

MOZAMBIQUE

Country Overview

Political Economic• Suspension of multilateral aid in 2016 follow
“hidden Debt” exposure ($2 Bill).• High external debt declined from 103.7% of GDP at
end-2016 to an estimated 85.2% by end-2017.• GDP growth decelerated to 3.7% in 2017, down
from 3.8% in 2016 and well below the 7% GDP growth achieved on average between 2011 and 2015
• Stabilized currency• Large mineral (coal and aluminium deposits being
developed. Nacala Moatize rail line completed and port upgrade completed-18 mt/yr capacity
• Macusa/Moatize rail line and port approved for commencement 2019
• 180 tcf of proven gas reserves with private partnerships. No likely development before 2023.
• ENI floating LNG plant-FID 2017- 3.4 Mtacapacity-completion 2013
• Yara 1.3 Mt/a fertilizer plant-still under feasibility
• Shell-GTL plant 38 Mb/d-under feasibility• GLA-250 MW power plant –under
feasibility
Social Environment Legal
• A relatively young country emerging from civil war in 1992
• Fragile peace between two major political partners—Frelimo and Renamo. Expected peace accord recently agreed.
• Elections in 2019.
• High level of corruption and low transparency.
• No owner ship of land that can be mortgaged.
• Difficulties in getting land allocations for projects
• Poor law enforcement—resolution of killings
• Deforestation from charcoal, firewood and commercial (legal and illegal) logging have seen the loss of 3 Mill ha since 2000
• Removal of mangroves in the delta areas
• Illegal wild life destruction and increasing human wildlife confrontation’
• Poor sewerage treatment in major urban areas
• Land degradation from continual cropping without nutrient replacement
Deforestation Mozambique L to R 2000, 2012, predicted 2019
Source: natural Capital project –Stanford University 2016
• Economic growth has been heavily concentrated in large, capital-intensive ‘mega-projects’ which have brought relatively few jobs and little poverty reduction.
• Only 10% of the population is formally employed.
• Mozambique remains one of the poorest countries in the world: 54.7% of the populations live in poverty. Female-headed households are worse off.
• Close to 50% of these households are in the poorest third of the population.
• 45% of the adult population is illiterate
Key takeaways• The withdrawal of IMF and donor support (20% of budget) in 2016 has caused significant pain on in
infrastructure, social and agricultural development programs. Likely to continue until 2023 when monetization of gas resource is expected.
• Poor infrastructure following civil war (end in 1992)• High poverty levels, particularly among SHF who produce 97% of produce. high illiteracy rates, high
Mozambique Pestel Analysis
Technical
Low use of technology in the agricultural sector—very low use of improved seed, any fertilizers, CPP’s and tractors

Importance of Agriculture in Mozambique• 73% of the population of 28.8 mill
reliant on agriculture. • Contributes 23% of GDP
Mozambique Agricultural Metrics• 48.6 Mill Ha of Agricultural land• 7.18 Mill ha of Arable (cultivated)
land
Farmer Demographics• 32.2 Mill SHF produce 95% of the produce (400 commercial growers). • Average farm size 1.2 Ha. • Low inputs, shifting cultivation. 1/3 of SHF sell outputs, 2/3 lack food
security.• Maize and cassava are the main food crops Grown by 80% of farmers
and contributing to 90% of the food crop production• Low population density. (4.9 persons/Ha of Arable land)• Estimated less than 10% of arable land is farmed.
Factors Impacting on Yield, Improvement and Profit Maximization.• Poor markets, poor infrastructure• Only 15% of SHF have access to or are
using improved production technologies such as seeds, fertilizers, CPP’s and management technologies.
• Shallow markets away from major towns• Land tenure issues in Mozambique—limit
borrowing
Fertilizer trials in East Africa showing the impact of No Fertilizer, Recommended Fertilizers and Balanced Fertilizers
Source:IFDC
Key Takeaways• High percentage of subsistence level farmers(+60%)—growing food for sustenance• Poor infrastructure for Agricultural development• Shallow markets• Low access and availability to productivity improving technologies• Significant land available for cultivation
Barriers to Agricultural development• Low access to credit• Low farm productivity• Lack of market –oriented
production.• Lack of infrastructure to
encourage market access. Roads are a high priority.
Mozambique- Agricultural Metrics
1980 2017 1980 2017
Burundi 1.2 4.1 10.9 164% 3.4 9.1 164% 32559 27.1
Ethiopia 15.1 35.2 105.0 198% 2.3 6.9 198% 820135 54.2
Mozambique 7.2 12.1 29.7 145% 1.7 4.1 145% 81600 11.4
Kenya 5.8 16.3 49.7 205% 2.8 8.6 205% 598045 103.1
Tanzania 15.2 18.7 57.3 207% 1.2 3.8 207% 267073 17.5
Malawi 3.8 6.2 18.6 198% 1.7 5.0 198% 295200 78.7
Zambia 3.8 5.8 17.1 192% 1.5 4.5 192% 450000 118.4
Zimbabwe 4.1 7.3 16.5 126% 1.8 4.0 126% 300000 73.2
Rwanda 1.2 5.1 12.8 149% 4.2 10.5 149% 59244 48.6
Uganda 6.9 12.6 42.8 241% 1.8 6.2 241% 58740 8.5
EAST AFRICAN COUNTRY METRICS (Population density by Arable land by Fertilizer use) 2018
Source: Country meters,FAO, World Bank, Index Mundi, AFO Fertilizer Technical Working Group, 2018, AFAP/IFDC Situation Statement 2017,
Fertilizer use/
Ha arable land
(Kg/Ha)Country
Arable
land
(MHa)
Population
(Millions)
Population Density
per Ha arable land
% increase in
Population
per Ha
Fertilizer
use (MT)
2016
% Change in
Population
(1980- 2017)

Source:-Mozambique Growth Corridors ARUP 2016
The National Development Strategy proposes to build trade corridors across Mozambique, with Public Private infrastructure Programs initiated to access the mineral wealth of Mozambique. The Growth Corridors aim to provide necessary services to the SHF to allow profitable growth and market development.
• The Maputo Corridor. Connecting Gauteng (SA) to Maputo. (Stage 5)
• The Beira Corridor. Connecting Beira to Zimbabwe, Zambia and Malawi. (Stage 5)
• The Zambezi Corridor (undeveloped). 600 km rail line to start construction in 2019 connecting Moatize/Chitima with a new deep water port to be build at Macuse. Chinese funded. To be run by Italian /Thai/ Mozambique consortium. Operational 2021.
• Nacala Corridor (Stage 1). Operational 2017. Rail only.
Mozambique Corridor Growth Strategy

• Key Characteristics of the Mozambique fertilizer market • Agricultural development has been centered around a concession concept, where agricultural industries are incentivised to establish nuclear
farms, processing plants and foster the development of out growers to supply the processing plants. These lever off Private Sector investment, and private sector extension to build capacity within the footprint area. Tobacco, sugar and cotton industries in Mozambique are based on this concept.
• The Govt signed a tri-partied agreement with the Governments of Japan and Brazil in 2011 to develop large tracts of the underutilized savanna land in the norther part of Mozambique. The concept is to build on the concession model encouraging private sector contribute toinfrastructure and capacity which would enable to sustainable cropping sectors to emerge. It was to follow the path of the Brazilian Ceradodevelopment levering private capital and development partner capital to build infrastructure. Large commercial land allocations to agricultural projects, such as Pro-Savanah and others, have come under considerable scrutiny from small holder farmers and civil society from claims of land grabbing—impacting some of these programs.
• Budget support withdrawal by bi lateral partners has impacted on the progress of agricultural projects outlined in PEDSA deferred, including the development of cooperative farm centers, to supply inputs (private sector) and aggregate outputs and store.
• Low fertilizer capacity in the public sector.• Many of the markets and potential markets are large distances from population centers leading to lack of profitability leading to lack of use of
productivity enhancing methods.• Fertilizer use by individual farmers in Mozambique is less than 3kt-the cause is multi factorial with many of the drivers common to the SSA
market:- shallow markets, low purchasing power of farmers, low capacity, poor support services, low availability of inputs, poor infrastructure, low productivity, large land availability etc.
• The Norwegian Embassy has funded a project- PROMAC2, in the Beira corridor to build 22 hub dealers and 400 community based service providers. The Beira corridor along with the Maputo corridor are the most developed but still are not mature. The project will provide customized fertilizers, farmer training and output market linkages
• The Maputo corridor is exposed to competition for the supply of fresh fruit and vegetables from South Africa
Mozambique Fertilizer Market Overview

Fertilizer type Fertilizer products (tons)
Tobacco blends 33,000
Sugar blends 15,000
urea 12,000
CAN 6,000
NPK 1,500
Total 67,500
Mozambique Fertilizer market—Product use by Crop and Fertilizer Products
• The starch staples maize, cassava and rice are grown on the most land but at very low levels of productivity. Low levels of Inputs such as fertilizer, seed and CPP’s are used. Profitability of these crops is constrained by factors of isolation from markets (distance to populated areas, poor infrastructure and technology support-Extension, weather impacts and credit availability)
• 96% of fertilizers are used in Tobacco, Sugar and Soya bean. The 50,000 SHF supplying to Tobacco concessions receive an allocation of maize fertilizer under the terms of the concession.
• Only an estimated 3000 ton of fertilizer are sold in Mozambique outside the concessions.
Tobacco and sugar concessions determine their own formulations, based on soil types and crop requirements. They place annual tenders for supply
Major Crops produced in Mozambique and Fertilizer Use
CropArea (Ha *1000)
Tons Produced (*1000)
Fertilizer tons used
Maize 1,600 1,500 1000
Cassava 1,000 9,100 0Rice 190 115 1000
Dry Beans 114 73 0Cashews 123 104 0
Tobacco 80 93 40,000Sugar Cane 42.3 2,700 24,000Soyabean 2.5 2,500 500
Other 1000Total 67500
Source: FAO data 2017, *AFAP/IFDC –personal coms
Mozambique-Fertilizer use by Crop Sector

Maize
Rice
Maize Yield has not improved in 30 years. This is associated with lack of new technologies including fertilizers, seed and management practice.Maize production closely follows area planted. Area Planted has increased 50-100% over the last 20 years.
Rice yields have remained static over the last 30 years. Rice production has fluctuated wildly –most likely due to the impact on climatic events (floods) in rice growing regions
Key Takeaways• Low Productivity (kg/ha) is not sustainable from both a resource management and farmer profitability perspective.• Mozambique agriculture is subject to the impact of severe climate events
Mozambique:-Maize and Rice Production Metrics

Opportunities in Agricultural Development
Mozambique's ability to realize its agricultural potential, lies in improving the profitability and productivity of the smallholder farmers. Infrastructure development is an important long term requirement, and the governments strategy to develop corridors on the back of development of the resource industry would seem an important step. • Mozambique is exposed to the impacts of climate change and weather variability. The Limpopo and Zambezi rivers
experiencing severe impact from flooding in the last 5 years.
• Research undertaken by IFDC in recent years has shown the ability to increase yields 200% on maize with recommended fertilizer applications and 300% with “balanced “ fertilizers. There are 3 blending plants in Mozambique and knowledge within the private sector to support the development of fertilizer inputs, but these have been slow because of the poor demand and the difficulties with logistics both in and out of markets.
• The rice potential of the Zambezi area is an attractive sector, given the 200, 000 Ha of land available, the reinvestment in the milling sector and the proposed Macusa port and rail development. Logistics to markets will still remain an key determinant of success and the fact that productivity levels are very low.
• Private sector interest in the higher value crops such as Cashews (low fertilizer use) and tea will help while the corridors are being developed Source:IFDC

2kt
International Market67.5kt
Estates/Concessions• Tobacco 40kt• Sugar 24kt• Soya 500t• Banana closed• Forestry closed• Cotton closed
Total 64.5 kt
ImportersETG, Yara, Omnia, Meridian,
Afriventures, Others
48.6 Mill Ha of Arable land, 5.6 Mill ha cultivated, 97% (3.8 Mill ha) by 3.2 Mill SHF. 400 Commercial farmers cultivate 200k ha.
Key Takeaways• Mozambique is a gateway to Zambia, Zimbabwe and Malawi with 650kt transiting through the country• 96% of fertilizers sold in Mozambique to Estates/ Concessions• Poor distribution system due to low demand
1kt
Agro-dealers
Mozambique Distribution Structure

Nitrogen Manufacture• Large gas reserves (180 tcf)of the northern coast of
Mozambique. • Mozambique Gas Master Plan has allocated gas for
Power generation, fertilizer production, Gas to Liquids and LNG
• Yara chosen for fertilizer project-allocated 2,2 to 2.5 MMcm/day to manufacture 1.2 to 1.3Mill tons of nitrogen fertilizer per yr.
• Project still under evaluation.• Poor infrastructure in Northern Mozambique
Phosphate Manufacture• One of the Largest Phosphate deposits in Southern
Africa. Evate deposit- in the Monapo Region, west of Nacala. Reserves of 150-200 Mill tons with P2O5
concentrations of 9.8% in ore. Vale abandoned the development rights in 2014 and the Govt has invited companies to submit development proposals
Key Takeaways• Mozambique is well endowed with resources for the production of both Nitrogenous and Phosphatic fertilizers• Feasibilities will need to take into account global supply surpluses in Nitrogen and significant capacity expansions
in phosphate production in North Africa (Morocco) and Saudi Arabia
Mozambique –Fertilizer Production Potential

Activity
Unit cost in
USD per
MT
Import Cost Insurance and Freight
Price of UREA AG (FOB)1 235.00
Freight2 45.00
Marine Insurance (1% of FOB) 2.35
CIF 282.35
Clearing and forwarding cost
Import Duty (2.5% of CIF) 7.06
Mozambique Customs Network charges (Mcnet)(0.85% of FOB) 2.00
Shore handling charges 3.80
Customs attendant, Tally and vessel agent 1.15
Clearance ( 1% of CIF) 2.82
Agency fees 8.50
Scanning charges 4.60
Demurrage3 10.00
Sub total Clearing and forwarding 39.93
Total landed cost 322.28
Bagging 9.50
Bag costs 10.00
Warehousing costs
Handling in/out warehouse 10.00
Transport to warehouse 8.50
Warehousing rent/week4 12.00
Sub total warehousing costs 30.50
Total cost on truck ex Warehouse 372.28
Transportation costs to major centers in Mozambique
Road freight to Manica (244km) 6.3c/tk 15.37
Road freight to Sena (335km) 6.3c/tk 21.11
Road freight to Gurue(758km) 6.3c/tk 47.75
FERTILIZER COST CHAIN ANALYSIS-PORT OF BEIRA AS OF APRIL 2018Value Chain CostsPort Costs• The Port of Beira is the main Fertilizer discharge point in Mozambique. Of the 750kt discharged
annually only 50kt remains in Mozambique. The Beira Corridor to Zimbabwe is the shortest link with road and rail logistics. Freight is also forwarded to Zambia, Malawi.
• It is a tidal port-draft restrictions on vessels and significant congestion at the port (berths, discharge rates and roads in the port Area). Importers allow $10/ton to cover these costs and demurrage.
• Process/documentation conformity frustrations (multi government agency involvement) adds cost causing some freight to be shipped through Durban--$10/ton allowanace (not included in the tabled costs).
• Internal Mozambique Road freight rates are on average 50% higher (per ton km) than corridor freight rates
• 2 Blending plants in Beira, mostly for export and one at Chimoio predominately supplying the tobacco industry.
• The Port of Nacala brings 10kt of fertilizer through per year for Malawi—limited use.
Fertilizer Cost Chain Build up through the Port of Beira
Fertilizer costs across Ports in East Africa (USD/Ton)
Activity
Port
Durban BeiraDar es Salaam Mombasa
Port Charges 6.7 39.9 21 39
Bagging 22.5 19.3 18.3 21
Warehousing 23.4 27.3 24 17.4
Total costs ex warehouse 52.6 86.5 63.3 77.4
source: AFAP/IFDC Port costs 2018
Beira Port has high cost due to congestions and inefficiencies. There is an estimated $20/ton on top of these costs that is incurred from poor coordination of different government agencies requiring uncoordinated paper work.

Average Urea Retail Prices (Oct ‘17) in selected countries
401
412406551
486
521
525
540
550
590604
654
614
914
US$/MT
World 240
Nigeria 401
Ghana 406
Tanzania 412
Kenya 486
Mali 521
Burkina Faso 525
Zambia 540
Malawi 550
Cote d'Ivoire 551
Uganda 590
Senegal 604
Rwanda 614
Mozambique 654
Burundi 914
Ratio to World Price
1.5 - 1.74
1.75 - 1.99
2.00 - 2.24
2.25 - 2.49
2.50 - 2.74
> 2.74
• Mozambique is a trade corridor but:
• urea prices in Mozambique are circa 18% higher (than countries served through Mozambique
• And 50% higher than Tanzania, another corridor
• Within the region, only Burundi has higher fertilizer prices than Mozambique

Crop Prices: History and In-Country Ranges
Observations & Comments:• The range of prices within country is large.
• This indicates that profitability may also vary greatly by geography.• The price range does appear to have narrowed over time. Narrowing would be expected if
transport infrastructure had improved, thus better linking the various marketplaces.

Average Crop Prices versus World Urea Price
Observations & Comments:• Maize prices show positive correlation with the exception of the 2015-2017 period.• Rice price correlation with urea has been generally positive beginning in mid-2010.

Average Crop Prices in international markets
Observations & Comments:• Maize and Rice prices were trending downwards since 2014 • 2018 appeared to have bucked the trend• Contrary to international markets:
• local maize prices increased significantly in 2016 and 17, then dropped in 2018
• Local rice prices have shown an upward trend since 2015
0
100
200
300
400
500
600
700
800
900
1000
Jul-
98
May
-99
Mar
-00
Jan
-01
No
v-0
1
Sep
-02
Jul-
03
May
-04
Mar
-05
Jan
-06
No
v-0
6
Sep
-07
Jul-
08
May
-09
Mar
-10
Jan
-11
No
v-1
1
Sep
-12
Jul-
13
May
-14
Mar
-15
Jan
-16
No
v-1
6
Sep
-17
Rice (US$/mt)
0
50
100
150
200
250
300
350
Jul-
98
May
-99
Mar
-00
Jan
-01
No
v-0
1
Sep
-02
Jul-
03
May
-04
Mar
-05
Jan
-06
No
v-0
6
Sep
-07
Jul-
08
May
-09
Mar
-10
Jan
-11
No
v-1
1
Sep
-12
Jul-
13
May
-14
Mar
-15
Jan
-16
No
v-1
6
Sep
-17
Maize (US$/mt)

Strengths Weaknesses Opportunities Threats
Manufacturer • Poor infrastructure • Yara reviewing Nitrogen manufacturing capacity in the North Of Mozamnbique GoM has asked Yara to include Evate evaluation.
Importer • Most majors import 650kt through Mozambique to inland markets (Nacala, Beira, South Africa)
• All majors have (or will have this year) blending capacity
• Many options for bulk discharge and –off quay bagging
• Multiple Moz Govt agencies involved in process which causes conflict. Needs a single “go to” entity
• Port congestion sometimes means it is more viable to bring product through Durban
• Unfriendly regulations for import and transit• Port congestion
• Lever off international experience to expedite product choice, formulations and best practice in fertilizer use
• Lever trade finance from manufacturers/Development funds and export banks
• Encourage manufacturers to provide flexible buying arrangements
• Entry of manufacturers into the market• Expansion of subsidy program at exclusion
of private sector
Blender • Adequate blending capacity. ETG, Omnia and Meridian
• Markets poorly developed. Major blender at Chimoio for tobacco market
• Laws for blending and export are complicated.• Unfriendly regulations for blending for export
• Define domestic markets with market demand—eg Rice• Work with Govt Pedsa• Support platform with technical capacity• Develop viable Anchor programs with adequate
infrastructure• Yara with the Norweign Govt implementing program to
build small holder fertilizer use in Mozambique• ETG have offered to assist in building input use through
accumulation depots
• Requirements on blend exports make operations to difficult to blend at Beira
Distributor • Poorly developed• High margin addition• Low volume• Poor distribution
Agro Dealer • Market development needs to happen first
Key Takeaways:1. Market creation is a strong requirement. Mozambique has large land availability and low population density. Infrastructure and market demand limit profitability. Hoyo Hoyo have
had to store Soya Bean for 2 years because it is not viable to sell. (US$150/ton freight inputs and US$150/ton freight to Beira—cheaper to import of the international market)2. Proposals like pro Savannah have not been successful in developing the 34 Mill Ha of savannah of Mozambique which would allow infrastructural development.
Mozambique value chain SWOT Analysis

Status• Mozambique’s legal and regulatory
framework consists of only a Regulation on Fertilizer Management, 2013 (Fertilizer Regulation), which was issued by the Council Ministers, and not a Fertilizer Act done through Parliament.
• Regulatory fragmentation. Multiple government institutions are involved in fertilizer importation.
• AMOFERT is a multi stakeholder platform that is considered the voice of the industry—it is considered the voice of the fertilizer industry
• Processes to maximize Govt revenue have caused considerable cost and inefficiencies
Outcomes/Weaknesses• The regulatory framework and environment guiding
fertilizer use in Mozambique is in a development phase• Mozambique’s regulatory system is vulnerable to
change by the executive at any time. • AMOFERT fulfills the role of bringing stakeholders
together from across the value chain to table issues to be resolved—it is considered the voice of the fertilizer industry and fulfills an important function as the Fertilizer regulations are developed in practice.
• Multiple Government agency involvement has lead to fragmentation of processes, particularly as related to imports. This has lead to inefficiencies as decisions in multiple agencies often impact on other agencies when implemented.
Mozambique Fertilizer market-Regulatory Environment

Mozambique Fertilizer Market Overview – Supply and Demand Issues
Supply issues
• Poor infrastructure exists in many areas, especially those in the North of the country. Significant impact on costs to get inputs in and costs
to get outputs to market. Internal freights rates are 50% higher ($/ton km)
• There are three blending plants in Mozambique. One is used for domestic supply to the tobacco sector and the other two are predominantly
used for export to neighbouring countries.
• Poor access to inputs—poor distribution systems because of low demand.
Demand issues
• Poor access to profitable markets.
• Low access to input credit and risk mitigation tools like insurance. Important for shallow markets and markets vulnerable to markets
exposed to the impact of weather. Low population densities on arable land mean it is less pressure on productivity increases that require
cash inputs.
• Poor knowledge of product use and farming practices needed for high productivity. Research in Mozambique has demonstrated 200%
yield increase to currently recommended fertilizer use and a further response of 300% yield increase to using correctly formulated
fertilizers that that address soil deficiencies for different crops.
• Limited knowledge of fertilizer technologies and marketing practices in the value chain
Key Takeaways• Poor profitability at the farm level due to poor output market access and linkages,--infrastructure and low population/markets to traditional crops.• Poor access to inputs because of undeveloped distribution systems.• Poor technical knowledge in the research, extension and distribution channels

Finance:Agricultural Economy Overview

Economic Overview: Major Points
• The agricultural economy is an important contributor to employment and GDP.
• The agricultural workforce is, on average, poorer than the national average.• This has significant implications relating to the ability to
finance ag-sector activities.

Economic Overview
The agricultural economy is a significant part of the overall economy.
• About three quarters of the workforce is employed in the agricultural sector.• The ag sector generates about one fifth of national GDP.

Economic Overview
The size of the ag workforce is much larger than its proportional contribution to GDP. Thismeans that a smaller amount of GDP accrues to a larger number of workers.

Economy Overview : Implications
Implications:• On average, the ag workforce is “poorer” than average (well below national
parity).• The ability of the ag workforce to build wealth (equity) is lower than average
leading to:• Lower ability to self-finance their activities• Lower credit capacity
• This lack of financing has been confirmed in numerous surveys and studies.• Lack of equity capital is severe and the most problematic financing issue to
overcome.• In the absence of new sources and/or structures to provide financing to the
ag sector, it should be expected to grow at a sub-par rate.

Finance:Commercial Banking Sector

Commercial Banking Sector: Major Points
• Commercial bank lending into the agricultural sector is extremely low given the size and importance of the ag economy.
• There are legitimate business reasons for this lack of lending.• Financing the inventories of input dealers would be best achieved
via trade finance.• Financing the farmer, at the scale needed, is a problem that had
yet to be solved.

Commercial Banking Sector
Comments and Observations:• Loans to the agricultural sector are a very small part (<2%) of the banking sector’s asset mix.• In relation to the ag sector’s importance in terms of employment and GDP contribution, ag lending lags
far behind.

Commercial Banking Sector
Comments and Observations (continued):• Bank lending to the ag sector is so small due to the nature of capital financing. Capital comes in two basic
types, equity and debt.• Equity is the risk bearing capital. It participates in the gains/losses of the enterprise.• Debt’s return is fixed, it does not participate in the gains/losses of the enterprise. Thus it is not risk
bearing. Debt is mean to be additive to, or leverage, equity capital. It is not a substitute for equity.• Legitimate business reasons can explain why ag lending is so small. Two major factors are:
1. Ag sector participants do not have adequate risk capital (equity) to support debt. Banks cannot be expected to provide debt financing when there is a lack of risk bearing (equity) capital.
2. Even ignoring risk, small sized and short maturity loans are not profitable for banks. Many financing needs in the ag sector have these attributes.

Financing for Increased Fertilizer Usage
• The unfulfilled demand for financing becomes more acute as you go down the distribution chain.
• Lack of creditworthiness and loan profitability make commercial bank lending less viable as you go down the distribution chain.
• The economic attributes of financing fertilizer distribution down to the local agro-dealer level are very different from those of financing the end-user farmer.

Financing for Increased Fertilizer Usage
• Farmer financing, especially smallholder farmers, is the most difficult part.
• Some fertilizer demand goes unfulfilled due to lack of physical product where and when it’s needed (effective demand). This needs to be addressed with inventory financing that allows supplies to position inventories when and where they are demanded.
• Even if the inventory financing issues are eliminated, much demand will go unfulfilled due to lack of financing at the end-user farmer level (latent demand).
• Increased usage of fertilizers requires profitability and ability to purchase at the end-user farmer level.

Financing for Increased Fertilizer Usage: Possible Solutions
• Distribution Chain (Inventory) Financing• Trade credit offers the most promising route to provide inventory financing down the
distribution chain. This is due to its attributes of:• Building business trust relationships between supplier and customer.• Control of physical flows allows for more efficient management and monitoring of credit
risk.• Financing improves turnover and thus profitability, allowing financing costs to be balanced
against product margins.• Farmer Financing
• This is the large problem that has yet to be solved. Several mechanisms have shown promise such as:
• Outgrower programs• Aggregator programs
• The scalability of the above programs is an issue due to the amount of management capacity and monitoring required to keep losses in check.
• New sources of funding and new credit delivery mechanisms need to be created. Some type of equity (risk bearing) financing needs to part of the solution.

Finance:Fertilizer Profitability

Fertilizer Profitability: Major Points
• Fertilizer profitability has a direct and important influence on demand.• Demand is the key element that shapes the structure of the supply side.• Realized demand depends on potential buyers to be both willing and able to
purchase.• Fertilizer profitability is impacted by large number of complex and ever
changing factors. This makes it difficult to analyze.• For the crops analyzed in Mozambique, our analysis shows a mixed picture
with respect to profitability. Rice profitability is strong and should support increased demand. The picture for maize is less positive and falls into the marginal area. An additional factor is the buyer’s ability to purchase.

Fertilizer Profitability & Demand
• The statistics showing that fertilizer usage in Africa has consistently lagged behind world averages have been well publicized for many years. This fact has driven many efforts across the continent with goal to reduce or eliminate this gap in an effort to increase farm yields.
• In the final analysis, end-user demand will be the driving force that shapes fertilizer distribution systems and the volume that they need to deliver.
• When approaching the demand environment, it is critical to understand the two major types of demand and how they impact current and potential usage of fertilizers:
• Effective demand – This is the volume of demand where the end-user farmer is both willing and able to purchase the products. Effective demand is determined by many factors such as cost/benefit, available supply and ability to purchase. While there exist gaps in certain markets where supply does not meet effective demand, these gaps are usually filled by profit seeking sellers and do not exist for long periods of time. Inefficiencies imposed on the supply chain could however artificially maintain the gaps.

Fertilizer Profitability & Demand
• Latent Demand – This is the volume of demand where the end-user farmer would be a willing buyer, but lacks a necessary element in order to become an able and willing purchaser. Common factors that determine latent demand can be product knowledge, unknown cost/benefit and lack of funds.
• Consensus is that latent demand far outstrips gaps in meeting effective demand. There have been numerous programs focused on turning latent demand into effective demand, a few examples are:• Farmer training and demonstrations• Subsidy programs• Input loan programs
• Not withstanding these efforts, the “fertilizer usage gap” still remains.• Understanding the factors behind latent demand is needed in order to:
• Identify effective ways to address those factors, and • Forecast the volume of potential demand in the market. This is critical for private sector
investors who are making investment decisions.

Fertilizer Profitability
• We look to analyze fertilizer profitability because it has an important, but not exclusive, role in the determination of product demand.
• Although total profitability of farming is a function of many factors, it is safe to say that the economic return to the farmer from fertilizer usage defines some important limits. If economic returns are low to negative, issues of supply, education and others become moot. Conversely, high economic returns imply high potential demand. Either case will have significant impacts on investment decisions along the distribution chain.
• Returning back to the well known statistics on fertilizer usage in Africa, before one states that Africa should eliminate the usage “gap”, one needs to first demonstrate that doing so will not cause economic harm to the farmer.

Fertilizer Profitability Analysis
• There is no single figure that represents the profitability of fertilizer usage. Profitability is a “local not global” concept that is influenced by:
• Specific geography• Crop• Method of usage/application• Other agronomic factors such as seed and CPPs• Ever changing market prices (input and crop)• Weather• Soil conditions• Timing of input purchase and sale of crops
… and these are just to name a few!• Compounding the above issues are difficulty in getting accurate and consistent data with
respect to costs, price and yield responses.
• Thus, we must preface this analysis with the caveat that our results are not definitive but indicative.

Fertilizer Profitability Analysis
• We have limited the analysis to two staple crops, maize and rice.• Specific sites were chosen that were central market locations.• The most recent growing season was chosen where reliable data was available.• We used fertilizer prices in effect at the planting season and crop prices at harvest season.
While this may represent a “worse case” (for example crop prices can be at seasonal lows during harvest) we felt that it best represented the reality of the smallholder farmer.
• We used suggested fertilizer application rates and only considered “basic” products (DAP, Urea, NPK) and not any blended products.
• The analysis assumes that fertilizer application is the only variable. In practice, combining improved fertilizer usage with improved seed and other inputs and practices can maximize overall yield gains.
• Valid yield response data allows for direct computation of profitability given knowledge of fertilizer prices, application rates and crop prices. However, getting such yield response data is the greatest challenge.
• Because of the difficulty in locating valid yield response data, we calculated a range of yield responses that would be needed to achieve a range of returns on investment (ROI).
• There is no scientific/objective level of a minimum acceptable ROI, but a practical rule of thumb is that a two time return (200% ROI) is needed.

• In order to reach an acceptable profitability of 200% ROI a yield response of about 3 mt/ha is required. Based on field test experiences, this is an aggressive figure.
• The conclusion is that the benefits of fertilizer usage are marginally profitable at best at the location where this analysis was done (Chimoio).
• A remaining issue would be the ability of farmers to finance the purchase.
Fertilizer Profitability Analysis: Maize

Fertilizer Profitability Analysis: Rice
• In order to reach an acceptable profitability of 200% ROI a yield response of about 0.8 mt/ha is required. Some field studies have shown that an expected yield response of >2 mt/ha is achievable.
• The conclusion is that the benefits of fertilizer usage are at a level that should strongly support increased demand.
• As with maize, the remaining issue would be the ability of farmers to finance the purchase.
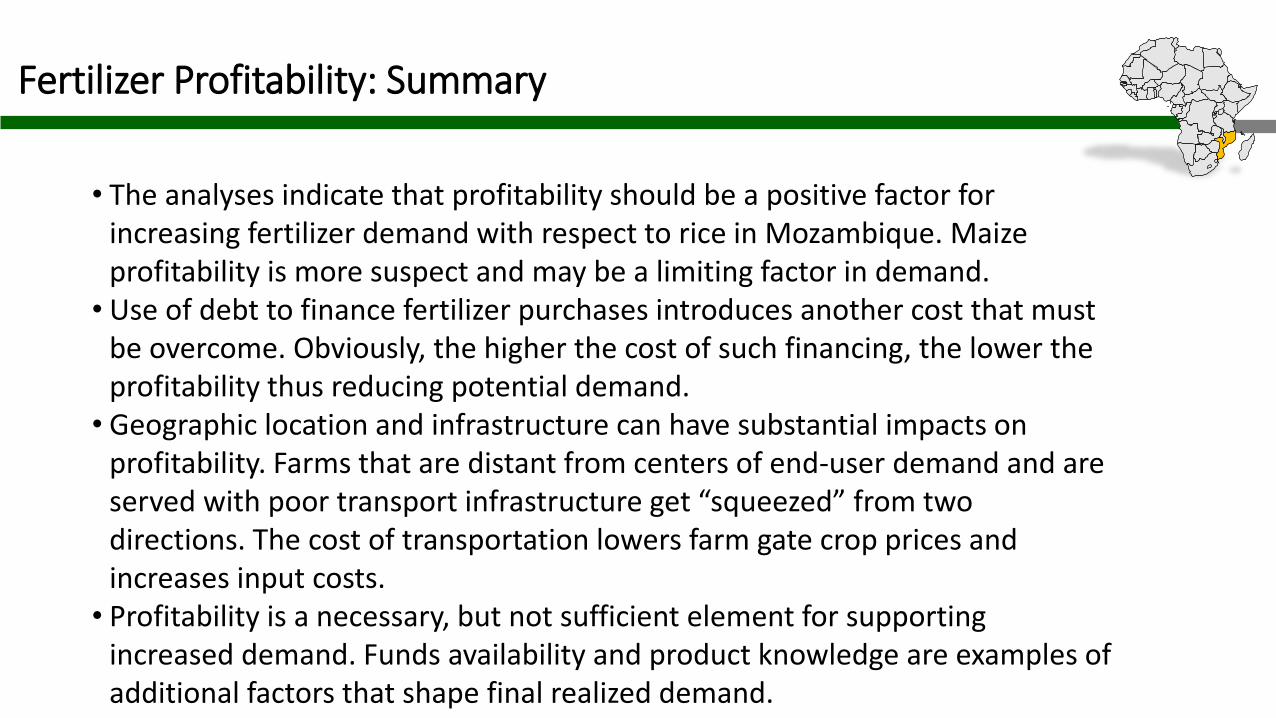
Fertilizer Profitability: Summary
• The analyses indicate that profitability should be a positive factor for increasing fertilizer demand with respect to rice in Mozambique. Maize profitability is more suspect and may be a limiting factor in demand.
• Use of debt to finance fertilizer purchases introduces another cost that must be overcome. Obviously, the higher the cost of such financing, the lower the profitability thus reducing potential demand.
• Geographic location and infrastructure can have substantial impacts on profitability. Farms that are distant from centers of end-user demand and are served with poor transport infrastructure get “squeezed” from two directions. The cost of transportation lowers farm gate crop prices and increases input costs.
• Profitability is a necessary, but not sufficient element for supporting increased demand. Funds availability and product knowledge are examples of additional factors that shape final realized demand.

Mozambique Highlights
• Large agrarian population• Large gas and Phosphate reserve with projects in view• Presence of a public-private fertilizer dialogue platform• Gateway to 3 countries• The lending plants at the ports supply land-locked neighbouring countries, distributing less
than 10% in Mozambique. Only 2,000 mt of fertilizers distributed through agrodealers.• Agricultural processing is minimal• Low access to input credit for trade. Structured trade credit required for growth• Farmer finance required to grow market. Options are Outgrower and Aggregator programs;
MicroFinance banks could also work.• Risk bearing financing mechanism probably needs to be included in the supply chain financing
structure• More appropriate blends (and higher yielding seeds) will be vital to fertilizer adoption.• Rice profitability analysis shows strong demand potential for fertilizers• Maize demand, as it stands, is marginal• Cassava farmers do not currently use fertilizers