MOX–Report No. 49/2014
28
MOX–Report No. 49/2014 Influence of the aortic valve leaflets on the fluid-dynamics in aorta in presence of a normally functioning bicuspid valve D. Bonomi, C. Vergara, E. Faggiano, M. Stevanella, C. Conti, A. Redaelli, G. Puppini et al MOX, Dipartimento di Matematica “F. Brioschi” Politecnico di Milano, Via Bonardi 9 - 20133 Milano (Italy) [email protected] http://mox.polimi.it
Transcript of MOX–Report No. 49/2014

MOX–Report No. 49/2014
Influence of the aortic valve leaflets on thefluid-dynamics in aorta in presence of a normally
functioning bicuspid valve
D. Bonomi, C. Vergara, E. Faggiano, M. Stevanella,C. Conti, A. Redaelli, G. Puppini et al
MOX, Dipartimento di Matematica “F. Brioschi”Politecnico di Milano, Via Bonardi 9 - 20133 Milano (Italy)
[email protected] http://mox.polimi.it


Influence of the aortic valve leaflets on the
fluid-dynamics in aorta in presence of a normally
functioning bicuspid valve
D. Bonomi1, C. Vergara2, E. Faggiano1,3, M. Stevanella4, C. Conti5,
A. Redaelli4, G. Puppini6, G. Faggian7, L. Formaggia1 and G.B. Luciani7
November 6, 2014
1 MOX– Modellistica e Calcolo Scientifico, Dipartimento di Matematica, Politecnico diMilano, via Bonardi 9, 20133 Milano, Italy
[email protected] Dipartimento di Ingegneria Gestionale, dell’Informazione e della Produzione,
Università di Bergamo, Italy3 LaBS, Dipartimento di Chimica, Materiali e Ingegneria Chimica, Politecnico di
Milano, Italy4 Dipartimento di Elettronica, Informazione e Bioingegneria, Politecnico di Milano,
Italy5 EnginSoft SpA, Parco Scientifico Tecnologico Kilometro Rosso, Bergamo, Italy
6 Department of Radiology, Azienda Ospedaliera Universitaria Integrata di Verona,Polo Confortini, Verona, Italy
7 Division of Cardiac Surgery, Department of Surgery, University of Verona, Italy
Keywords: Bicuspid aortic valve, aortic aneurysm, jet asymmetry, systolic he-licoidal patterns
Abstract
In this work we consider the blood fluid-dynamics in the ascending aortain presence of a normally functioning bicuspid aortic valve (BAV). In par-ticular, we perform a computational study to assess the effect of the inclu-sion of the leaflets on the fluid-dynamic abnormalities characterizing BAVcases. Indeed, in previous works it has been shown that without leaflets itis possible to recover such abnormalities, in particular the strong systolicjet asymmetry, but it was not clear how the inclusion of the leaflets wouldhave improve the results.
To this aim we perform a comparison in two real geometries (a di-lated and a non-dilated ones) among three scenarios which are built up foreach geometry: BAV without leaflets, BAV with leaflets, and tricuspid case(TAV) with leaflets. Our results show that the inclusion of the leaflets in-creases the fluid-dynamics abnormalities which are quantified through theintroduction of suitable synthetic indices.
1

1 Introduction
Bicuspid aortic valves (BAV) provide in general a normally functioning regimein absence of other complications, such as regurgitation or aortic dissection.However, they are associated with an increased prevalence of ascending aorticdilatation and, possibly, aneurysm in comparison with a normally functioningtricuspid aortic valve (TAV) (Hahn et al, 1992; Fedak et al, 2002; Nkomo et al,2003; Bauer et al, 2006). The reasons for this are matter of controversy: onthe one hand it is believed that a genetic origin could lead to a weakening ofthe aortic wall (Siddiqi and M.D., 2014); on the other hand a crucial role seemsto be played by the systolic blood fluid-dynamics observed in the ascendingaorta in BAV cases (Barker and Markl, 2011; Girdauskas et al, 2011), wherean abnormal fluid-dynamics has been described characterized by non-standardfeatures in comparison with the one developed in a normally functioning TAV.In particular, the fluid-dynamics at systole in the ascending aorta in a normallyfunctioning BAV feature:
1. An eccentric jet exiting from the left ventricle;
2. High concentrated wall shear stresses (WSS);
3. Elevated retrograde flows;
4. A possible helical flow, which becomes particularly intense in dilated cases.
These phenomena have been observed with medical imaging techniques, such asechocardiography (Schapira et al, 1979; Donal et al, 2005b) or phase-contrastmagnetic resonance (PC-MRI) (Hope et al, 2014a, 2010; Den Reijer et al, 2010;Barker et al, 2010; Hope et al, 2011; Sigovan et al, 2011; Barker et al, 2012),with in-vitro experiments (Saikrishnan et al, 2012; Atkins et al, 2014) , and withcomputational models (Viscardi et al, 2010; Vergara et al, 2012; Della Corte et al,2012; Chandra et al, 2012; Pasta et al, 2012; Faggiano et al, 2013). In particular,in (Faggiano et al, 2013) we observed that the four characteristics of the BAVfluid-dynamics mentioned above are not independent and are strictly related withone another. In (Viscardi et al, 2010; Vergara et al, 2012; Faggiano et al, 2013),rigid wall simulations where the valve orifice was projected on the valve plane(interface between left ventricle and aorta) and without modeling the leaflets werepresented. These simulations highlighted that the shape and the area of BAVseem to be enough to reproduce the abnormal fluid-dynamics in the ascendingaorta with a satisfying accuracy (see Faggiano et al (2013) for a quantitativecomparison with 2D CINE PC-MRI data). However, in (Della Corte et al, 2012;Chandra et al, 2012; Marom et al, 2013b; Pasta et al, 2012) the importance ofincluding the valve leaflets in the computational model has been highlighted toaccurately describe the jet deflection and WSS.
In this paper we present a work aimed at investigating and quantifying theeffect of the inclusion of the valve leaflets in fluid-dynamic numerical simulations
2

with rigid walls. In particular, we aimed at comparing BAV and TAV config-urations in presence of the leaflets, and BAV configurations with and withoutleaflets. To this end, four indices measuring jet asymmetry, flow reversal, helicalflow, and maximum wall shear stress were computed at the systole.
2 Methods
2.1 Data acquisition and generation of the volumes
In this work we considered two patient-specific non-stenotic BAV cases, one char-acterized by a normal ascending aorta (in what follows referred to as Patient 1),and the other one by a dilated ascending aorta with a diameter greater than4cm (referred to as Patient 2). Both patients featured an antero-posterior (AP)orientation of the commissures. None of the patients was affected by additionalstructural diseases, including aortic coarctation or tetralogy of Fallot.
For both patients a 3D contrast enhanced MRI (CE-MRI) was acquired witha voxel resolution of 1.72× 1.72× 1.5 mm. The following parameters were used:TE (Echo Time) = 1.02 ms; flip angle = 20deg ; slice thickness = 1.5 mm;acquisition matrix = 256× 106. The two geometries are shown in Figure 1. Twocross-sections are considered at two different aortic levels, namely the sinotubular
junction and the mid-ascending aorta. We will refer to these sections as A1 andA2, respectively (see Figure 1).
Moreover, a breath-hold true fast imaging with steady state precession (True-Fisp) cine-sequence with retrogated ECG triggering was acquired on the valveplane, defined as the interface between the left ventricle and the aorta, with thefollowing parameters: TE (Echo Time) = 1.6 ms; flip angle = 65deg ; slice thick-ness = 8 mm; temporal resolution = 20 phases in one cardiac cycle; acquisitionmatrix = 256× 146.
All the MRI acquisitions were performed on a 1.5 Tesla system (MagnetomSymphony, Siemens Medical Systems, Erlangen, Germany).
A surface model of the aortic root, ascending aorta and aortic arch of the twopatients has been then generated from the 3D CE-MRI images, using a level-setsegmentation technique implemented in the open-source code Vascular ModelingToolkit (vmtk, http://www.vmtk.org). The surfaces have been then cut at theaortic valve planes and at the outlets, obtaining the starting volumes (see Figure1).
2.2 Leaflets geometry
To include the leaflets in our geometries we preliminarily performed two struc-tural simulations in a realistic but not specific geometry, one for a BAV and onefor a TAV configuration. To this aim, finite element models of BAV and TAV con-figurations were based on average dimensions derived from 2D MRI acquisitionsperformed on 10 TAV and 8 AP-BAV subjects, respectively (Conti et al, 2010).
3

Figure 1: Computational domains. Left: Patient 1 with STJ (A1) and mid-ascending aorta (A2) sections; Right: Patient 2 with sections A1 and A2.
The mechanical response of aortic leaflets, modeled as a shell, was described viaa transversely isotropic incompressible hyperelastic model, implemented into theABAQUS/Explicit code (ABAQUS/ Explicit, SIMULIA Inc.) with a VUMATsubroutine, based on the following strain energy function (May-Newman andYin, 1998):
W = c0 exp (c1(I1 − 3)2 + c2(I4 − 1)2 − 1), (1)
where I1 and I4 are the first and fourth invariants of the Cauchy-Green straintensor. Constants c0, c1, c2 were set by fitting with the model reported by (Billiarand Sacks, 2000). Constitutive materials of the aorta were assumed linear, elasticand isotropic. The density was set equal to 1.1g/mm3 for all tissues. A two-stepsimulation was performed on the model. First, the aortic root was pressurizedby a linearly increasing load from the zero-pressure state to the tele-dyastolicaortic pressure level. Second, physiologic pressures were applied to the aorticroot substructures. For further details we refer the reader to (Conti et al, 2010).This allowed to obtain two reference open leaflets configurations, one for BAVand one for TAV.
In this work we were interested in computing fluid-dynamic quantities at thesystole, since they characterize the abnormal flow in presence of BAV. For thisreason we considered the open configurations obtained by the BAV and TAVstructural simulations in the reference geometry and we mapped them into thevolumes of the two patients, using Gambit, an Ansys preprocessor for engineeringanalysis. This mapping has been realized for both patients imposing that theresulting dimension of the BAV orifices and the orientation of the valves were thesame as those measured from the TrueFisp sequences. This allowed to obtain, forboth Patients 1 and 2, a BAV and a TAV open leaflets configuration in the samevolume, and then to appreciate the differences induced by the different valves,see Figure 2.
4

Figure 2: Valve leaflets for the tricuspid (left) and the bicuspid (right) configu-rations. Patient 1.
2.3 Generation of the meshes with the leaflets
Once we have obtained the four geometries with the open leaflets, we generatedwith vmtk a volume mesh of linear tetrahedra and a conforming superficial meshfor the leaflets, achieving for each of the two patients the computational domainswith leaflets for the TAV and BAV cases. In what follows we refer to such meshesas BAV-leaflets and TAV-leaflets (see Figure 3, left, for the leaflets mesh).
All leaflets triangles were duplicated , thus obtaining two coinciding surfacesand a discontinuity of the solution through the leaflets.
Figure 3: Mesh of the internal leaflets in the BAV configuration (left) and of theprojected valve orifice (right).
5

2.4 Generation of the meshes without the leaflets
In order to assess the accuracy of the simulations in presence of the leaflets,we generated for the two BAV cases also the corresponding two meshes withoutleaflets. To this aim, we identified for each scenario the valve plane. Then,for both patients we projected onto the valve plane the orifice delimited by theendpoints of the leaflets in the systolic configuration. At the end, two regionswere identified on this plane: the bicuspid valve orifice (light gray in Figure 3,right), which is the inlet for the fluid-dynamic simulations, and an impermeableregion (dark grey in Figure 3, right). Then, a mesh of linear tetrahedra wasgenerated with vmtk for each of the two patients, obtaining the computationaldomains without leaflets. In what follows we refer to such meshes as BAV-no-leaflets.
In Table 1 we report the values of the orifice area for all the meshes considered.Concerning the number of elements of each mesh, we obtained about 600 000
tetrahedra and 120 000 vertices for all the meshes related to the Patient 1, about750 000 tetrahedra and 140 000 vertices for the meshes related to the Patient 2.
Patient 1 Patient 2TAV-leaflets 3.1 4.2BAV-leaflets 2.0 2.5BAV-no-leaflets 1.8 2.3
Table 1: Values of the valve orifice areas expressed in cm2.
2.5 Description of the numerical simulations
Unsteady numerical simulations were performed by using the finite element li-brary LifeV (see www.lifev.org). Blood was considered as Newtonian, homoge-neous, and incompressible, modeled by the Navier-Stokes equations for incom-pressible fluids (Formaggia et al, 2009). The blood viscosity was 0.035 Poise, thedensity was 1.0 g/cm3, and the time step was 0.01s. For time independence, wetested that doubling the time step or refining the meshes the results remainedthe same up to a suitable tolerance. We used P1-P1 finite elements stabilizedwith the Interior Penalty technique, see Burman et al (2006). The vessel wall wasconsidered rigid since we do not expect that the dynamics of the wall substan-tially affects the abnormal systolic flows, especially the comparisons among thedifferent cases. Being interested in the hemodynamics at systolic ejection, theopening and closure mechanism of the valve leaflets was not modeled in the casewith leaflets, since we assumed that this would not influence the direction of thejet at systole and the other fluid-dynamic quantities. Valve opening and closurewere therefore modeled in an on/off modality without considering the intermedi-ate steps. For our tests we prescribed the same standard representative healthy
6

-5
0
5
10
15
20
25
0,0 0,1 0,2 0,3 0,4 0,5 0,6 0,7 0,8
flo
w r
ate
[L/
min
]
time [s]
Figure 4: Representative flow rate curve imposed at the inlet in all the scenarios.
flow rate to both patients (Avolio, 1980) (see Figure 4). To prescribe this flowrate, a Dirichlet boundary condition at the inflow under the assumption of flatvelocity profile was imposed (Moireau et al, 2012). At the outlets, a zero-stresscondition was prescribed, since the region of interest is in the proximal ascendingaorta. It must be highlighted that no turbulence models were assumed.
2.6 Indices for haemodynamic quantifications.
In order to perform a quantitative comparison among the various configurations,we introduced suitable easily computable indices providing useful informationabout the abnormal flow in the ascending aorta.
Flow asymmetry. BAV configurations lead to an asymmetric systolic flow inthe ascending aorta. To quantify this eccentricity we used the normalized flowasymmetry index NFA proposed in (Sigovan et al, 2011), defined as follows:
NFA =||cS − cvel||
L, (2)
where cvel is the center of velocity on S defined as (cvel)j =∫Sju+
·ndσ∫Su+·ndσ
, j = x, y, z,
where u+ is the part of the velocity u such that u
+ · n > 0 on S (n being thenormal direction to the section S), cS is the barycenter of the section S and L isa characteristic length of S.
We have NFA = 0 when the center of velocity lies in the center of thevessel (no asymmetric flow) and NFA = 1 when it is on the vessel wall (totallyasymmetric flow).
Retrograde flow analysis. One of the features of the systolic abnormal flowinduced by a BAV configuration is the formation of retrograde flows in the as-cending aorta. To quantify them, we introduce the index FRR on a section,
7

defined as follows (Barker and Markl, 2011; Faggiano et al, 2013)
FRR =|Qneg(tsys)|
|Qpos(tsys)|%, (3)
where Qneg and Qpos represent the backward and forward flow rates on the sectionat hand, respectively and tsys is the systolic instant. Observe that FRR = 0means that no retrograde flow occurred.
Systolic helical flow pattern analysis. As observed in the Introduction, oneof the peculiarity of the fluid-dynamics in BAV configurations, strictly relatedto the formation of retrograde flows and to the jet asymmetry, is the possibleformation of helical structures in the ascending aorta at systole, which are com-pletely absent in normal TAV configurations. To quantify such a phenomenonon a section S, in Faggiano et al (2013) we introduced the positive helix fractionindex PHF defined as
PHF =Hpos
Hpos +Hneg
(4)
where Hpos =∫Sh+, Hneg =
∫Sh−, h+ and h− are the positive and negative
parts, respectively, of the quantity h, defined as
h = (∇× ((u(tsys) · τ )τ ) · n, (5)
where τ is the tangent direction to the surface S. h is nothing but the nor-mal component of the systolic vorticity of the velocity parallel to the section S.PHF indicates the ratio between right-handed helices and the totality of therotating flux (PHF = 1 means complete right-handed helical flow, PHF = 0means complete left-handed helical flow, PHF = 0.5 means no prevalence of anydirection).
Wall shear stresses. Strictly related to the formation of asymmetric flows isthe production of elevated wall shear stresses in the ascending aorta. To quantifythe wall shear stress we introduced the index WSSmax, which is the maximumof WSS evaluated on the ascending aorta (Faggiano et al, 2013).
3 Results
In this section we report the numerical results obtained for the different config-urations we have presented. In the first part we analyze the velocity field andthe values obtained for the indices proposed in Section 2.6. In the second partof the section we present the results of a parametric study obtained by varyingthe flow rate imposed at the inlet, in order to account for low flow rates oftenmeasured in BAV patients(Barker et al, 2012).
8

Figure 5: Velocity field at the systole for Patient 1 (top) and Patient 2 (bottom).From the left to the right: TAV-leaflets, BAV-no-leaflets, BAV-leaflets.
3.1 Quantification of the indices
3.1.1 Flow Asymmetry
In Figure 5 we show the flow pattern in the ascending aorta at the systole forthe three different configurations BAV-leaflets, BAV-no-leaflets, TAV-leaflets foreach patient.
From this figure we can see a remarkable difference in the fluid-dynamicsbetween the TAV and the BAV cases, for both patients. We notice an asymmetricdistribution of the velocity field in the BAV models, in particular between thevalsalva sinus and the mid-ascending aorta, against a symmetric flow for theTAV configurations. In addition, BAV configurations feature higher values of thesystolic velocity with respect to TAV. As for the comparison between the twoBAV cases, with and without leaflets, we observe that the presence of the leafletsemphasizes the abnormal characteristic of the flow pattern leading to highervalues of the velocity and to a more pronounced asymmetry in the ascendingaorta for both patients.
In Table 2 the values of the NFA index for all the simulations are reported.We observe that the values obtained for TAV cases are very small, confirming thesymmetry of the flow for patients with tricuspid aortic valve. On the contrary, inthe BAV cases, the increased value of NFA highlights the deflection of the flowtowards the wall, a phenomenon that increases approaching the mid-ascendingaorta. In particular, we notice that at the STJ (section A1) there are differences
9

between the cases with and without leaflets of 17% for Patient 1 and 9% forPatient 2, whereas at the mid-ascending aorta (section A2) NFA values increaseby 45% and 42% in the model with the leaflets. Finally, we observe that, inall configurations, the asymmetry is more pronounced for Patient 2, which ischaracterized by a dilated configuration of the ascending aorta.
Patient 1 Patient 2A1 A2 A1 A2
TAV-leaflets 0.080 0.076 0.175 0.077BAV-no-leaflets 0.198 0.258 0.293 0.318BAV-leaflets 0.232 0.375 0.318 0.451
Table 2: Values of the index NFA at the sinotubular junction (A1) and at themid-ascending aorta (A2).
3.1.2 Retrograde flow
We report in Table 3 the values of the flow reversal ratio FRR for all the sim-ulations. From these results we notice that in the TAV configurations there isno retrograde flow at the peak systole, FRR being very small at the STJ andexactly zero at the mid-ascending aorta. A clear increase of FRR in the bicuspidcases is observed. In particular, elevated values of the index occur in all BAVmodels at both levels A1 and A2, indicating the presence of a recirculation zone.This index features a behavior similar to that of NFA, in the sense that thedifferences between BAV models with and without leaflets are less pronouncedat the STJ (A1) (an increment of 18% is observed in the case with leaflets forPatient 1 and of 10% in the case without leaflets for Patient 2). On the contrary,at the mid-ascending aorta (A2), the model without leaflets featured very smallvalues of FRR (very close to zero, thus without any substantial retrograde flow),whereas the one with the leaflets experienced high values of FRR and thus ahigh retrograde flow.
Patient 1 Patient 2A1 A2 A1 A2
TAV-leaflets 0.28 0.0 4.49 0.0BAV-no-leaflets 8.63 0.58 13.24 0.02BAV-leaflets 10.19 9.69 11.80 10.36
Table 3: Values of the index FRR (in % ) at the sinotubular junction (A1) andat the mid-ascending aorta (A2).
10

3.1.3 Helical flow analysis
Figure 6 shows the streamlines of the velocity field at the systole for Patient 2.
Figure 6: Streamlines of the velocity field at the systole for Patient 2. From theleft to the right: TAV-leaflets, BAV-no-leaflets, BAV-leaflets.
We note a considerable difference between the TAV and the BAV cases. In-deed in the TAV configuration the flux goes straight into the ascending aorta,without creating any secondary flow. On the contrary in the BAV models thestreamlines are not parallel to the wall and we can observe the formation ofa vortex with an evident helical pattern (for the BAV-no-leaflets case see alsoFaggiano et al (2013)).
Figure 7 shows the velocity field and the quantity h at the level A2, highlight-ing the formation of a right-handed vortex for all BAV configurations (absent inthe TAV-leaflets case), related to the lateral displacement of the flow and to itsasymmetry. For each patient, the two BAV models, with and without leaflets,present comparable results and show the formation of very similar vortices, whichhowever are slightly more pronounced in the BAV-leaflet configuration. In Table4 we report the values of the PHF index at the mid-ascending aorta. These re-sults confirm that the helical flow is absent for the TAV-leaflets cases (PHF veryclose to 0.5) and that it is more pronounced in the BAV case with leaflets. Inparticular, for the BAV cases PHF increased in the case with leaflets of 20% forPatient 1 and 15% for Patient 2. Moreover, they highlight the increased vorticityfor Patient 2 with respect to Patient 1 for all the BAV cases. This suggests thatthe helical pattern is more relevant in case of aortic dilatation, thus confirmingfor the models with leaflets, what found for the case without leaflets in Faggianoet al (2013).
11
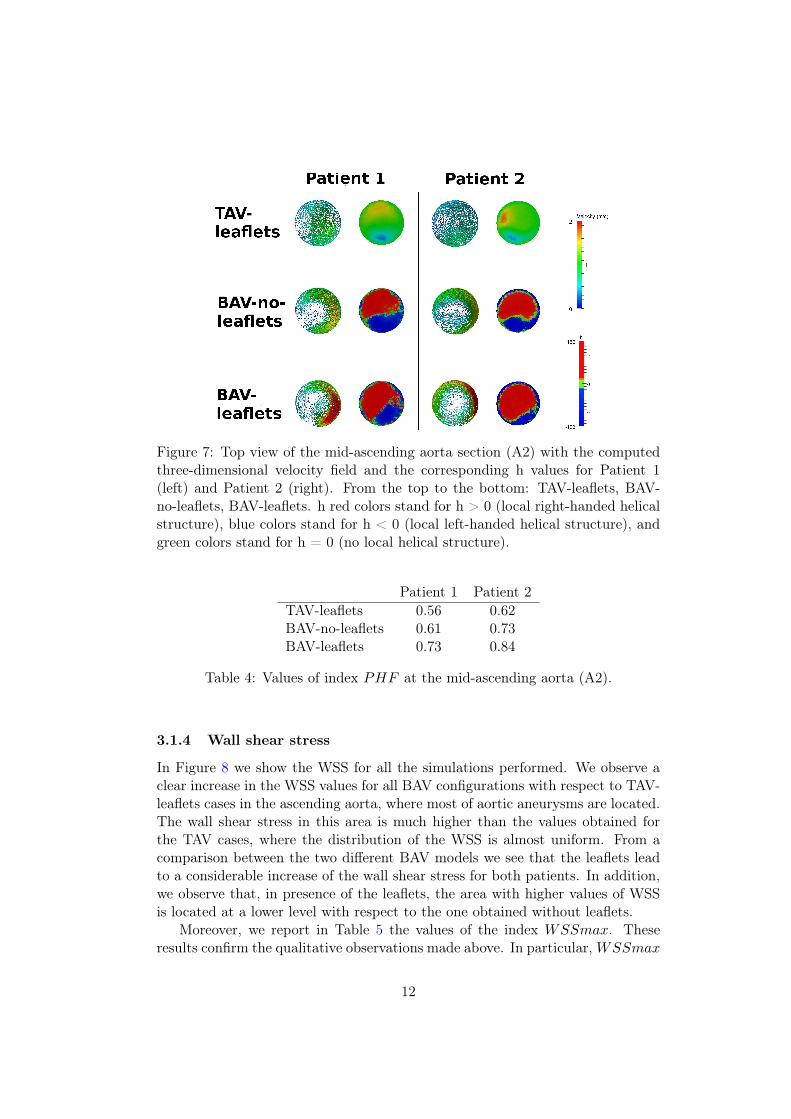
Figure 7: Top view of the mid-ascending aorta section (A2) with the computedthree-dimensional velocity field and the corresponding h values for Patient 1(left) and Patient 2 (right). From the top to the bottom: TAV-leaflets, BAV-no-leaflets, BAV-leaflets. h red colors stand for h > 0 (local right-handed helicalstructure), blue colors stand for h < 0 (local left-handed helical structure), andgreen colors stand for h = 0 (no local helical structure).
Patient 1 Patient 2TAV-leaflets 0.56 0.62BAV-no-leaflets 0.61 0.73BAV-leaflets 0.73 0.84
Table 4: Values of index PHF at the mid-ascending aorta (A2).
3.1.4 Wall shear stress
In Figure 8 we show the WSS for all the simulations performed. We observe aclear increase in the WSS values for all BAV configurations with respect to TAV-leaflets cases in the ascending aorta, where most of aortic aneurysms are located.The wall shear stress in this area is much higher than the values obtained forthe TAV cases, where the distribution of the WSS is almost uniform. From acomparison between the two different BAV models we see that the leaflets leadto a considerable increase of the wall shear stress for both patients. In addition,we observe that, in presence of the leaflets, the area with higher values of WSSis located at a lower level with respect to the one obtained without leaflets.
Moreover, we report in Table 5 the values of the index WSSmax. Theseresults confirm the qualitative observations made above. In particular, WSSmax
12

Figure 8: Wall shear stresses at the systole for Patient 1 (top) and Patient 2(bottom). From the left to the right: TAV, BAV without leaflets, BAV withleaflets.
in the BAV-leaflets configurations is almost four time bigger than in the TAV-leaflets case and almost twice than in the BAV-no-leaflets configuration.
Patient 1 Patient 2TAV-leaflets 1.41 0.95BAV-no-leaflets 2.42 1.73BAV-leaflets 4.33 3.36
Table 5: Values of the index WSSmax.
3.2 Parametric flow rate analysis
Often, in BAV configurations the flow rate entering the aorta through the aorticvalve is lower than the one occurring in a normal tricuspid case, because ofrecurring stenosis (Barker and Markl, 2011). In our cases, Patient 1 featured
13

a mild stenotic valve. This justified a sensitivity analysis to investigate thedependence of the proposed indices on maximum value of the flow rate. Inparticular, we performed the numerical simulations for all the BAV cases, byprescribing a flow rate at the inlet which is equivalent to 2
3of the previous ones,
with a mean flow rate decreasing from 4,85 to 3,23 l/min. We refer to thestandard and lower flow rates as F1 and F2, respectively.
In Tables 6, 7, 8, 9 we compare the values of the indices obtained withthe original flow rates and with the reduced one, for both patients. We noticethat the values of indices NFA and PHF related to the BAV model with theleaflets obtained with the lower flow rate F2 are in general very similar to thoseobtained with F1. On the contrary, we observe a marked difference among theresults obtained with the two flow rates for the BAV-no-leaflets models, especiallyfor NFA and PHF . In particular, in this case the abnormalities of the fluid-dynamics are strongly reduced with the lower flow rate, leading to a jet which ismore symmetric and characterized by a small right-handed helical structure.
Patient 1 Patient 2A1 A2 A1 A2
F1BAV-no-leaflets 0.198 0.258 0.293 0.318
BAV-leaflets 0.232 0.375 0.318 0.451
F2BAV-no-leaflets 0.080 0.131 0.188 0.190
BAV-leaflets 0.226 0.361 0.336 0.481
Table 6: Values of index NFA at the STJ (A1) and at the mid-ascending aorta(A2). Flow rate parametric study.
Patient 1 Patient 2A1 A2 A1 A2
F1BAV-no-leaflets 8.63 0.58 13.24 0.02
BAV-leaflets 10.19 9.69 11.80 10.36
F2BAV-no-leaflets 8.47 0.18 11.80 1.60
BAV-leaflets 11.96 12.91 10.77 18.07
Table 7: Values of the index FRR at the STJ (A1) and at the mid-ascendingaorta (A2). Flow rate parametric study.
14

Patient 1 Patient 2
F1BAV-no-leaflets 0.61 0.73
BAV-leaflets 0.73 0.84
F2BAV-no-leaflets 0.54 0.56
BAV-leaflets 0.70 0.79
Table 8: Values of the index PHF at the mid-ascending aorta (A2). Flow rateparametric study.
Patient 1 Patient 2
F1BAV-no-leaflets 2.42 1.73
BAV-leaflets 4.33 3.36
F2BAV-no-leaflets 1.51 1.10
BAV-leaflets 2.88 2.26
Table 9: Values of the the WSSmax index. Flow rate parametric study.
4 Discussion
4.1 State of the art and choice of the computational model
The study of the fluid-dynamics in the ascending aorta in presence of a bicuspidaortic valve by means of computational tools is a quite recent topic. To ourknowledge, the first work in this direction has been provided by Richards et al(2004), where the authors considered 3D simulations in idealized rigid geome-tries, without any modelization of the leaflets. A similar investigation has beenthen provided in Donal et al (2005a). The first studies with patient-specific ge-ometries have been reported in Viscardi et al (2010) and LaDisa et al (2010),where however the leaflets are not modeled and the valve orifice has been pro-jected on the valve plane. Similar investigations have been then provided in Tseet al (2011), Vergara et al (2012) and Faggiano et al (2013). Other works con-sidered the fluid-structure interaction arising between the blood and the aortawall, we mention Weinberg and Kaazempur Mofrad (2008), Chandra et al (2012),and Marom et al (2013a) for the case of idealized geometries, and Pasta et al(2013) for patient-specific geometries. As for the modeling of the leaflets, to ourknowledge the only works that considered them in the numerical simulations, ei-ther in rigid or compliant vessels, are Weinberg and Kaazempur Mofrad (2008),Della Corte et al (2012), Chandra et al (2012) and Marom et al (2013a) foridealized geometries, and Pasta et al (2013) for real geometries.
In this work we considered numerical simulations in patient-specific geome-tries with the presence of the leaflets, to assess the influence of the latter inthe fluid-dynamics. In particular, we did not model the interaction between
15

the blood and the leaflets, instead we built two reference open configurationsof the leaflets (one for TAV and one for BAV) by solving structural simulationsbased on the average of some patient-specific data, and then we mapped theminto the patient-specific geometries. This choice has been done, as a first ap-proximation, since here we were interested in simulating the fluid-dynamics atthe systole, when the leaflets are completely open. Our aim was to perform acomparison with other configurations (BAV without leaflets, TAV with leaflets).In this respect, we believe that the complete opening/closure mechanism of thevalve should not have a significant influence on the comparison of the systolicfluid-dynamic quantities. Moreover, we assumed a rigid aortic wall. Again, thissimplifying hypothesis has been justified by observing that the description ofthe interaction between blood and vessel should not influence the comparisonperformed in this work.
4.2 Abnormal fluid-dynamics induced by a bicuspid configura-
tion
As highlighted in the Introduction, the fluid-dynamics in the ascending aortain presence of a non-stenotic bicuspid aortic valve is very different from the onedeveloping in a TAV configuration. In particular, BAV configurations are charac-terized by a pronounced asymmetry of the systolic jet entering the aorta, whichgenerates large zones of flow reversal, high WSS at the sino-tubular junction andmid-ascending aorta, and, often, systolic helicoidal patterns. The computationalstudies mentioned above described such abnormalities. In particular, the asym-metry of the jet has been firstly reported by the results in Donal et al (2005b),where however the authors prescribed a priori the angle between the jet directionand the longitudinal axis. Then, this phenomenon has been recovered withoutany a priori imposition on the jet angle by the results in Viscardi et al (2010), Tseet al (2011), Vergara et al (2012), Faggiano et al (2013), and Pasta et al (2013),for the case without leaflets, and in Della Corte et al (2012), Marom et al (2013a)and Chandra et al (2012) in presence of the leaflets. Moreover, in vivo evidencesof flow asymmetry and sistolic helical flows has been reported in Barker et al(2012), Hope et al (2011). The abnormal maximum WSS in the ascending aortahas been reported by the results in Viscardi et al (2010) , LaDisa et al (2010),Tse et al (2011), and Pasta et al (2013), whereas the formation of flow reversalsand systolic vortices in Tse et al (2011), Chandra et al (2012), Faggiano et al(2013), and Marom et al (2013a).
4.3 Comparison among different configurations
BAV-leaflets vs BAV-no-leaflets. The computational studies mentionedabove suggested that the asymmetry of the systolic jet and the fluid-dynamicabnormalities observed in BAV configurations are provoked by two independentfactors: i) The shape of the open BAV orifice in combination with the typical
16

curvature and torsion of the ascending aorta; ii) The presence of the BAV leafletsin the open configuration, which forces the jet direction.
In this work we tried to quantify these two separate contributions. To dothis, we compared the numerical results obtained with and without the inclusionof the leaflets in BAV computational models. In particular, the comparison hasbeen performed in two real geometries of the ascending aorta, a non-dilated oneand a dilated one.
The results reported in Tables 2, 3, 4 and 5 showed that, for both pa-tients, jet asymmetry, flow reversal, formation of helicoidal patterns and WSSincrease at the systole when the leaflets are modeled. The increment of the in-dices quantifying the abnormal flow observed when the leaflets are included inthe computational models could be explained by observing Figure 9. In partic-ular, in this figure the systolic velocity field on a representative section locatedjust below the plane given by the endpoints of the leaflets is reported for theBAV-leaflets configuration, together with the systolic velocity field on the samesection obtained with the BAV-no-leaflets configuration. These plots highlightthat the systolic jet is confined in a small region in the BAV-leaflets case due tothe presence of the leaflets, whereas it is more spread out in the configurationwithout leaflets, since in this case the blood flowing between the valve orificeand the section at hand could diffuse in a wider region. This emphasizes the jetasymmetry (and thus the other abnormalities) in the case with leaflets at theSTJ and, in particular, at the mid-ascending aorta level. This is in agreementwith the fact that the inclusion of the leaflets produces a greater increment atthe mid-ascending aorta with respect to the STJ for the NFA and FRR indices.
These results also suggest that the inclusion of the leaflets is important todescribe the abnormal fluid-dynamics for BAV patients, especially for the non-dilated configuration (Patient 1), which presents a greater increment of the in-dices, see percentages reported in Sect. 3.1. Probably, the greater volume ofthe ascending aorta in the dilated case facilitates the formation of a pronouncedjet asymmetry also without modelling the leaflets. This induces the formationof a vortex generated by the pressure difference occurring in the dilated regionbetween the jet and the empty region. In the non dilated case, this dynamics isless pronounced and the inclusion of the leaflets becomes more influential for thegeneration of the jet asymmetry and of the other abnormalities.
BAV-leaflets vs TAV-leaflets. The comparison between the fluid-dynamicsin BAV and TAV cases has been reported in several works. We mention Hopeet al (2010, 2011); Barker and Markl (2011) among the radiological studies, Pastaet al (2013) as computational study in real geometries in presence of the leaflets,and Saikrishnan et al (2012) among the in-vitro studies.
Our results allowed to compare the fluid-dynamics in the TAV and in theBAV cases in presence of the leaflets, confirming the findings of the above works.In all the cases, the value of the indices increased notably in the BAV case. In
17

Figure 9: Velocity field on a selected section just below the endpoints of theleaflets in the BAV-leaflets configuration (left) and on the same section in theBAV-no-leaflets configuration (right).
particular, the NFA index was below 0.08 in the TAV-leaflets cases (except for avalue of 0.175 at the STJ of Patient 2) supporting the thesis of a centered flowfor TAV configurations also in presence of the leaflets. On the contrary, for theBAV-leaflets cases, it was always greater than 0.3 with a maximum of 0.45 atmid-ascending level of Patient 2. The FRR was almost always equal to 0.0%in TAV-leaflets cases with a peak of 4.49% at the STJ of Patient 2, whereasit assumed values around 10% in BAV-leaflets, demonstrating the appearanceof retrograde flow only in BAV. The PHF assumed values near 0.5 in TAV-leaflets (absence of any prevalence between right and left handed flows), whereasit increased to 0.73 for Patient 1 and 0.83 for Patient 2 in BAV-leaflets cases,denoting a clear presence of a right handed flow. Also WSS values becameat least three times greater in BAV-leaflets cases with respect to TAV-leaflets.These results highlighted that, also in presence of the leaflets, the fluid-dynamicsin presence of BAV is very different from the one with TAV, which featuresa symmetric systolic jet, very low flow reversals, and no helicoidal patterns atthe systole, thus confirming what found in previous works for the case withoutleaflets, see e.g. Vergara et al (2012).
Flow rate parametric study. Tables 6, 7, 8, 9 report the results obtainedwith a smaller flow rate prescribed at the inlet. This simulation has been carriedout to define the influence of valve leaflets in presence of a reduced flow ratedue for example to a mild aortic valve stenosis (as happens for Patient 1), acommon situations for BAV patients. In fact, clinically relevant scenarios includepatients with mildly or moderately stenotic BAV, with or without associatedascending aortic dilatation, either in natural history subject to follow-up imaginginvestigations or as result of surgical repair of regurgitant BAV (Luciani et al,2012).
Passing from the original to the lower flow rate, NFA was nearly the same
18
in BAV-leaflets, whereas it decreased substantially in BAV-no-leaflets, assumingvalues similar to those of TAV-leafletes for the original flow rate; FRR increasedin BAV-leaflets cases, whereas it remained nearly constant in BAV-no-leafletswith only one case in which it decreased; PHF, became nearly 0.5 for BAV-no-leaflets cases, indicating the loose of a prevalent helical structure, whereas inBAV-leaflets cases it decreased, however demonstrating a clear prevalence of aright handed helix; WSSmax decreased substantially for all the configurations,maintaining higher values (almost two times greater) in BAV-leaflets with respectto BAV-no-leaflets. From these results, we conclude that, in case of mild valvedysfunction only the shape of the valve orifice in combination with the particulargeometry of the ascending aorta is not able to reproduce all the abnormalities ofthe fluid-dynamics. Thus, we recommend the inclusion of the leaflets in particularin presence of small flow rates.
4.4 Do leaflets provide more reliable results?
The results reported in this work for the BAV configurations highlighted a gen-eral tendency to have more pronounced fluid-dynamics abnormalities in the casewhere the leaflets are modelled with respect to the case where the valve orificeis projected on the valve plane and the leaflets are neglected. The question nowis if leaflets inclusion gives more accurate results. Of course, our expectation isthat the model with the leaflets should provide more reliable results, since thephysical phenomenon is described in a more accurate way.
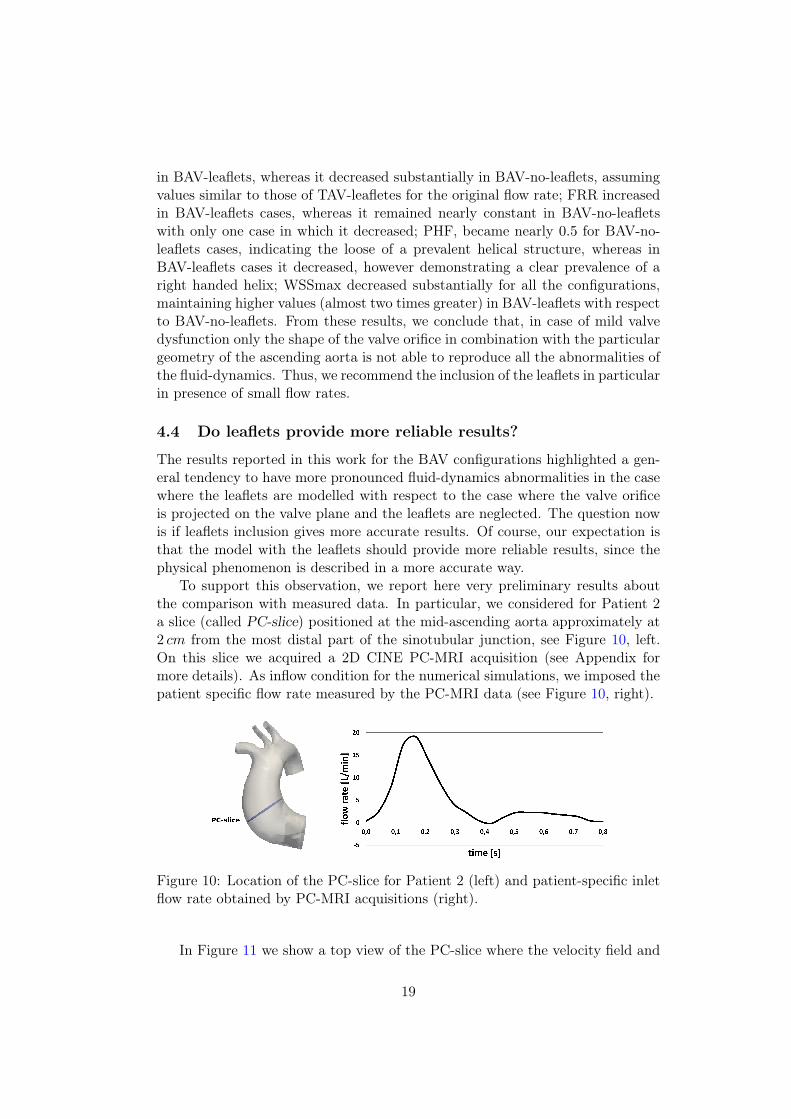
To support this observation, we report here very preliminary results aboutthe comparison with measured data. In particular, we considered for Patient 2a slice (called PC-slice) positioned at the mid-ascending aorta approximately at2 cm from the most distal part of the sinotubular junction, see Figure 10, left.On this slice we acquired a 2D CINE PC-MRI acquisition (see Appendix formore details). As inflow condition for the numerical simulations, we imposed thepatient specific flow rate measured by the PC-MRI data (see Figure 10, right).
Figure 10: Location of the PC-slice for Patient 2 (left) and patient-specific inletflow rate obtained by PC-MRI acquisitions (right).
In Figure 11 we show a top view of the PC-slice where the velocity field and
19

the h distribution are reported. We can see that both BAV models recognize thepresence of a right handed vortex, showing a pattern that is, on a qualitativelevel, very similar to the measures, especially for the model with the leaflets.
Figure 11: Velocity field (top row) and h distribution (bottom row) on the PC-slice. From left to right: BAV-no-leaflets, BAV-leaflets, in-vivo data.
In Table 10 we reported the values of NFA, FRR, and PHF obtained at thePC-slice with our BAV simulations and with the 2D CINE PC-MRI acquisition.
NFA FRR PHFBAV-no-leaflets 0.38 10.5 0.68BAV-leaflets 0.53 22.2 0.82In vivo 0.59 46.7 0.82
Table 10: Indices NFA, FRR, and PHF computed on the PC-slice.
These results showed that for all the indices there is a better agreement withthe measures when the leaflets are modeled. In particular, NFA and PHFindices are almost identical, whereas FRR index is still far from the real value.This could be ascribed to two reasons: i) the absence in our models of theinteraction with the aortic wall, producing a possible underestimation of theflow reversal due to the aortic dilatation; ii) the numerical dissipation whichtends to soften the secondary flows. Since PHF index is in good agreementwith the measures, we have a propensity to think that the main reason of thediscrepancy observed for FRR index is due to the absence of a fluid-structureinteraction model.
This comparison, although far to be a definitive validation, showed that the
20

increment observed for all the indices quantifying the fluid-dynamic abnormalitiesseems to be in the direction of a better description of the physical phenomena,thus providing a preliminary step towards a validation of our results.
5 Conclusions and Limitations
In previous work, it had been shown that the particular valve orifice shape inBAV configurations, in combination with the typical curvature and torsion ofthe aorta, was enough to reproduce the fluid-dynamic abnormalities absent inthe TAV cases. In this paper, we showed that the inclusion of the leaflets incomputational models canalizes the systolic jet, emphasizing the abnormalitiesof BAV flow, also in presence of failure. This has been proved by a preliminaryvalidation with in-vivo data. In particular, we found that the inclusion of theleaflets is recommended to describe:
• Non-dilated ascending aortas;
• Cases with a reduced flow rate (as happens for stenotic BAV);
• Fluid-dynamic abnormalities at the mid-ascending aorta level.
The first limitation of this study concerns the clinical data acquired. Indeed,we did not have available the patient-specific configurations of the leaflets. Nowa-days, with the modern image acquisition techniques it is possible to acquire thisinformation, in particular for ad hoc studies. However, common clinical proce-dures often do not allow to have the adequate spatial and temporal resolution todetect the leaflets. Then, our work could provide concrete indications for thosestudies where no patient-specific leaflets are available.
Other limitations are related to the physical and computational models cho-sen for this study. First of all we made a rigid wall assumption, thus neglectingthe interaction between fluid and aortic wall structure, and we did not consideran open/closure mechanism of the valve. As observed, this could be the causeof the significant underestimation of FRR index also in presence of the leaflets.Furthermore, we did not consider any turbulence or transition model, which isprobably necessary in the ascending aorta (see Saikrishnan et al (2014) for anexperimental study). In particular, the maximum Reynolds number characteriz-ing our simulations was 4000 for Patient 1 and 5000 for Patient 2. As discussed,we do not believe that the inclusion of these features in our computations affectsthe final conclusions of the work, since this is a comparative study. However, theimprovement of the physical and computational models will allow to obtain evenmore accurate indications about the fluid-dynamics in presence of BAV, so thatwe are working for future studies on these topics.
21

Appendix
We provide here some technical details on the 2D CINE PC-MRI acquisitionmade for Patient 2 at the PC-slice. A 1.5 Tesla system (Magnetom Symphony,Siemens Medical Systems, Erlangen, Germany) has been used. The temporalresolution was characterized by 20 phases in one cardiac cycle with a pixel res-olution of 1.17 × 1.17 mm. Velocity encoding values were chosen to optimizethe velocity map resolution with a value equal to 150 cm/s. The following pa-rameters were also used: TE (Echo Time) = 6.4 ms; flip angle = 15deg; slicethickness = 5 mm; acquisition matrix = 256× 256.
References
Atkins S, Cao K, Rajamannan N, Sucosky P (2014) Bicuspid aortic valve hemo-dynamics induces abnormal medial remodeling in the convexity of porcineascending aortas. Biomechanics and Modeling in Mechanobiology 13(6):1–17,
Avolio P (1980) Multi-branched model of the human arterial system. Medical &biological engineering & computing 18(6):709–18,
Barker A, Markl M (2011) Editorial: the role of hemodynamics in bicuspid aorticvalve disease. Eur J Cardio-thorac Surg 39(6):805–806
Barker A, Lanning C, Shandas R (2010) Quantification of hemodynamic wallshear stress in patients with bicuspid aortic valve using phase-contrast mri.Annals of Biomedical Engineering 38(3):788–800
Barker A, Markl M, BÃijrk J, Lorenz R, Bock J, Bauer S, Schulz-Menger J, VonKnobelsdorff-Brenkenhoff F (2012) Bicuspid aortic valve is associated withaltered wall shear stress in the ascending aorta. Circulation: CardiovascularImaging 5(4):457–466
Bauer M, Siniawski H, Pasic M, Schaumann B, Hetzer R (2006) Different hemo-dynamic stress of the ascending aorta wall in patients with bicuspid and tri-cuspid aortic valve. Journal of Cardiac Surgery 21(3):218–220
Billiar K, Sacks M (2000) Biaxial mechanical properties of the natural and glu-taraldehyde treated aortic valve cusp - part i: Experimental results. Journalof Biomechanical Engineering 122(1):23–30
Burman E, Fernandez M, Hansbo P (2006) Continuous interior penalty finiteelement method for oseen’s equations. SIAM Journal on Numerical Analysis44(3):1248–1274
Chandra S, Rajamannan N, Sucosky P (2012) Computational assessment of bi-cuspid aortic valve wall-shear stress: Implications for calcific aortic valve dis-ease. Biomechanics and Modeling in Mechanobiology 11(7):1085–1096
22
Conti C, Della Corte A, Votta E, Del Viscovo L, Bancone C, De Santo L, RedaelliA (2010) Biomechanical implications of the congenital bicuspid aortic valve:a finite element study of aortic root function from in vivo data. Journal ofThoracic and Cardiovascular Surgery 140(4):890–896
Della Corte A, Bancone C, Conti C, Votta E, Redaelli A, Del Viscovo L, CotrufoM (2012) Restricted cusp motion in right-left type of bicuspid aortic valves:A new risk marker for aortopathy. Journal of Thoracic and CardiovascularSurgery 144(2):360–369
Den Reijer P, Sallee D, Van Der Velden P, Zaaijer E, Parks W, RamamurthyS, Robbie T, Donati G, Lamphier C, Beekman R, Brummer M (2010) Hemo-dynamic predictors of aortic dilatation in bicuspid aortic valve by velocity-encoded cardiovascular magnetic resonance. Journal of Cardiovascular Mag-netic Resonance 12(1) DOI 10.1186/1532-429X-12-4
Donal E, Novaro G, Deserrano D, Popovic Z, Greenberg N, Richards K, ThomasJ, Garcia M (2005a) Planimetric assessment of anatomic valve area overesti-mates effective orifice area in bicuspid aortic stenosis. Journal of the AmericanSociety of Echocardiography 18(12):1392–1398
Donal E, Raud-Raynier P, Coisne D, Allal J, Herpin D (2005b) Tissue dopplerechocardiographic quantification. comparison to coronary angiography resultsin acute coronary syndrome patients. Cardiovascular Ultrasound 3(10):1–9
Faggiano E, Antiga L, Puppini G, Quarteroni A, Luciani G, Vergara C (2013)Helical flows and asymmetry of blood jet in dilated ascending aorta with nor-mally functioning bicuspid valve. Biomechanics and Modeling in Mechanobi-ology 12(4):801–813
Fedak P, Verma S, David T, Leask R, Weisel R, Butany J (2002) Clinicaland pathophysiological implications of a bicuspid aortic valve. Circulation106(8):900–904
Formaggia L, Quarteroni A, Veneziani A (2009) Cardiovascular Mathematics,Modeling and simulation of the circulatory system, vol 1. Springer
Girdauskas E, Borger M, Secknus M, Girdauskas G, Kuntze T (2011) Is aortopa-thy in bicuspid aortic valve disease a congenital defect or a result of abnormalhemodynamics? a critical reappraisal of a one-sided argument. Eur J Cardio-thorac Surg 39(6):809–815
Girdauskas E, Disha K, Borger MA, Kuntze T (2012) Relation of bicuspid aorticvalve morphology to the dilatation pattern of the proximal aorta: Focus onthe transvalvular flow. Cardiology Research and Practice DOI 10.1155/2012/478259
23

Hahn R, Roman M, Mograder A, Devereux R (1992) Association of aortic dila-tion with regurgitant, stenotic and functionally normal bicuspid aortic valves.Journal of the American College of Cardiology 19(2):283–288
Hope M, Hope T, Meadows A, Ordovas K, Urbania T, Alley M, Higgins C (2010)Bicuspid aortic valve: four-dimensional mr evaluation of ascending aortic sys-tolic flow patterns. Radiology 255(1):53–61
Hope M, Hope T, Crook S, Ordovas K, Urbania T, Alley M, Higgins C (2011)4d flow cmr in assessment of valve-related ascending aortic disease. JACC:Cardiovascular Imaging 4(7):781–787
Hope M, Sigovan M, Wrenn S, Saloner D, Dyverfeldt P (2014a) Mri hemodynamicmarkers of progressive bicuspid aortic valve-related aortic disease. Journal ofMagnetic Resonance Imaging 40(1):140–145
Hope MD, Sigovan M, Wrenn SJ, Saloner D, Dyverfeldt P (2014b) Mri hemo-dynamic markers of progressive bicuspid aortic valve-related aortic disease.Journal of Magnetic Resonance Imaging 40(1):140–145
LaDisa J, Taylor C, Feinstein J (2010) Aortic coarctation: Recent developmentsin experimental and computational methods to assess treatments for this sim-ple condition. Progress in Pediatric Cardiology 30(1-2):45–49
Luciani G, De Rita F, Lucchese G, Hila D, Rungatscher A, Faggian G, Maz-zucco A (2012) Repair of congenitally dysplastic aortic valve by bicuspidiza-tion: Midterm results. Annals of Thoracic Surgery 94(4):1173–1179
Marom G, Haj-Ali R, Rosenfeld M, SchÃďfers H, Raanani E (2013a) Aortic rootnumeric model: Annulus diameter prediction of effective height and coaptationin post-aortic valve repair. Journal of Thoracic and Cardiovascular Surgery145(2):406–411
Marom G, Kim HS, Rosenfeld M, Raanani E, Haj-Ali R (2013b) Fully coupledfluid-structure interaction model of congenital bicuspid aortic valves: Effect ofasymmetry on hemodynamics. Medical and Biological Engineering and Com-puting 51(8):839–848
May-Newman K, Yin F (1998) A constitutive law for mitral valve tissue. Journalof Biomechanical Engineering 120(1):38–47
Moireau P, Xiao N, Astorino M, Figueroa C, Chapelle D, Taylor C, Gerbeau JF(2012) External tissue support and fluid-structure simulation in blood flows.Biomechanics and Modeling in Mechanobiology 11(1-2):1–18
Nkomo V, Enriquez-Sarano M, Ammash N, Melton L, Bailey K, Desjardins V,Horn R, Tajik A (2003) Bicuspid aortic valve associated with aortic dilatation.Arteriosclerosis Thromb Vasc Biol 23(2):351–356
24

Pasta S, Phillippi J, Gleason T, Vorp D (2012) Effect of aneurysm on the me-chanical dissection properties of the human ascending thoracic aorta. Journalof Thoracic and Cardiovascular Surgery 143(2):460–467
Pasta S, Rinaudo A, Luca A, Pilato M, Scardulla C, Gleason T, Vorp D(2013) Difference in hemodynamic and wall stress of ascending thoracic aorticaneurysms with bicuspid and tricuspid aortic valve. Journal of Biomechanics46(10):1729–1738
Saikrishnan N, Yap C, Milligan N, Vasilyev N, Yoganathan A (2012) In vitrocharacterization of bicuspid aortic valve hemodynamics using particle imagevelocimetry. Annals of Biomedical Engineering 40:1760–1775
Saikrishnan N, Mirabella L, Yoganathan A (2014) Bicuspid aortic valves areassociated with increased wall and turbulence shear stress levels compared totrileaflet aortic valves. Biomechanics and Modeling in Mechanobiology DOI10.1007/s10237-014-0623-3
Schapira J, Martin R, Fowles R (1979) Two dimensional echocardiographic as-sessment of patients with bioprosthetic valves. The American Journal of Car-diology 43(3):510–519
Siddiqi K, MD K (2014) The aortopathy of bicuspid aortic valves. Controversiesin Aortic Dissection and Aneurysmal Disease 49–65
Sigovan M, Hope M, Dyverfeldt P, Saloner D (2011) Comparison of four-dimensional flow parameters for quantification of flow eccentricity in the as-cending aorta. Journal of Magnetic Resonance Imaging 34(5):1226–1230
Tse K, Chiu P, Lee H, Ho P (2011) Investigation of hemodynamics in the de-velopment of dissecting aneurysm within patient-specific dissecting aneurismalaortas using computational fluid dynamics (cfd) simulations. Journal of Biome-chanics 44(5):827–836
Vergara C, Viscardi F, Antiga L, Luciani G (2012) Influence of bicuspid valvegeometry on ascending aortic fluid dynamics: A parametric study. ArtificialOrgans 36(4):368–378
Viscardi F, Vergara C, Antiga L, Merelli S, Veneziani A, Puppini G, Faggian G,Mazzucco A, Luciani G (2010) Comparative finite element model analysis ofascending aortic flow in bicuspid and tricuspid aortic valve. Artificial Organs34(12):1114–1120
Weinberg E, Kaazempur Mofrad M (2008) A multiscale computational compar-ison of the bicuspid and tricuspid aortic valves in relation to calcific aorticstenosis. Journal of Biomechanics 41(16):3482–348
25

MOX Technical Reports, last issuesDipartimento di Matematica “F. Brioschi”,
Politecnico di Milano, Via Bonardi 9 - 20133 Milano (Italy)
49/2014 D. Bonomi, C. Vergara, E. Faggiano, M. Stevanella, C.
Conti, A. Redaelli, G. Puppini et al
Influence of the aortic valve leaflets on the fluid-dynamics in aorta in
presence of a normally functioning bicuspid valve
48/2014 Penta, R; Ambrosi, D; Shipley, R.
Effective governing equations for poroelastic growing media
47/2014 Penta, R; Ambrosi, D; Quarteroni, A.
Multiscale homogenization for fluid and drug transport in vascularized
malignant tissues
46/2014 Penta, R; Ambrosi, D.
The role of the microvascular tortuosity in tumor transport phenomena
45/2014 Pezzuto, S.; Ambrosi,D.; Quarteroni, A.
An orthotropic active-strain model for the myocardium mechanics and
its numerical approximation
44/2014 Pezzuto, S.; Ambrosi,D.
Active contraction of the cardiac ventricle and distortion of the mi-
crostructural architecture
43/2014 Brugiapaglia, S.; Micheletti, S.; Perotto, S.
Compressed solving: a numerical approximation technique for PDEs
based on compressed sensing
42/2014 Canale, A.; Vantini, S.
Constrained Functional Time Series: an Application to Demand and
Supply Curves in the Italian Natural Gas Balancing Platform
41/2014 Esfandiar, B.; Porta, G.; Perotto, S.; Guadagnini, A.
Impact of space-time mesh adaptation on solute transport modeling in
porous media
40/2014 Antonietti, P.F.; Mazzieri, I.; Quarteroni, A.
Improving seismic risk protection through mathematical modeling