Moving Model Test of High-Speed Train Aerodynamic Drag ... · range. Comparisons are conducted with...
15
RESEARCH ARTICLE Moving Model Test of High-Speed Train Aerodynamic Drag Based on Stagnation Pressure Measurements Mingzhi Yang 1 , Juntao Du 1,2 , Zhiwei Li 1 *, Sha Huang 1 , Dan Zhou 1 1 Key Laboratory of Rail Traffic Safety (Central South University), Ministry of Education, Changsha, Hunan Province, China, 2 CRRC QINGDAO SIFANG CO., LTD, Qingdao, Shandong Province, China * [email protected] Abstract A moving model test method based on stagnation pressure measurements is proposed to measure the train aerodynamic drag coefficient. Because the front tip of a high-speed train has a high pressure area and because a stagnation point occurs in the center of this region, the pressure of the stagnation point is equal to the dynamic pressure of the sensor tube based on the obtained train velocity. The first derivation of the train velocity is taken to calcu- late the acceleration of the train model ejected by the moving model system without addi- tional power. According to Newton’s second law, the aerodynamic drag coefficient can be resolved through many tests at different train speeds selected within a relatively narrow range. Comparisons are conducted with wind tunnel tests and numerical simulations, and good agreement is obtained, with differences of less than 6.1%. Therefore, the moving model test method proposed in this paper is feasible and reliable. Introduction Due to the advantages of high speed and efficiency, high-speed railways have become an important mode of transportation, drawing increasing attention worldwide [1]. According to references, worldwide high-speed railway lines will reach 0.59 million kilometers by the end of 2025. Although China started relatively recently, it has the largest rail network in the world after 10 years of development and is expected to reach a total mileage of over 0.3 million kilo- meters by the end of 2020 [2,3]. However, as train speed increases, the aerodynamic drag increases dramatically; this drag accounts for 85% of the total resistance when the train speed reaches 300 km/h [4,5]. Substan- tial resistance not only leads to high energy consumption but also demands higher require- ments of the train traction system, which negatively impacts further increases in speed [6,7]. Statistics show that 16% of the total energy consumed in the United States is used to overcome aerodynamic drag in transportation systems [8]. Baker notes that an x% reduction of a train’s aerodynamic drag can reduce fuel consumption by 0.5x% [9]. Therefore, the aerodynamic drag of the train is the main method for reducing the overall resistance and energy consump- tion of high-speed trains [10]. PLOS ONE | DOI:10.1371/journal.pone.0169471 January 17, 2017 1 / 15 a1111111111 a1111111111 a1111111111 a1111111111 a1111111111 OPEN ACCESS Citation: Yang M, Du J, Li Z, Huang S, Zhou D (2017) Moving Model Test of High-Speed Train Aerodynamic Drag Based on Stagnation Pressure Measurements. PLoS ONE 12(1): e0169471. doi:10.1371/journal.pone.0169471 Editor: Christof Markus Aegerter, Universitat Zurich, SWITZERLAND Received: August 23, 2016 Accepted: December 17, 2016 Published: January 17, 2017 Copyright: © 2017 Yang et al. This is an open access article distributed under the terms of the Creative Commons Attribution License, which permits unrestricted use, distribution, and reproduction in any medium, provided the original author and source are credited. Data Availability Statement: All relevant data are within the paper. Funding: The funding of Project of Innovation- driven Plan in Central South University (2015CX003) and Major Programs of the National Science Foundation (U1134203, U1334205) provided support for the study design, data collection and analysis; the funding of The Key Laboratory of Aerodynamics Grant (201202) provided financial support in the form of research materials; the funding of the Major Program of China Railway Engineering Corporation
Transcript of Moving Model Test of High-Speed Train Aerodynamic Drag ... · range. Comparisons are conducted with...

RESEARCH ARTICLE
Moving Model Test of High-Speed Train
Aerodynamic Drag Based on Stagnation
Pressure Measurements
Mingzhi Yang1, Juntao Du1,2, Zhiwei Li1*, Sha Huang1, Dan Zhou1
1 Key Laboratory of Rail Traffic Safety (Central South University), Ministry of Education, Changsha, Hunan
Province, China, 2 CRRC QINGDAO SIFANG CO., LTD, Qingdao, Shandong Province, China
Abstract
A moving model test method based on stagnation pressure measurements is proposed to
measure the train aerodynamic drag coefficient. Because the front tip of a high-speed train
has a high pressure area and because a stagnation point occurs in the center of this region,
the pressure of the stagnation point is equal to the dynamic pressure of the sensor tube
based on the obtained train velocity. The first derivation of the train velocity is taken to calcu-
late the acceleration of the train model ejected by the moving model system without addi-
tional power. According to Newton’s second law, the aerodynamic drag coefficient can be
resolved through many tests at different train speeds selected within a relatively narrow
range. Comparisons are conducted with wind tunnel tests and numerical simulations, and
good agreement is obtained, with differences of less than 6.1%. Therefore, the moving
model test method proposed in this paper is feasible and reliable.
Introduction
Due to the advantages of high speed and efficiency, high-speed railways have become an
important mode of transportation, drawing increasing attention worldwide [1]. According to
references, worldwide high-speed railway lines will reach 0.59 million kilometers by the end of
2025. Although China started relatively recently, it has the largest rail network in the world
after 10 years of development and is expected to reach a total mileage of over 0.3 million kilo-
meters by the end of 2020 [2,3].
However, as train speed increases, the aerodynamic drag increases dramatically; this drag
accounts for 85% of the total resistance when the train speed reaches 300 km/h [4,5]. Substan-
tial resistance not only leads to high energy consumption but also demands higher require-
ments of the train traction system, which negatively impacts further increases in speed [6,7].
Statistics show that 16% of the total energy consumed in the United States is used to overcome
aerodynamic drag in transportation systems [8]. Baker notes that an x% reduction of a train’s
aerodynamic drag can reduce fuel consumption by 0.5x% [9]. Therefore, the aerodynamic
drag of the train is the main method for reducing the overall resistance and energy consump-
tion of high-speed trains [10].
PLOS ONE | DOI:10.1371/journal.pone.0169471 January 17, 2017 1 / 15
a1111111111
a1111111111
a1111111111
a1111111111
a1111111111
OPENACCESS
Citation: Yang M, Du J, Li Z, Huang S, Zhou D
(2017) Moving Model Test of High-Speed Train
Aerodynamic Drag Based on Stagnation Pressure
Measurements. PLoS ONE 12(1): e0169471.
doi:10.1371/journal.pone.0169471
Editor: Christof Markus Aegerter, Universitat
Zurich, SWITZERLAND
Received: August 23, 2016
Accepted: December 17, 2016
Published: January 17, 2017
Copyright: © 2017 Yang et al. This is an open
access article distributed under the terms of the
Creative Commons Attribution License, which
permits unrestricted use, distribution, and
reproduction in any medium, provided the original
author and source are credited.
Data Availability Statement: All relevant data are
within the paper.
Funding: The funding of Project of Innovation-
driven Plan in Central South University
(2015CX003) and Major Programs of the National
Science Foundation (U1134203, U1334205)
provided support for the study design, data
collection and analysis; the funding of The Key
Laboratory of Aerodynamics Grant (201202)
provided financial support in the form of research
materials; the funding of the Major Program of
China Railway Engineering Corporation

The train aerodynamic drag consists of pressure drag and viscous drag. Because the length-
to-width ratio of a train ranges from 50~100, which is much larger than that of any other
ground vehicle, the aerodynamic characteristics are more complex than those of cars, trucks or
airplanes [11–13]. Full-scale field tests, model tests and numerical simulations are the main
methods used to study the aerodynamic properties of a train. The full-scale field test method
uses the coasting test principle to measure the train speed and to calculate the train resistance
indirectly; however, this method is costly and easily affected by environmental factors, making
it unsuitable for the early development and shape design phase of high-speed train
manufacturing [14]. The wind tunnel test is the most popular and important method and
offers relatively high reliability and repeatability; both domestic and international scholars
have performed experiments using this method and have obtained many achievements [15–
17]. However, because the train model is stationary and fixed on the floor, this model cannot
simulate the relative movement of the train model, the air and the surroundings. The main
problem with wind tunnel testing is how to properly simulate the ground [18–19]. Baker and
Brockie tested wind tunnels with several different ground simulation methods and found that
the measured resistance was usually more than 10% [20]. Air suction floor technology, con-
veyer belt floor technology [21,22], the double-model method with symmetric mirror deploy-
ment [23], or the screen method [24,25] are typically used to alleviate the influence of the
negative boundary layer effect on the train aerodynamic drag measurement. However, the
ground effect cannot be eliminated completely and additional facility effects may interfere
with the tunnel flow itself, decreasing the measurement accuracy.
The developed moving model test rig in which the train model runs along a track can
more accurately simulate the relative movement between the train, the ground and the sur-
roundings and has no interference from any floor boundary layer [26–28]. Currently, mov-
ing model rigs used for high-speed train aerodynamic studies are mainly located at the
Derby railway research center in the UK [29,30] and at Central South University in China.
Studies using these rigs have measured the train aerodynamic characteristics including tran-
sient pressure, micro-pressure wave and aerodynamic sound pressure level; however, none
of these studies measured the aerodynamic drag due to the rapid movement of the train
model. This paper proposes a new moving model test method to measure the train aerody-
namic drag, which will provide a new and valuable resource for studies of high-speed train
aerodynamic properties.
Test Method Principle
The test principle of the train resistance coefficient based on the moving model is similar to
the coasting experiment principle of a full-scale field test. The total resistance of the train can
be expressed using different equations, among which the Davis equation is widely accepted
and applied [23,31,32]. Generally, this equation is expressed as follows:
R ¼ Aþ BVt þ CVt2 ð1Þ
where R is the total operation resistance of the train, Vt is the train speed, and A (N), B (N�s/
m), and C (N�s2/m2) are the coefficients generally obtained from the coasting experiment. The
first term, A, is the mechanical operation resistance caused by the wheel and track friction and
is proportional to the train mass. BVt is all other mechanical resistance, including transmission
loss, brake resistance, and air momentum resistance. When a train operates normally, the cir-
culating engine heat, the cooling system, and the onboard air-conditioner all take in and dis-
charge air, causing air momentum resistance that is proportional to the train velocity. CVt2 is
the train aerodynamic drag and is proportional to the square of the train speed.
Moving Model Test of High-Speed Train Aerodynamic Drag Based on Stagnation Pressure Measurements
PLOS ONE | DOI:10.1371/journal.pone.0169471 January 17, 2017 2 / 15
(2015T002-A) and National Science Foundation
Grant (11372360) provided support for the
manuscript preparation and publication. In
addition, CRRC QINGDAO SIFANG CO., LTD,
provided support in the form of salaries for author
[JTD], but did not have any additional role in the
study design, data collection and analysis, decision
to publish, or preparation of the manuscript. The
specific role of the author is articulated in the
‘author contributions’ section.
Competing Interests: The authors have declared
that no competing interests exist. The authors are
affiliated to CRRC QINGDAO SIFANG CO., LTD.
CRRC QINGDAO SIFANG CO., LTD, does not
provide financial support for the study, and will not
use the relevant data for consultancy, patents,
products in development, or marketed products.
This does not alter our adherence to PLOS ONE
policies on sharing data and materials.
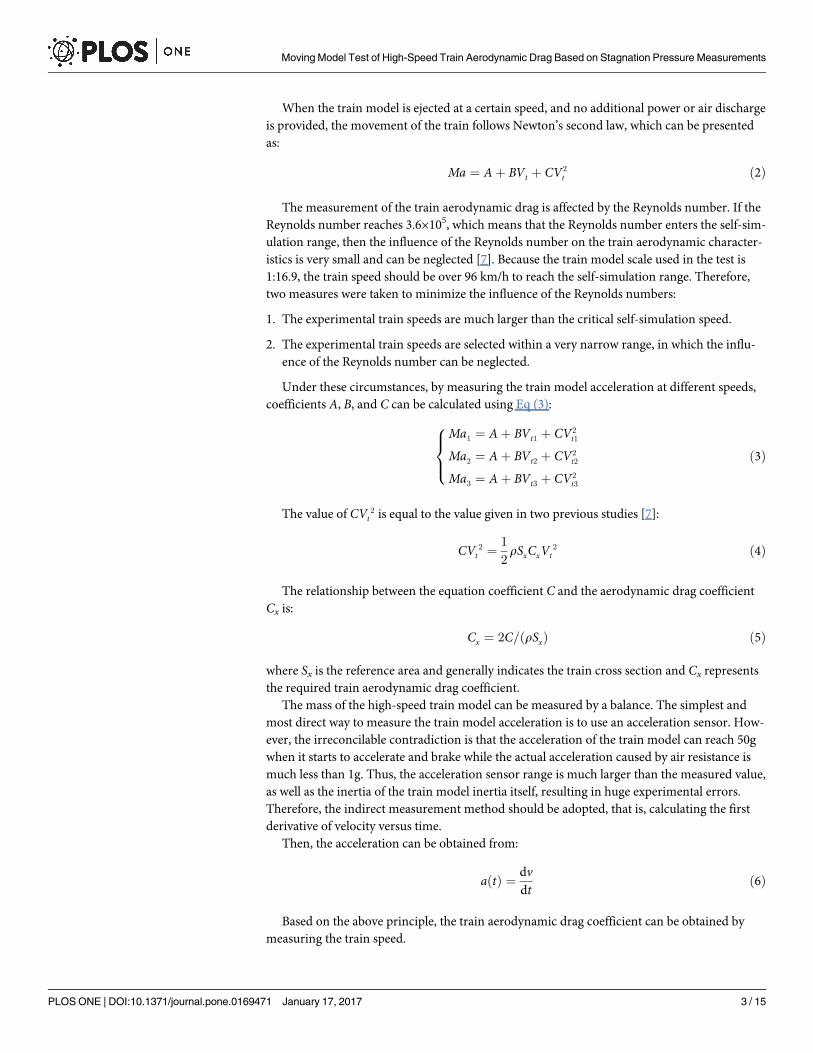
When the train model is ejected at a certain speed, and no additional power or air discharge
is provided, the movement of the train follows Newton’s second law, which can be presented
as:
Ma ¼ Aþ BVt þ CV2
t ð2Þ
The measurement of the train aerodynamic drag is affected by the Reynolds number. If the
Reynolds number reaches 3.6×10⁵, which means that the Reynolds number enters the self-sim-
ulation range, then the influence of the Reynolds number on the train aerodynamic character-
istics is very small and can be neglected [7]. Because the train model scale used in the test is
1:16.9, the train speed should be over 96 km/h to reach the self-simulation range. Therefore,
two measures were taken to minimize the influence of the Reynolds numbers:
1. The experimental train speeds are much larger than the critical self-simulation speed.
2. The experimental train speeds are selected within a very narrow range, in which the influ-
ence of the Reynolds number can be neglected.
Under these circumstances, by measuring the train model acceleration at different speeds,
coefficients A, B, and C can be calculated using Eq (3):
Ma1 ¼ Aþ BVt1 þ CV2t1
Ma2 ¼ Aþ BVt2 þ CV2t2
Ma3 ¼ Aþ BVt3 þ CV2t3
8><
>:ð3Þ
The value of CVt2 is equal to the value given in two previous studies [7]:
CVt2 ¼
1
2rSxCxVt
2 ð4Þ
The relationship between the equation coefficient C and the aerodynamic drag coefficient
Cx is:
Cx ¼ 2C=ðrSxÞ ð5Þ
where Sx is the reference area and generally indicates the train cross section and Cx represents
the required train aerodynamic drag coefficient.
The mass of the high-speed train model can be measured by a balance. The simplest and
most direct way to measure the train model acceleration is to use an acceleration sensor. How-
ever, the irreconcilable contradiction is that the acceleration of the train model can reach 50g
when it starts to accelerate and brake while the actual acceleration caused by air resistance is
much less than 1g. Thus, the acceleration sensor range is much larger than the measured value,
as well as the inertia of the train model inertia itself, resulting in huge experimental errors.
Therefore, the indirect measurement method should be adopted, that is, calculating the first
derivative of velocity versus time.
Then, the acceleration can be obtained from:
aðtÞ ¼dvdt
ð6Þ
Based on the above principle, the train aerodynamic drag coefficient can be obtained by
measuring the train speed.
Moving Model Test of High-Speed Train Aerodynamic Drag Based on Stagnation Pressure Measurements
PLOS ONE | DOI:10.1371/journal.pone.0169471 January 17, 2017 3 / 15

The Test Method
The moving model rig
The experiments were conducted on the moving model rig at Central South University in
China. As shown in Fig 1, the experimental line is a compound line with a total length of 164
m that is divided into an accelerating section, a testing section and a braking section. This
moving model system includes the experimental table, power system, acceleration system, con-
trol system, test system, brake system, data processing system, and experimental model. The
acceleration system of the moving model device uses a multi-level aerodynamic pulley acceler-
ation mechanism, which can achieve a maximum experimental speed of the moving train
model of 500 km/h [7]. To prevent electromagnetic disturbance of the onboard system and
high impact force, the moving model experimental device uses a mechanical hybrid brake to
ensure that there is no damage to the train model or test devices during deceleration and
stopping.
The train model
As shown in Fig 2, a 1:16.8 scale CRH380A high-speed train model with three coaches was
used in the moving model test. The total mass of the train model was 20.16 kg with a length of
4.64 m, a height of 0.198 m and a width of 0.220 m. The model was made of high-strength
foam using one-time modeling technology. The model has no pantographs on the top; how-
ever, windshields were placed between the inter-carriage gaps, and 3D printed bogies were
installed at the bottom of the train model, as shown in Fig 3.
The speed test system
The train aerodynamic drag is obtained indirectly by measuring the train speed and accelera-
tion. Therefore, the velocity of the train model must be measured properly.
Generally, the velocity of the train model can be measured by an external pilot tube or by
photoelectric sensors on the track side or at the bottom of the train model.
Fig 1. The moving model rig.
doi:10.1371/journal.pone.0169471.g001
Moving Model Test of High-Speed Train Aerodynamic Drag Based on Stagnation Pressure Measurements
PLOS ONE | DOI:10.1371/journal.pone.0169471 January 17, 2017 4 / 15

For the first method, external pilot tubes are set on top or in front of the train model to
measure the train speed directly. This method can collect complete information of the
dynamic velocity, but the pilot tubes themselves and their mounting brackets disturb the flow,
resulting in additional measurement errors.
The second method is to set up one row of photoelectric sensors on one side of the track
and to measure the train arrival times at each of the two sensors. Based on these measure-
ments, the average velocity in the running region are calculated. This method has no contact
with the train model and the moving model rig; thus, no interference occurs. However, it
requires large number of sensors to acquire sufficient velocity data; too many sensors will
result in shorter distances between the sensors, enlarging the errors caused by differences in
sensor installation.
The third method uses the photoelectric sensor installed at the bottom of the train model to
scan the zebra stripes laid on the track between two rails. The black and white stripes continu-
ously alternate; the white stripes reflect the infrared light back to the sensor, while the black
Fig 2. The train model.
doi:10.1371/journal.pone.0169471.g002
Moving Model Test of High-Speed Train Aerodynamic Drag Based on Stagnation Pressure Measurements
PLOS ONE | DOI:10.1371/journal.pone.0169471 January 17, 2017 5 / 15

stripes have no reflection. The sensor then converts the optical signal into an electrical signal,
generating a series of high and low continuous level pulse signals. Because the interval length
between the black and white stripes is constant, the time width of the pulse signal is measured
based on the obtained velocity. The method has the advantages of a simple structure and little
flow field disturbance; however, it requires high accuracy for the zebra stripe length and a high
contrast of the black and white colors.
Based on the characteristics of the three methods above, velocity tests based on the stagna-
tion pressure measurement are proposed in this paper because this method has little flow
interference, high accuracy and abundant data.
The front tip of the high-speed train generally has a high pressure area, and a stagnation
point occurs in the center of the region, as shown in Fig 4. The pressure p at the stagnation
point is equal to the dynamic pressure head of the sensor, which can be expressed as:
p ¼ 0:5� r� Vt2 ð7Þ
A pressure sensor is used to directly measure the stagnation pressure p; then, the velocity Vt
of the train can be calculated by:
Vt ¼ffiffiffiffiffiffiffiffiffiffiffiffiffiffiffiffiffiffiffiffiffiffip=ð0:5� r
pÞ ð8Þ
Honeywell differential pressure sensors are used in this experiment; their maximum mea-
surement range is 5000 Pa with an accuracy of 0.25% and a response frequency of 10 kHz. The
accuracy and frequency are sufficiently large to obtain the pressure information and satisfy the
requirements of the experiment.
Measuring the stagnation pressure is similar to measuring the surface pressure in a wind
tunnel. As shown in Figs 4 and 5, a hole with a diameter of 1.5 mm is opened at the stagnation
point of the train head along the normal direction to the model surface. A hollow plastic tube
with an outer diameter of 2.0 mm and an inner diameter of 1.0 mm goes through the hole with
glue on the surface. One end of the tube maintains the same smoothness as the external surface
of the train model, and the other end is connected to the differential pressure sensor. Because
too long of a plastic tube will increase the response time, distorting the relationship between
pressure and time, the plastic tube should be as short as possible to satisfy the sensor installa-
tion requirements for measuring the instantaneous pressure.
Fig 3. The 3D printed bogie.
doi:10.1371/journal.pone.0169471.g003
Moving Model Test of High-Speed Train Aerodynamic Drag Based on Stagnation Pressure Measurements
PLOS ONE | DOI:10.1371/journal.pone.0169471 January 17, 2017 6 / 15

The other side of the differential pressure sensor is connected to the reference pressure,
which is generally a large, sealed container with a constant pressure. Because the models used
in the experiment are too small to use a large container, a sealed, hard plastic tube is used
instead. The sealed tube is approximately 5~10 cm long and is fixed vertically on the inner wall
of the train model, perpendicular to the moving direction of the train. The direction of the ref-
erence pressure tube must not be parallel to the moving direction; in this case, the excessive
inertia force generated by the instant acceleration of the train would cause violent fluctuations
of the air inside the plastic tube, resulting in large measurement errors.
The differential pressure sensor should follow a similar installation principle and be placed
on the inner surface of the train model. If restricted by geometry, the metal beam of the train
body could be an alternative location for installing the sensor. However, because the metal
beam and the wheel have a hard connection, the train vibrations will pass directly to the metal
beam of the train body and to the sensor. Therefore, soft glue should be used to fasten the sen-
sor onto the metal beam to reduce the effect of train vibration.
The sensor converts pressure signals to electric signals in real time, and the electric signals
are transmitted to the signal collection board through the data line of the sensor and are then
stored in the collection board. The stored signals are transmitted via cables to computers and
are finally analyzed. The sensor, data acquisition system and storage system were all installed
inside the train model, so that the interference of the whole system to the flow field can be
neglected.
Fig 4. Stagnation point.
doi:10.1371/journal.pone.0169471.g004
Moving Model Test of High-Speed Train Aerodynamic Drag Based on Stagnation Pressure Measurements
PLOS ONE | DOI:10.1371/journal.pone.0169471 January 17, 2017 7 / 15

Results and Discussions
Results of train velocity and acceleration
Fig 6 shows the stagnation pressure curve of the train model moving in the experimental sec-
tion at a speed of 250 km/h. Due to the existence of train aerodynamic drag and wheel-rail fric-
tion drag, the velocity of the train model decreases as the train moves along the track without
power. According to Eq (7), the stagnation pressure of the train model decreases with the run-
ning time, as shown in Fig 6.
Fig 5. Stagnation pressure test system.
doi:10.1371/journal.pone.0169471.g005
Fig 6. Stagnation pressure of the train.
doi:10.1371/journal.pone.0169471.g006
Moving Model Test of High-Speed Train Aerodynamic Drag Based on Stagnation Pressure Measurements
PLOS ONE | DOI:10.1371/journal.pone.0169471 January 17, 2017 8 / 15

Based on Eq (8), the velocities of the train model are calculated and shown in Fig 7. As
shown in the figure, both the velocity and the stagnation pressure decrease linearly over time.
Fitting the velocity curve in Fig 7, Eq (9) is obtained to express the relationship between the
train velocity and time, and a good correlation of 0.9983 is obtained.
Vt ¼ � 3:0665t þ 70:083 ð9Þ
The first derivative is taken to Eq (9) to obtain the train acceleration, which can be
described as:
a ¼ dVt=dt ¼ � 3:0665 ð10Þ
To avoid data variability and to ensure reliability, repeatability tests were conducted.
Table 1 lists the initial velocity and the calculated acceleration values of 10 tests at train speeds
ranging from 200 km/h to 250 km/h. The average value, standard deviation and relative stan-
dard deviation are analyzed and shown in Table 2. The relative standard deviations of the ini-
tial speed and the acceleration are 0.68% and 2.27% for the initial speed and acceleration,
respectively, which satisfy the engineering requirements. The results show that the test method
is reliable and has a high measurement accuracy.
Because the power of the moving model test system is provided by a rubber rope and
because the elastic force of the rope is affected by temperature and motion state, the velocity of
the train model may not be exactly match the intended velocity. If the initial speed of the train
is 250 km/h, multiple measurements and analyses should be performed to obtain the actual
acceleration of the train model at a speed of approximately 250 km/h. Fig 8 gives the relation-
ship between the train speed and acceleration; this curve shows that the acceleration increases
Fig 7. Velocity of the train.
doi:10.1371/journal.pone.0169471.g007
Table 1. Repeatability tests.
Measurement Times 1 2 3 4 5 6 7 8 9 10
Velocity (m/s) 70.08 68.96 69.55 69.34 69.70 69.35 69.64 69.58 69.52 70.33
Acceleration (m/s2) 3.07 2.90 3.09 3.07 2.96 3.06 3.04 3.01 2.91 3.08
doi:10.1371/journal.pone.0169471.t001
Moving Model Test of High-Speed Train Aerodynamic Drag Based on Stagnation Pressure Measurements
PLOS ONE | DOI:10.1371/journal.pone.0169471 January 17, 2017 9 / 15

gently and slowly with speed. The regression function of the fitted acceleration can be pre-
sented as:
a ¼ 0:0884Vt � 3:1366 ð11Þ
The acceleration of the train model at a speed of 250 km/h can be calculated as 3.002 m/s2
using Eq (11). The acceleration of the train model at different train speeds can be calculated
similarly.
Results of the train aerodynamic drag coefficient
The accelerations of the train model at speeds of 240 km/h, 250 km/h and 260 km/h are
obtained using the method proposed in this paper, as shown in Table 3.
For the 1:16.8 scale CRH380A train model used in the test, the total mass is 20.16 kg, and
the reference area Sx is 0.0394 m2. Using these parameters in Eq (3), the resistance of the train
can be expressed as:
R ¼ 19:51027þ 0:00333Vt þ 0:008456Vt2 ð12Þ
According to Eq (5), the aerodynamic drag coefficient of the train model can be calculated
as Cx = 0.3504.
Results verification
To verify the reliability of the method proposed in this paper, the aerodynamic drag coefficient
obtained from the moving model test is compared with results from a wind tunnel test and a
numerical simulation.
Table 2. Velocity and acceleration standard deviations.
Average Value Standard Deviation Relative Standard Deviation
Velocity (m/s) 69.604 0.384 0.55%
Acceleration (m/s2) 3.018 0.069 2.27%
doi:10.1371/journal.pone.0169471.t002
Fig 8. Relationship between the train speed and acceleration.
doi:10.1371/journal.pone.0169471.g008
Moving Model Test of High-Speed Train Aerodynamic Drag Based on Stagnation Pressure Measurements
PLOS ONE | DOI:10.1371/journal.pone.0169471 January 17, 2017 10 / 15

The wind tunnel test was conducted in the wind tunnel in the low-speed aerodynamic insti-
tute of the China Aerodynamics Research & Development Centre. As shown in Fig 9, the cross
section of the experimental section is 8 m × 6 m, with a length of 15 m, and the wind speed in
the tunnel can reach 20~70 m/s. A turntable was placed in the middle of the floor to perform
experiments under different wind angles. The front and back edges of the floor are designed
with a streamlined shape to minimize flow interference.
A 1:8 scale CRH380A train model consisting of 3 coaches was placed in the middle of the
floor, as shown in Fig 10. The aerodynamic drag was measured by a six-component balance
that was installed at the bottom of the train model, with one side of the balance fixed to the
screen floor by a pole, as shown in Fig 11.
In addition, numerical simulations were conducted under different ground wall conditions.
As shown in Fig 12(a), the train model is at 1:8 scale and consisted of three coaches. Taking the
train height H as the characteristic dimension, the computational field velocity inlet is 20Haway from the train head nose, and the pressure outlet is 50H away from the train tail nose.
The width and height of the domain are 24H and 24H, respectively. Fixed wall and moving
wall boundary conditions were given to the bottom surface to analyze the influence of the
ground effect. Both side surfaces and the upper surface were set as symmetry planes to elimi-
nate the boundary influence.
In this case, a structured grid was built, and the total mesh had 30 million elements. The
first layer thickness was 0.5 mm, as shown as Fig 12(b), meaning that the non-dimensional
Table 3. Accelerations at different train speeds.
Train Model Velocity (km/h) Acceleration (m/s2)
CRH380A 240 2.8340
250 3.0020
260 3.1675
doi:10.1371/journal.pone.0169471.t003
Fig 9. Experimental section of the wind tunnel.
doi:10.1371/journal.pone.0169471.g009
Moving Model Test of High-Speed Train Aerodynamic Drag Based on Stagnation Pressure Measurements
PLOS ONE | DOI:10.1371/journal.pone.0169471 January 17, 2017 11 / 15

grid thickness fell the range of 30~300. Therefore, the Detached Eddy Simulation model was
used to simulate the aerodynamic performance of the CRH380A high-speed train.
Table 4 shows that the results obtained from the moving model test were 6.1% larger than
those of the wind tunnel test. This difference is mainly because the train model is stationary on
the fixed floor of the wind tunnel, and the fixed floor generates ground effects. These ground
effects change the flow field structure at the bottom and rear of the train model, decreasing the
Fig 10. Train model in the tunnel.
doi:10.1371/journal.pone.0169471.g010
Fig 11. The six-component balance.
doi:10.1371/journal.pone.0169471.g011
Fig 12. Computational domain and mesh.
doi:10.1371/journal.pone.0169471.g012
Moving Model Test of High-Speed Train Aerodynamic Drag Based on Stagnation Pressure Measurements
PLOS ONE | DOI:10.1371/journal.pone.0169471 January 17, 2017 12 / 15

train aerodynamic drag. In addition, the wind tunnel test uses a six-component balance, and
the support poles for the balance also affect the aerodynamic drag. Finally, the vibration of the
model train creates additional errors. The difference in the test results is consistent with the
conclusion that different types of wind tunnel ground simulation methods cause no more than
10% of the resistance error [20]. For the numerical simulation method, the results from the
moving wall condition are very close to those of the moving model test, while the results from
the fixed wall condition are close to those of the wind tunnel test. This finding further verifies
the influence of ground effects and shows the advantage of the moving model test method pro-
posed in this paper.
Conclusions
According to the formation mechanism of high-speed train resistance, a new moving model
test method based on stagnation pressure measurement is proposed to obtain the aerodynamic
drag coefficient of the train. Because a stagnation point occurs in front of the nose of the train
model and because the pressure at the stagnation point is equal to the dynamic pressure of the
sensor, the velocity can be calculated; then, the first derivation can be taken to obtain the train
acceleration. Based on Newton’s second law, the aerodynamic drag coefficient can be resolved
using the accelerations at different train speeds. Compared to the traditional wind tunnel
method, this method has two apparent advantages. First, this method can simulate the real rel-
ative movement between the train, air and ground, avoiding the influence of the ground effect
on the aerodynamic drag measurement. Second, the test and acquisition systems are all
installed inside the train model, so no flow interference occurs. Comparisons are also con-
ducted with wind tunnel tests and numerical simulations, and good agreement is obtained;
therefore, the method proposed in this paper is reliable and effective. Developing and improv-
ing this method will provide a new and effective method for train shape optimization and drag
reduction.
Acknowledgments
This research was supported by the Project of Innovation-Driven Plan in Central South Uni-
versity (2015CX003), the National Science Foundation Grant (11372360), Major Programs of
the National Science Foundation Grant (U1134203, U1334205), Major Program of China Rail-
way Engineering Corporation (2015T002-A), and the Key Laboratory of Aerodynamics Grant
(201202). The authors acknowledge the generous support of the Key Laboratory of Traffic
Safety on Track, Central South University for providing the full-scale field experiment data.
Author Contributions
Conceptualization: MZY JTD.
Data curation: MZY JTD.
Table 4. Results of different experimental methods.
Methods Cx Difference %
Wind tunnel test 0.330 /
Numerical simulation Fixed wall 0.316 -4.2
Moving wall 0.352 6.6
Moving model test 0.350 6.1
doi:10.1371/journal.pone.0169471.t004
Moving Model Test of High-Speed Train Aerodynamic Drag Based on Stagnation Pressure Measurements
PLOS ONE | DOI:10.1371/journal.pone.0169471 January 17, 2017 13 / 15

Formal analysis: JTD SH ZWL DZ.
Funding acquisition: MZY.
Investigation: MZY JTD ZWL.
Methodology: MZY JTD ZWL.
Project administration: MZY.
Resources: MZY.
Software: MZY ZWL.
Supervision: MZY.
Validation: MZY.
Visualization: MZY DZ.
Writing – original draft: ZWL.
Writing – review & editing: ZWL.
References1. Takagi R, Dong W. Reviewer of high-speed railway development in recent decades. Western. Technol-
ogy. 2005; 4: 44–58.
2. Shen Z. High-speed train and key technology. Academic Dynamic Report. 1997; 3: 5–14.
3. Shen Z. The superiorities innovatively developing high-speed train technology in China. Science
(China). 2012; 57: 594–599.
4. Gawthorpe R. G.. Aerodynamics of trains in the open air. Railway Engineer International 1978; 3: 7–12.
5. He Q. Some mechanical problems in high speed railways. Science Foundation of China. 1994; 3: 30–
232.
6. Lu G. The aerodynamics points of high-speed trains. Railway Vehicles. 2006; 44: 1–3, 44.
7. Tian H. Train aerodynamics. Beijing: China Railway Press; 2007. pp. 160–161.
8. Wood RM. Aerodynamic drag and drag reduction: energy and energy savings. AIAA Research Paper
2003–0209. Reno, NV: American Institute of Aeronautics and astronautics; 2003.
9. Baker C. J. Fact and friction. Technology Update. 1983: 86–88.
10. Peters JL. Aerodynamics of very high speed trains and maglev vehicles: state of the art and future
potential. Int J Vehicle Des. 1983; 3: 308–413.
11. Baron A, Mossi M, Sibilla S. The alleviation of the aerodynamic drag and wave effects of high-speed
trains in very long tunnels. J Wind Eng Ind Aerodynamics. 2001; 89: 365–401.
12. Schober M, Weise M, Orellano A, Deeg P, Wetzel W. Wind tunnel investigation of an ICE3 end car on
three standard ground scenarios. J Wind Eng Ind Aerodynamics. 2010; 98: 345–352.
13. Hemida H, Gil N, Baker C. LES of the slipstream of a rotating train. J Fluids Eng. 2010; 132: 1031–
1039.
14. Lukaszewicz P. A simple method to determine train running resistance from full-scale measurements. P
I Mech Eng F. J Rai 2007; 221: 331–337.
15. Maeda T, Kinoshita M, Kajiyama H, Yanemoto K. Aerodynamic drag of Shinkansen electric car (series
0, series, 200, series 100). Railway Technical Research Institute, Quarterly Reports 1989;30: 48–56.
16. Ido A, Iida M, Maeda T. Wind tunnel tests for nose and tail of train. RTRI JNR. 1993;7: 7.
17. Chen Y, Zhang J. Study of the high speed train aerodynamic drag. China Railway. 1998; 2: 43–47.
18. Schetz JA. Aerodynamics of high speed trains. Annu Rev Fluid Mech. 2001; 33: 371–414.
19. Willemsen E. High Reynolds number wind tunnel experiments on trains. J Wind Eng Ind Aerodynamics.
1997; 69–71: 437–447.
20. Baker CJ, Brockie NJ. Wind tunnel tests to obtain train aerodynamic drag coefficients: Reynolds num-
ber and ground simulation effects. J Wind Eng Ind Aerodynamics. 1991; 38: 23–28.
Moving Model Test of High-Speed Train Aerodynamic Drag Based on Stagnation Pressure Measurements
PLOS ONE | DOI:10.1371/journal.pone.0169471 January 17, 2017 14 / 15

21. Kwon H, Park Y, Lee D, Kim M. Wind tunnel experiments on Korean high-speed trains using various
ground simulation techniques. J Wind Eng Ind Aerodynamics. 2001; 89: 1179–1195.
22. Ido A, Kondo Y, Matsumura T, Suzuki M, Maeda T. 2001. Wind tunnel tests to reduce aerodynamic
drag of trains by smoothing the under-floor construction. Quarterly Report of RTRI. 2001; 42: 94–97.
23. Brockie NJW, Baker CJ. The aerodynamic drag of high speed trains. J Wind Eng Ind Aerodynamics.
1990; 34: 273–290.
24. Golovanevskiy VA, Chmovzh VV, Girka YV. On the optimal model configuration for aerodynamic
modeling of open cargo railway train. J Wind Eng Ind Aerodynamics. 2012; 107–108: 131–139.
25. Kwon H, Nam S, You W. Wind tunnel testing on crosswind aerodynamic forces acting on railway vehi-
cles. J Fluid Sci Technol. 2010; 5: 56–63.
26. Pope CW. The simulation of flows in railway tunnel using 1/25th scale moving model facility. 7th Interna-
tional Symposium on the Aerodynamics and Ventilation of Vehicle Tunnels; 1991. pp. 48–56.
27. Humphreys ND, Baker CJ. Forces on vehicles in cross winds from moving model tests. J Wind Eng Ind
Aerodynamics. 1992; 44: 2673–2684.
28. Sun PP. Research on aerodynamic drag reduction of high-speed train with non-smooth surface. Zhej-
ing: Zhejiang University. 2012.
29. Johnson T, Dalley S. 1/25 scale moving model tests for the trans-aero project. In: Schulte-Werning B,
Gregoire R, Malfatti A, Matschke G, editors. Transaero-a European initiative on transient aerodynamics
for railway system optimization. Berlin: Springer; 2002. pp. 123–135.
30. Miao X, Li M, Yao Y, Huang Z, Deng Y. Wind tunnel test investigation on the shape optimization of head
car of the high speed train. Journal Railway Science and Engineering. 2012; 9: 94–98.
31. Rochard BP, Schmid F. A review of methods to measure and calculate train resistances. P I Mech Eng
F. J Rai. 2000; 214: 185–199.
32. Schetz JA. Aerodynamics of high-speed trains. Annu Rev Fluid Mech. 2001; 33: 371–414.
Moving Model Test of High-Speed Train Aerodynamic Drag Based on Stagnation Pressure Measurements
PLOS ONE | DOI:10.1371/journal.pone.0169471 January 17, 2017 15 / 15