Moving from Private to Public Ownership: Selling Out to...
39
Moving from Private to Public Ownership: Selling Out to Public Firms vs. Initial Public Offerings* Annette Poulsen a and Mike Stegemoller b a Terry College of Business, University of Georgia, [email protected], (706) 542-3645 b Rawls College of Business, Texas Tech University, [email protected], (806) 742-3338 September 2006 JEL Classification: G34, G32 Keywords: initial public offerings, sellouts, going public, acquisitions * We thank Thomas Chemmanur, Jeff Coles, Laura Field, Kathleen Fuller, Radhakrishnan Gopalan, Randy Heron, Tim Jenkinson, Jim Linck, Michelle Lowry, Sandy Klasa, David Mustard, Lance Nail, Debarshi Nandy, Jeff Netter, Bill Petty, Gordon Phillips, Luc Renneborg, Kristian Rydqvist, and Jeffrey Zwiebel for their many helpful comments. In addition, we appreciate seminar comments at the University of Georgia, Texas Tech University, Texas A&M University, the 2004 Corporate Governance Conference at the University of Texas, the 2004 Financial Management Association Meetings, the 2005 European Finance Association Meetings, the 2005 Amsterdam Center for Law and Economics conference on the Ownership of the Modern Corporation, and the 2006 American Finance Association Meetings.
-
Upload
trinhthuan -
Category
Documents
-
view
215 -
download
1
Transcript of Moving from Private to Public Ownership: Selling Out to...

Moving from Private to Public Ownership: Selling Out to Public Firms vs. Initial Public Offerings*
Annette Poulsena and Mike Stegemollerb
aTerry College of Business, University of Georgia, [email protected], (706) 542-3645 bRawls College of Business, Texas Tech University, [email protected], (806) 742-3338
September 2006
JEL Classification: G34, G32 Keywords: initial public offerings, sellouts, going public, acquisitions * We thank Thomas Chemmanur, Jeff Coles, Laura Field, Kathleen Fuller, Radhakrishnan Gopalan, Randy Heron, Tim Jenkinson, Jim Linck, Michelle Lowry, Sandy Klasa, David Mustard, Lance Nail, Debarshi Nandy, Jeff Netter, Bill Petty, Gordon Phillips, Luc Renneborg, Kristian Rydqvist, and Jeffrey Zwiebel for their many helpful comments. In addition, we appreciate seminar comments at the University of Georgia, Texas Tech University, Texas A&M University, the 2004 Corporate Governance Conference at the University of Texas, the 2004 Financial Management Association Meetings, the 2005 European Finance Association Meetings, the 2005 Amsterdam Center for Law and Economics conference on the Ownership of the Modern Corporation, and the 2006 American Finance Association Meetings.

Moving from Private to Public Ownership: Selling Out to Public Firms vs. Initial Public Offerings*
Abstract:
We study the movement of assets from private to public ownership through two alternative
means: the acquisition of private companies by firms that are public (sellouts) or by initial public
share offerings (IPOs). We consider firm-specific characteristics for 1,074 IPOs and 735 sellouts
from 1995 through 2004 to identify differences in growth, capital constraints, and asymmetric
information between the two types of transactions. Our results suggest that firms move to public
ownership through an IPO when they have greater growth opportunities, and face more capital
constraints. Previous analyses of U.S. companies have focused on broad aggregate and industry-
level trends while our work allows a better understanding of the firm-specific characteristics
leading to firms choosing to go public through an IPO and the costs of accessing the public
capital markets.

Takeovers of private firms by publicly traded firms (sellouts) and initial public offerings
(IPOs) are two methods through which privately owned assets move to public ownership. These
transactions are comparable since they represent significant shifts in ownership structure, a
channel for raising capital, and a means of liquidation for owners. However, there are important
differences between the transactions. Most fundamentally, in an IPO the firm continues to exist as
a separate entity (although now owned by public shareholders) and in a sellout the control of the
assets moves to another public firm. In addition, the structures of the transactions that move the
assets to public ownership are different – sellouts need not access the costly IPO process.
In this research, we consider the factors that determine the mechanism through which a
firm moves to public status after the firm has decided to access the public equity market. Most
closely related to our study, Brau, Francis and Kohers (2003) report that IPOs are more likely
under macroeconomic conditions such as a relatively high cost of debt and a “hotter” IPO market
and industry characteristics such as in industries that are more highly concentrated and more
high-tech, while sellouts are more likely in higher market-to-book industries and highly leveraged
industries. In our analysis, we extend Brau, Francis, and Kohers by analyzing firm-specific
factors that might be important in the decision of how to access public equity markets.
More recently, Bayar and Chemmanur (2006) theoretically model the choice of exit
strategy by entrepreneurs and venture capitalists and find the probability of success in the product
market as a stand-alone firm and the amount of information asymmetry between the insiders and
IPO market investors or potential acquirers to be key drivers in the exit decision. They also
suggest that synergies with the acquirer, the relative bargaining power of the private firm and the
potential acquirer, and the presence of venture capitalists will affect the decision.
Our work extends this research empirically by considering firm-specific factors (i.e.,
growth opportunities, financial constraints, and asymmetric information in firm valuation) that
are associated with the method chosen to move assets from private to public status. Overall, our
results illustrate the importance of firm-specific growth opportunities and market valuation in
1

determining whether the firm goes public through an IPO rather than a sellout. We also find that
IPO firms are subject to more capital constraints than sellout firms are. In addition, we find mixed
results regarding the degree that IPO firms have characteristically lower asymmetric information
costs.
We identify 1,074 IPOs from 1995 through 2004 and compare those firms to 735 sellout
firms identified for the same period in our analysis. As a robustness check, we also create a
matched subsample, drawn from the full sample, of IPOs and sellouts, matched by the book value
of assets, industry, and period. In addition, we distinguish between venture capital-backed and
non-venture capital-backed firms. Venture capital firms may have the most experience in
choosing the optimal method of going public and may be more willing to consider alternatives
than owners making a one-time decision. See, e.g., Black and Gilson (1998) for a discussion of
venture capital firm exit strategies. Thus, the venture-capital sample provides an alternative
setting in which to examine the determinants of transition method.
Earlier work examining IPO volume and the IPO versus sellout decision has relied
primarily on aggregate or industry data. Instead, we collect firm-specific data from SEC filings
for private firms undertaking an IPO and from public acquirers in the takeovers of private firms.
These data allow us to directly compare and consider the factors that determined the method of
moving to public ownership. The two samples are comparable in average, median, and aggregate
size. The average, median and total size of sample sellouts is $244 million, $127 million, and
$179 billion, respectively. For IPOs, these measures are $412 million, $171 million, and $442
billion. While data availability limits our ability to consider many smaller sellout firms, our focus
on larger sellouts is interesting since it is in firms of this size that there is the largest variation in
method of transition. Smaller firms are disproportionately involved in sellouts while larger firms
can consider alternatives methods of transition to public ownership.
The remainder of the paper begins with a background discussion of the relevant literature
on IPOs, sellouts, and venture capital in section I. We develop our testable hypotheses in section
2

II. Section III discusses sample selection and descriptive statistics of transitioning firms. The
results of our empirical tests are in section IV and section V contains concluding remarks.
I. Background A fundamental decision when private firms move to public ownership is whether to do so
through an IPO or sellout. A recent Wall Street Journal (Grimes, 2004) story begins:
IPO or sale? Sale or IPO? These days many young companies that seemingly are ready to go public through stock offerings are instead surprising the market and agreeing to be bought by other companies, making the potential IPO moot. It’s a “bird in hand” strategy that is spreading its wings.
When Viewstar Corporation, one of our sample sellouts, decided to forego an IPO in lieu
of a sellout, the firm issued the following statement by Kamran Kheirolomoom, the President and
CEO of Viewstar, illustrating a similar perspective:
Although Viewstar had planned an IPO of Viewstar Common Stock and considered it an attractive opportunity for the Viewstar shareholders, the Viewstar Board of Directors has concluded that the anticipated benefits of the proposed merger with Digital will provide a better opportunity for the shareholders to realize the full value of their investment.
Although both of these transaction types provide access to public capital markets to the
firm and its managers and investors, academic literature and the popular press focus primarily on
IPOs. It is generally stated by entrepreneurs that an IPO is the most desired form of “harvest”
(see, e.g., Kensinger, Martin, and Petty, 2000). However, Sahlman (1990) documents that more
venture-backed firms resulted in sellouts than IPOs in the 1980s (709 sellouts versus 555 IPOs).
Black and Gilson (1998) report that for 2,609 exits by venture capitalists from 1984 through
1996, 55% were by IPO and 46% were by sellout. By directly comparing IPOs to sellouts, we
better understand the underlying determinants affecting the method of transition to public
ownership.
In an IPO, a private firm generally sells off a portion of its outstanding equity, with the
previous owners retaining significant ownership and control of the public corporation. In contrast,
sellouts are transactions where a public company generally buys all of the outstanding shares of a
3

privately held firm. The regulations affecting the transaction and the costs of the transaction are
different. The costs of an IPO include initial registration with the SEC and continuing mandated
disclosures, investment banking fees, and underpricing in the initial equity sale, as discussed
below. While there are similar types of costs associated with a sellout, they are probably lower
than for an IPO since the sellout firm is incorporated into the existing regulatory obligations of
the acquirer. In addition, Chemmanur and Fulghieri (1999) show that since the public firm raises
capital from a much larger number of investors, this larger number of investors must be
convinced about the value of the firm. These costs can also lead to a reduced share price in an
IPO. However, it is also possible that an acquirer is better able to extract value from a target when
there are few potential competing acquirers, resulting in a lower price for the sellout.
For an IPO, the initial offering return is referred to as underpricing and represents a
significant cost to the issuing firm. In his analysis of IPO underpricing, Ritter (1984) reports first-
day returns to investors, frequently referred to as “money left on the table,” of 18.8% for IPOs
from 1960 through 1982. More recently, Ritter and Welch (2002) document underpricing as high
as 65% for the internet boom period of 1999 and 2000. This underpricing represents a cost to the
firm in addition to the direct costs of the stock issuance, estimated to be 11% for IPOs from 1990
to 1994 (Lee, Lochhead, Ritter, and Zhao, 1996). There is evidence of similar “underpricing” in
sellouts, though it is difficult to compare the relative magnitude of the underpricing. Fuller,
Netter, and Stegemoller (2002) report the returns to bidding firms from acquisitions of private
targets in the 1990s and find that private acquisitions result in a 2% average return to bidders for
the five days surrounding the announcement of the acquisition. Thus, there is evidence that new
shareholders in an IPO or the acquirer in an acquisition benefit from underpricing of the firm.
Both a sellout and an IPO firm benefit from access to public debt and equity markets
(through the parent in the case of the sellout), liquidity of ownership, for both managers and
investors, previously tied up in an illiquid firm, and the possibility of linking management and
employee compensation to traded securities. In addition, sellouts represent the possibility for
4

synergy between the firm and the acquirer, improving their ability to compete in the product
market (see, e.g., Bayar and Chemmanur, 2006, Bradley, Desai, and Kim, 1988, and Mulherin
and Boone, 2000). Though firms that sell their assets to public firms are able to access public
markets with generally lower regulatory costs related to the transition and may benefit from
synergies, the effects of sellouts may be less attractive in other ways. In general, management of
the selling firm loses its ability to set firm policy more after a sellout than an IPO due to the
generally greater dilution of ownership. In addition, it may be difficult to raise capital for the
sellout firm’s projects since it would be competing with other projects of the acquiring firm in
internal capital markets (Stein, 1997).
Previous research suggests that both sellout and IPO firms are profitable prior to going
public, outperforming similar firms. Matsusaka (1993) studies sellouts in the late 1960s to mid
1970s and finds that private firms undergoing a takeover are more profitable than comparison
public firms. He suggests that the transactions result from synergy considerations, not corporate
control issues. Camerlynck, Ooghe, and De Langhe (2005) examine a sample of private Belgium
firm takeovers from 1992-1994. They also find that private firms involved in sellouts are, on
average, more profitable than their industry cohort and industry- and size-matched counterparts.
Additionally, they show that these firms are highly liquid, have low leverage, and are less likely
to experience financial distress than median firms within their industry.
Similar analysis of operating performance has been performed for IPOs. Mikkelson,
Partch, and Shah (1997) and Jain and Kini (1994) report the operating performance of private
companies before and after the IPO. Both studies find that IPO firms outperform their industry
counterparts and firms that go public are doing so when they are doing relatively well. Pagano,
Panetta, and Zingales (1998) suggest that the high valuation may reflect market timing by firms
when they go public and find that firm valuation drops quickly after the IPO.
Multiples are often the basis by which firm value is assessed in the sellout and IPO
process. Koeplin, Sarin, and Shapiro (2000) analyze a set of sellouts and public takeovers from
5

1984 to 1998. They find that sellouts are valued at a 20-30% discount to similar public takeover
deals.1 However, the magnitude of the discount only holds for multiples of earnings and
disappears when we use multiples of revenues for evaluation. Kim and Ritter (1999) analyze IPO
multiples for 1992 and 1993. A comparison of the multiples from Koeplin, Sarin and Shapiro and
Kim and Ritter suggests that IPOs are valued somewhat higher than the sellout firms: the mean
(median) market-to-book multiple for an IPO is 3.5 (3.0) vs. 2.4 (1.9) for a sellout, and the IPO
price-to-sales multiple is 2.7 (2.1) vs. 1.4 (1.1) for a sellout. Lerner (1994) finds that the return to
investments in private firms that go public via an IPO is more than four times that of sellouts for
venture-backed private firms, seemingly justifying any higher valuation placed on IPOs and paid
by investors. Thus, although the difference in pre-transaction performance is small there is some
existing evidence that firms that choose to go public via an IPO are valued more highly than firms
in a sellout are.
Brau, Francis, and Kohers focus primarily on industry and macroeconomic determinants
of the sellout vs. IPO decision, including industry-related, market timing, and demand for fund
factors, in addition to deal-specific factors such as the size of the firm and the post-transaction
liquidity of the private firm owners. They find industry factors are important in that IPOs are
more likely in industries that are more concentrated, have lower market-to-book ratios and lower
debt levels. They also find that firms are more likely to go public through an IPO when the
overall ratio of IPOs to mergers is higher, the private firm is larger and when 3-month T-bill rates
are relatively high.
II. Determinants of the Choice Our work extends the analysis of Brau, Francis and Kohers by considering firm-level
measures of their suggested explanatory variables and further analyzing the role of growth,
capital needs and difficulties in valuation of the firm in determining whether a firm moves to
1 More recent work by Officer (2006) finds an average acquisition discount for stand-alone private targets of 15% from 1979 to 2003.
6

public status via an IPO or a sellout. In this section, we provide discussion on the influence of
firm characteristics on the method of transition of the firm.
A. Growth and the Need for Capital We expect the growth and capital structure characteristics of the private firm to influence
whether a firm goes public through an IPO or a sellout. A firm may range from being a capital-
starved firm with many growth opportunities, to a mature firm producing a great deal of cash
flow but having few positive net present value projects in which to invest. In an IPO, the private
firm raises public capital and allocates it to projects that management deems most important.
Lowry (2003) finds that aggregate IPO volume is correlated with measures of overall growth in
the economy. Pagano, Panetta, and Zingales (1998) find that Italian firms that choose to go public
do so after relatively high growth, though they suggest that these older firms are rebalancing their
financing rather than seeking funds for new investments. In contrast, Brau, Francis, and Kohers
find that IPO firms are more likely in industries with lower market-to-book ratios, generally an
indicator of lower growth.
The ability to raise public capital is also relevant for sellouts but in a constrained
framework. After the sellout is completed, the investment opportunities of the sellout firm must
compete with other subsidiary operations for scarce resources within the merged firm’s internal
capital market. Stein (1997) suggests that the internal capital market may enhance the value of the
overall firm as managers are able to allocate funding to winners, known as winner picking.
However, Stein also shows that these same firms may be likely to participate in “loser sticking” –
allocating funds to poorly performing projects on the basis of it being a “favorite” project. Since
sellout firms are competing in the internal capital market for funds, high-growth firms might
avoid a sellout due to the constraints imposed by that market. By undertaking an IPO, the firm
may have greater flexibility in accessing resources, especially through its new access to the equity
markets. In addition, investors in IPOs may be especially willing to invest in high-growth firms
7

making it easier to raise capital through a public sale of shares. Thus, we hypothesize that firms
with greater growth potential will go public through an IPO rather than through a sellout. We use
changes in assets, capital expenditures, and revenues as proxies for growth in our sample firms.
Since the above measures rely on more than one year of data, we also consider the impact of the
ratio of capital expenditures and R&D to assets and the market-to-book ratio of each firm in the
year preceding the transaction as additional firm-specific indicators of growth in the firm and the
demand for capital.
Myers (1984) suggests that there is a strong link between a firm’s growth options and its
capital structure. Smith and Watts (1992) and Gaver and Gaver (1993) find empirical support for
this premise. In particular, they find that public firms with more growth opportunities are more
likely to use equity financing than those firms with fewer growth opportunities. If it is true that
higher growth firms are more likely to undertake an IPO than a sellout, we would also expect to
observe less leverage in IPO firms. Brau, Francis, and Kohers (2003) find that IPO firms are more
likely to be in industries with lower debt ratios.
Thus, capital structure may be the constraint that spurs a firm to seek public financing. A
firm with positive investment projects but constrained by a large amount of debt relative to its
optimal level may raise funds for its investment projects through an issuance of public equity.
Similarly, a firm with few investment opportunities may seek to be purchased by a firm with a
larger capacity for debt, thereby reducing free cash flows and agency costs. Looking at economy-
wide factors, Brau, Francis, and Kohers (2003) find evidence that transitioning firms are more
likely to go public via an IPO when Treasury bill rates are higher though their results considering
other measures of the demand for funds are insignificantly different from zero.
Instead of relying on aggregate credit demand measures, we consider liquidity constraints
for firms within our sample in determining whether they choose to go public through an IPO or a
sellout. An IPO provides the opportunity for alternative sources of equity financing and firms that
are more capital constrained may find it preferable to go public through an IPO rather than a
8

sellout. We look at leverage (total debt scaled by assets) and cash constraints (interest expense
relative to EBITDA) of the firms in our sample to determine if capital structure and liquidity
constraints affect the decision to go public through an IPO or a sellout.
B. Asymmetric Information The buyer’s ability to gather and properly assess information about the firm seeking
transition may play an important role in determining the method by which a firm moves to public
ownership. Beatty and Ritter (1986) suggest that IPOs are more costly (as measured by
underpricing) when there is increased uncertainty of investors regarding the value of the IPO.
Ellingsen and Rydquist (1997) argue that firms with assets that are not easily valued by diverse
public shareholders are more likely to choose a direct sale to another firm or individual.
Subscribers to an IPO are, in general, institutional managers that do not have particular expertise
in the operational intricacies of the private firm. These managers then offer the shares to a
dispersed group of even more uninformed investors. While investment bankers and money
managers are more informed than the general investor, it is still difficult for them to value a set of
assets that have unique qualities. In contrast, another company operating in a similar environment
to the private firm would be better able to value accurately these firm-specific assets.2
Additionally, firm-specific information may retain its value only when the information is not
accessible by outside competitors, as suggested by Chemmanur and Fulghieri (1999). By keeping
information undisclosed, the private firm is able to hold a competitive advantage over other firms
in the same industry, both public and private. Undertaking an IPO exposes firm-specific
information much more than if the firm was acquired by another public company.
2 Bayar and Chemmanur (2006) suggest a similar consideration. Firms that are in the “early stage” with products that are untested against competition may prefer to sell out since the acquirer may be able to provide support to the firm in the product market (i.e., create synergies for the merged firms). In contrast, their model suggests “later stage” firms that are more viable against product market competition are more likely to go public.
9

We expect that firms that are more difficult to value will be more likely to use a sellout to
transition to public status.3 Firms with assets that are more easily valued by dispersed public
shareholders are more likely to choose an initial public offering. However, we note that this
hypothesis may be difficult to measure empirically. For example, high-growth firms are generally
considered firms in which it is difficult to identify the future prospects of the firm. Since we
expect high-growth firms to be more likely to use equity markets to finance that growth, as noted
in the previous section, the two hypotheses suggest opposite empirical predictions. In addition to
growth, however, we offer several alternative measures of information availability including the
amount of intangible assets, whether the firm is in the development stage, whether there is
venture capital backing of the firm, the size of the firm and the profitability of the firm. We
expect that the lower the level of intangible assets, the more developed, and larger the firm, and
the more profitable the firm, the more information there is available about the firm’s operations
and prospects. We also expect that venture capital backing will provide additional information
about the firm’s prospects.
III. Sample Information We select the sellout and IPO samples from Securities Data Company (SDC) databases
on U.S. Mergers & Acquisitions and U.S. Global New Issues, respectively. Dates are restricted to
1995 – 2004 for the announcement date of sellouts and the issue date of IPOs. This period has
several advantages. These ten years represent a substantial variation in the activity of IPO and
takeover markets. There are numerous transactions in many different industries, allowing us to
examine the breadth of the market in our analysis. In addition, the Securities and Exchange
3 From a different perspective, Zingales (1995) argues that IPOs can give managers of private firms a means to establish a market value of the company before liquidating their position. Field and Mulherin (2003) show that IPOs are followed by a higher rate of takeover in the few years following the transaction than other publicly traded firms. We do not confirm this pattern in our matched sample; by the end of 2003, 120 of the acquirers of the sellout firms and 120 of the IPOs had been acquired or merged into another firm.
10

Commission’s EDGAR database began keeping electronic filings in 1995 for sellouts and in 1996
for IPO prospectuses, increasing data availability.4
To collect financial data on sellouts we rely on financial disclosure requirements from
two securities regulations that govern the financial reporting of private targets. The first is
regulation S-X that states that “if securities are being registered to be offered to the security
holders of the business to be acquired, the financial statements…shall be furnished for the
business to be acquired....” This required information is most often in S-4 statements filed by the
acquirer and they contain, in addition to financial data, reasons for the transaction, the
background of takeover negotiations, a description of the target business, and target ownership
and compensation data. The second means for acquiring private target data is by virtue of the
transaction being a “material” transaction to the acquirer. Rodrigues and Stegemoller (2006)
provide a summary of the requirements of acquiring firms with respect to private targets.
Depending on the transaction year and the method of payment, acquisitions that are 10% to 20%
or more of the acquirer’s total assets must file target financial statements since these transactions
meet the level of materiality as defined by the Securities and Exchange Commission. Due to these
restrictions, we limit our sample of sellouts to those deals valued at $50 million or higher. The
likelihood that a target will meet the significance measures required by the SEC, and therefore
will report the necessary financial data, drops off dramatically below this value. While this
restriction does decrease our sample size, it is unlikely that smaller firms are in a position to
consider the tradeoffs between these two transaction types.
Our sample of sellouts begins with an initial sample size of 4,801 domestic, industrial,
and private firms acquired from 1995 to 2004. From these deals, we find 1,296 transactions that
have a deal value of $50 million or more and are purchased by an acquirer listed on the NYSE,
4 We use the announcement date for the sellouts since the announcements represent essentially completed deals. In most cases, the formal completion of the deal happens within a month.
11

Nasdaq, or Amex.5 For 843 of these transactions, the deal value is 10% or more of the bidder’s
assets, satisfying the materiality requirement. From these 843, we find 735 transactions that
satisfy our data requirements and have at least one year of audited financial data for the target.
Our IPO sample is collected from SDC for U.S. industrial firms with an issue date
between 1995 and 2004. We find 2,262 issues of common stock that are subsequently listed on
the NYSE, Amex, or Nasdaq. To be comparable in size with our sellout sample we restrict the
IPO sample to those IPOs with a market value before the offering of $50 million or more. This
market value is the product of offering price and the number of shares outstanding after the IPO.
This restriction leaves 1,790 firms. We further restrict the sample by requiring the availability of
data for assets, sales, and EBITDA on Compustat in the year prior to the IPO. We are left with
1,074 IPOs.
From these firms (sellouts and IPOs), we choose a matched sample to be used in
robustness testing and for additional data analysis. After considering transactions that are within
the same Fama and French (1997) industry classification, we select only those IPOs that occur
within +/- 550 calendar days of a sellout. We also restrict IPO assets to be within 20% of the
assets of the sellout. Finally, we select the remaining IPO that is closest in asset amount to each
sellout. If we cannot find Fama-French industry matches, then we match with 2-digit SICs and
proceed as stated above. We are able to identify 425 IPO/sellout pairs.
Table I provides deal and market values for our main sample of 1,074 IPOs and 735
sellouts. The two samples are comparable in average, median and aggregate size. The average,
median, and total deal value of the sellouts in our sample is $244 million, $127 million and $179
billion, respectively. For IPOs, the same measures for the market value of the firm are $412
million, $171 million, and $442 billion. Our research is focused on larger-sized sellouts, since
5 SDC defines deal value as the total value of consideration paid by the acquirer, excluding fees and expenses.
12

these are the transactions that are most comparable to the IPO firms and have the greatest data
availability.
In Table II, we report the reasons for transition from private to public ownership as stated
in SEC filings. We were able to collect reasons for transition from 115 sellout documents,
concentrated in S4 statements, and in 856 IPO prospectuses. The discrepancy in number of filings
is due to the uniform filing requirements for IPOs and the more scarce and non-mandatory nature
of the corresponding information for sellouts. While we recognize the potential biases in these
data due to the lack of information for many firms and due to the self-reporting nature of the
responses, we believe that it is interesting to observe the managerial statements. We group the
rationale for transition into several broad categories and then further categorize the reasons
offered within those groups. Our broad categories include reasons related to access to capital and
growth, debt, payouts, marketing and personnel, and other reasons.
For IPO firms, the reasons given for transition focus mainly on the capacity of the firm to
grow. Most IPO firms mentioned the need for capital access or the desire for funding to achieve
growth through, for example, acquisitions, research and development, or capital expenditures.
IPO firms specifically cite the ability to raise working capital (65.5%), and the ability to fund
future acquisitions (36.7%), capital expenditures (34.6%), research and development (23.1%),
and general growth (8.5%). In addition, 50.5% of the IPO firms specifically mentioned the desire
to reduce debt. All of these reasons suggest that the IPO firms are more growth oriented when
compared to sellout firms.
In contrast, sellout firms place greater emphasis on liquidity, the ability of the owners to
“harvest” their initial investment, or the price paid (93.9%). While there are a significant number
of sellouts that mention growth (52.2%) or access to capital (40%), the most common reasons
offered for the sellout focuses on the value the sellers will receive for the firm, which is never
mentioned in the IPO reasons. Thus, a majority of sellouts cite a rationale related to the payout
that results from the transaction while a minority of IPO firms cite payouts and then only in terms
13

of a distribution to investors (6.4%) or in redeeming the investment of preferred stockholders
(7.8%). Sellout firms also cite synergies (80.9%) with the acquirer as a reason for the transaction,
consistent with Bayar and Chemmanur (2006), and are also more likely to mention reasons that
reflect strategic considerations, such as marketing abilities or industry conditions. A further
indication of differences in motivation is that 36.5% of sellouts mention favorable tax
consequences and 33% mention risk reduction, both reasons that are not mentioned by IPO firms.
Table III provides median and mean values for accounting, ownership and other firm-
specific variables for our full sample of sellout and IPO firms for the year preceding the
transaction. We report Wilcoxon test statistics for differences in the distribution for each median
and t-statistics for the differences in the means. Note that we are able to identify the balance sheet
and income statement items for all of the firms in both samples. However, ownership data and
other non-balance sheet items are more difficult to identify, especially for the sellout firms.
In general, the median values suggest that sellout firms are larger in terms of revenues,
assets, and earnings before interest and taxes plus depreciation and amortization (EBITDA) prior
to the transaction, though the median dollar value of the going public transaction is significantly
larger for IPO firms. In contrast, IPOs are, on average, significantly larger than sellouts in each of
these categories. This conflict between mean and median results may indicate that IPO firms are
in general less proven, younger, more growth-oriented firms, but also that the IPO sample
includes some firms that are larger and more established. The fact that IPO firms have a higher
median dollar valuation while the median asset, revenue, and EBITDA medians are lower
suggests the importance of the growth opportunities of these firms.
Sellout firms invest less in capital expenditures and research and development than IPO
firms according to both the median and mean values. Sellout firms also tend to be older than IPO
firms; the average (median) age is 15.6 (7) years for sellout firms and 10.1 (6) years for IPO
firms. Venture capitalists back 55.5% of our IPO sample versus 41.4% of our sellout sample.
While this difference is significant, it is noteworthy that there is venture backing for a large
14

portion of the sellout sample. Finally, there is, on average, a marginally significant difference in
insider ownership prior to the transaction, but as we should expect due to the nature of the
transaction IPOs maintain higher (42%) insider ownership afterwards. Overall, these data suggest
that the median sellout firm tends to be larger, somewhat older, and more established than the
median IPO firm. The median IPO firm, however, is investing more in capital expenditures and
R&D. We refer back to these descriptive statistics in the following analysis of our empirical
results.
IV. Empirical Results We first report summary data and univariate tests on our variables of interest and follow these
results with our logit regression analysis of the method of going public. While the univariate
statistics are limited in their ability to explain the choice of transition method relative to
regression analysis, they still provide an overview into the characteristics that may be important
in the decision.
A. Summary Data and Univariate Statistics Panels A and B of Table IV presents univariate statistics on different growth measures for
sellout and IPO firms. The growth rate measures (Panel A) represent the change in sales, total
assets, and capital expenditures from the fiscal year-end two years prior to the transaction relative
to the fiscal year-end prior to the IPO or sellout transaction. The data requirement for two years
before the transaction results in a significant drop in sample size – from 1074 IPOs to 555, and
from 735 sellouts to 550. We expect that firms that choose to transition to public status via an
IPO will be higher growth firms.
Prior to the going public transaction, the IPO median sales growth rate is 44.6% from
year -2 to year -1. This growth rate is significantly greater (as measured by the Wilcoxon test
statistic) than the median growth in sales experienced by sellout firms of 26.2%. Similarly, we
find the IPOs have significantly greater growth in total assets and in capital expenditures relative
15

to the sellout firms. Median asset growth for IPOs in the year prior to the transaction is 49.2%,
compared to growth in assets for sellouts of 18.8%. The median growth in capital expenditures in
the year preceding the transaction in the IPO firms is 49.3% relative to 16.3% in the sellout firms.
This evidence is consistent with our hypothesis that growth and the capital needs accompanying
that growth are important considerations in the decision to go public through an IPO.
In addition to the growth rates in Panel A, we consider expenditures on capital
improvements and research and development as alternative measures of growth (Panel B). Since
these measures are based on only one year of data, they are available for our full sample. Capital
and R&D expenditures are scaled by total assets. Median scaled capital expenditures are a
significantly different 7.9% for IPOs and 6.9% for sellouts. Likewise, the median scaled R&D is
a significantly different 8.2% for IPOs and 0.0% for sellouts. Thus, overall, our univariate results
present evidence that IPOs are more growth oriented than are sellouts.
We also consider the relation between capital structure and the method of transitioning to
public ownership, considering the impact of leverage and liquidity on this decision. Panel C of
Table IV reports differences in the debt characteristics of the firms. In the year prior to the
transition from private to public ownership, sellouts have more debt as a percentage of assets than
do IPOs. The median ratios of total debt to assets and long-term debt to assets are 65.7% and
11.6%, respectively, for sellouts and 58.6% and 7.8%, respectively, for IPOs. These differences
are significant at the 1% level. This result is consistent with IPO firms having greater growth
prospects and the capital structure literature suggesting that high-growth firms would have less
debt.
However, we are interested in whether IPO firms have reached the stage where they need
additional access to equity financing. We use a measure of cash constraints as a proxy for this
need. We say a firm is cash constrained if its interest payments are greater than cash flows, as
measured by earnings before interest, taxes, depreciation and amortization, as a measure of
capital constraints in the firm. We find that 35.3% of IPOs have interest expenses greater than
16

their EBITDA, significantly greater at the 1% level than the 28.6% in which this is true for sellout
firms. Thus, despite having less debt in general, IPO firms are more constrained in their ability to
service that debt.
In Panel D of Table IV, we report two additional measures of asymmetric information in
the private firms leading up to the time of the transition. The first is intangibles (including
goodwill, patents, etc.) scaled by total assets. Intangibles are generally difficult to value by the
market, but are perhaps more easily valued by acquiring firms with which there are synergies to
be gained. In addition, it may be easier for managers to communicate the value of the intangibles
to a small set of investors rather than a diffuse set of shareholders in an IPO. We find that the
percentage of the firm’s assets tied to intangibles is significantly greater for sellouts than IPOs, as
measured by the Wilcoxon test statistic. Although the medians are both zero, the 75th percentile is
3.6% for IPOs and 7.4% for sellouts.
We also measure information asymmetries with the percentage of firms that are in the
development stage at the time of the transaction. We classify a firm as being in the development
stage if the firm has revenues less than $500,000 or if research and development expenses are
greater than revenues. We suggest that these firms are the ones with assets which are most
difficult to value by the general investing public and which may receive a more accurate
valuation by an acquirer with asset-specific knowledge (see Officer, Poulsen, and Stegemoller
(2006)). We find no difference in the percentage of IPOs versus sellouts in the development stage
in our univariate analysis.
As noted above, it is difficult to interpret our results with respect to asymmetric
information. In many empirical studies, high-growth firms are characterized as firms with more
asymmetric information with respect to their potential projects and payoffs from those projects.
Thus, our results with respect to growth measures suggest that IPO firms may be subject to more
asymmetric information problems, while our alternative measure of intangibles to assets suggests
the opposite. In regression analysis, we include both factors to help sort out the dual effects of
17

growth and asymmetric information. Overall, the univariate results in Table IV present a general
picture suggesting that firms that choose to go public through an IPO tend to be higher growth
firms and firms that need access to non-debt sources of funding..
In Table V, we report valuation multiples as an additional measure of the value of growth
opportunities for our sample firms. In general, higher valuation multiples of either assets or
earnings is suggestive of future growth. Pagano, Panetta, and Zingales (1998) report that a firm is
more likely to go public the higher its industry’s market to book ratio, suggesting that valuation is
important in the IPO decision. Brau, Francis, and Kohers (2003), however, find that sellouts are
more likely to be the method chosen to transition when the private firm is in an industry with a
high market to book ratio. In Table V, we document the dollar amount paid for the firm as a
multiple of total assets and sales. (We do not consider multiples of earnings or cash flows due to
the problematic nature of negative values for these accounting items.) We measure the market
value of sellouts as the deal value reported by SDC. For IPOs, we use the product of the offer
price and total shares outstanding after the offer.
In Panel A, we report the valuation multiples for our full sample of firms, while in Panel
B we focus on the matched sample, where we control for industry, size and timing of the
transactions. In both the full sample and the matched sample, we find that the median market
value to book value of assets for IPOs is greater than the ratio for sellouts (significantly so for the
matched sample). In the full (matched) sample, the market value to book value of assets is 5.8
(6.4) for IPOs versus 4.3 (3.9) for sellouts, suggesting that IPOs have more growth opportunities
and therefore are valued more highly than comparable sellout firms. Confirming this observation,
the market value to sales ratio is significantly higher for both the full and matched IPO sample as
compared to the sellout sample.
In Panel C of Table V, we separate the sample into whether the firms received VC
backing or not, as identified by the SDC venture database, and consider whether the valuation
multiples differ with VC backing. Overall, we find that firms that have VC backing have
18

consistently higher valuation multiples than those firms that do not. However, the statistically
significant difference between IPO and sellout valuation disappears in both subsets. Note that the
proportion of sellout firms with VC backing (41.3% versus 55.5% of the IPO firms) is quite high
despite the general view that VC firms prefer to exit their investments via an IPO.
The ability of a firm to produce sustainable profits may have a significant impact on the
marketability of a firm to the general public and serve as another proxy for the ability of investors
to value a company. Stronger observed performance may suggest future profitability while poorer
performance could indicate uncertainty about future performance in addition to factors such as
the firm is in the development stage, may have poor management, or may be too small to benefit
from scale efficiencies. We measure pre-transaction performance with two accounting measures:
EBITDA scaled by sales (return on sales) and EBITDA scaled by total assets (return on assets),
as reported in Table VI, for both the year before the transaction and 2 years before the
transaction. Again, the sample size drops as the additional year of data is required. Both return
measures indicate that sellout firms are more profitable than IPO firms before the transaction
occurs. The median return on sales for sellouts in year -1 for the full sample is 6.5%, in contrast
to 4.3% for IPOs. Similarly, the return on assets for sellout firms in year -1 is 11.0% compared to
6.0% for IPOs. Both of these differences in medians are statistically significant. When we
consider the matched sample, controlling for industry, size, and timing considerations, we find
similar results. Again, the performance of the sellout firms is significantly better than that for the
IPOs. The results for year -2 mirror the results for year -1. Thus, the univariate profitability
results are not consistent with our hypothesis that, if profitability is a proxy for less asymmetric
information, more profitable firms will undertake an IPO.
B. Logistic Regression Analysis We use logistic regression analysis to provide an integrated analysis of the various
univariate tests provided above. We present results from our logistic regression analysis in Tables
19

VII and VIII, where the dependent variable is equal to one for IPO firms and zero for sellout
firms. The explanatory variables consider the importance of growth, capital structure, and
asymmetric information in the decision of the method of transition. In addition, we include but do
not report dummy variables for the industry of the firm and the year of the transaction to control
for fixed effects resulting from these commonalities.
The regression models in Table VII differ in the choice of the proxy variable included to
measure the growth of the firm. In regressions 1 through 3 we consider growth rates in assets,
capital expenditures, and revenues, respectively. The growth rate measures, however, result in a
reduction in sample size so they are excluded in regression 4. Regression 4 relies on the ratios of
capital expenditures to assets, the market to book ratio, and R&D to assets as the measures of
growth. While these latter two measures do not capture actual prior growth in the operations of
the firm, they represent investments in the firm that can lead to growth or expected growth as
proxied through market valuation.
In each regression, the growth measures suggest that firms with faster growth are more
likely to choose to go public through an IPO. This result confirms our hypothesis that faster
growing firms can benefit from direct access to public equity markets. It is also consistent with
Lowry’s (2003) findings that IPO volume is significantly related to overall capital demands in the
economy, as proxied by the number of new corporations and future aggregate sales growth. In
addition, the significance of the market to book ratio is consistent with earlier findings that IPO
firms tend to be in industries with high valuation ratios, though Brau, Francis and Kohers (2003)
found that sellouts were more likely than IPOs in these high valuation industries.6 Our firm-
specific data is consistent with the broader IPO literature.
6 Brau, Francis, and Kohers suggest that their result stems from managers being more willing to accept a takeover when valuations are relatively high. However, Pagano, et al., argue that managers choose to go public through IPOs when valuations are high so that they can benefit from these valuations. One possible explanation for the difference in our results is that since the Brau, et al., sample is from an earlier period (1984 to 1998) than ours (1995 to 2004), managers are better able to exploit the higher valuations through IPOS in our later sample.
20

We measure the importance of capital structure and liquidity constraints with the leverage
of the firm (total debt scaled by total assets) and an indicator variable for whether interest expense
is greater than EBITDA when interest expense is positive. We call the latter variable the
constrained cash flow indicator. We find that firms that go public through an IPO have
significantly less debt than the sellout firms. This result is consistent with the growth findings and
the capital structure proposition that high-growth firms will have less debt. However, the decision
to go public through an IPO is more closely related to the question of whether the firm has
reached its optimal debt level and further debt capacity is limited. The significantly positive
coefficient on the constrained cash flow variable suggests that the IPO firms are facing capital
constraints that could be alleviated with access to public equity markets. Thus, these results
confirm that high-growth firms in need of access to equity capital are more likely to choose to go
public through an IPO.
We consider several additional variables related to the measurement of asymmetric
information to determine if the difficulty in valuing the firm has an impact on the decision to go
public through an IPO. These proxies include the intangibles to total assets ratio, whether the firm
is in the development stage, whether the firm has VC backing, and the return on assets of the
firm. Lowry (2003) uses aggregate measures of uncertainty in the economy – abnormal returns at
earnings announcements and dispersion in analysts’ forecasts – to test the importance of
asymmetric information in determining IPO volume. She finds that IPO volume is negatively
related to these measures. Our firm-specific data for a large sample of U.S. firms provides
additional detail on this issue beyond the earlier work.
In general, the results from our alternative variables are consistent with the importance of
asymmetric information and difficulty in firm valuation in determining the method through which
the firm goes public. Firms with more intangible assets and firms in the development stage are
more likely to be involved in a sellout to a public firm than to go public through an IPO. In a
sellout, the managers of the firm are better able to provide information about the firm and, in
21

addition, the prospective buyers may be in similar industries or be able to benefit from synergies
in production. Firms with VC backing – a source of information about the quality of the firm (see,
e.g., Megginson and Weiss (1991)) – are more likely to go public via an IPO. The coefficient on
the return on assets variable is never significant in the reported regressions and is not significant
even when the other measures of asymmetric information are excluded as might be expected
given the relatively high correlation levels with the other explanatory variables.
We include an additional measure that can be a proxy for asymmetric information about
the firms in our regression analysis – the log of total assets in the firm. Alternatively, Bayar and
Chemmanur (2006) suggest that larger firms are more likely to have success in the product
market and thus are more viable IPO candidates. Previous researchers have found that larger
firms are more likely to go public through an IPO rather than staying private (Pagano, Panetta,
and Zingales (1998) and Chemmanur, He and Nandy (2005)) or selling out to a public firm (Brau,
Francis, and Kohers (2003). We also find that larger firms are more likely to go public as an IPO.
While these alternative measures of asymmetric information suggest the importance of
asymmetric information concerns in the decision between IPO and sellout, it is important to note
that high-growth firms – those more likely to choose to go public through an IPO – are generally
characterized as firms with significant asymmetric information concerns. Thus, are conflicting
results make it difficult to interpret our results. Nevertheless, there does seem to be some role for
asymmetric information as a contributing factor in the determination of the means through which
to go public, especially after controlling for growth in the firm.
In Table VIII, we separate our sample on the basis of whether the firm is VC backed or
not and present the results from regression 4 of Table VII for each subsample (with the exclusion
of the VC indicator variable). It may be that venture capital firms, given their portfolio of
investments and repeat decisions with respect to exiting firms, will have more expertise and
greater willingness to explore different exit strategies. Thus, by more closely examining the VC-
22

backed firms, we can limit the impact of one-time decision makers who may prefer one exit
strategy over another for personal liquidity, control, or other non-financial reasons.
Overall, the regression analysis for VC-backed firms supports the importance of growth,
capital structure, and, to a lesser extent, asymmetric information in determining the method of
going public. As noted in Table V, VC-backed firms have significantly higher valuation whether
the firm goes public through an IPO or a sellout. Nevertheless, the significance of the positive
coefficient on the market-to-book ratio confirms the importance of valuation and growth
expectations in determining the method of going public. The capital structure proxies are
significant, with lower leverage and higher capital constraints increasing the probability of an
IPO. The other asymmetric information variables also remain significant, with the exception of
return on assets, as in the earlier regressions. Again we note the inconsistency between the results
for the growth variables and the other asymmetric information variables, suggesting the need for
additional research to differentiate the impact of growth from asymmetric information on the
choice of exit strategy.
The regressions for non-VC-backed firms also support the general pattern of our findings,
though the results are somewhat weaker. The coefficients on the growth proxies still suggest that
faster growing firms will go public through an IPO even when not backed by a VC. While firms
with less leverage are more likely to undergo an IPO, the constrained cash flow variable is
insignificantly different from zero for this subsample. In addition, the alternative asymmetric
information proxies have insignificant explanatory power, except for larger firms being more
likely to undergo an IPO. We do not find it surprising, however, that these results are weaker
since we expect that there would be more idiosyncratic differences among these sellers that are
not, in general, making the decision on the method of going public for many firms.
23

V. Conclusions In this paper, we investigate the movement of assets from private to public ownership
through two alternative means: the acquisition of private companies by firms that are public
(sellouts) or by initial public offerings (IPOs). We identify 1,074 IPOs from 1995 through 2004
and compare those firms to 735 sellout firms from the same period. We gather firm-specific
information from public filings of the firms themselves or of the acquiring firms, while most
previous research in this area has relied on industry- or economy-wide data. In addition, by
focusing on IPO firms that have a median market value of about $170 million versus sellout firms
with a median value of about $130 million, we are directly comparing firms that could viably use
either transition method.
The evidence suggests that firm characteristics contribute significantly to the decision of
whether a firm accesses public equity markets through an IPO or instead is sold to a public
company. Overall, our results suggest that firms that choose to go public through an IPO tend to
be higher growth firms with higher valuation ratios and firms that need access to non-debt
sources of funding. We find that IPO firms are more likely to face capital constraints. In addition,
we find that IPO firms have fewer intangible assets, are less likely to be in the development stage
and are more likely to be backed by VC investors, all associated with less asymmetric
information problems, though the fact that IPO firms tend to have higher growth may contradict
this result. Our results are supported in subsamples of IPO and sellout firms backed by venture
capitalists. Because venture capitalists invest in many firms, we suggest that they may have more
experience in choosing the optimal method for going public and may be subject to fewer personal
preferences for liquidity or control than the sellers of non-VC backed firms.
There is an extensive literature studying initial public offerings, partially because they
provide a unique perspective from which to understand fundamental firm characteristics and
decisions such as corporate governance and capital raising. However, not every firm moving to
public ownership does so through an IPO. By empirically modeling the factors related to the
24

method of accessing public equity markets, we gain a better understanding of the underlying
differences between these alternative organizational structures and the firm characteristics leading
to the firm’s choice.
25

References Bayar, O., and T. Chemmanur, 2006, “IPOs or Acquisitions? A Theory of the Choice of Exit
Strategy by Entrepreneurs and Venture Capitalists,” Boston College Working Paper. Beatty, R., and J. Ritter, 1986, “Investment Banking, Reputation, and the Underpricing of Initial
Public Offerings.” Journal of Financial Economics 15, 213-232. Black, B., and R. Gilson, 1998, “Venture Capital and the Structure of Capital Markets: Banks
Versus Stock Markets.” Journal of Financial Economics 47, 243-277. Bradley, M., A. Desai, and E. H. Kim, 1988, “Synergistic Gains from Corporate Acquisitions and
Their Division between the Stockholders of Target and Acquiring Firms.” Journal of Financial Economics 21, 3-40.
Brau, J., B. Francis, and N. Kohers, 2003, “The Choice of IPO Versus Takeover: Empirical
Evidence.” Journal of Business 76, 583-612. Camerlynck, J., H. Ooghe, and T. De Langhe, 2005, “Pre-acquisition Profile of Privately Held
Companies Involved in Takeover: An Empirical Study.” Small Business Economics 24, 169-186.
Chemmanur, T., and P. Fulghieri, 1999, “A Theory of the Going-Public Decision.” Review of
Financial Studies 12, 249-279. Chemmanur, T., S. He, and D. Nandy, 2005, “The Going Public Decision and the Product
Market.” Boston College working paper. Ellingsen, T., and K. Rydqvist, 1997, “The Stock Market as a Screening Device and the Decision
to Go Public.” Stockholm School of Economics and Norwegian School of Management working paper.
Fama, E., and K. French, 1997, “Industry Costs of Equity, Journal of Financial Economics 43,
153-193. Field, L., and H. Mulherin, 2003, “Newly-Public Firms as Acquisition Targets: A Comparision
with Established Target Firms.” Pennsylvania State University working paper. Fuller, K., J. M. Netter, and M. Stegemoller, 2002, “What Do Returns to Acquiring Firms Tell
Us? Evidence from Firms That Make Many Acquisitions.” Journal of Finance 57, 1763-1793.
Gaver, J., and K. Gaver, 1993, “Additional Evidence on the Association Between the Investment
Opportunity Set and Corporate Financing, Dividend, and Compensation Policies.” Journal of Accounting and Economics 16, 125-160.
Grimes, A, 2004, “Many Sart-Ups Opt for ‘Dual Tracking’ IPO or Outright Sale.” Wall Street
Journal July 23, http://online.wsj.com/article_print/0,,SB109054612006071960,00.html.
26

Jain, B., and J. Kini, 1994, “The Post-Issue Operating Performance of IPO Firms.” Journal of Finance 49, 1699-1726.
Kensinger, J., J. Martin, and J. Petty, 2000, “Harvesting Value from Entrepreneurial Success.”
Journal of Applied Corporate Finance 12, 81-93. Kim, M., and J. Ritter, 1999, “Valuing IPOs.” Journal of Financial Economics 53, 409-737. Koeplin, J., A. Sarin, and A. Shapiro, 2000, “The Private Company Discount.” Journal of Applied
Corporate Finance 12, 94-101. Lee, I., S. Lochhead, J. Ritter and Q. Zhao, 1996, “The Costs of Raising Capital.” Journal of
Financial Research 19, 59-74. Lerner, J., 1994, “Venture Capitalists and the Decision to Go Public.” Journal of Financial
Economics 35, 293-316. Lowry, M., 2003, “Why Does IPO Volume Fluctuate So Much?” Journal of Financial Economics
1, 3-40. Matsusaka, J., 1993, “Target Profits and Managerial Discipline During the Conglomerate Merger
Wave.” Journal of Industrial Economics 41, 179-189. Megginson, W. and K. Weiss., 1991, “Venture Capitalist Certification in Initial Public
Offerings.” Journal of Finance 46, 879-903. Mikkelson, W., M. Partch, and K. Shah, 1997, “Ownership and Operating Performance of
Companies that Go Public.” Journal of Financial Economics 44, 281-307. Myers, S., 1984, “The Capital Structure Puzzle.” Journal of Finance 39, 575-592. Mulherin, J. H., and A. Boone., 2000, “Comparing Acquisitions and Divestitures.” Journal of
Corporate Finance 6, 117-140. Officer, M., 2006, “The Price of Corporate Liquidity: Acquisition Discounts for Unlisted
Targets.” Journal of Financial Economics forthcoming. Officer, M., A. Poulsen, and M. Stegemoller, 2006, “Information Asymmetry and Acquirer
Returns.” University of Southern California working paper. Pagano, M., F. Panetta, and L. Zingales., 1998, “Why Do Companies Go Public? An Empirical
Analysis.” Journal of Finance 53, 27-64. Ritter, J., 1984, “The ‘Hot Issue’ Market of 1980.” Journal of Business 57, 215-240. Ritter, J., and I. Welch., 2002, “A Review of IPO Activity, Pricing and Allocations.” Journal of
Finance 67, 1795-1828. Rodrigues, U. and M. Stegemoller, 2006, “An Inconsistency in SEC Disclosure Requirements?
The Case of the “Insignificant” Private Target.” Journal of Corporate Finance forthcoming.
27

Sahlman, W., 1990, “The Structure and Governance of Venture Capital Organizations.” Journal
of Financial Economics 27, 473-524. Smith, C., and R. Watts, 1992, “The Investment Opportunity Set and Corporate Financing,
Dividend and Compensation Policies.” Journal of Financial Economics 32, 263-292. Stein, J., 1997, “Internal Capital Markets and the Competition for Corporate Resources.” Journal
of Finance 52, 111-113. Zingales, L., 1995, “Insider Ownership and the Decision to Go Public.” Review of Economic
Studies 62, 425-448.
28

Table I. Values of Sellouts and IPOs from 1995 through 2004 The following table describes the size and number of deals in a given year. In Panel A, IPOs must be of US firms, must be listed on NYSE, AMEX or Nasdaq, must be an original IPO, must not be a spinoff and must be an offering of common stock. Sellouts must have a disclosed dollar value, must be a private US firm, the acquirer must be traded on the NYSE, AMEX, or Nasdaq, and the acquirer must acquire 100% of the target. In addition, financial and utility firms are eliminated from both samples. The total row provides the average deal value and also sums the deal values and number of sellouts and IPOs. Deal value is defined as the total value of consideration paid by the acquirer, excluding fees and expenses. Market value for an IPO is defined as the midpoint of the price on the opening day multiplied by the number of shares outstanding. The average, median and total columns are reported in millions of dollars.
Sellout Deal Values IPO Market Values Average Median Total N Average Median Total N
1995 $169 $123 $4,385 26 $156 $95 $15,087 97 1996 $185 $115 $16,878 91 $193 $110 $37,986 197 1997 $173 $94 $14,573 84 $342 $134 $49,899 146 1998 $179 $117 $17,350 97 $257 $126 $25,677 100 1999 $367 $136 $40,403 110 $700 $211 $160,307 229 2000 $332 $161 $49,442 149 $440 $293 $62,005 141 2001 $196 $135 $9,590 49 $423 $304 $14,808 35 2002 $214 $133 $7,484 35 $654 $365 $22,234 34 2003 $160 $116 $7,524 47 $430 $279 $11,620 27 2004 $248 $177 $11,637 47 $630 $220 $42,818 68 Total $244 $127 $179,264 735 $412 $171 $442,440 1,074
29

Table II. Reasons Given for the Transition from Private to Public Ownership The following table represents reasons found in S.E.C. filings for a sample of private firms either being acquired by a public company or undertaking an initial public offering. There are more observations for IPOs since the information gathered from prospectuses for IPOs is uniform, while the corresponding information for sellouts is scarcer and not always mandatory. In addition to the reason reported by the private firm, the frequency with which the reason is reported is recorded in both absolute and percentage terms.
Sellouts (N=115) IPOs
(N=856)
Access to Capital and Growth # % # %
Acquisitions 7 6.1% 314 36.7% Capital Expenditures (access to capital) 46 40.0% 296 34.6% General Corporate Purposes 3 2.6% 642 75.0% Growth 60 52.2% 73 8.5% R&D 24 20.9% 198 23.1% Working Capital - - 561 65.5%
Debt Debt Reduction - - 432 50.5%
Payouts Favorable Tax Consequences 42 36.5% - - Liquidity / Fair Price / Stock of public firm 108 93.9% 6 0.7% Pay a Distribution 7 6.1% 55 6.4% Redeem Preferred Stock - - 67 7.8% Pay a Termination Fee - - 5 0.6% Repurchase Common Stock - - 12 1.4%
Marketing and Personnel Issues Related to Personnel 31 27.0% 18 2.1% Marketing Activities 29 25.2% 125 14.6%
Other Create Value 16 13.9% - - Efficiencies / Scale / Synergies 93 80.9% - - Industry Conditions / Competition 27 23.5% - - Risk Reduction 38 33.0% - - Timing 9 7.8% - - Fund Operating Losses - - 12 1.4% Litigation Expenses - - 2 0.2% Reorganization & Alliances - - 9 1.1%
30

Table III. Statistics for Sellouts and IPOs from 1995 to 2004 The following table provides the median observation for sellouts and IPOs from the sample. The Wilcoxon signed rank test statistics for differences in distribution are reported in column (4). The p-value from a t-test for differences in means is in column (7). Dollars are recorded in millions.
(1) Firm characteristics
(2) Sellout
(3) IPO
(4) Wilcoxon
(5) Sellout
(6) IPO
(7) t-test
Median Mean
Revenues prior to transaction
$36.5 735
$26.9 1,074
.5099
$100.3 735
$196.9 1,074
.0005
Total assets prior to transaction
$27.7 735
$26.3 1,074
.0460
$79.1 735
$159.5 1,074
.0001
Dollar value of transaction
$127.4 735
$171.5 1,074
.0001
$243.9 735
$412.0 1,074
.0038
EBITDA prior to transaction
$4.0 735
$1.6 1,074
.0185
$7.8 735
$15.7 1,074
.0021
Capital expenditures
$1.5 735
$1.9 1,074
.0001
$8.2 735
$27.8 1,074
.0019
Research & development expense
$0.0 735
$1.7 1,074
.0001
$2.2 735
$6.0 1,074
.0001
Intangibles
$0.0 735
$0.0 1,074
.0247
$10.0 735
$29.5 1,074
.0081
Years of operating history
7 549
6 415
.0001
15.6 549
10.1 415
.0001
Number of employees
269 292
235 788
.8468
996.4 292
1449.2 788
.0818
Venture Backing
41.4% 735
55.5% 1,074
.0001
41.4% 735
55.5% 1,074
.0001
Age of CEO
47.5 140
45.5 424
.0825
47.9 140
46.3 424
.0593
Insider ownership prior to transaction
75.4% 228
65.1% 419
.0167
68.4% 228
64.5% 419
.0894
Insider ownership after the transaction
0.0% 425
50.1% 421
.0001
5.6% 425
49.4% 421
.0001
31

Table IV. Growth, Investment, Asymmetric Information, and Debt in Sellouts and IPOs from 1995 to 2004
Panel A of this table presents the median growth rates for sales, total assets, and capital expenditures (Capex). Year 0 represents the year in which the transaction occurred. Growth rates are represented by the change in sales, assets and capital expenditures from year -2 to year -1. Panel B shows scaled investment in the year prior to the IPO or acquisition. Panel C presents measures of debt and financial distress. EBITDA is measured as earnings before taxes plus amortization and depreciation and interest is interest expense reported in the income statement. Panel D provides data on measures of asymmetric information as of the year prior to the IPO or acquisition. The number of observations appears below the median. Wilcoxon test statistics for differences in distribution are reported in the sellout rows, and are represented by asterisks: ***, **, * represent significance levels for differences in distributions at the 1%, 5%, and 10% levels, respectively. Superscript numbers shown in the scaled R&D and scaled intangibles cells represent the observation at the 75th percentile.
Panel A: Measures of growth (growth rates)
Growth in sales Growth in total assets Growth in capex
Sellouts
26.2%*** 550
18.8%*** 588
16.3%***
568
IPOs
44.6% 555
49.2% 605
49.3% 574
Panel B: Measures of growth (scaled investment)
Capex / total assets
R&D / total assets
(Capex + R&D) / total assets
Sellouts
6.9%*** 735
0.0%22.2%***
735 14.7%*** 735
IPOs
7.9% 1,074
8.2%30.5% 1,074
25.6% 1,074
Panel C: Measures of debt
Total debt / total assets
Long-term debt / total assets
% of firms where interest > EBITDA
Sellouts
65.7%*** 735
11.6%***
735 28.6%***
735
IPOs
58.6% 1,074
7.8% 1,074
35.3% 1,074
Panel D: Measures of asymmetric information
Intangibles / total assets
Percentage of firms in the development stage
Sellouts
0.0%7.4%*** 735
15.0% 735
IPOs
0.0%3.6% 1,074
15.7% 1,074
32

Table V. Median Valuation Multiples of IPOs and Sellouts from 1995 to 2004 This table presents median valuation multiples for IPO and sellout firms. For every multiple the numerator is market value for an IPO defined as the midpoint of the price on the opening day multiplied by the number of shares outstanding and deal value for a sellout. The market value / book value of assets uses the value of assets from the balance sheet. The sales multiple is value scaled by total revenues. In Panel B, we compare multiples for only the matched sample of IPOs and sellouts. Panel C reports the differences in the multiples of VC and non-VC firms. Asterisks, ***, **, * represents significance levels for a Wilcoxon test for distributions in medians between IPO and Sellout values at the 1%, 5%, and 10% levels, respectively. a, b, c represents significance levels for a Wilcoxon test for distributions in medians between VC and non-VC values at the 1%, 5%, and 10% levels, respectively.
Panel A: All firms Sellouts IPOs MV / book value of assets
3.9 735
5.8 1,074
MV / sales
3.5*** 735
5.9 1,074
Panel B: Matched firms Sellouts IPOs MV / book value of assets
4.3***
425 6.4 425
MV / sales
3.2*** 425
6.6 425
Panel C: Venture capital backing Sellouts IPOs VC backed MV / book value of assets
8.9a 304
7.9a 596
MV / sales
9.6a 304
10.4a 596
Non-VC backed MV / book value of assets
3.0 431
3.2 478
MV / sales
2.1 431
2.3 478
33

Table VI. Median Operating Performance Prior to IPO or Sellout The following table reports the median income (EBITDA is measured as earnings before taxes plus amortization and depreciation) of sellouts and IPOs scaled by sales and total assets. Year 0 represents the year in which the transaction occurred. These returns are unadjusted operating returns. Wilcoxon test statistics for differences in distribution are reported in the sellout rows, and are represented by asterisks: ***, **, * represent significance levels at the 1%, 5%, and 10% levels, respectively.
Panel A: All firms Year -1 Year -2 EBITDA / Sales Sellouts
6.5%*** 735
7.4%*** 549
IPOs
4.3% 1,074
3.6% 555
EBITDA / Total assets Sellouts
11.0%*** 735
11.3%*** 569
IPOs
6.0% 1,074
3.9% 590
Panel B: Matched sample Year -1 Year -2 EBITDA / Sales Sellouts
7.1%***
425 8.8%***
177
IPOs
0.7% 425
3.1% 177
EBITDA / Total assets Sellouts
11.3%*** 425
11.7%***
192
IPOs
1.3% 425
3.1% 192
34

Table VII. Logistic Regression Analysis of Factors Influencing Transition Method for Sellouts and IPOs from 1995 to 2004
The dependent variable is a dummy equal to 0 if the observation is a sellout and equal to 1 it is an IPO. All of the independent variables are measured in year -1: growth in assets, capital expenditures (capex), and revenues are the change from year -2 to -1. For market-to-book the numerator is the midpoint of the price on the opening day multiplied by the number of shares outstanding for an IPO and is deal value for a sellout; the denominator is the value of assets from the balance sheet. Venture capital backing is a dummy variable where 1 denotes the presence of venture financing. Leverage is total debt scaled by total assets. Deal value (IPO value) is defined as the total value of consideration paid by the acquirer, excluding fees and expenses (the offer price multiplied by the number of shares outstanding after the IPO). Constrained cash flow is a dummy equal to 1 when interest expense is greater than EBITDA and interest expense is positive. Return on assets is EBITDA divided by total assets. Independent variables which are accounting variables are Winsorized at the 5% and 95% levels. Industry and year dummies are included, but not reported, in regressions (1) – (4). P-values are in brackets.
continued on next page
35
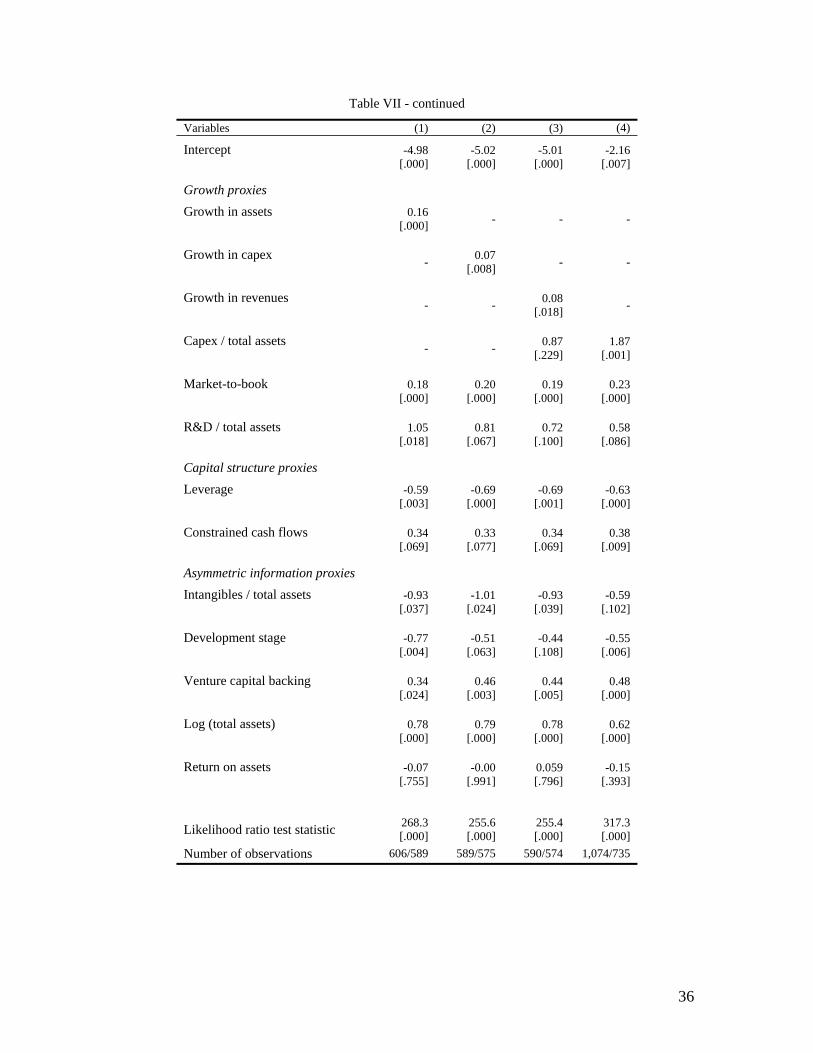
Table VII - continued
Variables (1) (2) (3) (4)
Intercept
-4.98 [.000]
-5.02 [.000]
-5.01 [.000]
-2.16 [.007]
Growth proxies
Growth in assets
0.16 [.000] - - -
Growth in capex - 0.07
[.008] - -
Growth in revenues - - 0.08
[.018] -
Capex / total assets - - 0.87
[.229] 1.87
[.001]
Market-to-book
0.18 [.000]
0.20 [.000]
0.19 [.000]
0.23 [.000]
R&D / total assets
1.05 [.018]
0.81 [.067]
0.72 [.100]
0.58 [.086]
Capital structure proxies
Leverage
-0.59 [.003]
-0.69 [.000]
-0.69 [.001]
-0.63 [.000]
Constrained cash flows
0.34 [.069]
0.33 [.077]
0.34 [.069]
0.38 [.009]
Asymmetric information proxies
Intangibles / total assets
-0.93 [.037]
-1.01 [.024]
-0.93 [.039]
-0.59 [.102]
Development stage
-0.77 [.004]
-0.51 [.063]
-0.44 [.108]
-0.55 [.006]
Venture capital backing
0.34 [.024]
0.46 [.003]
0.44 [.005]
0.48 [.000]
Log (total assets)
0.78 [.000]
0.79 [.000]
0.78 [.000]
0.62 [.000]
Return on assets
-0.07 [.755]
-0.00 [.991]
0.059 [.796]
-0.15 [.393]
Likelihood ratio test statistic 268.3 [.000]
255.6 [.000]
255.4 [.000]
317.3 [.000]
Number of observations 606/589 589/575 590/574 1,074/735
36
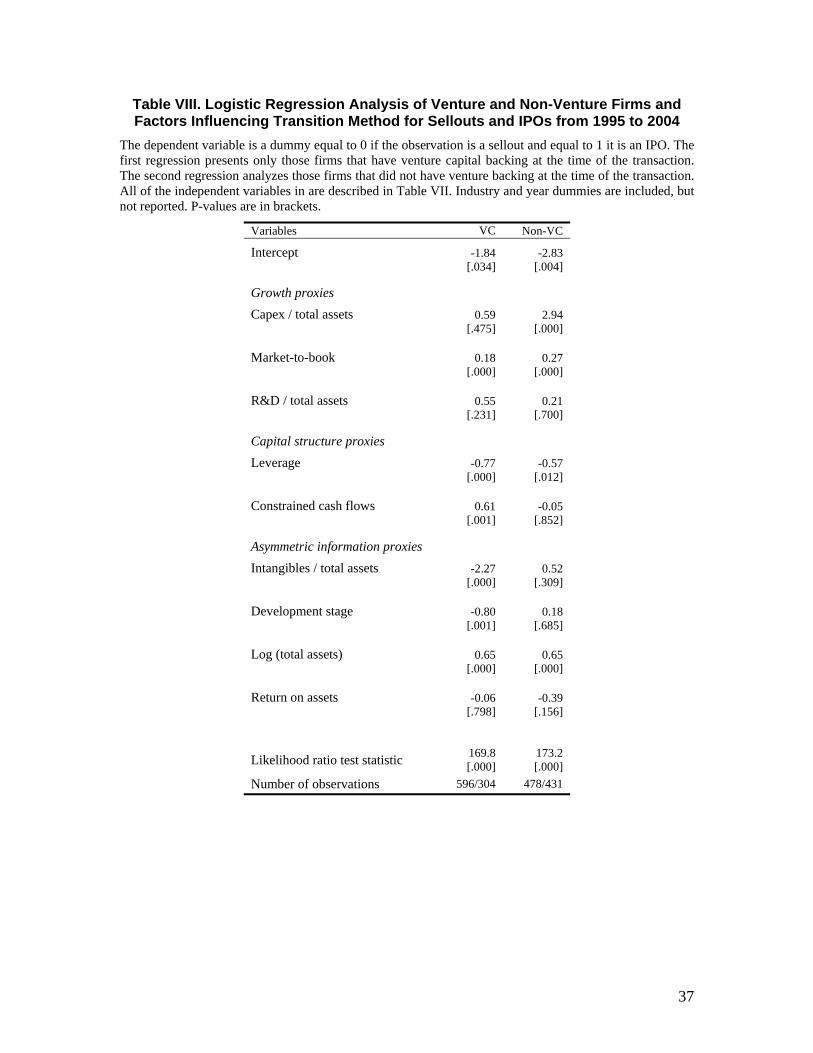
Table VIII. Logistic Regression Analysis of Venture and Non-Venture Firms and Factors Influencing Transition Method for Sellouts and IPOs from 1995 to 2004
The dependent variable is a dummy equal to 0 if the observation is a sellout and equal to 1 it is an IPO. The first regression presents only those firms that have venture capital backing at the time of the transaction. The second regression analyzes those firms that did not have venture backing at the time of the transaction. All of the independent variables in are described in Table VII. Industry and year dummies are included, but not reported. P-values are in brackets.
Variables VC Non-VC
Intercept
-1.84 [.034]
-2.83 [.004]
Growth proxies
Capex / total assets
0.59 [.475]
2.94 [.000]
Market-to-book
0.18 [.000]
0.27 [.000]
R&D / total assets
0.55 [.231]
0.21 [.700]
Capital structure proxies
Leverage
-0.77 [.000]
-0.57 [.012]
Constrained cash flows
0.61 [.001]
-0.05 [.852]
Asymmetric information proxies
Intangibles / total assets
-2.27 [.000]
0.52 [.309]
Development stage
-0.80 [.001]
0.18 [.685]
Log (total assets)
0.65 [.000]
0.65 [.000]
Return on assets
-0.06 [.798]
-0.39 [.156]
Likelihood ratio test statistic 169.8 [.000]
173.2 [.000]
Number of observations 596/304 478/431
37