Moving Beyond 4G Wireless Systems
20
See discussions, stats, and author profiles for this publication at: https://www.researchgate.net/publication/228589326 Moving Beyond 4G Wireless Systems Article CITATION 1 READS 254 4 authors, including: Some of the authors of this publication are also working on these related projects: UX Assessment of Cable Networks View project The Internet of Bodies View project Rahul Amin Clemson University 20 PUBLICATIONS 200 CITATIONS SEE PROFILE Ahmed M. Eltawil University of California, Irvine 233 PUBLICATIONS 2,705 CITATIONS SEE PROFILE Amr Hussien University of California, Irvine 13 PUBLICATIONS 121 CITATIONS SEE PROFILE All content following this page was uploaded by Ahmed M. Eltawil on 31 May 2014. The user has requested enhancement of the downloaded file.
Transcript of Moving Beyond 4G Wireless Systems

See discussions, stats, and author profiles for this publication at: https://www.researchgate.net/publication/228589326
Moving Beyond 4G Wireless Systems
Article
CITATION
1READS
254
4 authors, including:
Some of the authors of this publication are also working on these related projects:
UX Assessment of Cable Networks View project
The Internet of Bodies View project
Rahul Amin
Clemson University
20 PUBLICATIONS 200 CITATIONS
SEE PROFILE
Ahmed M. Eltawil
University of California, Irvine
233 PUBLICATIONS 2,705 CITATIONS
SEE PROFILE
Amr Hussien
University of California, Irvine
13 PUBLICATIONS 121 CITATIONS
SEE PROFILE
All content following this page was uploaded by Ahmed M. Eltawil on 31 May 2014.
The user has requested enhancement of the downloaded file.

Moving Beyond 4G Wireless Systems
Jim Martin, Rahul Amin
School of Computing
Clemson University Clemson, SC USA
Ahmed Eltawil, Amr Hussien
Department of Electrical and Computer Engineering
University of California
Irvine, CA USA
Abstract— As broadband data further blends with cellular
voice, mobile devices will become the dominant portals to the connected world. However current design practices still involve building independent networks that each make their own resource decisions. In this paper, we present a ‘clean-slate’ approach to wireless networking. In spite of the tremendous amount of related research in this area, there are still several elemental questions that must be addressed. First, is it better to treat wireless systems as independent access networks requiring the user to handle aspects of roaming between disparate wireless networks or is an internet model better where independent autonomous wireless systems (AWS) cooperate to form a single, unified cloud to users? Second, is it better to have dedicated, low power circuitry that supports a limited set of wireless Radio Access technologies (RATs) or is it better to build agile handsets that adapt (reconfigure) in real-time to operate over a much range of RAT technologies and operating modes? To move beyond 4G, we believe the answer to these questions must be yes. With these liberating assumptions, we are developing an architecture for a heterogeneous wireless system that moves beyond 4G systems. In this paper, we present preliminary results from a MATLAB-based simulation designed to demonstrate the essence of the ideas. We identify the key research challenges that must be addressed to move the idea from a concept to a viable network system.
Keywords-heterogeneous wireless networks; reconfigurable
radios; 4G wireless systems; cyberinfrastructure;
I. INTRODUCTION
While advances at both the network layer and the physical layer are prompting unprecedented mobile broadband growth, the means by which mobile terminals are offered services have created inefficiencies in both spectrum usage as well as mobile physical resources. The premise behind this issue is that while emerging devices support a multitude of wireless access methods, the current access methods require the user to select the active access network either by purchasing an appropriate handset (and service) or, in the case of multimodal smartphones, by manually selecting the access network. While this approach has worked fairly well for current 2G cellular networks, upcoming 3G and 4G systems will face significant challenges as wireless operators are held accountable for poor performance or inadequate coverage. It is well understood that individual systems that manage blocks of spectrum independently are inevitably operating at suboptimal performance.
Until recently, technology was the primary impediment to achieving universal, broadband wireless services that involve multiple radio access technologies. Today, the most significant impediments are the after-effects of antiquated government spectrum allocation policies and the resulting economic forces that drive the wireless industry. The effect is that in many geographic areas licensed spectrum is likely to be underutilized [1]. Current, physical MAC layers (i.e., the radio) of a wireless node attempts to achieve the best performance within its own network, generally ignoring impacts of co-located wireless networks. This ‘selfish’ behavior will usually not lead to optimal resource usage. Techniques or paradigms such as cooperative communications, symbiotic networking, cognitive networking, and dynamic spectrum access attempt to improve spectral efficiency through cooperation at the radio level [2]-[22]. At the network level, architectures and frameworks to support hybrid or heterogeneous networks have been suggested [24-30]. Recent proposals have been based on the IEEE 802.21 standard which provides a framework to support vertical handoffs transferring a mobile user between two networks that are based on different radio access technologies [23].
Although emerging 4G networks embody many of these recent advances, current design practices still involve building independent networks. The economic forces that are driving the cellular industry are reducing the number of cellular providers but causing their wireless networks to become large, heterogeneous systems based on numerous cellular data technologies at various lifecycle stages. At the same time, users are requiring more bandwidth intensive services that might not exist in all coverage areas. On the other hand, 802.11 networks have proliferated to the point that they are now considered to be a part of the computing (cyber) infrastructure. To augment wireless connectivity, some organizations or agencies have deployed site-wide, campus-wide, or city-wide broadband wireless coverage. These trends and the subsequent impacts on end users are becoming commonplace. Using Clemson University as an example, depending on the specific location on campus, one can find multiple 802.11 networks (some operated by the University, some operated by local public safety, others operated by the adjoining city of Clemson or nearby businesses whose coverage spills out over areas of the campus), coverage from an experimental campus WiMAX network, and multiple 2G/3G networks from cellular providers including AT&T, Sprint, T-Mobile, and Verizon. Over the next year, the spectrum on campus will become further cluttered as cellular providers deploy 4G networks. While wireless

technology is advancing rapidly, research that facilitates cooperation across independent networks is still immature.
In this paper we present an architecture for a wireless system that allows for a ‘clean-slate’ approach to the problem under the following assumptions:
1. Incentives are in place motivating independent, autonomous wireless systems (AWSs) to cooperate with each other to provide users a unified network with enhanced coverage and performance than could be achieved by any single AWS.
2. In any given geographic area, a handset might have access to a large number of AWSs. The use of multiple, concurrent radio links will become standard practice at least for a certain class of future smartphones.
3. Due to cost, size, and battery constraints, mobile nodes will be limited to a small number of adaptive radios that must be capable of operating in a relatively large number of supported communication modes and over a range of spectrum.
We envision two economic models that could support our idea: a carrier-centric model and an Internet model. In the carrier-centric model, a service provider offers services for specific markets (e.g., commercial wireless access, solutions for public safety). The carrier might own and operate portions of the physical network and possibly broker ‘peering’ arrangements with other wireless providers. Customers subscribe to a single carrier and gain access to any/all resources/services the subscriber has purchased. Voice, video, Internet connectivity, and VPN are the major services that are expected to be provided. An alternative economic model follows the current Internet model: organizations own and operate autonomous networks. Unification occurs through an overlay network that can be achieved through a combination of standard protocols, standard services, and incentive/reward mechanisms that promote peering and collaboration.
The key differences between the carrier-centric and Internet models include how vertical handoffs are initiated and the granularity of resource allocation. In the former, the carrier initiates vertical handoffs that might reflect load balancing or cost optimization. In the Internet model, handoffs might be based on an extended version of mobile IP that supports vertical handoff protocols based on the 802.21 framework. In the carrier model, network resources will be tightly controlled based on centralized resource allocation decisions that achieve the carrier’s policies. In the Internet model, an end-to-end mechanism allows users to compete fairly with other users for available bandwidth.
We consider a carrier-centric where a service provider offers services for specific markets (e.g., commercial wireless access, solutions for public safety etc.). The carrier might own and operate portions of the physical network and possibly broker ‘peering’ arrangements with other wireless providers. The optimal selection of the current active mode (or modes) is performed at a co-operative network level. A centralized algorithm manages bandwidth and user resources at a global level to optimize network–wide metrics, while localized algorithms based on standards-based MAC protocols manage
bandwidth over small time scales. The carrier initiates vertical handoffs that might reflect load balancing or cost optimization.
This paper is organized as follows. Section II presents and relates the relevant background and provides motivations for the work. We provide preliminary results from a MATLAB-based simulation in Section III. We then describe the key technical challenges that must be addressed to pave the way for future ‘beyond 4G’ wireless networks in Section IV. We conclude by describing our current project status and possible future directions in Section V.
II. BACKGROUND
Significant advances have been made in the last decade in radio technology. Recent work in cross-layer optimization has shown that breaking the rigid OSI layered stack model can enhance both spectral efficiency and application performance [2],[3]. Increased efficiency can be obtained through the use of transmit diversity methods such as multiple input, multiple output (MIMO) techniques [4],[5]. It has been shown that further improvements are obtained when wireless nodes cooperate using techniques such as relays and other forms of MAC/PHY layer cooperative communications [6]-[8]. Dynamic spectrum access (DSA) is another form of cooperation that is likely to be a foundation of future wireless systems [9]-[11]. DSA requires devices to be frequency agile giving rise to software defined radios (SDR) and cognitive radios (CR) as possible implementations. While SDRs and CRs have been under development for many years, they are limited to relatively narrowband systems due to multiple issues including power consumption and available computing cycles [12]-[14]. The challenge in handset design is managing the tradeoff between flexibility in how spectrum is used and in space/power requirements of the platform.
An extension to CR is cognitive networking which is defined in [19] as “a network with a cognitive process that can perceive current network conditions, and then plan, decide, and act on those conditions” [19]-[21]. One step further, symbiotic networking observes that current wireless networks tries to achieve the best performance within their own network and generally neglects the impact on co-located wireless networks [22]. In other words, radio behaviors are generally selfish and based only on information observed locally. Symbiotic networks extends the scope of cooperation across all layers and network boundaries.
While SDRs, CRs, cognitive networking and symbiotic networking focus on improving efficiency from the bottom up, heterogeneous wireless networks represent methods for cooperation driven from the top down. The IEEE 802.21 standard provides a framework to support seamless mobility through networks based on different radio access technologies (RATs) without the need to restart the radio connection every time the mobile moves to a new network [23]. Another relevant standard, IEEE P1900.4, defines building blocks for enabling coordinated network-device distributed decision making which will aid in the optimization of radio resource usage, including spectrum access control, in heterogeneous wireless access networks [24].

A number of architectures to support heterogeneous wireless networks have been proposed in the literature. Hierarchical resource managers have been proposed by the Common Radio Resource Management, Joint Radio Resource Management and Multi-access Radio Resource Management schemes studied by the 3GPP group [25]-[29]. The overhead associated with a centralized hierarchical wireless system is studied in [30]. In these hierarchical schemes, and also in our proposed system, the local resource managers of different wireless technologies interact with a centralized entity to jointly optimize the process of resource allocation. To the best of our knowledge, we have found that the work in [28] is the only work that involves a global resource controller issuing reconfiguration commands to radios. The system that is proposed in this paper extends prior research in the following ways:
1. We assume a wide range of wireless networks and infrastructure will exist and that the most flexible, unified system can only be derived when the devices are multimodal and highly reconfigurable.
2. We assume network-wide resource allocation is required. For simplicity, our initial path assumes an economic model that is carrier-centric, however the ultimate vision is a wireless Internet model where devices at any given time might have many connectivity choices and a set of distributed services exist to allow the device to use the available resources in a manner that achieves some understood and agreed upon compromise between fairness and system resources.
.
III. SYSTEM DESCRIPTION
A. System Model
Figure 1 illustrates the system model. The system consists of devices (also referred to as nodes) that have connectivity to one or more AWSs. Each AWS will have a controller (referred to as an AWSC) that represents all nodes in the AWS and that serves as a gateway connecting the AWS with other AWSs or external networks. A global resource controller (GRC) manages resources in a manner that supplements decisions made by local AWSs.
Figure 1 System Model
Users are presented with a unified network. Depending on node capabilities, users can operate over more than one AWS at any given time. A node’s TCP/IP stack sees a single IP link. The wireless virtual link layer (WVLL) handles packet scheduling over one or more radio links. Packet resequencing, error recovery using ARQ and/or FEC can optionally be implemented over the tunnel. The radio link block pictured in Figure 1 represents the MAC and physical layer that operates over a portion of the spectrum. A radio would be implemented using a combination of custom hardware along with programmable hardware based on technologies such as field programmable gate arrays (FPGAs) or digital signal processors (DSPs). User data is tunneled over the unified network cloud. The GRC (or another located in the backend network) represents the termination point for the tunnel. Nodes must maintain periodic contact with the GRC by sending status update information periodically. The GRC sends network level status and/or resource management control information periodically to the AWSC (and possibly to individual devices). The unified network provides a best effort datagram service specified. Based on tiered services, users would specify a downstream and upstream service rate. The network could define more complex data services such as a differentiated service offering, however, this is out of the scope of our current exploratory work.
B. Radio Capabilities
Radios are either static or capable of reconfiguration. Static radios are equipped with one or more non-reconfigurable radios. A non-reconfigurable radio supports a limited level of adaptive capability, but provides the lowest power consumption due to its custom nature. The position of mobile devices will be tracked by the GRC as location-based management is required. An AWS will likely consist of multiple wireless networks, generally of the same radio access technology. For example, a particular 3G network or a campus-wide 802.11 network would be considered an AWS. The GRC is necessary to facilitate cooperation across AWSs. For example, a node that concurrently supports 802.11 and 3G might be told by the GRC to use the 3G link as the control channel and the 802.11 network as the data channel.

Alternatively, if the same node moves to a location that has 802.16e coverage, the GRC might initiate a ‘reconfiguration handoff’. For example, as the node moves out of coverage of the 802.11 network and the GRC determines that the node is in coverage of the 802.16e network, the network could issue a reconfiguration command to the node instructing it to reconfigure the radio to 802.16e. A reconfiguration handoff is a vertical handoff that requires a radio to reconfigure itself. The implicit assumption here is that due to the multimodal nature required, radios will support reconfiguration rather than have several chipsets, each dedicated to a specific standard.
Reconfigurable architectures span the gamut from general purpose processors to multicore DSPs, with application specific instruction set processors presenting a good compromise between processing power and computational resources. Chip integration densities allow integrating a large number of cores on a single die, however, the issue of programming and managing these multi-cores in an efficient manner that meets real time processing requirements is still an open research issue. On the other hand, having dedicated chipsets for each individual standard becomes both cost and power prohibitive when the number of supported standards increase [ref]. An alternative approach that is gaining momentum due to the massive integration of transistors in advanced technology nodes is the potential use of FPGAs as programmable mobile platforms. Reconfiguration of the FPGA fabric allows for multi-modal support, while real-time performance metrics are easy to achieve due to the hardware acceleration of computational intensive tasks, as well as the massive parallelism achievable by the FPGA architecture. In fact, several FPGA manufacturers are already proposing low power versions of their current FPGA platforms specifically for that reason [refs]. Furthermore, Xilinx which is a leading FPGA vendor has released hardware platforms and tools that support partial reconfiguration of individual portions of the FPGA while the remaining sections continue processing, thus allowing fine grain reconfiguration.
In the remainder of the paper, we will assume an FPGA platform is used as a platform for reconfigurable radios. While currently available FPGA’s are still considered too power hungry to be used as mobile chips, the preceding argument indicates that there is strong push towards making this a reality in the near future. The intention is not to argue that FPGAs are the best platform for reconfigurable computing, but rather to use them as an exemplar to demonstrate the impact of reconfiguration in terms of network performance improvement, as well as estimate the impact on throughput and power consumption. Table 1 presents implementation and performance statistics for common access technologies. The table is by no means representative of the vast amount of architectures available in literature but is intended to extract a measure of the complexity in terms of area (measured in Kilo gate equivalents of a simple 2 input, drive one, NAND gate), as well as power consumption. The power consumption is categorized as dynamic power consumption (Pdyn ), which is consumed during regular circuit operation, and reconfiguration power (Prec )which is consumed when the circuit is reconfigured to a new standard. The reconfiguration power and time (Trec) are estimated based on the complexity of the standard, where
the minimum reconfigurable block is defined as a data path container (DPC~13.5 Kilo gates). Based on [32], the average reconfiguration power for each DPC (for a Xilinx Virtex II) is 234 mW and the average reconfiguration time is 0.63 ms, while the dynamic power is estimated from [33]. Thus, the average total power can be calculated as follows:
������ = ∝� �� � +∝�� ���
Where �� � and ��� represent the running and reconfiguration
power respectively, and ∝� and ∝�� represent the percentage of time the system operates in regular operation versus reconfiguration mode.
Table 1 Implementation statistics for current representative access technologies
802
.11
a
Mo
bil
e
WiM
AX
LT
E
HS
DP
A
EV
DO
(est
.
from
UM
TS
)
Reference [34] [35] [36] [37] [38]
No of
Kgates 416 728 270
723
(est. from
area and
technology)
684
No of
DPCs 31 53 20 53 50
Pdyn (W) @
100 MHZ 1.76 3 1.13 3 2.83
Prec (W) @
50 MHZ
rec
7.25 12.4 4.68 12.4 11.7
Trec (ms) 19.53 33.4 12.6 33.4 31.5
C. Use-Case Scenarios
Two ways to increase the coverage and capabilities of a
wireless network are to use more spectrum and to increase the
efficiency of how allocated spectrum is utilized. Increasing
spectrum is possible under two conditions: (i) the cellular
carrier deploys significant amount of higher throughput, lower
cell radius access technologies (such as 4G and Wi-Fi); (ii) the mobile terminals are capable of reconfiguration which allows
them to access additional resources through roaming
agreements between cellular carriers. We formulate two use-
cases based on these conditions to compare the difference in
achieved performance:
Use-Case 1: x nodes can connect to only Carrier 1’s cellular
and WiFi network, y nodes can connect to only Carrier 2’s
cellular and WiFi network
Use-Case 2: x and y can now make use of the other carrier’s
network if there is excess capacity.
D. Simulation Description
We have developed a MATLAB-based simulation model with sufficient fidelity to demonstrate the possible benefits of the proposed wireless system. We base the analysis methodology loosely on that used in [39] which demonstrates the potential increase in spectral efficiency when femtocells augment the reach of a wireless provider’s macrocell network. While our underlying assumptions allow us to consider more

complex heterogeneous wireless systems, our methodology is similar. We use simulation to model an approach for managing resources taking into account the benefits and possible costs of reconfiguration. As in [39], we are interested in showing the improvements observed by each node and also at the global network-wide level. There are many aspects of the analysis that we do not take into account, including modeling the impacts of the messaging overhead that is required by a global resource control strategy and modeling the impacts of signal fading and channel interference.
The simulation topology that was used for the results reported in this paper consists of a 2 * 2 km2 grid. Any number of wireless access technologies can be used for connectivity within the grid. The AWS model is parameterized by transmit power, a propagation model, and a mapping between effective receive power at a given location and effective data rate. The latter capability allows, for example, the modulation and coding of specific radio access technologies (e.g., WiMAX16e, 802.11g) to be taken into account. An example simulation configuration involving three AWSs per carrier is illustrated in Figure 3. Using this example, a simulation involves any number of nodes, each of which can be assigned a maximum of three radios. Further, each radio might be reconfigurable (i.e., can be instructed to operate over any of the AWSs) or non-reconfigurable (statically set to one AWS). Periodically, a central controller allocates bandwidth using a scheduling algorithm that selects channels for each reconfigurable radio and that assigns bandwidth to nodes in a manner that attempts to maximize both resource utilization and fairness.
We present simulation results from a scenario involving two wireless providers, each of which has three RATs: EVDO Rev 0 (3G Carrier 1), HSPA (3G Carrier 2), IEEE 802.16e (4G Carrier 1), LTE (4G Carrier 2) and IEEE 802.11g (Wi-Fi Carrier 1 and Carrier 2). For the cellular based AWSs (3G/4G AWS) we assume that a single base station serves all nodes in the simulation topology. These base stations are located near the center of the grid. The 3G base stations have a coverage radius of 1.25 km and the 4G base stations have a coverage radius of 0.75 km [RAHUL: reference?]. The IEEE 802.11g APs are spread throughput the topology as illustrated in Figure 3. There are two Wi-Fi AWSs, each having three APs, and each AWS belongs to a different carrier. The coverage radius of Wi-Fi AP is 0.15 km. The scenario is based on an urban location that has two large service providers in the area and are designed to show the possible tradeoffs surrounding varying levels of device reconfiguration and varying levels of sharing between the two wireless providers.
Figure 3: Coverage of an example simulation topology
The simulation involves 100 mobile nodes that are initially positioned randomly within the grid. 50 nodes represent users subscribed to Carrier 1 and the other 50 represent users subscribed to Carrier 2. Nodes move using a random walk mobility model at various speeds. Due to this movement, link performance varies over time depending on the node’s location in the grid and scheduling decisions. To strike a balance between update frequency and overhead, the mobile node sends its connectivity parameters for each access technology to the Global Resource Controller every one second. The Global Resource Controller implements a scheduler that assigns each node’s radio the most efficient access technology and that allocates bandwidth in a manner that seeks fairness while maximizing total throughput. The scheduler follows a two step approach. In the first step, the scheduler allocates a minimum required throughput of 100 kbps to each node using its best cellular (3G/4G) radios. In the second step, the scheduler distributes unused cellular access technology resources to a window of 10 mobile nodes with best connectivity parameters in increments of 100 kbps. Nodes are limited to a maximum allocation of 1 Mbps by the cellular networks. Finally, Wi-Fi resources are distributed evenly amongst connected users by each Wi-Fi AP.
Each node uses radios according to the decisions made by the GRC. So when the GRC instructs a node to switch/reconfigure the radio to be used, there is a cost associated with this operation in terms of unusable time and an increase in power. The number of switch/reconfigurations is related to the speed at which the mobile nodes move. The simulation is run for mobile node speeds in the range of [2 mph, 40 mph] in increments of 2 mph. The reference time and power cost values are presented in Table 1. The reference power estimates from the table are used in the simulation. However, the scheduler operates on a 1 second allocation basis. So the time estimate for a reconfiguration cost is set to 1 second instead of the values provided in Table. In addition, as mentioned in Section B, these time and power values are hardware specific and by no means are absolute values. To get a better feel for the possible range, the values are multiplied by a scalar in the range [0, 1] which we define as the ‘impact of reconfiguration’. The scalar value of 0 implies there is no switch/reconfiguration cost. The scalar values of 1 represents the reconfiguration power costs provided in Table 1 and reconfiguration time cost of 1 second. The simulation is run for

10,000 seconds and the average throughput experienced by each carrier’s users, spectral efficiency and average power consumption results are presented under different mobile node speeds and impacts of reconfiguration for both use-cases described in Section C.
E. Results and Discussion
The results are dependent on node mobility, access
technology coverage range, allocation resources of each access
technology and scheduler implementation. The scheduler
implemented in this study attempts to maximize network
efficiency and maintain fairness across users. Other forms of
schedulers might result in different results. We will explore in detail the scheduling problem in future work. For the purposes
of this study, our objective was a simple allocation strategy
that is sufficient to illustrate the potential benefits of our ideas.
The average throughput experienced by the users of Carrier 1 and Carrier 2 is presented in Figures 4 and 5
respectively. As observed from both figures, the average
throughput of use-case 2 is significantly higher than that
compared to use-case 1. All the available resources are
distributed in a much efficient manner for use-case 2 which
results in this increase. For example, additional resources of
each cellular technology were allocated to users with lower
modulation and coding scheme in Step 2 of the scheduler for
use-case 1, whereas the same resources were allocated to users
with higher modulation and coding scheme for use-case 2.
Also, as the speed of the users increase, the achieved throughput increases till a certain speed (20 mph in Figure 4
and 8 mph in Figure 5), after which the throughput decreases.
This phenomenon is related to the time each user spends in
good connectivity zones based on their speeds. For certain
speeds (20 mph and 8 mph for Carrier 1 and Carrier 2
respectively), depending on the network coverage and
movement pattern, all connectivity options are aligned to
achieve best performance. The impact of reconfiguration does
not have as much influence on achieved throughput as the
speed does. Losing one second slot during reconfiguration
does not cost the average received throughput significantly.
Figure 4: Average Throughput for Carrier 1 Users
Figure 5: Average Throughput for Carrier 2 Users
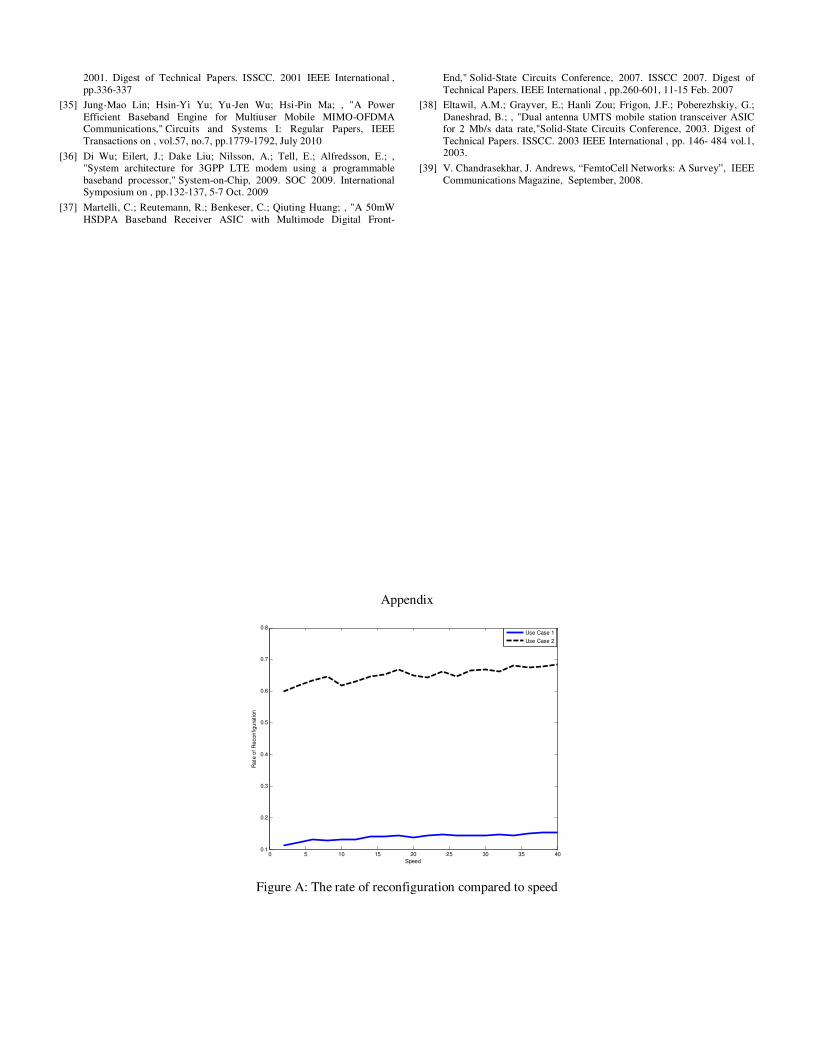
To provide further insight in the results, Figure 6 shows
the average rate of reconfiguration for a node. As expected,
use case 2 has a significantly higher rate than use case 1, about
three times that of use case 1. The higher reconfiguration rate
corresponds to a higher throughput for use-case 2.
Reconfiguration decisions help mobile terminals achieve
better throughput on average by using more throughput-
efficient modulation and coding scheme. This increases not
only the throughput of each carrier’s users but also the overall
system spectral efficiency. As seen in Figure 7, the spectral
efficiency follows the same pattern as that of each carrier’s
users’ average throughput in Figures 4 and 5. The spectral efficiency is improved almost 15%.
Figure 6: The rate of reconfiguration compared to speed
0 5 10 15 20 25 30 35 40
0
0.5
10.72
0.74
0.76
0.78
0.8
0.82
0.84
0.86
0.88
0.9
Speed (in mph)
Impact of Reconfiguration
Av
era
ge T
hro
ugh
put
for
Carr
ier
1 C
usto
mers
(M
bps
)
Use Case 2
Use Case 1
0 5 10 15 20 25 30 35 40
0
0.5
10.65
0.7
0.75
0.8
0.85
0.9
Speed (in mph)
Impact of Reconfiguration
Avera
ge T
hro
ugh
pu
t fo
r C
arr
ier
2 C
us
tom
ers
(M
bp
s)
Use Case 2
Use Case 1
0 5 10 15 20 25 30 35 400.1
0.2
0.3
0.4
0.5
0.6
0.7
0.8
Speed
Rate
of
Re
con
fig
ura
tion
Use Case 1
Use Case 2

Figure 7: Spectral Efficiency
The average power consumption depicted in Figure 8 is
opposite to the pattern seen in Figures 4, 5 and 7. The impact
of reconfiguration has a far greater affect on average power
consumption than the speed of the mobile user. For use-case 2,
since the reconfiguration rate is significantly high, the power
consumption almost doubles with the reference power
reconfiguration specs used from Table 1 at impact of
reconfiguration value of 1. This suggests that the power cost
needs to be carefully examined before the GRC issues a
reconfiguration command. For an average power consumption
of 7 Watts as compared to 3 Watts, a mobile device such as an
iPhone 4G would last 1 hour 20 minutes in comparison to 3 hours 10 minutes. This decreases the battery life of a mobile
terminal by almost half. But as better hardware innovations are
made, the actual battery life reduction is going to decrease
since the impact of reconfiguration is going to move farther
away from 1 and move closer towards 0. Eventually,
considering the expected number of mobile internet users to
significantly increase, the spectral efficiency increase of 15%
will far outweigh the disadvantage of increased power
consumption. Thus, the combined results from the simulation
demonstrate the advantages of carrier collaboration and
moving towards the reconfigurable mobile terminals.
We summarize the results as follows:
• Reconfiguration rate mainly depends on the number of
available resources and not on speed. Even at higher
speeds, the reconfiguration rate is relatively steady for
each use-case.
• For the scenarios examined, reconfiguration increases
achieved average throughput for users of both carriers
and increases overall spectral efficiency by 15%.
• Current power consumption during reconfiguration
reduces the battery life of a mobile terminal by almost
half; new hardware innovations are required to bring
this reduction down to acceptable levels.
Figure 8: Average Power Consumption
IV. TECHNICAL CHALLENGES
There are several open questions that are at the heart of the ideas presented in this paper:
• Handset capabilities: Is it better to have dedicated, low power circuitry that supports a limited set of wireless RATs or is it better to build agile handsets that adapt in real-time to operate over a much larger range of RAT technologies.
• Network models: It is better to treat wireless systems as independent access networks requiring the user to handle the roaming support or is it better to move towards an Internet model where independent AWSs cooperate to form a single, unified cloud to users.
While these questions will be debated for many years, we predict the alternatives that we identify will eventually prevail. With this assumption, our research strives to identify and address the key significant challenges that must be overcome in order to move beyond 4G systems. We identify the following technical challenges that guide our next phases of this work:
• Develop resource allocation methods that support desired
services and that achieve fairness objectives.
• Establish optimization techniques to manage the tradeoffs between power, degree and frequency of reconfigurability,
channel depth, and spectrum efficiency.
• Identify and develop an appropriate device platform in terms
of power consumption, programming model and scalability.
• Identify and develop a system architecture that is flexible yet
sufficiently scalable to support both carrier-centric and
Internet economic models.
V. CONCLUSIONS AND FUTURE WORK
In spite of recent advances in wireless technology, wireless networks continue to be designed as independent networks that make resource decisions without considering co-located networks. Cognitive radio, and the more recent idea of cognitive networks address the layer from the perspective of the physical layer (and up the stack). The hierarchical
0 5 10 15 20 25 30 35 40
0
0.5
1
0.95
1
1.05
1.1
1.15
1.2
1.25
Speed (in mph)
Impact of Reconfiguration
Sp
ec
tra
l e
ffic
ien
cy
(b
its
/s/H
z)
Use Case 1
Use Case 2
0 5 10 15 20 25 30 35 40
0
0.5
12
3
4
5
6
7
8
Speed (in mph)
Impact of Reconfiguration
Av
era
ge P
ow
er
Co
nsu
mpti
on
(W
att
s)
Use Case 2
Use Case 1

architecture that we have described adopts a top down perspective. Moving beyond 4G networks requires cooperation at the network layers. Preliminary simulation results confirm that significant increase in spectral efficiency can be achieved. In future work, we plan on addressing the key technical issues. Our next step is to explore strategies for optimal resource allocation that take into account rapidly developing advances in reconfigurable radio capabilities.
Our analysis has not considered crucial areas including:
• The impacts of messaging overhead required for network-wide coordination.
• Real-world physical link conditions that suffer degraded performance caused by signal fading and channel interference.
• The impacts of congestion caused by time varying traffic patterns.
We will be addressing each of these areas in future work.
REFERENCES
[1] FCC, ET Docket No 03-222 Notice of Proposed Rule Making and
Order, December 2003.
[2] M. Schaar, ; N. S. Shankar , "Cross-layer wireless multimedia
transmission: challenges, principles, and new paradigms," IEEE Wireless Communications , vol.12, no.4, pp. 50-58, Aug. 2005.
[3] M. Bohge, J. Gross, A. Wolisz, M. Meyer, “Dynamic Resource Allocation in OFDM Systems: An Overview of Cross-Layer
Optimization Principles and Techniques”, IEEE Network, Jan 2007.
[4] A.J. Paulraj, D.A. Gore, R.U.Nabar and H. Bolcskei , "An overview of MIMO communications - a key to gigabit wireless," Proceedings of the
IEEE , vol.92, no.2, pp. 198-218, Feb 2004
[5] G. J. Foschini andM. J. Gans, “On limits of wireless communications in a fading environment when using multiple antennas,” Wireless Personal
Commun.: Kluwer Academic Press, no. 6, pp. 311–335, 1998
[6] A. Nosratinia, T.E. Hunter, A. Hedayat, "Cooperative communication in wireless networks," IEEE Communications Magazine , vol.42, no.10,
pp. 74-80, Oct. 2004
[7] G. Kramer, M.Gastpar and P.Gupta , "Cooperative Strategies and Capacity Theorems for Relay Networks," IEEE Transactions on
Information Theory, , vol.51, no.9, pp. 3037-3063, Sept. 2005
[8] A. Host-Madsen , "Capacity bounds for Cooperative diversity," IEEE Transactions on Information Theory, vol.52, no.4, pp.1522-1544, April
2006
[9] C. Santivanez, R. Ramanathan, C. Partridge, R. Krishnan, M. Condell, S.
Polit, “Opportunistic Spectrum Access: Challenges, Architecture, Protocols, WiCon06, August, 2006.
[10] Y. Xing, R. Chandramouli, S. Mangold, S. Shankar, “Dynamic
Spectrum Access in Open Spectrum Wireless Networks”, IEEE Journal on Selected Areas in Communications, vol. 24, No. 3, pp 626-637,
March 2006.
[11] I. Akyildiz, W. Lee, M. Vuran, S. Mohanty, “NeXt Generation/Dynamic Spectrum Access/Cognitive Radio Wireless Networks: A Survey”,
Elsevier Computer Networks, Vol 50, pp. 2127-2159, 2006.
[12] E. Buracchini , "The software radio concept," IEEE Communications Magazine, , vol.38, no.9, pp.138-143, Sep 2000
[13] Wally H. W. Tuttlebee, "Software defined radio: enabling technologies",
John Wiley and Sons, 2002
[14] R. Bagheri, A.Mirzaei, M.E. Heidari, S. Chehrazi,Lee Minjae, M. Mikhemar, W.K. Tang, A.A. Abidi , "Software-defined radio receiver:
dream to reality," IEEE Communications Magazine, vol.44, no.8, pp.111-118, Aug. 2006
[15] J. Mitola, Cognitive Radio: An Integrated Agent Architecture for
Software Defined Radio, PhD Thesis, Royal Institute of Technology (KTH) 2000.
[16] J. Mitola, "Cognitive Radio for Flexible Mobile Multimedia Communications", Mobile Networks and Applications, Volume 6,
Number 5 / September, 2001,pp 435-441
[17] S.Haykin, "Cognitive radio: brain-empowered wireless communications", IEEE Journal on Selected Areas in Communications,
Volume: 23, Issue: 2,pp 201- 220, Feb. 2005
[18] N. Devroye, P. Mitran, V. Tarokh, "Achievable rates in cognitive radio channels" IEEE Transactions on Information Theory , vol.52, no.5, pp.
1813-1827, May 2006
[19] R.W. Thomas, L.A. DaSilva, A.B. MacKenzie, "Cognitive networks", in: Proceedings of the First IEEE International Symposium on New
Frontiers in Dynamic Spectrum Access Networks, Baltimore, MD, USA, November 8–11, 2005.
[20] R. Thomas, D. Friend, L. Dasilva, A. Mackenzie, “Cognitive Networks:
Adaptation and Learning to Achieve End-to-end Performance Objectives,” IEEE Communications Magazine, vol. 44, no. 12,
December 2006, pp. 51-57.
[21] C. Fortuna, M. Mohorcic, "Trends in the development of communication networks: Cognitive networks", Computer Networks, 2009.
[22] E. Poorter, B. Latre, I. Moerman, P. Demeester, “Symbiotcis Networks: Towards a New Level of Cooperation Between Wireless Networks”,
Wireless Personal Communications, vol.45, no.4, pp. 479-495, June 2008.
[23] IEEE Std 802.21-2008, IEEE Standard for Local and Metropolitan Area
Networks, Part 21: Media Independent Handover Services, IEEE, January 2009.
[24] S. Buljore, H. Harada, S. Filin, P. Houze, K. Tsagkaris, O. Holland, K.
Nolte, T. Farnham, V. Ivanov, “Architecture and Enablers for Optimized Radio Resource usage in Heterogeneous Wireless Access Networks: The
IEEE 1900.4 Working Group”, IEEE Communications Magazine, January 2009.
[25] S. Lee, K. Sriram. K. Kim, Y. Kim, N. Golmie, “Vertical Handoff
Decision Algorithms for Providing Optimized Performance in Heterogeneous Wireless Networks, IEEE Transactions on Vehicular
Technology, vol.58, no. 2, February 2009, pp. 865-881.
[26] N. Nasser, A. Hasswa, H. Hassanein, “Handoffs in Fourth Generation Heterogeneous Networks”, IEEE Communications Magazine, October
2006.
[27] F. Siddiqui, S. Zeadally, “Mobility Management Across Hybrid Wireless Networks: Trends and Challenges”, Elsevier Computer
Communications, vol 29, (2006), pp. 1363-1385.
[28] L. Gavrilovska, V. Atanasovski, “Resource Management in Wireless
Heterogeneous Networks (WHNs)”, Telsiks October 2009.
[29] S. Yoo, D. Cypher, N. Golmie, “Timely Effective Mechanisms in Heterogeneous Wireless Networks”, Wireless Personal
Communications, vol53, no.3, Feb 2008, pp.449-475.
[30] T. Tugeu, I Akyildiz, E. Ekiki, “Location Management for Next Generation Wireless Systems, “Proceedings of the Internation
Conference on Communications”, June 2004.
[31] “Gate count capacity metrics for FPGAs ” ……………………………... http://www.xilinx.com/support/documentation/application_notes/xapp05
9.pdf
[32] Shafique, M.; Bauer, L.; Henkel, J.; , "REMiS: Run-time energy minimization scheme in a reconfigurable processor with dynamic power-
gated instruction set,"Computer-Aided Design - Digest of Technical
Papers, 2009. ICCAD 2009. IEEE/ACM International Conference on ,
pp.55-62, 2-5 Nov. 2009
[33] L.Shang, A.S.Kaviani, K.Bathala “Dynamic power consumption in virtex II FPGA family” ACM/SIDGA international symposium on Field
Programmable Gate Arrays, Feb. 2002
[34] Eberle, W.; Derudder, V.; Van Der Perre, L.; Vanwijnsberghe, G.;
Vergara, M.; Deneire, L.; Gyselinckx, B.; Engels, M.; Bolsens, I.; De Man, H.; , "A digital 72 Mb/s 64-QAM OFDM transceiver for 5 GHz
wireless LAN in 0.18 µm CMOS," Solid-State Circuits Conference,
2001. Digest of Technical Papers. ISSCC. 2001 IEEE International ,
pp.336-337
[35] Jung-Mao Lin; Hsin-Yi Yu; Yu-Jen Wu; Hsi-Pin Ma; , "A Power
Efficient Baseband Engine for Multiuser Mobile MIMO-OFDMA Communications," Circuits and Systems I: Regular Papers, IEEE
Transactions on , vol.57, no.7, pp.1779-1792, July 2010
[36] Di Wu; Eilert, J.; Dake Liu; Nilsson, A.; Tell, E.; Alfredsson, E.; , "System architecture for 3GPP LTE modem using a programmable
baseband processor," System-on-Chip, 2009. SOC 2009. International Symposium on , pp.132-137, 5-7 Oct. 2009
[37] Martelli, C.; Reutemann, R.; Benkeser, C.; Qiuting Huang; , "A 50mW
HSDPA Baseband Receiver ASIC with Multimode Digital Front-
End," Solid-State Circuits Conference, 2007. ISSCC 2007. Digest of
Technical Papers. IEEE International , pp.260-601, 11-15 Feb. 2007
[38] Eltawil, A.M.; Grayver, E.; Hanli Zou; Frigon, J.F.; Poberezhskiy, G.;
Daneshrad, B.; , "Dual antenna UMTS mobile station transceiver ASIC for 2 Mb/s data rate,"Solid-State Circuits Conference, 2003. Digest of
Technical Papers. ISSCC. 2003 IEEE International , pp. 146- 484 vol.1, 2003.
[39] V. Chandrasekhar, J. Andrews, “FemtoCell Networks: A Survey”, IEEE
Communications Magazine, September, 2008.
Appendix
Figure A: The rate of reconfiguration compared to speed
0 5 10 15 20 25 30 35 400.1
0.2
0.3
0.4
0.5
0.6
0.7
0.8
Speed
Rate
of
Re
con
figu
rati
on
Use Case 1
Use Case 2
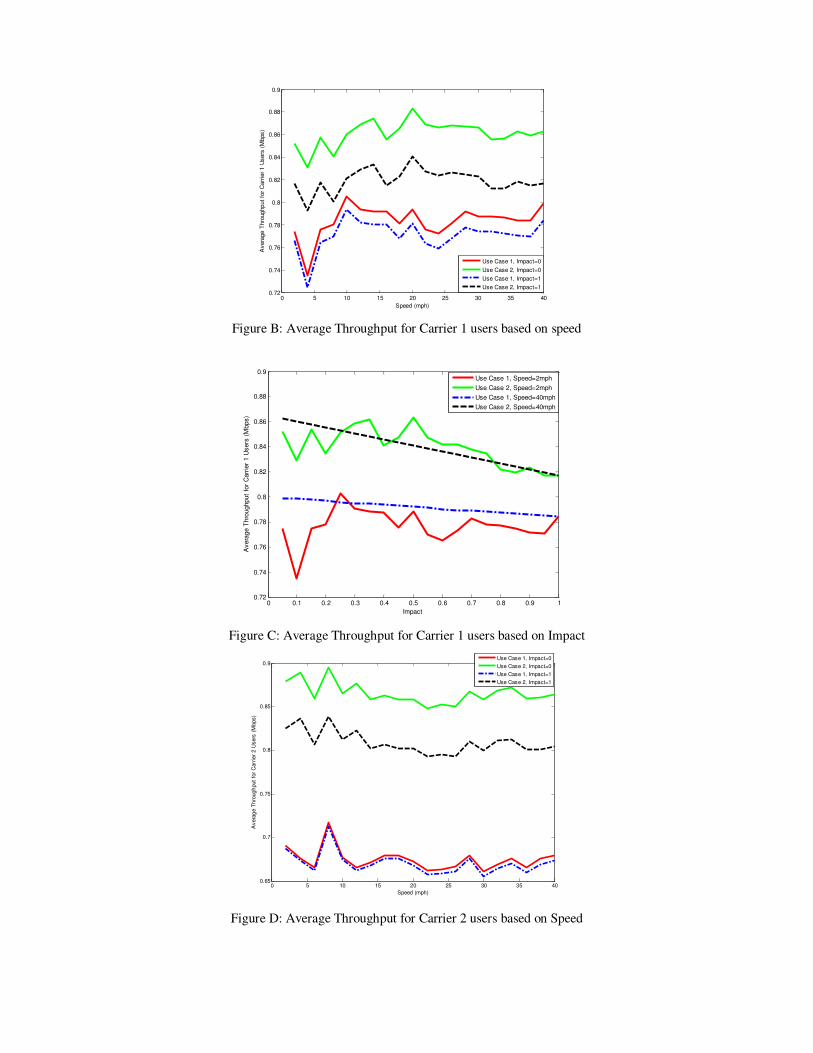
Figure B: Average Throughput for Carrier 1 users based on speed
Figure C: Average Throughput for Carrier 1 users based on Impact
Figure D: Average Throughput for Carrier 2 users based on Speed
0 5 10 15 20 25 30 35 400.72
0.74
0.76
0.78
0.8
0.82
0.84
0.86
0.88
0.9
Speed (mph)
Avera
ge T
hro
ughput
for
Carr
ier
1 U
sers
(M
bps)
Use Case 1, Impact=0
Use Case 2, Impact=0
Use Case 1, Impact=1
Use Case 2, Impact=1
0 0.1 0.2 0.3 0.4 0.5 0.6 0.7 0.8 0.9 10.72
0.74
0.76
0.78
0.8
0.82
0.84
0.86
0.88
0.9
Impact
Avera
ge T
hro
ughput
for
Carr
ier
1 U
sers
(M
bps)
Use Case 1, Speed=2mph
Use Case 2, Speed=2mph
Use Case 1, Speed=40mph
Use Case 2, Speed=40mph
0 5 10 15 20 25 30 35 400.65
0.7
0.75
0.8
0.85
0.9
Speed (mph)
Avera
ge T
hro
ugh
put
for
Carr
ier
2 U
sers
(M
bps)
Use Case 1, Impact=0
Use Case 2, Impact=0
Use Case 1, Impact=1
Use Case 2, Impact=1

Figure E: Average Throughput for Carrier 2 users based on impact
Figure F: Spectral Efficiency for different Speeds
Figure G: Spectral Efficiency for different Impact
0 0.1 0.2 0.3 0.4 0.5 0.6 0.7 0.8 0.9 10.65
0.7
0.75
0.8
0.85
0.9
Impact
Avera
ge T
hro
ug
hput
for
Carr
ier
2 U
sers
(M
bps)
Use Case 1, Speed=2mph
Use Case 2, Speed=2mph
Use Case 1, Speed=40mph
Use Case 2, Speed=40mph
0 5 10 15 20 25 30 35 400.95
1
1.05
1.1
1.15
1.2
1.25
Speed (mph)
Spectr
al E
ffic
iency (
bits/s
/Hz)
Use Case 1, Impact=0
Use Case 2, Impact=0
Use Case 1, Impact=1
Use Case 2, Impact=1
0 0.1 0.2 0.3 0.4 0.5 0.6 0.7 0.8 0.9 11
1.05
1.1
1.15
1.2
1.25
Impact
Sp
ectr
al E
ffic
ienc
y (
bits/s
/Hz)
Use Case 1, Speed=2mph
Use Case 2, Speed=2mph
Use Case 1, Speed=40mph
Use Case 2, Speed=40mph

Figure H: Average Power consumption based on Speed
Figure I: Average Power Consumption based on impact
0 5 10 15 20 25 30 35 402
3
4
5
6
7
8
Speed (mph)
Av
era
ge
Po
we
r C
on
su
mp
tio
n (
Wa
tts)
Use Case 1, Impact=0
Use Case 2, Impact=0
Use Case 1, Impact=1
Use Case 2, Impact=1
0 0.1 0.2 0.3 0.4 0.5 0.6 0.7 0.8 0.9 12
2.5
3
3.5
4
4.5
5
5.5
6
6.5
7
Impact
Avera
ge P
ow
er
Consum
ption(W
att
s)
Use Case 1, Speed=2mph
Use Case 2, Speed=2mph
Use Case 1, Speed=40mph
Use Case 2, Speed=40mph

Speed
Technology
2
mph
4
mph
6
mph
8
mph
10
mph
12
mph
14
mph
16
mph
18
mph
20
mph
WiMAX 15.54 15.25 15.21 15.33 15.42 15.27 15.31 14.63 15.11 15.36
EVDO 3.54 3.53 3.50 3.52 3.49 3.51 3.52 3.62 3.70 3.74
LTE 16.32 16.37 16.57 16.16 16.13 16.43 16.22 16.71 16.80 16.92
HSPA 2.47 2.89 2.90 2.75 2.74 2.75 2.72 3.33 3.36 3.46
WiFi 5.08 4.55 5.24 5.65 6.19 6.17 6.19 0.60 0.98 1.33
WiFi 6.55 5.63 6.45 5.45 6.22 5.94 5.81 9.90 8.78 7.96
WiFi 5.54 4.64 4.84 6.23 5.98 5.42 5.92 8.93 8.26 7.41
WiFi 6.13 6.41 5.91 6.81 6.03 6.26 6.23 7.54 8.19 8.34
WiFi 6.95 6.27 5.97 6.65 5.30 5.16 5.76 6.89 6.15 5.61
WiFi 5.14 4.99 5.42 6.21 6.61 5.99 5.44 6.00 5.79 6.68
Table 1: Low Speed Average Data Rate (Mbps) Per Technology (Use Case 1)
Speed
Technology
22
mph
24
mph
26
mph
28
mph
30
mph
32
mph
34
mph
36
mph
38
mph
40
mph
WiMAX 15.91 15.82 15.61 15.55 15.83 15.79 15.90 15.73 15.25 15.91
EVDO 3.80 3.83 3.77 3.80 3.86 3.76 3.77 3.73 3.48 3.80
LTE 16.96 16.93 16.49 16.28 16.45 16.10 15.94 15.81 16.22 16.96
HSPA 3.52 3.46 3.54 3.32 3.17 3.02 3.08 2.99 2.74 3.52
WiFi 3.36 3.29 3.44 3.31 4.14 3.34 3.00 5.13 6.52 3.36
WiFi 6.97 8.37 8.05 8.19 7.75 7.56 6.80 6.70 5.90 6.97
WiFi 6.77 6.81 7.67 6.00 6.84 6.96 7.44 6.10 5.78 6.77
WiFi 7.42 6.89 6.57 6.34 7.13 7.21 7.99 6.86 6.31 7.42
WiFi 4.75 5.13 4.27 5.99 6.27 5.80 6.11 5.54 5.89 4.75
WiFi 6.03 7.84 5.21 5.11 6.76 4.52 4.91 4.31 5.78 6.03
Table 2: High Speed Average Data Rate (Mbps) Per Technology (Use Case 1)

Speed
Technology
2
mph
4
mph
6
mph
8
mph
10
mph
12
mph
14
mph
16
mph
18
mph
20
mph
WiMAX 15.54 15.26 21.18 21.68 21.68 21.70 21.61 21.66 21.61 21.09
EVDO 3.54 3.54 2.00 2.01 2.04 1.94 2.00 1.98 1.99 1.91
LTE 16.33 16.37 16.41 16.24 16.25 16.11 16.05 16.22 16.16 17.12
HSPA 2.47 2.89 0.70 0.84 0.93 0.85 0.76 0.79 0.79 1.64
WiFi 5.09 4.55 7.89 7.23 7.54 7.48 7.83 8.14 7.62 5.58
WiFi 6.56 5.64 7.31 7.34 7.65 7.30 7.56 8.03 7.53 10.00
WiFi 5.55 4.64 7.37 7.47 7.27 7.57 7.31 7.42 7.61 11.32
WiFi 6.14 6.41 8.42 8.27 6.92 8.37 8.08 8.09 7.85 10.49
WiFi 6.95 6.28 8.42 7.99 8.32 8.06 7.24 7.26 7.76 7.24
WiFi 5.15 4.99 6.87 6.98 7.29 7.41 7.85 7.75 7.72 5.59
Table 3: Low Speed Average Data Rate (Mbps) Per Technology (Use Case 2)
Speed
Technology
22
mph
24
mph
26
mph
28
mph
30
mph
32
mph
34
mph
36
mph
38
mph
40
mph
WiMAX 21.60 21.82 21.93 22.06 21.96 21.89 21.88 21.77 21.89 21.97
EVDO 1.90 1.88 1.94 1.92 1.90 1.95 1.94 1.85 1.97 1.99
LTE 17.15 17.28 17.25 17.36 17.30 16.78 16.62 16.97 16.38 16.36
HSPA 1.73 1.78 1.80 1.65 1.64 1.59 1.51 1.45 1.33 1.26
WiFi 6.30 6.59 7.14 7.41 6.97 6.74 6.67 6.99 6.83 6.89
WiFi 9.55 9.58 9.62 10.48 11.25 10.47 9.63 9.73 8.79 8.10
WiFi 10.56 9.35 9.71 8.47 8.65 9.66 8.06 8.96 8.02 8.29
WiFi 10.77 10.57 9.93 9.22 8.48 8.13 7.94 8.24 8.54 9.11
WiFi 6.76 6.34 5.74 5.74 6.18 7.24 8.67 7.55 8.40 7.79
WiFi 4.79 5.42 6.08 7.01 7.89 8.63 8.26 7.83 7.67 6.33
Table 4: High Speed Average Data Rate (Mbps) Per Technology (Use Case 2)

Speed
Technology
2
mph
4
mph
6
mph
8
mph
10
mph
12
mph
14
mph
16
mph
18
mph
20
mph
WiMAX 38.52 37.88 37.24 37.51 37.57 37.53 37.48 38.52 39.09 39.57
EVDO 35.68 35.62 35.34 35.51 35.18 35.44 35.48 36.49 37.33 37.74
LTE 11.14 11.91 12.30 12.35 12.13 12.12 12.28 12.35 11.50 11.02
HSPA 7.08 7.19 7.30 7.45 7.17 7.16 7.14 7.37 7.27 6.99
WiFi 1.39 1.11 1.10 1.38 1.26 1.35 1.42 0.21 0.35 0.65
WiFi 1.21 1.24 1.24 1.13 1.14 1.08 1.18 1.97 1.74 1.56
WiFi 1.29 0.99 1.00 1.11 1.21 1.13 1.21 1.73 1.63 1.49
WiFi 1.38 1.46 1.37 1.53 1.37 1.36 1.37 1.30 1.36 1.44
WiFi 1.12 1.22 1.29 1.36 0.99 1.11 1.17 2.27 2.00 1.81
WiFi 0.99 1.03 1.12 1.16 1.26 1.15 1.03 0.42 0.48 0.53
Table 5: Low Speed Average Number of Users Per Technology (Use Case 1)
Speed
Technology
22
mph
24
mph
26
mph
28
mph
30
mph
32
mph
34
mph
36
mph
38
mph
40
mph
WiMAX 40.07 40.72 41.05 40.90 40.49 41.32 40.30 40.35 40.45 37.09
EVDO 37.95 38.25 38.57 37.98 38.33 38.86 37.85 38.06 37.63 35.08
LTE 10.67 10.20 10.30 10.49 10.28 10.10 10.35 10.33 10.17 12.60
HSPA 6.88 6.58 6.50 6.86 7.01 6.56 7.26 7.52 7.36 7.17
WiFi 0.96 1.36 1.42 1.55 1.61 1.69 1.26 1.18 1.43 1.43
WiFi 1.43 1.40 1.41 1.47 1.33 1.26 1.27 1.11 1.26 1.14
WiFi 1.56 1.46 1.47 1.69 1.37 1.53 1.66 1.50 1.63 1.12
WiFi 1.48 1.44 1.34 1.30 1.22 1.51 1.54 1.60 1.49 1.43
WiFi 1.66 1.58 1.65 1.43 1.47 1.70 1.47 1.65 1.27 1.08
WiFi 0.58 0.62 0.65 0.52 0.55 0.62 0.57 0.64 0.58 1.09
Table 6: High Speed Average Number of Users Per Technology (Use Case 1)

Speed
Technology
2
mph
4
mph
6
mph
8
mph
10
mph
12
mph
14
mph
16
mph
18
mph
20
mph
WiMAX 78.86 79.23 78.72 80.12 79.18 79.75 79.53 78.31 79.20 79.83
EVDO 20.45 20.53 20.83 19.85 20.49 20.24 20.35 19.52 19.44 19.28
LTE 8.25 8.01 7.85 8.24 7.96 7.95 8.14 7.94 7.88 7.77
HSPA 4.14 4.34 4.23 4.29 4.31 4.26 4.24 4.37 4.94 5.34
WiFi 2.60 2.39 2.51 2.61 2.54 2.66 2.74 1.56 1.77 2.12
WiFi 2.16 2.18 2.25 2.22 2.18 2.19 2.24 3.05 2.85 2.77
WiFi 2.46 2.12 2.08 2.10 2.23 2.25 2.32 3.57 3.30 2.99
WiFi 2.82 2.82 2.91 2.83 2.91 2.80 2.79 2.11 2.09 2.13
WiFi 2.18 2.26 2.55 2.45 2.06 2.18 2.22 2.90 2.77 2.59
WiFi 2.11 2.29 2.16 2.34 2.40 2.38 2.26 1.82 1.63 1.63
Table 7: Low Speed Average Number of Users Per Technology (Use Case 2)
Speed
Technology
22
mph
24
mph
26
mph
28
mph
30
mph
32
mph
34
mph
36
mph
38
mph
40
mph
WiMAX 79.87 79.96 80.40 80.39 79.98 80.27 78.97 78.32 79.41 78.96
EVDO 19.80 19.65 19.44 19.91 19.89 18.98 20.17 20.29 20.50 20.76
LTE 7.82 8.08 8.41 7.93 7.89 8.62 8.15 8.44 7.90 7.89
HSPA 5.40 5.55 5.06 5.40 5.10 5.31 5.26 5.55 4.30 4.34
WiFi 2.42 2.81 2.74 2.86 2.68 2.85 2.31 2.24 2.75 2.73
WiFi 2.65 2.41 2.36 2.75 2.49 2.23 2.22 1.95 2.12 2.20
WiFi 2.93 2.78 2.79 3.02 2.71 2.82 2.80 2.55 2.19 2.29
WiFi 2.17 2.12 1.97 1.97 1.89 2.21 2.02 2.08 2.82 2.77
WiFi 2.39 2.32 2.25 2.20 2.20 2.40 2.20 2.21 2.30 2.27
WiFi 1.70 2.00 2.06 2.11 2.22 2.12 2.21 2.19 2.16 2.20
Table 8: High Speed Average Number of UsersPer Technology (Use Case 2)

SINR
Threshold
MCS Data Rate
(Bits/slot)
Slots/Sec Throughput
(Mbps)
BPSK 1/11 91 9000 0.82
QPSK 1/11 182 9000 1.64
BPSK 1/2 500 9000 4.50
BPSK 3/4 750 9000 6.75
QPSK 1/2 1000 9000 9.00
QPSK 3/4 1500 9000 13.50
16-QAM ½ 2000 9000 18.00
16-QAM 3/4 3000 9000 27.00
64-QAM 2/3 4000 9000 36.00
64-QAM 3/4 4500 9000 40.50
Table 9: Simulation Parameters for IEEE 802.11g
SINR
Threshold
(dB)
MCS Data Rate
(Bits/slot)
Slots/Sec Throughput
(Mbps)
3 QPSK ½ 48 102000 4.90
9 QPSK ¾ 72 102000 7.34
11 16-QAM ½ 96 102000 9.79
17 16-QAM ¾ 144 102000 14.69
64-QAM ½ 144 102000 14.69
64-QAM 2/3 192 102000 19.58
64-QAM ¾ 216 102000 22.03
64-QAM 5/6 240 102000 24.48
Table 10: Simulation Parameters for IEEE 802.16e
SINR
Threshold
MCS Data Rate
(Bits/slot)
Slots/Sec Throughput
(Mbps)
QPSK ½ 36 163000 5.89
QPSK ¾ 54 163000 8.80
16-QAM ½ 72 163000 11.74
16-QAM ¾ 108 163000 17.60
64-QAM ½ 108 163000 17.60
64-QAM 2/3 144 163000 23.47
64-QAM ¾ 162 163000 26.41
64-QAM 5/6 180 163000 29.34
Table 11: Simulation Parameters for LTE

SINR
Threshold
MCS Data Rate
(Bits/slot)
Slots/Sec Throughput
(Mbps)
QPSK ¼ 2.34375 384000 0.90
QPSK ½ 4.6875 384000 1.80
QPSK ¾ 7.03125 384000 2.70
16-QAM ½ 9.375 384000 3.60
64-QAM ¾ 14.0625 384000 5.40
64-QAM 4/4 18.75 384000 7.20
64-QAM ¾ 22.9167 384000 8.80
64-QAM 5/6 27.47395 384000 10.55
Table 12: Simulation Parameters for HSPA
SINR
Threshold
(dB)
MCS/
Spreading Factor
(Chips/bit)
Data Rate
(Bits/slot)
Slots/Sec Throughput
(Mbps)
-12.0 QPSK 1/5/32 64 600 0.04
-9.6 QPSK 1/5/16 128 600 0.08
-6.8 QPSK 1/5/8 256 600 0.15
-3.9 QPSK 1/5/4 512 600 0.31
-3.8 QPSK 1/5/4 512 600 0.31
-0.6 QPSK 1/3/2 1024 600 0.61
-0.8 QPSK 1/3/2 1024 600 0.61
1.8 8-PSK 1/3/1.33 1536 600 0.92
3.7 QPSK 2/3/1 2048 600 1.23
3.8 16-QAM 1/3/1 2048 600 1.23
7.5 8-PSK 2/3/0.67 3072 600 1.84
9.7 16-QAM 2/3/0.5 4096 600 2.46
13.3 64-QAM 3/4/0.5 5120 600 3.07
Table 13: Simulation Parameters for EVDO

Figure J: Consolidated Figures 4 and 5
Technology Spectrum Used (MHz)
WiFi Carrier 1 (Channel 1) 22
WiFi Carrier 2 (Channel 2) 22
WiMAX 10
LTE 10
HSPA 5
EVDO 1.25
Total 70.25
Table 14: Spectrum Usage for Spectral Efficiency Calculations
Spectral Efficiency = Total Throughput Achieved by 100 users/Total spectrum Used
0 5 10 15 20 25 30 35 40
0
0.5
1
0.65
0.7
0.75
0.8
0.85
0.9
Speed (in mph)
Impact of Reconfiguration
Aver
age
Thro
ughp
ut (
Mbp
s)
Use Case 2, Carrier 1 Users
Use Case 2, Carrier 2 Users
Use Case 1, Carrier 1 Users
Use Case 1, Carrier 2 Users
View publication statsView publication stats