
Mountain Risk Management: Integrated People … · Carolina Garcia Londoño Tutors: Mattia De...
236
Università degli Studi di Milano-Bicocca Faculty of Mathematical, Physical and Natural Sciences Department of Environmental and Territorial Sciences School of Doctorate of Sciences PhD. Program in Environmental Sciences XXIII Cycle Mountain Risk Management: Integrated People Centred Early Warning System as a risk reduction strategy, Northern Italy PhD Dissertation of: Carolina Garcia Londoño Tutors: Mattia De Amicis, UNIMIB-DISAT Simone Sterlacchini, CNR-IDPA Co-tutors: Alessandro Pasuto, CNR Stefan Greiving, TUDO-Dortmund, Germany Marcel Hurlimman, UPC-Barcelona, Spain Matr. N. 716844 2011
Transcript of Mountain Risk Management: Integrated People … · Carolina Garcia Londoño Tutors: Mattia De...

Università degli Studi di Milano-Bicocca
Faculty of Mathematical, Physical and Natural Sciences Department of Environmental and Territorial Sciences
School of Doctorate of Sciences
PhD. Program in Environmental Sciences XXIII Cycle
Mountain Risk Management: Integrated People Centred Early Warning System as a
risk reduction strategy, Northern Italy
PhD Dissertation of:
Carolina Garcia Londoño Tutors: Mattia De Amicis, UNIMIB-DISAT Simone Sterlacchini, CNR-IDPA Co-tutors: Alessandro Pasuto, CNR
Stefan Greiving, TUDO-Dortmund, Germany Marcel Hurlimman, UPC-Barcelona, Spain
Matr. N. 716844
2011

ii
iii
Para mi querido Coupe de su eterna tormenta

iv

Integrated People Centred Early Warning System as a risk reduction strategy, Northern Italy
v
Abstract A methodology to integrate early warning systems and emergency plans has been elaborated in the framework of the European project Mountain Risks. This methodology, focused on prevention as a key element for disaster risk reduction, was partially applied in the Mountain Consortium of Municipalities Valtellina di Tirano, northern Italy, an area recurrently affected by several mountain hazards.
Results indicate that in the study zone, several valuable risk reduction efforts have been made in the past, including the development of a comprehensive emergency plan. However the tendency is still to direct efforts towards emergency response rather than prevention. Taking into account the current state of disaster management and risk reduction initiatives in the study area, it was decided that the methodology that best fits the present conditions would be a non structural approach, such as an Integrated People Centred Early Warning System (IEWS). The aim of the IEWS is not only to increase the level of awareness and preparedness of the community and decrease its vulnerability, but also to strengthen institutional collaboration, in particular at the local level, in order to assure sustainability of the efforts in the long term. All the EWS (Early Warning System) components are present in the study area, but they display several shortcomings, are individually developed, have little structure and are poorly linked. This lack of integration of the components may render these EWS efforts ineffective. To alleviate this, several actions are proposed to integrate the different risk management strategies into an IEWS (Integrated community based Early Warning System) with a interdisciplinary approach. In addition, in order to create a comprehensive disaster management plan it is necessary to combine those IEWS strategies with the emergency plan already existing in the study area.
This thesis presents some results derived from the process of designing and initially implementing an IEWS. However, more work is necessary to complete the implementation of a sustainable IEWS at Valtellina di Tirano. The design of the IEWS involved several phases, including hazard and risk assessment, analysis of the legal framework and also the application of an extensive social survey to evaluate the levels of perceived risk, awareness, preparedness and information needs of the community. The IEWS also includes the development of educational activities to increase preparedness. These activities were designed by an multidisciplinary group composed of scientists, local leaders and local authorities based on the results of the survey. The activities include an education and communication campaign addressed to the local community and practitioner stakeholders.
Results of the survey show that, despite having good knowledge of previous flooding and mass movements, the population of the study area have low levels of perceived risks and preparedness. However, the population also is interested in being informed about natural hazards, mitigation activities, risk management and emergency procedures. People express willingness to participate in communication campaigns to learn how to be better prepared to react in case of a future event. This include learning about appropriate mitigation activities they can perform themselves to be less vulnerable.
The presented thesis also includes a conceptual contribution which describes some of the difficulties and challenges of developing integrated risk reduction strategies with a multidisciplinary approach, together with some recommendations to overcome them and to improve the current risk management situation of the study area.

Integrated People Centred Early Warning System as a risk reduction strategy, Northern Italy
vi
Riassunto Una metodologia per integrare sistemi di allarme precoce e piani di emergenza è stata elaborata all’ interno del Progetto Europeo Mountain Risks. Tale metodologia, focalizzata sulla prevenzione come elemento chiave per la riduzione dei disastri, è stata parzialmente applicata nella Comunità Montana Valtellina di Tirano, nel Nord Italia, un’area frequentemente colpita da eventi pericolosi tipici delle aree montane.
Dopo aver analizzato l’attuale situazione di gestione del rischio è stato rilevato che l’autorità locale ha compiuto molti importanti sforzi nell’ area di studio per la riduzione del rischio . Tuttavia, la tendenza è ancora quella di indirizzare le attività verso la risposta all’ emergenza piuttosto che alla prevenzione. Considerando l’attuale stato della gestione del rischio e delle iniziative per la sua riduzione in tale area, è stato deciso che la metodologia meglio adattabile alle condizioni presenti è quella basata su un approccio non strutturale: un Sistema Integrato di Allarme Precoce - basato sulle persone (SIAP). Lo scopo del SIAP non è soltanto quello di incrementare i livelli di consapevolezza, la preparazione della comunità e ridurne la vulnerabilità, ma anche rinforzare la collaborazione tra istituzioni, in particolare a livello locale, con lo scopo di assicurare la sostenibilità degli sforzi a lungo termine. Tutte le componenti di un SAP (Sistema di Allarme Precoce) sono presenti nell’area considerata ma presentano alcuni limiti: sono state sviluppate indipendentemente, risultano poco strutturate e debolmente collegate. Ne risulta una mancanza di integrazione che può rendere inefficienti gli sforzi del SAP. Per aumentarne l’efficienza, sono state proposte diverse azioni al fine di integrare le diverse strategie di gestione del rischio in un SIAP mediante un approccio interdisciplinare. Inoltre, per creare un piano globale di gestione del rischio si è evidenziata la necessità di combinare le strategie del SIAP con il piano di emergenza già esistente.
Questa tesi presenta alcuni risultati ottenuti dal processo di design e implementazione iniziale di un SIAP. Per completare l’ implementazione di un SIAP sostenibile nella Comunità Montana Valtellina di Tirano sarebbe necessario, infatti, proseguire il lavoro qui presentato. La progettazione del SIAP implica diverse fasi, che includono: valutazione della pericolosità e del rischio, analisi del quadro normativo e svolgimento di una vasta indagine sociale per valutare i livelli di percezione del rischio, consapevolezza, preparazione e necessità d’informazione della comunità. Il SIAP, inoltre, deve coinvolgere lo sviluppo di attività di educazione al fine di incrementare il livello di preparazione della popolazione alle emergenze. Nell’ambito del lavoro qui presentato sono state progettate queste attività sulla base dei risultati dell’ indagine svolta su un gruppo multidisciplinare composto da scienziati, figure chiave e autorità locali.
I risultati dell’ indagine mostrano che, nonostante esista una memoria storica di alluvioni e frane avvenute in passato, la popolazione della Comunità Montana mostra una scarsa percezione dei rischi naturali e una preparazione insufficiente a possibili eventi. Nonostante ciò, la popolazione è interessata ad essere informata sui pericoli naturali, sulla gestione del rischio e le procedure di emergenza. Gli abitanti hanno espresso, inoltre, la disponibilità a partecipare a campagne educative per imparare a migliorare la loro preparazione ad affrontare futuri eventi; questa comprende attività di mitigazione che loro stessi possono intraprendere per ridurre la loro vulnerabilità.
Questa tesi evidenzia le difficoltà e le sfide che si devono affrontare per sviluppare delle strategie per la riduzione dei rischio con un approccio multidisciplinare. Essa offre inoltre delle raccomandazioni su come superare e migliorare l'attuale situazione del rischio nell'area di studio.
Integrated People Centred Early Warning System as a risk reduction strategy, Northern Italy
vii
Resumen En el marco del proyecto europeo Mountain Risks fue elaborada una metodología para integrar sistemas de alerta temprana con planes de emergencia. Esta metodología, enfocada en la prevención como elemento clave para la reducción de desastres, fue parcialmente aplicada en la Comunidad Montana Valtellina di Tirano, norte de Italia, un área recurrentemente afectada por amenazas típicas de zonas montañosas.
Luego de evaluar la actual situación de la gestión del riesgo, se encontró que en la zona de estudio las autoridades locales han hecho múltiples esfuerzos valiosos para la reducción de riesgos. Sin embargo, todavía hay una tendencia a dirigir tales esfuerzos hacia la atención de emergencia, en vez de orientarlos hacia la prevención. Tomando en cuenta el estado actual de la gestión de riesgo y de las iniciativas para su reducción en la zona de estudio, se decidió que la metodología que mejor se adapta a las condiciones actuales es un enfoque no estructural, como un Sistema Integrado de Alerta Temprana basado en la comunidad (SIAT). El objetivo del SIAT no es sólo aumentar el nivel de conciencia del riesgo y la preparación de la comunidad, disminuyendo así la vulnerabilidad, sino también fortalecer la colaboración institucional, en particular a nivel local, con el fin de asegurar una sostenibilidad de los esfuerzos a largo plazo. Aunque todos los elementos del SIAT están presentes en la zona de estudio, éstos presentan diversas fallas, están desarrollados independientemente, tienen poca estructura y están poco conectados. Esta falta de integración de los componentes puede generar que los esfuerzos del SIAP sean inefectivos. Para solucionar esto, se proponen varias acciones para integrar las diferentes estrategias y conformar así un SIAT. Adicionalmente, con el objeto de crear un plan de gestión de riesgos integral, es necesario combinar esas estrategias del SIAT con el plan de emergencia existente en la zona de estudio.
Esta tesis presenta algunos resultados del proceso de diseño e implementación inicial de un SIAT. Sin embargo, para completar la implementación de un SIAT sostenible en la Comunidad Montana Valtellina de Tirano, es necesario continuar el trabajo. El diseño del SIAT comprendió diferentes fases, incluyendo un análisis de las amenazas y del riesgo y un análisis del marco legal, además de la aplicación de una extensa encuesta para evaluar los niveles de riesgo percibido, conciencia del riesgo, preparación y necesidades de información de la comunidad. El SIAT también incluye el desarrollo de campañas educativas para incrementar la preparación. Estas actividades fueron diseñadas por un grupo multidisciplinario compuesto de científicos, líderes locales y autoridades locales, basados en los resultados de la encuesta. Las actividades incluyeron una campaña de educación y comunicación dirigida a la comunidad local y a todos los técnicos y gobernantes interesados.
Los resultados de la encuesta muestran que a pesar de tener un buen conocimiento de las pasadas inundaciones y deslizamientos, la población de la zona de estudio tiene bajos niveles de riesgo percibido y de preparación. Sin embargo, la población está interesada en ser informada acerca de amenazas naturales, actividades de mitigación, gestión del riesgo y procedimientos de emergencia. Los entrevistados expresaron su disposición a participar en campañas de educación para aprender cómo estar mejor preparados para reaccionar en caso de un nuevo evento. Esto incluye aprender acerca de las actividades de mitigación apropiadas que ellos pueden desarrollar por sí mismos para ser menos vulnerables.
La tesis también incluye una contribución conceptual que describe algunas de las dificultades y retos a afrontar en el desarrollo de estrategias integradas de reducción del riesgo con un enfoque multidisciplinario, junto con algunas recomendaciones para superarlas y para mejorar la actual situación de gestión del riesgo en la zona de estudio.

Integrated People Centred Early Warning System as a risk reduction strategy, Northern Italy
viii
Integrated People Centred Early Warning System as a risk reduction strategy, Northern Italy
ix
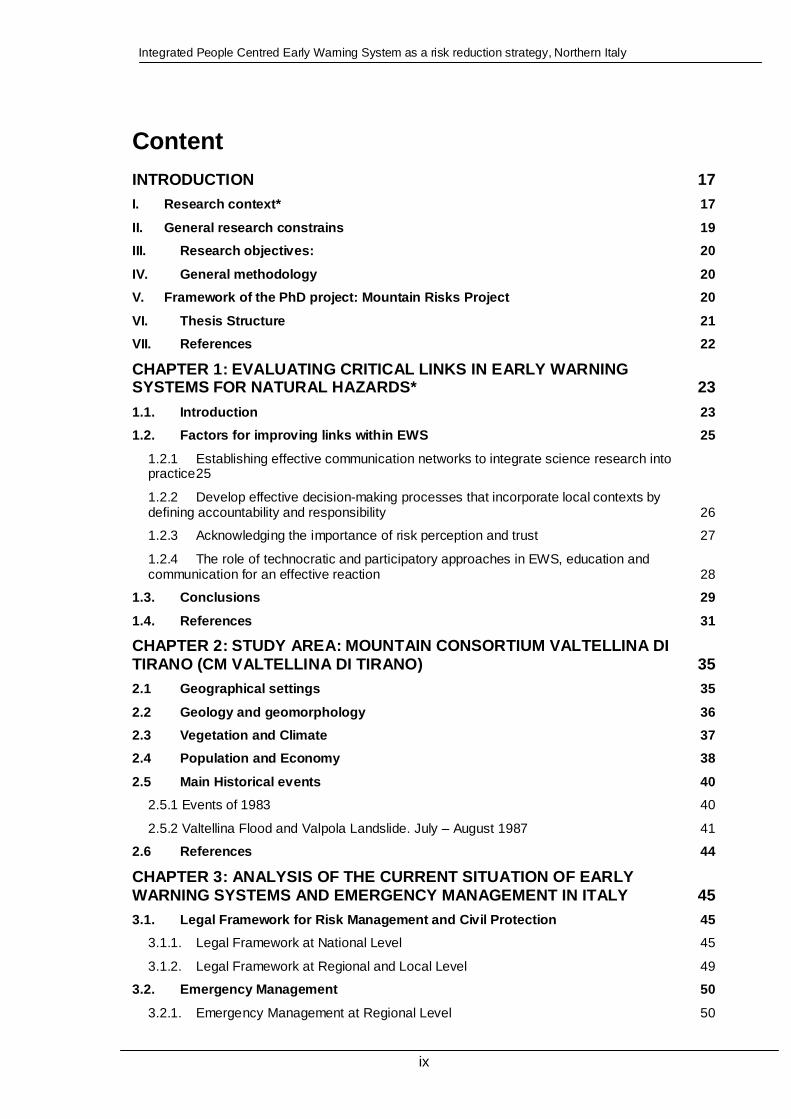
Content INTRODUCTION 17
I. Research context* 17
II. General research constrains 19 III. Research objectives: 20
IV. General methodology 20 V. Framework of the PhD project: Mountain Risks Projec t 20
VI. Thesis Structure 21 VII. References 22
CHAPTER 1: EVALUATING CRITICAL LINKS IN EARLY WARNI NG SYSTEMS FOR NATURAL HAZARDS* 23
1.1. Introduction 23 1.2. Factors for improving links within EWS 25
1.2.1 Establishing effective communication networks to integrate science research into practice 25
1.2.2 Develop effective decision-making processes that incorporate local contexts by defining accountability and responsibility 26 1.2.3 Acknowledging the importance of risk perception and trust 27
1.2.4 The role of technocratic and participatory approaches in EWS, education and communication for an effective reaction 28
1.3. Conclusions 29
1.4. References 31
CHAPTER 2: STUDY AREA: MOUNTAIN CONSORTIUM VALTELLI NA DI TIRANO (CM VALTELLINA DI TIRANO) 35
2.1 Geographical settings 35
2.2 Geology and geomorphology 36 2.3 Vegetation and Climate 37 2.4 Population and Economy 38
2.5 Main Historical events 40 2.5.1 Events of 1983 40
2.5.2 Valtellina Flood and Valpola Landslide. July – August 1987 41 2.6 References 44
CHAPTER 3: ANALYSIS OF THE CURRENT SITUATION OF EAR LY WARNING SYSTEMS AND EMERGENCY MANAGEMENT IN ITALY 4 5
3.1. Legal Framework for Risk Management and Civil Prote ction 45 3.1.1. Legal Framework at National Level 45
3.1.2. Legal Framework at Regional and Local Level 49 3.2. Emergency Management 50
3.2.1. Emergency Management at Regional Level 50

Integrated People Centred Early Warning System as a risk reduction strategy, Northern Italy
x
3.2.2. Emergency Management at Local Level: Municipal Emergency Plans 54 3.3. Early Warning Systems in Italy 55
3.3.1. National Early Warning System – Italy 55
3.3.2. Warning System at Regional and Local Level 58 3.4. Regional Qualitative and Quantitative Hazard, Vulne rability and Risk Assessment of the CM Valtellina di Tirano 61
3.5. Emergency Plans of the CM Valtellina di Tirano 64 3.6. Discussion 67
3.7. References 68
CHAPTER 4: DEVELOPMENT OF A PEOPLE CENTRED EARLY WA RNING SYSTEM FOR MOUNTAIN RISKS: CHALLENGES, LIMITATIONS AND STRATEGIES 69
4.1. Components of Early Warning System: Challenges, lim itations and strategies 69 4.1.1 Risk Knowledge: systematically collect data and undertake risk assessments 69
4.1.2 Monitoring and Warning: develop hazard monitoring and early warning services 69 4.1.3 Dissemination and Communication: communicate risk information and Early Warnings 70
4.1.4 Response Capability: build national and community response capabilities 71 4.2. Discussion and general recommendations 71
4.3. Conclusions 72 4.4. References 73
CHAPTER 5: METHODOLOGY FOR IMPLEMENTING INTEGRATED EARLY WARNING SYSTEMS 74
5.1 Analysis of the current methodologies 74
5.1.1 EWS models 75 5.1.2 Risk management methodologies 79
5.2 Components of an Integrated Early Warning System 82 5.3 Methodology for implementing People Centred Integra ted EWS 89
5.3.1. Detailed methodology for developing a IEWS 89 5.3.2. Schematic guidelines to develop IEWS 93
5.4 Discussion 95 5.5 References 95
CHAPTER 6: COMMUNITY RESPONSE CAPACITY ANALYSIS 97
6.1. Methodology 97 6.2. Design 99
6.3. Distribution 99 6.4. Results 99
6.4.1 Demographic data and other respondents data 99 6.4.2 Hazards previous experiences 101
6.4.3 Perception of the risks 102 6.4.4 Hazard Knowledge 105

Integrated People Centred Early Warning System as a risk reduction strategy, Northern Italy
xi
6.4.5 Perceived preparedness 108 6.4.6 Trust 111 6.4.7 Self Efficacy and self protective behaviour 113
6.4.8 Preferences for warning and emergency procedures 113 6.4.9 Legislation on spatial planning and natural hazards 114
6.4.10 Participation in past workshops or meetings about risk and natural hazards and emergency exercises 115
6.5. Discussion and recommendations 116
6.6. Conclusions 118 6.7. References 119
CHAPTER 7: VULNERABILITY ASSESSMENT AT MUNICIPAL SC ALE 121
7.1 Introduction 121 7.2 Vulnerability assessment 122
7.2.1 Quantitative Vulnerability: Census based 123 7.2.2 Qualitative Social Vulnerability: Survey based 129
7.3 Past events related to natural hazards 133 7.4 Municipal debris flow hazard level 135
7.5 Discussion 137 7.6 Conclusions 138 7.7 References 139
CHAPTER 8: COMMUNICATION AND EDUCATION STRATEGIES 1 41
8.1 Survey results relevant to the communication and ed ucation campaigns 142
8.1.1 Results regarding information available and actual levels of knowledge 143 8.1.2 Results regarding knowledge of emergency management and emergency procedures 145
8.1.3 Results regarding the perceived level of own preparedness 146 8.1.4 Results regarding new information on risks related to natural hazards 147 8.1.5 Results regarding information needs of risks related to natural hazards 150
8.1.6 Results regarding importance and willingness to participate in a education-communication campaign 151
8.2 Discussion 152
8.3 Development of Education – Communication strategies 153 8.3.1 Educational Project for the Schools 154
8.3.2 Collaboration with IREALP-RINAMED 155 8.3.3 Integrative Communication Campaign (Adapted from Fontana et al., submitted) 157
8.4 Conclusions 158 8.5 References 159
CHAPTER 9: MOUNTAIN RISKS AND RISK GOVERNANCE: CHAL LENGES AND LESSONS LEARNT 161
9.1. Introduction 161
9.2. Study Areas 163
Integrated People Centred Early Warning System as a risk reduction strategy, Northern Italy
xii
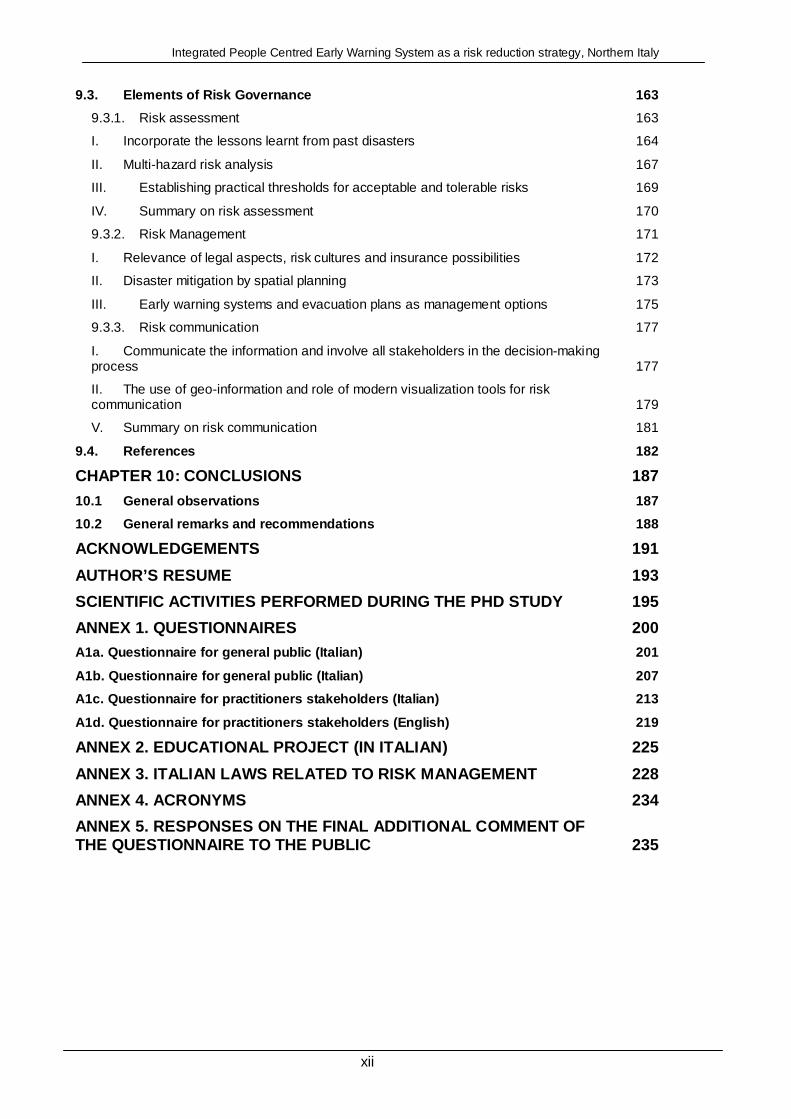
9.3. Elements of Risk Governance 163 9.3.1. Risk assessment 163 I. Incorporate the lessons learnt from past disasters 164
II. Multi-hazard risk analysis 167 III. Establishing practical thresholds for acceptable and tolerable risks 169
IV. Summary on risk assessment 170 9.3.2. Risk Management 171
I. Relevance of legal aspects, risk cultures and insurance possibilities 172 II. Disaster mitigation by spatial planning 173
III. Early warning systems and evacuation plans as management options 175 9.3.3. Risk communication 177
I. Communicate the information and involve all stakeholders in the decision-making process 177 II. The use of geo-information and role of modern visualization tools for risk communication 179 V. Summary on risk communication 181
9.4. References 182
CHAPTER 10: CONCLUSIONS 187
10.1 General observations 187 10.2 General remarks and recommendations 188
ACKNOWLEDGEMENTS 191
AUTHOR’S RESUME 193
SCIENTIFIC ACTIVITIES PERFORMED DURING THE PHD STUDY 195
ANNEX 1. QUESTIONNAIRES 200
A1a. Questionnaire for general public (Italian) 201
A1b. Questionnaire for general public (Italian) 207 A1c. Questionnaire for practitioners stakeholders ( Italian) 213
A1d. Questionnaire for practitioners stakeholders ( English) 219
ANNEX 2. EDUCATIONAL PROJECT (IN ITALIAN) 225
ANNEX 3. ITALIAN LAWS RELATED TO RISK MANAGEMENT 22 8
ANNEX 4. ACRONYMS 234
ANNEX 5. RESPONSES ON THE FINAL ADDITIONAL COMMENT OF THE QUESTIONNAIRE TO THE PUBLIC 235

Integrated People Centred Early Warning System as a risk reduction strategy, Northern Italy
xiii
Figures Figure 1. General Framework of the Mountain Risks Research Training Network (Source:
http://www.unicaen.fr/mountainrisks ).................................................................................. 21 Figure 1.1. The four components of people-centred early warning systems (Adapted from
United Nations, 2006)......................................................................................................... 24 Figure 1.2. Diagram of EWS with factors to improve the linking of subsystems ............................ 30 Figure 2.1. Location of the CM Valtellina di Tirano....................................................................... 35 Figure 2.2. Geologic Map of the middle Valtellina Valley.............................................................. 36 Figure 2.3. Inhabited alluvial fan typical from the Valtellina Valley, Municipality of Bianzone. ....... 37 Figure 2.4. Mean Annual rainfall CM Valtellina di Tirano (Adapted from Ceriani and Carelli,
1991).................................................................................................................................. 38 Figure 2.5. Consequences of the landslides of May 1983, a) buildings destroyed by the debris
flow in Tresenda; b) debris flow in Valgella.......................................................................... 41 Figure2.6. Remnants of Condominio La Quieta, destroyed by a debris flow in July 18th 1987,
leaving 11 deaths, Tartano (Photo from http://www.logifranchi.it)......................................... 42 Figure 2.7. Val Pola Landslide, July 1987. (Photo Regione Lombardia) ....................................... 42 Figure 2.8. Town of San Antonio Morignone, a) one year before the event; b) First flooding
leading to the evacuation of the town; c) town after being buried by the Val Pola Landslide. 43 Figure 3.1. Evolution of the Civil Protection Legislation in Italy..................................................... 45 Figure 3.2. National System of Civil Protection (Adapted from Regione Lombardia, 2004) ........... 47 Figure 3.3. Simplified structure of the National Department of Civil Protection in the late 1990’s
(Adapted from Alexander, 2002) ......................................................................................... 48 Figure 3.4. Authorities involved in emergency management according to the type of event:
Augustus Method (Adapted from Pagliara, 2010) ................................................................ 52 Figure 3.5. Procedural Scheme for Emergency Management based on the subsidiarity
principle according to the DGR VIII/4732 of 2007 (from Regione Lombardia, 2007)............. 53 Figure 3.6. Components for the elaboration of the Municipal Emergency Plan in Lombardy
Region according to the DGR VIII/4732 of 2007 (from Regione Lombardia, 2007)............... 54 Figure 3.7. Cycle of testing and updating for the municipal emergency plans as established
by the DGR VIII/4732 of 2007 (from Regione Lombardia, 2007).......................................... 55 Figure 3.8. General Components of the national Early Warning System (Pagliara, 2010)............. 57 Figure 3.9. Example of a Criticity Bulletin issued by the Director of the UO (Regione Lombardia,
2009).................................................................................................................................. 59 Figure 3.10. Regional Homogeneous Alert Zones for hydrogeological and hydraulic risks,
according to the DGR 22/12/2008 n. 8/8753 (Regione Lombardia, 2009).. .......................... 60 Figure 3.11. Qualitative Geologic and Geohydrologic Hazard Map of the CM Valtellina di
Tirano, according to the DGR 8/1566. Elaborated by the Mountain Consortium, CNR-IDPA and UNIMIB........................................................................................................................ 62
Figure 3.12. Official Risk Matrix of the Lombardy Region according to the DGR 8/1566............... 62 Figure 3.13. Qualitative Risk Map of the CM Valtellina di Tirano. Elaborated by the Mountain
Consortium, CNR-IDPA and UNIMIB, according to the DGR 8/1566 ................................... 63 Figure 3.14. Debris flow hazard map with different hazard classes (Blahut, 2010)........................ 64 Figure 3.15. Example of risk scenario in CM Valtellina di Tirano. Risk Scenario Grosio 4............. 65 Figure 3.16. Example of emergency structures presented in the risk scenario Grosio 4 ............... 65 Figure 4.1. Recommended actions to improve effectiveness of EWS........................................... 72 Figure 5.1. The general components of an integrated warning system (from Mileti and
Sorenson, 1990)................................................................................................................. 75 Figure 5.2. The four components of people-centred early warning systems (from UNISDR –
PPEW, 2005)...................................................................................................................... 75 Figure 5.3. Integrated systems model of early warning system. Linear technical warning
service in box at bottom. Feedback paths indicated in red (from Basher, 2006)................... 76

Integrated People Centred Early Warning System as a risk reduction strategy, Northern Italy
xiv
Figure 5.4. Generic forecasting/warning system (from Carmen Schlosser, unpublished in Twigg 2003) ........................................................................................................................76
Figure 5.5. Principal components of natural hazard early warning systems (from Parker, 2005)....77 Figure 5.6. General ILEWS structure (from Bell et al., 2009).........................................................77 Figure 5.7. Synthetic phases of early warning systems (from Villagran et al., 2006)......................78 Figure 5.8. Effective Early Warning System Model (from Leonard et al., 2008) .............................79 Figure 5.9. Process of introducing community-based disaster risk management (from
Bollin, 2003). .......................................................................................................................80 Figure 5.10. Guidelines for Implementing the Community Emergency Response and Disaster
Mitigation (CERDM) model (from Interiano, 2010)................................................................82 Figure 5.11. Guidelines for Implementing an Integrated Early Warning System (IEWS) ................94 Figure 6.1. Distribution per age group of the surveyed population versus total population of
the study area....................................................................................................................100 Figure 6.2. Distribution per municipality of the surveyed population versus total population ........101 Figure 6.3. Perceived danger of different hazards ......................................................................103 Figure 6.4. Estimation of the likelihood of several risky events....................................................104 Figure 6.5. Perceived knowledge about mass movement and flooding .......................................107 Figure 6.6. Perceived triggering factors for mass movements and flooding.................................108 Figure 6.7. Perceived preparedness levels for mass movement and flooding .............................110 Figure 6.8. Levels of trust in the information about risks associated to natural hazards coming
from different sources........................................................................................................112 Figure 6.9. Levels of agreement regarding changes in the legislation .........................................115 Figure 6.10. Participation in past workshops on natural hazards and emergency exercises ........116 Figure 7.1. Methodological Scheme ...........................................................................................122 Figure 7.2. Quantitative relative social vulnerability.....................................................................126 Figure 7.3. Quantitative relative economic vulnerability...............................................................127 Figure 7.4. Quantitative relative physical vulnerability.................................................................128 Figure 7.5. Reaction Capacity – Qualitative Vulnerability at municipal level ................................131 Figure 7.6. Relative Reaction Capacity – Qualitative Vulnerability; normalized at municipal
level ..................................................................................................................................132 Figure 7.7. Map of the municipal distribution of the debris flow events and density of events
(Provided by Blahut and Frigerio, 2010).............................................................................134 Figure 7.8. Number of debris flow events vs. density of events in each municipality (Data
provided by Blahut and Frigerio, 2010)...............................................................................134 Figure 7.9. Number of debris flow events vs. density of events in each municipality (Data from
Blahut et al., subm.)...........................................................................................................135 Figure 7.10. Debris Flow Hazard Map of the CM Valtellina di Tirano (Blahut et al, 2010) ............136 Figure 7.11. Relative Debris Flow Hazard Map at municipal level of the study area ....................137 Figure 8.1. Iconic-text symbols of the communication campaign (Designed by Fontana and
Rossetti)............................................................................................................................157 Figure 9.1. Distribution of five main groups of records of the disaster database of CM
Valtellina di Tirano. ............................................................................................................166

Integrated People Centred Early Warning System as a risk reduction strategy, Northern Italy
xv
Tables Table 2.2. Gender distribution of the population in the municipalities of the CM Valtellina di
Tirano (Data extracted from ISTAT, 2001) 39 Table 2.3. Age distribution of the population in the municipalities of the CM Valtellina di Tirano
(Data extracted from ISTAT, 2001). 39 Table 2.4. Age variability of the population in CM Valtellina di Tirano (Adapted from CM
Valtellina di Tirano, 2000). 40 Table 3.1. Support functions according to the Augustus Method 51 Table 3.2. Criticality levels and Alert Code according to the DGR 22/12/2008 n. 8/8753
(Regione Lombardia, 2009) 60 Table 3.3. Threshold values for the Homogeneous Alert Zones for hydrogeological and
hydraulic risks in Lombardy Region according to the DGR 22/12/2008 n. 8/8753 (Regione Lombardia, 2009) 61
Table 3.4. Classification of the elements at risk according to the DGR 8/1566 63 Table 3.5. Risk Scenarios present in the CM Valtellina di Tirano by the Mountain Consortium,
CNR-IDPA and the University Milano Bicocca 66 Table 5.1. Stakeholders of EWS 74 Table 5.2. Comparison of varying components between technical-traditional, community
based and people centred integrated EWS 84 Table 5.3. Components and tasks to develop a IEWS* 85 Table 6.1. Content of the questionnaire applied to the general public of the study area 98 Table 6.2. Age and gender of questionnaire respondents 100 Table 6.3. Characteristics of the questionnaire respondents 101 Table 6.4. Previous experience with disasters related to natural hazards 102 Table 6.5. Levels of concern about natural hazards 102 Table 6.6. Perceived danger of different hazards 103 Table 6.7. Type of hazards of most concern 103 Table 6.8. Estimation of the likelihood of several risky events 104 Table 6.9. Risk Perception distribution according to gender and age groups 105 Table 6.10. Risk Perception distribution according to gender and age groups 105 Table 6.11. Perceived knowledge about mass movement and flooding 106 Table 6.12. Ranking of perceived triggering factors 108 Table 6.13. Perceived preparedness levels for mass movement and flooding 109 Table 6.14. Levels of trust in the information about risks associated to natural hazards coming
from different sources 111 Table 6.15. Responses regarding the issuing of a warning and the emergency management 114 Table 6.17. How agree are you that the legislation should: 115 Table 6.18. How agree are you that the legislation should: 116 Table 7.1. Quantitative Vulnerabilities indexes and indicators census based 123 Table 7.2. Detailed Quantitative Vulnerabilities census based indexes and indicators, with
attributes and references 124 Table 7.3. Example of the normalization of the vulnerability indicators values. 125 Table 7.4. Qualitative vulnerability indexes and indicators 129 Table 7.5. Detailed Qualitative Vulnerability survey based indexes and indicators, with classes
and references 130 Table 7.7. Debris flow hazard distribution in the municipalities of the CM Valtellina di Tirano
(Data provided by Blahut, 2011) 136 Table 7.8. Comparative table of vulnerabilities, hazard and reaction capacity of the CM
Valtellina di Tirano 138 Table 8.1. Survey results for information received on risks related to natural hazards 143 Table 8.2. Survey results about knowledge of the emergency plan, emergency management
and legislation 145 Table 8.3. Results regarding preparedness levels 146

Integrated People Centred Early Warning System as a risk reduction strategy, Northern Italy
xvi
Table 8.4. Results of the survey regarding new information on risks related to natural hazards 147 Table 8.5. Results regarding the information needs of risks related to natural hazards 150 Table 8.6. Results of the survey regarding the willingness to participate in an informative
meeting about risks related to natural hazards 151 Table 8.6b. Importance of an educational meeting about natural hazards 151 Table 8.7. Participants of the educational activities developed in May 2010 at the Scuola
Superiore di Tirano 155 Table 8.8. Participants of the project about risk education developed by the IREALP 156 Table 8.9. Participants of the final event of the project about risk education developed by the
IREALP 156 Table 9.1. Cross tabulation with results of Previous Experiences versus perceived levels of risk,
knowledge and preparedness of the population (Adapted from Garcia et al., in prep.) 165

Introduction
17
Introduction
I. Research context*
The United Nations-International Strategy for Disaster Reduction (UN-ISDR) defines early warning as ‘the provision of timely and effective information, through identified institutions, that allows individuals exposed to a hazard to take action to avoid or reduce their risk and prepare for effective response’ (UN/ISDR 2004). While early warning is restricted to the timely emission of a warning before an impeding crisis, Early Warning System (EWS) include not only the warning itself, but as a system, it includes an integrated set of elements that interact long before the crisis starts, with the main goal of achieving risk reduction. According to UN/ISDR – PPEW (2005), a complete and effective EWS must comprise four inter-related elements: i) risk knowledge: assessment of the relevant hazards and vulnerabilities considering their dynamics and variability; ii) monitoring and warning service: capacity to monitor hazard precursors, forecast the hazard evolution, and issue timely and accurate warnings; iii) dissemination and communication: dissemination of clear and understandable warnings with prior preparedness information, using multiple communication channels to assure that the warnings reach those at risk; and iv) response capability: systematic education and preparedness programmes so authorities and those at risk understand their risks and be prepared to properly react. Even if in the common conception EWSs consist of a ‘warning chain’ of elements organized in a linear sequence, in reality there is not a sequence but each element has multiple linkages and interacts with all the other elements in an integrated scheme (Basher 2006). Consequently, a weakness or failure in any element or linkage could result in failure of the whole system (UN 2006; Garcia & Fearnley, subm.). Ultimately, as a system, an EWS should be judged not by the quality of its individual components, but by its effectiveness at achieving the desired result, which can only be attain if the elements and the linkages are well-understood, well-designed and well-operated (Basher 2006). Although the element of “monitoring and warning service” has been the aspect of EWSs that traditionally has received most attention, nowadays it is been broadly recognized that a precise forecast is insufficient by itself to achieve the main goal of any EWS which is reducing damages and loss of lives. Moreover, even if EWSs have been traditionally conceived as hazard-focused, in reality disasters are the result of a complex combination of multiple factors. Therefore, EWSs should be holistic, having a multi-hazard approach, considering the most relevant vulnerability elements, the response capabilities, the way warnings are communicated and acted on and the dynamics of the evacuation processes. In reality, most failures in EWSs typically occur within the communication and preparedness elements (Southern 1995, Cardona 1997). Despite the advance in technology for the dissemination of the message, the lack of understanding of the warning and the lack of knowledge of how to properly react remain as some of the biggest shortcomings of the system (UN 2006, IFRC 2009), The previous reflects the need for a more significant role of the human factor on risk mitigation and EWSs in general (Twigg 2002, Bird et al. 2010). In order to accomplish the necessary constant and effective integration of the four factors of EWS, it is fundamental to involve all the stakeholders in the system. Even if scientists and technologists have typically been the core actors in EWSs, the role of the population is fundamental to develop sustaining warning capabilities, especially on the mitigation and preparedness components (Wisner et al. 2004, Pearce 2005, Basher, 2006). Low engagement and empowerment of those at risk, during the design and operation of the warning system, may generate a lack of sense of ownership of the system and create mistrust towards the experts and authorities (Paton 2008). In addition, the dominance of the experts can cause in the population a lack of understanding of: the meaning of a warning, the warning uncertainty, the nature of false alarms and the necessary responses to different types of warnings (Twigg 2002). The previous do not pretend to underestimate the role of the experts, on the contrary, to be effective, it is fundamental that EWSs have a strong multidisciplinary knowledge base, combining natural and social science fields, in a systemic, crosscutting and applied research approach. Ultimately, for an EWS to be effective, it should be integrated, holistic, technically systematic and people-centred (Zschau & Küppers 2003, Cardona 2004, EWC II 2004, Wisner et al. 2004, Basher 2006, Villagran & Bogardi 2006, IFRC 2009, Garcia & Fearnley, subm.).
* From: Garcia C., Sterlacchini S., De Amicis M., Pasuto A. and Greiving S. 2010. Community Based Early Warning System for mountain risks, northern Italy: identifying challenges and proposing strategies. Proceedings: International Conference “Mountain Risks: bringing science to society”: 291-299.

Integrated People Centred Early Warning System as a risk reduction strategy, Northern Italy
18
People-Centred or Community Based Early Warning Systems (CB-EWS) are recognized by institutions as the UN as an effective and important strategy for disaster risk reduction. According to UN/ISDR, the Asian Ocean tsunami in December 2004 was probably the loudest wake up call, in recent history, indicating the urgent need to have effective CB-EWS in place, in all countries and regions, and for all types of hazards. Despite the broad destruction caused by the tsunami, local community based initiatives, developed since before the event, proved to be successful (Subramanian 2005). According to the UN (2006), the objective of CB-EWS is to empower individuals and communities threatened by hazards to act in sufficient time and in an appropriate manner so as to reduce the possibility of personal injury, loss of life, damage to property and the environment and loss of livelihoods. CB-EWSs do not only aim to increase the level of preparedness of the community and decrease its vulnerability, but also to strengthen institutional collaboration, in particular local institutions, in order to assure a continuity of the efforts. The previous is only possible with (i) constant linking and interaction among all the elements of the CB-EWS, (ii) by focusing on the management of risks rather than just warning of hazards and (iii) by emphasizing the fundamental role of the human elements of the system through a continuous participation and feedbacks among all the actors, including the governmental entities, the at risk communities, the local technicians and the research community.
Currently CB-EWS is a strategy broadly used especially in developing countries and has proved its effectiveness in many crisis all over the world (Peralta 2008, Practical Action-Bangladesh 2009, UN/ISDR 2010). However, there are really few applications of CB-EWS in developed countries. Particularly in Western Europe, risk reduction efforts have been at regional scale and usually focused on risk knowledge, monitoring, forecasting and warning dissemination, while preparedness of the population has been commonly neglected. Additionally, people at risk do usually not assume an active role in risk reduction, but rather transfer this responsibility to the government and experts (Bird et al., 2009). As result, the response capability of the population, i.e. its ability to react sensibly when facing a crisis caused by natural hazards, is compromised. Moreover, most EWS scientific projects funded by the European Union usually have as main goal to achieve a timely emission of the warning, without considering the whole system, neither the response capability. In addition, the projects usually have just partial interaction with local technicians and government and do not include any involvement of the exposed population in general. Some of those projects are: SLEWS (A Sensorbased Landslide Early Warning System), SAFER (Seismic Early Warning for Europe), DEWS (Distant Early Warning System), ILEWS (Integrative Landslide Early-Warning Systems) and NEAREST (Integrated observations from NEAR shore sourcES of Tsunamis: towards an early warning system).
Italy is one of the most multi-hazardous countries in Europe. The country is characterized by a marked heterogeneity among its regions both geographically and culturally. Each region has its own risk management legal framework that considers the hazards presented in each territory. In particular for Lombardy Region, the risk management framework is based on the “Augustus Method” established on the principles of simplicity and flexibility (Galanti, 1997). The main tool for emergency management is a Municipal Emergency Plan based on the preliminary definition of possible risk scenarios. The municipal emergency plans should also include the description of the warning systems and the intervention models with detailed procedural chains for every possible scenario. Even if each municipality is responsible by law for the elaboration of the municipal emergency plans, they can transfer this responsibility to another entity in case of lacking the necessary resources to elaborate the plan. In the study zone most municipalities delegated the elaboration of the emergency plan to the Mountain Consortium authorities. In particular for hydro-geological hazards, the risk scenarios of the Municipal Emergency Plans in the study zone were defined by the combination of local expert criteria and the use of risk maps. In Lombardy region there are no legal standard procedures for the elaboration of hazard, vulnerability and risk maps using scientifically sound criteria. For the previous reason, in the CM Valtellina di Tirano the risk maps, scale 1:10.000, are a result of crossing maps of elements at risk with hazards maps derived from Feasibility Maps (carta di Fattibilità, in Italian). The feasibility maps, which are at the same time the main tool for spatial planning, result from combining geomorphologic and hydrogeologic maps with buffer zones, but lack a real hazard analysis.
While the Civil Protection is the operative body in charge of the emergency management at the national level, the mayor is the principal authority of the local civil protection and the legal responsible for the protection of the population. The mayor is specifically responsible of managing the emergency and is in charge of risk communication and preparedness education for the population. In spite of that, preparation activities organized by municipalities are almost inexistent, and most of the few existing educational activities are isolated efforts of some academic institutions, the Civil Protection and the Italian National Institute of Geology and Volcanology (INGV). Even if the National Civil Protection has

Introduction
19
been increasingly involved in education campaigns, most of those campaigns have consisted only in the passive dissemination of information without including any active role of the public. In some particular regions and provinces the local Civil Protection has organized evacuation drills involving the population. However, these valuable efforts remain isolated in a domain where the population is usually excluded of any prevention and preparedness activities.
Taking into account the actual state of disaster risk reduction initiatives in the study area, it was decided that the methodology that will better fit and could help to improve the risk management would be a non structural approach to DRR such as a CB-EWS**. The process of designing the CB-EWS involved several phases, including hazard and risk assessment, analysis of the legal framework and also the application of an extensive social survey to evaluate the levels of perceived risks, awareness, preparation and information needs of the community. The proposed CB-EWS also included the design of prevention and monitoring strategies and preparedness activities, including a communication campaign created by an interdisciplinary group to inform and educate the community and practitioner stakeholders. During the design and partial implementation of the CB-EWS, several challenges related to any multidisciplinary work with participatory approach were faced. Next, is presented a conceptual contribution that contains the description of some of these challenges, together with some recommendations to overcome them and to improve the current risk management situation of the study area.
This thesis intends to provide a better understanding of the situation of risk management, and in particular, Early Warnings Systems, in northern Italy.
II. General research constrains ***
As can be expected from any scientific activity some limitations and constrains were faced during this research, it is important to mention them as they become also part of the findings, challenges and ways forward for future research projects.
The fact that there was not budget available for instrumentation determined that the proposed EWS should be non structural, with a strong interaction with local community and focused on prevention. In addition to the economic constraints, there was also a restricted time frame for the activities comprising 30 months, which include not only the research development but also all the academic activities typical of PhD studies and the process of learning a new language. The latter, even if not a requirement of the research, proved to be essential to facilitate the interaction with the local people, including population, technicians, authorities and researchers. An additional time constrain was the necessity to adapt the research activities to schooling schedules, including holidays and examination periods.
Regarding the present information, it was necessary to deal with different scales which made difficult the integration of the elements. For example, while the new quantitative hazard-risk analysis was developed at regional scale, the emergency management plans are at local scale.
It established that the research should be interdisciplinary, involving as possible natural and social sciences. This, even if truly enriching and essential to assure an integrated research, slowed down the research process as it was constantly necessary to reach a consensus about the contrasting approaches and different definitions of same topics.
The need to foster interaction between several institutions and people in order to co-involve them in the project was also understood. It is necessary to invest a great amount of time and energy to contact them and to persuade them to participate. Even if it is a hassle typical of applying sciences outside the academic environment, it is greatly rewarding and is the only way to assure a continuity of the process, once the research project is finished.
** Posterior insights during the research process lead to a change in the choice of the most approapiate EWS type. Even if at the beginning of the research the CBEWS was considered to be the most appropriate, after posterior analysis presented on this work, it was found that the proposed Integrated People Centred Early Warning System is the most comprehensive and widely applicable one. *** From: Garcia C., Sterlacchini S., De Amicis M., Pasuto A. and Greiving S. 2010. Community Based Early Warning System for mountain risks, northern Italy: identifying challenges and proposing strategies. Proceedings: International Conference “Mountain Risks: bringing science to society”: 291-299.
Integrated People Centred Early Warning System as a risk reduction strategy, Northern Italy
20
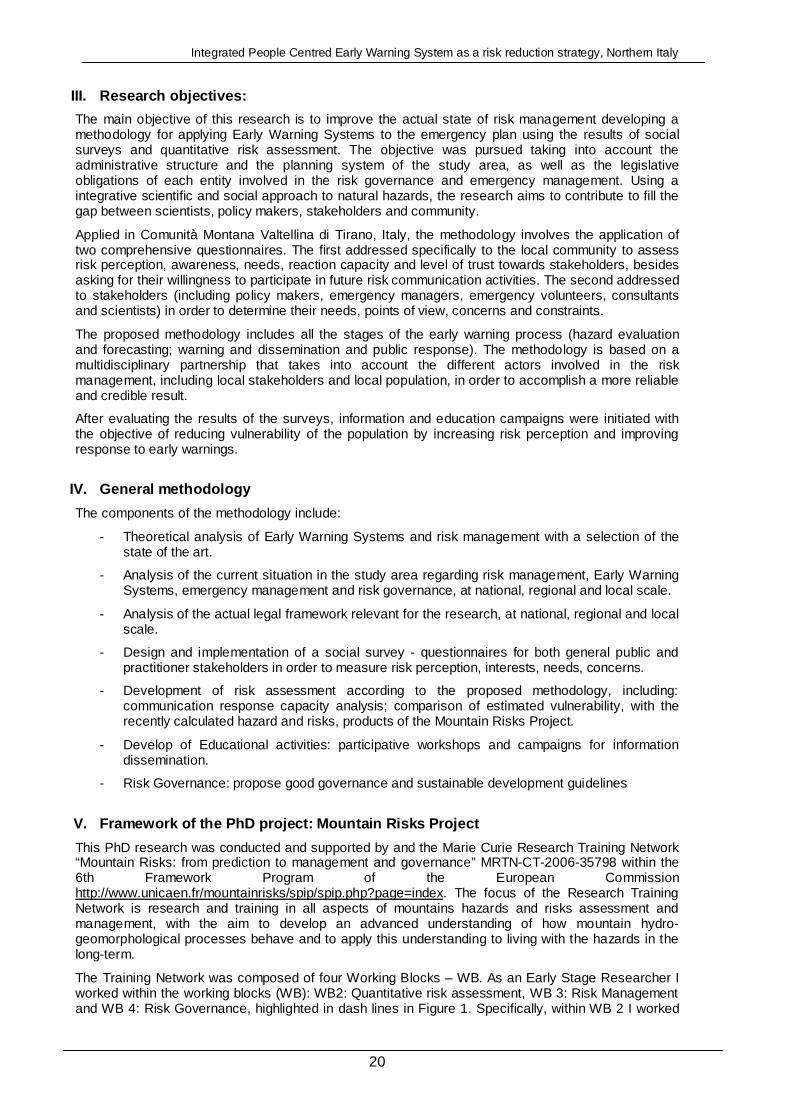
III. Research objectives:
The main objective of this research is to improve the actual state of risk management developing a methodology for applying Early Warning Systems to the emergency plan using the results of social surveys and quantitative risk assessment. The objective was pursued taking into account the administrative structure and the planning system of the study area, as well as the legislative obligations of each entity involved in the risk governance and emergency management. Using a integrative scientific and social approach to natural hazards, the research aims to contribute to fill the gap between scientists, policy makers, stakeholders and community.
Applied in Comunità Montana Valtellina di Tirano, Italy, the methodology involves the application of two comprehensive questionnaires. The first addressed specifically to the local community to assess risk perception, awareness, needs, reaction capacity and level of trust towards stakeholders, besides asking for their willingness to participate in future risk communication activities. The second addressed to stakeholders (including policy makers, emergency managers, emergency volunteers, consultants and scientists) in order to determine their needs, points of view, concerns and constraints.
The proposed methodology includes all the stages of the early warning process (hazard evaluation and forecasting; warning and dissemination and public response). The methodology is based on a multidisciplinary partnership that takes into account the different actors involved in the risk management, including local stakeholders and local population, in order to accomplish a more reliable and credible result.
After evaluating the results of the surveys, information and education campaigns were initiated with the objective of reducing vulnerability of the population by increasing risk perception and improving response to early warnings.
IV. General methodology
The components of the methodology include:
- Theoretical analysis of Early Warning Systems and risk management with a selection of the state of the art.
- Analysis of the current situation in the study area regarding risk management, Early Warning Systems, emergency management and risk governance, at national, regional and local scale.
- Analysis of the actual legal framework relevant for the research, at national, regional and local scale.
- Design and implementation of a social survey - questionnaires for both general public and practitioner stakeholders in order to measure risk perception, interests, needs, concerns.
- Development of risk assessment according to the proposed methodology, including: communication response capacity analysis; comparison of estimated vulnerability, with the recently calculated hazard and risks, products of the Mountain Risks Project.
- Develop of Educational activities: participative workshops and campaigns for information dissemination.
- Risk Governance: propose good governance and sustainable development guidelines
V. Framework of the PhD project: Mountain Risks Pro ject
This PhD research was conducted and supported by and the Marie Curie Research Training Network “Mountain Risks: from prediction to management and governance” MRTN-CT-2006-35798 within the 6th Framework Program of the European Commission http://www.unicaen.fr/mountainrisks/spip/spip.php?page=index. The focus of the Research Training Network is research and training in all aspects of mountains hazards and risks assessment and management, with the aim to develop an advanced understanding of how mountain hydro-geomorphological processes behave and to apply this understanding to living with the hazards in the long-term.
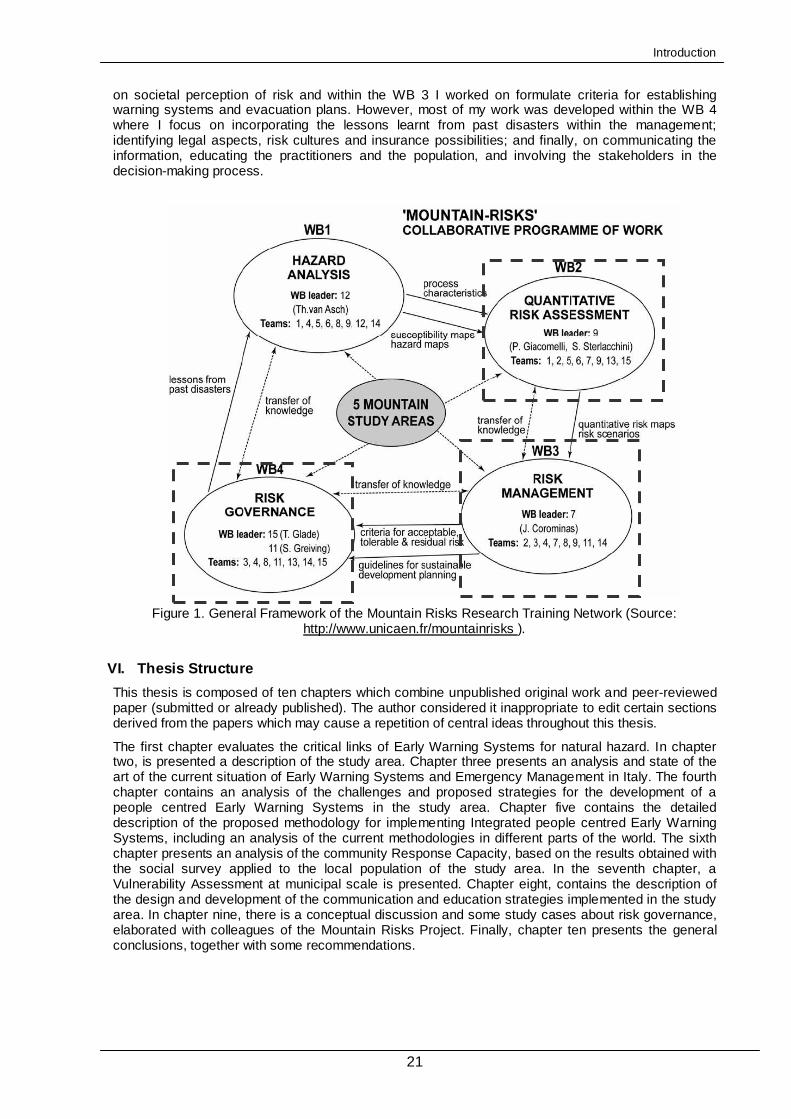
The Training Network was composed of four Working Blocks – WB. As an Early Stage Researcher I worked within the working blocks (WB): WB2: Quantitative risk assessment, WB 3: Risk Management and WB 4: Risk Governance, highlighted in dash lines in Figure 1. Specifically, within WB 2 I worked
Introduction
21
on societal perception of risk and within the WB 3 I worked on formulate criteria for establishing warning systems and evacuation plans. However, most of my work was developed within the WB 4 where I focus on incorporating the lessons learnt from past disasters within the management; identifying legal aspects, risk cultures and insurance possibilities; and finally, on communicating the information, educating the practitioners and the population, and involving the stakeholders in the decision-making process.
Figure 1. General Framework of the Mountain Risks Research Training Network (Source:
http://www.unicaen.fr/mountainrisks ).
VI. Thesis Structure
This thesis is composed of ten chapters which combine unpublished original work and peer-reviewed paper (submitted or already published). The author considered it inappropriate to edit certain sections derived from the papers which may cause a repetition of central ideas throughout this thesis.
The first chapter evaluates the critical links of Early Warning Systems for natural hazard. In chapter two, is presented a description of the study area. Chapter three presents an analysis and state of the art of the current situation of Early Warning Systems and Emergency Management in Italy. The fourth chapter contains an analysis of the challenges and proposed strategies for the development of a people centred Early Warning Systems in the study area. Chapter five contains the detailed description of the proposed methodology for implementing Integrated people centred Early Warning Systems, including an analysis of the current methodologies in different parts of the world. The sixth chapter presents an analysis of the community Response Capacity, based on the results obtained with the social survey applied to the local population of the study area. In the seventh chapter, a Vulnerability Assessment at municipal scale is presented. Chapter eight, contains the description of the design and development of the communication and education strategies implemented in the study area. In chapter nine, there is a conceptual discussion and some study cases about risk governance, elaborated with colleagues of the Mountain Risks Project. Finally, chapter ten presents the general conclusions, together with some recommendations.

Integrated People Centred Early Warning System as a risk reduction strategy, Northern Italy
22
VII. References
Basher, R. 2006. Global early warning systems for natural hazards: Systematic and people-centred. In: Philosophical Transactions of the Royal Society 364: 2167–2182.
Bird, D.K., Gisladottir, G. & Dominey-Howes, D. 2009. Resident perception of volcanic hazards and evacuation procedures. In: Nat. Hazards and Earth Syst. Sci. 9(1): 251-266.
Bird, D.K., Gisladottir, G. & Dominey-Howes, D. 2010. Volcanic risk and tourism in southern Iceland: Implications for hazard, risk and emergency response education and training. In: Journal of Volc. and Geothermal Research 189: 33-48.
Cardona, O. 1997. Management of the volcanic crises of Galeras volcano: Social, economic and institutional aspects. In: Journal of Volc. and Geothermal Research 77: 313-324.
Cardona, O. 2004. The Need for Rethinking the Concepts of Vulnerability and Risk from a Holistic Perspective: a Necessary Review and Criticism for Effective Risk Management. In: Bankoff, G.; Frerks, G. & D. Hilhorst (eds.), Mapping Vulnerability: Disasters, Development and People: 37-51. London: Earthscan Publishers.
EWC II. 2004. Early warning as a matter of policy: the conclusions of the Second International Conference on Early Warning, 16–18 October, Bonn, Germany. International Strategy for Disaster Reduction (ISDR) secretariat and the German Disaster Reduction Committee (DKKV).
Galanti, E. 1997. Il Metodo Augustus. DPC INFORMA - Periodico informativo del Dipartimento della Protezione Civile, Numero 4 Maggio-Giugno 1997. Protezione Civile Regione Piemonte.
Garcia, C. & Fearnley, C. submitted. Evaluating Critical Links in Early Warning Systems for Natural Hazards. In: Environmental Hazards. Special Publication Disaster Risk Reduction: Connecting Research and Practice.
IFRC (International Federation of Red Cross and Red Crescent Societies). 2009. World Disasters Report 2009 – Focus on Early Warning Early Action. Geneva: IFRC.
Paton, D. 2008. Risk communication and natural hazard mitigation: how trust influences its effectiveness. In: Int. J. Global Environmental Issues 8(1/2): 2-16.
Pearce, L. 2005. The value of public participation during a Hazard, Impact, Risk and Vulnerability (HIRV) analysis. In: Mitigation and Adaptation Strategies for Global Change 10: 411–441.
Peralta, H. 2008. “Planeación estratégica para la reducción integral de riesgos en el Municipio de Páez, Cauca, Colombia, por la reactivación del volcán Nevado del Huila”. In: Revista EIRD Informa - Las Américas 15(13). Online 11/09/2010 http://www.eird.org/esp/revista/No_15_2008/art13.html
Practical Action-Bangladesh. 2009. Good Practices for Community Resilience. In: Practical Action-Bangladesh, Dhaka: 46
Southern, R.L. 1995. Warnings that failed, warnings that worked , and a few heroes : Stories from Bamgladesh and Australia. In: Stop Disasters 25: 9-10.
Subramanian, T.S. 2005. Their own warning systems. In: Frontline 22(02). Online 12/09/2010 http://www.flonnet.com/fl2202/stories/20050128006701600.htm
Twigg, J. 2002. The human factor in early warnings: risk perception and appropriate communications. In: Zschau J. & Küppers A.N. (eds.), Early warning systems for natural disaster reduction: 19–26. Berlin: Springer.
UN (United Nations). 2006. Global Survey of Early Warning Systems: an assessment of capacities, gaps and opportunities toward building a comprehensive global early warning system for all natural hazards. Secretary-General of the United Nations: 46
UN/ISDR (United Nations/International Strategy for Risk Reduction). 2004. Terminology: basic terms of disaster risk reduction. International Strategy for Disaster Reduction, Geneva. Online 20/08/2010 http://www.unisdr.org/eng/library/lib-terminology-eng%20home.htm
UN/ISDR – PPEW (Platform for the Promotion of Early Warning) 2005. Basics of early warning: the four elements of effective early warning systems. Online 20/08/2010 http://www.unisdr.org/ppew/whats-ew/basics-ew.htm
UN/ISDR. 2010. Early Warning Practices can Save Many Lives: Good Practices and Lessons Learned., Bonn, Germany: United Nations Secretariat of the International Strategy for Disaster Reduction (UNISDR)
Villagran de León, J.C. & Bogardi, J. 2006. Early Warning Systems in the context of Disaster Risk Management. In: Entwicklung & Ländlicher Raum 2: 23-25.
Wisner, B., P. Blaikie, Cannon, T. & Davis, I. (ed.) 2004. At Risk: Natural Hazards, People’s Vulnerability and Disasters. 2nd edition. London: Routledge.
Zschau, J. & Küppers, A. N. (ed.) 2003. Early Warning Systems for Natural Disaster Reduction. Berlin: Springer.

Chapter 1: Evaluating Critical Links in Early Warning Systems for Natural Hazards
23
Chapter 1: Evaluating Critical Links in Early Warni ng Systems for Natural Hazards*
Early warning systems (EWS) are extensive systems that integrate different components of Disaster Risk Reduction (DRR) for the provision of timely warnings to minimise loss of life, and to reduce economic and social impact on vulnerable populations. Historically, empirical research has focused on the individual components or subsystems of EWS, such as hazard monitoring, risk assessment, forecasting tools and warning dissemination. Yet, analyses of natural hazard disasters indicate that, in most cases, it is not the individual components of EWS that cause failure, but the processes that link them.
This chapter reviews several case studies conducted over the last thirty years, to present common emerging factors that improve links between the different components of EWS. The factors identified include: (1) establishment of effective communication networks to integrate science research into practice; (2) development of effective decision-making processes that incorporate local contexts by defining accountability and responsibility; (3) acknowledgment of the importance in risk perception and trust for an effective reaction; (4) consideration of the differences among technocratic and participatory approaches in EWS when applied in diverse contexts. These factors show the importance of flexibility and the consideration of local context in making EWS effective, whereas increasing levels of standardisation within EWS nationally and globally, might challenge the ability to incorporate the required local expertise and circumstances.
1.1. Introduction
There are many definitions of EWS, but the most commonly used is ‘the provision of timely and effective information, through identifying institutions, that allow individuals exposed to a hazard to take action to avoid or reduce their risk and prepare for effective response’ by the United Nations (ISDR, 2003). Alternatively, they can be considered as ‘a mean of getting information about an impending emergency, communicating that information to those that need it, and facilitating good decisions and timely response by people in danger’ (Mileti and Sorenson, 1990:2-1). Traditionally EWS are viewed as systems that bring together various components such as detection (monitoring, forecasting, informing), management (decision-making, issuing warnings), and response (confirmation and action) (Mileti and Sorenson, 1990).
EWS are designed to reduce the impact of a hazardous event and, if effective, can substantially increase the numbers of survivors. An example of how beneficial EWS can be is outlined in a review of deaths on the east coast of India from cyclones (ISDR, 2009). Following a major cyclone in 1977, over 20,000 deaths occurred resulting in the development of a EWS including meteorological radars and emergency plans, so that when the same area was hit by similar cyclones in 1996 and 2005, the death tolls were just 100 and 27 respectively. It is therefore no surprise that in 2005, EWS were identified as key to ‘identify, assess and monitor disaster risks and enhance early warning’ in the UN Hyogo Framework (ISDR, 2005).
Whilst in principle EWS are straightforward, in practice they are highly complex due to variations in space (global, regional, national, local), hazard onset (rapid or slow), frequency, goals (provide safety, protect property or the environment), and hazard types (hydro-meteorological, geological, climatic, health). Furthermore, EWS operate within complex economic, political and societal contexts in different countries and regions, bringing together multiple, institutions and organisations (scientific, civil authorities, technical, media and public) to communicate warnings to all relevant stakeholders. Consequently, research on EWS remains largely fragmented, based either on theoretical approaches rather than practical application, or on individual isolated case studies (Kuppers and Zschau, 2003).
Today, EWS should not be regarded as linear models that adopt a top-down approach from the scientific experts to the public, as this model is too simplistic to explain the dynamic relationships
* Based on: Garcia, C. & Fearnley, C. submitted. Evaluating Critical Links in Early Warning Systems for Natural Hazards. In: Environmental Hazards. Special Publication Disaster Risk Reduction: Connecting Research and Practice
Integrated People Centred Early Warning System as a risk reduction strategy, Northern Italy
24
between the different actors and the different subsystems within a EWS such as detection, management and response (Foster, 1980). A systems approach provides a more holistic view of EWS, but even this approach has its limitations as EWS operate within complex systems, where there are large numbers of interacting actors or components that have non-linear activities that self-organise under specific pressures (Urry, 2006). With increasing levels of scientific knowledge, technological capabilities, globalisation, pluralisation, erosion of expertise, and increasing zero risk tolerance, it is clear that EWS are not simple systems and that complexity plays a significant role within their operation.
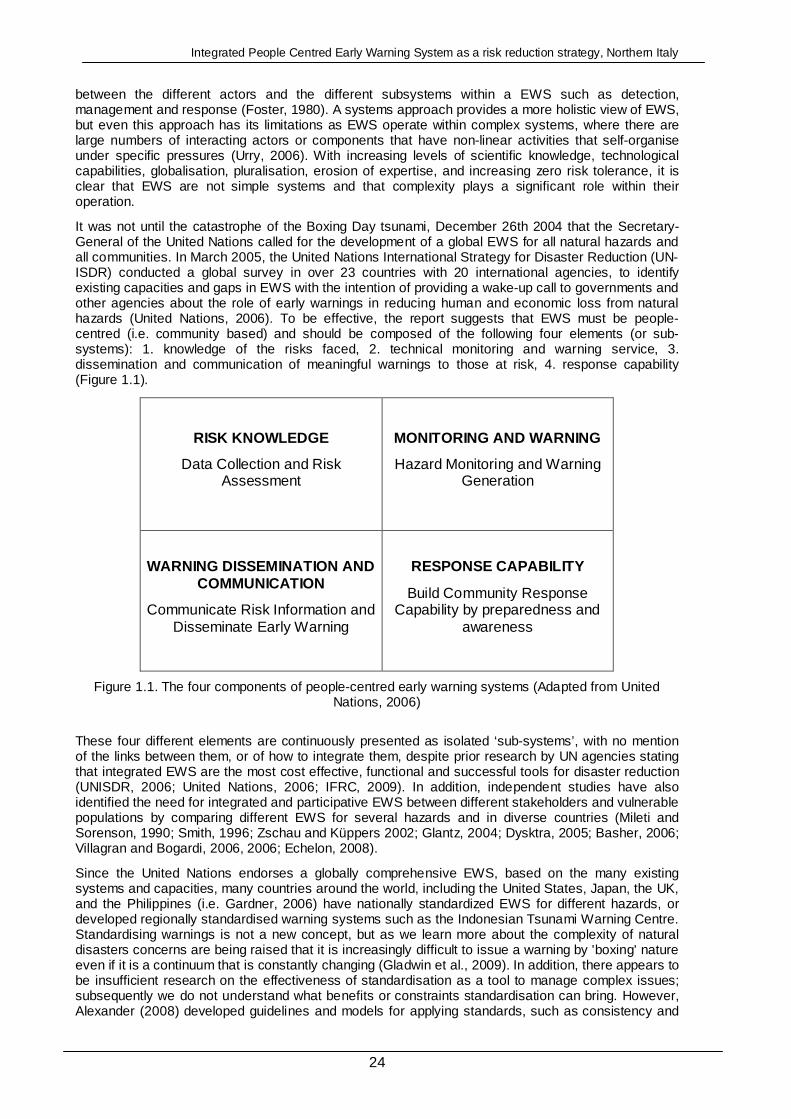
It was not until the catastrophe of the Boxing Day tsunami, December 26th 2004 that the Secretary-General of the United Nations called for the development of a global EWS for all natural hazards and all communities. In March 2005, the United Nations International Strategy for Disaster Reduction (UN-ISDR) conducted a global survey in over 23 countries with 20 international agencies, to identify existing capacities and gaps in EWS with the intention of providing a wake-up call to governments and other agencies about the role of early warnings in reducing human and economic loss from natural hazards (United Nations, 2006). To be effective, the report suggests that EWS must be people-centred (i.e. community based) and should be composed of the following four elements (or sub-systems): 1. knowledge of the risks faced, 2. technical monitoring and warning service, 3. dissemination and communication of meaningful warnings to those at risk, 4. response capability (Figure 1.1).
RISK KNOWLEDGE
Data Collection and Risk Assessment
MONITORING AND WARNING
Hazard Monitoring and Warning Generation
WARNING DISSEMINATION AND COMMUNICATION
Communicate Risk Information and Disseminate Early Warning
RESPONSE CAPABILITY
Build Community Response Capability by preparedness and
awareness
Figure 1.1. The four components of people-centred early warning systems (Adapted from United Nations, 2006)
These four different elements are continuously presented as isolated ‘sub-systems’, with no mention of the links between them, or of how to integrate them, despite prior research by UN agencies stating that integrated EWS are the most cost effective, functional and successful tools for disaster reduction (UNISDR, 2006; United Nations, 2006; IFRC, 2009). In addition, independent studies have also identified the need for integrated and participative EWS between different stakeholders and vulnerable populations by comparing different EWS for several hazards and in diverse countries (Mileti and Sorenson, 1990; Smith, 1996; Zschau and Küppers 2002; Glantz, 2004; Dysktra, 2005; Basher, 2006; Villagran and Bogardi, 2006, 2006; Echelon, 2008).
Since the United Nations endorses a globally comprehensive EWS, based on the many existing systems and capacities, many countries around the world, including the United States, Japan, the UK, and the Philippines (i.e. Gardner, 2006) have nationally standardized EWS for different hazards, or developed regionally standardised warning systems such as the Indonesian Tsunami Warning Centre. Standardising warnings is not a new concept, but as we learn more about the complexity of natural disasters concerns are being raised that it is increasingly difficult to issue a warning by 'boxing' nature even if it is a continuum that is constantly changing (Gladwin et al., 2009). In addition, there appears to be insufficient research on the effectiveness of standardisation as a tool to manage complex issues; subsequently we do not understand what benefits or constraints standardisation can bring. However, Alexander (2008) developed guidelines and models for applying standards, such as consistency and
Chapter 1: Evaluating Critical Links in Early Warning Systems for Natural Hazards
25
quality control, for developing and using emergency plans arguing that while standards can be viewed as unnecessarily restrictive and overly prescriptive, they can help guarantee the quality, content and relevance of plans. Whilst this may be true, they also inhibit flexibility and become static within a constantly changing context. Regardless, it seems there will be increasing levels of warning standardisation in future years.
So far, we have presented a number of theoretical approaches to EWS, and the popular policy approach to standardise EWS. Conversely, how EWS work theoretically can be very different to how they operate in practice. The rest of this paper focuses on studies that have reviewed EWS more holistically, recognising the need for strong links between the different sub-systems while maintaining the flexibility of the whole system to adapt to multiple circumstances.
1.2. Factors for improving links within EWS
Over the last thirty years, studies of natural hazard disasters have identified a number of failings and successes in EWS, often outside the components commonly identified. The objective of this paper is to illustrate where linking processes between different components of EWS have broken down leading to failure, i.e. disaster, or success. In addition, guidance is provided in how to make the link more robust for practical application of a EWS.
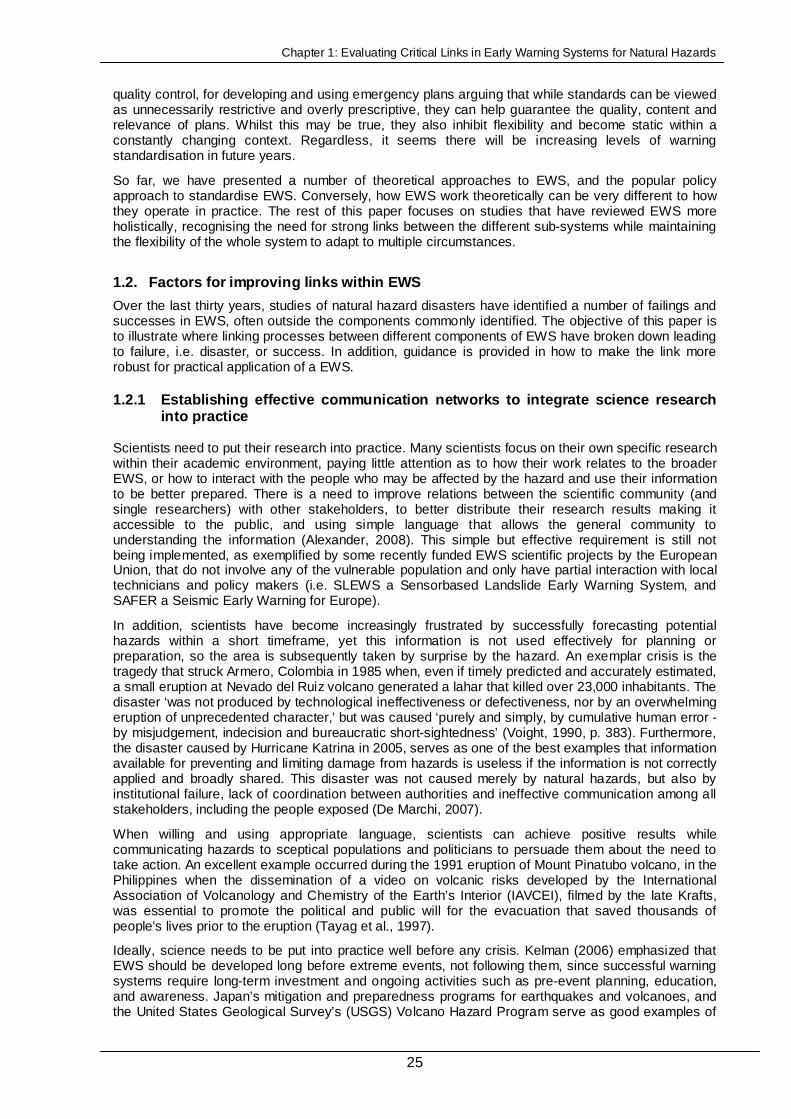
1.2.1 Establishing effective communication networks to integrate science research into practice
Scientists need to put their research into practice. Many scientists focus on their own specific research within their academic environment, paying little attention as to how their work relates to the broader EWS, or how to interact with the people who may be affected by the hazard and use their information to be better prepared. There is a need to improve relations between the scientific community (and single researchers) with other stakeholders, to better distribute their research results making it accessible to the public, and using simple language that allows the general community to understanding the information (Alexander, 2008). This simple but effective requirement is still not being implemented, as exemplified by some recently funded EWS scientific projects by the European Union, that do not involve any of the vulnerable population and only have partial interaction with local technicians and policy makers (i.e. SLEWS a Sensorbased Landslide Early Warning System, and SAFER a Seismic Early Warning for Europe).
In addition, scientists have become increasingly frustrated by successfully forecasting potential hazards within a short timeframe, yet this information is not used effectively for planning or preparation, so the area is subsequently taken by surprise by the hazard. An exemplar crisis is the tragedy that struck Armero, Colombia in 1985 when, even if timely predicted and accurately estimated, a small eruption at Nevado del Ruiz volcano generated a lahar that killed over 23,000 inhabitants. The disaster ‘was not produced by technological ineffectiveness or defectiveness, nor by an overwhelming eruption of unprecedented character,’ but was caused ‘purely and simply, by cumulative human error - by misjudgement, indecision and bureaucratic short-sightedness’ (Voight, 1990, p. 383). Furthermore, the disaster caused by Hurricane Katrina in 2005, serves as one of the best examples that information available for preventing and limiting damage from hazards is useless if the information is not correctly applied and broadly shared. This disaster was not caused merely by natural hazards, but also by institutional failure, lack of coordination between authorities and ineffective communication among all stakeholders, including the people exposed (De Marchi, 2007).
When willing and using appropriate language, scientists can achieve positive results while communicating hazards to sceptical populations and politicians to persuade them about the need to take action. An excellent example occurred during the 1991 eruption of Mount Pinatubo volcano, in the Philippines when the dissemination of a video on volcanic risks developed by the International Association of Volcanology and Chemistry of the Earth’s Interior (IAVCEI), filmed by the late Krafts, was essential to promote the political and public will for the evacuation that saved thousands of people's lives prior to the eruption (Tayag et al., 1997).
Ideally, science needs to be put into practice well before any crisis. Kelman (2006) emphasized that EWS should be developed long before extreme events, not following them, since successful warning systems require long-term investment and ongoing activities such as pre-event planning, education, and awareness. Japan’s mitigation and preparedness programs for earthquakes and volcanoes, and the United States Geological Survey’s (USGS) Volcano Hazard Program serve as good examples of

Integrated People Centred Early Warning System as a risk reduction strategy, Northern Italy
26
what can be achieved when scientists interact successfully with vulnerable populations through education, outreach, and the development of extensive relationships with responsible civil agencies by creating crisis co-ordination plans, aiding with land use planning, and establishing communication protocols for the different agencies and the media.
Guidance Notes: Effective use of scientific information for early warning can only be achieved by constant communication between all the stakeholders who should work in an integrated partnership to address the relevant issues (Alusa, 2002). Regular dialogue between all stakeholders should be established during the elaboration of the preparedness plans and not only performed during an impending crisis. There is little value in producing high quality research if the results are not put into practice. It is fundamental to put down the 'egos' and stop the tendency of many scientists to keep the knowledge just for the scientific community and to underestimate the non/scientific community. Furthermore, in order to improve communication and dissemination of previous experience, international organisations working on the practical aspect of EWS should publish more in scientific journals and not only produce institutional reports. At the same time, scientist should be more curious about the initiatives carried out outside their institution and include grey literature from international humanitarian organizations in their research, while promoting collaborative work among scientific and humanitarian institutions, bearing in mind that coordinated team work is more productive that chaotic individual efforts. Despite the constant improvements in science and technology, resulting in the ability to provide more accurate warnings, numerous case studies have shown that the ability for warnings to be effective is often not dependent on scientific information or the issuance of a warning, but how this information is disseminated, used and integrated within other areas of the EWS.
1.2.2 Develop effective decision-making processes t hat incorporate local contexts by defining accountability and responsibility
Decision-making occurs at every stage of a EWS: during the process of understanding monitoring data, while deciding when to issue a particular warning, when communicating information to users of the EWS such as civil agencies and local authorities, and when helping the users to make the best decisions possible given the uncertainties. The decisions made and the communication involved in these processes are essential for making EWS work, but in order to do so, the roles, needs and values of the different stakeholders involved must be clearly defined. A lack of clarity in decision-making can lead to lives being lost, such as seen due to the miscommunication between the Chilean Navy and Emergency Services that resulted in a tsunami warning not being issued following the 8.8 magnitude earthquake near Conception, Chile on 27th February 2010, resulting in more than 400 deaths due to the tsunami (Moloney, 2010).
Traditionally there has been conflict between the scientists who make decisions based on scientific uncertainties, and the local authorities that make decisions while evaluating the potential risk. Without better integration between the scientist and the local authorities, it is likely that poor decision-making will result in EWS continuing to fail.
A fundamental problem of natural hazards EWS is that the physical phenomena are complex, and consequently, are often high levels of uncertainty when issuing a warning. Given such uncertainties there is a need for scientists, decision-makers and disaster practitioners to be honest and as transparent as possible in the decision-making process that leads to warnings (Glantz, 2004). The IFRC (2009) states that uncertainties should be addressed openly and explicitly before the emission of a warning to promote early actions so, even if the event doesn’t occur, it will be useful in the future. A recent example is the “false alarm” issued in Hawaii for a tsunami following the 8.8 magnitude earthquake in Chile, February 2010, that lead to the largest evacuation in Hawaii for decades. Dai Lin Wang, an oceanographer at the Pacific Tsunami Warning Centre in Hawaii, said 'It's a key point to remember that we cannot under-warn. Failure to warn is not an option for us. […] We cannot have a situation that we thought was no problem and then it's devastating. That just cannot happen' (Song, 2010). Thanks to this openness and public explanation of the science, the reaction of the people to this false alarm was of calm and understanding.
Often a lack of ‘scientific and data foundation' is blamed for poor decisions leading to the failure of EWS, as the UN EWS Global Survey suggested (United Nations, 2006). Time after time, examples have shown that although scientific knowledge is often uncertain, frequently it is not the science or technology that led to failure, but the failure in communicating the meaning and severity of the warning resulting in the wrong decisions being made, which may not be a failure of the scientists. Disasters to date imply that the effectiveness of EWS have been, and continue to be hindered by institutional
Chapter 1: Evaluating Critical Links in Early Warning Systems for Natural Hazards
27
weaknesses in procedures and infrastructures, and by weak integration, ineffective communication and poor sharing of knowledge between scientists, civil authorities, the public and other stakeholders (Peterson et al., 1993).
EWS are complex with decisions and communication occurring in every aspect; therefore, defining each stakeholders’ responsibility and accountability is essential. Unfortunately, the transfer of safety responsibility is a common practice among unprepared populations who not only transfer the responsibility to other members of the community, but also to local authorities by assuming that community preparedness is predominantly the responsibility of the emergency personnel (Glantz, 2004; Gregg et al., 2004; Bird et al., 2009). This practice is particularly common in developed countries where the majority of the population believes that the government will completely take care of them in case of an emergency, leading that, as Moore (2005) suggests, most of the population lacks the basic skills and knowledge to survive in a major disaster.
Guidance Notes: Failures in decision-making are often nothing to do with the understanding of the level of certainty of the scientific forecast, but with failure to have policies or procedures in place, to establish and maintain adequate communication networks and to openly share knowledge. As pointed by Glantz (2007), 'there must be as much transparency as possible in the decision-making process that leads to warnings', since 'it’s fundamental for the public, and for other stakeholders, to be aware of the limits of an EWS so that expectations about what it can do more closely approximate reality'. Additionally, the roles and responsibilities of the different organisations and individuals within the EWS need to be clearly defined to prevent confusion and facilitate effective decision-making.
1.2.3 Acknowledging the importance of risk percepti on and trust
The way people view EWS will impact its effectiveness (Glantz, 2004). In addition, when an EWS is created it often generates unrealistic expectations and sometimes a false sense of security that could lead to a society relaxing its self-protection mechanisms and mitigative actions (Glantz, 2004). In many cases, a lack of understanding about the risk perception of a particular community may result in well intended policies becoming ineffective (Slovic, 1987). Therefore, to design effective preparedness strategies, i.e. EWS, it is fundamental to understand the levels of risk perception among the vulnerable populations in order to evaluate their level of preparedness and anticipate the populations’ reaction to a future hazardous event (Slovic, 1987; Mileti, 1993). The impact that risk perception can have on preparedness was assessed via a survey by Plapp and Werner (2006) on zones affected by flooding and earthquakes in south Germany. The survey responses indicated that research on natural hazards is relatively unknown within the public realm, due to ignorance or ineffective communication strategies, and that there is a low perceived self-efficacy and a strong lack of preparedness in the population. These findings demonstrate the need to develop risk communication strategies focused on preparedness and on offering information about possible self-preventive measures.
Risk perception can influence the effectiveness of EWS in several ways. First, a population can have low levels of risk perception, regardless of being aware of the multiple hazards they face (Bird et al., 2009) which can result in a poor capacity to respond to warnings. Second, when people perceive themselves as having low levels of preparedness, there is usually a general desire to implement strategies to increase these levels, while in contrast, some people develop an unrealistic optimism bias as they perceive themselves as being better prepared, less vulnerable or more skilful than the average person (Sjöberg, 2000). Third, even if people accept that extensive preparedness is needed, they assume that this need applies to others and not to themselves. In doing so, they transfer the responsibility to others resulting in people underestimating risk, and therefore increasing their vulnerability (Paton et al. 2008).
Trust is another key factor that determines the effective reaction of vulnerable populations. If people do not trust the warning source, they will not automatically follow warning advice or adopt protective measures (Slovic, 1993; Paton, 2008). A good example of the influence of trust, or lack thereof, is the 2006 eruption of Merapi Volcano in the Philippines, and the volcanic crisis in Galeras Volcano since 1989 in Columbia. In both cases, amongst other reasons, mistrust of the authorities developed following confusion about which alert level should be issued, resulted in vulnerable populations not evacuating despite the issuance of high alert levels. The mistrust generated may result in poor future responses to warnings and advice (Cardona, 1997; Wilson et al., 2007). However, it has been demonstrated that if issues that led to warning confusion are clearly explained to the public and stakeholders, EWS could continue to be effective (Mileti and Sorenson, 1990). Another kind of trust rarely addressed, is the one between vulnerable people and external institutions such as NGO’s. A
Integrated People Centred Early Warning System as a risk reduction strategy, Northern Italy
28
study by Bowman (on this volume) demonstrated that in a community of El Salvador, affected by the eruption of Santa Ana (Ilamatepec) volcano in 2005, the desired community outcomes were contrary to the power structure of the NGO’s resulting in a generally disempowered community. This example demonstrates the necessity to improve communication and engagement of local communities when dealing with external agencies.
Guidance Notes: It is imperative to consider local attitudes, such as risk perception and levels of trust, in order to develop and operate an effective EWS. Overestimating existing knowledge and the effectiveness of mitigation measures, transferring responsibility and/or attributing the need for preparedness to others, will result in people underestimating risk, and therefore increasing their vulnerability (Paton, 2005). Furthermore, if a warning message is misunderstood, it can lead to confusion or inaction, which is why it is fundamental not only to provide information using clear and common terminology, but to educate stakeholders prior to a crisis, and actively engage the population during the whole process to promote the adoption of self-protecting actions (Paton, 2006). This will also help avoid ineffective response for a real hazard if a “false alarm” has been issued in the past. Additionally, establishing trust and credibility is essential to obtain the desired responses from the vulnerable populations.
1.2.4 The role of technocratic and participatory ap proaches in EWS, education and communication for an effective reaction
Technology is increasingly used within EWS for the dissemination of warnings, particularly within developed countries. Globally, warning messages are commonly disseminated via public broadcast media such as radio and television, whereas in some small communities via emergency personnel either door to door or using megaphones. Warnings can range from state of the art technology such as receiving mobile phone SMS and televisions that automatically turn on for a warning, to primitive methods of shouting or sirens. Especially in developed countries, there is often a strong reliance on technology warning dissemination, which becomes highly ineffective if electricity supplies are cut off. During an evacuation exercise for a volcanic crisis in Iceland, the communication system for the delivery of the evacuation message via SMS and landline phone calls failed, demonstrating the need to find alternative communication methods that do not rely so heavily on technology (Bird et al., 2009). Another problem of focusing only on technology is that often it is not tailored to disseminate information only to the specific areas affected. A study showed that when a large portion of people in USA received warnings issued on their NOAA Weather Radio (U.S. National Oceanic and Atmospheric Administration) that were not for their local area, people unplugged their warning device, storing them away to prevent unnecessary interruptions (Moore, 2005). Despite the existence of a range of universally accepted methods to issue a warning, not all are necessarily effective for each population, reason way the dissemination method should be locally adapted to reflect the capacities and preferences of the target communities in order to make sure that the whole population receives the message (Tayag, 1998, United Nations, 2006; IFRC, 2009).
Despite technological advances that enable the quick dissemination of warnings to the target population at risk, not understanding the warning and the lack of knowledge of how to properly react remains one of the biggest shortcomings of EWS (United Nations, 2006; IFRC, 2009). There is consensus that delivering information and disseminating a warning is not effective unless firmly accompanied by strategies to engage the community members in ways that facilitate the adoption of protective actions, including educational campaigns, in order to assure that the warning message is well understood (Paton and Johnston, 2001; Paton et al., 2008; Becker et al., 2009; IFRC, 2009; Leonard et al., 2008, Bowman, on this volume). In addition, Ballantyne et al., (2000) demonstrated that providing information without participatory education campaigns may even lead vulnerable populations to believe their environment is safer than it was before, as they put their faith into the scientists and authorities. Consequently, their perceived level of risk will decline, as will their perceived need to adopt protective measures. The crisis that occurred in Darwin, Australia, on 25th December 1974, is an example where despite timely and repeated warnings provided by the meteorological centre for cyclone Tracy, which destroyed 90% of the town, official and public apathy completely negated the value of the warning resulted in the death of 65 people, several hundreds injured and the evacuation of 35,000 people (Southern, 1995).
People are more likely to react appropriately when they have participated in risk education and know the emergency procedures. Some examples, where sustained prior public education and community preparedness resulted in effective reactions, are that during the lahar in Paez associated to the Nevado del Huila Volcano, Colombia 2007 (Peralta, 2008), the eruption of the Mount Pinatubo

Chapter 1: Evaluating Critical Links in Early Warning Systems for Natural Hazards
29
Volcano in Philippines 1991 (Punongbayan and Newhall, 1998), Cyclone Sidr in Bangladesh 2007 (British Red Cross and Bangladesh Red Crescent, 2008), Hurricane Michelle in Cuba 2001 (Wisner, 2001), amongst others.
There is a struggle between top-down approaches to EWS, often dependent on sophisticated technology, that use standard practices for policy development, and bottom-up approaches designed to best deal with a crisis on a local level using local resources and capabilities. Research on community based EWS involving community participation show high levels of effectiveness in bottom-up initiatives, largely adopted in developing countries. This can be achieved not only through public education and awareness campaigns but also using strategies that promote active participation. EWS in developed countries commonly involve the scientific community, policy makers and practitioners, but leave out the participation of the community. In addition, it is common practice that ‘preparation activities’ in developed countries are limited to the distribution of information about hazards and general emergency procedures without interaction with the population. This may be the result of significant investment in risk analysis rather than preparedness. It’s fundamental to take into account that, as pointed by the IFRC (2009), ultimately, early warnings, however accurate and complete, are only as useful as the responses that they elicit.
During recent years, there has been a strong tendency to develop interactive educational tools of excellent quality, mostly targeted to school populations. This means that the problem is not the lack of educational tools, but the need for broader dissemination and application of these resources, and the use of real participatory activities with community involvement (Becker et al., 2009).
Unfortunately, as with any other preparedness related initiatives, the cost benefit of EWS cannot be proved prior to the impact of the expected event. For this reason, many people tend to disregard its importance, especially in long return period events. A common problem is maintaining continuity in hazard monitoring. In fact, in many cases instrumentation for monitoring is either controlled by private companies, or is installed as part of a scientific project and therefore only used for a limited period of time, so, due to budgetary constraints once the project ends no one is left in charge of its maintenance or data recollection to continue to provide vital information. This could be partially solved by training locals in the basic maintenance, data collection and basic reading of the instrumentation. An excellent example of how an EWS can be effective for long return period events, even if based only on ancient traditions and not advanced technology, is that of the tribes in the Andaman Islands in India, during the tsunami of 2004. The tribes recognised the tsunami’s biological warning signs such as changes in the cries of birds and the behaviour patterns of land and marine animals that have been described in the traditional songs passed down through generations. Therefore their traditional folklore enabled them to move to higher ground (Gaillard et al., 2008). In numerous examples, oral traditions and the knowledge of previous crises may increase awareness (Richardson, Reilly and Jones, 2003; Cashman and Cronin, 2008; Gaillard et al., 2008).
Guidance Notes: Although in large cities the mass media could be used to effectively broadcast the warning, in smaller communities’ local networks are more effective. Therefore it is essential to promote traditional knowledge transfer, by involving the local population and promoting the establishment of non-technical community networks for preparedness and warning dissemination to assure that everyone receives the warning, and that it is understood by all those who need to take action, in particular, the groups that are particularly vulnerable (i.e. disabled people, tourists. different language speakers). To make education effective, strategies have to be adapted to each addressed community, taking into account their needs, priorities, indigenous knowledge and capacity (Twigg, 2002). It is important to consider that the level of risk changes over time, requiring that preparedness strategies and plans for response to warnings are updated and rehearsed on regular basis (United Nations, 2006). This is particularly important when a period of 20 to 30 years has elapsed since the last significant thread (Southern, 1995), where previous crises were effectively managed or when the damage intensity was low, since this could create an underestimation of the risk (Ripley, 2008), in addition to transference of responsibilities and a false sense of security.
1.3. Conclusions
EWS are extensive systems that integrate different components of DRR with the purpose of trying to minimise loss of life and to reduce economic and social impact on vulnerable populations. However, common practice is that researchers and other stakeholders, rather than working together, work independently on the EWS sub-systems in a multitude of non-coordinated strategies, with no structure or linking, compromising in this way the effectiveness of the EWS and therefore DRR. Time after time,

Integrated People Centred Early Warning System as a risk reduction strategy, Northern Italy
30
examples have shown that often it is not the science or technology that led to failure, but the social and institutional elements.
The case studies presented indicate that EWS are not just a warning message or rigid system comprised of tightly linked sub-systems, but a system that needs flexibility to enable interaction and adaption to local conditions, and allow prompt alteration of the whole system in the face of unexpected events, or in case of the failure of one of the sub-systems. Understanding local contexts (social, political, cultural and economic), can help make effective use of appropriate technologies and participatory methods to provide warnings and educate populations so that responses to warnings are effective. In addition, the language used for dissemination should be non-technical and adapted to local jargon so it can be tailored to the needs of a wide range of different threats and different user communities. It is clear that since different local groups have different requirements for EWS, it is fundamental to design EWS so they are adapted to local necessities, especially in countries with centralised structures.
Through this chapter we identify a number of processes that can impact positively the linking of the sub-systems and consequently the effectiveness of EWS such as: establishing effective communication networks at local, regional, and national level in order to communicate information timely between different stakeholders; assuring the availability to local people of scientific knowledge about risk; acknowledging the limitations of science and available resources, establishing effective decision making processes adapted to the different contexts to generate timely and effective warnings; understanding the different risk perceptions and levels of trust among all the different stakeholders; establishing responsibilities of different stakeholders including an essential increase in public participation; defining accountability and responsibility for everyone, based on honesty and transparency to build trust and finally, understanding the complex context where EWS operate, while ensuring EWS to be flexible to cater for differing local contexts (Figure 1.2).
Figure 1.2. Diagram of EWS with factors to improve the linking of subsystems
There is a need to stop viewing EWS as a system of independent sub-systems, but to explore further the interrelationships that occur between them, because they are complex and cannot be modelled in a linear systematic function. Further research to identify the linking processes and their impact on effectiveness on EWS is highly recommended to better understand EWS, before adopting significant levels of standardisation within EWS.
The case studies presented show that with so many complexities involved within EWS due to the wide variety of situations, the idea of using a standardised and linear EWS, even on National levels, as supported by the UN, is limiting and does not provide the required flexibility to accommodate local contingencies. Ultimately, in order to have effective EWS, more than creating new standardised systems, it is necessary to focus the efforts in connecting the already existent individualistic DRR initiatives within a flexible intra-institutional, multi-sectorial, multidisciplinary and participatory approach. An effective EWS can only be achieved once stakeholders understand that all are part of EWS and they need to work together, to link all efforts to achieve effective DRR.
Chapter 1: Evaluating Critical Links in Early Warning Systems for Natural Hazards
31
1.4. References
Alexander, D. 2008. “Planning and Management of complex emergencies”. Blog: Disaster Planning and Emergency Management <http://emergency-planning.blogspot.com/2008/04/planning-and-management-of-complex.html> (03/03/2010)
Alusa, A. 2002. “Scientific Contributions to Effective Early Warning in an Environmental Context”. Early warning systems for natural disaster reduction, Zschau J, Küppers A.N, eds. Springer, Berlin. Ch. 1.4. 27-32
Ballantyne, M., Paton, D., Johnston, D., Kozuch, M., Daly, M., 2000. “Information on volcanic and earthquake hazards: The impact on awareness and preparation”. Institute of Geological & Nuclear Sciences Limited, Lower Hutt. Science Report 2000/2.
Basher, R. (UN/ISDR Platform for the Promotion of Early Warning). 2006. “Global early warning systems for natural hazards: systematic and people-centred”. Philosophical Transactions of the Royal Society, A 364, 2167-2182
Becker, J.S.; Johnston, D.M.; Paton, D.; Ronan, K. 2009 “Community resilience to earthquakes : understanding how individuals make meaning of hazard information, and how this relates to preparing for hazards”. Paper 04: Why do we still tolerate buildings that are unsafe in earthquakes New Zealand Society for Earthquake Engineering 2009 Conference, 3-5 April, Christchurch, New Zealand.
Bird, D.K., Gisladottir, G. and Dominey-Howes, D. 2009. “Resident perception of volcanic hazards and evacuation procedures”. Nat. Hazards Earth Syst. Sci., 9(1): 251-266.
British Red Cross and Bangladesh Red Crescent Society. 2008. “New homes for survivors of Bangladesh cyclone. 4 July 2008”. < http://www.redcross.org.uk/news.asp?id=82852> (19/02/2010)
Bowman, L. On this volume. “Community perceptions of an NGO’s impact on disaster preparedness in Los Planes de La Laguna, Santa Ana volcano, El Salvador”. Natural Hazards Review.
Cardona, O. 1997. “Management of the volcanic crises of Galeras volcano: Social, economic and institutional aspects”. Journal of Volcanology and Geothermal Research 77, 313-324
Cashman, K.V. and Cronin, S.J. 2008. “Welcoming a monster to the world: Myths, oral tradition, and modern societal response to volcanic disasters”. Journal of Volcanology and Geothermal Research, 176. 407–418
De Marchi, B. 2007. Not just a matter of knowledge. The Katrina debacle. Environmental Hazards 7. 141–149
Dysktra, E. 2005. “Early Warning Systems – Interdisciplinary Observations and Policies from a Local Government Perspective”. Symposium Concept Paper and Call for Papers. Early Warning Systems – A Public Entity Risk Institute Symposium. 5 p. <https://www.riskinstitute.org/peri/images/file/EWS_Symposium_ConceptPaper.pdf> (19-02-2010)
Echelon, 2008. “Emergency Risk Management Report, Albury Local Emergency Management Committee”. Final Draft Version 3 - Issue – 31 January 2008. 85 p.
Foster, H. D. 1980. “Disaster planning: the preservation of life and property”. New York, Springer. 275 p.
Gaillard, J.-C., Clave, E., Vibert, O., Azhari, D., Denain, J.-C., Efendi, Y., Grancher, D., Liamzon, C.C., Sari, D.S.R., Setiawan, R. 2008. “Ethnic groups' response to the 26 December 2004 earthquake and tsunami in Aceh, Indonesia”. Natural Hazards, 47 (1), 17-38.
Gardner, C. A., and Guffanti, M. C., U.S. Geological Survey's Alert Notification System for Volcanic Activity, USGS Factsheet 2006-3139, 2006. Online 19/03/2010 http://pubs.usgs.gov/fs/2006/3139
Glantz, M. 2003. “Usable Science 8: Do’s and Don’ts”. Report of Workshop 20-23 October 2003. Shangai, China. 77 p.
IFRC (International Federation of Red Cross and Red Crescent Societies). 2009. “World Disasters Report 2009 – People-centred approach and the ‘last mile”. Online 19/02/2010 http://www.ifrc.org/Docs/pubs/disasters/wdr2009/WDR2009-full.pdf
Gregg, C. E., Houghton, B. F., Paton, D., Swanson, D. A., and Johnston, D. M. 2004. “Community preparedness for lava flows from Mauna Loa and Hualalai volcanoes, Kona, Hawai’i, B". Bulletin of Volcanology,, 66, 531–540.
ISDR. 2003. “Terminology: Basic Terms of Disaster Risk Reduction”. Online 20/03/2010 http://www.unisdr.org/eng/library/lib-terminology-eng%20home.htm
ISDR, U. 2005. “Hyogo Framework for Action 2005-2015: Building the Resilience of Nations and Communities to Disasters”. Online 20/03/2010 http://www.unisdr.org/wcdr/intergover/official-doc/L-docs/Hyogo-framework-for-action-english.pdf
ISDR, 2009. “Reducing Disaster Risks through Science: Issues and Actions. Report of the ISDR Scientific and Technical Committee”. Global Platform for Disaster Risk Reduction, in Geneva, 16-19 June 2009. Online 10/03/2010 http://www.preventionweb.net/globalplatform/2009/ background/documents/SD-03-ENG-Scientific-Technical-Committee.pdf
Kelman, I. 2006. “Warning for the 26th December 2004 Tsunamis”. Disaster Prevention and Management. 15 (1), 178-189
Kuppers, A. N. and J. Zschau. 2003. “Early Warning Systems for Natural Disaster Reduction”. Early Warning Systems for Natural Disaster Reduction, Springer. 817-821.

Integrated People Centred Early Warning System as a risk reduction strategy, Northern Italy
32
Leonard, G., Johnston, D., Paton, D., Christianson, A., Becker, J., Keys, H. 2008. “Developing effective warning systems for volcanic hazards: Ongoing research at Ruapehu volcano, New Zealand”. Journal of Volcanology and Geothermal Research, 172. 199–215
McCloskey, J., Antonioli A , Piatanesi, A., Sieh , K., Steacy, S., Nalbant, S., Cocco, M,
Mileti, D. 1993 “Communicating Public Earthquake Risk Information.” Prediction and Perception of Natural Hazards, J. Nemec, J. Nigg, and F. Siccardi, eds.,Kluwer Academic Publishers, Boston.
Mileti, D. and Sorenson, J. H. 1990. “Communication of Emergency Public Warnings: A Social Science Perspective and State-of-the -Art Assessment. Oak Ridge, TN: Oak Ridge National Laboratory, U.S. Department of Energy”. Online 20/03/2010 http://stargate.ornl.gov/CSEPPweb/data/Evacuation%20Guidebook/files/content_files/CommunicationFinal.pdf
Moloney, A. 2010. MEDIAWATCH: Chilean authorities come under fire over tsunami alert. AlertNet, alerting humanitarians to emergencies. Online 10/03/2010 http://www.alertnet.org/db/an_art/59877/2010/02/4-192810-1.htm
Moore, A. 2005. “The Human Component of the Early Warning Issue”. Early Warning Systems – A Public Entity Risk Institute Symposium. 4 p. Online 19/02/2010 http://www.riskinstitute.org/peri/images/file/PERI_Symposium_Moore.pdf
Paton, D. 2005. “Community resilience: Integrating hazard management and community engagement”. Proceedings of the International Conference on Engaging Communities. Brisbane: Queensland Government/UNESCO
Paton, D. 2006. “Disaster Resilience: Building Capacity to Co-Exist with Natural Hazards and their Consequences”. Disaster Resilience: an Integrated Approach..Paton, D. and Johnston, D., eds., Illinois: Thomas Publisher Ltd.
Paton, D. 2008. “Risk communication and natural hazard mitigation: how trust influences its effectiveness”. Int. J. Global Environmental Issues, 8 (1/2), 2–16.
Paton, D. and Johnston, D., 2001. “Disasters and Communities: vulnerability, resilience and preparedness”. Disaster Prevention and Management, 10(4), 270-277
Paton, D., Smith, L., Daly, M., and Johnston, D. 2008. “Risk perception and volcanic hazard mitigation: individual and social perspectives”, J. Volcanol. Geoth. Res., 172, 170–178.
Peralta, H. 2008. “Planeación estratégica para la reducción integral de riesgos en el Municipio de Páez, Cauca, Colombia, por la reactivación del volcán Nevado del Huila en el marco del desarrollo local sostenible, desde la cosmovisión de las comunidades del pueblo Indígena Nasa”. Revista EIRD Informa - Las Américas, 15 (13). Online 22/02/2010 http://www.eird.org/esp/revista/No_15_2008/art13.html
Plapp, T., Werner, U. 2006. “Understanding risk perception from natural hazards: examples from Germany”.,RISK 21 - Coping with risks due to natural hazards in the 21st century (Proc. CENAT-Workshop 2004), A., Walter A., S. Dannenmann, L. Vulliet, eds., London: Taylor and Francis,101-108.
Punongbayan, R. S. and Newhall, C. G. 1998. “Early Warning for the 1991 eruptions of Pinatubo volcano - a success story”. Programme and Abstracts, International IDNDR-Conference on Early Warning Systems for the Reduction of Natural Disasters, EWC'98, Potsdam, Federal Republic of Germany, September 7-11.
Richardson, J., Reilly, J. and Jones, P.J.S. 2003. “Community and public participation: risk communication and improving decision making in flood and coastal defence”. Presentation at 38th DEFRA Flood & Coastal Management Conference, Keele University, 16-18 July 2003; based on report to DEFRA/EA from Scott-Wilson on R&D project under the Flood & Coastal Defence Research Programme: Policy Development theme.
Ripley, A. 2008. “The Unthinkable: who survives when disaster strikes and why”. Crown Publishers. 266 p.
Smith, K. 1996. “Environmental Hazards. Second Edition. Routledge, London and New York. Sjöberg, L., 2000. Factors in risk perception. Risk Analysis 20, p. 1–11.
Slovic, P. 1987. Perception of Risk. Science, New Series, 236 (4799), 280-285.
Slovic, P. 1993. Perceived risk, trust and democracy. Risk Analysis 13, 675–682
Song, J. 2010. Scientists defend warning after tsunami non-event. JapanToday. Online 12/03/2010 http://www.japantoday.com/category/world/view/scientists-defend-warning-after-tsunami-non-event
Southern, R.L. 1995. “Warnings that failed, warnings that worked , and a few heroes : Stories from Bamgladesh and Australia”. Stop Disasters 25, 9-10.
Tayag, J.C., Insauriga S.I., Ringor A. and Belo M., 1997. “People's response to eruption warning: the Pinatubo experience, 1991–1992”. Fire and Mud: Eruption and Lahars of Mt Pinatubo, Philippines. Newhall C. and Punongbayan R.S., eds., University of Washington Press, Seattle. 87-99
Tayag, J. C. 1998. “Diverse responses to eruption warning transmitted via different channels”. Programme and Abstracts, International IDNDR-Conference on Early Warning Systems for the Reduction of Natural Disasters, EWC’98, Potsdam, Federal Republic of Germany, September 7-11.
Chapter 1: Evaluating Critical Links in Early Warning Systems for Natural Hazards
33
Twigg, J. 2002. “The human factor in early warnings: risk perception and appropriate communications”. Early warning systems for natural disaster reduction. Zschau J, Küppers A.N., eds., Berlin:Springer. Ch. 1.3. 19–26.
UNISDR, 2006. “Early warning - from concept to action: the conclusions of the third international conference on early warning (EWC III)”, 27-29 March 2006, Bonn, Germany. 32 p.
United Nations, 2006. “Global Survey of Early Warning Systems”. Final Version. 46 p. Online 20/03/2010 http://www.preventionweb.net/files/3612_GlobalSurveyofEarlyWarningSystems.pdf
Urry, J. 2006. “Complexity. Theory”, Culture and Society, 23(2-3), 111-115.
Van de VEN, G. P. 2004. “Man-Made Lowlands. History of Water Management and Land Reclamation in the Netherlands”. Matrijs, Utrecht.
Villagran de León, J. C. and Bogardi, J. 2006. “Early Warning Systems in the context of Disaster Risk Management”. Entwicklung & Ländlicher Raum, 2/2006, 23-25.
Wilson, T.; Kaye, G., Stewart, C. and Cole, J. 2007. “Impacts of the 2006 eruption of Merapi volcano, Indonesia, on agriculture and infrastructure”. GNS Science Report 2007/07 69p.
Wisner, B. 2001. “Socialism and storms”. The Guardian, November 14 2001.
Zschau, J. and Küppers, A. N. 2003. „Early Warning Systems for Natural Disaster Reduction”. Springer-Verlag Berlin Heidelberg New York.

Integrated People Centred Early Warning System as a risk reduction strategy, Northern Italy
34

Chapter 2: Study area
35
Chapter 2: Study Area: Mountain Consortium Valtellina di Tirano (CM Valtellina di Tirano)
2.1 Geographical settings
The study was developed in the Mountain Consortium Valtellina di Tirano (Comunità Montana Valtellina di Tirano - CM Valtellina di Tirano, in Italian) which administratively belongs to Sondrio Province in Lombardy Region (Figure 2.1). The CM Valtellina di Tirano, composed by 12 municipalities, is located in the central portion of the Valtellina Valley, Northern Italy. It presents an area of about 450 km2 and has around 29 000 inhabitants, mostly settled in the bottom of the valley close to the main road National Road SS.38.
Figure 2.1. Location of the CM Valtellina di Tirano
Both to the south and north, the area presents high elevation zones, with the highest elevation reached at the Cima Viola, Grosio Municipality with 3 374 m a.s.l. and the lowest elevation is at the outlet of Adda River near San Giacomo di Teglio (352 m a.s.l.). Of the total territory, 36.7% is located above 2001 m a.s.l. and 22.9% is located between 1 501 and 2 000 m a.s.l. (CM Valtellina di Tirano, 2000). The geographical characteristics of the study area have a strong influence on multiple aspects, such as the weather -including rain, winds, sun exposure and temperature-, and the social and economic dimensions.
The main economic activities are the tourism and the agriculture. The principal touristic centres are Aprica and Teglio highly active during winter and summer seasons. The agriculture is focused on the production of high quality grapes and apples, with the presence of vineyards both in the bottom of the valley as in the North flank, but in particular in the terraced slopes with dry stone walls between Teglio and Tirano. In addition, the area between Tirano and Grosio is mainly dedicated to medium scale cattle breeding. Another non negligible economic factor is the emigration both from other Italian
Grosio
Grosotto
Vervio Mazzo
Tovo Sernio
Tirano
Villa
Bianzone
Teglio
Aprica
Lovero
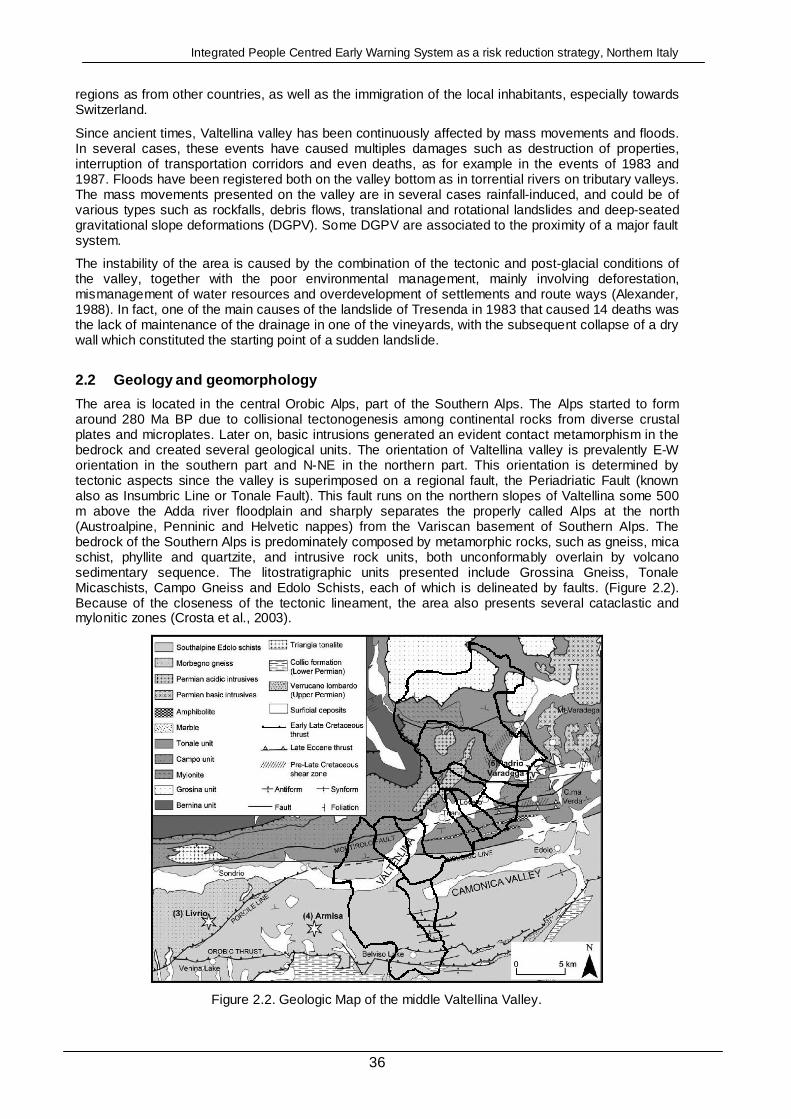
Integrated People Centred Early Warning System as a risk reduction strategy, Northern Italy
36
regions as from other countries, as well as the immigration of the local inhabitants, especially towards Switzerland.
Since ancient times, Valtellina valley has been continuously affected by mass movements and floods. In several cases, these events have caused multiples damages such as destruction of properties, interruption of transportation corridors and even deaths, as for example in the events of 1983 and 1987. Floods have been registered both on the valley bottom as in torrential rivers on tributary valleys. The mass movements presented on the valley are in several cases rainfall-induced, and could be of various types such as rockfalls, debris flows, translational and rotational landslides and deep-seated gravitational slope deformations (DGPV). Some DGPV are associated to the proximity of a major fault system.
The instability of the area is caused by the combination of the tectonic and post-glacial conditions of the valley, together with the poor environmental management, mainly involving deforestation, mismanagement of water resources and overdevelopment of settlements and route ways (Alexander, 1988). In fact, one of the main causes of the landslide of Tresenda in 1983 that caused 14 deaths was the lack of maintenance of the drainage in one of the vineyards, with the subsequent collapse of a dry wall which constituted the starting point of a sudden landslide.
2.2 Geology and geomorphology
The area is located in the central Orobic Alps, part of the Southern Alps. The Alps started to form around 280 Ma BP due to collisional tectonogenesis among continental rocks from diverse crustal plates and microplates. Later on, basic intrusions generated an evident contact metamorphism in the bedrock and created several geological units. The orientation of Valtellina valley is prevalently E-W orientation in the southern part and N-NE in the northern part. This orientation is determined by tectonic aspects since the valley is superimposed on a regional fault, the Periadriatic Fault (known also as Insumbric Line or Tonale Fault). This fault runs on the northern slopes of Valtellina some 500 m above the Adda river floodplain and sharply separates the properly called Alps at the north (Austroalpine, Penninic and Helvetic nappes) from the Variscan basement of Southern Alps. The bedrock of the Southern Alps is predominately composed by metamorphic rocks, such as gneiss, mica schist, phyllite and quartzite, and intrusive rock units, both unconformably overlain by volcano sedimentary sequence. The litostratigraphic units presented include Grossina Gneiss, Tonale Micaschists, Campo Gneiss and Edolo Schists, each of which is delineated by faults. (Figure 2.2). Because of the closeness of the tectonic lineament, the area also presents several cataclastic and mylonitic zones (Crosta et al., 2003).
Figure 2.2. Geologic Map of the middle Valtellina Valley.

Chapter 2: Study area
37
The main folding period of the Alps occurred during the first half of the Tertiary (65 Ma BP) with phases of quiescence when erosion and uplift where in constant interaction (Embleton et al., 1984). Later, after the metamorphism of about 45 e 30 Ma BP and the intrusion of granitic plutons around 30-35 Ma BP, the axial part of the Alpine chain suffered a fast uplift, estimated in around 10-20 km (Regione Lombardia, 2008). The most recent tectonic activity includes traslative movements around fragile fracture zones, some of them still active such as the Engadine Line (Regione Lombardia, 2008).
The glaciation history is complex. According to Embleton (1984), among 5 or 6 Quaternary Glaciations, the penultimate from Riss, 200.000 Ma BP and the last of Wurm, 80.000-60.000 Ma BP, appear to have extended the further and remove early traces of earlier cold periods. As a consequence, the territory is morphologically juvenile due to the modelling action derived from neotectonics and Quaternary glacial activity in the last 11 to 14.000 years. The valley has a transversal U-shaped profile and its axis is represented by the Adda River which flows for about 100 km, from Bormio (1 225 m a.s.l) to Colico (218 m a.s.l) close to the Como Lake. Both flanks of the valley are covered by morainic sediments and colluvial deposits, while in the lower parts of the flanks are presented glacial, fluvio-glacial, and colluvial deposits of variable thickness. In the bottom of the valley the alluvial plain of the Adda River is 250 m up to 3 km wide. There are several alluvial fans presented at the outlet of tributary valleys reaching a considerable size, with a longitudinal length up to 3 km. Some of these alluvial fans are heavily inhabited and in some cases entire municipalities, such as Aprica and Bianzone, are developed on top of one of these fans (Figure 2.3).
Figure 2.3. Inhabited alluvial fan typical from the Valtellina Valley, Municipality of Bianzone.
2.3 Vegetation and Climate
The strong differences of altitude between the bottom of the valley and the top of the mountains have a clear influence on the distribution of the vegetation of the Valtellina Valley. Up until 600-700 m a.s.l the vegetation in Valtellina is composed mainly by broad-leaved forests; above this and up to 1000 m a.s.l is usual to find chestnut trees and above 1400 up to 2300 m a.s.l the conifers are predominant (Regione Lombardia, 2008). In the bottom of the valley and in some slopes there is a strong antrophic influence on the vegetation, with extended deforestation for agriculture and pasture fields and terraces on the slopes for vineyards.
The climate is also heavily influenced by the strong height differences. Most part of Valtellina has a continental weather with medium precipitation in the middle part of the valley, incremented in the Lower valley towards the Como Lake. January is the coldest month and July is the hottest. There are marked differences on the climate of both slopes. The Rhaetic or Alpin slope on the north presents a

Integrated People Centred Early Warning System as a risk reduction strategy, Northern Italy
38
milder and dryer weather and less precipitation than the Orobic slope on the south (Regione Lombardia, 2008).
Precipitation is extremely variable, from less than 700 mm/yr on the valley bottom to more than 2000 mm/year on the higher zones (Guzzetti et al., 1992). According to Agostoni et al. (1997), the annual precipitation recorded from 1881 to 1979 in Tirano, located at 430 m a.s.l, was 726,6 mm, with a minimum of 296,0 mm/year and maximum of 1286,6 mm/year. Whereas in Aprica, located at 1.181 m a.s.l, the annual precipitation between 1881 to 1985 was 1.188,6 mm, with a minimum of 241,0 mm/year and maximum of 2216,0 mm/year (Figure 2.4).
Figure 2.4. Mean Annual rainfall CM Valtellina di Tirano (Adapted from Ceriani and Carelli, 1991)
2.4 Population and Economy
Valtellina Valley has been inhabited since thousands of years as proved by prehistoric art works disseminated in the whole territory. A possible reason of the continuous human presence on the site since historic times is the geographical location of the area, which allows an easy access from Switzerland through the Bermina Pass, from Como Lake, from Aprica Pass and from Mortirolo. This characteristic provides a strategic interest that explains the pass of several invaders armies through history as well as smugglers, in particular during the economic crisis in the middle of the 20th century.
At the present year of 2010 the webpage of the CM Valtellina di Tirano reports 29 388 inhabitants, while, according to the Italian Census, by the year 2001 the population of the CM Valtellina di Tirano was of 29 063, distributed in 11 655 family units (ISTAT, 2001).
In the Table 2.1 it is possible to observe the variation of the population in the last 40 years. The total population of the CM has been quite stable but there have been clear strong variations in several municipalities. In the last 40 years most of the municipalities have experienced a decrease of population except for Aprica, Grosio, Mazzo di Valtellina and Tovo di San Agata, with an increase of population between +39,9% (in Tovo) and +32,3% (in Aprica).
N

Chapter 2: Study area
39
Table 2.1. Adapted from CM Valtellina di Tirano (2000), including results from census (ISTAT, 2001).
Inhabitants % variation of Inhabitants Municipali-ties
1961 1971 1981 1991 1997 1998 1999 2001 99/61 99/81 99/91
Aprica 1.214 1.272 1.508 1.606 1.594 1.600 1.606 1.588 32,3 6,5 0,0
Bianzone 1.452 1.282 1.309 1.362 1.293 1.294 1.266 1.220 -12,8 -3,3 -7,0
Grosio 4.598 4.676 4.777 4.955 4.877 4.895 4.843 4.827 5,3 1,4 -2,3
Grosotto 2.238 2.117 1.857 1.684 1.671 1.647 1.650 1.686 -26,3 -11,1 -2,0
Lovero 811 730 709 689 664 650 635 635 -21,7 -10,4 -7,8
Mazzo di valt. 972 890 949 1.010 1.061 1.082 1.072 1.045 10,3 13,0 6,1
Sernio 521 449 453 460 439 427 438 445 -15,9 -3,3 -4,8
Teglio 5.695 5.240 5.224 5.106 4.961 4.950 4.909 4.797 -13,8 -6,0 -3,9
Tirano 7.502 8.519 8.805 8.914 8.967 8.895 8.807 9.044 17,4 0,0 -1,2
Tovo di s.agata 403 456 493 525 549 554 564 569 39,9 14,4 7,4
Vervio 607 427 330 280 251 260 254 239 -58,1 -23,0 -9,3
Villa di Tirano 3.159 3.016 2.924 2.927 2.988 2.954 2.966 2.968 -6,1 1,4 1,3
Comunità Montana
29.172 29.074 29.338 29.518 29.315 29.208 29.010 29.063 -0,6 -1,1 -1,7
Provincia di Sondrio
161.450 169.149 173.918 175.453 177.187 177.466 177.368 176.856 9,9 2,0 1,1
CM/ Provincia 18,1% 17,2% 16,9% 16,8% 16,5% 16,5% 16,4% 16,4% 9,3 0,9 -0,6
Regarding the gender distribution, there is a general lightly prevalence of the female gender with 51,7% for the whole CM, except in Tovo di Sant'Agata where there is a slightly larger male population with 51,1% (Table 2.2).
Table 2.2. Gender distribution of the population in the municipalities of the CM Valtellina di Tirano (Data extracted from ISTAT, 2001)
M F Municipality n % n %
Total
Aprica 749 47,2 839 52,8 1588 Bianzone 579 47,5 641 52,5 1220 Grosio 2310 47,9 2517 52,1 4827 Grosotto 801 47,5 885 52,5 1686 Lovero 317 49,9 318 50,1 635 Mazzo di Valtellina 512 49 533 51 1045 Sernio 208 46,7 237 53,3 445 Teglio 2368 49,4 2429 50,6 4797 Tirano 4340 48 4704 52 9044 Tovo di Sant'Agata 291 51,1 278 48,9 569 Vervio 114 47,7 125 52,3 239 Villa di Tirano 1434 48,3 1534 51,7 2968 TOTAL 14023 48,3 15040 51,7 29063
According to the distribution of the population in age groups (Table 2.3), it is possible to observe that, except in Mazzo di Valtellina, there is a clear majority of the elder population, older than 65 years old.
Table 2.3. Age distribution of the population in the municipalities of the CM Valtellina di Tirano (Data extracted from ISTAT, 2001).
0-14 15-64 65+ Municipality
n % N % n % Total
Aprica 214 13,5 1106 69,6 268 16,9 1588 Bianzone 154 12,6 803 65,8 263 21,6 1220 Grosio 742 15,4 3207 66,4 878 18,2 4827 Grosotto 221 13,1 1074 63,7 391 23,2 1686 Lovero 87 13,7 412 64,9 136 21,4 635 Mazzo di Valtellina 184 17,6 693 66,3 168 16,1 1045 Sernio 68 15,3 294 66,1 83 18,7 445 Teglio 536 11,2 3150 65,7 1111 23,2 4797 Tirano 1306 14,4 6071 67,1 1667 18,4 9044 Tovo di Sant'Agata 90 15,8 382 67,1 97 17,0 569 Vervio 38 15,9 146 61,1 55 23,0 239 Villa di Tirano 406 13,7 1919 64,7 643 21,7 2968 TOTAL 4046 13,9 19257 66,3 5760 19,8 29063
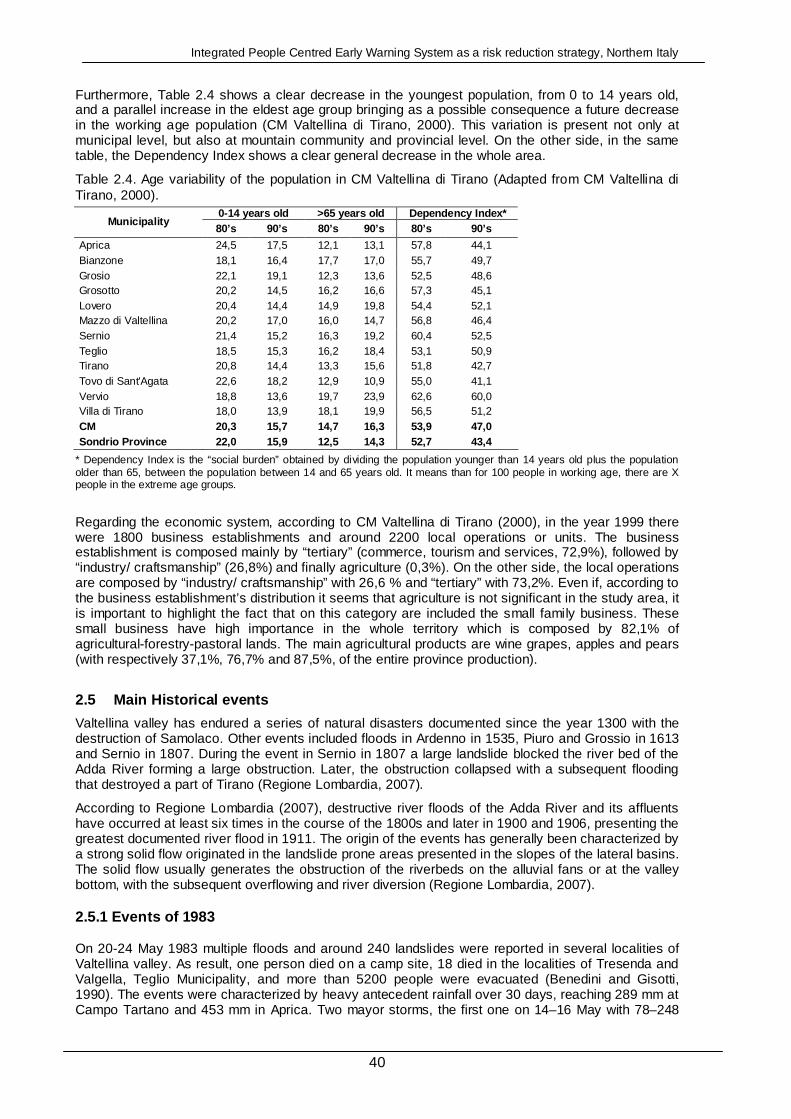
Integrated People Centred Early Warning System as a risk reduction strategy, Northern Italy
40
Furthermore, Table 2.4 shows a clear decrease in the youngest population, from 0 to 14 years old, and a parallel increase in the eldest age group bringing as a possible consequence a future decrease in the working age population (CM Valtellina di Tirano, 2000). This variation is present not only at municipal level, but also at mountain community and provincial level. On the other side, in the same table, the Dependency Index shows a clear general decrease in the whole area.
Table 2.4. Age variability of the population in CM Valtellina di Tirano (Adapted from CM Valtellina di Tirano, 2000).
0-14 years old >65 years old Dependency Index* Municipality
80’s 90’s 80’s 90’s 80’s 90’s
Aprica 24,5 17,5 12,1 13,1 57,8 44,1 Bianzone 18,1 16,4 17,7 17,0 55,7 49,7 Grosio 22,1 19,1 12,3 13,6 52,5 48,6 Grosotto 20,2 14,5 16,2 16,6 57,3 45,1 Lovero 20,4 14,4 14,9 19,8 54,4 52,1 Mazzo di Valtellina 20,2 17,0 16,0 14,7 56,8 46,4 Sernio 21,4 15,2 16,3 19,2 60,4 52,5 Teglio 18,5 15,3 16,2 18,4 53,1 50,9 Tirano 20,8 14,4 13,3 15,6 51,8 42,7 Tovo di Sant'Agata 22,6 18,2 12,9 10,9 55,0 41,1 Vervio 18,8 13,6 19,7 23,9 62,6 60,0 Villa di Tirano 18,0 13,9 18,1 19,9 56,5 51,2 CM 20,3 15,7 14,7 16,3 53,9 47,0 Sondrio Province 22,0 15,9 12,5 14,3 52,7 43,4
* Dependency Index is the “social burden” obtained by dividing the population younger than 14 years old plus the population older than 65, between the population between 14 and 65 years old. It means than for 100 people in working age, there are X people in the extreme age groups.
Regarding the economic system, according to CM Valtellina di Tirano (2000), in the year 1999 there were 1800 business establishments and around 2200 local operations or units. The business establishment is composed mainly by “tertiary” (commerce, tourism and services, 72,9%), followed by “industry/ craftsmanship” (26,8%) and finally agriculture (0,3%). On the other side, the local operations are composed by “industry/ craftsmanship” with 26,6 % and “tertiary” with 73,2%. Even if, according to the business establishment’s distribution it seems that agriculture is not significant in the study area, it is important to highlight the fact that on this category are included the small family business. These small business have high importance in the whole territory which is composed by 82,1% of agricultural-forestry-pastoral lands. The main agricultural products are wine grapes, apples and pears (with respectively 37,1%, 76,7% and 87,5%, of the entire province production).
2.5 Main Historical events
Valtellina valley has endured a series of natural disasters documented since the year 1300 with the destruction of Samolaco. Other events included floods in Ardenno in 1535, Piuro and Grossio in 1613 and Sernio in 1807. During the event in Sernio in 1807 a large landslide blocked the river bed of the Adda River forming a large obstruction. Later, the obstruction collapsed with a subsequent flooding that destroyed a part of Tirano (Regione Lombardia, 2007).
According to Regione Lombardia (2007), destructive river floods of the Adda River and its affluents have occurred at least six times in the course of the 1800s and later in 1900 and 1906, presenting the greatest documented river flood in 1911. The origin of the events has generally been characterized by a strong solid flow originated in the landslide prone areas presented in the slopes of the lateral basins. The solid flow usually generates the obstruction of the riverbeds on the alluvial fans or at the valley bottom, with the subsequent overflowing and river diversion (Regione Lombardia, 2007).
2.5.1 Events of 1983
On 20-24 May 1983 multiple floods and around 240 landslides were reported in several localities of Valtellina valley. As result, one person died on a camp site, 18 died in the localities of Tresenda and Valgella, Teglio Municipality, and more than 5200 people were evacuated (Benedini and Gisotti, 1990). The events were characterized by heavy antecedent rainfall over 30 days, reaching 289 mm at Campo Tartano and 453 mm in Aprica. Two mayor storms, the first one on 14–16 May with 78–248
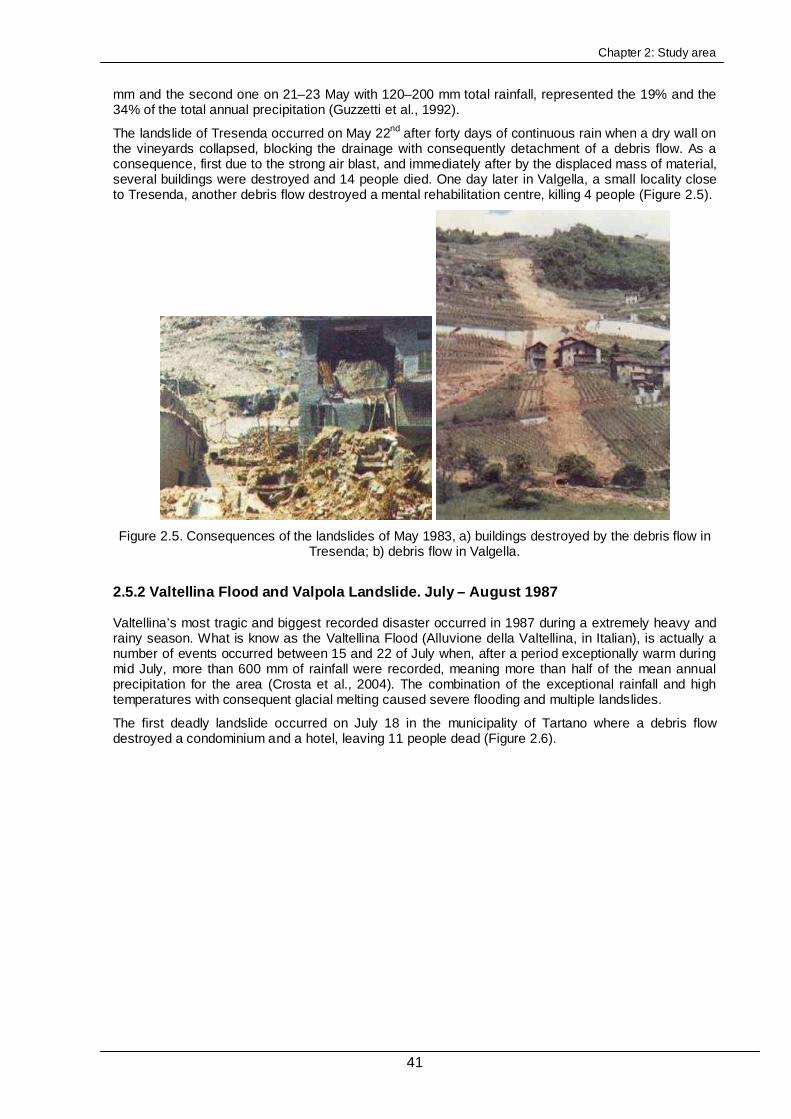
Chapter 2: Study area
41
mm and the second one on 21–23 May with 120–200 mm total rainfall, represented the 19% and the 34% of the total annual precipitation (Guzzetti et al., 1992).
The landslide of Tresenda occurred on May 22nd after forty days of continuous rain when a dry wall on the vineyards collapsed, blocking the drainage with consequently detachment of a debris flow. As a consequence, first due to the strong air blast, and immediately after by the displaced mass of material, several buildings were destroyed and 14 people died. One day later in Valgella, a small locality close to Tresenda, another debris flow destroyed a mental rehabilitation centre, killing 4 people (Figure 2.5).
Figure 2.5. Consequences of the landslides of May 1983, a) buildings destroyed by the debris flow in
Tresenda; b) debris flow in Valgella.
2.5.2 Valtellina Flood and Valpola Landslide. July – August 1987
Valtellina’s most tragic and biggest recorded disaster occurred in 1987 during a extremely heavy and rainy season. What is know as the Valtellina Flood (Alluvione della Valtellina, in Italian), is actually a number of events occurred between 15 and 22 of July when, after a period exceptionally warm during mid July, more than 600 mm of rainfall were recorded, meaning more than half of the mean annual precipitation for the area (Crosta et al., 2004). The combination of the exceptional rainfall and high temperatures with consequent glacial melting caused severe flooding and multiple landslides.
The first deadly landslide occurred on July 18 in the municipality of Tartano where a debris flow destroyed a condominium and a hotel, leaving 11 people dead (Figure 2.6).
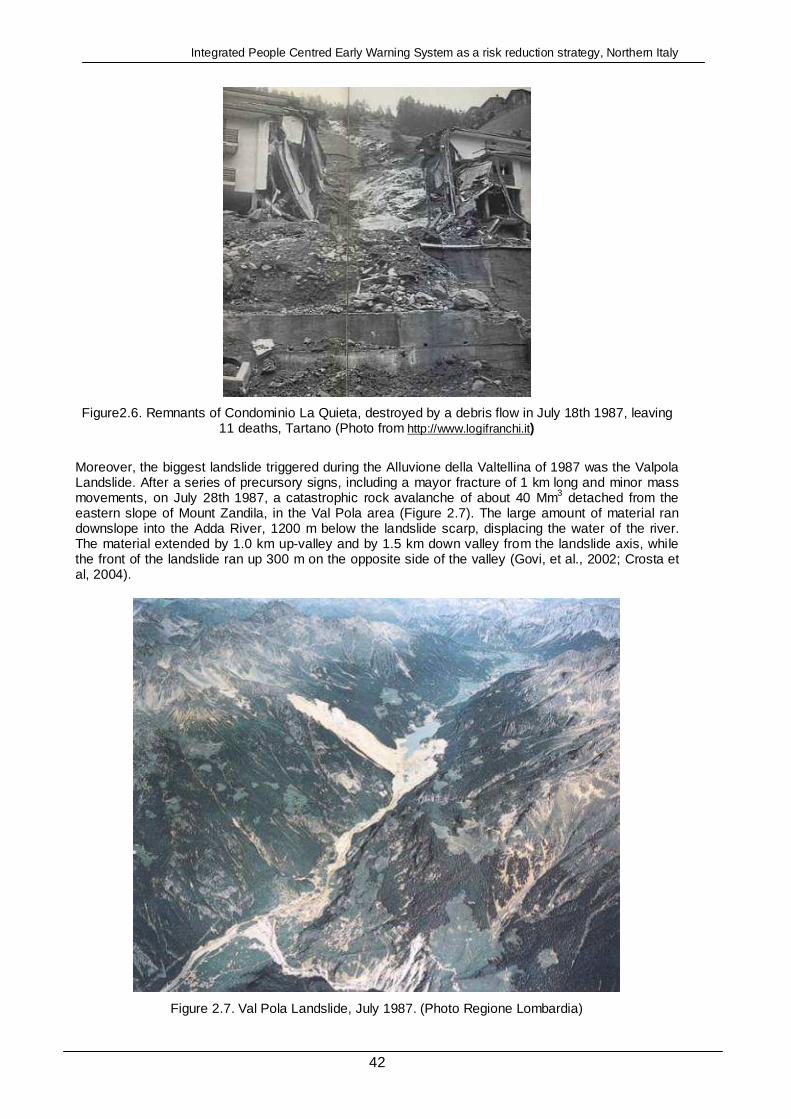
Integrated People Centred Early Warning System as a risk reduction strategy, Northern Italy
42
Figure2.6. Remnants of Condominio La Quieta, destroyed by a debris flow in July 18th 1987, leaving 11 deaths, Tartano (Photo from http://www.logifranchi.it)
Moreover, the biggest landslide triggered during the Alluvione della Valtellina of 1987 was the Valpola Landslide. After a series of precursory signs, including a mayor fracture of 1 km long and minor mass movements, on July 28th 1987, a catastrophic rock avalanche of about 40 Mm3 detached from the eastern slope of Mount Zandila, in the Val Pola area (Figure 2.7). The large amount of material ran downslope into the Adda River, 1200 m below the landslide scarp, displacing the water of the river. The material extended by 1.0 km up-valley and by 1.5 km down valley from the landslide axis, while the front of the landslide ran up 300 m on the opposite side of the valley (Govi, et al., 2002; Crosta et al, 2004).
Figure 2.7. Val Pola Landslide, July 1987. (Photo Regione Lombardia)
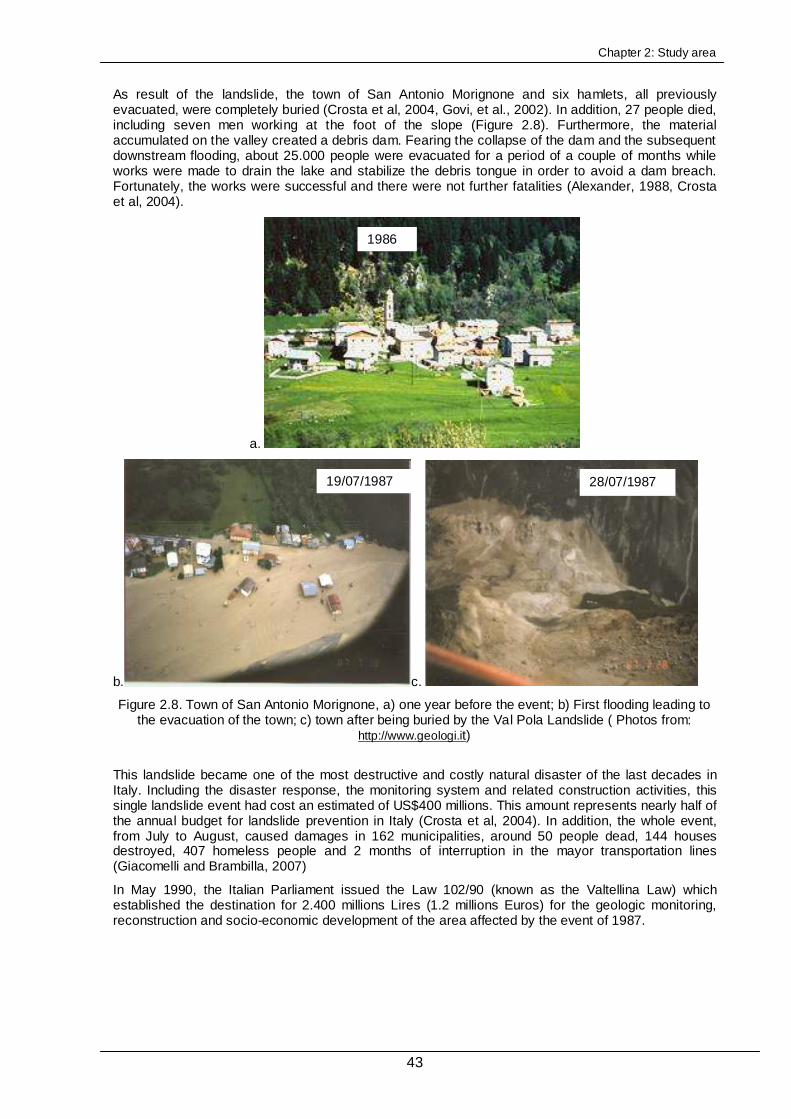
Chapter 2: Study area
43
As result of the landslide, the town of San Antonio Morignone and six hamlets, all previously evacuated, were completely buried (Crosta et al, 2004, Govi, et al., 2002). In addition, 27 people died, including seven men working at the foot of the slope (Figure 2.8). Furthermore, the material accumulated on the valley created a debris dam. Fearing the collapse of the dam and the subsequent downstream flooding, about 25.000 people were evacuated for a period of a couple of months while works were made to drain the lake and stabilize the debris tongue in order to avoid a dam breach. Fortunately, the works were successful and there were not further fatalities (Alexander, 1988, Crosta et al, 2004).
a.
b. c.
Figure 2.8. Town of San Antonio Morignone, a) one year before the event; b) First flooding leading to the evacuation of the town; c) town after being buried by the Val Pola Landslide ( Photos from:
http://www.geologi.it)
This landslide became one of the most destructive and costly natural disaster of the last decades in Italy. Including the disaster response, the monitoring system and related construction activities, this single landslide event had cost an estimated of US$400 millions. This amount represents nearly half of the annual budget for landslide prevention in Italy (Crosta et al, 2004). In addition, the whole event, from July to August, caused damages in 162 municipalities, around 50 people dead, 144 houses destroyed, 407 homeless people and 2 months of interruption in the mayor transportation lines (Giacomelli and Brambilla, 2007)
In May 1990, the Italian Parliament issued the Law 102/90 (known as the Valtellina Law) which established the destination for 2.400 millions Lires (1.2 millions Euros) for the geologic monitoring, reconstruction and socio-economic development of the area affected by the event of 1987.
19/07/1987 28/07/1987
1986
Integrated People Centred Early Warning System as a risk reduction strategy, Northern Italy
44
2.6 References
Agostoni, S., Laffi, R. and Sciesa, E. 1997. Centri abitati instabili della Provincia di Sondrio. CNR-GNDCI, Regione Lombardia and Università di Milano. 59 p.
Alexander, D. 1988. Valtellina Landslide and flood emergency, Northern Italy, 1987. Disasters, 12(3): 212-222. Benedini, M. and Gisotti, G.. Il Dissesto Idrogeologico: Cause, effetti e interventi a difesa del suolo. La Nuova
Italia Scientifica
Ceriani, M. and Carelli, M. 1991. Carta delle precipitazioni media annue del territorio alpino Lombardo (registrate nel periodo 1891-1990). Servizio Geologico – Ufficio Rischi Geologic,iRegione Lombardia. Italy
Comunità Montana Valtellina di Tirano (CM Valtellina di Tirano). 2000. Piano pluriennale di sviluppo economico-sociale della Comunità Montana Valtellina di Tirano, Prima Bozza di Lavoro. CM Valtellina di Tirano. Online 27/07/2010 http://www.cmtirano.it/oggetti/2846.pdf
Crosta, G. B., Dal Negro, P. and Frattini, P. 2003. Soil slips and debris flows on terraced slopes. Natural Hazards and Earth System Sciences (2003) 3: 31–42
Embleton, C. 1984. Geomorphology of Europe. McMillan, London. 465 p. Giacomelli, P. ad Brambilla, M. 2007. Economic assessment of natural risks due to climate change. The case of a
mountain Italian region. In: Landslides and Climate Change : challenges and Solutions : Proceedings of the International Conference on Landslides and Climate Change / R. McInnes, J. Jakeways, H. Fairbank, E. Mathie. - [s.l] : Taylor and Francis, 2007 May 10. - ISBN 9780415443180. - pp. 455-463
Govi, M., Gulla, G. and Nicoletti, P.G. 2002. Val Pola Rock Avalanche of July 28, 1987, in Valtellina, northern Italy (Central Italian Alps), in evens, S.G. and DeGraff, J.V. eds. Catastrophic landslides: Effects, occurrence and mechanisms. Boulder Colorado, Geological Society of America Reviews in Engineering Geology, v. XV, p. 71-89
Guzzetti F, Crosta G, Marchetti M, Reichenbach P. 1992.Debris flows triggered by the 17–19 July, 1987 storm in the Valtellina area (Northern Italy). In: Aulitzky A (ed) Proceedings of Interpraevent 1992, Bern, Switzerland. Tagungspubl., Österr. Wasserwirtsch., Klagenfurt, 2 : 193–204
ISTAT, 2001. 14th General Population and Housing Census. The National Institute of Statistics – ISTAT. Rome – Italy. Online 20/07/2010 http://dawinci.istat.it/pl/index_eng.html
Regione Lombardia, 2007. Framework document Civil Protection National Exercise: Hydraulic and Hydrogeological Risk "Valtellina 2007". 23 p. Online 20/07/2010 http://valtellina.protezionecivile.regione.lombardia.it/valtellina/download/documentoimpianto/documentoimpianto_esercitazione_en.pdf
Regione Lombardia, 2008. I Geositi della Provincia di Sondrio. Regione Lombardia and IREALP. 139 p.

Chapter 3: Analysis of the current situation of EWS and Emergency Management in Italy
45
Chapter 3: Analysis of the current situation of Ear ly Warning Systems and Emergency Management in Italy
3.1. Legal Framework for Risk Management and Civil Protection
The Department of the Civil Protection of the cabinet is the operative body of the Prime Minister’s Office (Presidente del Consiglio dei Ministri, in Italian), regarding the safeguarding of people and assets exposed to particular threatens derived by natural or man-made disasters. The Italian Civil Protection System is a diffused and open organization that involves from Ministries to small municipalities, besides the civil society that participates through the volunteers.
Since the beginning, the Department of the Civil Protection has been in charge of managing the geohydrological risks, among natural and technologic risks. After multiple changes in the Italian legal framework (Figure 3.1), it was established that the Civil Protection is in charge, not only of the emergency management, but also the forecasting, prevention and recovery phases. Nowadays, the legislation establishes that it is fundamental to identify in advance the possible future damaging events, the possible affected zones and the activities which should be performed before, during and after the emergency.
Figure 3.1. Evolution of the Civil Protection Legislation in Italy
Forecasting and prevention are developed in close collaboration with scientific research institutions, using modern technological systems for the collection and analysis of the information in order to determine, with the highest precision possible, the probability of occurrence of a future catastrophic event (Protezione Civile Nazionale, 2010).
3.1.1. Legal Framework at National Level
The origins of the Civil Protection in Italy can be traced back to more than forty years. By 1970 Italy had already been affected by several catastrophic events, but there was no real civil protection legislation to establish the responsibilities for the management of emergencies. During the flooding of Florence in 1966, that left 36 people dead, a large number of volunteers collaborated during the
Integrated People Centred Early Warning System as a risk reduction strategy, Northern Italy
46
emergency. The previous constituted a landmark event in the formation of the volunteer forces on which disaster response lean so heavily (Alexander, 2002). In fact, the flooding in Florence, together with the earthquake of Belice – Sicily in 1968, that left 296 people dead, promoted the creation of the first modern national civil protection law, the Law 996 of 1970. This law, know as the “Norm about the rescue and assistance of the population affected by a calamity – Civil Protection”, institutionalized some of the temporary measures adopted during these events and gave leading responsibility for disaster relief to the fire brigades and the Red Cross. The direction of the disaster management was assigned to a Commissar appointed by the government in every new event.
After the 1980 earthquake in Irpina, that left more than 2700 people dead, a new civil protection legislation was established, the Decree of the President of the Italian Republic (D.P.R.) 66/1981. This decree gave the local responsibilities to the prefect and the local authorities, promoted the “self-protection” based on civil protection education and also established a ministerial post for the general direction of major national disasters.
It was only until 1992, thanks to the efforts on behalf of disaster relief and reduction of the Minister Giuseppe Zamberletti, known as the ‘Father of Italian Civil Protection’, that the modern National Civil Protection was instituted with the Law n. 225/1992. With this law, the direction of major national disasters was turned from a ministry into a Department of the Italian State, under the direct control of the cabinet and answering to the Prime Minister through his delegate, the Minister of the Interior. This constituted the model for the rest of Europe, as it became the pattern mandated by an EU directive (Alexander, 2002).
The Law n. 225/1992 institutes the National Service of Civil Protection with the aim of safeguard the integrity of people, assets, settlements and the environment, of the damage derived by the natural calamities or catastrophic events. The main innovations of the Law n. 225/1992 were, first, to establish that the Civil Protection System should not be constituted in the moment of the event, but that it should be pre-existent to the event. Second, that the Mayors are the main local Civil Protection authority, and therefore the primary responsible for disaster planning and management at the local level. And third, that it is necessary to give a high importance to the volunteer organizations.
The Italian Service of Civil Protection is a complex system that involves many different public, scientific/academic and private organizations. According to the Article 6, Law 225/1992, the components of the Italian Service of Civil Protection includes not only governmental bodies at different levels such as ministries, regions, provinces, prefectures, municipalities, mountain consortiums and public institutions, but also scientific research groups, and specially important, the citizens and the volunteers groups (Figure 3.2).

Chapter 3: Analysis of the current situation of EWS and Emergency Management in Italy
47
Figure 3.2. National System of Civil Protection (Adapted from Regione Lombardia, 2004)
On the other side, according to the Article 11, Law 225 /1992, the operational structure of the Italian Service of Civil Protection is composed as follows:
• National Fire Brigade (Vigili del Fuoco, in Italian)
• Armed Forces
• Police Forces
• State Corps of Forest Rangers (Corpo Forestale dello Stato, in Italian)
• National Technical Services
• National Groups of Scientific Research, National Institute of Geophysics and Volcanology (INGV)
• Italian Red Cross (Croce Rossa Italiana, in Italian)
• National Health Service
• Volunteers Organizations
• Alpine Rescue Corp. (Corpo Nazionale del Soccorso Alpino, in Italian)
The Department of Civil Protection, under the cabinet (also known as the Presidency of the Council of Ministers), is the headquarters of the Italian National Service of Civil Protection. The Operational Committee is set up in the Department of Civil Protection to ensure a unified direction and coordination of the emergency management. This Operational Committee is composed not only by representatives of each operational component previously listed, but also by representatives of the media, transportation systems, electricity management agencies, telecommunication companies, agency for flight control and the monitoring forecast team (Figure 3.3).

Integrated People Centred Early Warning System as a risk reduction strategy, Northern Italy
48
Figure 3.3. Simplified structure of the National Department of Civil Protection in the late 1990’s (Adapted from Alexander, 2002)
In the Article 2 of the Law 225/92, the events and competences of the different levels of the Italian Civil Protection are classified as follow:
A – Natural or anthropic events (local level);
B – Natural or anthropic events (provincial and regional level);
C – Natural calamities, disasters or other events (national level).
According to the previous, A and B events can be managed through ordinary interventions implemented by local or regional bodies and administrations. While C events must be managed using extraordinary means and powers at national level.
It is interesting to notice that the numerals “A” and “B” of the Article 2 does not clarify the type nor the effects of the events the law addressed, i.e. it does not specify it is referring to events of negative repercussions.
Furthermore, the Law n. 225/1992 defined the activities of the Civil Protection including for the first time not only the emergency management but also the prevention, forecasting and recovering. These elements are defined in the Article 3 of the Law n. 225/1992 as following:
• Forecasting (previsione, in Italian) includes the study and determination of the cause of the disasters, for risks identification and the individualization of the zones at risk.
• Prevention (prevenzione, in Italian): consists in the activities carried out to avoid or to minimize the possibility of damage caused by the events addressed in the article 2, also based on what learned previously during the forecasting.
• First aid (soccorso, in Italian): includes the interventions directed to assure any type of first aid to the population affected by the events addressed in the article 2.
• Recovering (superamento dell’emergenza, in Italian): includes exclusively the implementation, coordinated by the competent institutions, of the necessary initiatives which can not be postponed, aimed to remove the obstacles for the resumption of the normal life conditions.
The Law n. 225/1992 allocated the duties between the state, the region and the local authorities, based in a nationally response structure which, according to Alexander (2002), proved to be robust and efficient when administered by capable people. In spite of this, there were some things to be improved since the level of integration of the volunteer groups into the national structure needed to be increased, so a greater standardization and homogenization of mitigation and preparedness activities was necessary (Alexander, 2002).

Chapter 3: Analysis of the current situation of EWS and Emergency Management in Italy
49
In 1998, the Legislative Decree 112, 1998, known as the Bassanini Law No 59, set out the rules for decentralizing the Civil Protection in Italy. The law transferred some responsibilities, previously from the national government, to the regions, provinces mountain consortiums and municipalities. The municipalities acquired the whole competence of the Civil Protection at local level while the Regions were responsible of the employment of the volunteers and the Province of the elaboration of the Provincial Emergency Plans. Additionally, the law assigns coordination responsibilities to the mountain consortium authorities according to the structure of the intermunicipal emergency plans. However, the dispositions of the Decree 112, 1998, were not applied equally in all the Italian territory. After the decree, it followed a period of struggle between the prefectures - representing the authority of the central state at the province level- and the provincial and regional governments (Alexander, 2002). In addition, some regions adopted a direct management of the Civil Protection, while others delegated some responsibilities to the provinces (Grosseto Province, 2010).
According to Alexander, (2002), the real pillars on which Italian civil protection rests are the municipalities (comuni) and the voluntary organizations. As in many other countries, so in Italy, the local mayor is the final authority when disaster strikes. Municipalities have been busy setting up emergency offices and developing plans, reaching in some cases, high degrees of sophistication and prominence.
Finally, the Civil Protection works based on the principle of subsidiarity, which is the idea that a central authority should have a subsidiary function, performing only those tasks which cannot be performed effectively at a more immediate or local level.
3.1.2. Legal Framework at Regional and Local Level
The first main regional law was the Law 225/1992. This was a generic law that did not assigned a significant role to the regions regarding the civil protection. On the contrary, it only gave to the regions the responsibility to redact the Forecasting and Prevention Program (Programma di Previsione e Prevenzione, in Italian), and the generic role of training and divulgating the civil protection culture. Furthermore, with the transfer of many of the competences from the national government to the regions, the result was a diffused operational force that gave to the region some ambiguous, even if significant, role in civil protection (Raja, 1998; Regione Lombardia, 2010). In spite of the previous, at the present, the regions play a fundamental role especially in the phases of forecasting and prevention which have a strong incidence in the spatial planning of the territory. It was just until 1998, with the Decree 112/1998, art. 108 that the regions assumed stronger responsibilities. The Decree 112/1998 established the region as the entity in charge of the orientation, programming and control of the provincial and municipal activities. The region should coordinate the risk prevention activities and to collaborate during an emergency when required by the local authorities by providing technical and operative support. With this Decree is constituted what is called “Regional System of Civil Protection”. At local scale, it was only with occurrence of several disastrous events, such as the landslide of Sarno and Soverato of 1998, that the necessity of a stronger organization of the local authorities was evident. On this regard, the Law 267/1998 established the obligatory elaboration of a Municipal Emergency Plan in the municipalities with high risk zones (Regione Lombardia, 2004). Lombardy, the largest Italian region, embraces 11 Provinces and 1546 municipalities and has more than 200 civil protection voluntary units. In 1998, Lombardy Region published the first “Regional Program for Forecasting and Prevision for Civil Protection” - RPFP 1998, starting in this way a process of modernization of the civil protection legislation, with a more extended analysis of the risks and the regional territory. The RPFP 1998 included the identification and representation, in a general cartographic scale, of the principal risks presented in the region, including geohydrological, seismic, industrial, nuclear and fire risks. Another important legislative instrument for civil protection of the Lombardy Region is the Regional Law 22nd of May 2004, n. 16, known as the “Unique text about the regional dispositions in regard of Civil protection” (Testo unico delle disposizioni regionali in materia di Protezione Civile,TUPC, in Italian). This law, based on the principles of subsidiarity, suitability and differentiation, has as main objective to improve the emergency services provided to the citizens through a fluid and more efficient emergency management and to promote the return to “normality” as fast as possible. The TUPC, only valid for local or regional events, gives emphasis to the role of the local authorities and recognizes the importance of the volunteers. In addition, it established that the Mayors of the municipalities are the first operative authorities, while the Provinces coordinate the volunteers. The constant roles of the Region include the forecasting and warning. According to the Article 2 of the Law 225/1992, in case of an event type B, the region is in charge of the emergency management coordination through the

Integrated People Centred Early Warning System as a risk reduction strategy, Northern Italy
50
Administrative Centre (Centro di Governo, in Italian), the distribution of the emergency personnel, in particular the Fire Brigades and of requesting to the Prime Minister’s Office to declare a State of Emergency. In 2007, Lombardy Region established an “Integrated Security System” (Sistema Integrato di Sicurezza, in Italian) in order to update the RPFP 1998 and to improve the security system in general (Regione Lombardia, 2008). The elements of the Integrated Security System included: new operative instruments for integral risk assessment and definition of mitigation actions; new operative instruments of monitoring and surveillance, such as the “Regional Operative Centre for the Security” (Centro Operativo Regionale per la Sicurezza -CORES, in Italian); new instruments and infrastructure for information, data exchange and communication, such as the Prevention Portal (Portale della Prevenzione, in Italian), and new instruments for residual risk transfer, such as insurance. The document that serves as framework of the “Integrated Security System” is the Integral Regional Program of Risk Mitigation 2007 – 2010 (Programma Regionale Integrato di Mitigazione dei Rischi -PRIM, in Italian) Taking into account the recommendations of the UN- Disaster Reduction meeting in Kobe (2005), the region structured the PRIM based on the principles of: priority of action, meaning to select the mayor risks first; strong institutional base, in particular related to the institutions for risk prevention; need to identify, evaluate and monitoring risks, including appropriate forecasting and early warning systems; promote a culture of resilience; promote emergency preparedness, in both institutions and social networks; and finally, the construction of a global response network on prevention and protection, through the involvement, according to the respective competences, of the national government, the region, the local authorities and the end-user and citizens. The PRIM 2007 – 2010 applies at the same time on natural, technological and social risks, and clusters them in two categories: Mayor Risks – hydrogeological, seismic, industrial, meteorological and forest fire risks-, and Incidents or Events Socially Relevant – road accidents, industrial accidents and urban insecurity. The main innovations of the PRIM 2007 – 2010 are: i) the increment of the action range by considering risk as an integral analytical category, ii) the individualization of the most exposed areas, iii) the creation of a framework with the mitigation actions of all the institutions working on prevention, and iv) the definition of actions efficiency indicators according to the expected risk reduction, in order to evaluate the policies impact (Regione Lombardia, 2008). The integral risk vision of the PRIM 2007-2010, promoted the transition from a single risk approach to a multi-risk approach and the integration of informative and technological monitoring infrastructure.
3.2. Emergency Management
When an emergency occurs, several administrative levels intervene, depending on the dimension of the disaster, while tasks and responsibilities are shared among the local and central institutions, based on the principle of subsidarity. In the most important and serious cases, the law establishes the direct engagement of the Prime Minister who activates the National System of Civil Protection before declaring the state of emergency. In this case, the Head of the Civil Protection Department is in charge of coordinating all the interventions necessary to face the emergency (Civil Protection, 2010). In addition, the Prime Minister could manage the intervention using extraordinary, powerful, fast and flexible legislative tools known as the Prime Minister Decrees.
3.2.1. Emergency Management at Regional Level
As explained before, the Decree 112/98 served to distribute the responsibilities of disaster preparedness among the regions, provinces, prefectures, mountain consortiums and municipalities. Later, in 1997 the Civil Protection Department published the Augustus Method which became the main instrument for emergency management. ‘Augustus’ represents a unique operative system with principles and standards adapted for the management of any emergency, no matter the dimension, the type, or the entities involved (Galanti, 1997). The method specifies nine emergency support functions at the municipal level and fourteen at the provincial level (Table 3.1). Furthermore, the method, based on the principle that the more complex a problem is the simpler should be the solution, creates a language and specific unified procedures that allow a timely and efficient collaboration between all the actors involved in the management and overcoming of the emergency. In addition, it proposes a flexible emergency plan based on a preliminary evaluation of the available public and private resources.
In Lombardy Region, the legislation that compiles the procedures of the Augustus Method at regional level is represented by the L.R. 16/2004 and all its posterior updating, such as the DGR VI/46001 of

Chapter 3: Analysis of the current situation of EWS and Emergency Management in Italy
51
1999, the DGR VII/12200 of 2003, the DGR VIII/4732 of 2007 (Regione Lombardia, 2007) and lately, the DGR 8/8753 of 2008.
Table 3.1. Support functions according to the Augustus Method
Provincial Level Municipal Level
1. Planning – techno scientific
2. Sanity – social assistance
3. Mass Media and Information
4. Volunteers
5. Materials
6. Transport and circulation – viability
7. Telecommunications
8. Essential services (electricity, water, gas, etc)
9. Damage assessment (people and assets)
10. Operative Structure
11. Local Institutions
12. Dangerous Material
13. Evacuation Logistics – relocation zones
14. Coordination – Operative Centres
1. Planning – techno scientific
2. Sanity – social assistance
3. Volunteers
4. Materials
5. Essential services (electricity, water, gas, etc) and schools activities
6. Damage assessment (people and assets)
7. Local Operative Structure
8. Telecommunications
9. Population assistance
The Augustus Method clarifies the roles of each operative centre at different territorial and functional levels (Figure 3.4). The structure of the method also allows the representatives of each operative function to correctly interact among them in order to timely start the collaborative decisional process. In addition, the representatives of the operative functions are coordinated by a Disaster Manager who is in charge of coordinate the emergency activities, as well as each component of the Civil Protection System and the assistance to the population (Galanti, 1997).
Some of the main operative centres are:
- Operative Municipal Centre (Centro Operativo Comunale, COC): responsible of the activities at local level, coordinated by the Mayor (Sindaco). From this centre the Mayor coordinates the emergency management, activates the support functions and informs the citizens about the risk levels. This centre is located in a secure zone away of the affected area.
- Combined Operative Centre (Centro Operativo Misto, COM): is activated in case of an event that affects several municipalities.
- Emergency Assistance Coordination Centre C.C.S. (Centro Coordinamento dei Soccorsi, CCS): main centre at provincial level, coordinated by the Prefect. Includes two areas, the strategic for decisional activities and the operative where the support functions are activated.
- Operative Regional Centre (Centro Operativo Regionale, COR): activated during emergencies that affect several provinces and is coordinated by the President of the Region.
- Direction of Command and Control (Direzione di Comando e Controllo, Di.Coma.C.): decisional organ at national level activated in the mayor calamities, usually located at the Department of Civil Protection in Rome.
Additionally, at local level, there is a Local Crisis Unit (Unità di Crisi Locale, UCL), parallel to the COC, activated by the Mayor and composed by representatives of several local operational groups. Finally, the Advanced Command Post (Posto di Comando Avanzato, PCA), is the operative and technical structure coordinated by the Fire Brigades, located in a secure zone close to the emergency area, that supports the Mayor “in the field” emergency management.
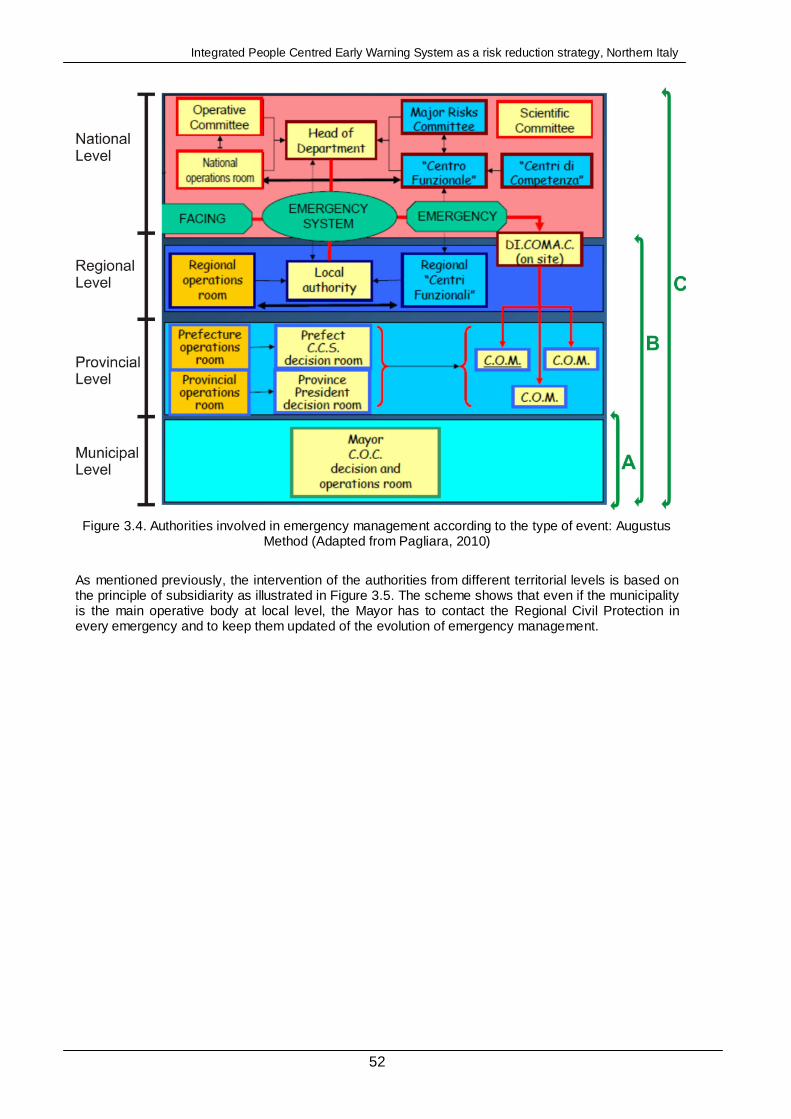
Integrated People Centred Early Warning System as a risk reduction strategy, Northern Italy
52
Figure 3.4. Authorities involved in emergency management according to the type of event: Augustus Method (Adapted from Pagliara, 2010)
As mentioned previously, the intervention of the authorities from different territorial levels is based on the principle of subsidiarity as illustrated in Figure 3.5. The scheme shows that even if the municipality is the main operative body at local level, the Mayor has to contact the Regional Civil Protection in every emergency and to keep them updated of the evolution of emergency management.
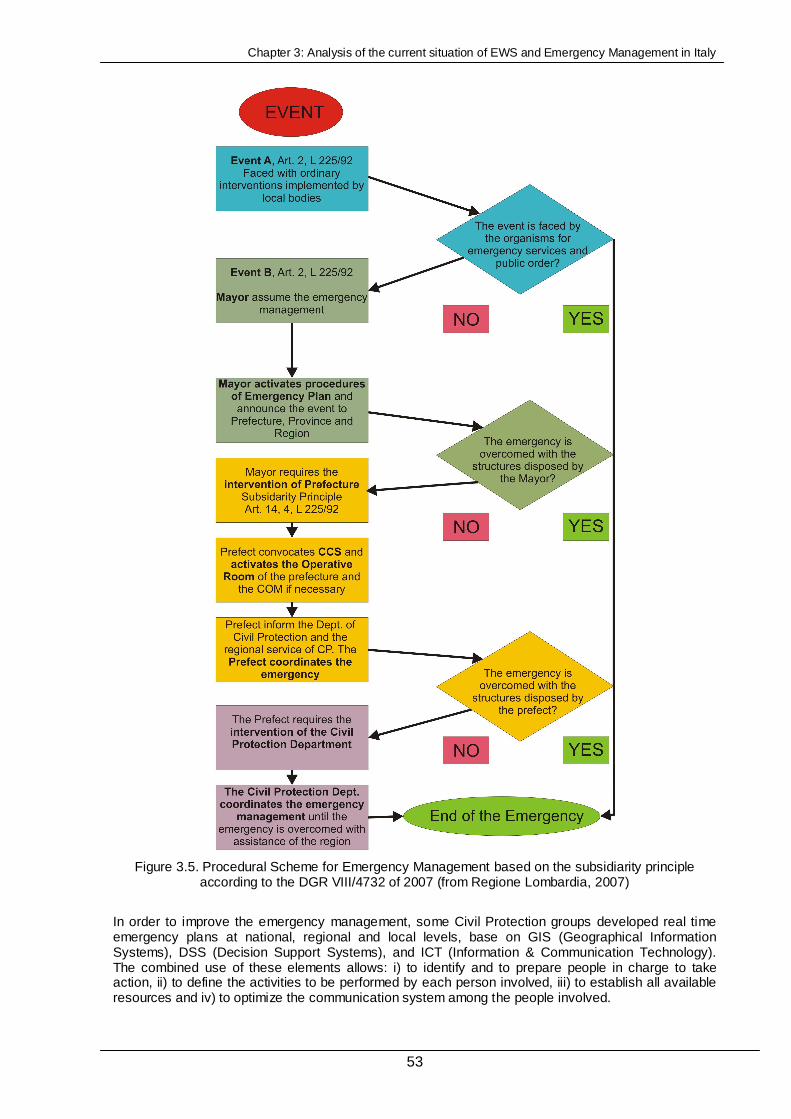
Chapter 3: Analysis of the current situation of EWS and Emergency Management in Italy
53
Figure 3.5. Procedural Scheme for Emergency Management based on the subsidiarity principle
according to the DGR VIII/4732 of 2007 (from Regione Lombardia, 2007)
In order to improve the emergency management, some Civil Protection groups developed real time emergency plans at national, regional and local levels, base on GIS (Geographical Information Systems), DSS (Decision Support Systems), and ICT (Information & Communication Technology). The combined use of these elements allows: i) to identify and to prepare people in charge to take action, ii) to define the activities to be performed by each person involved, iii) to establish all available resources and iv) to optimize the communication system among the people involved.
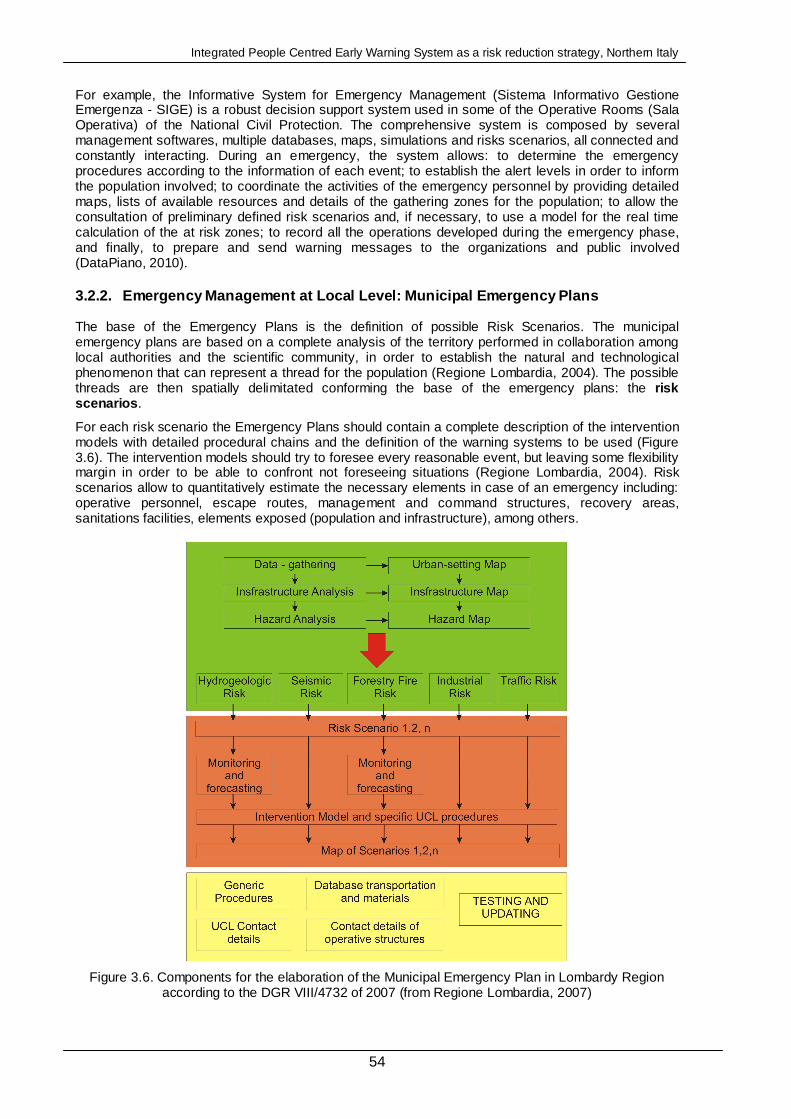
Integrated People Centred Early Warning System as a risk reduction strategy, Northern Italy
54
For example, the Informative System for Emergency Management (Sistema Informativo Gestione Emergenza - SIGE) is a robust decision support system used in some of the Operative Rooms (Sala Operativa) of the National Civil Protection. The comprehensive system is composed by several management softwares, multiple databases, maps, simulations and risks scenarios, all connected and constantly interacting. During an emergency, the system allows: to determine the emergency procedures according to the information of each event; to establish the alert levels in order to inform the population involved; to coordinate the activities of the emergency personnel by providing detailed maps, lists of available resources and details of the gathering zones for the population; to allow the consultation of preliminary defined risk scenarios and, if necessary, to use a model for the real time calculation of the at risk zones; to record all the operations developed during the emergency phase, and finally, to prepare and send warning messages to the organizations and public involved (DataPiano, 2010).
3.2.2. Emergency Management at Local Level: Municip al Emergency Plans
The base of the Emergency Plans is the definition of possible Risk Scenarios. The municipal emergency plans are based on a complete analysis of the territory performed in collaboration among local authorities and the scientific community, in order to establish the natural and technological phenomenon that can represent a thread for the population (Regione Lombardia, 2004). The possible threads are then spatially delimitated conforming the base of the emergency plans: the risk scenarios .
For each risk scenario the Emergency Plans should contain a complete description of the intervention models with detailed procedural chains and the definition of the warning systems to be used (Figure 3.6). The intervention models should try to foresee every reasonable event, but leaving some flexibility margin in order to be able to confront not foreseeing situations (Regione Lombardia, 2004). Risk scenarios allow to quantitatively estimate the necessary elements in case of an emergency including: operative personnel, escape routes, management and command structures, recovery areas, sanitations facilities, elements exposed (population and infrastructure), among others.
Figure 3.6. Components for the elaboration of the Municipal Emergency Plan in Lombardy Region according to the DGR VIII/4732 of 2007 (from Regione Lombardia, 2007)

Chapter 3: Analysis of the current situation of EWS and Emergency Management in Italy
55
According to the DGR VIII/4732 of 2007 (Regione Lombardia, 2007), all the elements of the Emergency Plan are interlinked and must be continuously updated and verified at last once every year in order to evaluated and update the proposed scenarios and to include new scenarios if necessary. In addition, the law requires the development of regular emergency exercises and trainings in order to evaluate the efficiency of the proposed emergency procedures (Figure 3.7). The municipality can provide either single-hazard plans, or a multi-risk plan, analyzing the possible interactions between different events.
Figure 3.7. Cycle of testing and updating for the municipal emergency plans as established by the DGR VIII/4732 of 2007 (from Regione Lombardia, 2007)
3.3. Early Warning Systems in Italy
Until recently, the prevailed tendency of the Italian Civil Protection was to focus on the emergency management and recovery phases. Nowadays, however, the legislation focus has changed towards the phases of forecasting and prevention. While the forecasting aims to individualize the possible events and to predict the effects, the prevention is based on the concept of risk reduction instead.
The combination of forecasting, together with hydro-pluviometric monitoring, allows using a warning system to timely activate the Civil Protection emergency plans in order to reduce the impact of the event and to assure people’s safety. In Italy, the benefits of forecasting and prevention have been evident in several opportunities during the last decades. For example, in the basin of River Po, the flood of 1994 killed 68 people, while a strongest event in 2000 left 24 victims thanks to the application of a warning system (Protezione Civile Nazionale, 2010).
Regarding the prevention, preventive actions can be either structural or not-structural. Structural actions consist in works active or passive, such as embanks, slope consolidation, retaining walls, etc, that aim to reduce the thread of the event, by reducing its probability of occurrence or by decreasing its impact. On the other side, non structural actions include those actions aim to reduce the damage through the urbanization control, emergency planning, development of warning systems and monitoring networks. Both types of preventive activities have been differentially applied around the Italian territory.
An important step in the process of improving the activities of forecasting and prevention in Italy, was the enactment of the Law DPCM 27/02/2004. This Law contains the “Operative instructions for the functional and organizational management of the national and regional alert system for the geohydrological and hydraulic risks for Civil Protection Purposes” (Indirizzi operativi per la gestione organizzativa e funzionale del sistema di allertamento nazionale e regionale per il rischio idrogeologico ed idraulico ai fini di protezione civile).
3.3.1. National Early Warning System – Italy
The origins of the Italian Early Warning System were established in 2004 with the Law DPCM 27/02/2004. Even if it at the beginning was defined only for geohydrological and hydraulic risks, nowadays it covers a whole range of natural and technological hazards. The system, under the direct control of the Civil Protection Authorities through a network of Functional Centres (Centri Funzionali) and Competence Centres (Centri di Competenza), is used for multi-hazards assessment, real time forecast, assessment of the risk scenarios and estimation of the induced effects of catastrophic events on human life and goods (Pagliara, 2010).
According to the Law DPCM 27/02/2004, each region is responsible of establishing the procedures and the modality of the early warning system for different territorial levels. On this regard, the regions should take into account the different phases defined by the national warning system including:
Integrated People Centred Early Warning System as a risk reduction strategy, Northern Italy
56
- Forecasting phase: constituted by the estimation, based on adequate numeric models, of the expected meteorological, hydrological, hydraulic and geomorphologic conditions. It should also include the expected effects that those conditions may have on the integrity of live, goods, settlements and environment.
- Monitoring and surveillance phase: articulated in: i) quantitative and qualitative observation -direct and instrumental-, of the meteorological and hydrological event in action; ii) short term forecast of the relative effects through the meteorological now casting and/or the influx-outflux model performed with real time measurements.
The previous phases activate:
- Risk prevention phase: implemented either through the actions to counteract the event included on the Regional Programs of Forecasting and Prevention, than through technical urgent interventions, as established on the article 108 of the DL n. 112/1998.
- Several phases of the emergency management: by implementing the regional, provincial and municipal Emergency Plans.
The Regional Programs of Forecasting and Prevention, besides assigning the functions, tasks and management of the phases of forecasting, monitoring and surveillance, should also support the functional and operative organization of the emergency aid service. All emergency programs and plans at different territorial levels must be harmonized, and in this sense, the Emergency Plans must be organically and functionally linked to the Programs of Forecasting and Prevention.
Regarding the forecasting and prevention, the regions, in cooperation with the civil protection department, define “Alert Zones” considering: the possible existing risks; the possible evolution of the events; the possible effects; the relationship and binds among the different territorial levels and hydrographic basin in regard to geology, infrastructure, administration and social-environment; the indications provided on the Extract Plans For Hydrogeological Setting (Piani Stralcio per la Tutela dal Rischio Idrogeologico); and the more general planning at national, regional and provincial level.
For each Alert Zone, the different Risk Scenarios should be identified, together with their possible effects. Additionally, the regions should establish a threshold system for each type of hazard. The threshold system must include at least two levels of criticality -moderate and high, besides an additional base level for the ordinary situation when the risk levels are acceptable by the population. According to the threshold system, some levels of alert must be established for before, during and after the foreseen event (Figure 3.8).
The declaration of the different alert levels and the activation of the emergency plans are in charge of the President of the Regional Council who bases the decision on the criticality levels. The evaluation of the criticality levels is responsibility of the Functional Centres based on the risk scenarios, previously established.

Chapter 3: Analysis of the current situation of EWS and Emergency Management in Italy
57
Figure 3.8. General Components of the national Early Warning System (Pagliara, 2010)
The Functional Centres, or Centres for Forecasting and Surveillance of Effects – CFSE, are the operative support units of the Early Warning System that provides technical and scientific support to the civil protection decision process. The goal of the CFSE is to provide, to the Civil Protection, real time modelling of hazards, risks and damage scenarios. The CFSE are in charge of the collection, integration and real time exchange through common standards and procedures, of all available meteorological, hydrological and geological data. Some of the information managed in the CFSE includes: short term and real time monitoring data provided by in situ instruments in the whole national territory, including 2040 telemetric stations, 1400 rain gauges and 900 flow-meters, among others; geospatial data and digital terrain models; data from the local authorities and the local technical teams; and weather forecast data, among others.
Another component of the system is the Competence Centres, or Centres for Technological and Scientific services - CTS, which are involved in the hazard assessment and surveillance activities. These centres are research institutions which provide services, information and technical and scientific contributions.
About the time response of the National Warning System, the Civil Protection requires 12 hours to run emergency civil protection procedures, plus 12 hours to produce the scenario. Consequently, it is necessary to identify precursory events 24 hours in advance in order to effectively apply the National Warning Systems at full capacity (Pagliara, 2010).
The warning messages produced by the Functional Centres for hydrogeological risks, usually include an explanatory bulletin with a map at regional scale describing risk levels, weather conditions, among others. One of the mostly used media for the dissemination of the messages includes the National Civil Protection public website - www.protezionecivile.it. On this website, and in some of the regional civil protection websites as well, it is possible to find data from the monitoring network including rivergauges, raingauges, webcams, meteorological stations and data from National Radar Network, as well as some information on statistics, previous events, damage occurred, warning areas, flood exposition, among others.
Since recently, the Civil Protection has been working on improving satellite estimation (rain rate, soil moisture, snow parameters, hydrological validation, etc.) with the aim of using Earth Observation Satellites Data to support users in every phase of risk management cycle (Pre-disaster, Emergency response, Post Disaster). On this regard, one of the most vanguards programs on the use of Earth Observation for Civil Protection purposes is the COSMO SkyMed system, which is the first spatial

Integrated People Centred Early Warning System as a risk reduction strategy, Northern Italy
58
program for dual application –civil/ commercial and military. The COSMO-SkyMed, funded by the Italian Spatial Agency (ASI) and the Defense Minister, launched its first satellite in 2007 and nowadays has four satellites in orbit. One of the most useful functional advantages of the system, is the capacity of change, in short time notice, the acquisition planning by request of the final user, in order to obtain data in the fastest time possible. The high quality of the products and their high capacity of analysis of different data, the operability in any meteorological and light condition, the short temporal acquisition interval and high acquisition capability with up to 1800 images at day, are useful for prevention, monitoring, and in particular for the management of natural and man-made emergencies (Agenzia Spaciale Italiana, 2010).
According to Pagliara (2010), since 1997 the Italian Civil Protection, aware that during a warning or a catastrophe citizens’ behaviour is too important as to neglect it, has been developing educational and informative activities addressed to the general public. These activities aim to improve the capacity reaction of the general community and are usually performed in collaboration with mass media and educational institutions.
The instruments developed by the Civil Protection for risk education and communication include the “Vademecum of Civil Protection” called “Civil Protection in the Family” (Protezione Civile in Famiglia) published in 2005. This booklet, distributed in several schools and public meetings, aims to increase the risk awareness among the Italian population and to improve its risk capacity by informing about appropriate and inappropriate behaviour to adopt during emergencies associated to different hazards (Department of Civil Protection, 2005).
3.3.2. Warning System at Regional and Local Level
The most recent legislative tool that defines the alert system in the Lombardy Region, replacing the Law DPCM 27/02/2004, is the Directive DGR 22/12/2008 n. 8/8753 “Determination regarding the organizative and functional management of the natural risks warning system for civil protection” (Determinazione in merito alla gestione organizzativa e funzionale del sistema di allerta per i rischi naturali ai fini di protezione civile). This directive applies for several risks including hydrogeologic, hydraulic, strong thunderstorms, snow, avalanches, strong wind, heat waves and forestry fires.
According to the DGR 22/12/2008, the alert system is composed by two phases: a forecasting phase which activates the risk prevention, and a monitoring and surveillance phase which activates the emergency management.
During the forecasting phase, the warning time is typically superior to 12 hours, based on meteorological data and an atmospheric prediction. This functions are responsibility of the Meteorological Office of the Regional Agency for the Protection of the Environment (Agenzia Regionale per la Protezione del Ambiente della Lombardia - ARPA) who issues a warning bulletin which is delivered to the Operative Unit (Unità Operativa - UO) of the Regional Civil Protection. Following the bulletin, the Functional Centre (Centro Funzionale- CF) located at the UO, elaborates a prediction of the possible effects, classify them according to criticity levels and then post the results on a Criticity Bulletin issued by the Director of the UO on daily basis (Figure 3.9).
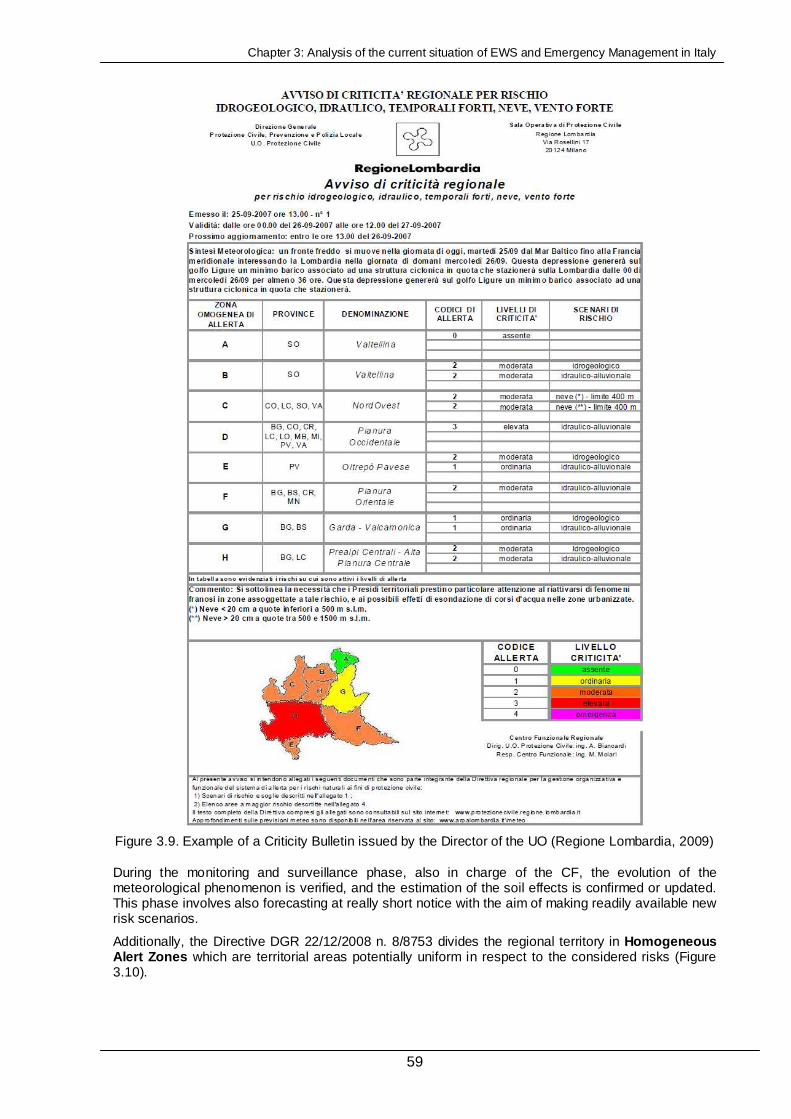
Chapter 3: Analysis of the current situation of EWS and Emergency Management in Italy
59
Figure 3.9. Example of a Criticity Bulletin issued by the Director of the UO (Regione Lombardia, 2009)
During the monitoring and surveillance phase, also in charge of the CF, the evolution of the meteorological phenomenon is verified, and the estimation of the soil effects is confirmed or updated. This phase involves also forecasting at really short notice with the aim of making readily available new risk scenarios.
Additionally, the Directive DGR 22/12/2008 n. 8/8753 divides the regional territory in Homogeneous Alert Zones which are territorial areas potentially uniform in respect to the considered risks (Figure 3.10).

Integrated People Centred Early Warning System as a risk reduction strategy, Northern Italy
60
Figure 3.10. Regional Homogeneous Alert Zones for hydrogeological and hydraulic risks, according to the DGR 22/12/2008 n. 8/8753 (Regione Lombardia, 2009). Note: the study area (Comunità Montana
Valtellina di Tirano) is contained in the Homogeneous Alert Zones A and B.
The activation of the regional alert codes is based on the criticality levels: absent, ordinary, moderate and high (Table 3.2). The determination of the criticality levels is based on the degree of involvement of the following fields in crescent priority order: environment, economical activity, settlements and properties, transportation infrastructure for public services and finally, but most critical, health and preservation of the living species in general and the human beings in particular.
Table 3.2. Criticality levels and Alert Code according to the DGR 22/12/2008 n. 8/8753 (Regione Lombardia, 2009)
CRITICALITY LEVEL
ALERT CODE CRITICALITY DESCRITION
Absent 0 Non expected natural phenomenon that can activates the considered risk
Ordinary 1 Expected natural phenomenon that could generate some criticality considered acceptable by the population
Moderate 2 Expected natural phenomenon that do not reach extreme values and that are expected to generate some moderate damage to the population, involving an important part of the considered territory
Elevate 3 Expected natural phenomenon that could reach extreme values and that are expected to generate some heavy damages to the population, involving most of the considered territory
Emergency 4 Extremely serious situations when there are some reported and spread damages, where the actions should be first of all aim to help the population
Regarding the thresholds for hydrogeologic and hydraulic risks, the Geological Service of Lombardy Region defined some equations to determine the rainfall thresholds associated to the different Alert Levels for debris flows, slow flows, soil slips and debris torrents. These equations are based on the intensity and duration of the rainfall, related to the medium annual rainfall, without considering the geotechnical properties of the materials involved.
The equations are:
S1 = [(D-0,55)*2,01*m.a.r/100]*D
S2 = [(D-0,48)*2,80*m.a.r/100]*D
Where:
S1 = minimum triggering threshold (< 10 debris flows per km2) = 1st alert threshold S2 = minimum triggering threshold (< 20 debris flows per km2) = 2nd alert threshold D = rainfall duration, m.a.r. = medium annual rainfall of the respective area
CODE NAME PROVINCES
A Alta Valtellina SO
B Media-bassa Valtellina SO
C Nordovest VA, CO, LC, SO
D Pianura Occidentale VA, CO, LC, MZ, MI, CR, LO, PV
E Oltrepò Pavese PV
F Pianura Orientale BG, BS, CR, MN
G Garda – Valcamonica BS, BG
H Prealpi Centrali BG, LC
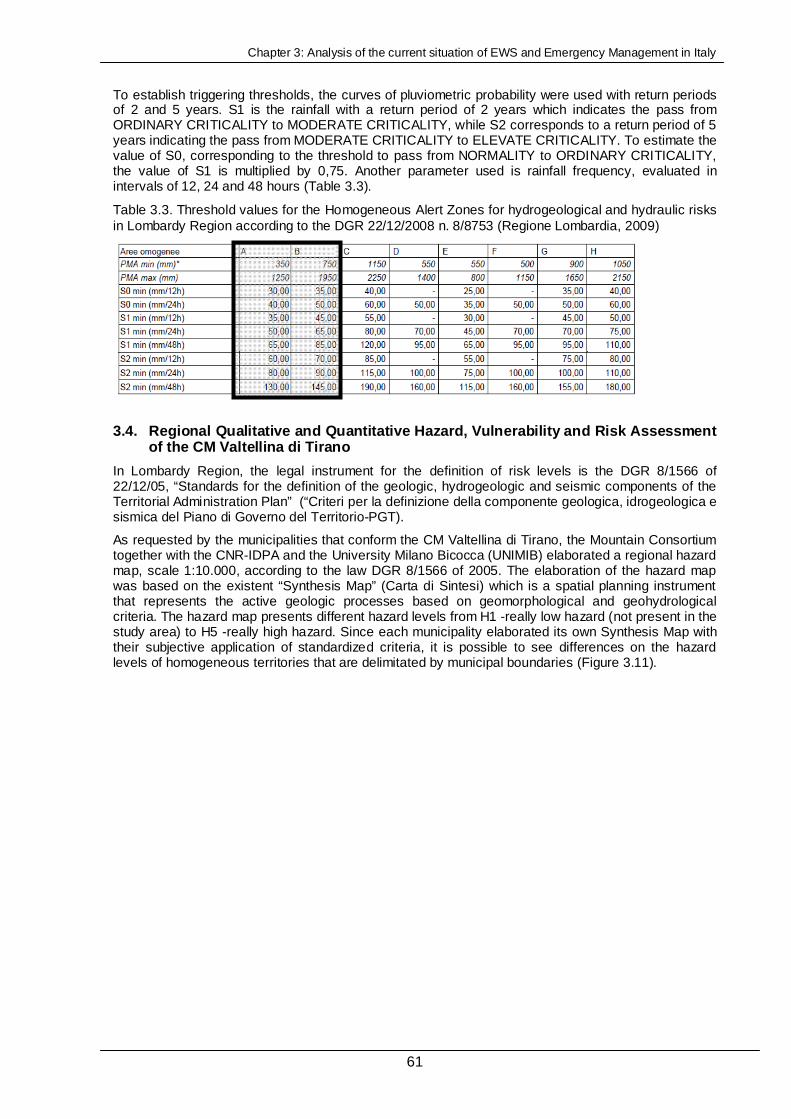
Chapter 3: Analysis of the current situation of EWS and Emergency Management in Italy
61
To establish triggering thresholds, the curves of pluviometric probability were used with return periods of 2 and 5 years. S1 is the rainfall with a return period of 2 years which indicates the pass from ORDINARY CRITICALITY to MODERATE CRITICALITY, while S2 corresponds to a return period of 5 years indicating the pass from MODERATE CRITICALITY to ELEVATE CRITICALITY. To estimate the value of S0, corresponding to the threshold to pass from NORMALITY to ORDINARY CRITICALITY, the value of S1 is multiplied by 0,75. Another parameter used is rainfall frequency, evaluated in intervals of 12, 24 and 48 hours (Table 3.3).
Table 3.3. Threshold values for the Homogeneous Alert Zones for hydrogeological and hydraulic risks in Lombardy Region according to the DGR 22/12/2008 n. 8/8753 (Regione Lombardia, 2009)
3.4. Regional Qualitative and Quantitative Hazard, Vulnerability and Risk Assessment of the CM Valtellina di Tirano
In Lombardy Region, the legal instrument for the definition of risk levels is the DGR 8/1566 of 22/12/05, “Standards for the definition of the geologic, hydrogeologic and seismic components of the Territorial Administration Plan” (“Criteri per la definizione della componente geologica, idrogeologica e sismica del Piano di Governo del Territorio-PGT).
As requested by the municipalities that conform the CM Valtellina di Tirano, the Mountain Consortium together with the CNR-IDPA and the University Milano Bicocca (UNIMIB) elaborated a regional hazard map, scale 1:10.000, according to the law DGR 8/1566 of 2005. The elaboration of the hazard map was based on the existent “Synthesis Map” (Carta di Sintesi) which is a spatial planning instrument that represents the active geologic processes based on geomorphological and geohydrological criteria. The hazard map presents different hazard levels from H1 -really low hazard (not present in the study area) to H5 -really high hazard. Since each municipality elaborated its own Synthesis Map with their subjective application of standardized criteria, it is possible to see differences on the hazard levels of homogeneous territories that are delimitated by municipal boundaries (Figure 3.11).

Integrated People Centred Early Warning System as a risk reduction strategy, Northern Italy
62
Figure 3.11. Qualitative Geologic and Geohydrologic Hazard Map of the CM Valtellina di Tirano, according to the DGR 8/1566. Elaborated by the Mountain Consortium, CNR-IDPA and UNIMIB. In the
detailed box it is possible to see different hazard levels delimitated by municipal boundaries
In order to evaluate the risk and to elaborate a qualitative risk map the risk matrix proposed by the DGR 8/1566 was used by the Mountain Consortium (Figure 3.12). The risk matrix, with five classes of hazards versus four classes of elements at risk, serves to classify risk areas according to the possible consequences to the elements at risk caused by a natural hazard and by the estimated hazard level.
Figure 3.12. Official Risk Matrix of the Lombardy Region according to the DGR 8/1566 . Where: H: hazard level, E: elements at risk, R: risk level

Chapter 3: Analysis of the current situation of EWS and Emergency Management in Italy
63
The elements at risk are divided into four groups considering the strategic importance and severity of possible outcomes in case of a hazardous event (Table 3.4).
Table 3.4. Classification of the elements at risk according to the DGR 8/1566 Class Element at Risk
E4 Urban areas Public Infrastructure
E3 Primary roads and main railways Quarries and junkyards
E2 Secondary roads and narrow railways Valuable agricultural areas (vineyards and orchards)
E1 Other agricultural areas Forests and other areas
The Qualitative Risk Map of the CM Valtellina di Tirano obtained by applying the risk matrix, according to the DGR 8/1566, is presented in the Figure 3.13.
Figure 3.13. Qualitative Risk Map of the CM Valtellina di Tirano. Elaborated by the Mountain Consortium, CNR-IDPA and UNIMIB, according to the DGR 8/1566
In the framework of the Mountain Risks Project, quantitative maps of both hazard and risk were produced for debris flows by Blahut (2010). The Hazard Map of the CM Valtellina di Tirano at scale 1:10.000 was elaborated taking into account the probabilities of debris flow initiation combined with runout simulation models (Figure 3.14).
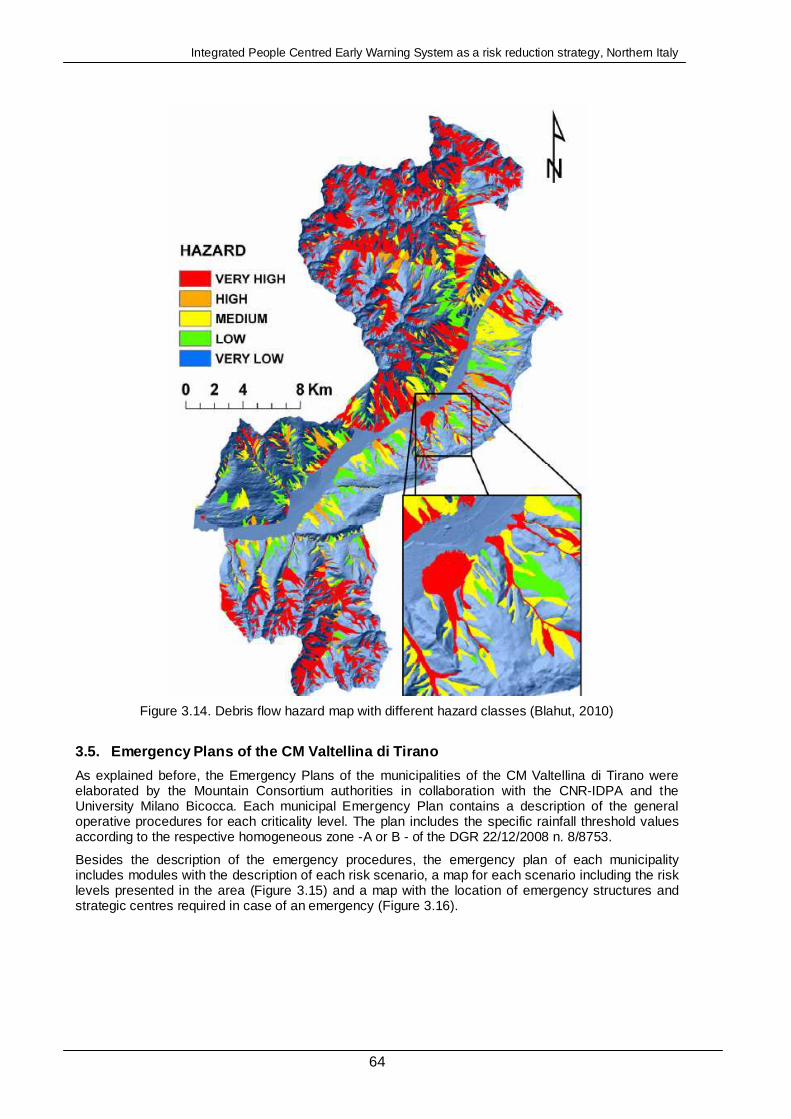
Integrated People Centred Early Warning System as a risk reduction strategy, Northern Italy
64
Figure 3.14. Debris flow hazard map with different hazard classes (Blahut, 2010)
3.5. Emergency Plans of the CM Valtellina di Tirano
As explained before, the Emergency Plans of the municipalities of the CM Valtellina di Tirano were elaborated by the Mountain Consortium authorities in collaboration with the CNR-IDPA and the University Milano Bicocca. Each municipal Emergency Plan contains a description of the general operative procedures for each criticality level. The plan includes the specific rainfall threshold values according to the respective homogeneous zone -A or B - of the DGR 22/12/2008 n. 8/8753.
Besides the description of the emergency procedures, the emergency plan of each municipality includes modules with the description of each risk scenario, a map for each scenario including the risk levels presented in the area (Figure 3.15) and a map with the location of emergency structures and strategic centres required in case of an emergency (Figure 3.16).

Chapter 3: Analysis of the current situation of EWS and Emergency Management in Italy
65
Figure 3.15. Example of risk scenario in CM Valtellina di Tirano. Risk Scenario Grosio 4 - GR4. Elaborated by the Mountain Consortium, CNR-IDPA and the University Milano Bicocca according to
the DGR 8/1566
Figure 3.16. Example of emergency structures presented in the risk scenario Grosio 4 – GR 4. Elaborated by the Mountain Consortium, CNR-IDPA and the University Milano Bicocca according to
the DGR 8/1566
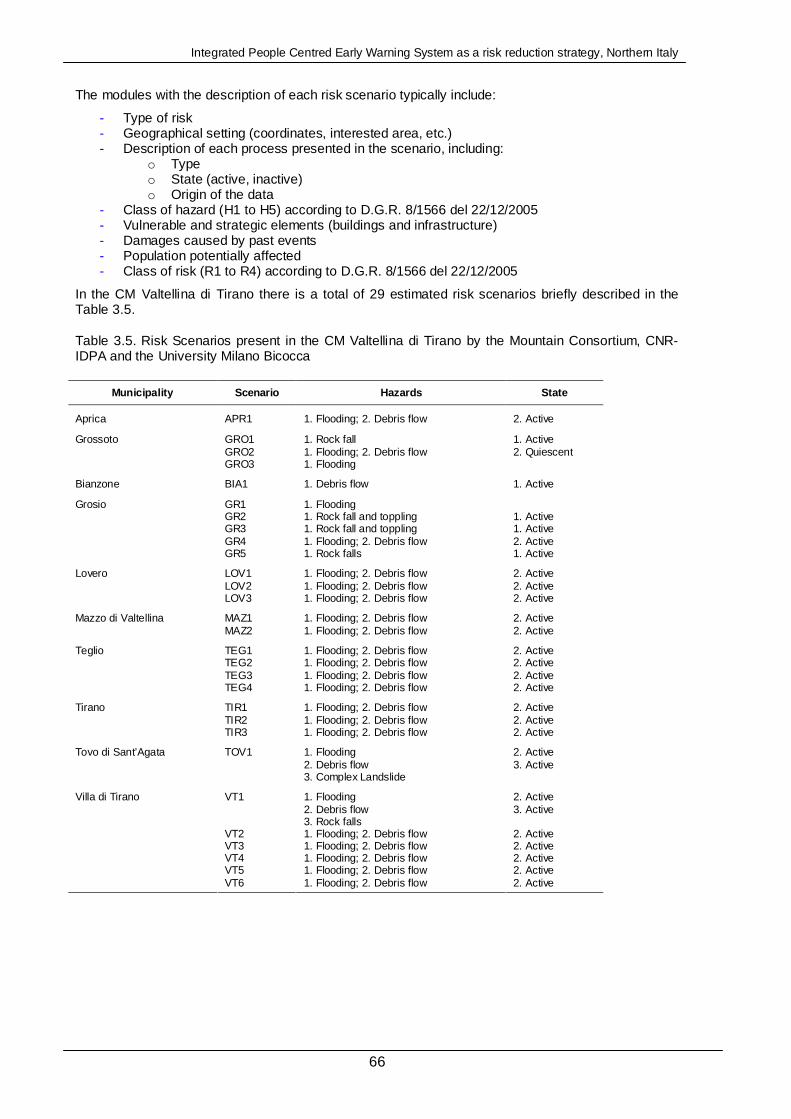
Integrated People Centred Early Warning System as a risk reduction strategy, Northern Italy
66
The modules with the description of each risk scenario typically include:
- Type of risk - Geographical setting (coordinates, interested area, etc.) - Description of each process presented in the scenario, including:
o Type o State (active, inactive) o Origin of the data
- Class of hazard (H1 to H5) according to D.G.R. 8/1566 del 22/12/2005 - Vulnerable and strategic elements (buildings and infrastructure) - Damages caused by past events - Population potentially affected - Class of risk (R1 to R4) according to D.G.R. 8/1566 del 22/12/2005
In the CM Valtellina di Tirano there is a total of 29 estimated risk scenarios briefly described in the Table 3.5.
Table 3.5. Risk Scenarios present in the CM Valtellina di Tirano by the Mountain Consortium, CNR-IDPA and the University Milano Bicocca
Municipality Scenario Hazards State
Aprica APR1 1. Flooding; 2. Debris flow 2. Active
GRO1 1. Rock fall 1. Active GRO2 1. Flooding; 2. Debris flow 2. Quiescent
Grossoto
GRO3 1. Flooding
Bianzone BIA1 1. Debris flow 1. Active
GR1 1. Flooding GR2 1. Rock fall and toppling 1. Active GR3 1. Rock fall and toppling 1. Active GR4 1. Flooding; 2. Debris flow 2. Active
Grosio
GR5 1. Rock falls 1. Active
LOV1 1. Flooding; 2. Debris flow 2. Active LOV2 1. Flooding; 2. Debris flow 2. Active
Lovero
LOV3 1. Flooding; 2. Debris flow 2. Active
MAZ1 1. Flooding; 2. Debris flow 2. Active Mazzo di Valtellina MAZ2 1. Flooding; 2. Debris flow 2. Active
TEG1 1. Flooding; 2. Debris flow 2. Active TEG2 1. Flooding; 2. Debris flow 2. Active TEG3 1. Flooding; 2. Debris flow 2. Active
Teglio
TEG4 1. Flooding; 2. Debris flow 2. Active
TIR1 1. Flooding; 2. Debris flow 2. Active TIR2 1. Flooding; 2. Debris flow 2. Active
Tirano
TIR3 1. Flooding; 2. Debris flow 2. Active
Tovo di Sant’Agata TOV1 1. Flooding 2. Debris flow 3. Complex Landslide
2. Active 3. Active
VT1 1. Flooding 2. Debris flow 3. Rock falls
2. Active 3. Active
VT2 1. Flooding; 2. Debris flow 2. Active VT3 1. Flooding; 2. Debris flow 2. Active VT4 1. Flooding; 2. Debris flow 2. Active VT5 1. Flooding; 2. Debris flow 2. Active
Villa di Tirano
VT6 1. Flooding; 2. Debris flow 2. Active

Chapter 3: Analysis of the current situation of EWS and Emergency Management in Italy
67
3.6. Discussion
In the last 20 years the evolution of the Italian Civil Protection System has been complex, passing from a central model to a model where the responsibilities are shared among the different territorial authorities, based on the principle of subsidiarity. The complexity of the legal framework in Italy, the multiplicity of civil protection laws and the division of responsibilities have produced that there is not a clear frame of the duties and obligations of each institution, especially with large events that affect several municipalities (Raja, 1992). While civil protection is responsibility of everyone, the Civil Protection remains as an indistinct entity of fuzzy characteristics for the mass media. Furthermore, the fact that the civil protection legal framework is continuously changing makes difficult its application due to the high cost, in time and money that implies to perform any change.
The key role of the volunteers in the Civil Protection System in Italy is a positive example for many countries and has been proved effective for the management of several emergencies. However, it also has a large constrain in the sense that the volunteers of the Civil Protection are seen as the representative body of the general population inside the Civil Protection system. While in reality, once a person becomes a volunteer he/she gain some extra training and knowledge and becomes part of a institution, therefore is not longer a common citizen. The fact that the volunteers are seen as representatives of the population generates that there is a strong focus on the preparedness of the volunteers neglecting the preparedness of the general population.
Regarding the legal framework for risk management, since 1992 Italian legislation makes emphasis on importance of prevention and mitigation. However, most of the actions have been focused mainly on the emergency management or in on structural mitigation measures instead of having a broader approach that strongly includes non structural measures for prevention and mitigation. Nonetheless, it is important to acknowledge that some scattered initiatives on non structural measures have been carried out by some municipalities, unfortunately this efforts currently constitute the exception and not the rule. Additionally, there are several legal duties which are usually not accomplished, especially those regarding preparedness of the general population. Although the Mayor is the responsible by law (Art. 12 Law 265, 1999) for risk communication and preparedness education for the population, education and preparedness activities organized by the municipalities are rarely performed in Italy. Particularly, in the study zone, there have never been any preparedness activities neither communication campaigns developed by any of the municipalities involved. Additionally, the emergency plans have never been communicated to population and, even if there have been some emergency exercise with the volunteers of the Civil Protection, no drills involving the population at risk have ever been performed, despite this being mandatory by law. Taking into account the previous, it is possible to affirm that there is still a general strong disconnection between what established by law and what is effectively carried out.
Regarding the risk maps used to establish the risk scenarios, the standards for the elaboration of the risk maps remain vague and unclear what generates contrasting results for homogeneous areas. Additionally, the lack of susceptibility analysis and an integral vulnerability assessment generates a narrow estimation of the possible risk scenarios.
The emergency Response Tool available in the study area is an excellent tool that it is just being installed in the different communes of the mountain consortium. In order to assure an effective emergency response, the database used for the tool must be constantly updated in a joint effort from the scientific institution and the local authorities. The updating of the database takes time and patience and requires constant involving and communication among the different authorities and scientific institutions. This tool represent a potential key element for the effective emergency management, however, it has to be tested as soon as possible in order to evaluate its effectiveness and to analyze if changes are necessary in order to adapt the tool to the local conditions.
Even if the Italian Civil Protection has been increasingly involved in education campaigns, most of those campaigns have consisted only in the passive dissemination of information without including any active role of the public. Furthermore, except in some particular cases, most of the education campaigns are focused on earthquakes and volcanoes neglecting other hazards, in particular landslides. In addition, even if the developed activities are considered by the Italian Civil Protection a part of the Warning System (Pagliara, 2010), there is not a single national legal instrument that supports this in order to encourage the development of well structured and constant educational activities. On the contrary, the responsibilities for the communication to the population rest in the

Integrated People Centred Early Warning System as a risk reduction strategy, Northern Italy
68
Mayors who, in part due to the short mandate periods, are not able to develop long-term education campaigns.
Regarding the national EWS, the law DPCM 27/02/2004 is a large step on risk reduction since it legally establishes the importance of an early warning. However, the law focused mostly on the forecasting and warning, disregarding the preparedness and improvement of response capability. For the previous reason, it is not possible to say that a EWS exists. Furthermore, the so called national EWS created in 2004 rules at national level without considering the local differences that could be presented during different events. The early warning itself remains responsibility mostly of the regions that apply general sub-regional forecasting thresholds, disregarding the strong microclimate variations that can be presented inside a sub-region due to general factors such as altitude. However, in reality, to build a high tech instrumental monitoring network large enough to consider all microclimates is not economically or logistically feasible. For this reason, it is necessary to look for alternatives to monitor large regions at low cost. In several countries community based monitoring networks have proved to be highly effective on this matter.
In Italy great valuable efforts have been performed on civil protection generating an important improvement of the risk management situation. Furthermore, the scientific understanding of risk factors has increased remarkably in the last decades. Unfortunately, the disconnection among scientific research and risk management is still strong, especially concerning the involvement of the population at risk. Having gained great knowledge and experience, it is time to extensively combine them in practice, in order not only to improve emergency management, but also to achieve an effective risk reduction through mitigation and preparedness. Risk reduction should be focused on prevention and mitigation and not only on mostly structural measures and weather forecasting as is focused nowadays. In order to achieve the previous it is fundamental to improve the networking and communication among the different stakeholders, actively including the local population.
3.7. References
Agenzia Spaciale Italiana. 2010. COSMO-SkyMed: Sistema duale per l'osservazione della Terra. Online 20/08/2010 http://www.asi.it/it/attivita/osservazione_terra/cosmoskymed
Alexander, D. 2002. The Evolution of Civil Protection in Modern Italy. In: Disastro! Disasters in Italy since 1860: culture, politics and society. John Dickie, John Foot and Frank M. Snowden, eds. 165-185 p.
Blahut, J. 2010. debris flow hazard and risk analysis at medium and local scale. PhD Dissertation. Università degli Studi di Milano Bicocca. Italy. 230 p.
Department of Civil Protection, 2005. Protezione Civile in Famiglia. 2nd ed. Rome, 64 p.
Elvezio Galanti, 1997. Il Metodo Augustus. DPC INFORMA - Periodico informativo del Dipartimento della Protezione Civile, Numero 4 Maggio-Giugno 1997. Protezione Civile Regione Piemonte. 34 p.
Grosseto Province, 2010. Fonte Normativa della Proteczione Civile. Civil protection office. Online 15/08/2010. http://www.provincia.grosseto.it/protezionecivile/protezione_civile.php/key-Fonte+normativa/liv-2
Pagliara, P. 2010. Proceedings Training Workshop on Multi-Hazard Early Warning Systems (MHEWS) with focus on Institutional Partnerships and Cooperation, 22-25 March 2010, San Jose, Costa Rica. Online 15/08/2010 http://www.wmo.int/pages/prog/drr/events/MHEWSCostaRica/Docs/Session%202/Italy/Costa%20Rica_marzo_2010_newnew.pdf
Protezione Civile Nazionale, 2010. Attività del sistema: rischio hidrogeologico. Online 17/08/2010 http://www.protezionecivile.it/minisite/index.php?dir_pk=251&cms_pk=1443
Raja, R. 1998. Emergenza, Protezione Civile e prevenzione del rischio: un lenguaggio comune. In: Programma regionale di previsione e prevenzione di protezione civile ai sensi art. 12 comma 2 legge 24 febbraio 1992 n. 225 / Regione Lombardia. Online 17/08/2010 http://www.pc.regione.lombardia.it/files_vari/cap1.pdf
Regione Lombardia, 2004. La Pianificazione di emergenza in Lombardia. Guida ai piani di emergenza comunali e provinciali. I quaderni della Protezione Civile 7. Regione Lombardia: Milano. 95 p.
Regione Lombardia, 2007. Direttiva Regionale per la Pianificazione di Emergenza degli Enti Locali (L.R. 16/2004 - art. 7, comma 11) Approvata con D.G.R. n.VIII/4732 del 16 maggio 2007
Regione Lombardia, 2008. PRIM 2007-2010. Programma Regionale Integrato di Mitigazione dei Rischi. 43 p. Regione Lombardia, 2009. DGR 22/12/2008 n. 8/8753 Determinazione in merito alla gestione organizzativa e
funzionale del sistema di allerta per i rischi naturali ai fini di protezione civile. Bolletino Ufficiale, 1st Suplemento Straordinario. 88 p.
Regione Lombardia, 2010. L'Organizzazione della Protezione Civile in Regione Lombardia. Online 17/08/2010. http://www.pc.regione.lombardia.it/ChiSiamo.aspx
Chapter 4: Development of a EWS: challenges, limitations and strategies
69
Chapter 4: Development of a People Centred Early Warning System for mountain risks: Challenges, limitations and strategies
4.1. Components of Early Warning System: Challenges , limitations and strategies
The current state of each component of the EWS in the study area was evaluated taking into account some of the main elements defined by the UN/ISDR – PPEW (2005) described in previous chapters. Based on the results of this evaluation several challengues, limitations and strategies to develop a CB-EWS were identified and are presented next.
4.1.1 Risk Knowledge: systematically collect data a nd undertake risk assessments
To assess this component it is necessary to analyze the existing knowledge, both from experts and people exposed, about the risks, hazards and vulnerabilities, their patterns and trends and the availability of data and maps.
As explained before, in CM Valtellina di Tirano the municipal regulatory hazard maps are based on spatial planning maps at municipal scale and not on hazard analysis. The spatial planning maps are developed based mostly on geomorphic criteria and buffer zones for construction restrictions. The procedures to obtain the maps are not completely structured and leave a large margin for expert decision. Basically, each municipality can apply its own criteria with the consequence that the municipal maps are biased and are often not scientifically rigorous. As result, once the municipal maps are joined to create a regional map, it is common to find in the municipal boundaries mismatches of the hazard zonification even in areas with homogenous hydrogeologic conditions. Regarding the regulatory vulnerability maps, these only take into account the presence of strategic elements at risk without considering the degree of loss, nor applying any vulnerability analysis.
Regarding the actual risk scenarios, they were established based on expert criteria, taking into account mostly evidences of previous events. Although the database of historic events is continuously updated, the reliance on past events is not enough and does not substitute the necessary multi-hazard risk assessment. Future events are in the fewest cases a replication of past ones but, particularly for landslides, is highly probable that they might as well affect other unexpected zones. The previous indicates that the current risk scenarios might be limited.
One of the drawbacks of the current approach is that even if new and more precise maps are produced, it is not possible to change the actual regulatory maps at once since they are legally binding. Consequently, replacing the maps would involve a highly cost and complex legal process. However, new scientific results should be produced and shared with the local authorities. The risk assessment should be developed at local scale, using a comprehensive and precise scientific methodology for the detailed analysis of hazard, vulnerability and risk, applied in detail on the whole region. Nowadays, several research projects at different scales are under development to evaluate different risk components on the study zone. These projects include local mass movement modelling and regional debris flow risk assessment, among others (Blahut et al. 2010, Quan Luna et al., in prep.). The objectives of these new projects include defining new risk scenarios based on scientific methods. The results of these projects should be shared and discussed with the municipal and Mountain Consortium authorities in order to evaluate if the inclusion of new scenarios in the emergency plans is deemed necessary.
4.1.2 Monitoring and Warning: develop hazard monito ring and early warning services
This element refers to the adequacy of the monitored parameters, the strength of the scientific basis of the forecast and the capacity to generate accurate and timely warnings.
In Lombardy Region, the Regional Office for the Protection of the Environment (ARPA in Italian) is the entity in charge of issuing the warnings for geological, hydrological, storm, snow, wind, heat, forest fire and avalanche risks. The warnings are issued on a bulletin and then sent to the Civil Protection, the region, the provinces and the municipalities, following what has been established by the Regional

Integrated People Centred Early Warning System as a risk reduction strategy, Northern Italy
70
Directive law VIII/8753 2008. The same law divides Lombardy Region in eight Regional Homogeneous Zones for Hydrogeological Risks, which are potentially uniform zones with respect to the considered risks. Regarding the forecast, rainfall thresholds defined by law for each homogeneous zone serve to set the pre-alarm and alarm phases for geological and hydrological risks. The thresholds were calculated based on the information available from past mass movements triggered by rainfall. A problem related to the use of the database of past events is that, for most of the cases, it lacks a precise indication of the time when the event was triggered and this makes the identification of the time-activation correlation difficult. Another setback is the lack of direct observations while the event is in progress, or right after, complicating the precise location of the activation zone and the correct understanding of the mechanisms (IRER 2008).
In the study area, the use of instrumentation for monitoring rapid onset mass movements is scarce, limited to a few large active movements monitored by private companies and to temporary scientific research projects developed in specific areas. Regarding DGPV (Deep Seated Gravitational Slope Deformations), an InSAR campaign it is been developed in the bottom of the valley. However, DGPV represent a rather small threat compared to rapid onset movements, such as debris flows and shallow landslides, which are in fact the more common phenomena in the study area (Blahut, pers. comm.). In addition, most of the rapid onset movements are small and medium size (Malamud et al. 2004, Corporacion OSSO & La Red 2008) and can occur in large parts of the territory, making the instrumental monitoring of all the high hazard zones not practical viable or economically feasible.
The study zone, with around 20 sub-basins within an area of 450 km2, involves two of the homogeneous zones and contains four meteorological stations. Taking into account the high variation of the precipitation and the extension of the area, it seems that the amount of meteorological stations is not enough to cover the different microclimates presented in the study zone. According to IRER (2008), the best condition to assure a good correlation of rain with mass movements is the presence of at least one pluviometric station in the centre of each sub-basin. It is highly advisable to increase the instrumentation in order to consider the microclimate variations, however, given the administrative and economic context is unrealistic to expect that instrumentation at sub-basin scale will be installed. In the same sense, in order to increase the effectiveness of the forecast, it would be ideal to have high tech monitoring and warning systems in the most susceptible areas. Unfortunately, the high cost entailed makes this aim highly difficult to achieve. Additionally, correlations of past events with rainfall data show that there have been multiple particularly intense rainfall events that have not triggered any mass movements despite having higher rainfall values than some of those reported as landslide triggering events (IRER 2008). Subsequently, in order to achieve a timely and precise forecast, the information of past events and a precise risk zoning, even if important and useful, are not enough. For the previous reasons, an alternative to improve the forecasting and monitoring would be to create a network of low cost instrumentation monitored by inhabitants of the area whom should also be prepared to recognize changes in the dynamic of the territory. The network should be coordinated by local authorities and civil protection, which should be in constant communication with regional authorities and scientific bodies.
4.1.3 Dissemination and Communication: communicate risk information and Early Warnings
This element involves the quality of the warning message which should not only reach all those at risk, but also must be understandable, clear and useable for everyone.
In Italy, the mayor is responsible by law for the preparedness of the population and, at the same time, has to keep the citizens informed about the emergency strategies for possible crises. In spite of the previous, the emergency plans have never been communicated to the population in any of the municipalities of the study zone. Additionally, neither preparedness activities nor education campaigns addressed to the population at risk have ever been developed in the CM Valtellina di Tirano. The population is only “involved” during the onset of emergency situations when the evacuation order is given by the emergency personnel. The evacuation message is disseminated by the Civil Protection and Police Department using a small scale method, such as going door by door or using a loud speaker from a vehicle.
The survey applied to the population in the study zone served, among others, to evaluate the preferences of the people regarding the warning dissemination. The survey assessed the practicability and efficiency of the warning methods used until the present, as well as the levels of trust of the population towards the different authorities providing the warning (Garcia, in prep.). Results show
Chapter 4: Development of a EWS: challenges, limitations and strategies
71
medium levels of trust towards the local authorities whom, at the same time, are perceived to be moderately prepared. The preferred media to issue the warning is mainly an acoustic signal followed by television reporting.
Finally, in order to improve the communication and dissemination element, it is fundamental to involve the people at risk during the whole process, before and during the emergencies, with constant and widely available briefings. Additionally, in order to assure that the message arrives to the whole population it is important to use multiple warning methods, including long-range acoustic signals. The message should be disseminated by an institution respected and trusted by the population at risk. Finally, the methods for communication and dissemination should be locally adapted, defined taking into account not only the technical and legal constrains, but also the preferences of the population expressed on the survey.
4.1.4 Response Capability: build national and commu nity response capabilities
In order to assess the response capability it is necessary to evaluate the current state of the response plans, the application of local knowledge and capacities and the level of preparedness of the people.
The main tools for emergency management in the CM Valtellina di Tirano are dynamic and real time Municipal Emergency Plans set on a computer platform called PeTer (Protection Emergency Territory). PeTer is a tool that combines GIS (Geographical Information Systems), DSS (Decision Support Systems) and ICT (Information & Communication Technology). The tool is based on a complete chart flow of procedures and a highly detailed database. If updated and correctly applied, this tool allows a real time and highly efficient emergency management. The efficiency of the tool lies on the constant updating of the database which must be performed by the local technicians of each municipality. At the present, the tool has not been tested neither used during a real emergency in the study area. Currently, the database is in process of being updated in a combined effort of scientist and local authorities.
Regarding the response capability of the population, the survey shows that even if nearly 90% of the population knows about the existence of large events in the past, the population presents low levels of preparedness and perceived risk, lack of knowledge related to natural hazards and emergency management and a high transfer of responsibility on risk reduction from the population to the authorities (Garcia, in prep.). These combined results indicate that the population has a low response capability.
All the results confirm that it is fundamental to perform activities to increase preparedness and to improve the response capability of the population exposed. As part of the research project, small scale communication and education campaigns were developed in some schools of the study area in collaboration with several local institutions such as IREALP, Legambiente and the Mountain Consortium authorities. However, these activities are not enough, it is necessary to divulgate the emergency plan among the whole local population and to perform regular large scale campaigns developed by local authorities with the collaboration of scientific and local institutions.
4.2. Discussion and general recommendations
Currently, all the elements of EWS are present in the study zone, but they are independently developed, have no structure and are poorly linked. As a result, it is possible to say that there is not a real Early Warning System but a group of non-coordinated risk management strategies. Nevertheless several actions were identified as required to achieve to integration of the different risk management strategies into a more effective EWS (Figure 4.1).
The actual regulatory maps and legal framework applied on the study area present several constraints. There are no legal standard procedures for producing hazard, risk and vulnerability maps with a sound scientific basis. On the contrary, the maps used are derived from spatial planning maps without a proper risk analysis and, in addition, the criteria used to produce them may differ among municipalities. Consequently, it is fundamental to establish legal scientifically sound standards to produce regional risk maps at local scale. The new risk assessment should be holistic and integrated and not hazard focused as it is in the present. Multiple vulnerability analysis should be integrated with accurate hazard maps in order to obtain a more reliable and accurate risk zoning. The new risk maps, instead of been a secondary product of the spatial planning maps, should be used to improve them.

Integrated People Centred Early Warning System as a risk reduction strategy, Northern Italy
72
It is essential to put research into practice by disseminating scientific results among decision makers and local technicians, using a simple and understandable language. The experience in the study area with the emergency response tool (PeTer) shows the importance of performing follow up activities once the scientific products are handed out to local authorities. Otherwise, the utility of what in principle could be excellent scientific tools will be reduced due to the lack of continuity on its maintenance, constant updating or underestimation of its full potential. It is fundamental to share responsibilities among different actors in order to improve the current situation. Scientists must team work with local authorities for updating the emergency response tool and communicate it to the population.
The aim of the CB-EWS is not only to increase the level of preparedness and awareness of the community and decrease its vulnerability, but also to strengthen institutional collaboration, in particular local institutions, in order to assure a continuity of the efforts. The lack of interdisciplinary work and communication results in the repetition of many individual efforts. Therefore, it is important to actively look for other research projects and risk reduction efforts currently in process or undertaken in the past by other institutions. Work with local and national institutions is essential to achieve effective results either by developing new projects or supporting and collaborating with current risk reduction efforts. Furthermore, increasing the effectiveness of the elements of EWS requires changing the top-down expert focus approach by involving all stakeholders in every phase of the process, including the decision-making. This includes the incorporation of the knowledge, experience and feedback from users and those at risk. Additionally, a more effective public participation and constant interaction among all stakeholders is essential in order to build trust and understanding so the system can be credible and reliable. Involving the local community leaders could be particularly useful in order to facilitate the process of contacting the rest of the community. Massive participatory education campaigns are necessary to reach all the community and to increase the level of interaction among stakeholders. To achieve a real increase of preparedness and resilience of the population, all risk reduction strategies must be tailored to the local needs, and to the local levels of perceived risk and preparedness (Paton & Johnston 2001). To provide information is not enough, it is necessary to make sure that people understand the information given and the implications of undertaking or not a specific action.
Figure 4.1. Recommended actions to improve effectiveness of EWS.
4.3. Conclusions
In the study zone, several valuable efforts have been conducted on risk reduction. However, there is still a tendency of directing the efforts towards the attention of emergencies instead of prevention. All the EWS components are present in the study area but they display multiple shortcomings, are not integrated and have a poor linking among them. These issues indicate that an integrated EWS is not present.

Chapter 4: Development of a EWS: challenges, limitations and strategies
73
Early warning systems are not simple, linear mechanisms limited to the emission of a timely warning. In order to improve the actual state of risk management, and to develop an integrated CB-EWS in the study area it is necessary: (1) to involve all stakeholders, including the population at risk, in order to build trust and confidence through a process of public participation, mutual learning and collaboration; (2) to use local forecasting thresholds when possible; (3) to develop risk reduction strategies tailored to the local needs and taking onto account the local levels of perceived risk and preparedness; (4) to change the hazard focus towards a more integrated approach involving detailed assessments of response capabilities, vulnerability and risk; (5) to change the top down expert approach and combine efforts with local institutions while sharing responsibilities; (6) divulgate scientific studies results among the general public and government, using an accessible divulgation media and a simple language that allows the understanding of the message by all the people.
4.4. References
Blahut, J., Horton, P., Sterlacchini, S. and Jaboyedoff, M. 2010. Debris flow hazard modelling on medium scale: Valtellina di Tirano, Italy. Nat. Hazards Earth Syst. Sci. 10: 2379–2390
Corporacion Osso & La Red. 2008. DesInventar online 8.1.9-2: sistema de inventario de efectos de desastres. Cali: OSSO/La Red de Estudios Sociales en Prevención de Desastres en América Latina. Online 12/09/2010 http://online.desinventar.org
Garcia, in prep. Use of quantitative surveys for the estimation of response capacity in the designing of a Community Based Early Warning System.
IRER. 2008. Definizione delle soglie pluviometriche d’innesco di frane superficiali e colate torrentizie: accorpamento per aree omogenee. Rapporto Finale Codice IReR: 2007B023.
Malamud, B.D., Turcotte, D.L., Guzzetti, F. & Reichenbach, P. 2004. Landslide inventories and their statistical properties, In: Earth Surface Processes and Landforms 29: 687–711.
Paton, D., Johnston, D. 2001. Disasters and Communities: Vulnerability, resilience and Preparedness. Disaster. Prevention and Management, 10: 270-277
Quan Luna, B., Blahut, J., Camera, C., van Westen, C.J., Sterlacchini, S. and Apuani, T. in prep. Debris flow quantitative risk assessment and estimation of economic damages. Landslides,
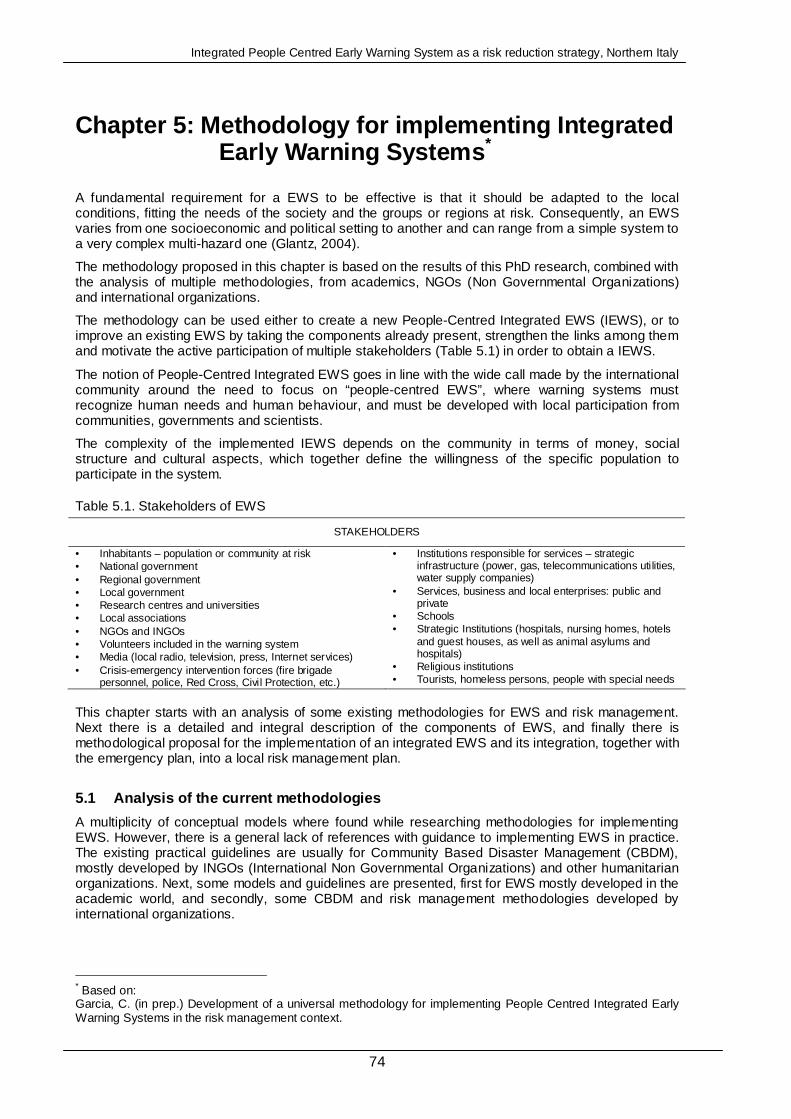
Integrated People Centred Early Warning System as a risk reduction strategy, Northern Italy
74
Chapter 5: Methodology for implementing Integrated Early Warning Systems *
A fundamental requirement for a EWS to be effective is that it should be adapted to the local conditions, fitting the needs of the society and the groups or regions at risk. Consequently, an EWS varies from one socioeconomic and political setting to another and can range from a simple system to a very complex multi-hazard one (Glantz, 2004).
The methodology proposed in this chapter is based on the results of this PhD research, combined with the analysis of multiple methodologies, from academics, NGOs (Non Governmental Organizations) and international organizations.
The methodology can be used either to create a new People-Centred Integrated EWS (IEWS), or to improve an existing EWS by taking the components already present, strengthen the links among them and motivate the active participation of multiple stakeholders (Table 5.1) in order to obtain a IEWS.
The notion of People-Centred Integrated EWS goes in line with the wide call made by the international community around the need to focus on “people-centred EWS”, where warning systems must recognize human needs and human behaviour, and must be developed with local participation from communities, governments and scientists.
The complexity of the implemented IEWS depends on the community in terms of money, social structure and cultural aspects, which together define the willingness of the specific population to participate in the system.
Table 5.1. Stakeholders of EWS
STAKEHOLDERS
• Inhabitants – population or community at risk • National government • Regional government • Local government • Research centres and universities • Local associations • NGOs and INGOs • Volunteers included in the warning system • Media (local radio, television, press, Internet services) • Crisis-emergency intervention forces (fire brigade
personnel, police, Red Cross, Civil Protection, etc.)
• Institutions responsible for services – strategic infrastructure (power, gas, telecommunications utilities, water supply companies)
• Services, business and local enterprises: public and private
• Schools • Strategic Institutions (hospitals, nursing homes, hotels
and guest houses, as well as animal asylums and hospitals)
• Religious institutions • Tourists, homeless persons, people with special needs
This chapter starts with an analysis of some existing methodologies for EWS and risk management. Next there is a detailed and integral description of the components of EWS, and finally there is methodological proposal for the implementation of an integrated EWS and its integration, together with the emergency plan, into a local risk management plan.
5.1 Analysis of the current methodologies
A multiplicity of conceptual models where found while researching methodologies for implementing EWS. However, there is a general lack of references with guidance to implementing EWS in practice. The existing practical guidelines are usually for Community Based Disaster Management (CBDM), mostly developed by INGOs (International Non Governmental Organizations) and other humanitarian organizations. Next, some models and guidelines are presented, first for EWS mostly developed in the academic world, and secondly, some CBDM and risk management methodologies developed by international organizations.
* Based on: Garcia, C. (in prep.) Development of a universal methodology for implementing People Centred Integrated Early Warning Systems in the risk management context.

Chapter 5: Methodology for implementing IEWS
75
5.1.1 EWS models
Since the early 90’s, Mileti and Sorenson (1990) recognized the lack of integration and linking among the components of warning systems as some of the greatest constrains to effective emergency warning. In order to tackle this issue, Mileti and Sorenson (1990) present one of the first models of integrated warning systems (Figure 5.1) and analyze the different components of the system.
Figure 5.1. The general components of an integrated warning system (from Mileti and Sorenson, 1990)
The UN’s People Centred Model of UNISDR – PPEW (2005), and analyzed later by Basher (2006), provides what has become the main reference framework for EWS. However, it limits to describing the components of the people centred EWS without providing guidance for its implementation (Figure 5.2). Later, an outcome of the “Third International Conference on Early Warning (EWC III)” held in Bonn, Germany in March 2006, was the “Checklist for developing early warning systems” (UNISDR – PPEW 2006) which served to complement the previous work. According to UNISDR – PPEW (2006), this checklist “aims to be a simple list of the main elements and actions that national governments or community organizations can refer to when developing or evaluating early warning systems, or simply checking that crucial procedures are in place. It is not intended to be a comprehensive design manual, but instead a practical, non-technical reference tool to ensure that the major elements of a good early warning system are in place”.
RISK KNOWLEDGE
Systematically collect data and undertake risk assessment
Are the hazards and vulnerabilities well known?
What are the patterns and trends in these factors?
Are risk maps and data widely available?
MONITORING AND WARNING
Develop hazard Monitoring and early warning services
Are the right parameters being monitored?
Is there sound scientific basis for making forecasts?
Can accurate and timely warning be generated?
WARNING DISSEMINATION AND COMMUNICATION
Communicate risk information and early warning
Do warnings reach all those at risk?
Are the risk and warnings understood?
Is the warning information clear and useable?
RESPONSE CAPABILITY
Build national and community response capabilities
Are response plans up to date and tested?
Are local capacities and knowledge made use of?
Are the people prepared and ready to react to warnings?
Figure 5.2. The four components of people-centred early warning systems (from UNISDR – PPEW, 2005)
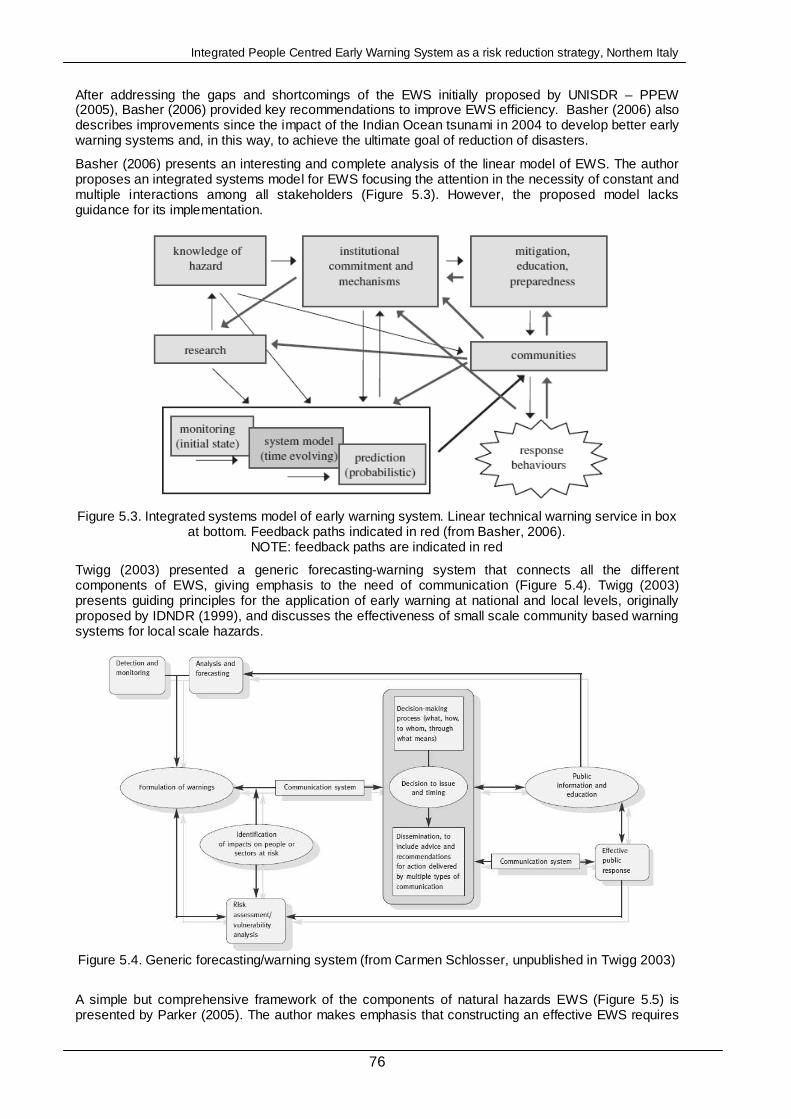
Integrated People Centred Early Warning System as a risk reduction strategy, Northern Italy
76
After addressing the gaps and shortcomings of the EWS initially proposed by UNISDR – PPEW (2005), Basher (2006) provided key recommendations to improve EWS efficiency. Basher (2006) also describes improvements since the impact of the Indian Ocean tsunami in 2004 to develop better early warning systems and, in this way, to achieve the ultimate goal of reduction of disasters.
Basher (2006) presents an interesting and complete analysis of the linear model of EWS. The author proposes an integrated systems model for EWS focusing the attention in the necessity of constant and multiple interactions among all stakeholders (Figure 5.3). However, the proposed model lacks guidance for its implementation.
Figure 5.3. Integrated systems model of early warning system. Linear technical warning service in box at bottom. Feedback paths indicated in red (from Basher, 2006).
NOTE: feedback paths are indicated in red
Twigg (2003) presented a generic forecasting-warning system that connects all the different components of EWS, giving emphasis to the need of communication (Figure 5.4). Twigg (2003) presents guiding principles for the application of early warning at national and local levels, originally proposed by IDNDR (1999), and discusses the effectiveness of small scale community based warning systems for local scale hazards.
Figure 5.4. Generic forecasting/warning system (from Carmen Schlosser, unpublished in Twigg 2003)
A simple but comprehensive framework of the components of natural hazards EWS (Figure 5.5) is presented by Parker (2005). The author makes emphasis that constructing an effective EWS requires
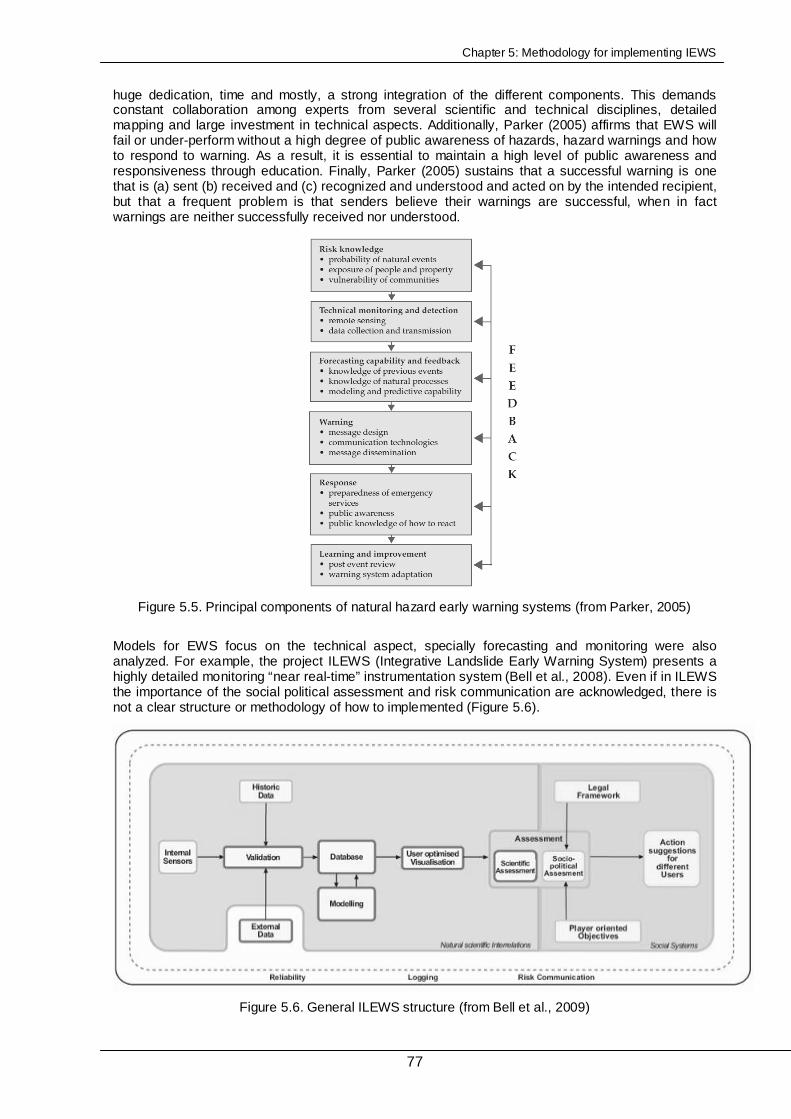
Chapter 5: Methodology for implementing IEWS
77
huge dedication, time and mostly, a strong integration of the different components. This demands constant collaboration among experts from several scientific and technical disciplines, detailed mapping and large investment in technical aspects. Additionally, Parker (2005) affirms that EWS will fail or under-perform without a high degree of public awareness of hazards, hazard warnings and how to respond to warning. As a result, it is essential to maintain a high level of public awareness and responsiveness through education. Finally, Parker (2005) sustains that a successful warning is one that is (a) sent (b) received and (c) recognized and understood and acted on by the intended recipient, but that a frequent problem is that senders believe their warnings are successful, when in fact warnings are neither successfully received nor understood.
Figure 5.5. Principal components of natural hazard early warning systems (from Parker, 2005)
Models for EWS focus on the technical aspect, specially forecasting and monitoring were also analyzed. For example, the project ILEWS (Integrative Landslide Early Warning System) presents a highly detailed monitoring “near real-time” instrumentation system (Bell et al., 2008). Even if in ILEWS the importance of the social political assessment and risk communication are acknowledged, there is not a clear structure or methodology of how to implemented (Figure 5.6).
Figure 5.6. General ILEWS structure (from Bell et al., 2009)

Integrated People Centred Early Warning System as a risk reduction strategy, Northern Italy
78
Simple, but effective, Community Based models (Figure 5.7) were taken into account including the one of Villagran et al. (2006). This model has been proved highly effective for small communities in developing countries (OAS, 2010; Bollin, 2003), where there is a low reliance on the state from part of the population. This model gives particular attention to the use of indigenous knowledge, which if incorporated in disaster management strategies can lead to a more cost-effective, sustainable, more realistic and site-specific emergency plan (Thapa et al. 2008, Barszczynska et al., 2006; Mercer et al., 2007).
Figure 5.7. Synthetic phases of early warning systems (from Villagran et al., 2006)
DKKV (2002) suggest course of actions for the improvement of the use of EWS in the context of risk reduction. DKKV (2002) identify several needs such as:
- better inter-linkages among stakeholders at several levels,
- rethink EWS strategy from supply-oriented to a demand-oriented,
- carrying out hazard and vulnerability assessment at different scales,
- thorough inventory and review/analysis of existing initiatives in disaster risk reduction at different territorial levels,
- development of indicators/criteria to evaluate the effectiveness of EWS and capacity building and educational programs.
Additionally, they provide a general course with key areas of work where the ISDR should focus their attention on efforts to achieve risk reduction.
A comprehensive guide to help local governments in organizing and building a local warning system for flood is the one of Barszczynska et al. (2006). The authors start pointing some weakness and flaws of the traditional warning systems including:
- the centralized structure for information and warning flow making it difficult to reach at−risk inhabitants with the information in time;
- the lack of solutions and tools to facilitate decision making as to when and how to warn inhabitants and other users of hazard areas;
- application of solutions which do not motivate people at risk to take action;
- lack of prior identification of hazard areas, and consequently, lack of knowledge about entities which should be warned;
- lack of an effective system for warning dissemination among inhabitants and lack of an education and information system which would make inhabitants aware that they as individuals can save themselves and their property from flooding.
After analyzing what according to them constitute an effective EWS, Barszczynska et al. (2006) provide guidelines to choose the right system taking into account the local conditions. After analyzing the different components of the EWS, they provide a general guide of how to build the system making

Chapter 5: Methodology for implementing IEWS
79
emphasis on the need of collaboration among all stakeholders as a condition of success. Even if this work contains excellent general guidelines, it fails to provide a chronological structured methodology with clear specific steps and definition of responsible actors.
One of the few practical EWS models found is the one of Leonard et al. (2008) elaborated to obtain correct and effective response to hazard warnings in New Zealand, in particular to Ruapehu volcano. The authors present a practical model for effective EWS constituted of five steps which must be based on sound and regularly updated underpinning science and tied to formal effectiveness evaluation, which is fed back into system improvements. The authors recognize that there is a substantial amount of work, beyond the generation and notification of an early warning message, required to achieve an optimum rate of correct decision-making and action based upon that warning. This work, with strong social components, requires even more effort than the hardware components of early warning systems. The five steps, connected with constant research and science advice and effectiveness evaluation are showed in Figure 5.8.
Figure 5.8. Effective Early Warning System Model (from Leonard et al., 2008)
5.1.2 Risk management methodologies
Different methodologies for disaster risk management developed by international organizations with several years of field experiences were also taken into account. Among the methodologies is the community based disaster management approach developed by Bollin (2003) based on her work with the GTZ (German Technical Cooperation - Deutsche Gesellschaft für Technische Zusammenarbeit, in German) in several communities in Central America. Bollin (2003) affirms that was in the 90’s when one of the major milestones necessary for the risk reduction was found. This milestone was the recognition of the role of the local and particularly the community level for disaster risk management and the resultant involvement of local actors. Using the practical experience gained, Bollin (2003) developed strategies and know-how for a broad mainstreaming of disaster risk management at local

Integrated People Centred Early Warning System as a risk reduction strategy, Northern Italy
80
level as part of decentralized national systems. The main findings about disaster risk management identified by Bollin include:
- the populations in the regions threatened by disaster are prepared to take an active part in disaster risk management;
- local disaster risk management capabilities are organized most effectively when responsibility is borne jointly with the municipal authorities and other representatives of the population of various social sectors;
- planning disaster risk management should be participatory and if possible coupled with measures for raising awareness or training and an initial risk analysis;
- plans for disaster risk management measures should cater for a mix of short-term (e.g. emergency plan) and long-term (e.g. land use planning) activities and a realistic assessment of the resources, capacities and competencies of the actors involved;
- community-based disaster risk management does not stand alone; it is part of the national system. The only way to ensure maximum effectiveness is for local capabilities to be well interfaced with the national system;
- difficulty of introducing planning, monitoring and evaluation instruments for sustainable ongoing development that meets quality standards;
- the successful introduction of community-based disaster risk management depends heavily on local conditions such as personal or party-political rivalry, personnel turnover or the occurrence or non-occurrence of extreme natural events;
- most decision-makers still see disaster risk management more as a cost factor than an investment; and,
- disaster risk management must also adjust to new challenges posed by climate change, which underscores the need for a sustainable institutionalization of disaster risk management.
After analyzing each of the previous findings, Bollin (2003) proposed a schematic process to develop or to introduce community based disaster risk management with a rough chronological guide (Figure 5.9).
Figure 5.9. Process of introducing community-based disaster risk management (from Bollin, 2003).
In order to obtain sustained and efficient disaster local risk management operations, Bollin (2003) identified five indispensable elements:
1. The existence of a stable disaster risk management group
2. The group must be well informed about the background and possibilities of disaster risk management
3. Support for the local group from the responsible national institutions
4. Conducted measures in risk assessment, disaster prevention and mitigation (and risk management) and disaster preparedness
Chapter 5: Methodology for implementing IEWS
81
5. Raising awareness of the population at risk and their participation in activities
The ADPC (Asian Disaster Preparedness Centre) has produced multiple materials to guide practitioners and community on disaster risk management. In particular, Abarquez and Murshed (2004) from the ADPC, made a handbook of Community Based Disaster Risk Management (CBDRM) for practitioners with a strong emphasis on the importance of develop Community Based work, focused mainly on participatory analysis. According to Abarquez and Murshed (2004), the CBDRM Process should lead to progressive improvements in public safety and community disaster resilience while contributing to equitable and sustainable community development in the long term. The handbook constitutes an excellent detailed guide for practitioners to implement CBDRM. However, even if the methodology has been successfully implemented in multiple communities, this methodology seems specifically designed for poor developing countries which lack strong instrumental monitoring, scientific risk assessment, and specially, a strong risk governance.
The proposed CBDRM Process consists of seven sequential steps which can be executed before the occurrence of a disaster, or after one has happened, to reduce future risks. The steps consist of:
1. Selecting the Community 2. Rapport Building and Understanding the Community 3. Participatory Disaster Risk Assessment (PDRA) 4. Participatory Disaster Risk Management Planning 5. Building and Training a Community Disaster Risk Management Organization (CDRMO) 6. Community-Managed Implementation 7. Participatory Monitoring and Evaluation
Another important document developed by the ADPC (2006) is the “Critical Guidelines of Community-based Disaster Risk Management”. This work complements the one of Abarquez and Murshed (2004), by providing a framework for tasks that will need to take place at the local level by local governments, NGO’s, civil society organizations and community leaders as they devise CBDRM projects and programs. The aim of this document is to provide a series of practical, simple and relevant templates that can be developed and adapted for use at specific local levels. The guidelines refer to and are built from recent parallel work on the quest for indicators to measure the effectiveness of risk reduction, including work from different international organizations such as ALNAP, SPHERE, Provention Consortium, Tearfund, among others. Additionally, the guidelines present several principles for planning and action so that if the circumstances faced by practitioners differ from those implied by indicators then they can use the principles to design their own tools for CBDRM.
The Community Emergency Response and Disaster Mitigation (CERDM) model or practice developed for WorldVison by Interiano (2010) has been successfully implemented in several developing countries. The model seeks to strengthen the community organization for participatory management of risk reduction and disaster assistance by promoting and training the community in disaster prevention and mitigation strategies. Based on the experience gained, Interiano (2010) affirms that a community that is prepared and is able to manage the impact of disasters also gains greater insight and wherewithal to address the causes of longer-term poverty and underdevelopment. The author provides a synthetic and useful guideline for the implementation of the model (Figure 5.10).
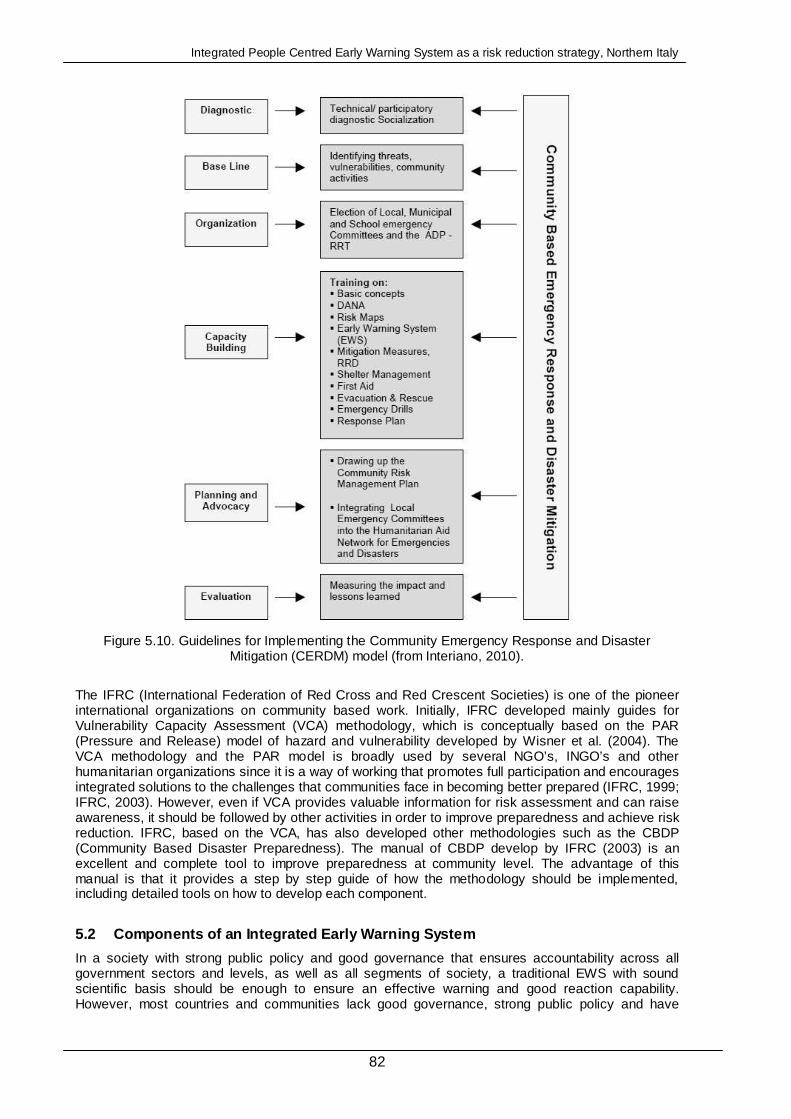
Integrated People Centred Early Warning System as a risk reduction strategy, Northern Italy
82
Figure 5.10. Guidelines for Implementing the Community Emergency Response and Disaster Mitigation (CERDM) model (from Interiano, 2010).
The IFRC (International Federation of Red Cross and Red Crescent Societies) is one of the pioneer international organizations on community based work. Initially, IFRC developed mainly guides for Vulnerability Capacity Assessment (VCA) methodology, which is conceptually based on the PAR (Pressure and Release) model of hazard and vulnerability developed by Wisner et al. (2004). The VCA methodology and the PAR model is broadly used by several NGO’s, INGO’s and other humanitarian organizations since it is a way of working that promotes full participation and encourages integrated solutions to the challenges that communities face in becoming better prepared (IFRC, 1999; IFRC, 2003). However, even if VCA provides valuable information for risk assessment and can raise awareness, it should be followed by other activities in order to improve preparedness and achieve risk reduction. IFRC, based on the VCA, has also developed other methodologies such as the CBDP (Community Based Disaster Preparedness). The manual of CBDP develop by IFRC (2003) is an excellent and complete tool to improve preparedness at community level. The advantage of this manual is that it provides a step by step guide of how the methodology should be implemented, including detailed tools on how to develop each component.
5.2 Components of an Integrated Early Warning Syste m
In a society with strong public policy and good governance that ensures accountability across all government sectors and levels, as well as all segments of society, a traditional EWS with sound scientific basis should be enough to ensure an effective warning and good reaction capability. However, most countries and communities lack good governance, strong public policy and have

Chapter 5: Methodology for implementing IEWS
83
communication problems among the different components of the society. Furthermore, even developed countries with strong economies, robust government and broad emergency management system, such as the United States of America, have proved that these characteristics are not enough to assure an effective reaction of the communities towards a timely warning, as in the case of Hurricane Katrina 2005.
There are two main types of EWS, the traditional EWS, usually technically strong and centralized, and the Community Based EWS (CB-EWS). The traditional EWS, as described by OAS (2010), generally tend to be high-tech systems that require technical expertise to observe and monitor meteorological phenomena and produce accurate forecasting. Additionally, they are expensive, complex, require active maintenance, have high maintenance costs, and are prone to theft when communities are not actively involved in their installation, maintenance and vigilance. In addition to the high cost of the systems, the lack of technical expertise is usually the largest impediment to implementing these systems.
The operation of these systems demands professionals with advanced knowledge and training, capable to develop hydro-meteorological models and to interpret the information from the processing centres outside of the capital cities. Professionals, who are generally located in the capitals, are crucial in broadcasting advisories and warnings in advance of alerts. The number of complex stages that information must pass through before arriving to the end users may make the difference between life and death. Adding to this is the lack of coordination between the data providers, the agencies responsible for delivering advisories and early warnings and the various levels of government.
On the other hand, the CB-EWS as described by OAS (2010), generally tend to be a simpler, low-cost system, characterized by the use of low-tech equipment, which is operated by community members who are responsible for observing and monitoring the meteorological phenomena as well as issuing the alerts. CB-EWS are based on the active participation of volunteers from the communities living in the at risk area where the EWS is installed. Volunteers are not only active in the response efforts, but also participate in prevention and mitigation. The community- centred approach has a number of benefits. Chief among the advantages is the fact that it is inexpensive and requires little technical expertise. Thus, is more sustainable in the context of vulnerable local communities. When local authorities and the population participate in implementing the CB-EWS, it leads to a greater sense of ownership and understanding (Ballantyne et al., 2000; Zschau and Küppers, 2003; Bollin et al., 2003; Paton, 2005; Dekens, 2007).
While a traditional EWS can work in a well structure society, unfortunately in most cases that is not the reality due to negative aspects such as corruption and communication problems which form part of the daily social life. For that reason it is important to share responsibilities and to promote the active participation of the population.
On the other side, transfer the entire responsibility for the management of the EWS to the population, like in a basic CB EWS, is not effective in all cases. This is particularly true in developed societies with high budget for instrumentation, a strong reliance of the population on the government and where governmental agencies are already in charge of monitoring and forecasting. The idea is not to transfer the whole responsibility to the population, but to promote their active participation to complement and to improve the already existent system. The only way to assure the effectiveness of the system is to combine both traditional EWS and community based (De Marchi, 2007; Dekens, 2007; Mercer et al., 2007).
After analyzing the different types and methodologies of EWS and disaster management, it was decided that the model that could adapt better to any circumstance is an Integrated People-Centred Early Warning System (IEWS). The IEWS is a result of the combination of the traditional EWS model and the CB-EWS (Table 5.2), the first one focused on the assessment, monitoring and forecasting, the second one focused on preparedness and reaction of the community.
The result of combining both models is a methodology that gives importance to every single component of the system, while involving all stakeholders such as the communities, governments and scientists.
Based on the components of the People Centred Model defined by UNISDR – PPEW (2005) and a thorough analysis of the different methodologies presented above, a detailed table of IEWS sub-components and implementation tasks was created (Table 5.3). The aim of the table is to group and organize the multiple tasks necessary for the development of a EWS, showing the complexity of that kind of systems.

Inte
gra
ted
Peo
ple
Ce
ntr
ed E
arly
Wa
rnin
g S
yste
m a
s a
risk
red
uctio
n s
tra
tegy
, No
rth
ern
Ita
ly
84
Tabl
e 5.
2. C
ompa
rison
of v
aryi
ng c
ompo
nent
s be
twee
n te
chni
cal-t
radi
tiona
l, co
mm
unity
bas
ed a
nd p
eopl
e ce
ntre
d in
tegr
ated
EW
S
TE
CH
NIC
AL-T
RAD
ITIO
NAL
EW
S
CO
MM
UN
ITY
BAS
ED
EW
S
PE
OP
LE C
EN
TRE
D IN
TEG
RA
TED
E
WS
S
cien
tific
bac
kgro
und
Usu
ally
str
ong
Usu
ally
wea
k S
tron
g R
isk
com
pone
nt fo
cus
Ha
zard
foc
used
V
uln
erab
ility
foc
us
Ho
listic
foc
us
EW
S c
ompo
nent
focu
s A
sses
smen
t, m
onito
ring
and
for
ecas
ting
Pre
pare
dnes
s an
d re
actio
n A
ll co
mpo
nen
ts
Cou
ntry
type
app
licab
ility
M
ostly
de
velo
ped
coun
trie
s w
ith s
tron
g ri
sk g
ove
rnan
ce
Mos
tly d
eve
lopi
ng c
oun
trie
s an
d po
or w
ith w
eak
ris
k go
vern
anc
e A
ny c
ount
ry ty
pe
Haz
ard
type
U
sua
lly S
ingl
e H
azar
d U
sua
lly S
ingl
e H
azar
d M
ulti
ple
Ha
zard
P
artic
ipat
ion
of p
opul
atio
n at
ris
k Lo
w
Hig
h H
igh
Sen
se o
f ow
ners
hip
from
the
popu
latio
n Lo
w
Hig
h H
igh
Mon
itorin
g pe
rson
nel
Tech
nica
l ins
titut
ion
s, p
riva
te o
r fr
om th
e go
vern
men
t V
olu
ntee
rs in
habi
tan
ts o
f th
e co
mm
unity
at r
isk
Mix
ed,
gove
rnm
ent t
echn
icia
ns a
nd
popu
latio
n D
omin
ance
E
xper
t do
min
anc
e P
opu
latio
n do
min
ance
N
o do
min
ance
C
omm
unity
invo
lvem
ent
Exc
lude
com
mun
ity p
artic
ipat
ion
duri
ng m
ost p
hase
s P
rom
ote
act
ive
com
mu
nity
par
ticip
atio
n P
rom
ote
act
ive
com
mu
nity
par
ticip
atio
n
Inst
rum
enta
tion
Cos
t H
igh
cost
and
usu
ally
hig
h te
ch a
nd c
ompl
ex
inst
rum
enta
tion
Low
cos
t and
sim
ple
low
-tec
h in
stru
me
nta
tion
Med
ium
cos
t
Tech
nica
l exp
ertis
e re
quire
men
t H
igh.
Con
sta
nt p
rese
nce
of s
peci
aliz
ed p
erso
nne
l de
ma
nds
prof
essi
ona
ls w
ith a
dva
nced
kno
wle
dge
and
tra
inin
g Lo
w.
Don
’t re
quir
e sp
ecia
lized
per
sonn
el b
ut t
rain
ed
popu
latio
n in
bas
ic p
roce
dure
s P
refe
rabl
e
Fore
cast
ing
Com
ple
x, p
rob
abili
stic
B
ased
on
trad
ition
al k
now
ledg
e to
rec
ogni
ze
prec
urso
rs,
vari
ant p
reci
sion
M
ixed
Mea
sure
men
t A
uto
ma
tic m
easu
rem
ent
Man
ual m
eas
ure
me
nt
Mix
ed
Dat
a re
quire
men
ts
Hig
h a
mo
unt o
f da
ta
Low
am
oun
t of
data
U
se o
f al
read
y e
xist
ing
data
War
ning
Dis
sem
inat
ion
Re
al t
ime
war
ning
to
cent
ral a
utho
rity
. C
omp
lex
com
mun
icat
ion
netw
ork
caus
ing
war
ning
so
met
imes
don
’t ar
rive
to t
he p
opul
atio
n
Fro
m v
olu
nte
ers
to r
est o
f th
e co
mm
unity
usi
ng in
tern
al
com
mun
icat
ion
netw
orks
M
ulti
ple
tra
nsm
itter
s an
d ch
anne
ls t
o cr
eate
red
unda
ncy
Com
mun
icat
ion
Sys
tem
C
omp
lex
netw
ork
of m
ulti
ple
co
mpo
nen
ts a
nd s
tag
es b
efor
e ar
rivi
ng to
the
pop
ulat
ion
at r
isk
Sim
ple
. In
form
atio
n ar
rive
s qu
icke
r to
the
pop
ulat
ion.
E
ffic
ient
than
ks t
o re
dund
anc
y (m
ultip
le
diss
em
ina
tion
met
hod
s)
Dev
elop
men
t cos
t H
igh
Low
D
epen
den
t M
aint
enan
ce
Com
ple
x, h
igh
cots
S
imp
le,
low
cos
t D
epen
den
t A
lert
tran
smitt
er
Go
vern
men
t, m
edia
P
opu
latio
n S
eve
ral
Firs
t Em
erge
ncy
Res
pons
e E
mer
genc
y pe
rson
nel,
regi
ona
l go
vern
men
t Lo
cal g
ove
rnm
ent,
popu
latio
n A
ll lo
cal s
take
hold
ers
Haz
ard
type
– s
cale
N
atio
nal a
nd
regi
ona
l - L
arge
eve
nts
– af
fect
ing
mu
ltip
le
terr
itori
es
Loca
l - L
ocal
eve
nts
– a
ffec
ting
loca
l com
mun
ities
S
eve
ral s
cale
s –
loca
lly a
dap
ted
Sus
tain
abili
ty
Diff
icul
t to
long
ter
m d
ue
to h
igh
cost
in in
stru
men
tatio
n an
d pe
rson
nel
Usu
ally
hig
her
due
to d
irec
t inv
olv
emen
t of
loca
l go
vern
men
t and
co
mm
unity
. M
ay d
epen
d on
in
tern
atio
nal f
inan
cial
aid
H
igh
Com
men
tarie
s U
sua
lly a
ll e
lem
ents
of
EW
S a
re p
rese
nt b
ut d
isco
nnec
ted
Par
ticip
atio
n of
mu
ltip
le s
take
hold
ers,
em
phas
is in
the
popu
latio
n. L
ow
inte
ract
ion
with
sci
entif
ic b
odie
s an
d re
gion
al g
ove
rnm
ent
All
EW
S c
ompo
nent
s ar
e pr
esen
t and
co
nnec
ted
Rel
atio
nshi
p to
pre
pare
dnes
s an
d m
itiga
tion
Usu
ally
not
re
late
d in
pra
ctic
e or
at p
olic
y le
vel.
Lim
ited
to
the
em
issi
on
of th
e w
arni
ng
Hig
h re
latio
nshi
p. P
rom
ote
pre
ven
tion
and
miti
gatio
n as
intr
insi
c pa
rts
of th
e sy
ste
m
Hig
h re
latio
nshi
p. P
rom
ote
pre
ven
tion
and
miti
gatio
n as
intr
insi
c pa
rts
of th
e sy
ste
m
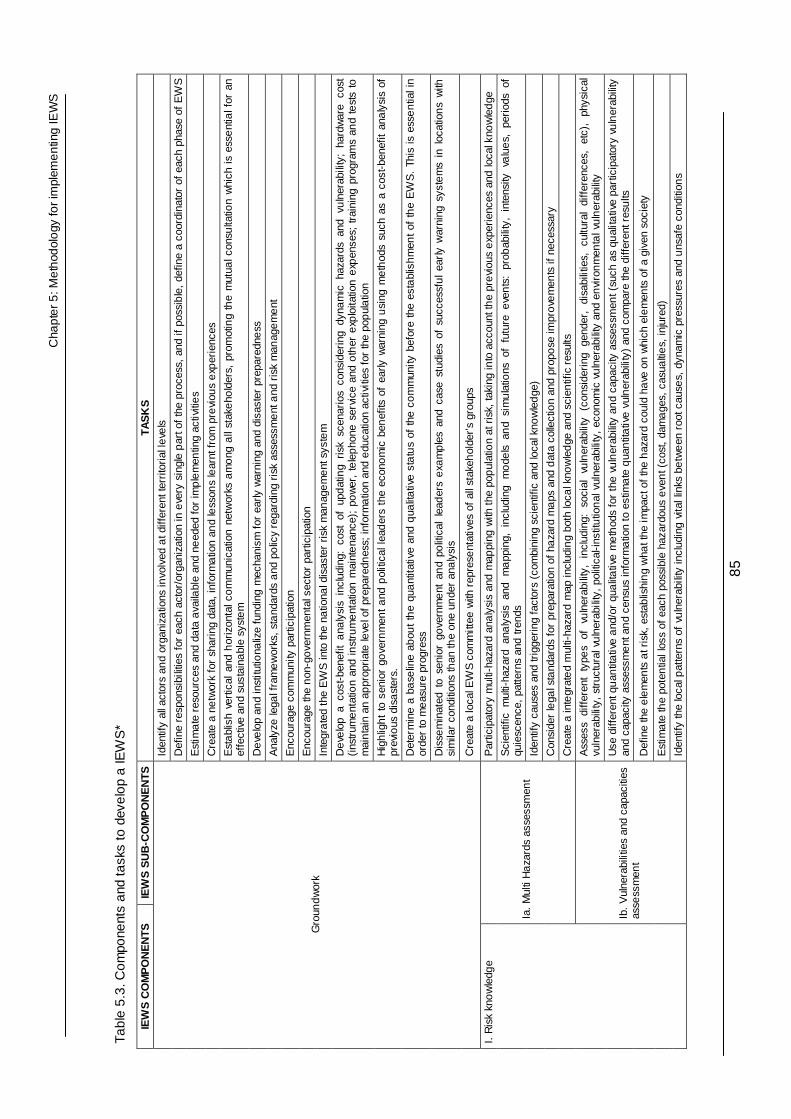
Cha
pte
r 5
: Me
thod
olo
gy fo
r im
plem
en
ting
IEW
S
85
Tabl
e 5.
3. C
ompo
nent
s an
d ta
sks
to d
evel
op a
IEW
S*
IEW
S C
OM
PO
NE
NTS
IE
WS
SU
B-C
OM
PO
NE
NTS
TA
SK
S
Iden
tify
all a
ctor
s an
d or
gani
zatio
ns in
volv
ed a
t diff
eren
t ter
rito
rial
leve
ls
Def
ine
resp
onsi
bilit
ies
for
each
act
or/o
rgan
izat
ion
in e
very
sin
gle
par
t of
the
proc
ess,
and
if p
ossi
ble
, de
fine
a co
ordi
nato
r of
eac
h ph
ase
of E
WS
Est
ima
te r
esou
rces
and
da
ta a
vaila
ble
and
need
ed f
or im
ple
men
ting
activ
itie
s
Cre
ate
a ne
twor
k fo
r sh
arin
g da
ta,
info
rma
tion
and
less
ons
lear
nt f
rom
pre
viou
s e
xper
ienc
es
Est
abl
ish
vert
ical
and
hor
izon
tal c
om
mun
icat
ion
netw
orks
am
ong
all
stak
eho
lder
s, p
rom
otin
g th
e m
utua
l con
sulta
tion
whi
ch i
s es
sent
ial f
or a
n ef
fect
ive
and
sust
aina
ble
syst
em
De
velo
p an
d in
stitu
tiona
lize
fund
ing
mec
hani
sm f
or e
arly
war
ning
and
dis
aste
r pr
epar
edne
ss
Ana
lyze
lega
l fra
me
wor
ks,
sta
ndar
ds a
nd p
olic
y re
gard
ing
risk
ass
essm
ent
and
ris
k m
anag
em
ent
Enc
oura
ge c
omm
unity
par
ticip
atio
n
Enc
oura
ge th
e n
on-g
ove
rnm
enta
l sec
tor
part
icip
atio
n
Inte
gra
ted
the
EW
S in
to th
e na
tiona
l dis
aste
r ri
sk m
anag
em
ent
sys
tem
De
velo
p a
cost
-ben
efit
ana
lysi
s in
clud
ing:
cos
t of
upd
atin
g ri
sk s
cena
rios
con
side
ring
dyn
am
ic h
azar
ds a
nd
vuln
erab
ility
; ha
rdw
are
cos
t (i
nstr
ume
ntat
ion
and
inst
rum
ent
atio
n m
aint
ena
nce)
; po
wer
, te
lep
hone
ser
vice
and
oth
er e
xplo
itatio
n e
xpen
ses;
tra
inin
g pr
ogra
ms
and
test
s to
m
ain
tain
an
appr
opri
ate
leve
l of
prep
ared
nes
s; in
form
atio
n an
d e
duca
tion
activ
ities
for
the
pop
ula
tion
Hig
hlig
ht
to s
enio
r go
vern
men
t a
nd p
oliti
cal l
ead
ers
the
econ
om
ic b
enef
its o
f ea
rly w
arni
ng u
sing
me
thod
s su
ch a
s a
cost
-ben
efit
ana
lysi
s of
pr
evio
us d
isa
ster
s.
Det
erm
ine
a ba
selin
e ab
out
the
qua
ntita
tive
and
qua
lita
tive
sta
tus
of t
he c
om
mun
ity b
efor
e th
e es
tabl
ish
men
t of
th
e E
WS
. Th
is i
s es
sen
tial i
n or
der
to m
eas
ure
prog
ress
Dis
sem
inat
ed t
o s
enio
r go
vern
me
nt a
nd
polit
ical
lea
der
s e
xam
ple
s an
d c
ase
stud
ies
of s
ucce
ssfu
l ea
rly
war
ning
sys
tem
s in
loc
atio
ns
with
si
mila
r co
nditi
ons
than
the
one
unde
r an
aly
sis
Gro
und
wor
k
Cre
ate
a lo
cal E
WS
com
mitt
ee w
ith r
epre
sent
ativ
es o
f al
l sta
keh
olde
r’s
grou
ps
Par
ticip
ator
y m
ulti-
haza
rd a
naly
sis
and
map
ping
with
the
pop
ulat
ion
at r
isk,
taki
ng in
to a
ccou
nt th
e pr
evi
ous
exp
erie
nces
and
loca
l kno
wle
dge
Sci
entif
ic m
ulti-
haza
rd a
naly
sis
and
ma
ppin
g, i
nclu
ding
m
ode
ls a
nd
sim
ula
tions
of
futu
re e
ven
ts:
prob
abili
ty,
inte
nsity
va
lue
s, p
erio
ds o
f qu
iesc
ence
, pa
ttern
s an
d tr
ends
Iden
tify
caus
es a
nd tr
igge
ring
fac
tors
(co
mbi
ning
sci
entif
ic a
nd lo
cal k
now
led
ge)
Con
side
r le
gal s
tand
ards
for
pre
para
tion
of h
aza
rd m
aps
and
dat
a co
llect
ion
and
prop
ose
impr
ove
men
ts if
nec
essa
ry
Ia.
Mul
ti H
aza
rds
asse
ssm
ent
Cre
ate
a in
tegr
ate
d m
ulti-
haza
rd m
ap in
clud
ing
both
loca
l kno
wle
dge
and
sci
entif
ic r
esul
ts
Ass
ess
diff
eren
t ty
pes
of
vuln
erab
ility
, in
clud
ing:
so
cial
vu
lner
abili
ty
(con
side
ring
ge
nder
, di
sabi
litie
s,
cultu
ral
diff
eren
ces,
et
c),
phys
ical
vu
lner
abili
ty,
stru
ctur
al v
uln
erab
ility
, po
litic
al-i
nstit
utio
nal
vul
nera
bilit
y, e
cono
mic
vu
lner
abili
ty a
nd e
nvi
ron
men
tal v
uln
erab
ility
Use
diff
eren
t qu
antit
ativ
e a
nd/o
r qu
alit
ativ
e m
eth
ods
for
the
vuln
erab
ility
an
d ca
paci
ty a
sses
smen
t (su
ch a
s qu
alita
tive
part
icip
ator
y vu
lner
abili
ty
and
capa
city
ass
essm
ent
an
d ce
nsus
info
rma
tion
to e
stim
ate
qua
ntit
ativ
e vu
lner
abili
ty)
and
com
pare
the
diff
eren
t res
ults
Def
ine
the
ele
men
ts a
t ris
k, e
stab
lishi
ng
wha
t the
im
pact
of
the
haz
ard
coul
d ha
ve o
n w
hich
ele
men
ts o
f a
give
n so
ciet
y
Est
ima
te th
e po
ten
tial l
oss
of e
ach
poss
ible
haz
ardo
us e
ven
t (co
st,
dam
age
s, c
asua
ltie
s, in
jure
d)
I. R
isk
kno
wle
dge
Ib.
Vul
nera
bilit
ies
and
capa
citie
s as
sess
men
t
Iden
tify
the
loca
l pat
tern
s of
vu
lner
abili
ty in
clud
ing
vita
l lin
ks b
etw
een
roo
t cau
ses,
dyn
amic
pre
ssur
es a
nd u
nsaf
e co
nditi
ons

Inte
gra
ted
Peo
ple
Ce
ntr
ed E
arly
Wa
rnin
g S
yste
m a
s a
risk
red
uctio
n s
tra
tegy
, No
rth
ern
Ita
ly
86
Def
ine
stan
dard
ized
me
tho
dolo
gies
for
ris
k as
sess
men
ts a
nd m
appi
ng a
t reg
ion
al,
natio
nal a
nd
loca
l le
vels
De
velo
p ri
sk s
cena
rios
(co
mbi
ne c
omm
unity
par
ticip
atio
n an
d sc
ient
ific
resu
lts f
rom
haz
ards
and
vu
lner
abili
ty a
naly
sis)
Con
side
r un
cert
ain
ty
Est
abl
ish
with
the
com
mun
ity a
nd o
ther
sta
keho
lder
s th
e ac
cept
able
an
d to
lera
ble
ris
k le
vels
Con
side
r le
gisl
atio
n a
nd s
tand
ards
po
licy
rega
rdin
g ri
sk a
sses
sme
nt
Re
vie
w a
nd u
pda
te r
isk
asse
ssm
ent e
ach
year
con
side
ring
new
haz
ard
and
vuln
erab
ility
dat
a
Ic. R
isk
asse
ssm
ent
Inte
gra
te th
e re
sults
of
risk
ass
ess
men
t int
o th
e lo
cal e
mer
genc
y pl
ans
and
war
ning
sys
tem
Est
abl
ish
a ce
ntra
l “lib
rary
” fo
r G
IS d
ata
and
all
haza
rd,
vuln
erab
ility
and
ris
k in
form
atio
n so
it c
an b
e ea
sily
ava
ilab
le t
o al
l
De
velo
p a
mai
nten
anc
e pl
an t
o ke
ep
data
cur
rent
and
upd
ate
d.
Id.
Dat
a an
d ri
sk m
aps
ava
ilabi
lity
Mad
e fr
eely
ava
ilab
le t
he in
form
atio
n co
ncer
ning
ris
ks,
usin
g st
anda
rds
for
data
exc
han
ge a
nd p
ostin
g th
e da
ta o
n pu
blic
bui
ldin
g no
tice
boar
ds
or w
ithin
pu
blic
bui
ldin
gs
(inc
ludi
ng s
choo
ls,
chur
ches
, go
vern
men
tal b
uild
ings
, co
mm
uni
ty c
entr
es,
bus
and
trai
n st
atio
ns,
etc
.)
Sel
ectio
n of
app
ropr
iate
mon
itori
ng p
aram
eter
s (a
ccor
ding
to s
peci
fic h
azar
ds)
IIa.
Dat
a co
llect
ion
Rec
eive
d da
ta r
outin
ely
pro
cess
ed a
nd m
ade
ava
ilab
le in
me
anin
gfu
l for
ma
ts in
rea
l tim
e, o
r ne
ar-r
eal t
ime
Sel
ect a
ppro
pria
te m
easu
ring
and
da
ta c
olle
ctio
n d
evi
ces
and
equi
pmen
t (hi
gh te
ch a
nd lo
w c
ost)
. C
onst
rain
ed b
y a
vaila
bilit
y of
fun
ding
S
elec
tion
of a
ppro
pria
te lo
catio
n fo
r in
stru
men
tatio
n an
d m
easu
ring
sta
tions
Sel
ect p
erso
nne
l tra
ined
in th
e us
e an
d m
ain
tena
nce
of th
e m
oni
tori
ng e
qui
pmen
t. C
onst
rain
ed
by a
vaila
bilit
y of
fun
ding
Invo
lve
the
com
mu
nity
in th
e m
onito
ring
by
defin
ing
a ne
twor
k of
vo
lunt
eers
who
obs
erve
mo
nito
ring
de
vice
s a
nd t
hen
deliv
er t
his
info
rma
tion
to
the
cris
is in
terv
ent
ion
cent
re o
r m
onito
ring
res
pons
ible
Kno
wle
dge
of le
gal a
nd t
echn
ical
con
stra
ins
for
inst
alli
ng in
stru
men
tatio
n
IIb.
Mon
itori
ng
Use
of
rem
ote
sen
sing
and
plu
vio
met
ric
netw
orks
alre
ady
in p
lace
Ela
bor
ate
fore
cast
ing
mo
dels
with
so
und
scie
ntifi
c ba
sis:
loca
l and
reg
ion
al
II.
Mon
itori
ng,
and
fore
cast
ing
IIc.
For
ecas
ting
haza
rd
evo
lutio
n D
efin
e th
resh
old
s va
lue
s w
ith s
ound
sci
entif
ic b
asis
: lo
cal a
nd r
egio
nal
Pre
pare
d a
war
nin
g m
ess
age
tem
pla
te (
clea
r, p
ositi
ve,
unde
rsta
nda
ble,
sho
rt a
nd u
sing
info
rma
l la
ngu
age)
to s
pee
d up
the
em
issi
on
me
ssag
e
Con
tent
of
the
mes
sage
: -
WH
Y:
Cur
rent
and
for
ecas
ted
situ
atio
n, p
oss
ible
con
seq
uenc
es o
f th
e e
ven
t -
WH
EN
: E
xpec
ted
time
of p
ote
ntia
lly h
arm
ful e
ven
t occ
urre
nce
and
time
of e
vacu
atio
n -
WH
ER
E:
Pla
ces/
area
s at
ris
k an
d sa
fe p
lace
s -
WH
AT:
Sug
ges
ted
actio
ns
to t
ake
Use
loca
l lan
gua
ge a
nd E
ngl
ish
(mor
e la
ngua
ges
wh
en p
ossi
ble)
to f
acili
tate
tha
t th
e m
essa
ge b
e un
ders
tood
by
the
tran
sien
t pop
ulat
ion
War
ning
ale
rts
and
mes
sage
s sh
ould
be
geo
grap
hica
lly-s
peci
fic to
ens
ure
war
ning
s ar
e ta
rget
ed o
nly
to th
ose
at r
isk
War
ning
ale
rts
and
mes
sage
s sh
ould
enc
oura
ge
com
mun
ity s
olid
arity
W
arni
ng a
lert
s an
d ri
sk c
om
mun
icat
ion
mes
sag
es s
houl
d b
e lo
cally
tai
lore
d, d
eve
lope
d o
n t
he b
asis
of
an a
sse
ssm
ent
of
info
rmat
ion
ne
eds
of
mu
ltip
le s
ocia
l gro
ups
at r
isk
(div
erse
cul
tura
l, so
cial
, ge
nder
, lin
guis
tic a
nd e
duca
tion
al b
ackg
roun
ds)
III.
War
ning
IIIa
. Mes
sage
Pre
test
cla
rity
and
rea
ch o
f th
e m
essa
ge t
o ge
t fee
dba
ck o
f ta
rget
gro
ups
on
the
suita
bilit
y of
mes
sage
s
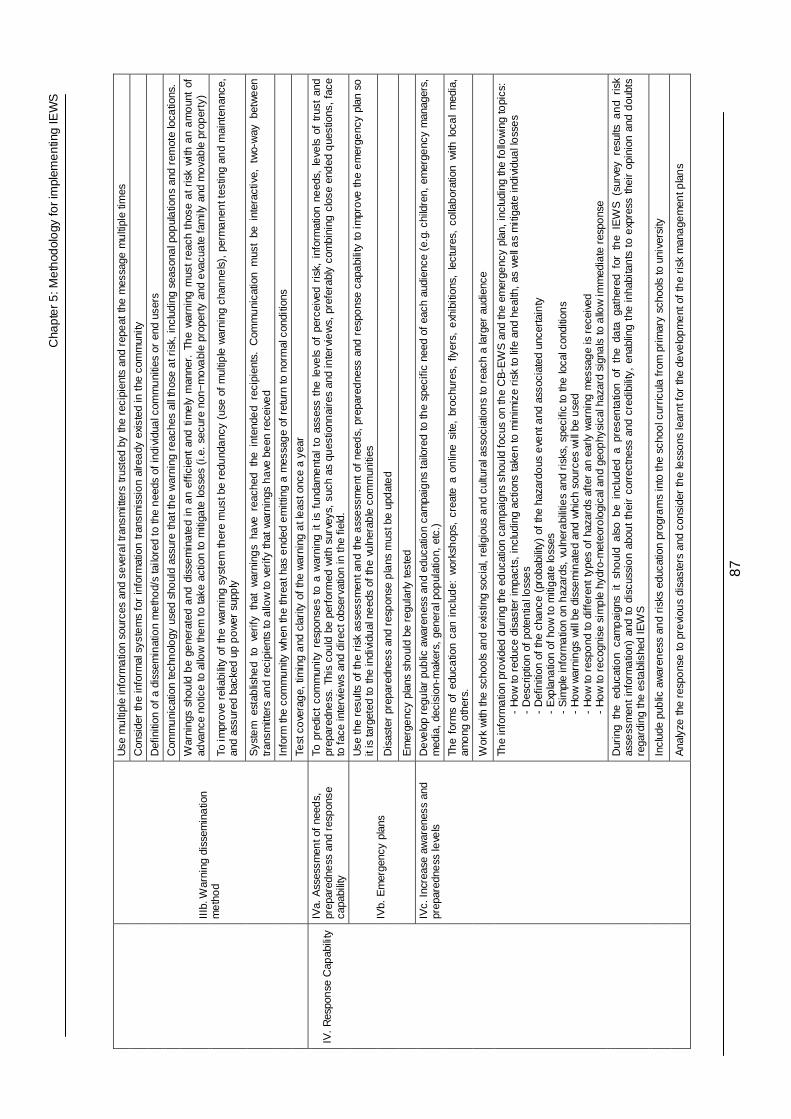
Cha
pte
r 5
: Me
thod
olo
gy fo
r im
plem
en
ting
IEW
S
87
Use
mu
ltipl
e in
form
atio
n so
urce
s an
d se
vera
l tra
nsm
itter
s tr
uste
d by
the
reci
pien
ts a
nd r
epe
at t
he m
essa
ge m
ulti
ple
times
Con
side
r th
e in
form
al s
yste
ms
for
info
rmat
ion
tran
smis
sio
n al
rea
dy e
xist
ed in
the
com
mun
ity
Def
initi
on o
f a
diss
emin
atio
n m
eth
od/
s ta
ilore
d to
the
nee
ds o
f in
divi
dua
l com
mu
nitie
s or
end
use
rs
Com
mu
nica
tion
tech
nol
ogy
use
d sh
oul
d as
sure
tha
t th
e w
arni
ng r
each
es a
ll th
ose
at r
isk,
incl
udin
g se
ason
al p
opul
atio
ns
and
rem
ote
loca
tions
.
War
ning
s sh
ould
be
gene
rate
d a
nd d
isse
min
ate
d in
an
effic
ient
and
tim
ely
man
ner.
Th
e w
arni
ng m
ust
reac
h th
ose
at
risk
with
an
am
oun
t of
ad
vanc
e no
tice
to a
llow
the
m t
o ta
ke a
ctio
n to
miti
gate
loss
es (
i.e.
secu
re n
on−
mo
vabl
e pr
oper
ty a
nd e
vacu
ate
fam
ily a
nd m
ova
ble
pro
per
ty)
To i
mpr
ove
rel
iabi
lity
of th
e w
arni
ng s
yste
m th
ere
mus
t be
redu
nda
ncy
(use
of
mul
tiple
war
ning
cha
nne
ls),
per
ma
nen
t tes
ting
and
mai
nten
ance
, an
d as
sure
d ba
cked
up
po
wer
sup
ply
Sys
tem
est
ablis
hed
to
veri
fy t
hat
war
ning
s ha
ve r
each
ed
the
inte
nde
d re
cipi
ents
. C
omm
uni
catio
n m
ust
be i
nter
activ
e, t
wo-
way
bet
we
en
tran
smitt
ers
and
reci
pien
ts to
allo
w to
ver
ify th
at w
arni
ngs
ha
ve b
een
rec
eive
d
Info
rm th
e co
mm
uni
ty w
hen
the
thre
at h
as e
nded
em
ittin
g a
mes
sag
e of
ret
urn
to n
orm
al c
ondi
tions
IIIb
. War
ning
dis
sem
ina
tion
me
tho
d
Test
co
vera
ge,
tim
ing
and
cla
rity
of
the
war
ning
at l
eas
t onc
e a
year
IVa.
Ass
essm
ent o
f ne
eds,
pr
epar
edne
ss a
nd r
esp
onse
ca
pabi
lity
To p
redi
ct c
omm
unity
res
pons
es
to a
war
ning
it
is f
unda
me
ntal
to
asse
ss t
he l
eve
ls o
f pe
rcei
ved
risk
, in
form
atio
n ne
eds,
le
vels
of
trus
t an
d pr
epar
edne
ss.
This
cou
ld b
e pe
rfor
med
with
sur
veys
, su
ch a
s qu
estio
nnai
res
and
inte
rvie
ws,
pre
fera
bly
com
bini
ng c
lose
end
ed q
uest
ions
, fa
ce
to f
ace
inte
rvie
ws
and
dire
ct o
bser
vatio
n in
the
fie
ld.
Use
the
res
ults
of
the
risk
ass
essm
ent a
nd
the
ass
ess
me
nt o
f ne
eds,
pre
pare
dne
ss a
nd r
espo
nse
capa
bilit
y to
im
pro
ve t
he
em
erge
ncy
plan
so
it
is ta
rget
ed to
the
indi
vidu
al n
eed
s of
the
vuln
erab
le c
omm
uniti
es
Dis
aste
r pr
epar
edne
ss a
nd r
esp
onse
pla
ns m
ust b
e up
dat
ed
IVb.
Em
erge
ncy
plan
s
Em
erge
ncy
plan
s sh
oul
d be
reg
ular
ly te
sted
De
velo
p re
gula
r pu
blic
aw
aren
ess
and
educ
atio
n ca
mpa
igns
tai
lore
d to
the
spec
ific
need
of
each
aud
ienc
e (e
.g. c
hild
ren,
em
erge
ncy
man
ager
s,
med
ia,
deci
sion
-mak
ers,
gen
era
l pop
ulat
ion,
etc
.)
The
form
s of
edu
catio
n ca
n in
clud
e: w
orks
hop
s, c
reat
e a
onlin
e si
te,
broc
hure
s, f
lyer
s, e
xhib
ition
s, l
ectu
res,
col
lab
orat
ion
with
loc
al
med
ia,
amo
ng o
ther
s.
Wor
k w
ith th
e sc
hoo
ls a
nd
exi
stin
g so
cial
, re
ligio
us a
nd c
ultu
ral a
ssoc
iatio
ns
to r
each
a la
rger
aud
ienc
e
The
info
rma
tion
pro
vide
d d
urin
g th
e ed
ucat
ion
cam
paig
ns s
hou
ld f
ocus
on
the
CB
-EW
S a
nd th
e em
erge
ncy
plan
, in
clud
ing
the
follo
win
g to
pics
: -
Ho
w to
red
uce
disa
ster
impa
cts,
incl
udin
g ac
tions
tak
en
to m
inim
ize
risk
to li
fe a
nd h
eal
th,
as w
ell
as
miti
gate
indi
vidu
al l
oss
es
-
Des
crip
tion
of p
oten
tial l
oss
es
- D
efin
ition
of
the
chan
ce (
prob
abili
ty)
of th
e ha
zard
ous
eve
nt a
nd a
ssoc
iate
d un
cert
ain
ty
- E
xpla
natio
n of
ho
w t
o m
itig
ate
loss
es
- S
impl
e in
form
atio
n on
haz
ards
, vu
lner
abi
litie
s an
d ri
sks,
spe
cific
to th
e lo
cal c
ondi
tion
s -
Ho
w w
arni
ngs
will
be
diss
em
inat
ed
and
whi
ch s
ourc
es w
ill b
e u
sed
- H
ow
to r
espo
nd to
diff
eren
t ty
pes
of h
azar
ds a
fter
an
early
war
ning
mes
sag
e is
rec
eive
d -
Ho
w to
rec
ogni
se s
imp
le h
ydro
-met
eoro
logi
cal a
nd
geop
hysi
cal h
azar
d si
gna
ls t
o a
llow
im
med
iate
res
pons
e
Dur
ing
the
educ
atio
n ca
mp
aign
s it
sho
uld
als
o b
e in
clud
ed a
pre
sen
tatio
n of
the
da
ta
gath
ered
for
th
e IE
WS
(su
rvey
res
ults
an
d ri
sk
asse
ssm
ent
info
rma
tion)
and
to
disc
ussi
on
abou
t th
eir
corr
ectn
ess
and
cred
ibili
ty,
enab
ling
the
inha
bita
nts
to
exp
ress
the
ir o
pini
on a
nd d
oubt
s re
gard
ing
the
esta
blis
hed
IEW
S
Incl
ude
pub
lic a
war
enes
s an
d ri
sks
educ
atio
n pr
ogra
ms
into
the
sch
ool c
urric
ula
from
pri
mar
y sc
hool
s to
uni
vers
ity
IV.
Res
pon
se C
apab
ility
IVc.
Inc
reas
e aw
aren
ess
and
prep
ared
ness
leve
ls
Ana
lyze
the
res
pons
e to
pre
viou
s di
sast
ers
and
cons
ider
the
less
ons
lear
nt f
or th
e de
velo
pm
ent
of
the
risk
man
age
men
t pla
ns
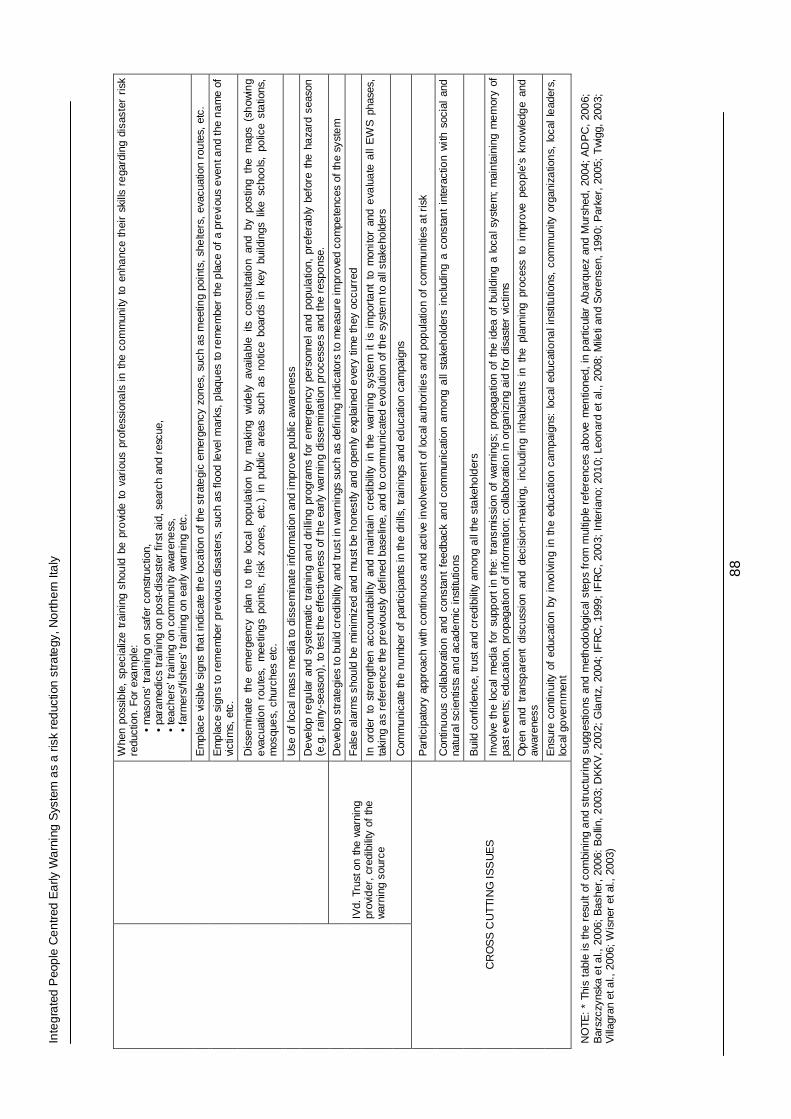
Inte
gra
ted
Peo
ple
Ce
ntr
ed E
arly
Wa
rnin
g S
yste
m a
s a
risk
red
uctio
n s
tra
tegy
, No
rth
ern
Ita
ly
88
Whe
n po
ssib
le,
spec
ializ
e tr
aini
ng s
hou
ld b
e pr
ovi
de t
o va
riou
s pr
ofes
sion
als
in
the
com
mun
ity t
o en
hanc
e th
eir
skill
s re
gard
ing
disa
ster
ris
k re
duct
ion.
For
exa
mpl
e:
• m
aso
ns’ t
rain
ing
on s
afer
con
stru
ctio
n,
• pa
ram
edic
s tr
aini
ng o
n po
st-d
isa
ster
fir
st a
id,
sear
ch a
nd r
escu
e,
• te
ache
rs’ t
rain
ing
on c
omm
unity
aw
aren
ess
, •
farm
ers/
fishe
rs’ t
rain
ing
on e
arly
war
ning
etc
.
Em
pla
ce v
isib
le s
igns
tha
t ind
icat
e th
e lo
catio
n of
the
stra
tegi
c em
erge
ncy
zone
s, s
uch
as m
eetin
g po
ints
, sh
elte
rs,
evac
uatio
n ro
ute
s, e
tc.
Em
pla
ce s
ign
s to
rem
em
ber
pre
viou
s di
sast
ers,
suc
h as
flo
od le
vel m
arks
, p
laqu
es t
o re
me
mbe
r th
e p
lace
of
a pr
evi
ous
eve
nt a
nd t
he n
am
e of
vi
ctim
s, e
tc.
Dis
sem
inat
e th
e em
erge
ncy
plan
to
the
loca
l po
pula
tion
by m
aki
ng
wid
ely
ava
ilabl
e its
con
sulta
tion
and
by p
ostin
g th
e m
aps
(sh
owin
g e
vacu
atio
n ro
ute
s, m
eetin
gs
poin
ts,
risk
zon
es,
etc.
) in
pub
lic a
reas
suc
h as
no
tice
boar
ds i
n ke
y bu
ildin
gs l
ike
sch
ools
, po
lice
sta
tions
, m
osqu
es,
chu
rche
s et
c.
Use
of
loca
l mas
s m
edi
a to
dis
sem
inat
e in
form
atio
n an
d im
pro
ve p
ubl
ic a
war
enes
s
De
velo
p re
gula
r an
d s
yste
mat
ic t
rain
ing
and
drill
ing
prog
ram
s fo
r e
mer
genc
y pe
rson
nel a
nd p
opu
latio
n, p
refe
rab
ly b
efor
e th
e h
aza
rd s
easo
n
(e.g
. ra
iny-
seas
on),
to te
st th
e ef
fect
iven
ess
of th
e ea
rly w
arni
ng
diss
em
ina
tion
proc
esse
s an
d th
e re
spo
nse.
De
velo
p st
rate
gies
to
build
cre
dibi
lity
and
trus
t in
war
ning
s su
ch a
s de
finin
g in
dica
tors
to
me
asur
e im
pro
ved
com
pete
nces
of
the
syst
em
Fal
se a
larm
s sh
ould
be
min
imiz
ed a
nd m
ust
be
hon
estly
and
ope
nly
exp
lain
ed e
very
tim
e th
ey o
ccur
red
In o
rder
to
stre
ngt
hen
acco
unta
bilit
y an
d m
aint
ain
cred
ibili
ty i
n th
e w
arni
ng s
yste
m i
t is
im
port
ant
to
mon
itor
and
eva
lua
te a
ll E
WS
pha
ses,
ta
king
as
refe
renc
e th
e pr
evi
ousl
y de
fined
bas
elin
e, a
nd t
o co
mm
uni
cate
d e
volu
tion
of th
e sy
ste
m t
o al
l sta
keho
lder
s
IVd.
Tru
st o
n th
e w
arni
ng
prov
ider
, cr
edib
ility
of
the
war
ning
sou
rce
Com
mu
nica
te th
e nu
mbe
r of
par
ticip
ants
in th
e dr
ills,
trai
ning
s an
d ed
ucat
ion
cam
paig
ns
Par
ticip
ator
y ap
proa
ch w
ith c
ontin
uou
s a
nd a
ctiv
e in
volv
emen
t of
loca
l au
thor
itie
s an
d po
pul
atio
n of
com
mu
nitie
s a
t ris
k
Con
tinu
ous
colla
bora
tion
and
cons
tan
t fe
edba
ck a
nd
com
mun
icat
ion
am
ong
all
sta
keh
olde
rs i
nclu
ding
a c
onst
ant
inte
ract
ion
with
soc
ial
and
na
tura
l sci
entis
ts a
nd
acad
em
ic in
stitu
tions
Bui
ld c
onfid
ence
, tr
ust a
nd c
redi
bilit
y am
ong
all
the
sta
keho
lder
s
Invo
lve
the
loca
l m
edia
for
sup
por
t in
the
: tr
ansm
issi
on o
f w
arni
ngs;
pro
paga
tion
of t
he i
dea
of b
uild
ing
a lo
cal s
yste
m;
mai
nta
inin
g m
em
ory
of
past
eve
nts
; ed
uca
tion,
pro
paga
tion
of in
form
atio
n; c
olla
bora
tion
in o
rgan
izin
g ai
d fo
r di
sast
er v
ictim
s
Op
en a
nd t
rans
par
ent
disc
ussi
on a
nd d
ecis
ion-
ma
king
, in
clud
ing
inha
bita
nts
in t
he p
lann
ing
proc
ess
to i
mpr
ove
peo
ple’
s kn
ow
ledg
e an
d
awar
enes
s
CR
OS
S C
UT
TIN
G I
SS
UE
S
Ens
ure
cont
inui
ty o
f ed
ucat
ion
by i
nvo
lvin
g in
th
e ed
uca
tion
cam
paig
ns:
loca
l ed
ucat
iona
l ins
titu
tions
, co
mm
unity
org
aniz
atio
ns,
loca
l le
ader
s,
loca
l go
vern
men
t
NO
TE:
* Th
is t
able
is t
he r
esu
lt of
com
bini
ng a
nd s
truc
turi
ng s
ugg
estio
ns a
nd m
eth
odo
logi
cal s
tep
s fr
om m
ultip
le r
efer
ence
s a
bove
men
tione
d, in
par
ticul
ar A
bar
quez
and
Mur
shed
, 20
04;
AD
PC
, 20
06;
B
arsz
czyn
ska
et a
l., 2
006;
Bas
her,
200
6: B
olli
n, 2
003;
DK
KV
, 20
02;
Gla
ntz,
200
4; I
FR
C,
1999
; IF
RC
, 20
03;
Int
eria
no;
201
0; L
eon
ard
et a
l., 2
008;
Mile
ti an
d S
oren
sen,
199
0; P
arke
r, 2
005;
Tw
igg,
200
3;
Vill
agra
n et
al.,
200
6; W
isne
r et
al.,
200
3)

Chapter 5: Methodology for implementing IEWS
89
5.3 Methodology for implementing People Centred Int egrated EWS
Taking into account the different components of IEWS described previously, a methodology was established for its development and implementation with the aim of generating a correct and effective response to hazard warnings. Initially, the general components of the methodology are listed, providing a general description of each sub component and explaining the importance of each one. Later, the methodology is shown in a schematic and chronological way, as a guideline showing the fundamental procedures necessary for the implementation of the methodology. The aim is to provide a comprehensive but flexible methodology applicable to all kinds of environment and circumstances according to the availability of personnel and resources. Another important aspect of the methodology is encouraging the use of existing resources while providing guidance for their integration into the system in order to make EWS much more effective for those at risk. Even if all components of the methodology are necessary, the order of implementation can be changed according to each case.
5.3.1. Detailed methodology for developing a IEWS
The following is the result of combining the different methodologies for EWS and Community Based Disaster Management described before. Each phase of the proposed methodology is associated to specific subcomponents of the Table 5.3.
I. Analyze the current state of each EWS components [Part of Groundwork - Table 5.3]
To start is fundamental to know the actual state of the risk reduction measures and of the different EWS components in the area selected for the implementation of the EWS. It is therefore recommended to:
• Locate and evaluate information and data available and define data necessities and key findings;
• analyze the state of the current risk reduction measures both structural and non-structural; • apply surveys to establish levels of perceived risk, trust, preparedness and information needs.
Since the surveys constitute the first approach to the community they are an important process for building rapport and trust with the community;
• identify major actors and organizations already involved in local disaster risk management and risk reduction initiatives;
• identify social, religious and other natural leaders in the community whom already have the confidence of the local population, such as religious leaders, school teachers and community association members;
• evaluate the willingness of the community to participate in education and risk reduction activities;
• define performance indicators for each phase of the EWS to measure the effectiveness; • determine baseline information about the quantitative and qualitative status of the community,
before the establishment of the EWS in order to measure EWS progress; • conduct meetings to identify local problems and discuss the proposed early warning system
with all stakeholders, e.g. community leaders, local authorities and the local population at risk. Meetings should enable the local population and other stakeholders to express their real needs and present their preferred solutions, as well as any doubts they may have concerning the warning system;
• propose possible members of the EWS committee.
II. Creation of a stable local early warning system committee [Part of Groundwork - Table 5.3]
Promote the coalition of committed local stakeholders which will become the driving force behind the need for CB-EWS and apply pressure on government. The committee should hold regular meetings to discuss disaster risks, vulnerabilities, and identify actions for disaster risk management. It should be composed by representatives of all relevant stakeholders: local authorities, local technicians, scientists, emergency management personnel, population at risk, small business, farmers, local industry, NGOs, local media, school teachers, etc. This committee constitutes a decision-making organ and a platform for exchanging views among people who look at the same problem from different viewpoints. The tasks of the committee include:

Integrated People Centred Early Warning System as a risk reduction strategy, Northern Italy
90
• Define the responsibilities for each phase of the EWS and, if possible, define a coordinator of each phase of the EWS
• Define an action plan for the development of each phase • Set realistic targets that stand a reasonable chance of being achieved • The scientific members should keep themselves up to date on the advances in hazards
research, in the development of early warning systems, and in new technologies and techniques that can improve the effectiveness of existing EWS
• Control the implementation of the different phases • Control the development of training activities • Make a estimated budget for the development of the different phases of the EWS • Find and allocate funding for the development of the different EWS phases. Because of the
often limited resources (human and financial), when allocating funding it is important to distinguish between what is desirable for an effective EWS and what is essential.
• Control the emplacement of signs that indicate the location of the strategic emergency zones, such as meeting points, shelters, evacuation routes, etc.
• Hold regular meetings, at least once every month, drawing up short minutes on the topics discussed and the results of the meeting.
• Collect, from each phased coordinator evidences of the effectiveness of the different components
• Ensure that each coordinator submits an annual report of the state of the EWS phase they are responsible for
• Regularly control the development of the EWS, based on the previously established baseline, according to the defined goals and performance indicators
III. Develop a participative risk assessment and ri sk reduction planning [Component I - Table 5.3]
The assessment process, which involves a deep analysis of the hazard, vulnerability and capacities of the community at risk, is composed by two main components: one component focus on pure scientific and technical assessment and a component of participatory assessment involving the population at risk and local stakeholders.
The hazard assessment demands a strong scientific basis and involves multi-hazard analysis and mapping, including models and simulations of future events, definition of probability, intensity values, periods of quiescence, patterns and trends.
Developing a participative risk assessment facilitates improvements in the scientific risk assessment by including the knowledge of the population about the hazards, their coping capacity and vulnerability. It also helps to increase the credibility of the system and trust among stakeholders, which is a key element to generate an effective reaction to the warning (Paton, 2008; Haynes et al., 2008). Additionally, a participative risk assessment improves leadership and community solidarity, enhances the levels of social motivation, builds confidence and mutual trust among different stakeholders, raises awareness of community members about risks and preparedness, encourages community level action planning and develops community capacity for risk reduction (ADPC, 2006).
The vulnerability assessment is a multi-level task that considers diverse scales of vulnerability, from root causes of vulnerability (such as a lack of good governance, or no public access to political power), to dynamic pressures (such as urbanization or population growth) that translate these causes into unsafe conditions (such as a lack of early warnings of impending hazards or unsafe dwellings). For the participatory planning of disaster risk management measures, the population identifies risk reduction measures that will reduce vulnerabilities and enhance capacities within their communities.
The participatory vulnerability assessment could be performed using the method of VCA (Vulnerability and Capacity Assessment) developed by the IRDC (IRDC, 2006).
• Some expected products of this phase include
o Standardized methodologies for risk assessments and mapping at regional, national and local levels, considering legislation and standards policy regarding risk assessment;
o an integrated multi-hazard map including both local knowledge and scientific results; o a map with risk scenarios which are the result of combining local wisdom, traditional
knowledge and scientific results; o a list of elements at risk establishing what the impact of the hazard could have on
which elements of a given society;

Chapter 5: Methodology for implementing IEWS
91
o identification of local patterns of vulnerability, including vital links between root causes, dynamic pressures and unsafe conditions;
o acceptable and tolerable risk levels defined with the community and other stakeholders:
o defined structural and non structural risk reduction measures.
It is important to develop regular reviews and updates of the risk assessment (at least once a year, or when considered necessary), including new hazard and vulnerability data and taking into account the dynamic state and continual change over time of hazards, vulnerability and capacities.
Finally, the results of risk assessment should be integrated into the local emergency plans and warning system. Additionally, a comprehensive risk management plan can be obtained by combining the local emergency plan with all the components of the EWS and the land planning and building codes.
IV. Involve the community in the monitoring and war ning [Component II and III- Table 5.3]
To start it is necessary to evaluate the state and components of the current monitoring and forecasting system. If it is considered that the existing network is not enough to effectively monitor the risk zones of the territory under assessment, then, it is necessary to consider improvements with new low cost instruments controlled by the community.
The participation of the community in the monitoring includes two aspects. First, an active participation of the population in the structural monitoring. The previous involves controlling the instrumentation and giving a warning in case the established thresholds are reached. Second, by direct visual monitoring and observation of the landscape. This involves looking for features that might indicate an impending hazard and/or an increment of vulnerability and communicate these features to the nearby community and local authorities. These features include, for example, indicators of landslide movement or instability, such as appearance of ground cracks, tilted fences, unusual elevation changes, broken water lines, etc.
For instrumental monitoring with community involvement, it is necessary to define a network of volunteers in charge of observing monitoring devices and delivering this information to the communication centre and local authorities in charge of emergency management (e.g. mayor, Civil Defense). The monitoring devices include those already present, as well as new instrumentation which can consist of low cost devices such as handmade rain gauges located at different altitudes levels in a basin.
Regarding the warning, it is necessary to analyze the existing and possible methods for early warning message dissemination and involving the community to define the most effective ways of transmitting warnings according to the local conditions. This must be done in consideration of both infrastructure-based warning systems (e.g. hardware, electronics and communications system) and simple warning dissemination methods (e.g. door to door, loudspeaker, etc.).
In order to improve reliability of the warning system there must be redundancy. Besides the dissemination method, the source of the warning is also fundamental. The relationship and level of trust between communities and the source of warnings have a strong influence on generating an effective public response to the warning.

Integrated People Centred Early Warning System as a risk reduction strategy, Northern Italy
92
V. Communication and education activities [Component IV - Table 5.3]
Organize public awareness and education campaigns tailored to the specific need of each audience (e.g. children, emergency managers, media, decision-makers, general population, etc.) and the cultural, social and economic context of the community. The goal is to promote in the population the understanding of the risk situation which increase the likelihood of response to warning, to equip local community members to undertake basic risk reduction measures, to improve the knowledge of response procedure which may prompt less confusion in emergency situations and to openly talk about uncertainties and the possibility of false alarms in order to maintain trust among stakeholders.
This education campaigns involve several components:
I Regular education-information campaigns to the general population using all available means of communication: brochures, flyers, local press, internet, radio and television.
II. Fixed permanent information about emergency procedures easily available in public sites
III. Develop educational activities for schools
IV. Develop training programs for emergency response forces
In order to measure the effectiveness of the education campaigns, it is important to evaluate the changes in awareness, preparedness and risk perception within the community before and after.
VI. Test, drills, exercises and evaluation based on a baseline [Component IV - Table 5.3]
Hold community emergency drills, involving all stakeholders, including population, emergency personnel and local authorities, are the key for ensuring sustainability of the whole system and rise community preparedness levels. By participating in emergency drills, there are higher chances that the people will follow agreed procedures in emergency situations; e.g. immediate evacuation after hearing the warning, following an agreed route and reaching an agreed destination, etc.
Feedback sessions must be held after the completion of drills, in order to identify areas for improvement.
Measure the level of enhanced awareness and knowledge of risk and safety measures within the community after the drill is important in order to establish the suitability and effectiveness of the drills and perform changes if necessary. The results must be compared with the baseline values obtained at the beginning of the EWS implementation.
It is fundamental to periodically test and assess the effectiveness of EWS in a feedback process, coordinated by the committee, with the participation of all stakeholders. However, the frequency is a balance between positive maintained readiness and awareness, and negative social disruption. This should be established by a combined decision among warning system operators, response agencies and those being warned.
Such organization of work, however, requires great openness on the part of local government with respect to inhabitants, patience during the system design phase, and hiring of experts who will help carry through the entire process.
Monitoring and improvement of warning effectiveness is performed by observing simulation drills (observing staff and public actions, public perceptions and decision-making), testing alarm systems and message audibility, researching public awareness, analyzing suitability and location of signage, monitoring the effectiveness of education initiatives, and, most importantly, evaluating how effectively people are removed from harm's way. The monitoring and evaluation of EWS phases will strengthen accountability and improve future actions.
In order to ensure that the early warning is effective in saving losses to lives and property, it is important that facilities for community action are available; e.g. safer evacuation routes, emergency evacuation facilities to take refuge, search and rescue teams. In the absence of these facilities at the community level, the early warning might not be a productive process.

Chapter 5: Methodology for implementing IEWS
93
5.3.2. Schematic guidelines to develop IEWS
A guideline to develop IEWS is composed by the following elements, schematically represented in Figure 5.11:
1. ASSESSMENT
• Form local EWS Committee (representatives of all stakeholders) • Collect data: scientific data, traditional knowledge • Analyze current state of the system and linking of the different components: risk
assessment, monitoring, forecasting, response capacity, communication system, warning dissemination method, etc. Use multiple methods such as bibliographical research, direct observation, questionnaires, interviews, etc.
• Elaborate a basic analysis of the institutional and social networks • Evaluate info and define key findings • Identification of volunteers and additional community leaders • Cost benefit analysis of implementing an EWS
2. IMPLEMENTATION
• Basic plan for action to implement EWS • Meeting with community leaders, volunteers and population
2.1 IMPROVE KNOWLEDGE AND CAPACITY
• Risk assessment (scientifically and participative): mapping and assessment of hazard, vulnerability and capacities of people and organizations.
• Define acceptable and tolerable risk levels with the population • Include assessment results in actual community emergency plan or to create community
disaster plan that involve both EWS and emergency plan (warning, preparedness, mitigation and response)
• Strengthen forecasting and monitoring components • Prioritize problems and actions according to real conditions and possibilities
2.2 INCREASE RESPONSE CAPABILITY
• Develop educational campaigns for population and other stakeholders, such as local government officials, emergency personnel, volunteers, etc.
• Train volunteers in non-structural monitoring and warning communication • Improve warning dissemination by including new communication channels to achieve
redundancy. If possible, create a local communication network to disseminate the warning message
• Disseminate and post in public places risk management information with results of risk assessment, emergency procedures including description of warning system
• Perform regular drills and emergency exercise involving emergency services and population (local government if possible) testing alarm system and message audibility
3. LEARNING AND IMPROVING
• Constant monitoring and evaluation of the different phases of the system and apply changes if necessary to improve effectiveness
• Constant feedback • Post event review and warning system adaptation if necessary

Integrated People Centred Early Warning System as a risk reduction strategy, Northern Italy
94
Figure 5.11. Guidelines for Implementing an Integrated Early Warning System (IEWS)

Chapter 5: Methodology for implementing IEWS
95
5.4 Discussion
Above all, it is important to understand that EWS are not just composed of communication systems, forecasting and monitoring networks or prepared and aware communities. They are all of the above and more. Many of the existing EWS installed and in operation do not contain all of these criteria. In most cases, the EWS contains one or two of these criteria at most and as such, this hampers the ability of communities and governments to provide timely alerts or early warnings (OAS, 2010).
Most of the methodologies developed by the scientific community neglect the importance of active community participation and focus mostly on the relevance of forecasting and warning. On the other hand, the methodologies used by the non-academic organizations tend to overlook the information produced by scientists and focus mostly in community participative activities. Both approaches fail in recognizing the importance of elements, academic information and community participation, generating a big gap that, if addressed, could largely improve the efficiency of the whole system.
While technical traditional EWS are usually only applied in developed countries due to the high cost and complicated logistics, the CB-EWS has been successfully used in developing or poor countries with weak national risk governance. Most CB-EWS have been effectively applied at local level, but due to their local nature, it is possible that these kinds of systems will not be efficient at regional level where a multiplicity of community and stakeholders complicate the strong interaction required for its success.
The participation of all stakeholders in every phase of the EWS is required for the effectiveness of the system. However this is not the only important factor. The sustainability and the successful implementation of any EWS will also depend on the formulation and execution of sound public policy and good governance that ensures accountability across all government sectors and levels, as well as all segments of society, and effective coordination (OAS, 2010).
While traditional EWS focus on hazards, CB-EWS focuses on vulnerabilities. However, the proposed IEWS considers hazards and vulnerabilities together with a view to reducing risk. As such, it should be possible to improve the communications within institutions and among stakeholders to increase the efficiency of outgoing actions and to raise public preparedness so the EWS could be effective (Villagran et al. 2006).
5.5 References
Abarquez, I. and Murshed, Z. 2004. Community-based Disaster Risk Management field practitioners’ handbook. ADPC
ADPC 2006. Critical Guidelines of Community-based Disaster Risk Management. Asian Disaster Preparedness Centre: Bangkok
Ballantyne, M., Paton, D., Johnston, D., Kozuch, M., Daly, M., 2000. “Information on volcanic and earthquake hazards: The impact on awareness and preparation”. Institute of Geological & Nuclear Sciences Limited, Lower Hutt. Science Report 2000/2.
Barszczynska M, Bogdanska−Warmuz R, Konieczny R, Madej P and Siudak M. 2006. In time for the flood. A methodological guide to local flood warning systems. Institute of Meteorology and Water Management, Poland.
Basher, R. (UN/ISDR Platform for the Promotion of Early Warning). 2006. “Global early warning systems for natural hazards: systematic and people-centred”. Philosophical Transactions of the Royal Society, A 364, 2167-2182
Bell R., Glade T., Thiebes B, Jaeger S., Krummel H., Janik M. & Holland R. 2009: Modelling and web processing of early warning.- In: Malet J.-P., Remaître A. & T. Bogaard (eds.): Landslide Processes: from geomorphological mapping to dynamic modelling. Strassbourg, France, 249-252 pp.
Bell R., Thiebes B., Glade T., Becker R., Kuhlmann H., Schauerte W., Burghaus S., Krummel H., Janik M. & Paulsen, H. 2008. The technical concept within the Integrative Landslide Early Warning System (ILEWS). In: Geotechnologien, Science Report 14
Bollin, C. 2003. Community-based disaster risk management: Experience gained in Central America. GTZ ed. Eschborn.
De Marchi, B. 2007. Not just a matter of knowledge. The Katrina debacle. In: Environmental Hazards 7: 141–149.
Dekens, J. 2007. Local Knowledge for Disaster Preparedness: A Literature Review. International Centre for Integrated Mountain Development (ICIMOD), Nepal.
DKKV (German Committee for Disaster Reduction). 2002. Early Warning and Sustainable Development. Input paper prepared in the context of WSSD and on-going work on early warning. 6 p. Online 20/09/2010 http://www.unisdr.org/ppew/info-resources/ewc2/upload/downloads/FinalEW.pdf

Integrated People Centred Early Warning System as a risk reduction strategy, Northern Italy
96
Glantz, M. 2004. Usable Science 8: Early Warning Systems: Do’s and Don’ts. Report of Workshop 20-23 October 2003. Shangai, China. 77 p.
Haynes, K., Barclay, J. and Pidgeon, N. 2008. The issue of trust and its influence on risk communication during a volcanic crisis. Bulletin of Volcanology 70: 605-621.
IDNDR Early Warning Programme: 1999. Reports on Early Warning. UN International Decade for Natural Disaster Reduction. Geneva 4 p. Online http://www.geomuseum.com/docs/reports/guiding_principles.pdf
IFRC 2003 Make that change, better be ready, Community based disaster risk management for facilitators. IFRC: Port of Spain
IFRC. 1999. VCA Vulnerability and capacity assessment an International Federation Guide. Geneva.
Interiano, M.L. 2010. Building preparedness capacity for community emergency response and disaster mitigation (CERDM). Online 12/09/2010 http://www.visionmundial.org/visionmundial_in.php?id=208
IRDC 2006. What is VCA? An introduction to vulnerability and capacity assessment. International Federation of Red Cross and Red Crescent Societies. Geneva
Leonard, G., Johnston D., Paton, D., Christianson, A., Becker, J. and Keys, H. 2008. Developing effective warning systems: Ongoing research at Ruapehu volcano, New Zealand. Journal of Volcanology and Geothermal Research, 172 (3-4): 199-215
Mercer, J., Dominey-Howes, D., Kelman, I. and Lloyd, K. 2007. The potential for combining indigenous and western knowledge in reducing vulnerability to environmental hazards in small island developing states. Environmental Hazards 7: 245-256.
Mileti, D.S. and Sorensen, J.H. 1990. Communication of Emergency Public Warnings: A social science perspective and state-of-the-art assessment. Oak Ridge Laboratory ORNL-6609
OAS (Organization of American States). 2010. Community-Centered Flood Early Warning Systems in the Central American
Parker, D. 2005. Early Warning for Natural Hazard Mitigation. Asian Disaster Management News. January - March 2005: 3-4.
Paton, D. 2008. Risk communication and natural hazard mitigation: how trust influences its effectiveness. International Journal of Global Environmental Issues. 8(1/2):2
Thapa, M., Raj Luintel, Y., Gauchan, B. and Amatya, K. 2008. Indigenous Knowledge on Disaster Mitigation: Towards Creating Complementarity between Communities’ and Scientists’ Knowledge. In: Indigenous Knowledge for Disaster Risk Reduction: Good Practices and Lessons Learned from Experiences in the Asia-Pacific Region: 30-33.
Twigg, J. 2003. Disaster risk reduction. Mitigation and preparedness in development and emergency programming. Good Practice Review No. 9, HPN, London: ODI
UNISDR – PPEW (Platform for the Promotion of Early Warning) 2005. Basics of early warning: the four elements of effective early warning systems. Online 08/09/2010 http://www.unisdr.org/ppew/whats-ew/basics-ew.htm
UNISDR – PPEW. 2006. Developing early warning systems, a checklist: third international conference on early warning (EWC III), 27-29 March 2006, Bonn, Germany
Villagran de León, J.C., Bogardi, J., Dannenmann, S. and Basher, R. 2006. Early Warning Systems in the context of Disaster Risk Management. Entwicklung & Ländlicher Raum, 2/2006, 23-25.
Wisner, B., Blaikie, P., Cannon, T. and Davis, I. 2003. At Risk: natural hazards, people’s vulnerability and disasters. 2nd ed. London: Routledge
Zschau, J. and Küppers, A. N. 2003. „Early Warning Systems for Natural Disaster Reduction”. Springer-Verlag Berlin Heidelberg New York.
Chapter 6: Community response capacity analysis
97
Chapter 6: Community response capacity analysis *
Raising awareness of risks and understanding the factors which underlie them are critical to reduce vulnerability since people can plan a proper response only by fully understanding the risks they faced. Thus, estimating how risk is perceived by a particular community may provide a basis for understanding and anticipating public responses to hazards (Slovic, 1987). This is particularly relevant for governments and emergency personnel because, in many cases, the lack of understanding about how risk is perceived by a particular community may result in well intended policies being ineffective (Slovic, 1987). Thus, understanding the way the people of a particular community think about risk is fundamental to correctly address risk reduction efforts, to improve risk communication and to define preparedness strategies, including policies and emergency plans (Slovic, 1987; Frattini and Crosta, 2006; Haynes et al., 2008a; Bird et al. 2009).
Even if the expressed opinion in a survey could be different than the actual response to the hazard, and the objective risks may differ from perceived risks (Finlay and Fell, 1997; Ruin et al., 2007), questionnaires have been broadly used for acquiring information on public knowledge and perception of natural hazards (Finlay and Fell, 1997; DeChano and Butler, 2001; Solana and Kilburn, 2003; Gregg et al. 2004; RINAMED, 2004; Barberi et al. 2008; Bird et al. 2009, among many others).
As part of the Integrated People Centred Early Warning System (IEWS), two comprehensive questionnaires were designed. The first one addressed to scientist and local authorities obtained low response and the answers, even if were not statistically processed, were considered for the analysys of the current situation. The second questionnaire, addressed to the population of the study area, was designed and implemented to assess: previous experience with hazardous events, perception of risk related to mass movements and flooding, levels of hazard awareness, level of preparedness, level of trust towards stakeholders and information needs. The purpose of developing and implementing the questionnaire was to evaluate the preparedness of the population of the study area to face a future emergency and to use the results to develop non structural risk mitigation strategies. The results of the survey, together with some recommendations, will be shared with the local government and the emergency management agencies, so they can decide if it is necessary to redesign the current risk management and emergency procedures in order to improve the response of the local population.
In this chapter a description of the techniques employed for the development and implementation of the survey is presented following the template suggested by Bird (2009). Later, the results of the questionnaire addressed to the population are presented and analyzed.
6.1. Methodology
A quantitative survey was performed using the questionnaire shown in Annex 1 in order to evaluate several aspects of the population of the study area. The questions were sequenced in a logical order to allow a smooth transition from one topic to the next (Sarantakos, 2005). The questionnaire was composed mostly by closed-ended questions, some of them measured on a five-point Likert scale which allows an average score to be calculated as well as the S.D. (Standard Deviation) At the end of the questionnaire an additional open-ended question gave the respondent the possibility to provide supplementary information (some responses to this ending question are presented in ANNEX 5). Questions requiring numerical answers such as age and number of generations were open-ended and later coded during the analysis. Several questions provide check-box predefined answers including the option “other, please specify” in order to minimize the effect of limiting participants to the pre-defined answers (Oppenheim, 1992; Bird, 2009). In some “yes/no” questions, participants were asked to provide more information in order to obtain in-depth understanding of their knowledge. At the beginning of the questionnaire, some basic instructions were provided to the respondents for the compilation. The anonymity of the questionnaire and confidentiality of the responses were also highlighted.
Regarding the survey’s content (Table 6.1), in the first part of the questionnaire some questions about demographic and geographical data were asked, including municipality of residence and information
* Based on: Garcia, in prep. Use of quantitative surveys for the estimation of response capacity in the designing of a Community Based Early Warning System.
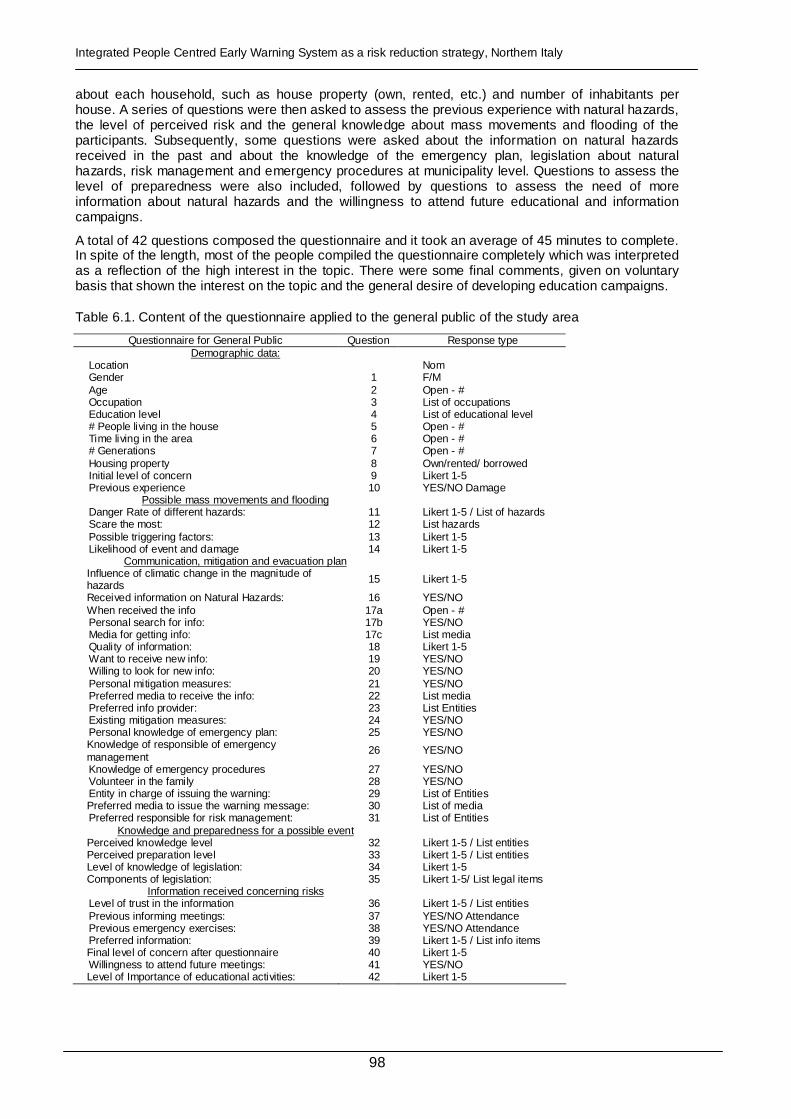
Integrated People Centred Early Warning System as a risk reduction strategy, Northern Italy
98
about each household, such as house property (own, rented, etc.) and number of inhabitants per house. A series of questions were then asked to assess the previous experience with natural hazards, the level of perceived risk and the general knowledge about mass movements and flooding of the participants. Subsequently, some questions were asked about the information on natural hazards received in the past and about the knowledge of the emergency plan, legislation about natural hazards, risk management and emergency procedures at municipality level. Questions to assess the level of preparedness were also included, followed by questions to assess the need of more information about natural hazards and the willingness to attend future educational and information campaigns.
A total of 42 questions composed the questionnaire and it took an average of 45 minutes to complete. In spite of the length, most of the people compiled the questionnaire completely which was interpreted as a reflection of the high interest in the topic. There were some final comments, given on voluntary basis that shown the interest on the topic and the general desire of developing education campaigns.
Table 6.1. Content of the questionnaire applied to the general public of the study area
Questionnaire for General Public Question Response type Demographic data:
Location Nom Gender 1 F/M Age 2 Open - # Occupation 3 List of occupations Education level 4 List of educational level # People living in the house 5 Open - # Time living in the area 6 Open - # # Generations 7 Open - # Housing property 8 Own/rented/ borrowed Initial level of concern 9 Likert 1-5 Previous experience 10 YES/NO Damage
Possible mass movements and flooding Danger Rate of different hazards: 11 Likert 1-5 / List of hazards Scare the most: 12 List hazards Possible triggering factors: 13 Likert 1-5 Likelihood of event and damage 14 Likert 1-5
Communication, mitigation and evacuation plan Influence of climatic change in the magnitude of hazards
15 Likert 1-5
Received information on Natural Hazards: 16 YES/NO When received the info 17a Open - # Personal search for info: 17b YES/NO Media for getting info: 17c List media Quality of information: 18 Likert 1-5 Want to receive new info: 19 YES/NO Willing to look for new info: 20 YES/NO Personal mitigation measures: 21 YES/NO Preferred media to receive the info: 22 List media Preferred info provider: 23 List Entities Existing mitigation measures: 24 YES/NO Personal knowledge of emergency plan: 25 YES/NO Knowledge of responsible of emergency management
26 YES/NO
Knowledge of emergency procedures 27 YES/NO Volunteer in the family 28 YES/NO Entity in charge of issuing the warning: 29 List of Entities Preferred media to issue the warning message: 30 List of media Preferred responsible for risk management: 31 List of Entities
Knowledge and preparedness for a possible event Perceived knowledge level 32 Likert 1-5 / List entities Perceived preparation level 33 Likert 1-5 / List entities Level of knowledge of legislation: 34 Likert 1-5 Components of legislation: 35 Likert 1-5/ List legal items
Information received concerning risks Level of trust in the information 36 Likert 1-5 / List entities Previous informing meetings: 37 YES/NO Attendance Previous emergency exercises: 38 YES/NO Attendance Preferred information: 39 Likert 1-5 / List info items Final level of concern after questionnaire 40 Likert 1-5 Willingness to attend future meetings: 41 YES/NO Level of Importance of educational activities: 42 Likert 1-5

Chapter 6: Community response capacity analysis
99
6.2. Design
The questionnaire’s design** was based on several questionnaires from various authors including: Finlay and Fell (1997), DeChano and Butler (2001), Solana and Kilburn (2003), RINAMED (2004), Wright et al. (2006), Interprovinciaal Overleg (2006), Practical Action (2008), Barberi et al. (2008), Cittadinanzattiva and Dipartimento della Protezione Civile (2008), Coast Surf Shire (2008) and RAMSOIL (2009).
Initially written in English, the questionnaire was later translated into Italian by Italian academic colleagues. Once the first draft of the questionnaire was ready, the Italian version was discussed with local authorities from the Comunità Montana di Tirano, as well as with some environmental and educational local leaders and external advisors. Based on their comments and views, minor adjustments were made. The questionnaire was then distributed among a pilot group in order to evaluate the clarity and suitability of each question.
6.3. Distribution
Except for three questionnaires compiled face to face by main stakeholders (school teacher, environmental leader and local geological technician), the questionnaire was mostly distributed using different self administered modes, meaning that each participant complete the questionnaire at their own leisure. Firstly, a large proportion was distributed at the high school of Tirano during the last week of February 2009. This location was selected because is the only high school of the study area and therefore it host students of all the 12 municipalities analyzed. The distribution consisted in delivering two questionnaires to all the students of the higher classes. One of the questionnaires was meant to be compiled on the class, so 45 minutes were allowed for the compilation in the presence of the class teacher. The students were asked to take the second questionnaire to their houses so it could be compiled by an adult family member, or a friend, and then brought back to the school after one week. Secondly, in order to reach different age groups, some questionnaires were distributed to the members of several associations and social groups during the period of March 2009 to June 2009. Thirdly, the questionnaire was posted on the webpage of the Comunità Montana Valtellina di Tirano during a period of 6 months, between September 2009 and February 2010. Finally, in order to find a balance on the age distribution of the compiled questionnaires and increase the number of adults’ responses, the questionnaire was distributed to the students of the primary schools of Aprica, Teglio and Bianzone who were asked to deliver the questionnaires to their parents for completion at home before collection one week later at the school.
A total of 648 questionnaires were compiled by people living in the study areas. Some questionnaires were compiled by people living outside the study area; these questionnaires were not included in the analysis and were taken apart as control group. The rate response was really different in each group of respondents which include students, student’s relatives and non school related adults. At the schools, even if the compilation was on voluntary basis, most of the students compiled the questionnaire for a total response rate of 91%. The response rate of the questionnaires distributed for the relatives of the high school and primary school students was 37%, while the response rate in the different social groups and associations, i.e. non school related adults, was 42%. The questionnaire posted on the website obtained no response.
6.4. Results
Questionnaires were office coded and the software SPSS® 16.0 was used for data entry and analysis. The software Microsoft Excel® was used to process the answers of the final open ended question.
6.4.1 Demographic data and other respondents data
Even if the students were asked to bring the questionnaire to a relative of their own sex, many adult participants were female, factor that affected the total gender distribution of the participants resulting in 57.7% female and 42.3% male participation. The results differ to the distribution of the total population in 6%, even if the general population also shows a prevalence of the female gender with 51.7% female and 48.3% male.
** The questionnaire was designed in collaboration with the Mountain Risks European Project colleague Marjory Angignard from the Institute for Spatial Planning, Technical University of Dortmund, Germany.

Integrated People Centred Early Warning System as a risk reduction strategy, Northern Italy
100
Regarding the age distribution, it was intended to obtain a distribution similar to the one of the general population by distributing the questionnaires to different age groups. However, due to the different response rate of the age groups, the obtained age distribution (Figure 6.1) shows a clear predominance of the group of 15-19 years, i.e. the school students. However the differences in the age distribution, it is considered that the large sample size balances this issue and therefore the surveyed population is a reasonably representative sample.
4,619,8
41,761,1
45,45,2
8,313,9
- 10,0 20,0 30,0 40,0 50,0 60,0 70,0
%
up to 14 years
15 - 19 years
20-64 years
65 years and older
Distribution of the surveyed population versus the total population
% Pop. Questionnaire % Pop CM Valtellina di Tirano (Census 2001)
Figure 6.1. Distribution per age group of the surveyed population versus total population of the study area
The age and gender distribution of the participants according to each municipality is showed in Table 6.2. In Figure 6.2 it is possible to observe that the distribution of the participants regarding the municipality of origin is really similar that the distribution of the total population, although in municipalities of Vervio and Tovo di Sant’Agata the number was really low.
Table 6.2. Age and gender of questionnaire respondents
up to 14 years
15 - 19 years 20 - 34 years 35 - 49 years 50 - 64 years
65 years and older Municipality
M F M F M F M F M F M F
TOTAL
Aprica 5 6 1 4 0 0 3 7 0 0 0 0 26 Bianzone 1 1 2 2 1 3 8 7 4 2 0 1 32 Grosio 2 5 9 25 1 0 6 11 0 2 0 0 61 Grosotto 0 1 7 8 0 0 1 5 3 0 1 0 26 Lovero 2 0 4 4 0 0 0 5 1 0 0 0 16 Mazzo di Valtellina 1 1 11 11 0 0 2 4 2 0 0 0 32 Sernio 1 0 5 6 0 0 2 2 2 1 0 0 19 Teglio 0 2 9 6 0 4 23 27 7 5 3 8 94 Tirano 8 15 68 69 2 4 15 45 15 11 3 2 257 Tovo di Sant'Agata 0 0 2 5 0 0 0 1 2 1 0 0 11 Vervio 0 0 1 5 0 0 0 2 0 0 0 0 8 Villa di Tirano 1 2 13 17 1 0 3 5 6 6 4 8 66
21 33 132 162 5 11 63 121 42 28 11 19 TOTAL
54 294 16 184 70 30 648

Chapter 6: Community response capacity analysis
101
Aprica
Bianzone
Grosio
Grosotto
Lovero
Mazzo di Valtellina
Sernio
Teglio
Tirano
Tovo di Sant'Agata
Vervio
Villa di Tirano
Distribution of the Population CM Valtellina di Tir ano
010002000300040005000
Participants distribution by Municipality
0 20 40 60 80 100 120 140 160
M F
Figure 6.2. Distribution per municipality of the surveyed population versus total population
Regarding the occupation, 54.9% of the respondents were students, follow by 31.6% of workers (in agriculture, industry and services), 7.3% of housewife/househusband and just 0.2% of unemployed. The results for the highest level of education completed has been influenced by the majority of school students, with a 65.9% with completed Junior High School, follow by 23.6% with High School degree and 6.8% with an university degree. Most of the surveyed population has been living in the community for 3 or more generations (59.6%), and a minority has lived 1 (13.7%) or 2 (17.3%) generations. In regard of the property, most of the properties are owned by the respondent or his/her family, while 11.3% rent the house and a minority of 1.2% use the house for free (Table 6.3).
Table 6.3. Characteristics of the questionnaire respondents
Occupation
Agriculture Industry Student Unemployed Housewife/househusband Services
21 (3.2%) 33 (5.1%) 356 (54.9%) 1 (0.2%) 47 (7.3%) 151 (23.3%)
Highest level of education completed
Primary School Junior High
School High School University Degree
24 (3.7%) 427 (65.9%) 153 (23.6%) 44 (6.8%)
Number of generations lived in the community
1 2 3 > 3 Missing data
91 (14%) 89 (13.7%) 112 (17.3%) 274 (42.3%) 82 (12.7%)
State of property
Owned Rented Free use Missing data
559 (86.3%) 73 (11.3%) 12 (1.2%) 4 (0.6%)
6.4.2 Hazards previous experiences
In order to evaluate the previous experiences with disasters, people was asked if they or their families have ever have direct experience with disasters related to natural hazards, specifying one of four possibilities relating the experience and the consequences. Results presented in Table 6.4 show that most respondents have experienced a disastrous event without been affected (n=270, %=41.7) or they know that there have been some disasters before even if they have not personally experienced

Integrated People Centred Early Warning System as a risk reduction strategy, Northern Italy
102
(n=253, %=39.0). A minority has either been directly affected by a previous event (n=45, %=6.9) or do not know about a previous disastrous event happening in the community (n=75, %=11.6). The previous indicates that 88.4% of the respondents either have experienced or know about past disastrous events. When asked to specify what was the previous event, most answered that it was the flooding of 1987 (alluvione del 1987, in Italian), followed by the Val Pola landslide (occurred in 1987 in the same period than the previous event) and the landslide of Tresenda (occurred in 1983).
Table 6.4. Previous experience with disasters related to natural hazards
Previous Experience n %
Yes, but I didn’t suffer any damage or injury 270 41.7
Yes and I was directly affected by it 45 6.9
No, but I know there had been some before in this particular municipality 253 39.0
No, and I haven’t heard about any in this particular municipality 75 11.6
Note: Missing data: n=5, %=0.8; S.D.=1.13
6.4.3 Perception of the risks
In order to evaluate the perception of mass movements and flooding risks several aspects were considered including: i) levels of worry or concern about natural hazards, aspect that was measured once at the beginning of the questionnaire and a second time at the end of the survey in order to evaluate the impact of the application of the questionnaire on the awareness; ii) perceived danger of different hazards; iii) hazard of most concern; iv) estimation of the likelihood of a set of risky events occurring. i) The levels of concern were rated with the question “How concern do you feel when you think about natural hazards in your community?” using a 5 point Likert-scale from 1 (not at all) to 5 (completely). Results show a medium level of concern (Table 6.5), with a mean of 2,46 at the beginning of the questionnaire and a mean of 2,70 at the end. This increment of 5% in the level of concern might show that the fact of compiling the questionnaire induces the people to think about natural hazards and this by itself could temporary increment the level of concern and awareness.
Table 6.5. Levels of concern about natural hazards
Level of Concern Initial Final
Not at all (1) 72 42
A little bit (2) 275 219
Fairly (3) 239 282
A lot (4) 42 69
Completely (5) 14 21
Missing data 6 15
Mean 2.46 2.70
SD 0.86 0.87
0% 10% 20% 30% 40% 50% 60% 70% 80% 90% 100%
Final
Initial
Level of Concern
Not at all (1) A little bit (2) Fairly (3)
A lot (4) Completely (5) Missing data
ii) A list of eight different hazards was provided in order to rate how dangerous each hazard is considered using a Likert scale from 1 to 5, being 1 the lowest danger (without consequences) and 5 the highest (extremely dangerous). Three different mass movements were included in the list (landslide, debris flow and rock falls) with a short definition for the first two. Snow avalanches, floods, forest fires and earthquakes were also included on the list, together with the option “other”.
Results in Table 6.6 and Figure 6.3 show that the hazards rated as most dangerous are forest fires (Mean = 3.32), followed by landslides (Mean = 3.00) and then floods (Mean = 2.97).
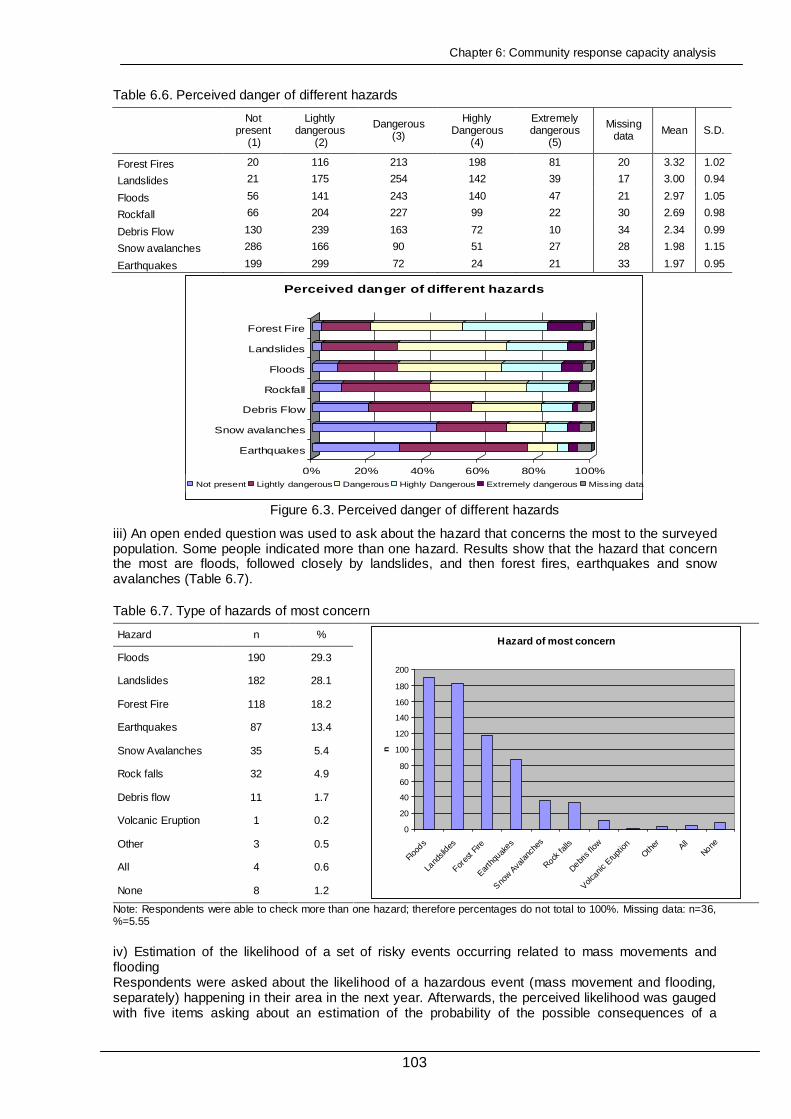
Chapter 6: Community response capacity analysis
103
Table 6.6. Perceived danger of different hazards
Not
present (1)
Lightly dangerous
(2)
Dangerous (3)
Highly Dangerous
(4)
Extremely dangerous
(5)
Missing data Mean S.D.
Forest Fires 20 116 213 198 81 20 3.32 1.02
Landslides 21 175 254 142 39 17 3.00 0.94
Floods 56 141 243 140 47 21 2.97 1.05
Rockfall 66 204 227 99 22 30 2.69 0.98
Debris Flow 130 239 163 72 10 34 2.34 0.99
Snow avalanches 286 166 90 51 27 28 1.98 1.15
Earthquakes 199 299 72 24 21 33 1.97 0.95
0% 20% 40% 60% 80% 100%
Earthquakes
Snow avalanches
Debris Flow
Rockfall
Floods
Landslides
Forest Fire
Perceived danger of different hazards
Not present Lightly dangerous Dangerous Highly Dangerous Extremely dangerous Missing data
Figure 6.3. Perceived danger of different hazards
iii) An open ended question was used to ask about the hazard that concerns the most to the surveyed population. Some people indicated more than one hazard. Results show that the hazard that concern the most are floods, followed closely by landslides, and then forest fires, earthquakes and snow avalanches (Table 6.7).
Table 6.7. Type of hazards of most concern
Hazard n %
Floods 190 29.3
Landslides 182 28.1
Forest Fire 118 18.2
Earthquakes 87 13.4
Snow Avalanches 35 5.4
Rock falls 32 4.9
Debris flow 11 1.7
Volcanic Eruption 1 0.2
Other 3 0.5
All 4 0.6
None 8 1.2
Hazard of most concern
0
20
40
60
80
100
120
140
160
180
200
Flood
s
Land
slides
Fores
t Fire
Earth
quak
es
Snow A
valanc
hes
Rock fa
lls
Debris f
low
Volcan
ic Erup
tion
Other All
None
n
Note: Respondents were able to check more than one hazard; therefore percentages do not total to 100%. Missing data: n=36, %=5.55
iv) Estimation of the likelihood of a set of risky events occurring related to mass movements and flooding Respondents were asked about the likelihood of a hazardous event (mass movement and flooding, separately) happening in their area in the next year. Afterwards, the perceived likelihood was gauged with five items asking about an estimation of the probability of the possible consequences of a
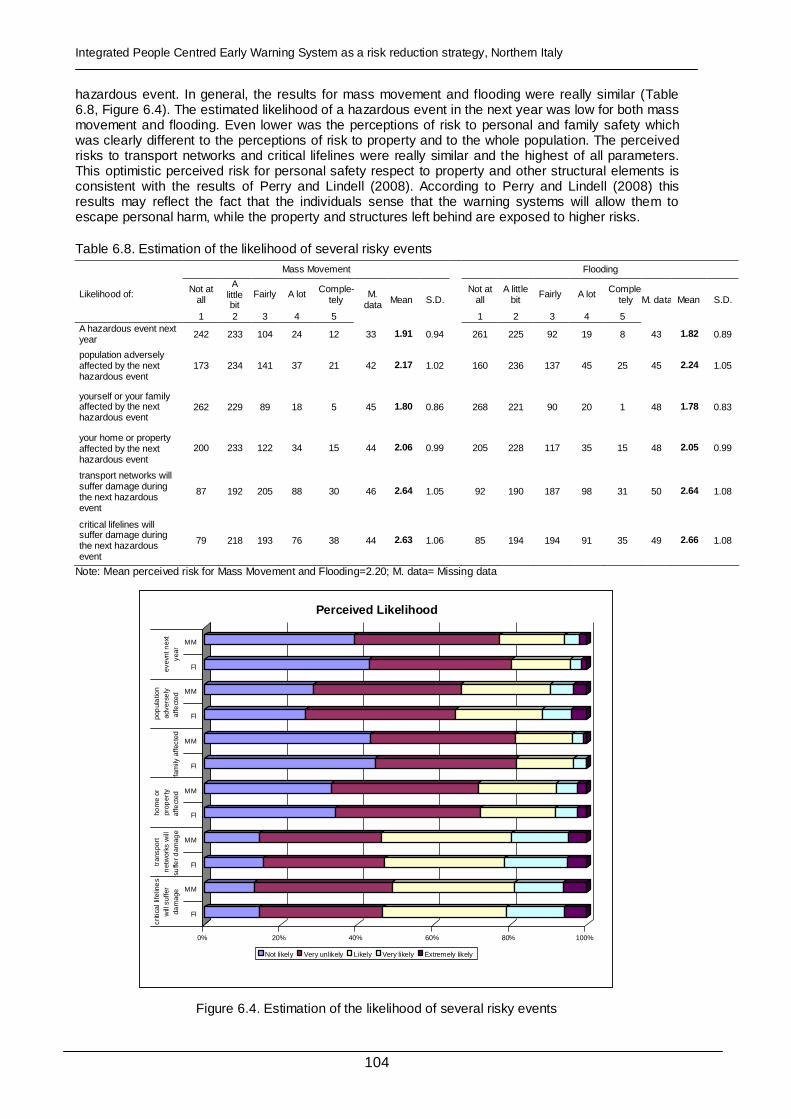
Integrated People Centred Early Warning System as a risk reduction strategy, Northern Italy
104
hazardous event. In general, the results for mass movement and flooding were really similar (Table 6.8, Figure 6.4). The estimated likelihood of a hazardous event in the next year was low for both mass movement and flooding. Even lower was the perceptions of risk to personal and family safety which was clearly different to the perceptions of risk to property and to the whole population. The perceived risks to transport networks and critical lifelines were really similar and the highest of all parameters. This optimistic perceived risk for personal safety respect to property and other structural elements is consistent with the results of Perry and Lindell (2008). According to Perry and Lindell (2008) this results may reflect the fact that the individuals sense that the warning systems will allow them to escape personal harm, while the property and structures left behind are exposed to higher risks.
Table 6.8. Estimation of the likelihood of several risky events
Mass Movement Flooding
Likelihood of: Not at all
A little bit
Fairly A lot Comple-tely
Not at all
A little bit
Fairly A lot Completely
1 2 3 4 5
M. data Mean S.D.
1 2 3 4 5
M. data Mean S.D.
A hazardous event next year 242 233 104 24 12 33 1.91 0.94 261 225 92 19 8 43 1.82 0.89
population adversely affected by the next hazardous event
173 234 141 37 21 42 2.17 1.02 160 236 137 45 25 45 2.24 1.05
yourself or your family affected by the next hazardous event
262 229 89 18 5 45 1.80 0.86 268 221 90 20 1 48 1.78 0.83
your home or property affected by the next hazardous event
200 233 122 34 15 44 2.06 0.99 205 228 117 35 15 48 2.05 0.99
transport networks will suffer damage during the next hazardous event
87 192 205 88 30 46 2.64 1.05 92 190 187 98 31 50 2.64 1.08
critical lifelines will suffer damage during the next hazardous event
79 218 193 76 38 44 2.63 1.06 85 194 194 91 35 49 2.66 1.08
Note: Mean perceived risk for Mass Movement and Flooding=2.20; M. data= Missing data
0% 20% 40% 60% 80% 100%
MM
Fl
MM
Fl
MM
Fl
MM
Fl
MM
Fl
MM
Fl
evev
nt n
ext
year
pop
ula
tion
adve
rse
lyaf
fect
ed
fam
ily a
ffect
ed
hom
e or
prop
erty
affe
cted
tran
spor
tn
etw
orks
will
suffe
r dam
age
criti
cal l
ifelin
es
will
suf
fer
dam
age
Perceived Likelihood
Not likely Very unlikely Likely Very likely Extremely likely
Figure 6.4. Estimation of the likelihood of several risky events

Chapter 6: Community response capacity analysis
105
The perceived risk for mass movements and flooding is rather similar in population of different age groups with the same gender, except in the elder men whom perceive the risk from mass movements fairly lower than the risk from flooding. As regards to the gender, in general men perceive the risk of mass movements and flooding lower than women (perceived risk for mass movements: men=2.09, women=2.27; perceived risk for flooding: men=2.07, women=2.27). When comparing according to the age and gender (Table 6.9), results show that the youngest women perceive the risk quite higher than young men and both men and women between 20 and 34 years have a higher perception of the risk than the rest of the population. However, despite of the particular differences between some of the age groups, the perceived risk is quite homogenous and is no correlated with the age for both flooding (t=1.514, p=0.011) and mass movement (t=1.455, p=0.022).
Table 6.9. Risk Perception distribution according to gender and age groups Male Female
Mean perceived risk
up to 14 years
15 to 19 years
20 to 34 years
35 to 49 years
50 to 64 years
65 and older
up to 14 years
15 to 19 years
20 to 34 years
35 to 49 years
50 to 64 years
65 and older
Mass Movement
2.02 2.14 2.42 2.14 1.87 1.56 2.45 2.31 2.38 2.17 2.19 2.17
Flooding 1.94 2.05 2.25 2.11 2.10 2.33 2.43 2.33 2.47 2.18 2.06 2.19
The relationship of the perceived likelihood of risky events with other gauged elements was analyzed. It was found a statistically significant correlation of the perceived likelihood with the levels of concern, both initial (flood: t =15.35, p=0.00; mass movements: t =14.2, p=0.00) and final (flood: t =25.3, p=0.00; mass movements: t =28.9, p=0.00). Regarding the correlation of the previous experience with the perceived likelihood of risky events (Table 6.10), even if there is a slight increment of the mean perceived risk from the people who was previously directly affected, it was found no statistically significant correlation of the previous experience with the perceived likelihood of risky events (flood: t =2.75, p=0.042; mass movements: t =1.09, p=0.35).
Table 6.10. Risk Perception distribution according to gender and age groups
Mean perceived likelihood of risk Previous experience of natural hazards
Mass Movement Flooding
Yes, but I didn’t suffer any damage or injury 2,17 2,18
Yes and I was directly affected by it 2,32 2,39
No, but I know there had been some before in this particular municipality 2,23 2,23
No, and I haven’t heard about any in this particular municipality 2,10 1,99
As mentioned before, the distribution of the questionnaire was phases between February 2009 and February 2010. In April 6, 2009, an earthquales hit the region L’Aquilla, central Italy, causing more than 300 deads. Even if the study area is not seismic, and the perceived danger to earthquakes is really low, it is interesting to notice a slight increment in the perceived risk results after the mentioned earthquake, from 2.07 to 2.20. This results could be associated to the national concern generated after the large earthquake, how
6.4.4 Hazard Knowledge
In order to estimate the hazard knowledge, the perceived knowledge about mass movements and flooding was gauged as well as the perceived main triggering factors. Results of the perceived general knowledge about mass movements and flooding for different entities is presented in Table 6.11 and Figure 6.5. The results show that the perceived knowledge for mass movements and flooding of the different entities is almost identical. The entities with higher perceived knowledge, considered as acceptable knowledge, are the Civil Protection, the Comunità Montana and the Municipality. The mean perceived knowledge of the other entities was considered poor including the self-knowledge of the respondents (Mean=2.51) and the knowledge of the population. (Mean=2.69). The entities with least perceived hazard knowledge are insurance companies, national government and mass media.
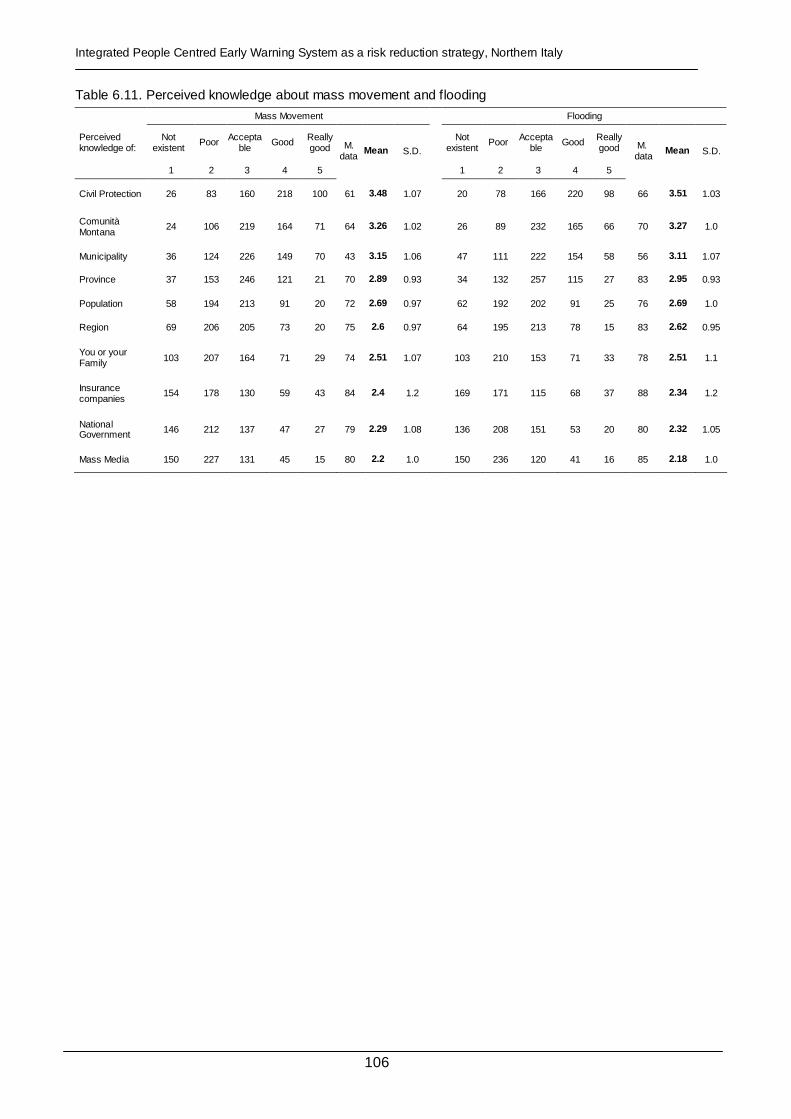
Integrated People Centred Early Warning System as a risk reduction strategy, Northern Italy
106
Table 6.11. Perceived knowledge about mass movement and flooding
Mass Movement Flooding
Perceived knowledge of:
Not existent
Poor Acceptable
Good Really good
Not existent
Poor Acceptable
Good Really good
1 2 3 4 5
M. data
Mean S.D.
1 2 3 4 5
M. data
Mean S.D.
Civil Protection 26 83 160 218 100 61 3.48 1.07 20 78 166 220 98 66 3.51 1.03
Comunità Montana
24 106 219 164 71 64 3.26 1.02 26 89 232 165 66 70 3.27 1.0
Municipality 36 124 226 149 70 43 3.15 1.06 47 111 222 154 58 56 3.11 1.07
Province 37 153 246 121 21 70 2.89 0.93 34 132 257 115 27 83 2.95 0.93
Population 58 194 213 91 20 72 2.69 0.97 62 192 202 91 25 76 2.69 1.0
Region 69 206 205 73 20 75 2.6 0.97 64 195 213 78 15 83 2.62 0.95
You or your Family 103 207 164 71 29 74 2.51 1.07 103 210 153 71 33 78 2.51 1.1
Insurance companies
154 178 130 59 43 84 2.4 1.2 169 171 115 68 37 88 2.34 1.2
National Government 146 212 137 47 27 79 2.29 1.08 136 208 151 53 20 80 2.32 1.05
Mass Media 150 227 131 45 15 80 2.2 1.0 150 236 120 41 16 85 2.18 1.0
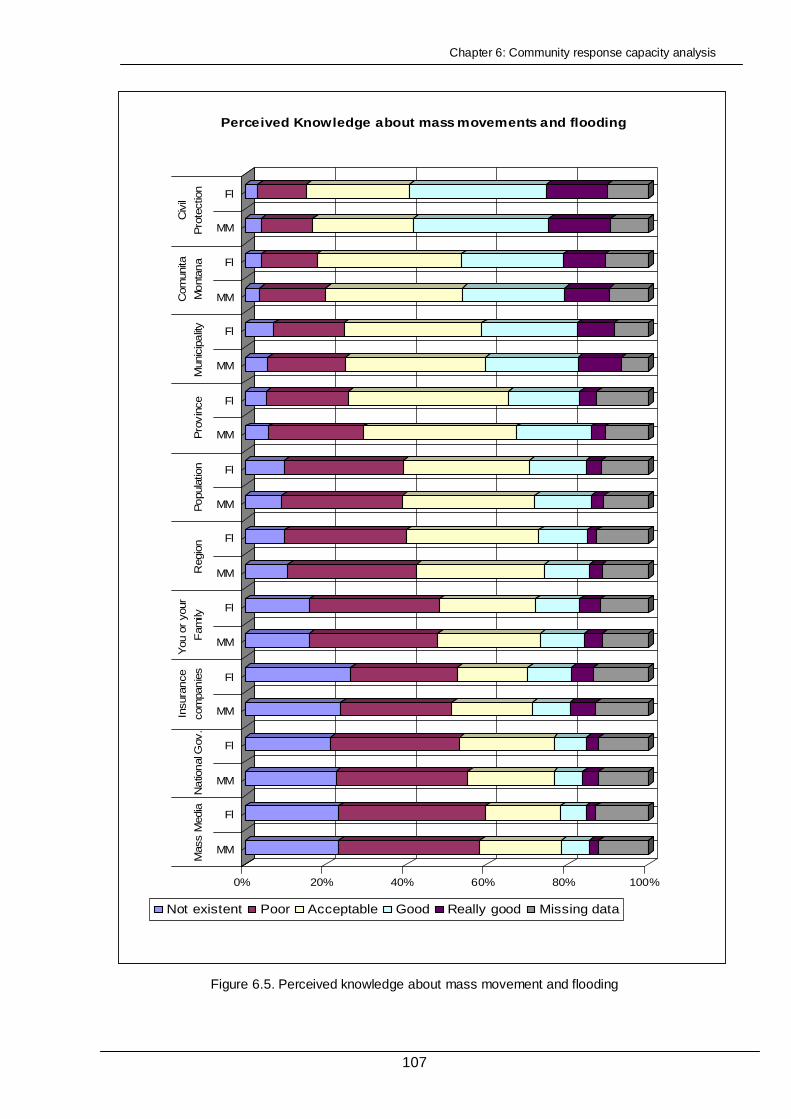
Chapter 6: Community response capacity analysis
107
0% 20% 40% 60% 80% 100%
MM
Fl
MM
Fl
MM
Fl
MM
Fl
MM
Fl
MM
Fl
MM
Fl
MM
Fl
MM
Fl
MM
FlM
ass M
edia
Natio
nal
Gov
.
Insu
rance
com
panie
s
You
or
your
Fam
ilyR
egio
nPopu
latio
nP
rovin
ceM
unic
ipality
Com
unita
Mont
ana
Civ
il
Pro
tect
ion
Perceived Knowledge about mass movements and floodi ng
Not existent Poor Acceptable Good Really good Missing data
Figure 6.5. Perceived knowledge about mass movement and flooding
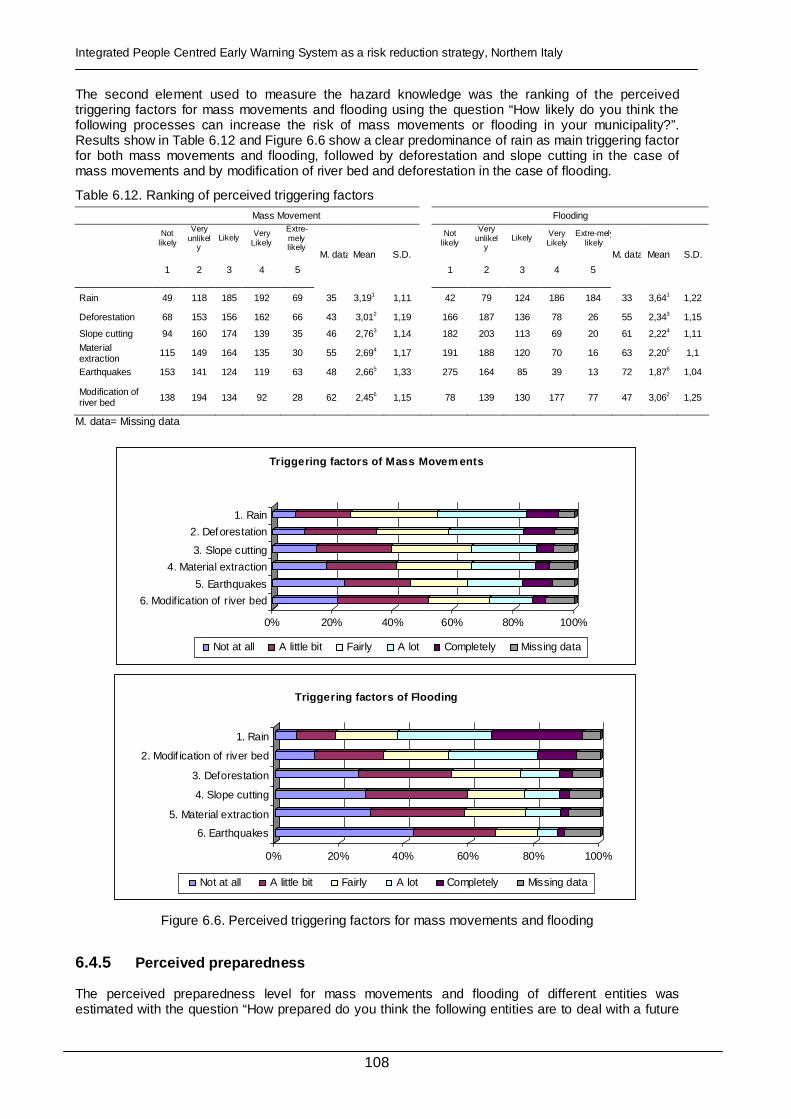
Integrated People Centred Early Warning System as a risk reduction strategy, Northern Italy
108
The second element used to measure the hazard knowledge was the ranking of the perceived triggering factors for mass movements and flooding using the question “How likely do you think the following processes can increase the risk of mass movements or flooding in your municipality?”. Results show in Table 6.12 and Figure 6.6 show a clear predominance of rain as main triggering factor for both mass movements and flooding, followed by deforestation and slope cutting in the case of mass movements and by modification of river bed and deforestation in the case of flooding.
Table 6.12. Ranking of perceived triggering factors
Mass Movement Flooding
Not
likely
Very unlikel
y Likely Very
Likely
Extre-mely likely
Not likely
Very unlikel
y Likely Very
Likely Extre-mely
likely
1 2 3 4 5
M. data Mean S.D.
1 2 3 4 5
M. data Mean S.D.
Rain 49 118 185 192 69 35 3,191 1,11 42 79 124 186 184 33 3,641 1,22
Deforestation 68 153 156 162 66 43 3,012 1,19 166 187 136 78 26 55 2,343 1,15
Slope cutting 94 160 174 139 35 46 2,763 1,14 182 203 113 69 20 61 2,224 1,11
Material extraction
115 149 164 135 30 55 2,694 1,17 191 188 120 70 16 63 2,205 1,1
Earthquakes 153 141 124 119 63 48 2,665 1,33 275 164 85 39 13 72 1,876 1,04
Modification of river bed 138 194 134 92 28 62 2,456 1,15 78 139 130 177 77 47 3,062 1,25
M. data= Missing data
0% 20% 40% 60% 80% 100%
6. Modification of river bed
5. Earthquakes
4. Material extraction
3. Slope cutting
2. Deforestation
1. Rain
Triggering factors of Mass Movem ents
Not at all A little bit Fairly A lot Completely Missing data
0% 20% 40% 60% 80% 100%
6. Earthquakes
5. Material extraction
4. Slope cutting
3. Deforestation
2. Modif ication of river bed
1. Rain
Triggering factors of Flooding
Not at all A little bit Fairly A lot Completely Missing data
Figure 6.6. Perceived triggering factors for mass movements and flooding
6.4.5 Perceived preparedness
The perceived preparedness level for mass movements and flooding of different entities was estimated with the question “How prepared do you think the following entities are to deal with a future

Chapter 6: Community response capacity analysis
109
mass movement or flooding?”. The mean perceived preparedness was generally poor, except for the Civil Protection and Comunità Montana which are considered to have an acceptable preparedness. The ranking of the preparedness levels of the different entities was really similar to the ranking of the perceived knowledge although the mean values were slightly minor in general. The entities with highest perceived preparedness are Civil Protection, Comunità Montana and Municipality, while the entities with least perceived preparedness are the national government, mass media and insurance companies (Table 6.13 and Figure 6.7).
Table 6.13. Perceived preparedness levels for mass movement and flooding
Mass Movement Flooding
Not existent
Poor Acceptable
Good Really good
Not existent
Poor Acceptable
Good Really good
1 2 3 4 5
M. data Mean S.D.
1 2 3 4 5
M. data Mean S.D.
Civil Protection
28 75 165 224 104 52 3.51 1.06 30 64 182 207 102 63 3.49 1.06
Comunità Montana 45 121 218 162 46 56 3.07 1.04 47 123 217 147 47 67 3.04 1.05
Municipality 50 150 243 123 37 45 2.91 1.01 66 136 242 119 36 49 2.87 1.04
Province 48 153 241 118 22 66 2.85 0.96 46 159 222 126 22 73 2.86 0.94
Region 74 201 213 76 14 70 2.58 0.95 77 192 208 87 11 73 2.59 0.96
Population 86 216 191 71 19 65 2.52 0.99 90 199 203 66 18 72 2.52 0.99
You or your Family
117 218 166 53 27 67 2.41 1.05 121 218 156 52 29 72 2.39 1.07
National Government
123 217 150 66 25 67 2.4 1.07 118 223 151 62 22 72 2.39 1.04
Insurance companies 182 188 132 40 29 77 2.2 1.12 190 182 124 41 30 81 2.19 1.13
Mass Media 199 210 124 32 12 71 2.04 0.98 198 225 108 32 7 78 1.99 0.93

Integrated People Centred Early Warning System as a risk reduction strategy, Northern Italy
110
0% 10% 20% 30% 40% 50% 60% 70% 80% 90% 100%
MM
Fl
MM
Fl
MM
Fl
MM
Fl
MM
Fl
MM
Fl
MM
Fl
MM
Fl
MM
Fl
MM
Fl
Mas
s M
edia
Insu
ranc
eco
mpa
nies
Na
tion
alG
ov.
You
or
your
Fam
ilyP
opul
atio
nR
egi
onP
rovi
nce
Mu
nici
palit
yC
omun
itaM
onta
naC
ivil
Pro
tect
ion
Perceived preparedness leves for mass movements and flooding
Not existent Poor Acceptable Good Really good Missing data
Figure 6.7. Perceived preparedness levels for mass movement and flooding
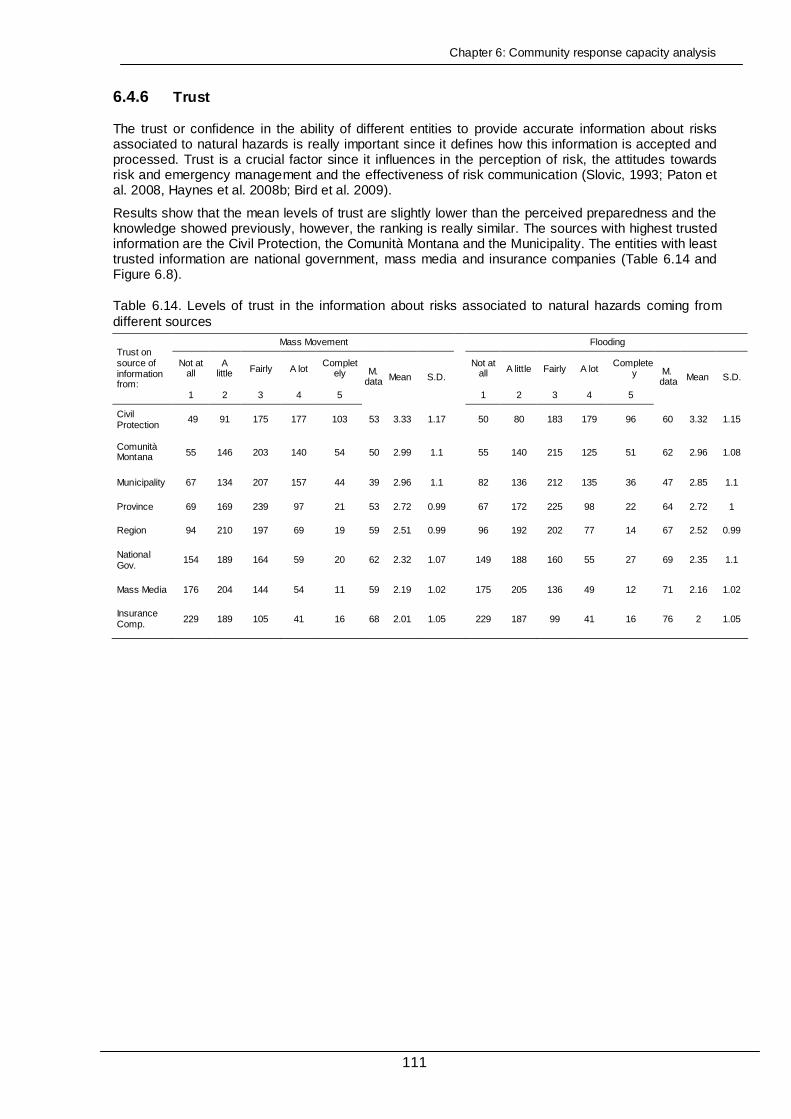
Chapter 6: Community response capacity analysis
111
6.4.6 Trust
The trust or confidence in the ability of different entities to provide accurate information about risks associated to natural hazards is really important since it defines how this information is accepted and processed. Trust is a crucial factor since it influences in the perception of risk, the attitudes towards risk and emergency management and the effectiveness of risk communication (Slovic, 1993; Paton et al. 2008, Haynes et al. 2008b; Bird et al. 2009).
Results show that the mean levels of trust are slightly lower than the perceived preparedness and the knowledge showed previously, however, the ranking is really similar. The sources with highest trusted information are the Civil Protection, the Comunità Montana and the Municipality. The entities with least trusted information are national government, mass media and insurance companies (Table 6.14 and Figure 6.8).
Table 6.14. Levels of trust in the information about risks associated to natural hazards coming from different sources
Mass Movement Flooding
Not at all
A little Fairly A lot
Completely
Not at all A little Fairly A lot
Completely
Trust on source of information from:
1 2 3 4 5
M. data Mean S.D.
1 2 3 4 5
M. data Mean S.D.
Civil Protection
49 91 175 177 103 53 3.33 1.17 50 80 183 179 96 60 3.32 1.15
Comunità Montana 55 146 203 140 54 50 2.99 1.1 55 140 215 125 51 62 2.96 1.08
Municipality 67 134 207 157 44 39 2.96 1.1 82 136 212 135 36 47 2.85 1.1
Province 69 169 239 97 21 53 2.72 0.99 67 172 225 98 22 64 2.72 1
Region 94 210 197 69 19 59 2.51 0.99 96 192 202 77 14 67 2.52 0.99
National Gov.
154 189 164 59 20 62 2.32 1.07 149 188 160 55 27 69 2.35 1.1
Mass Media 176 204 144 54 11 59 2.19 1.02 175 205 136 49 12 71 2.16 1.02
Insurance Comp. 229 189 105 41 16 68 2.01 1.05 229 187 99 41 16 76 2 1.05

Integrated People Centred Early Warning System as a risk reduction strategy, Northern Italy
112
0% 20% 40% 60% 80% 100%
Fl
MM
Fl
MM
MM
Fl
MM
Fl
MM
Fl
Fl
MM
Fl
MM
Fl
MM
Insu
ranc
eC
omp.
Mas
s M
edia
Nat
iona
lG
ov.
Re
gio
nP
rovi
nce
Mu
nici
palit
yC
omun
itàM
onta
naC
ivil
Pro
tect
ion
Levels of trust in different sources
Not at all A little Fairly A lot Completely Missing data
Figure 6.8. Levels of trust in the information about risks associated to natural hazards coming from
different sources

Chapter 6: Community response capacity analysis
113
6.4.7 Self Efficacy and self protective behaviour
Self-efficacy is defined as the individual’s perception of their ability to protect him/herself and his/her family from the effects of a new hazardous event. Regarding the self protective behaviour, Mulilis and Duval (1997) point that the individuals perception of responsibility for self-protection serve as a lenses through which the need for and efficacy of adjustments is assessed.
In order to measure the self efficacy and self protective behaviour, several elements were evaluated including: i) level of perceived self preparedness, ii) knowledge about mass movements and flooding, iii) willingness to seek new information, iv) personal mitigation measures, v) knowledge of existing physical mitigation/protection measures, vi) ) knowledge of the emergency plan and the emergency procedures, vii) knowledge of the responsible for emergency management and viii) participation on voluntary groups.
i) The mean perceived preparedness of the population (Table 6.13) is considered poor (Mean=2.52, S.D. =0.99) while the self preparedness is slightly lower and also considered poor (Mean=2.41, S.D. =1.05). ii) A similar result was obtained for the mean perceived self knowledge about mass movements and flooding (Table 6.11) considered poor both for the individual and family knowledge (Mean=2.51, S.D. =1.07) as for the population which is slightly higher (Mean=2.69, S.D. =0.97).
iii) Several authors have found that information seeking about hazards, risks and protections is correlated with risk perception, hazard adjustment and adoption of self-protective behavior (Mileti and Darlington, 1997 and Perry and Lindell, 2008). Information seeking was measured twice in the survey, first for the information received in the past and second for the information in the future. Regarding the information received in the past, to the question “Did you look for the information?” just 10.5% (n=68) of the surveyed population answered yes but this is not representative due to the large value of Missing data=44.1% (n=286). When asking about the willingness to look for information in the future 47.2% (n=306) of the surveyed population answered Yes (Missing data 4.2%, n=27).
iv) Regarding the personal mitigation measures, just 15,3% of the surveyed population (99 people, Missing data=33, 5.1%) thinks that they can take personal mitigation measures to reduce the consequences of natural hazards. v) On the other side, when asked if physical mitigation/protection measures exist in the community, 284 people (43.8%) answered Yes, 68 (10,5%) answered No and 293 people (45.2%) answered that they do not know if any physical measure exists.
vi) When asked if they know the emergency plan, just 27 people (4.2%) answered that they know it, while 117 people (18.1%) affirmed that they knew the emergency procedures in case of an emergency. As regards to the emergency management, 23,8% (154 people, Missing data=11, 1,7%) of the respondents stated that they know who is the responsible for managing an emergency related to natural hazards. vii) However, when they were asked to identify the responsible, most affirmed that it was the Civil Protection (13,9%) followed by the Mayor (9,3%) and the fire fighters (2,9%) and just few people named the local police (0.5%) and the Comunità Montana (0.3%).
viii) The participation on voluntary groups is also considered an element of the sense of community that is the degree to which residents feel bonded to their community. Of the total surveyed population, 19,4% (126 people, Missing data=7, 1,1%) affirm that themselves or someone of their family have ever been a volunteer. The groups they have been volunteers of are mainly Civil Protection (6,6%), followed by Fire Brigade (3,1%) and the Red Cross (2,3%).
6.4.8 Preferences for warning and emergency procedures
After evaluating the knowledge on warning and emergency management, the respondents were asked to establish their preferences about the entity which should be responsible for issuing the warning, their preferred media to issue the warning and the entity which should be responsible of the emergency management. Results in Table 6.15 show that most respondents consider that the Municipality should be responsible for both issuing the warning and the emergency management, followed by the Civil Protection and the Comunità Montana. It is interesting to notice that the majority of respondents consider themselves, their neighbours and the scientific community not responsible for issuing the warning.
Regarding the media, the best considered media to issue the warning is an acoustic signal (76.2%), follow distantly by television (44.6%), SMS (18.8%) and door to door 17.0%). The least preferred media to issue the warning are radio (16.4%), land phone call (14.8%) and Internet (7.4%).
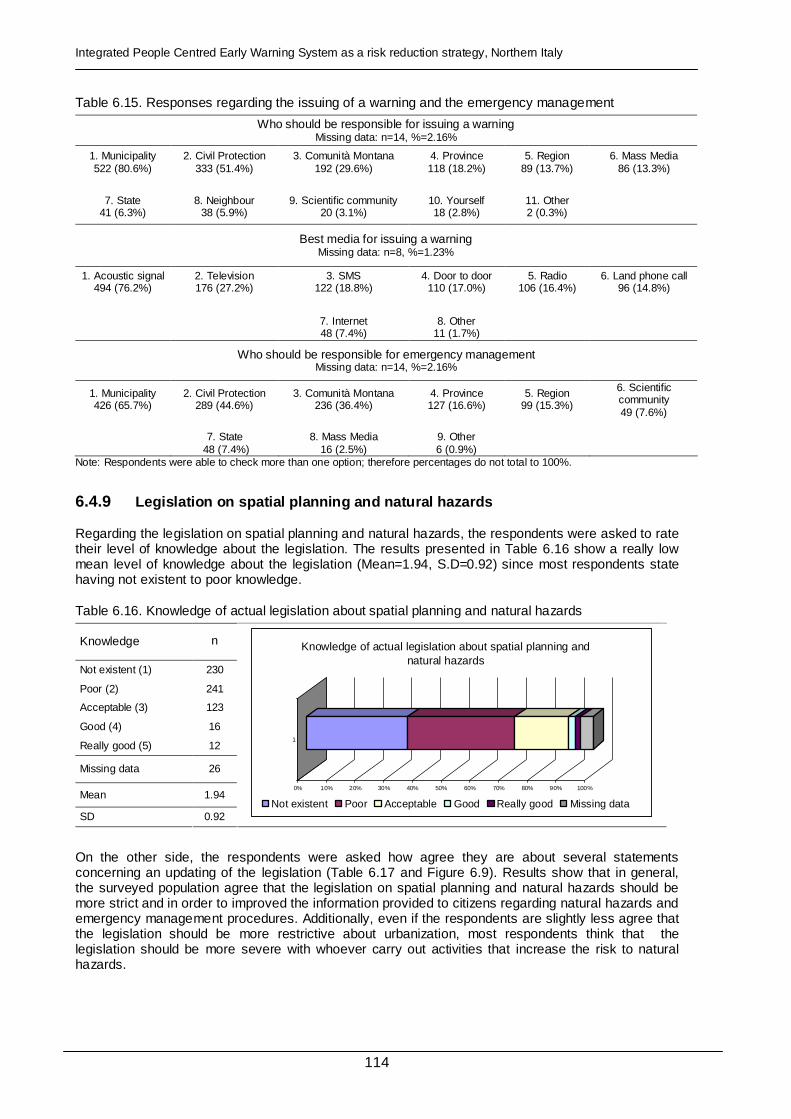
Integrated People Centred Early Warning System as a risk reduction strategy, Northern Italy
114
Table 6.15. Responses regarding the issuing of a warning and the emergency management
Who should be responsible for issuing a warning Missing data: n=14, %=2.16%
1. Municipality 522 (80.6%)
2. Civil Protection 333 (51.4%)
3. Comunità Montana 192 (29.6%)
4. Province 118 (18.2%)
5. Region 89 (13.7%)
6. Mass Media 86 (13.3%)
7. State 41 (6.3%)
8. Neighbour 38 (5.9%)
9. Scientific community 20 (3.1%)
10. Yourself 18 (2.8%)
11. Other 2 (0.3%)
Best media for issuing a warning Missing data: n=8, %=1.23%
1. Acoustic signal 494 (76.2%)
2. Television 176 (27.2%)
3. SMS 122 (18.8%)
4. Door to door 110 (17.0%)
5. Radio 106 (16.4%)
6. Land phone call 96 (14.8%)
7. Internet 48 (7.4%)
8. Other 11 (1.7%)
Who should be responsible for emergency management Missing data: n=14, %=2.16%
1. Municipality 426 (65.7%)
2. Civil Protection 289 (44.6%)
3. Comunità Montana 236 (36.4%)
4. Province 127 (16.6%)
5. Region 99 (15.3%)
6. Scientific community 49 (7.6%)
7. State 48 (7.4%)
8. Mass Media 16 (2.5%)
9. Other 6 (0.9%)
Note: Respondents were able to check more than one option; therefore percentages do not total to 100%.
6.4.9 Legislation on spatial planning and natural hazards
Regarding the legislation on spatial planning and natural hazards, the respondents were asked to rate their level of knowledge about the legislation. The results presented in Table 6.16 show a really low mean level of knowledge about the legislation (Mean=1.94, S.D=0.92) since most respondents state having not existent to poor knowledge.
Table 6.16. Knowledge of actual legislation about spatial planning and natural hazards
Knowledge n
Not existent (1) 230
Poor (2) 241
Acceptable (3) 123
Good (4) 16
Really good (5) 12
Missing data 26
Mean 1.94
SD 0.92
0% 10% 20% 30% 40% 50% 60% 70% 80% 90% 100%
1
Knowledge of actual legislation about spatial planning and natural hazards
Not existent Poor Acceptable Good Really good Missing data
On the other side, the respondents were asked how agree they are about several statements concerning an updating of the legislation (Table 6.17 and Figure 6.9). Results show that in general, the surveyed population agree that the legislation on spatial planning and natural hazards should be more strict and in order to improved the information provided to citizens regarding natural hazards and emergency management procedures. Additionally, even if the respondents are slightly less agree that the legislation should be more restrictive about urbanization, most respondents think that the legislation should be more severe with whoever carry out activities that increase the risk to natural hazards.

Chapter 6: Community response capacity analysis
115
Table 6.17. How agree are you that the legislation should:
Strongly disagree Disagree Moderately Agree
Strongly agree Agree that legislation should:
1 2 3 4 5
Missing data
Mean S.D.
force institutions to inform about natural hazards and risks 14 40 115 197 254 28 4.03 1.03
force local institutions to provide an intervention plan in case of emergency
12 16 95 200 292 33 4.21 0.93
be more restrictive about urbanization and land development
18 59 136 176 226 33 3.87 1.1
be more severe with whoever carry out activities that increase the natural risk
14 44 100 154 300 36 4.11 1.06
0% 10% 20% 30% 40% 50% 60% 70% 80% 90%100%
Agree force institutions to inform about NH
Agree force local institutions to provide an interventionplan in case of emergency
Agree be more restrictive about urbanization and landdevelopment
Agree be more severe with whoever carry out activitiesthat increase the natural risk
About the legislation on natural hazards and risks
Strongly disagree Disagree Moderately Agree Strongly agree Missing data
Figure 6.9. Levels of agreement regarding changes in the legislation
6.4.10 Participation in past workshops or meetings about r isk and natural hazards and emergency exercises
The knowledge about the development and the participation on previous workshops or meetings to discuss the risks associated to natural hazards as well as on past emergency exercises was evaluated with the questions “Do you know if has ever been any workshop, informing meetings or discussion about risks related to natural hazards in the municipality/fraction where you are living?” and “Do you know if there has been any emergency exercise for events related to natural hazards in this municipality?” . Results presented in Table 6.18 and Figure 6.10 show that just 2.2% of the surveyed population has ever attended a workshop or meeting about risks related to natural hazards and just 2.9% reported have participated in a emergency exercise. Most people do not know about the development of any workshop or meeting in the past (69.8%) neither know about any past emergency exercise (63.9%).

Integrated People Centred Early Warning System as a risk reduction strategy, Northern Italy
116
Table 6.18. Participation in past events
Workshop or meetings
Emergency exercise
Participation in past events Missing data
17 (2.6%) Missing data
19 (2.9%)
I. Yes, and you attended 14 (2.2%) 22 (3.4%)
II. Yes, but you didn’t attended (no explanation given) 5 (0.8%) 8 (1.2%)
IIa. Yes, but you didn’t attended-because you didn’t have time to go 31 (4.8%) 18 (2.8%)
IIb. Yes, but you didn’t attended-because you were not interested 12 (1.9%) 4 (0.6%)
IIc. Yes, but you didn’t attended- for a different reason 12 (1.9%) 14 (2.2%)
III. No, there hasn’t been any 105 (16.2%) 149 (23.0%)
IV. No, don’t know 452 (69.8%) 414 (63.9%)
14 60 105 452 17
22 46 149 414 17
0% 20% 40% 60% 80% 100%
Workshop or meetings
Emergency exercise
Participation in past workshops and emergency exerc ises
I. Yes, and you attended II. Yes, but you didn’t attended III. No, there hasn’t been any
IV. No, don’t know Missing data
Figure 6.10. Participation in past workshops on natural hazards and emergency exercises
6.5. Discussion and recommendations
The distribution via schools was proven to be very efficient at least among the student population, even if the response rate of the students’ relatives was much lower than the one of the students.
Regarding the structure and design of the questionnaire, it was found that in general the questions were sequenced in a logical order. However, some participants expressed that some questions seem to be repetitive. This could be due to the lack of understanding of the terminology used, e.g. responsible of emergency management versus responsible of issuing the alarm. Since the questionnaire was translated by academic colleagues and revised by people with technical knowledge of the topic, it seems that the terminology and language used could have been too technical for some respondents. This suggests that the questionnaire may be improved in the future by rewording some of the questions using a simpler terminology.
The results of the survey show that, despite most respondents having either personally experienced or knowledge about the existence of previous disastrous events, the perceived risk and levels of awareness are quite low. This lack of correlation of previous experience and risk perception, even if unexpected, has been found in other studies (Tierney et al., 2001). In our case, the missing correlation could be due to the lack of a regular exposure at the regional level because, except for the large event of 1987 and some particular events, most landslides and floods have affected small areas and few people. Another explanation is that the most recalled event, the flood of 1987, even if affected a large portion of the study area causing vast structural damages, generated a relatively low amount of fatalities (most of them due to the Val Pola landslide). This was partially due to the good and timely emergency management. Since this event was the population’s main experience of an infrequent large event, it became their archetypal event. As a result, people infer that the next large event could have similar consequences, i.e. a large magnitude event with minor consequences regarding loss of

Chapter 6: Community response capacity analysis
117
lives. This pattern is consistent with the “normalization bias” (Haynes et al., 2008a; Paton et al. 2008). In circumstances like this, in which the consequences of a past event were relatively minor in respect to the possible damage, the operation of this bias can result in people overestimating their perceived preparedness and reducing future preparedness because they do not consider that something worse could happen (Paton et al., 2008). This means, as pointed out by Paton et al. (2008), that if communities base their risk decisions on lower intensity events, this reduces their levels of preparedness and perceived risk increasing their vulnerability and therefore their future real risk level. The obtained results show that the perceived risk are levels are low, agreeing with the previous statement. On the contrary, the perceived levels of self-preparedness and preparedness of the population are also low, suggesting that the population recognizes the lack of self-preparedness to face future events, instead of the usual over-confidence.
There is a clear difference in the perceptions of risk to personal safety and to property and other structural elements. The low perceived risk to personal safety could reflect the fact that the individuals sense that the warning systems will allow them to escape personal harm, while the property and structures left behind are exposed to higher risks.
Results about the perceived danger of different hazards and the hazard of most concern were consistent among each other and are also consistent with the hazard levels obtained by the scientific community and government. Forest fires are perceived as the most dangerous hazard, followed by flooding and landslides. However, flooding and landslides are the hazards of most concern, followed by forest fires. It is important to point out that according to the Regione Lombardia (2009), CM Valtellina di Tirano has an average of 5.5 forest fires per year, most of them during the winter season, and has a medium risk level to forest fires (Level 2, in a scale from 1 to 3). This indicates that there is not a particularly high risk for forest fires in the study area. Additionally, there have not been any recent major forest fires. However, since most fires occur during the winter (season of the application of most questionnaires) and fires are visually evident even during a small intensity event, this might influence and increase the perceive danger of this hazard.
The hazard self-knowledge was rated poor, but the results of the question about triggering factors of mass movements and flooding show a good understanding of the different mechanisms that can influence in the activation of a hazardous event.
Results for perceived knowledge, preparedness and trust were highly consistent among each other. The entities considered to be better prepared and more trusted are the Civil Protection, the Comunità Montana and the Municipality. On the contrary, the entities with the lowest levels of trust and preparedness are the national government, mass media and insurance companies.
Both self efficacy and self protective behaviour were rated low indicating that in general, respondents’ perceive that they lack ability to protect themselves and their family from the effects of a new hazardous event.
When asked about the physical mitigation measures, just 43.8% of the respondents answered that they know about their existence and 45.2% answered that they do not know about it. These results are interesting since many kinds of mitigation structures such as channels, levees, dry walls, retaining walls, etc have been constructed in the whole study area. On the other hand, just 1 out of 7 people (15.3%) think that they can take personal mitigation measures to reduce the consequences of natural hazards. This shows a low knowledge about the non structural mitigation measures any person can perform. However, when asked about the willingness to look for new information, almost half of the respondents answer yes, showing a high desire to improve their actual knowledge.
Just one out of each 25 people (4.2%) stated that they know the emergency plan and approximately just one out of five people (18.1%) affirmed that they know the emergency procedures. The answers show that even those respondents that think they have good knowledge of the emergency procedures, in reality are confused about who is the responsible for managing the emergency and who is responsible for the emergency response. All the previous could be a problem in case of a future emergency since most people would lack the knowledge of how to properly react which could generate an increase in the negative effects of the event.
The lack of self knowledge and self preparedness, the fact that respondents ask for stronger laws while most people think they can not do any mitigation activities themselves, the lower level of perceived risk than the actually present, the higher trust in the authorities than in the population and in themselves show that there is a strong transference of responsibility to the authorities and a belief in the reduction of risk from technological solutions. This transference of responsibility to others can generate a false sense of security and a consequent reduction of the preparedness level of the
Integrated People Centred Early Warning System as a risk reduction strategy, Northern Italy
118
population (Mulilis and Duval, 1995; Paton et al., 2001; Auckland Regional Council. 2002; Solana and Kilburn, 2003)
Respondents consider that the Municipality should be responsible for both issuing the warning and the emergency management, followed by the Civil Protection and the Comunità Montana. The best considered media to issue the warning is an acoustic signal, followed distantly by television, SMS and door to door. This is in general agreement with the actual emergency procedures where the Mayor is the responsible of the emergency management. At the moment, in most municipalities the method of issuing the warning involves the use of moving loud speakers located in the cars of the emergency services. Taking into account the results of the survey, it would be convenient to place fixed acoustic devices in highly visited central areas.
Recurrent emergency exercises are an excellent way to increase preparedness and assure an effective emergency reaction (Ripley, 2008). However, most people reported that they have neither participated in any workshop or meeting about risks related to natural hazards nor in any emergency exercise. This is interesting since in all the schools of the CM Valtellina di Tirano an emergency evacuation drill is performed at least once a year since several years ago, meaning that all the students surveyed have participated in emergency exercises at least once. The predominance of negative answers to this question could be the result of several aspects. Respondents could have thought that the questions were related only to their home municipality where there may never have been any emergency exercise, and not to the whole mountain consortium. Another possibility is that respondents are not aware that the emergency exercises performed in the school could be applied to emergencies related to natural hazards, but only to man-made emergencies such as fires etc. During an evacuation exercise performed in one school, researchers observed that even if the exercise was developed in a timely and organized way, no feedback was provided to the participants. In particular, students only received instructions about how to execute the emergency procedure at the school; they were not taught in which real-life situations these could be applied outside the school.
Most results of the questions that compare mass movements and floods were very similar. This might indicate that there is not distinction between the differences and the effects of both hazards. On the other side, for some questions, the fact of presenting both hazards in the same frame might also have had an influence on the homogeneity of the answers. It is possible that if there had been separate questions for each hazard the results may had been different.
Several problems were found regarding the way some questions were formulated, probably affecting the answers. For example, regarding the questions about previous experiences and education activities (Questions 10, 37 and 38), there might been previous activities or events they knew the existence of or they assisted with inside the CM Valtellina di Tirano, but since the questions are related specifically about their own community, that might have caused that some positive answers were excluded.
Three different mass movements (landslide, debris flow and rock falls) were included in the list of the question about perceived danger of different hazards and levels of concern about natural hazards (Questions 11 and 12). If the hazards had been put together as just mass movements or called frana (Italian for landslides) the results might had been different since it is possible that the definitions of the different mass movements were not clear for the respondents.
6.6. Conclusions
Questionnaires are a useful tool that can be used to quantitatively gauge the population’s perceived risk, trust on authorities, awareness, knowledge and preparedness in relation to natural hazards, among many others. Once the obtained information is properly analyzed, the results could be used as predictors of the reactions and general response capacity of the population to a future event. This could give the local authorities, scientists and emergency personal information about how to properly direct efforts in order improve, if necessary, the level of preparedness and awareness of the population and thus decrease the negative impact of a future damaging event by reducing the vulnerability.
Regular emergency exercises, such as the drills performed in the schools, are an excellent way to prepare new generations to effectively face emergencies. However, in order to be efficient, they can not be limited merely to the development of the evacuation procedure. A preliminary discussion and posterior analysis must be performed between the students and the school personnel. This ensures an understanding of the different emergencies and an increase of awareness allowing students and
Chapter 6: Community response capacity analysis
119
other emergency exercise participants to be able to apply the knowledge gained during emergencies occurring outside the school.
Results show that at present the individuals sense that the warning systems will allow them to escape personal harm with sufficient time, while the property and structures left behind are exposed to higher risks. This generates a low perceived risk and a transfer of responsibility to the authorities, who are expected to manage the whole emergency without intervention of the population. However, respondents show a high interest in increasing their level of knowledge and preparedness. This interest should be addressed by the local authorities and emergency personnel with the development of educational campaigns specifically covering the local risks. The topics of the campaigns should include emergency procedures and other topics selected by the local population. A key aspect is to increment the participation of the population in the risk management and the application of non structural mitigation strategies.
6.7. References
Auckland Regional Council. 2002. Hazard Identification and Risk Assessment for Local Authorities. Hazard Guideline No. 2. Technical Publication No. 106. 28 p.
Barberi, F., Davis, M.S. Isaia, R., Nave, R, and Ricci, T. 2008 Volcanic risk perception in the Vesuvius population. Special issue on "Volcanic Risk Perception", Journal of Volcanology and Geothermal Research, 172: 244-258, doi:10.1016/j.jvolgeores
Bird, D. 2009. The use of questionnaires for acquiring information on public perception of natural hazards and risk mitigation—a review of current knowledge and practice. Nat Hazards Earth Syst Sci 9:1307–1325
Bird, D.K., Gisladottir, G. and Dominey-Howes, D. 2009. Resident perception of volcanic hazards and evacuation procedures. Nat. Hazards Earth Syst. Sci. 9: 251–266
Cittadinanzattiva and Dipartimento della Protezione Civile. 2008 Quando la terra trema: Conoscenza e percezione del rischio sismico. Online 15/12/2008 http://www.crisbasilicata.it/admin%5Callegatinews%5Cupload%5CIndagine_terremoto_bozza_19_nov.pdf 101803040149.pdf
Coast Surf Shire (2008). Online survey for the Community Based Emergency Risk Management Project. Online 11/12/2008 http://www.surfcoastdirectories.com/SurveyFull/TakeSurvey.asp?SurveyID=922mp34Jmn53G
DeChano L. and Butler D. 2001. Analysis of public perception of debris flow hazard. In: Disaster Prevention and Management. Vol 10, Number 4, pp. 261-269
Finlay, P.J. and Fell, R. 1997. Landslides: risk perception and acceptance. Canadian Geotechnical Journal, 34: 169-188.
Frattini, P. and Crosta, G. 2006. Valutazione dell’accettabilità del rischio da frana e analisi costi-benefici. Giornale di Geologia Applicata 4: 49-56, doi: 10.1474/GGA.2006-04.0-06.0134
Gregg, C. E., Houghton, B. F., Johnston, D. M., Paton, D., and Swanson, D. A.: The perception of volcanic risk in Kona communities from Mauna Loa and Hualalai volcanoes, Hawaii. J. Volcanol. Geoth. Res. 130: 179–196
Haynes, K., Barclay, J. and Pidgeon, N. 2008a. Whose reality counts? Factors affecting the perception of volcanic risk. J. of Volcanology and Geothermal Research 172: 259–272
Haynes, K., Barclay, J. and Pidgeon, N. 2008b. The issue of trust and its influence on risk communication during a volcanic crisis. Bulletin of Volcanology 70: 605-621.
Interprovinciaal Overleg. 2006. Risk Communication Manual. The Hague: 52 p.
Mileti, D. and Darlington, J. 1997. The role of searching in shaping reactions to earthquake risk information. Social Problems 44: 89–103
Mulilis and Duval. 1997. The pre model of coping with threat and tornado preparedness behavior; The moderating effects of felt responsibility. Journal of Applied Social Psychology 27: 1250–1266
Oppenheim, A. N. 1992. Questionnaire Design, Interviewing and Attitude Measurement, Continuum, London: 303 pp.
Paton, D., Millar, M. and Johnston, D. 2001. Community resilience to volcanic hazard consequences. Nat. Hazards 24: 157–169
Paton, D., Smith, L., Daly, M. and Johnston, D. 2008. Risk perception and volcanic hazard mitigation: Individual and social perspectives. Journal of Volcanology and Geothermal Research 172: 179–188
Perry, R.W. and Lindell, M.K. 2008. Volcanic risk perception and adjustment in a multi-hazard environment. Journal of Volcanology and Geothermal Research 172: 170–178
Practical Action 2008 . FloodEWS Baseline Survey. Online 17/12/2009 http://practicalactionconsulting.org/print/docs/region_nepal/dipecho/dipecho_questionnaire_en.pdf
RAMSOIL 2009. Questionnaires about methodologies for risk assessments. Online 08/01/2009 http://www.ramsoil.eu/UK/Questionnaire/

Integrated People Centred Early Warning System as a risk reduction strategy, Northern Italy
120
Regione Lombardia 2009. Piano regionale delle attività di previsione, prevenzione e lotta attiva contro gli incendi boschivi - Revisione 2009. Online 14/01/2011 http://www.pcvt.it/public/portal/public/upload/piano_aib_reg_lombardia_2010_2012.pdf
RINAMED 2004. Strategie di valutazione della percezione del rischio idrogeologico in aree esposte e linee guida per la comunicazione dei rischi naturali. Online 02/11/2008 http://www.rinamed.net/index.html
Ripley, A. 2008. The Unthinkable: who survives when disaster strikes and why. Crown Publishers. 266 p.
Ruin, I., Gaillard, J.C. and Lutoff, C. 2007. How to get there? Assessing motorists’ flash flood risk perception on daily itineraries. Environmental Hazards 7: 235–244
Sarantakos, S. 2005. Social Research, 2nd edition, Palgrave Macmillan Hampshire: 464 pp.
Solana, M. and Kilburn, C. 2003. Public awareness of landslides hazards: the Barranco de Tirajana, Gran Canaria, Spain. Geomorphology 54, 39-48
Slovic, P. 1987, Perception of Risk, Science 236: 280-285
Slovic, P. 1993. Perceived risk, trust and democracy. Risk Anal 13:675–682
Tierney, K., Lindell, M.K., Perry, R.W. 2001. Facing the Unexpected. John Henry Press, Washington, DC
Wright, D. Dressel, K. and Merad, M. 2006. Risk communication practices in EU Member States,selected other countries and industries. David Wright (ed.) Deliverable 2 for Project STARC -STakeholders in Risk Communications.
Chapter 7: Vulnerability Assessment at municipal scale
121
Chapter 7: Vulnerability Assessment at municipal scale *
7.1 Introduction
The UN-ISDR (United Nations International Strategy for Disaster Reduction) has widely advocated for new ways to enable authorities, communities, experts and other stakeholders to jointly diagnose disaster risk-related problems, decide on plans of action and implement them. As a result, new methodologies and tools for hazard, vulnerability and risk assessment are called for.
In the Hyogo Framework for Action 2005-2015, the international community defines the measuring of vulnerability and risk as a key activity to achieve disaster risk reduction. The Framework suggests that the impacts of disasters on social, economic and environmental conditions should be examined through indicators to assess vulnerability. As pointed out by Tapsell et al. (2010), ‘Vulnerability’ has emerged then as a central concept for understanding which conditions of people enable a hazard to become a disaster. Birkmann (2006) discusses different definitions and conceptual frameworks used by the different schools of thought summarising the rationale behind measuring vulnerability and the use of vulnerability indicators. According to Tapsell et al. (2010) information on social vulnerability helps to:
• define where the greatest need is and set priorities e.g. by deriving knowledge about spatial distribution patterns • determine actions e.g. by improving intervention tools • monitor progress and analyse trends • measure effectiveness of mitigation approaches • anticipate undesirable states • inform policymakers and practitioners • alert the public and raise awareness • stimulate discussion • gain funding e.g. for poverty reduction initiatives • represent social responsibility • look at the social roots of vulnerability.
Regarding the different approaches of vulnerability, Cutter et al. (2003) point out that there are three main tenets in vulnerability research: the identification of conditions that make people or places vulnerable to extreme natural events utilizing an exposure model (Burton et al. 1993); the assumption that vulnerability is a social condition, a measure of societal resistance or resilience to hazards (Blaikie et al. 1994; Hewitt, 1997); and the integration of potential exposures and societal resilience with a specific focus on particular places or regions (Kasperson et al., 1995; Cutter et al., 2000).
In most vulnerability analyses, vulnerability indicators are based on the physical features of the building environment and on general social and economic characteristics of a community, i.e. age, education, income level. Conversely, characteristics such as risk perception, preparedness and awareness are still generally neglected although they have been identified as an important resource. This importance is because different levels of risk perception and preparedness can directly influence people’s vulnerability and the way they might react in case of an emergency caused by natural hazards (Slovic, 1987; Birkmann, 2007; Haynes et al., 2008; Paton et al. 2008). When risk perception and people’s awareness are displayed in a spatial format, they can be useful for several actors in the risk management arena. However, in spite of the profuse literature about risk perception and preparedness, works to spatially portray these features are really scarce. The spatial relationship of perceived risks and preparedness with the hazard level can be used as a powerful tool either to improve the knowledge or for operational reasons (e.g. management of preventive information). Local authorities and civil protection authorities can design better educational activities in order to increase the preparation of particularly vulnerable groups or clusters of households within a community (Granger et al. 1999; Leonard et al., 2006, Birkmann, 2007; Leonard et al., 2008; Bird et al. 2009;
* Based on: Garcia, C. (in preparation). Social survey and GIS mapping tools: integrating people’s perception, preparedness and trust for Vulnerability assessment.
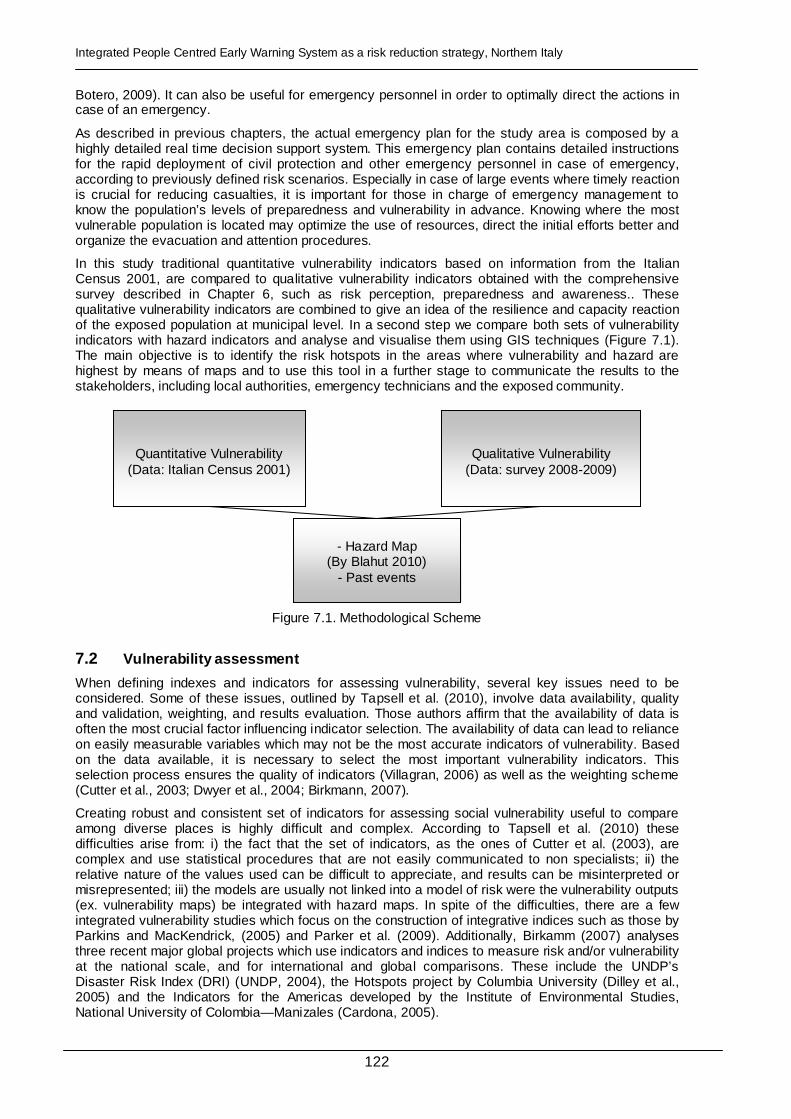
Integrated People Centred Early Warning System as a risk reduction strategy, Northern Italy
122
Botero, 2009). It can also be useful for emergency personnel in order to optimally direct the actions in case of an emergency.
As described in previous chapters, the actual emergency plan for the study area is composed by a highly detailed real time decision support system. This emergency plan contains detailed instructions for the rapid deployment of civil protection and other emergency personnel in case of emergency, according to previously defined risk scenarios. Especially in case of large events where timely reaction is crucial for reducing casualties, it is important for those in charge of emergency management to know the population’s levels of preparedness and vulnerability in advance. Knowing where the most vulnerable population is located may optimize the use of resources, direct the initial efforts better and organize the evacuation and attention procedures.
In this study traditional quantitative vulnerability indicators based on information from the Italian Census 2001, are compared to qualitative vulnerability indicators obtained with the comprehensive survey described in Chapter 6, such as risk perception, preparedness and awareness.. These qualitative vulnerability indicators are combined to give an idea of the resilience and capacity reaction of the exposed population at municipal level. In a second step we compare both sets of vulnerability indicators with hazard indicators and analyse and visualise them using GIS techniques (Figure 7.1). The main objective is to identify the risk hotspots in the areas where vulnerability and hazard are highest by means of maps and to use this tool in a further stage to communicate the results to the stakeholders, including local authorities, emergency technicians and the exposed community.
Figure 7.1. Methodological Scheme
7.2 Vulnerability assessment
When defining indexes and indicators for assessing vulnerability, several key issues need to be considered. Some of these issues, outlined by Tapsell et al. (2010), involve data availability, quality and validation, weighting, and results evaluation. Those authors affirm that the availability of data is often the most crucial factor influencing indicator selection. The availability of data can lead to reliance on easily measurable variables which may not be the most accurate indicators of vulnerability. Based on the data available, it is necessary to select the most important vulnerability indicators. This selection process ensures the quality of indicators (Villagran, 2006) as well as the weighting scheme (Cutter et al., 2003; Dwyer et al., 2004; Birkmann, 2007).
Creating robust and consistent set of indicators for assessing social vulnerability useful to compare among diverse places is highly difficult and complex. According to Tapsell et al. (2010) these difficulties arise from: i) the fact that the set of indicators, as the ones of Cutter et al. (2003), are complex and use statistical procedures that are not easily communicated to non specialists; ii) the relative nature of the values used can be difficult to appreciate, and results can be misinterpreted or misrepresented; iii) the models are usually not linked into a model of risk were the vulnerability outputs (ex. vulnerability maps) be integrated with hazard maps. In spite of the difficulties, there are a few integrated vulnerability studies which focus on the construction of integrative indices such as those by Parkins and MacKendrick, (2005) and Parker et al. (2009). Additionally, Birkamm (2007) analyses three recent major global projects which use indicators and indices to measure risk and/or vulnerability at the national scale, and for international and global comparisons. These include the UNDP’s Disaster Risk Index (DRI) (UNDP, 2004), the Hotspots project by Columbia University (Dilley et al., 2005) and the Indicators for the Americas developed by the Institute of Environmental Studies, National University of Colombia—Manizales (Cardona, 2005).
Quantitative Vulnerability (Data: Italian Census 2001)
Qualitative Vulnerability (Data: survey 2008-2009)
- Hazard Map
(By Blahut 2010) - Past events

Chapter 7: Vulnerability Assessment at municipal scale
123
7.2.1 Quantitative Vulnerability: Census based
Using the available information of the Italian Census of 2001 (Italian Institute of Statistics- ISTAT, 2001) quantitative vulnerability indexes were defined for three kinds of vulnerability: social, physical and economical (Table 7.1). The selected indexes include for Social Vulnerability: population fragility, population density, response household fragility and education; for Economic Vulnerability: employment rate and household economic capacity, and finally, for Physical Vulnerability: dwelling stock fragility.
Table 7.1. Quantitative Vulnerabilities indexes and indicators census based
Quantitative Vulnerabilities Indexes Indicators
Age dependency radio Population Fragility Gender (Household masculinity index)
Population Density Population density
Response Household fragility Family density Index Social Vulnerability
Education Education
Employment rate Employment rate Economic Vulnerability (household scale) Household Economic Capacity Dependence (economic dependence)
Inhabited Dwellings
Total Dwellings Physical Vulnerability Dwelling Stock Fragility
Families per Dwelling
All quantitative vulnerability indexes and indicators were defined based on an extensive analysis of literature about vulnerability assessment (Table 7.2). In order to calculate vulnerability and generate the maps, the indicator values for the 12 Municipalities were normalized, the highest municipal value was replaced by one (1) and the lowest value replaced by 0 (zero). Intermediate values were replaced proportionally between 0 and 1 (Table 7.3). By normalizing the values it was possible to generate maps with relative vulnerability values among the twelve municipalities of the study zone. In order to generate the vulnerability maps, a mean of the different indicators for each vulnerability type was calculated and visually represented in a map.

Integrated People Centred Early Warning System as a risk reduction strategy, Northern Italy
124
Table 7.2. Detailed Quantitative Vulnerabilities census based indexes and indicators, with attributes and references
Quantitative Vulnerabilities
Indexes Indicators Attributes Reference
Age dependency radio (ADP)
% of people (<14 +>65) or (<5 +>65)
Morrow, 1999; Rhodes & Reinholtd, 1998; Granger et al. 1999; Puente, 1999; Ngo, 2001; Tapsell et al. 2005; Cutter et al. 2003; Dwyer et al. 2004; Glade et al. 2005; Botero, 2009; Population
Fragility
Gender (Household masculinity index)
Household masculinity index (% of females)
Granger et al. 1999; Blaikie et al. 1994; Fothergill, 1996; Enarson and Morrow, 1998; Rhodes & Reinholtd, 1998; Morrow, 1999; Puente, 1999; Cutter et al. 2003; Dwyer et al. 2004; Botero, 2009
Population Density Population density Population density (hab/km2) Granger et al. 1999; Dwyer et al. 2004
Response Household fragility
Family density Index
Number of members per family
Blaikie et al. 1994; Rhodes & Reinholtd, 1998; Granger et al. 1999; Puente, 1999; Morrow, 1999; Dwyer et al. 2004
Undergraduate % Rate of undergraduates 19-34 years
Social Vulnerability
Education
Education Non achievement of school index (15-52 years)
Granger et al. 1999; Cutter et al. 2003; Botero, 2009
Employment rate Employment rate % Employment rate (for older than 15 years)
Blaikie et al. 1994; Granger et al. 1999; King & MacGregor, 2000; Dwyer et al. 2004; Tapsell et al. 2005;
Dependence (economic dependence)
% Dependence index (pop <14+>65)/15-64
Morrow, 1999; Botero, 2009; Cutter et al. 2003; Dwyer et al. 2004; King & MacGregor, 2000
Economic vulnerability (analyzed only for household) Household
Economic Capacity Family density
Index Number of members per family Morrow, 1999; Dwyer et al. 2004; Granger et al. 1999; Blaikie et al. 1994; Puente, 1999
Inhabited Dwellings
Number of inhabited dwellings (according to the type of locality: inhabit centre-group of buildings, well developed with independent services; inhabit nucleus: group of buildings without independent services; sparse houses
Bolin & Stanford, 1991; Morrow, 1999; Puente, 1999; Dwyer et al. 2004; Granger et al. 1999; King & MacGregor, 2000; Cutter et al. 2003; Botero, 2009
Total Dwellings Number of Dwellings Granger et al. 1999; King & MacGregor, 2000; Dwyer et al. 2004
Physical vulnerability
Dwelling Stock Fragility
Families per Dwelling
Number of families per Dwellings
Granger et al. 1999; King & MacGregor, 2000; Cutter et al. 2003; Dwyer et al. 2004

Chapter 7: Vulnerability Assessment at municipal scale
125
Table 7.3. Example of the normalization of the vulnerability indicators values.
Municipality Age
dependency ratio
Age dependency ratio
normalized
Population Density
(hab/km2)
Population Density
(hab/km2) normalized
Household Masculinity
index
Household Masculinity index
normalized
Aprica 0,304 0,000 78,000 0,227 0,528 0,904
Bianzone 0,342 0,447 71,000 0,200 0,525 0,837
Grosio 0,336 0,375 38,000 0,073 0,521 0,747
Grosotto 0,363 0,695 32,000 0,050 0,525 0,826
Lovero 0,351 0,557 47,000 0,108 0,501 0,277
Mazzo di Valtellina 0,337 0,389 68,000 0,188 0,510 0,488
Sernio 0,339 0,418 46,000 0,104 0,533 1,000
Teglio 0,343 0,465 42,000 0,088 0,506 0,404
Tirano 0,329 0,294 279,000 1,000 0,520 0,717
Tovo di Sant'Agata 0,329 0,293 52,000 0,127 0,489 0,000
Vervio 0,389 1,000 19,000 0,000 0,523 0,782
Villa di Tirano 0,353 0,583 121,000 0,392 0,517 0,642
The maps obtained for the quantitative relative social vulnerability, economic and physical vulnerability, together with their indexes are presented in Figure 7.2, Figure 7.3 and Figure 7.4 respectively.
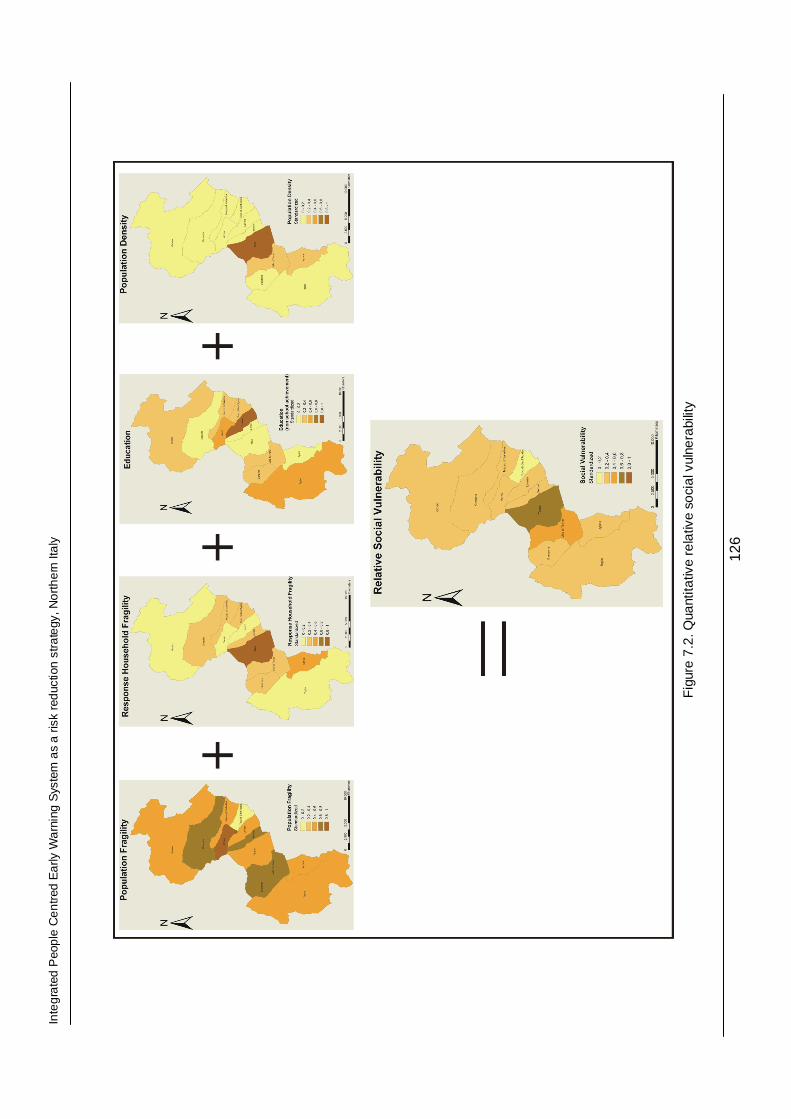
Inte
gra
ted
Peo
ple
Ce
ntr
ed E
arly
Wa
rnin
g S
yste
m a
s a
risk
red
uctio
n s
tra
tegy
, No
rth
ern
Ita
ly
12
6
F
igur
e 7.
2. Q
uant
itativ
e re
lativ
e so
cial
vul
nera
bilit
y

Cha
pte
r 7
: Vul
ne
rabi
lity
Ass
essm
ent a
t mu
nici
pal s
cale
12
7
Fig
ure
7.3.
Qua
ntita
tive
rela
tive
econ
omic
vul
nera
bilit
y

Inte
gra
ted
Peo
ple
Ce
ntr
ed E
arly
Wa
rnin
g S
yste
m a
s a
risk
red
uctio
n s
tra
tegy
, No
rth
ern
Ita
ly
12
8
F
igur
e 7.
4. Q
uant
itativ
e re
lativ
e ph
ysic
al v
ulne
rabi
lity
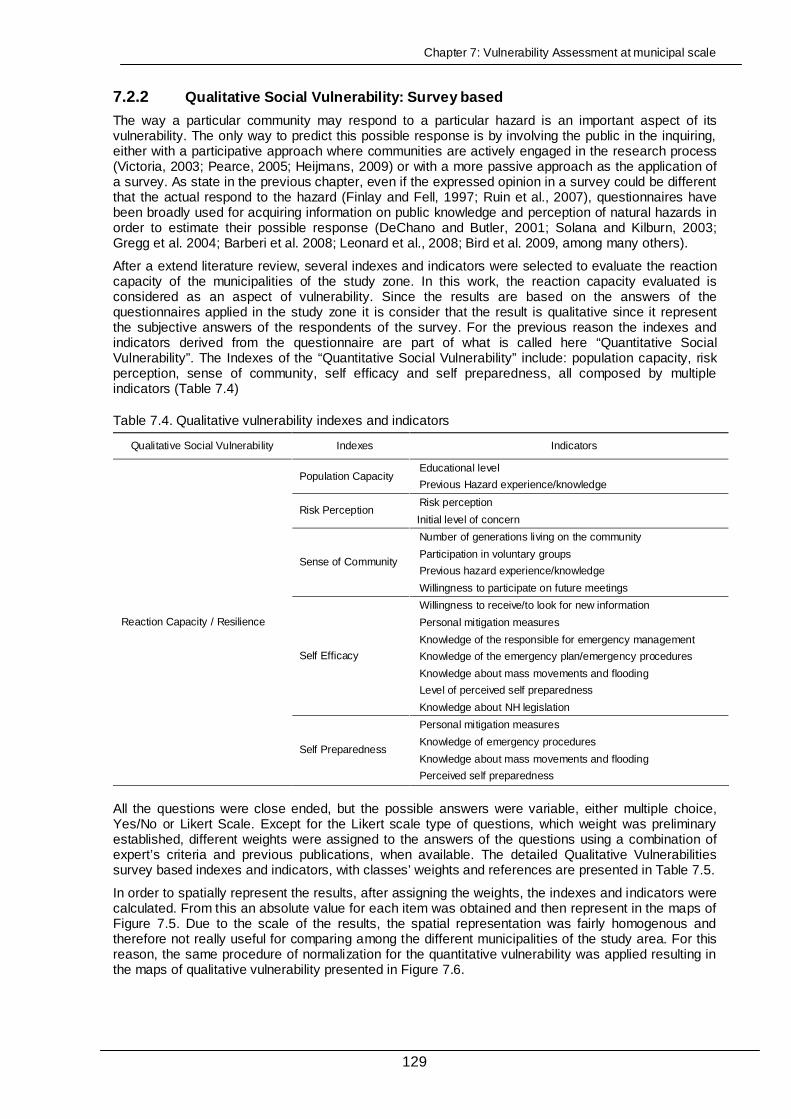
Chapter 7: Vulnerability Assessment at municipal scale
129
7.2.2 Qualitative Social Vulnerability: Survey based
The way a particular community may respond to a particular hazard is an important aspect of its vulnerability. The only way to predict this possible response is by involving the public in the inquiring, either with a participative approach where communities are actively engaged in the research process (Victoria, 2003; Pearce, 2005; Heijmans, 2009) or with a more passive approach as the application of a survey. As state in the previous chapter, even if the expressed opinion in a survey could be different that the actual respond to the hazard (Finlay and Fell, 1997; Ruin et al., 2007), questionnaires have been broadly used for acquiring information on public knowledge and perception of natural hazards in order to estimate their possible response (DeChano and Butler, 2001; Solana and Kilburn, 2003; Gregg et al. 2004; Barberi et al. 2008; Leonard et al., 2008; Bird et al. 2009, among many others).
After a extend literature review, several indexes and indicators were selected to evaluate the reaction capacity of the municipalities of the study zone. In this work, the reaction capacity evaluated is considered as an aspect of vulnerability. Since the results are based on the answers of the questionnaires applied in the study zone it is consider that the result is qualitative since it represent the subjective answers of the respondents of the survey. For the previous reason the indexes and indicators derived from the questionnaire are part of what is called here “Quantitative Social Vulnerability”. The Indexes of the “Quantitative Social Vulnerability” include: population capacity, risk perception, sense of community, self efficacy and self preparedness, all composed by multiple indicators (Table 7.4)
Table 7.4. Qualitative vulnerability indexes and indicators
Qualitative Social Vulnerability Indexes Indicators
Educational level Population Capacity
Previous Hazard experience/knowledge
Risk perception Risk Perception
Initial level of concern
Number of generations living on the community
Participation in voluntary groups
Previous hazard experience/knowledge Sense of Community
Willingness to participate on future meetings
Willingness to receive/to look for new information
Personal mitigation measures
Knowledge of the responsible for emergency management
Knowledge of the emergency plan/emergency procedures
Knowledge about mass movements and flooding
Level of perceived self preparedness
Self Efficacy
Knowledge about NH legislation
Personal mitigation measures
Knowledge of emergency procedures
Knowledge about mass movements and flooding
Reaction Capacity / Resilience
Self Preparedness
Perceived self preparedness
All the questions were close ended, but the possible answers were variable, either multiple choice, Yes/No or Likert Scale. Except for the Likert scale type of questions, which weight was preliminary established, different weights were assigned to the answers of the questions using a combination of expert’s criteria and previous publications, when available. The detailed Qualitative Vulnerabilities survey based indexes and indicators, with classes’ weights and references are presented in Table 7.5.
In order to spatially represent the results, after assigning the weights, the indexes and indicators were calculated. From this an absolute value for each item was obtained and then represent in the maps of Figure 7.5. Due to the scale of the results, the spatial representation was fairly homogenous and therefore not really useful for comparing among the different municipalities of the study area. For this reason, the same procedure of normalization for the quantitative vulnerability was applied resulting in the maps of qualitative vulnerability presented in Figure 7.6.
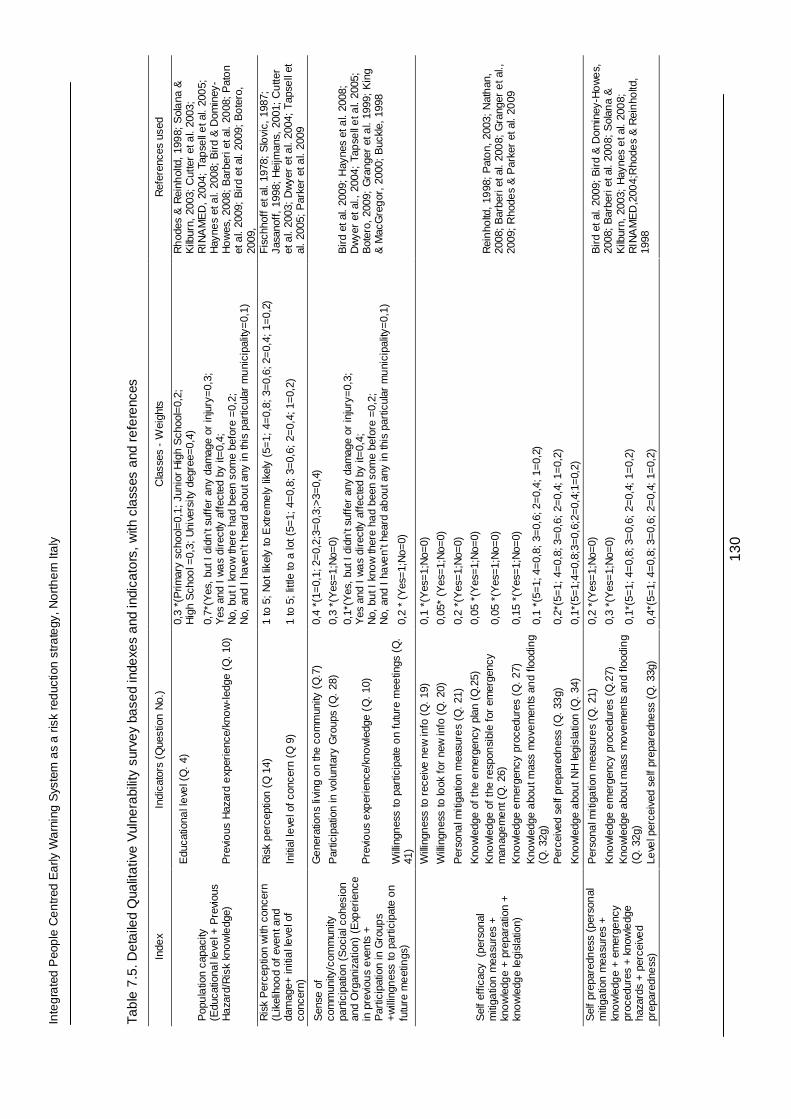
Inte
gra
ted
Peo
ple
Ce
ntr
ed E
arly
Wa
rnin
g S
yste
m a
s a
risk
red
uctio
n s
tra
tegy
, No
rth
ern
Ita
ly
13
0
Tabl
e 7.
5. D
etai
led
Qua
litat
ive
Vul
nera
bilit
y su
rvey
bas
ed in
dexe
s an
d in
dica
tors
, with
cla
sses
and
ref
eren
ces
Inde
x
Indi
cato
rs (
Que
stio
n N
o.)
Cla
sses
- W
eigh
ts
Ref
eren
ces
used
Edu
catio
nal l
eve
l (Q
. 4)
0,
3 *(
Prim
ary
scho
ol=
0,1;
Jun
ior
Hig
h S
choo
l=0,
2;
Hig
h S
choo
l =0,
3; U
nive
rsity
deg
ree=
0,4)
P
opu
latio
n ca
paci
ty
(Edu
catio
nal l
eve
l + P
revi
ous
Ha
zard
/Ris
k kn
ow
ledg
e)
Pre
vio
us H
azar
d e
xper
ienc
e/kn
ow
-led
ge (
Q.
10)
0,7*
(Yes
, bu
t I d
idn’
t suf
fer
any
dam
age
or in
jury
=0,
3;
Yes
and
I w
as
dire
ctly
aff
ecte
d by
it=
0,4;
N
o, b
ut I
kno
w th
ere
had
been
som
e be
fore
=0,
2;
No,
and
I h
ave
n’t h
eard
ab
out a
ny in
this
par
ticul
ar m
uni
cipa
lity=
0,1)
Rh
odes
& R
einh
oltd
, 19
98;
Sol
ana
&
Kilb
urn,
200
3; C
utte
r et
al.
2003
; R
INA
ME
D,
2004
; Ta
pse
ll e
t al.
200
5;
Hay
nes
et a
l. 20
08;
Bir
d &
Dom
iney
-H
ow
es,
2008
; B
arbe
ri e
t al.
2008
; P
ato
n et
al.
2009
; B
ird
et a
l. 20
09;
Bo
tero
, 20
09,
R
isk
per
cept
ion
(Q 1
4)
1 to
5;
No
t lik
ely
to E
xtre
me
ly li
kely
(5=
1; 4
=0,
8; 3
=0,
6; 2
=0,
4; 1
=0,
2)
Ris
k P
erce
ptio
n w
ith c
once
rn
(Lik
elih
ood
of e
ven
t and
da
mag
e+ in
itia
l le
vel o
f co
ncer
n)
Initi
al le
vel o
f co
ncer
n (Q
9)
1 to
5;
little
to a
lot (
5=1;
4=
0,8;
3=
0,6;
2=
0,4;
1=
0,2)
Fis
chho
ff e
t al.
1978
; S
lovi
c, 1
987;
Ja
sano
ff,
1998
; H
eijm
ans,
200
1; C
utte
r et
al.
2003
; D
wye
r et
al.
2004
; T
apse
ll et
al
. 20
05;
Par
ker
et a
l. 20
09
Ge
nera
tion
s liv
ing
on
the
com
mun
ity (
Q.7
) 0,
4 *(
1=0,
1; 2
=0,
2;3=
0,3;
>3=
0,4)
Par
ticip
atio
n in
vol
unta
ry G
roup
s (Q
. 28
) 0,
3 *(
Yes
=1;
No=
0)
Pre
vio
us e
xper
ienc
e/kn
ow
ledg
e (Q
. 10
)
0,1*
(Yes
, bu
t I d
idn’
t suf
fer
any
dam
age
or in
jury
=0,
3;
Yes
and
I w
as
dire
ctly
aff
ecte
d by
it=
0,4;
N
o, b
ut I
kno
w th
ere
had
been
som
e be
fore
=0,
2;
No,
and
I h
ave
n’t h
eard
ab
out a
ny in
this
par
ticul
ar m
uni
cipa
lity=
0,1)
Sen
se o
f co
mm
unity
/com
mun
ity
part
icip
atio
n (S
ocia
l coh
esio
n an
d O
rgan
izat
ion)
(E
xper
ienc
e in
pre
viou
s e
ven
ts +
P
artic
ipat
ion
in G
roup
s +
will
ingn
ess
to p
artic
ipat
e o
n fu
ture
me
etin
gs)
Will
ingn
ess
to p
artic
ipat
e o
n fu
ture
mee
tings
(Q
. 41
) 0,
2 *
(Yes
=1;
No=
0)
Bir
d et
al.
2009
; H
ayne
s et
al.
2008
; D
wye
r et
al.,
200
4; T
apse
ll e
t al.
2005
; B
oter
o, 2
009;
Gra
nger
et a
l. 19
99;
Kin
g &
Mac
Gre
gor
, 20
00;
Buc
kle,
199
8
Will
ingn
ess
to r
ecei
ve n
ew
info
(Q
. 19
) 0,
1 *(
Yes
=1;
No=
0)
Will
ingn
ess
to lo
ok f
or n
ew in
fo (
Q.
20)
0,05
* (Y
es=
1;N
o=0)
Per
sona
l miti
gatio
n m
easu
res
(Q.
21)
0,2
*(Y
es=
1;N
o=0)
Kno
wle
dge
of t
he e
mer
genc
y pl
an (
Q.2
5)
0,05
*(Y
es=
1;N
o=0)
K
now
ledg
e of
the
res
pon
sibl
e fo
r em
erge
ncy
man
age
me
nt (
Q.
26)
0,05
*(Y
es=
1;N
o=0)
Kno
wle
dge
em
erge
ncy
proc
edur
es (
Q.
27)
0,15
*(Y
es=
1;N
o=0)
K
now
ledg
e a
bou
t mas
s m
ove
men
ts a
nd
flood
ing
(Q.
32g)
0,
1 *(
5=1;
4=
0,8;
3=
0,6;
2=
0,4;
1=
0,2)
Per
ceiv
ed s
elf
prep
ared
nes
s (Q
. 33
g)
0,2*
(5=
1; 4
=0,
8; 3
=0,
6; 2
=0,
4; 1
=0,
2)
Sel
f ef
ficac
y (
pers
onal
m
itiga
tion
mea
sure
s +
kn
ow
ledg
e +
pre
para
tion
+
kno
wle
dge
legi
slat
ion)
Kno
wle
dge
abo
ut
NH
legi
sla
tion
(Q.
34)
0,1*
(5=
1;4=
0,8;
3=0,
6;2=
0,4;
1=0,
2)
Rei
nho
ltd,
1998
; P
ato
n, 2
003;
Nat
han
, 20
08;
Bar
beri
et a
l. 20
08;
Gra
nger
et a
l.,
2009
; R
hode
s &
Par
ker
et a
l. 20
09
Per
sona
l miti
gatio
n m
easu
res
(Q.
21)
0,2
*(Y
es=
1;N
o=0)
Kno
wle
dge
em
erge
ncy
proc
edur
es (
Q.2
7)
0,3
*(Y
es=
1;N
o=0)
K
now
ledg
e a
bou
t mas
s m
ove
men
ts a
nd
flood
ing
(Q.
32g)
0,
1*(5
=1;
4=
0,8;
3=
0,6;
2=
0,4;
1=
0,2)
Sel
f pr
epar
edn
ess
(per
son
al
miti
gatio
n m
easu
res
+
kno
wle
dge
+ e
mer
genc
y pr
oced
ures
+ k
now
ledg
e ha
zard
s +
per
ceiv
ed
prep
ared
ness
) Le
vel p
erce
ived
se
lf pr
epar
edne
ss (
Q.
33g)
0,
4*(5
=1;
4=
0,8;
3=
0,6;
2=
0,4;
1=
0,2)
Bir
d et
al.
2009
; B
ird
& D
omin
ey-H
ow
es,
20
08;
Bar
beri
et a
l. 20
08;
Sol
ana
&
Kilb
urn,
200
3; H
ayne
s e
t al.
200
8;
RIN
AM
ED
,200
4;R
hode
s &
Rei
nho
ltd,
1998
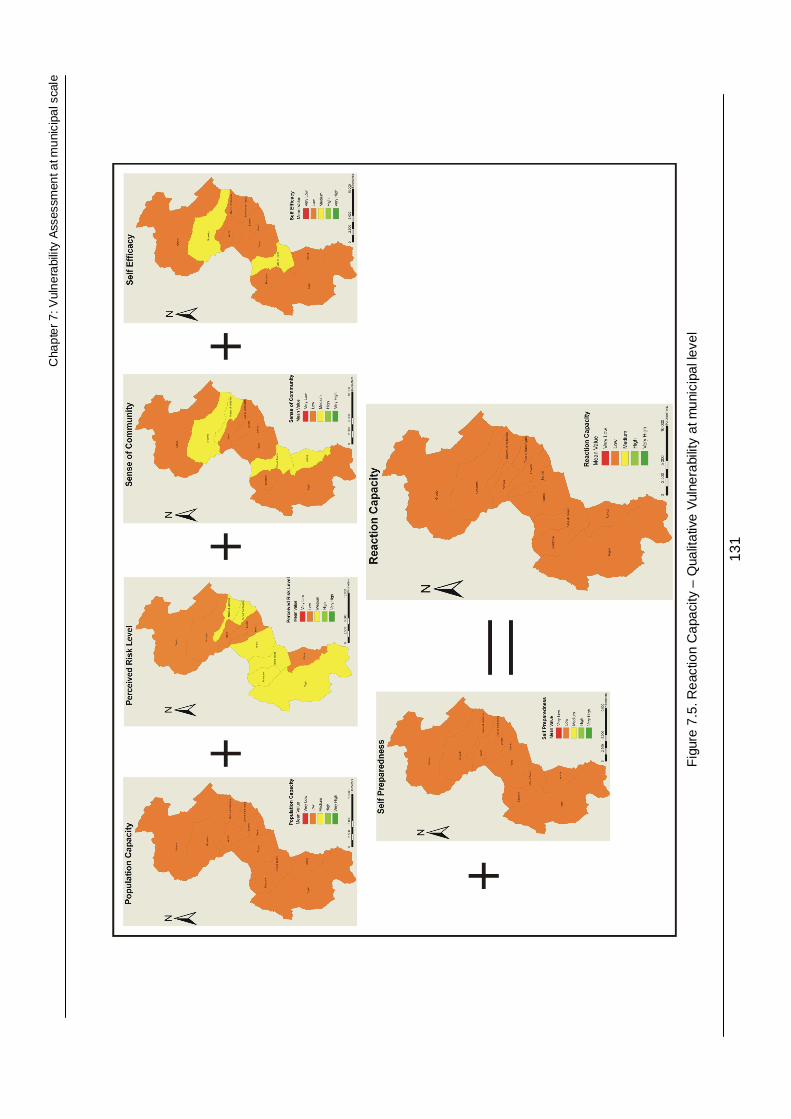
Cha
pte
r 7
: Vul
ne
rabi
lity
Ass
essm
ent a
t mu
nici
pal s
cale
13
1
Fig
ure
7.5.
Rea
ctio
n C
apac
ity –
Qua
litat
ive
Vul
nera
bilit
y at
mun
icip
al le
vel
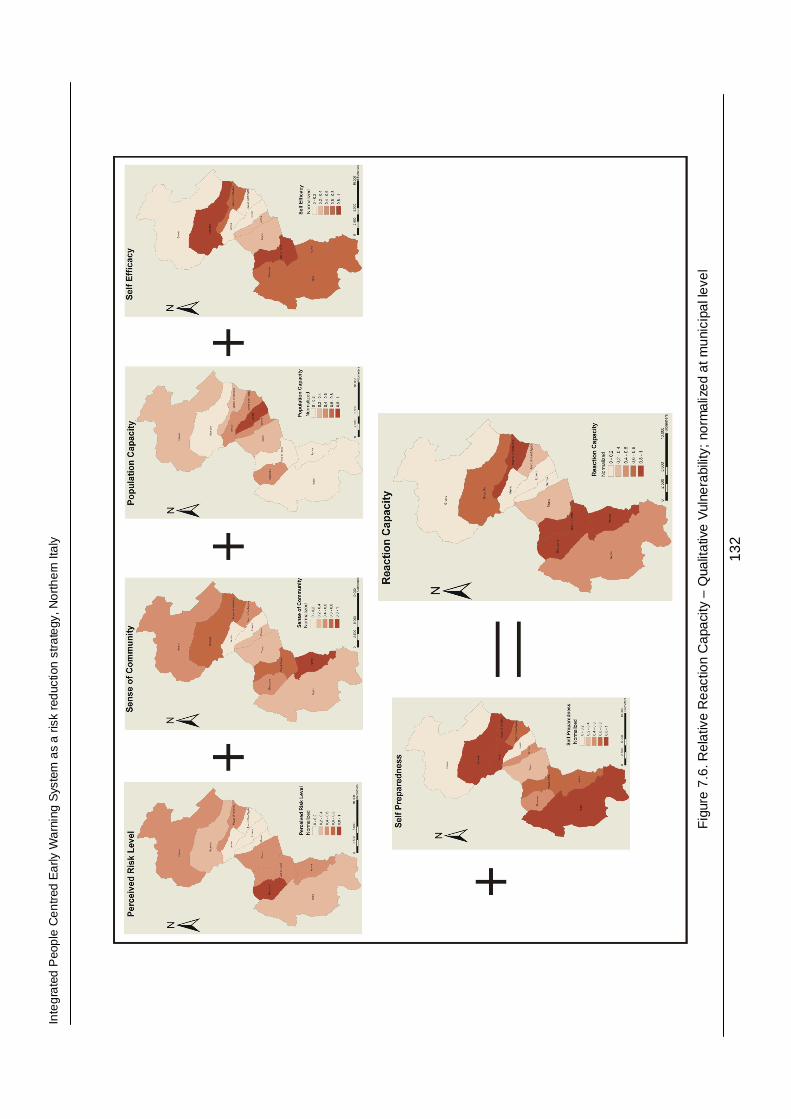
Inte
gra
ted
Peo
ple
Ce
ntr
ed E
arly
Wa
rnin
g S
yste
m a
s a
risk
red
uctio
n s
tra
tegy
, No
rth
ern
Ita
ly
13
2
F
igur
e 7.
6. R
elat
ive
Rea
ctio
n C
apac
ity –
Qua
litat
ive
Vul
nera
bilit
y; n
orm
aliz
ed a
t mun
icip
al le
vel
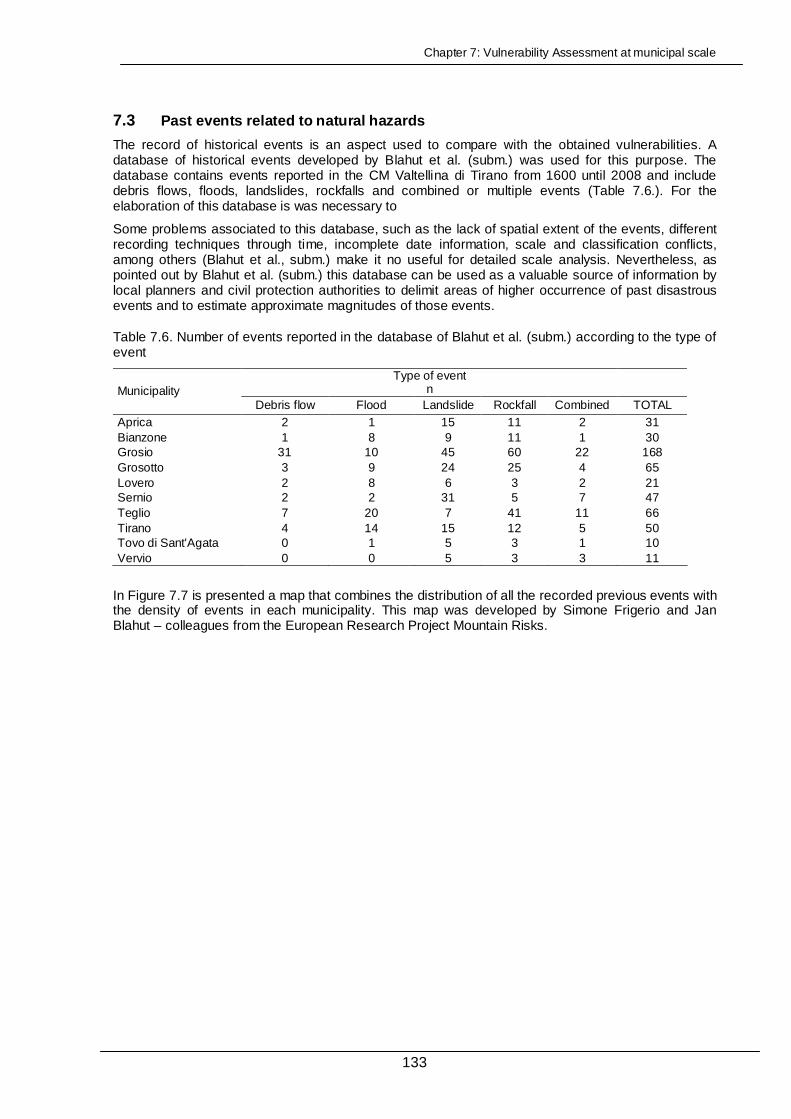
Chapter 7: Vulnerability Assessment at municipal scale
133
7.3 Past events related to natural hazards
The record of historical events is an aspect used to compare with the obtained vulnerabilities. A database of historical events developed by Blahut et al. (subm.) was used for this purpose. The database contains events reported in the CM Valtellina di Tirano from 1600 until 2008 and include debris flows, floods, landslides, rockfalls and combined or multiple events (Table 7.6.). For the elaboration of this database is was necessary to
Some problems associated to this database, such as the lack of spatial extent of the events, different recording techniques through time, incomplete date information, scale and classification conflicts, among others (Blahut et al., subm.) make it no useful for detailed scale analysis. Nevertheless, as pointed out by Blahut et al. (subm.) this database can be used as a valuable source of information by local planners and civil protection authorities to delimit areas of higher occurrence of past disastrous events and to estimate approximate magnitudes of those events.
Table 7.6. Number of events reported in the database of Blahut et al. (subm.) according to the type of event
Type of event n
Municipality
Debris flow Flood Landslide Rockfall Combined TOTAL Aprica 2 1 15 11 2 31 Bianzone 1 8 9 11 1 30 Grosio 31 10 45 60 22 168 Grosotto 3 9 24 25 4 65 Lovero 2 8 6 3 2 21 Sernio 2 2 31 5 7 47 Teglio 7 20 7 41 11 66 Tirano 4 14 15 12 5 50 Tovo di Sant'Agata 0 1 5 3 1 10 Vervio 0 0 5 3 3 11
In Figure 7.7 is presented a map that combines the distribution of all the recorded previous events with the density of events in each municipality. This map was developed by Simone Frigerio and Jan Blahut – colleagues from the European Research Project Mountain Risks.

Integrated People Centred Early Warning System as a risk reduction strategy, Northern Italy
134
Figure 7.7. Map of the municipal distribution of the debris flow events and density of events (Provided by Blahut and Frigerio, 2010)
The same data of the total number of events and density of events in each municipality is represented in a graphic in Figure 7.8. In the graphic, it is possible to see that even if Sernio presents the highest density of events, the amount of events it presents is much lower than the municipalities of Grosio and Teglio which, followed by Grosotto and Tirano, present the highest amount of events.
Figure 7.8. Number of debris flow events vs. density of events in each municipality (Data provided by
Blahut and Frigerio, 2010)
A more detailed representation is shown in Figure 7.9 with a map of past events differentiating the type of event: flood, debris flow, landslide, rockfall and combined events.
Legend
Historical events
Municipal boundaries
Density of events
4.6 events / km^2
0.9 events / km^2
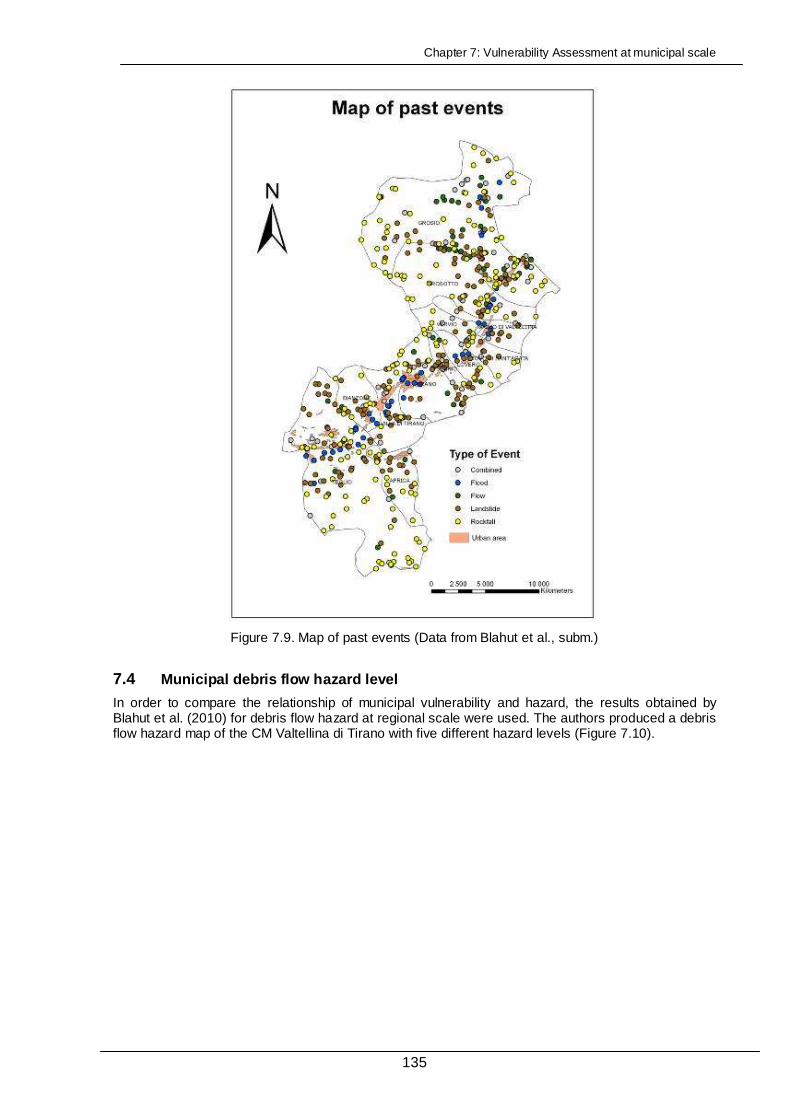
Chapter 7: Vulnerability Assessment at municipal scale
135
Figure 7.9. Map of past events (Data from Blahut et al., subm.)
7.4 Municipal debris flow hazard level
In order to compare the relationship of municipal vulnerability and hazard, the results obtained by Blahut et al. (2010) for debris flow hazard at regional scale were used. The authors produced a debris flow hazard map of the CM Valtellina di Tirano with five different hazard levels (Figure 7.10).
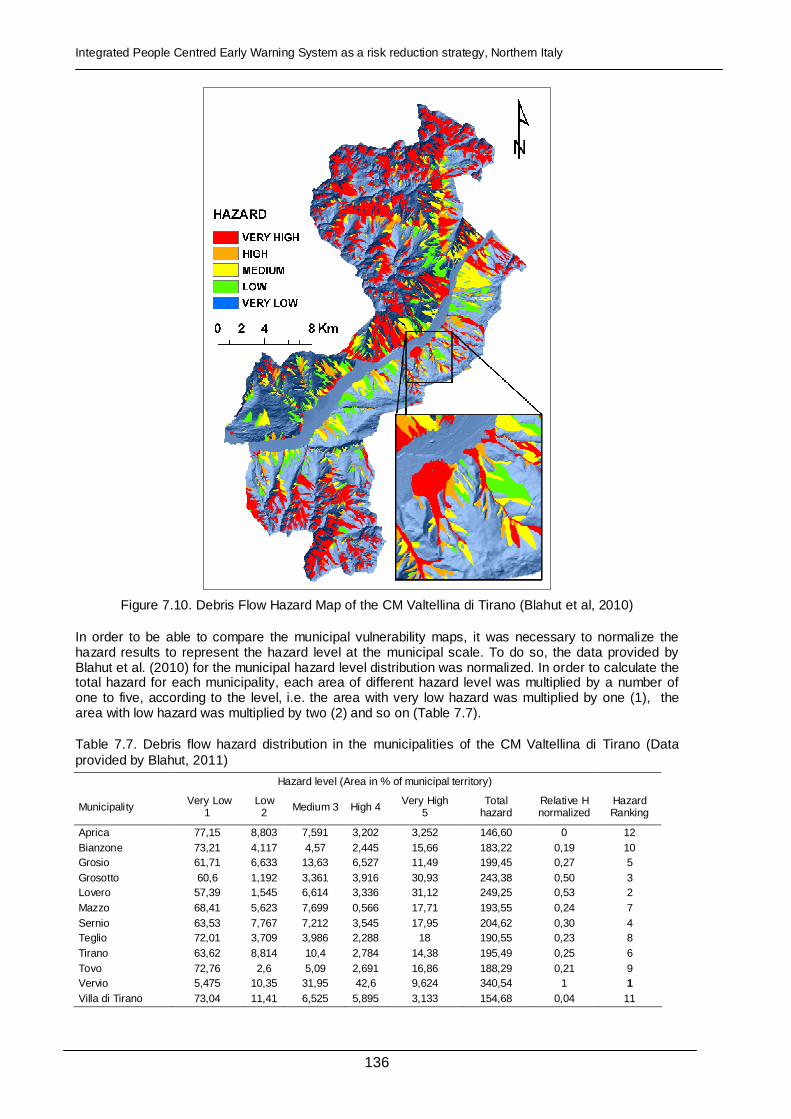
Integrated People Centred Early Warning System as a risk reduction strategy, Northern Italy
136
Figure 7.10. Debris Flow Hazard Map of the CM Valtellina di Tirano (Blahut et al, 2010)
In order to be able to compare the municipal vulnerability maps, it was necessary to normalize the hazard results to represent the hazard level at the municipal scale. To do so, the data provided by Blahut et al. (2010) for the municipal hazard level distribution was normalized. In order to calculate the total hazard for each municipality, each area of different hazard level was multiplied by a number of one to five, according to the level, i.e. the area with very low hazard was multiplied by one (1), the area with low hazard was multiplied by two (2) and so on (Table 7.7).
Table 7.7. Debris flow hazard distribution in the municipalities of the CM Valtellina di Tirano (Data provided by Blahut, 2011)
Hazard level (Area in % of municipal territory)
Municipality Very Low
1 Low
2 Medium 3 High 4 Very High
5 Total
hazard Relative H normalized
Hazard Ranking
Aprica 77,15 8,803 7,591 3,202 3,252 146,60 0 12 Bianzone 73,21 4,117 4,57 2,445 15,66 183,22 0,19 10 Grosio 61,71 6,633 13,63 6,527 11,49 199,45 0,27 5 Grosotto 60,6 1,192 3,361 3,916 30,93 243,38 0,50 3 Lovero 57,39 1,545 6,614 3,336 31,12 249,25 0,53 2 Mazzo 68,41 5,623 7,699 0,566 17,71 193,55 0,24 7 Sernio 63,53 7,767 7,212 3,545 17,95 204,62 0,30 4 Teglio 72,01 3,709 3,986 2,288 18 190,55 0,23 8 Tirano 63,62 8,814 10,4 2,784 14,38 195,49 0,25 6 Tovo 72,76 2,6 5,09 2,691 16,86 188,29 0,21 9 Vervio 5,475 10,35 31,95 42,6 9,624 340,54 1 1 Villa di Tirano 73,04 11,41 6,525 5,895 3,133 154,68 0,04 11
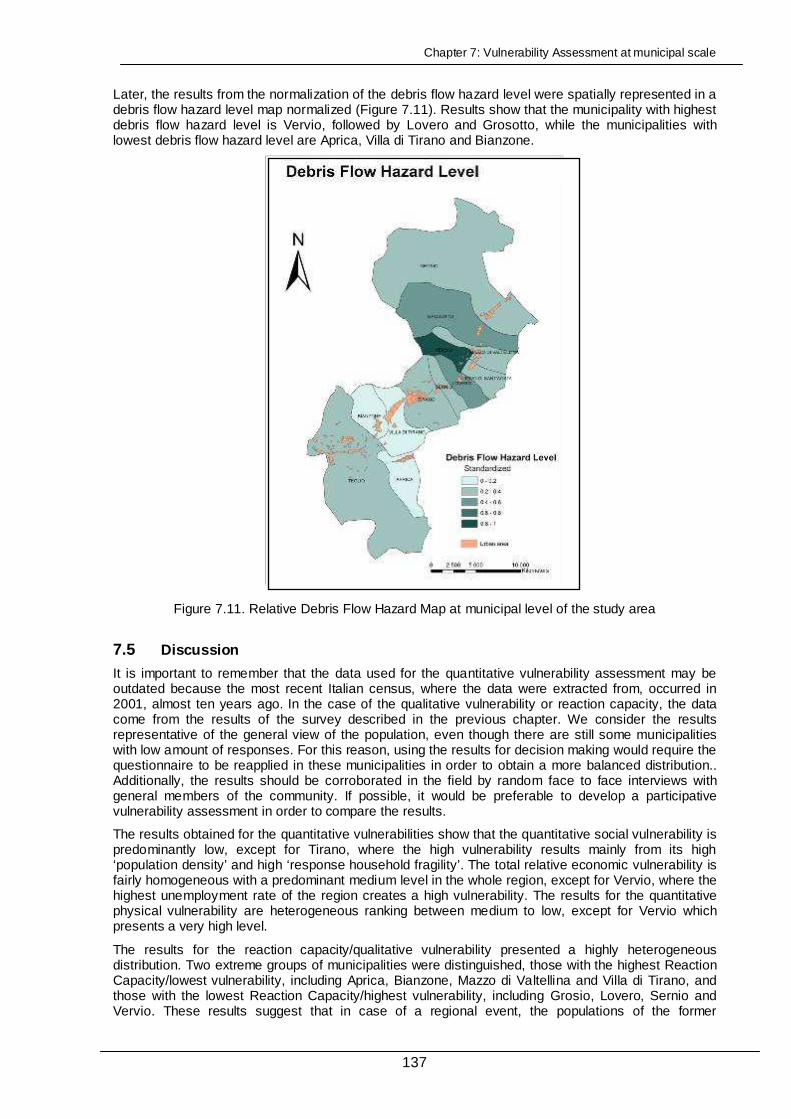
Chapter 7: Vulnerability Assessment at municipal scale
137
Later, the results from the normalization of the debris flow hazard level were spatially represented in a debris flow hazard level map normalized (Figure 7.11). Results show that the municipality with highest debris flow hazard level is Vervio, followed by Lovero and Grosotto, while the municipalities with lowest debris flow hazard level are Aprica, Villa di Tirano and Bianzone.
Figure 7.11. Relative Debris Flow Hazard Map at municipal level of the study area
7.5 Discussion
It is important to remember that the data used for the quantitative vulnerability assessment may be outdated because the most recent Italian census, where the data were extracted from, occurred in 2001, almost ten years ago. In the case of the qualitative vulnerability or reaction capacity, the data come from the results of the survey described in the previous chapter. We consider the results representative of the general view of the population, even though there are still some municipalities with low amount of responses. For this reason, using the results for decision making would require the questionnaire to be reapplied in these municipalities in order to obtain a more balanced distribution.. Additionally, the results should be corroborated in the field by random face to face interviews with general members of the community. If possible, it would be preferable to develop a participative vulnerability assessment in order to compare the results.
The results obtained for the quantitative vulnerabilities show that the quantitative social vulnerability is predominantly low, except for Tirano, where the high vulnerability results mainly from its high ‘population density’ and high ‘response household fragility’. The total relative economic vulnerability is fairly homogeneous with a predominant medium level in the whole region, except for Vervio, where the highest unemployment rate of the region creates a high vulnerability. The results for the quantitative physical vulnerability are heterogeneous ranking between medium to low, except for Vervio which presents a very high level.
The results for the reaction capacity/qualitative vulnerability presented a highly heterogeneous distribution. Two extreme groups of municipalities were distinguished, those with the highest Reaction Capacity/lowest vulnerability, including Aprica, Bianzone, Mazzo di Valtellina and Villa di Tirano, and those with the lowest Reaction Capacity/highest vulnerability, including Grosio, Lovero, Sernio and Vervio. These results suggest that in case of a regional event, the populations of the former

Integrated People Centred Early Warning System as a risk reduction strategy, Northern Italy
138
municipalities are better prepared to respond efficiently, while the populations of the latter are those less prepared to properly respond.
In order to facilitate the comparison among the different vulnerabilities and hazard, a table was created with the different relative levels (Table 7.8). The levels were divided in five (5) different classes, from Very Low (0-0.2; including the municipalities with the lowest value in each variable), to Very High (0,8-1; including the municipalities with the highest value in each variable). In the table it is possible to observe and compare the different levels of relative vulnerability to the debris flow hazard which can give an idea of the levels of risk. It is important to remember that the represented values are not absolute values but more a comparison among the extreme lowest and highest values of the different municipalities. The table shows that the municipality that presents the worse combination is Vervio, which has a very low reaction capacity, very high physical vulnerability and very high debris flow hazard. Tirano, the capital of the Mountain Consortium and the municipality with highest population, has a particular strategic importance. This municipality has high quantitative social vulnerability and low reaction capacity.
Table 7.8. Comparative table of vulnerabilities, hazard and reaction capacity of the CM Valtellina di Tirano
*Note: the colours scale of the reaction capacity is inverse since its relation with the vulnerability is inverse, i.e. the higher reaction capacity the lower vulnerability is present.
7.6 Conclusions
Relationships between the quantitative and qualitative population vulnerability, hazard levels and distribution of past events as well as the reaction capacity levels of the exposed population are presented in this chapter.
Factors such as community's risk perception and preparedness are usually not used as inputs for geographic representation of risk, nevertheless there are possibilities to retrieve and spatially represent this information. Displaying survey-derived indicators for capacity reaction and vulnerability in spatial formats (maps) can improve the risk communication processes among authorities, scientists and local communities, as well as enhance the decision-making processes and help to prioritize risk reduction actions.
Municipalities in mountainous communities can make use of quantitative and qualitative indicators to homogenize their hazard, vulnerability and risk assessments to take coordinated risk reduction decisions and actions.
Surveys allow examination of a community's own unique circumstances, in order to test and adapt the best practices and solutions for that community’s needs. However, when possible, further work should be done involving the people in a more active way, so that local communities may assess their own vulnerability and create their own solutions with regard to natural hazards.
Municipality Quant Social Vulnerability
Quant Economic Vulnerability
Quant Physical Vulnerability
Reaction Capacity*
Debris Flow
Hazard
Aprica L L VL VH VL
Bianzone L M L VH VL
Grosio L M VL VL L
Grosotto L M M H M
Lovero L L L VL M
Mazzo di Valtellina L L M VH L
Sernio L M L VL L
Teglio L M L M L
Tirano H M VL L L
Tovo di Sant'Agata VL VL M L L
Vervio L H VH VL VH
Villa di Tirano M M M VH VL
Chapter 7: Vulnerability Assessment at municipal scale
139
7.7 References
Barberi F., Davis, M.S. Isaia, M.S., Nave, R. and Ricci, T. 2008. Volcanic risk perception in the Vesuvius population. Special issue on "Volcanic Risk Perception", Journal of Volcanology and Geothermal Research 172 (3-4): 244-258.
Bird, D. and Dominey-Howes, D. 2008. Testing the use of a `questionnaire survey instrument' in investigate public perceptions of tsunami hazard and risk in Sydney, Australia. Natural Hazards 45: 99-122
Bird, D.K., Gisladottir, G., and Dominey-Howes, D. 2009. Resident perception of volcanic hazards and evacuation procedures, Nat. Hazards Earth Syst. Sci. 9: 251-266
Birkmann, J. (ed) 2006. Measuring vulnerability to natural hazards: Towards disaster resilient societies. United Nations University Press: New York
Birkmann, J. 2007. Risk and vulnerability indicators at different scales: Applicability, usefulness and policy implications. Environmental Hazards 7: 20–31
Blaikie, P., Cannon, T., Davis, I. and Wisner, B. 1994. At Risk: Natural Hazards, People’s Vulnerability and Disasters. Routledge, London, UK.
Blahut, J., Horton, P., Sterlacchini, S. and Jaboyedoff, M. 2010. Debris flow hazard modelling on medium scale: Valtellina di Tirano, Italy. Nat. Hazards Earth Syst. Sci. 10: 2379–2390
Blahut, J., Poretti, I., Sterlacchini, S. and De Amicis, M. (submitted). Database of historical disasters for Civil Protection Purposes. Natural Hazards
Bolin, R., and L. Stanford. 1991. Shelter, Housing and Recovery: A Comparison of US Disasters. Disasters 15(1):24–34
Botero, V. 2009. Geo-information for measuring vulnerability to earthquakes: a fitness for use approach. Enschede. University of Utrecht. ITC Dissertation 158, 191 p.
Buckle, P. 1998. Re-defining Community and Vulnerability in the context of Emergency Management. Australian Journal of Emergency Management, 13(1):21–26.
Burton, I., Kates, R. W., and White, G. F. 1993. The Environment as Hazard, 2nd ed.. New York: Guildford
Cardona, O.D., 2005. Indicators of disaster risk and risk management— main technical report. IDB/IDEA Program of Indicators for Disaster Risk Management, National University of Colombia, Manizales. Online 22/11/09 http://idea.unalmzl.edu.co
Cutter, S. L., Mitchell, J. T. and Scott, M. S. 2000. Revealing the Vulnerability of People and Places: A Case Study of Georgetown County, South Carolina. Annals of the Association of American Geographers 90(4):713–37.
Cutter, S.L., Boruff, B.J. and Shirley, W.L. 2003. Social Vulnerability to Environmental Hazards. Social Science Quarterly 84(1): 242-261
De Chano, L.M. and Butler, D.R. 2001 Analysis of public perception of debris flow hazard. Disaster Prevention and Management 10: 261–269.
Dilley, M., Chen, R.S., Deichmann, U., Lerner-Lam, A., Arnold, M., 2005. Natural Disaster Hotspots. A Global Risk Analysis. The World Bank, Hazard Management Unit, Washington, DC.
Dwyer, A., Zoppou, C., Nielsen, O., Day, S. & Roberts, S. 2004. Quantifying Social Vulnerability: A methodology for identifying those at risk to natural hazards. GeoCat No. 61168, Geoscience Australia.
Enarson, E., and Morrow, B. 1998. The Gendered Terrain of Disaster. New York: Praeger.
Fischhoff, B., Lichtenstein, P., Read, S. and Combs, B. 1978. How Safe is Safe Enough? A Psychometric Study of attitudes towards technological risks and benefits. Policy Sciences, 9:127–152.
Fothergill, A. 1996. ‘Gender, Risk, and Disaster. International Journal of Mass 14(1):33–56.
Glade, T.; Anderson, M. and Crozier, M. 2005. Landslide hazard and risk. John Wiley & Sons Ltd. Chichester: 802 p.
Granger, K., Jones, T. and Scott, G. 1999. Community Risk in Cairns: a multi-hazard risk assessment. Technical report, Geoscience Australia, Commonwealth Government of Australia, Canberra, Australia.
Gregg, C. E., Houghton, B. F., Paton, D., Swanson, D. A., and Johnston, D. M. 2004. Community preparedness for lava flows from Mauna Loa and Hualalai volcanoes, Kona, Hawai’i, B. Volcanol., 66, 531–540.
Haynes, K, Barclay, J and Pidgeon, N 2008. Whose reality counts? Factors affecting the perception of volcanic risk. Journal of Volcanology and Geothermal Research 172(3-4): 259-272
Heijmans, A. 2001. Vulnerability: A matter of perception. International Conference on Vulnerability in Disaster Theory and Practice, pages 24–34, London, UK
Heijmans, A. 2009. The social life of community-based disaster risk reduction: origins, politics and framing. Disaster Studies Working Paper 20. Aon Benfield UCL Hazard Research Centre
Hewitt, K. 1997. Regions of Risk: A Geographical Introduction to Disasters. Essex, U.K.: Longman.
ISTAT, 2001. 14th General Population and Housing Census. The National Institute of Statistics – ISTAT. Rome – Italy. Online 12/09/08 http://dawinci.istat.it/pl/index_eng.html

Integrated People Centred Early Warning System as a risk reduction strategy, Northern Italy
140
Jasanoff, S. 1998. The political science of risk perception. Reliability Engineering and System Safety, 59:91–99.
Kasperson, J. X., Kasperson, R. E. and Turner, B. L. (eds.) 1995. Regions at Risk: Comparisons of Threatened Environments. Tokyo: United Nations University Press
King, D. and MacGregor, C. 2000. Using social indicators to measure community vulnerability to natural hazards. Australian Journal of Emergency Management, 15(3):52–57.
Leonard, G. S., Johnston, D. M., Paton, D., Christianson, A., Becker, J. and Keys, H. 2008. Developing effective warning systems: Ongoing research at Ruapehu volcano, New Zealand. Journal of Volcanology and Geothermal Research 172: 199–215
Leonard, G. S., Johnston, D. M., Saunders, W. and Paton, D. 2006. Assessment of Auckland Civil Defence and Emergency Management Group warning system options. GNS Science Report 2006/002
Morrow, B.H. 1999. ‘Identifying and Mapping Community Vulnerability. Disasters 23(1):11–18.
Nathan, F. 2008. Risk perception, risk management and vulnerability to landslides in the hill slopes in the city of La Paz, Bolivia. A preliminary statement. Disasters 32(3): 337-357
Ngo, E. B. 2001. When Disasters and Age Collide: Reviewing Vulnerability of the Elderly. Natural Hazards Review 2(2):80–89.
Parker, D. and Tapsell, S. et al., (2009) Deliverable 2.1. Relations between different types of social and economic vulnerability. Final draft report submitted to EU project ‘Enhancing resilience of communities and territories facing natural and na-tech hazards’ (ENSURE).
Parkins, J.R. and MacKendrick, N.A. 2005. Social dimensions of community vulnerability to mountain pine beetle. Social Sciences Research Group, Natural Resources Canada, Edmonton.
Paton, D. 2003. Disaster preparedness: a social-cognitive perspective. Disaster Prevention and Management 12 (3): 210 - 216
Paton, D., Smith, L., Daly, M. and Johnston, D. 2008. Risk perception and volcanic hazard mitigation: Individual and social perspectives. Journal of Volcanology and Geothermal Research 172(3-4): 179-188
Puente, S. 1999. ‘Social Vulnerability to Disaster in Mexico City. In: J. K. Mitchell, ed., Crucibles of Hazard: Mega-Cities and Disasters in Transition. Tokyo: United Nations University Press. 295–334
Rhodes, A. and Reinholtd, S. 1998. Beyond technology: a holistic approach to reducing residential fire fatalities. Australian Journal of Emergency Management, 13 (1): 39-44
RINAMED, 2004. Strategie di valutazione della percezione del rischio idrogeologico in aree esposte e linee guida per la comunicazione dei rischi naturali. Project INTERREG III. 211 p.
Slovic, P. 1987. Perception of Risk. Science, New Series, 236 (4799): 280-285.
Solana, M. and Kilburn, C. 2003. Public awareness of landslide hazards: the Barranco de Tirajana, Gran Canaria, Spain. Geomorphology 54 (1-2): 39 - 48
Tapsell S M, Tunstall S M, Green C, Fernandez A. 2005, Task 11 Social Indicator Set, FLOODsite report T11-07-01. Enfield: FHRC. Online 02/01/11 http://www.floodsite.net/html/publications.asp
Tapsell, S., McCarthy, S., Faulkner, H., Alexander, M., Steinführer, A., Kuhlicke, C., Brown, S., Walker, G., Pellizzoni, L., Scolobig, A., De Marchi, B., Bianchizza, C., Supramaniam, M. and Kallis, G. 2010. Social vulnerability to natural hazards. Social vulnerability to natural hazards. Report D 4.1 – Version 2.2, CapHaz – Net Porject. 87 p.
United Nations Development Programme (UNDP), 2004. Reducing disaster risk. A challenge for development. A Global Report, UNDP—Bureau for Crisis Prevention and Recovery (BRCP), New York. Online 03/10/10 http://www.undp.org/bcpr/disred/rdr.htm
Villagran, J.C. 2006 Vulnerability. A Conceptual and Methodological Review. “Studies of the University: Research, Counsel, Education-SOURCE”, Publication Series of UNU-EHS N.4/2006.
Webb, G. R., Tierney, K. J. and Dahlhamer, J. M. 2000. Business and Disasters: Empirical Patterns and Unanswered Questions. Natural Hazards Review 1(2):83–90
Pearce, L. 2005. The value of public participation during a hazard, impact, risk and vulnerability (HIRV) analysis. Mitigation and Adaptation Strategies for Global Change 10: 411–441
Victoria, L. 2003. Community-Based Approaches to Disaster Mitigation. Proceedings Regional Workshop on Best Practices in Disaster Mitigation, Asian Disaster Preparedness Center (ACDP): 269-314.

Chapter 8: Communication and Education Strategies
141
Chapter 8: Communication and Education Strategies
If people learn or suspect that they are not receiving the “whole truth,” they are likely to ignore instructions about how to respond, and instead respond in ways consistent with their suspicions. [Mileti, 1995]
The increment of disasters related to natural hazards observed during the last decades, shows the need of non structural risk prevention and mitigation measures that contribute to improve people’s safety towards natural hazards. Among the usually most effective non structural measures that serve to improve the preparedness of the population, is the development of locally adapted risk communication campaigns that actively involve the population.
Risk communication is an essential aspect in the risk management and risk reduction since it can contribute to or avert a disaster situation (Rodriguez et al., 2004). Risk communication aims to increase awareness by encouraging people to adopt preparedness measures that reduce their risk and increase their ability to manage hazard consequences and to make informed and appropriate independent judgments to minimise loss of life and damage to property (Lindell and Perry, 2004; Rodriguez et al., 2004; Paton et al. 2008; Haynes et al., 2008). However, providing information about risk is simply not enough since it is not information by itself that determines whether people act to manage their risk (Paton et al., 2008; Perry and Lindell, 2008; Parker et al., 2009; Garcia and Fearnley, submitted). Rather, decisions to act are determined by how people interpret information in the dynamic context of previous experiences, social relationships, trust and expectations (Gregg 2004; Perry and Lindell, 2008; Haynes et al., 2008). This is especially true when people at risk are in denial about the risk they face or when they expect to be protected by the authorities and emergency personnel, being therefore unprepared to respond appropriately and effectively to warnings.
In order to communicate scientific knowledge to the general population in an efficient manner, and, therefore, enhance its levels of preparedness and response to a particular hazard, it is necessary to develop an integrated research approach that involves scientific knowledge of diverse disciplines and multiple stakeholders, combined inside an effective communication model (Rodriguez et al., 2004). The model should include scientific knowledge from social sciences, physical sciences and engineers, but also must take into account the knowledge of the population regarding risk related to natural hazards. The interaction between scientists, local authorities and the end-users is extremely important and indispensable for the effectiveness of the communication. On this sense, it is necessary to bring together science and the needs of the end-users or population at risk.
The levels of risk perception and awareness are strongly related to the availability, quality and quantity of information, which should be provided at the proper time and should be adapted to the local conditions (Mileti and Sorenson, 1990; De Marchi, 2007). In this sense, an effective educational campaign need not just a far-reaching divulgation, but it is fundamental that the information be provided in a clear way, using a simple language and terminology. The local costumes and traditions should be considered, as well as the real level of perceived risk and the type of information that the population considers more relevant and necessary to improve preparedness. Equally important is the selection of an appropriate dissemination and communication strategy in order to ensure a high level of participation (Barszczynska et al., 2006).
An excellent example of improvement of communication is provided by Parker et al. (2009), whom describe that “in the United Kingdom the relationship between those living in flood risk areas and risk management organisations has changed in the past decade or so. Those at risk from fluvial and coastal flooding are being provided with much more information than formerly about risks and ways of reducing them including warnings, and they are being encouraged to engage in managing risks. This has coincided with a period in which the frequency and intensity of flooding has increased, providing motivation for some, at least, to learn about warnings and how to respond appropriately to them. UK risk agencies use an appropriately wide range of communication and awareness-raising approaches, including advertising, direct mailings, newsletters, placing information in local libraries, websites, local risks directories, risks guidance leaflets, local risks surgeries, local risks fairs, risks stalls at local farmer’s markets, local radio, media publicity campaigns, etc. However, there are still many who lack sufficient motivation, awareness and knowledge and motivating people to learn remains a core problem which limits what currently may be achieved”.

Integrated People Centred Early Warning System as a risk reduction strategy, Northern Italy
142
As pointed by Rodriguez et al. (2004), it is not only necessary to improve communication processes but significant changes also need to occur in the existing scientific paradigms in order to incorporate the needs and problems that the end-user communities confront. In order to be prepared, the population should be actively involved in the risk reduction initiatives, should understand the relationship among risk, hazard and vulnerability, and should be trained to have an effective response in case of emergency. Additionally, population should be aware of the local risks and receive technical and logistical assistance from the local authorities whom should also have a proper response in case of emergency. At the same time, people should assume responsibility for their own safeness, because to think that the civil protection is a matter only of the experts, is a common but really dangerous attitude (Department of Civil Protection, 2005). Moreover, the active participation of the community is an essential element that can decide the success or failure of an entire early warning system or any risk reduction strategy (Barszczynska et al., 2006). When community members believe that information from governmental and scientific sources fail to address their concerns, the consequence is a loss of trust in the source of information (Paton et al. 2008). In fact, Ballantyne et al. (2000) demonstrated that providing information without participatory education campaigns may even lead vulnerable populations to believe their environment is safer than it was before, as they put their faith into the scientists and authorities.
Regarding the media to transmit the information, the mass media (e.g., television, newspapers, radio) is one of mechanisms which can be utilized to provide information and play an extremely important role in the communication of hazards and disasters related news and information (Rodriguez et al., 2004; King, 2004; Mileti, 1999). As one of the most important sources of disaster information mass media significantly influences or shapes how the population and the government views, perceives, and responds to hazards and disasters (Rodriguez et al., 2004). On this sense, Widalksky (1979) affirms that the perception of risk is reflected by the media’s coverage of these events. Prior research on the mass media and disasters has often depicted the mass media as transmitters of inaccurate, biased, and exaggerated information, focusing on human loss and physical destruction (Wenger, et. al., 1980; Nigg, 1987; Pérez-Lugo, 2001; King, 2004). The media may have negative effects on the understanding of a disaster situation and, therefore, on the level of preparedness and the effectiveness of the response to a disaster. On the other side, Mileti (1999) affirms that the news media can potentially play an important and positive role in communicating reliable and accurate information to the general public.
To design an awareness and risk communication program it is first necessary to estimate the population’s understanding of the hazards they face (Solana and Kilburn, 2003; Bird et al., 2009). The survey described in the previous chapter was used for this purpose and its results relevant for the communication and education campaigns are described next.
8.1 Survey results relevant to the communication and ed ucation campaigns
The survey described in preliminary chapters, included a section to evaluate the risk knowledge and levels of risk awareness of the local population. Another section focused directly in the education campaign, asking about the willingness to participate in it, the importance of developing it, and the topics which according to the population should be discussed. The educational project and communication campaign, later described, were designed based on the obtained results.

Chapter 8: Communication and Education Strategies
143
8.1.1 Results regarding information available and actual levels of knowledge
In order to evaluate the information received in the past about natural hazards and risks, a series of questions were included in the survey (Table 8.1).
Table 8.1. Survey results for information received on risks related to natural hazards YES NO M. data
Table 8. 1a. Regarding previous information: % (n)
S.D.
Have you ever received information on risks related to natural hazard 21.9% (142)
76.6% (496)
1.5% (10) 0.42
Did you look for the information? 10.5% (68)
45.3% (294)
44.1% (286)
0.39
Table 8.1b. Quality of available/received information
Non existent Poor Acceptable . Good Really good
1 2 3 4 5
Missing data
Mean S.D.
127 162 143 58 8 150 2.31 1.02
Quality of available information about natural haza rds
0% 10% 20% 30% 40% 50% 60% 70% 80% 90% 100%
1
Nonexistent Poor Acceptable Good Really good
Table 8.1c. Most common media of received information
Information source YES
n % S.D.
1. Family members 124 19.1 0.49
2. Press 116 17.9 0.49
3. Television 109 16.8 0.48
4. In the School 95 14.7 0.48
5. Neighbours or friends 62 9.6 0.41
6. Internet 54 8.3 0.39
7. Radio 43 6.6 0.36
8. Flyers. Educational Brochures 40 6.2 0.35
9. Informative Meetings 37 5.7 0.34
10. Street posters 25 3.9 0.28
11. Scientific/tech reports 24 3.7 0.28
12. Official Reports 13 2.0 0.21
NOTE: Based on 288 responses (45% of the total), missing data: n=320, %=55. Respondents were able to check more than one source; therefore percentages do not total to 100%.
Most common media of received information
020
406080
100120140
Fam
ilym
embe
rs
Pre
ss
Tel
evi
sio
n
In th
e S
choo
l
Nei
ghb
ours
or
frie
nds
Inte
rnet
Rad
io
Fly
ers,
Ed
ucat
iona
lIn
form
ativ
eM
eeti
ngs
Stre
et
post
ers
Sci
entif
ic/te
chre
por
tsO
ffic
ial
Rep
orts
n
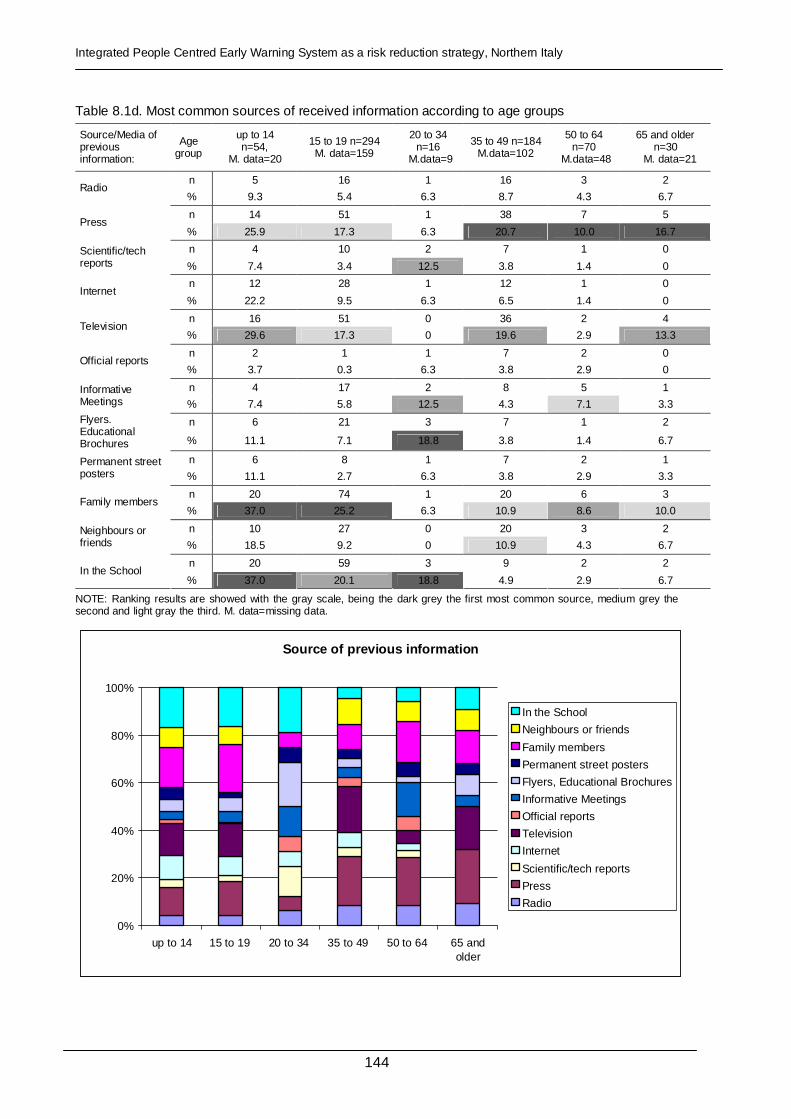
Integrated People Centred Early Warning System as a risk reduction strategy, Northern Italy
144
Table 8.1d. Most common sources of received information according to age groups
Source/Media of previous information:
Age group
up to 14 n=54,
M. data=20
15 to 19 n=294 M. data=159
20 to 34 n=16
M.data=9
35 to 49 n=184 M.data=102
50 to 64 n=70
M.data=48
65 and older n=30
M. data=21
n 5 16 1 16 3 2 Radio
% 9.3 5.4 6.3 8.7 4.3 6.7
n 14 51 1 38 7 5 Press
% 25.9 17.3 6.3 20.7 10.0 16.7
n 4 10 2 7 1 0 Scientific/tech reports % 7.4 3.4 12.5 3.8 1.4 0
n 12 28 1 12 1 0 Internet
% 22.2 9.5 6.3 6.5 1.4 0
n 16 51 0 36 2 4 Television
% 29.6 17.3 0 19.6 2.9 13.3
n 2 1 1 7 2 0 Official reports
% 3.7 0.3 6.3 3.8 2.9 0
n 4 17 2 8 5 1 Informative Meetings % 7.4 5.8 12.5 4.3 7.1 3.3
n 6 21 3 7 1 2 Flyers. Educational Brochures % 11.1 7.1 18.8 3.8 1.4 6.7
n 6 8 1 7 2 1 Permanent street posters % 11.1 2.7 6.3 3.8 2.9 3.3
n 20 74 1 20 6 3 Family members
% 37.0 25.2 6.3 10.9 8.6 10.0
n 10 27 0 20 3 2 Neighbours or friends % 18.5 9.2 0 10.9 4.3 6.7
n 20 59 3 9 2 2 In the School
% 37.0 20.1 18.8 4.9 2.9 6.7
NOTE: Ranking results are showed with the gray scale, being the dark grey the first most common source, medium grey the second and light gray the third. M. data=missing data.
Source of previous information
0%
20%
40%
60%
80%
100%
up to 14 15 to 19 20 to 34 35 to 49 50 to 64 65 andolder
In the School
Neighbours or friends
Family members
Permanent street posters
Flyers, Educational Brochures
Informative Meetings
Official reports
Television
Internet
Scientific/tech reports
Press
Radio

Chapter 8: Communication and Education Strategies
145
• Analysis of results regarding information received in the past
According to the survey results showed in Table 8. 1a, around three quarters of the surveyed population (76.6%) declared that have never received information on natural hazards and risks. The quality of the received information (Table 8. 1b) was rated rather low (Poor to Acceptable; mean 2.31/5). It is important to highlight an interesting casual finding. Due to the editing of the questionnaire, the question regarding the source of received information (question Number 17) that followed the question asking if any information have been received in the past (question 16) was in a different page. For this reason, many people who even if answering that they have never received any information (Q. 16) still selected a source of information (Q. 17). This could show that even if people have received information on natural hazards, they are not really aware of the information, showing maybe that the way the information has been provided has not been appropriate. People that answered YES to the question about receiving information in the past was n=68, while the people that answered the question about the source of past information is n=288. Regarding the source of received information (Table 8.1c), most of the surveyed population have received the information from (1) Family members, followed by (2) Press and (3) Television. Results show a difference about the most common source of information in the different age groups (Table 8. 1d). The young population (0 to 15 years old) received the information mostly from (1) Family members, (2) School and (3) Television, while the older population (35 and older) received the information mostly from the (1) Press, (2) Television and (3) Family Members.
8.1.2 Results regarding knowledge of emergency management and emergency procedures
Several questions in the survey served to evaluate the knowledge about the emergency plan, the emergency management and the legislation about risks related to natural hazards (Table 8.2).
Table 8.2. Survey results about knowledge of the emergency plan, emergency management and legislation
YES NO M. data Table 8. 2a. Knowledge of emergency plan and management: % (n)
S.D.
Know the emergency plan 4.1% (27)
95.1% (616)
0.8% (5) 0.2
Know who is responsible for managing the emergency* 23.8% (154)
74.5% (483)
1.7% (11) 0.43
Table 8.2b. Know who is responsible for managing the emergency* % 1. Civil Protection 61.6 2. Municipality- Mayor (Sindaco) 41.1 3. Fire Fighter (Vigili del fuoco) 13.0 4. Local police 2.1 5. Comunità Montana 1.4 6. Others 4.8
NOTE: the values correspond to the percentage of the population that answer YES the question about “Knowing who is responsible for managing the emergency” (n=154, %=23,8). Respondents were able to check more than one option; therefore percentages do not total to 100%. Comunità Montana = CM Valtellina di Tirano.
Table 8.2c. Knowledge of actual legislation about spatial planning on natural hazards (Table 6.16)
Not existent Poor Acceptable Good Really good 1 2 3 4 5
Missing data
Mean S.D.
230 241 123 16 12 26 1.94 0.92
0% 20% 40% 60% 80% 100%
1
Knowledge of actual legislation about spatial planning and natural hazards
Not existent Poor Acceptable Good Really good Missing data

Integrated People Centred Early Warning System as a risk reduction strategy, Northern Italy
146
Table 8.2d. Perceived general knowledge about mass movement and flooding
Mass Movement Flooding
Not existent
Poor Accep-table
Good Really good
Not existent
Poor Accep-table
Good Really good
Perceived knowledge of:
1 2 3 4 5
M. data
Mean S.D.
1 2 3 4 5
M. data
Mean S.D
Population 58 194 213 91 20 72 2.69 0.97 62 192 202 91 25 76 2.69 1.0
You or your Family 103 207 164 71 29 74 2.51 1.07 103 210 153 71 33 78 2.51 1.1
0% 10% 20% 30% 40% 50% 60% 70% 80% 90% 100%
MM
Fl
MM
Fl
General knowledge about m ass m ovements and flooding
Not existent Poor Accept able Good Really good Missing dat a
• Analysis of results regarding knowledge of emergenc y management and emergency procedures
According to the results of Table 8.2a just 4.1% of the surveyed population knows the emergency plan and less than one quarter of the surveyed population (23.8%) knows who is the responsible for emergency managing. When asked to specify who was the responsible for emergency managing (Table 8. 2b), the answers were (1) Civil Protection, (2) Mayor and (3) Fire Fighters. The knowledge of the legislation regarding natural hazards and emergency management (Table 8. 2c) was low (Mean=1.94/5). Finally, the perceived own knowledge and knowledge of the population (Table 8. 2d) were both rated Poor to Acceptable (Mean=2.51 and 2.69 respectively).
8.1.3 Results regarding the perceived level of own prepar edness
Some questions served to evaluate the preparedness level to confront a potentially damaging future event, particularly mass movement and/or flooding (Table 8.3).
Table 8.3. Results regarding preparedness levels
YES NO Missing data Table 8. 3a. Regarding knowledge of emergency procedures and perceived self
preparedness: % (n)
S.D.
Know the emergency procedures in case of an emergency 18.1% (117)
79.4% (515) 2.5% (16) 0.39
Do you think you could take personal measures to reduce the consequences of a possible mass movement or flooding?
15.2% (99)
79.6% (516)
5.1% (33) 0.37
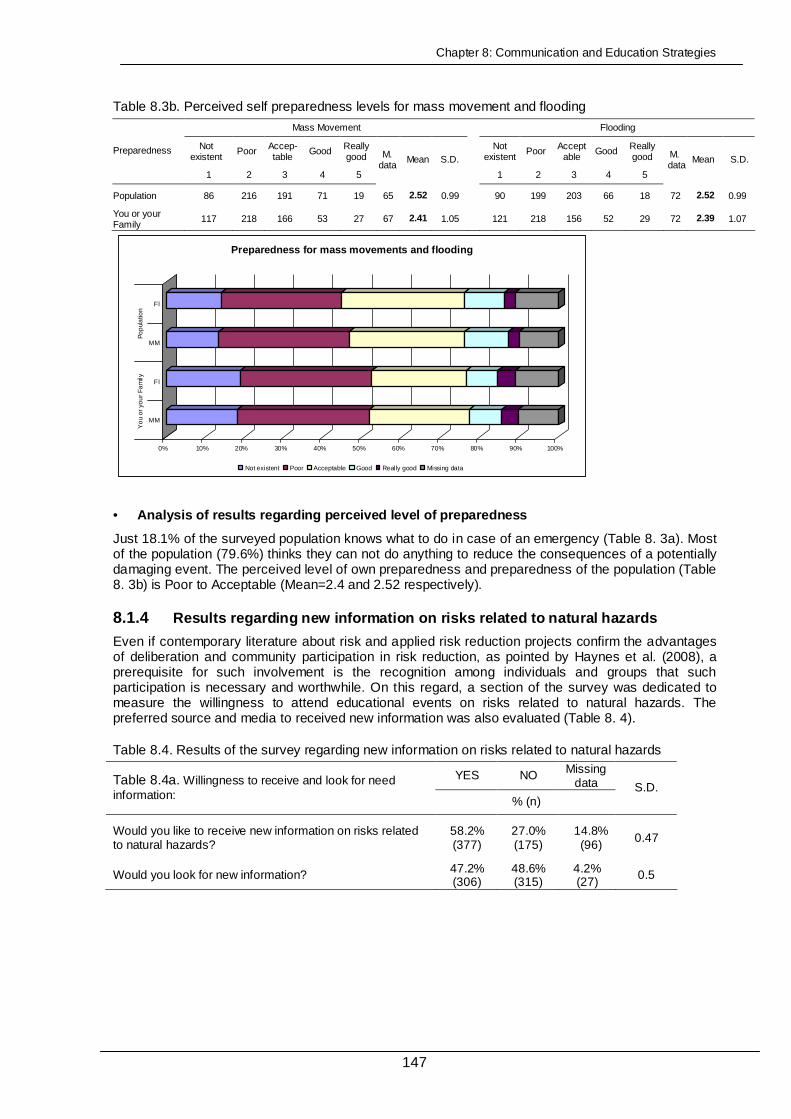
Chapter 8: Communication and Education Strategies
147
Table 8.3b. Perceived self preparedness levels for mass movement and flooding
Mass Movement Flooding
Not existent
Poor Accep-table
Good Really good
Not existent
Poor Acceptable
Good Really good
Preparedness
1 2 3 4 5
M. data
Mean S.D.
1 2 3 4 5
M. data
Mean S.D.
Population 86 216 191 71 19 65 2.52 0.99 90 199 203 66 18 72 2.52 0.99
You or your Family
117 218 166 53 27 67 2.41 1.05 121 218 156 52 29 72 2.39 1.07
0% 10% 20% 30% 40% 50% 60% 70% 80% 90% 100%
MM
Fl
MM
Fl
Yo
u o
r yo
ur
Fa
mily
Po
pul
atio
n
Preparedness for mass movements and flooding
Not existent Poor Acceptable Good Really good Missing data
• Analysis of results regarding perceived level of pr eparedness
Just 18.1% of the surveyed population knows what to do in case of an emergency (Table 8. 3a). Most of the population (79.6%) thinks they can not do anything to reduce the consequences of a potentially damaging event. The perceived level of own preparedness and preparedness of the population (Table 8. 3b) is Poor to Acceptable (Mean=2.4 and 2.52 respectively).
8.1.4 Results regarding new information on risks related to natural hazards
Even if contemporary literature about risk and applied risk reduction projects confirm the advantages of deliberation and community participation in risk reduction, as pointed by Haynes et al. (2008), a prerequisite for such involvement is the recognition among individuals and groups that such participation is necessary and worthwhile. On this regard, a section of the survey was dedicated to measure the willingness to attend educational events on risks related to natural hazards. The preferred source and media to received new information was also evaluated (Table 8. 4).
Table 8.4. Results of the survey regarding new information on risks related to natural hazards
YES NO Missing data Table 8.4a. Willingness to receive and look for need
information: % (n) S.D.
Would you like to receive new information on risks related to natural hazards?
58.2% (377)
27.0% (175)
14.8% (96)
0.47
Would you look for new information? 47.2% (306)
48.6% (315)
4.2% (27)
0.5

Integrated People Centred Early Warning System as a risk reduction strategy, Northern Italy
148
Table 8.4b. Preferred media to receive new information
Rank Preferred media n % S.D.
1. Television 238 36.7 0.48
2. Press 209 32.3 0.47
3. Flyers. Educational Brochures 199 30.7 0.46
4. Informative Meetings 165 25.5 0.44
5. Internet 162 25.0 0.44
6. Permanent Street posters 113 17.4 0.38
7. Scientific/tech reports 108 16.7 0.37
8. Official Reports 99 15.3 0.36
9. Radio 76 11.7 0.33
10. In the School 8 1.2 0
11. Other 3 0.5 0 Note: Based on 629 responses (97.1% of the total), missing data: n=19, %=2.9. Respondents were able to check more than one option; therefore percentages do not total to 100%.
Table 8.4c. Preferred media to receive new information according to age groups
Media for new information:
Age group
up to 14 n=54,
M. data=1
15 to 19 n=294
M. data=11
20 to 34 n=16
M. data=4
35 to 49 n=184 M. data=2
50 to 64 n=70
M. data=2
65 and older n=30
M. data=1
n 11 37 1 18 6 3 Radio
% 20.4 12.6 6.3 9.8 8.6 10.0
n 33 102 5 53 11 5 Press
% 61.1 34.7 31.3 28.8 15.7 16.7
n 7 33 6 38 19 5 Scientific/tech reports % 13.0 11.2 37.5 20.7 27.1 16.7
n 22 92 5 35 8 Internet
% 40.7 31.3 31.3 19.0 11.4
n 35 130 3 50 9 11 Television
% 64.8 44.2 18.8 27.2 12.9 36.7
n 3 40 6 35 14 1 Official reports
% 5.6 13.6 37.5 19.0 20.0 3.3
n 15 64 4 43 29 10 Informative Meetings % 27.8 21.8 25.0 23.4 41.4 33.3
n 14 78 9 72 19 7 Flyers. Educational Brochures % 25.9 26.5 56.3 39.1 27.1 23.3
n 14 54 3 23 11 8 Permanent street posters % 25.9 18.4 18.8 12.5 15.7 26.7
n 1 7 0 0 0 0 In the School
% 1.9 2.4 0 0 0 0
NOTE: Ranking of the preferred media for information is show with the gray scale, being the dark grey the first most preferred media, medium grey the second and light gray the third. M. data=missing data

Chapter 8: Communication and Education Strategies
149
Preferred media for new information according to a ge groups
0%
20%
40%
60%
80%
100%
up to 14 15 to 19 20 to 34 35 to 49 50 to 64 65 andolder
In the School
Permanent street posters
Flyers, Educational Brochures
Informative Meetings
Official reports
Television
Internet
Scientific/tech reports
Press
Radio
Table 8.4d. Source which should provide information on natural hazards
Rank Preferred source n % Missing data
S.D.
1. Municipality 485 74.8 7 0.43
2. Comunità Montana 325 50.2 8 0.5
3. Civil Protection 254 39.2 8 0.49
4. Province 163 25.2 8 0.44
5. Region 129 19.9 9 0.4
6. Mass Media 83 12.8 8 0.34
7. Scientific community 53 8.2 9 0.28
8. National Government 44 6.8 8 0.25
9. Other 3 0.5 8 0
NOTE: Respondents were able to check more than one option; therefore percentages do not total to 100%.
Table 8.4e. Source which should provide information on natural hazards, by age groups
Municipality Comunità Montana
Civil Protection
Mass Media
Province Region National
Gov. Scientific
community Age groups
% % % % % % % %
up to 14 75.93 61.11 55.56 37.04 31.48 27.78 11.11 20.37 15 to 19 70.83 59.72 45.49 17.01 27.78 25.78 10.76 8.33 20 to 34 56.25 56.25 31.25 6.25 25.00 25.00 0.00 12.50
35 to 49 78.80 39.67 29.35 6.52 27.17 15.22 3.26 6.56
50 to 64 85.51 40.58 33.33 1.45 11.59 8.70 1.45 5.80
65 and older 90.00 34.48 37.93 0.00 13.79 6.90 0.00 0.00
NOTE: the values corresponded to is the percentage of each age group that answered YES to each source. Respondents were able to check more than one option; therefore percentages do not total to 100%.
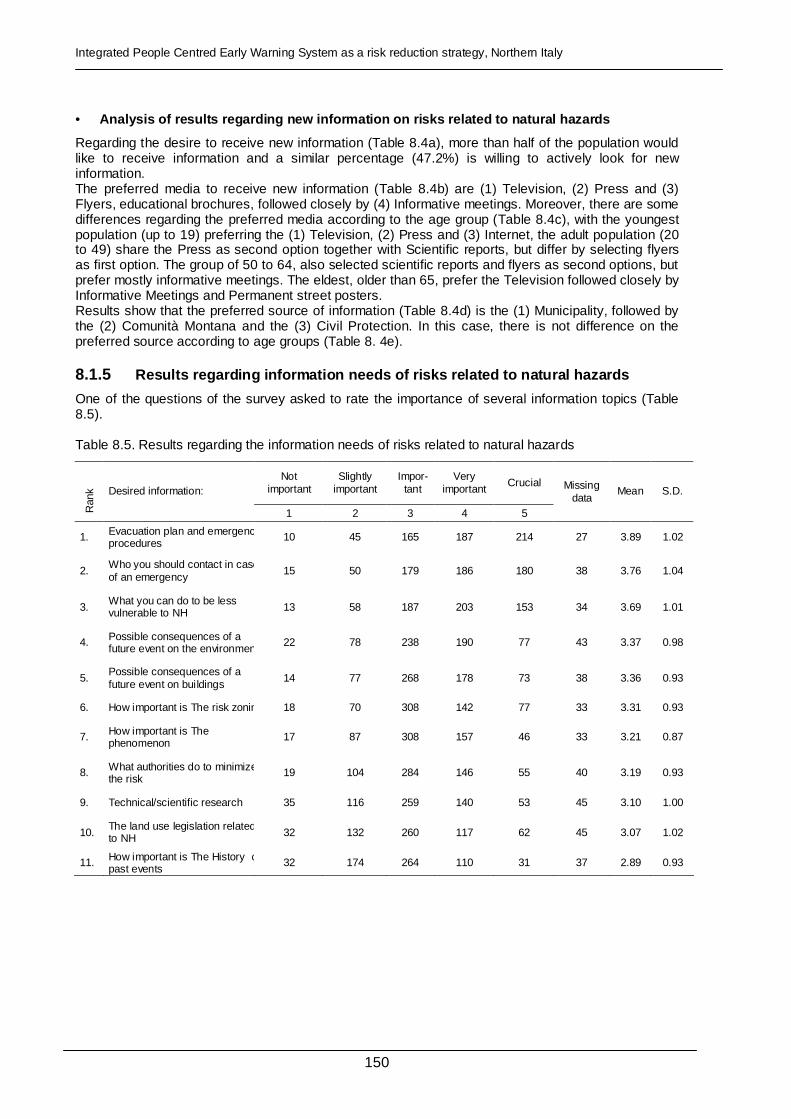
Integrated People Centred Early Warning System as a risk reduction strategy, Northern Italy
150
• Analysis of results regarding new information on ri sks related to natural hazards
Regarding the desire to receive new information (Table 8.4a), more than half of the population would like to receive information and a similar percentage (47.2%) is willing to actively look for new information. The preferred media to receive new information (Table 8.4b) are (1) Television, (2) Press and (3) Flyers, educational brochures, followed closely by (4) Informative meetings. Moreover, there are some differences regarding the preferred media according to the age group (Table 8.4c), with the youngest population (up to 19) preferring the (1) Television, (2) Press and (3) Internet, the adult population (20 to 49) share the Press as second option together with Scientific reports, but differ by selecting flyers as first option. The group of 50 to 64, also selected scientific reports and flyers as second options, but prefer mostly informative meetings. The eldest, older than 65, prefer the Television followed closely by Informative Meetings and Permanent street posters. Results show that the preferred source of information (Table 8.4d) is the (1) Municipality, followed by the (2) Comunità Montana and the (3) Civil Protection. In this case, there is not difference on the preferred source according to age groups (Table 8. 4e).
8.1.5 Results regarding information needs of risks relate d to natural hazards
One of the questions of the survey asked to rate the importance of several information topics (Table 8.5).
Table 8.5. Results regarding the information needs of risks related to natural hazards
Not important
Slightly important
Impor-tant
Very important
Crucial
Ran
k Desired information:
1 2 3 4 5
Missing data
Mean S.D.
1. Evacuation plan and emergency procedures
10 45 165 187 214 27 3.89 1.02
2. Who you should contact in case of an emergency
15 50 179 186 180 38 3.76 1.04
3. What you can do to be less vulnerable to NH 13 58 187 203 153 34 3.69 1.01
4. Possible consequences of a future event on the environment
22 78 238 190 77 43 3.37 0.98
5. Possible consequences of a future event on buildings
14 77 268 178 73 38 3.36 0.93
6. How important is The risk zoning 18 70 308 142 77 33 3.31 0.93
7. How important is The phenomenon
17 87 308 157 46 33 3.21 0.87
8. What authorities do to minimize the risk
19 104 284 146 55 40 3.19 0.93
9. Technical/scientific research 35 116 259 140 53 45 3.10 1.00
10. The land use legislation related to NH 32 132 260 117 62 45 3.07 1.02
11. How important is The History of past events
32 174 264 110 31 37 2.89 0.93
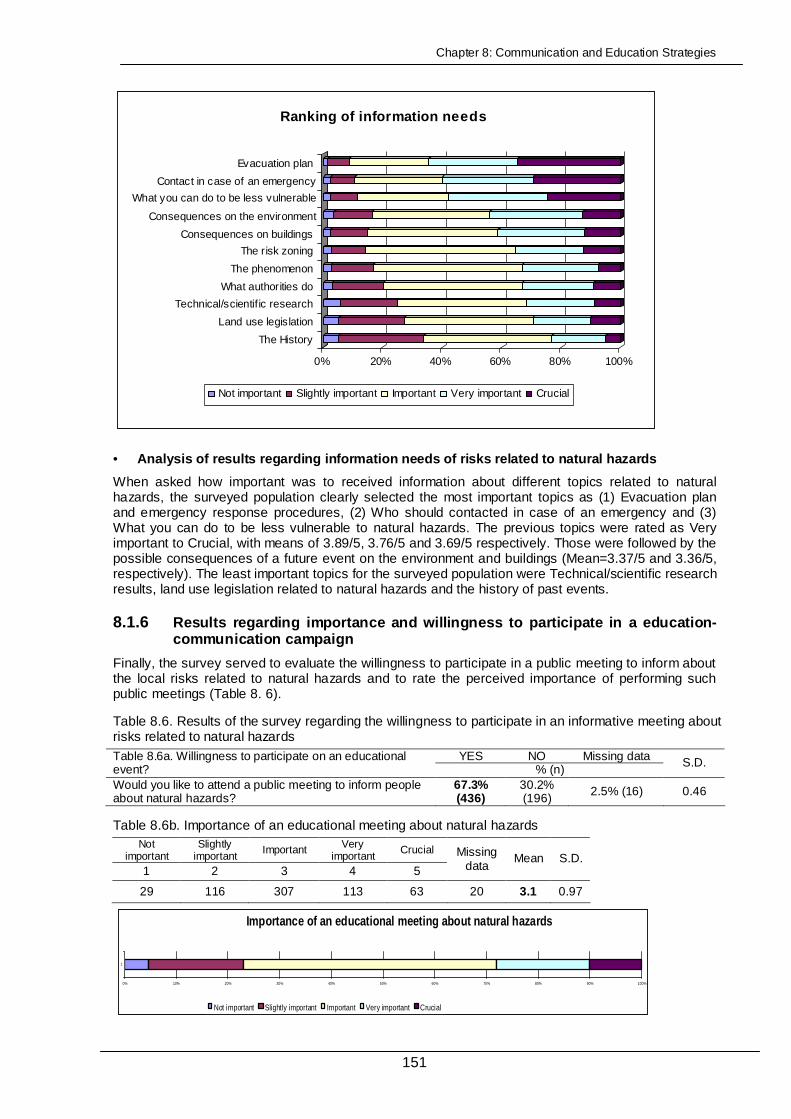
Chapter 8: Communication and Education Strategies
151
0% 20% 40% 60% 80% 100%
The History
Land use legislation
Technical/scientific research
What authorities do
The phenomenon
The risk zoning
Consequences on buildings
Consequences on the environment
What you can do to be less vulnerable
Contact in case of an emergency
Evacuation plan
Ranking of information needs
Not important Slightly important Important Very important Crucial
• Analysis of results regarding information needs of risks related to natural hazards
When asked how important was to received information about different topics related to natural hazards, the surveyed population clearly selected the most important topics as (1) Evacuation plan and emergency response procedures, (2) Who should contacted in case of an emergency and (3) What you can do to be less vulnerable to natural hazards. The previous topics were rated as Very important to Crucial, with means of 3.89/5, 3.76/5 and 3.69/5 respectively. Those were followed by the possible consequences of a future event on the environment and buildings (Mean=3.37/5 and 3.36/5, respectively). The least important topics for the surveyed population were Technical/scientific research results, land use legislation related to natural hazards and the history of past events.
8.1.6 Results regarding importance and willingness to par ticipate in a education-communication campaign
Finally, the survey served to evaluate the willingness to participate in a public meeting to inform about the local risks related to natural hazards and to rate the perceived importance of performing such public meetings (Table 8. 6).
Table 8.6. Results of the survey regarding the willingness to participate in an informative meeting about risks related to natural hazards
YES NO Missing data Table 8.6a. Willingness to participate on an educational event? % (n)
S.D.
Would you like to attend a public meeting to inform people about natural hazards?
67.3% (436)
30.2% (196)
2.5% (16) 0.46
Table 8.6b. Importance of an educational meeting about natural hazards Not
important Slightly
important Important Very
important Crucial
1 2 3 4 5
Missing data
Mean S.D.
29 116 307 113 63 20 3.1 0.97
Importance of an educational meeting about natural hazards
0% 10% 20% 30% 40% 50% 60% 70% 80% 90% 100%
1
Not important Slightly important Important Very important Crucial
Integrated People Centred Early Warning System as a risk reduction strategy, Northern Italy
152
• Analysis of results regarding the importance and wi llingness to participate in a education-communication campaign
Results about the willingness to participate in an informative meeting about risks related to natural hazards (Table 8. 6a.) showed that two thirds of the population (67.3%) is willing to participate. Additionally, the development of an educational meeting (Table 8. 6b.) was rated as Important to Very Important (Mean=3.1)
8.2 Discussion
The results show that most of the surveyed population states have never received information about natural hazards. Results also show a general lack of knowledge of the responders regarding the emergency management and confusion as to who is responsible for emergency management at local level (Mayor) and who is responsible for the emergency response (Civil Protection and Fire Fighters). These results are similar to those obtained by De Marchi et al. (2007) in the region of Trentino-Alto Adige, an area close to our study zone in the north of Italy with a significant history of flooding where, even if there is an official warning system, only a minority of the population knows how to respond when a impeding hazard warning is received.
Results obtained in previous chapters about the lack of distinction between mass movements and flooding regarding the level of risk, preparedness and knowledge, were corroborated.
The perceived self-preparedness is slightly lower than the one perceived for the population. This is consistent with the fact that most of the population (79.6%) thinks they cannot do anything by themselves to reduce the risk. The previous shows either a general lack of knowledge about non-structural mitigation measures that can be performed by any person, or a general lack of self-responsibility in regard to risk reduction. These results are also consistent with the results of De Marchi et al. (2007). According to De Marchi et al., there has been a progressive loss of a culture of self-protection among the people living in Trentino-Alto Adige. In that region, most responders do not take steps to protect their dwellings, neither before nor after a damaging event. This response in Trentino-Alto Adige is reinforced by lack of knowledge and lack of confidence in available measures which individuals can take to protect themselves. However, when specifically asked, villagers of Trentino-Alto Adige showed interest in learning more about individual protective measures, which coincide again with the results on CM Valtellina di Tirano.
For the design and development of an educational campaign, it is important to take into account the differences of the preferred media according to age groups, considering at the same time the available resources. The Television and Press, selected as first options in the survey, are costly and it takes too much time to involve them. For the previous reason, they have not been included in the development of the communication campaign. However, it would be recommended to contact the local Television and Press asking them to collaborate in the communication campaign, initially for the dissemination of general information such as dates, meeting places, etc. Flyers and educational brochures were rated high by the adults and rather high by the younger groups, indicating that this is a good general option for the dissemination of information. Additionally, informative meeting were selected, by the adult and eldest population, as a good media to disseminate information. The scientific and official reports could be used, but only with specifics groups of population (20 to 34 and 50 to 64). Possibly this is due to the fact that many people of the first group (20 to 34) are currently attending the university or recently finished academic degrees, while the second group (50 to 64), can understand scientific language more easily than the eldest and youngest population.
Regarding the source of new information, there is a clear tendency on preferring mostly the information coming from the Municipality, Comunità Montana and Civil Protection. The previous coincide with the high levels of trust towards them demonstrated in the previous chapter (Table 6.14). It is interesting to notice that even if the Television and Press were selected as preferred media to receive information, the levels of trust on the information coming from the Mass Media are very low. The desire of the general population of receiving information from the scientific community is also very low, only slightly better than the National Government which had the worse ratings. For the previous reason, it is important that any kind of education/communication initiative will be developed in close collaboration with the local authorities (Municipality, Civil Protection and Comunità Montana).
Regarding the topic of information, the people clearly state that it is very important to receive information about the Evacuation Plan and Emergency Procedures, including contact details of responsible for emergency management. Furthermore, the respondents think it is very important to
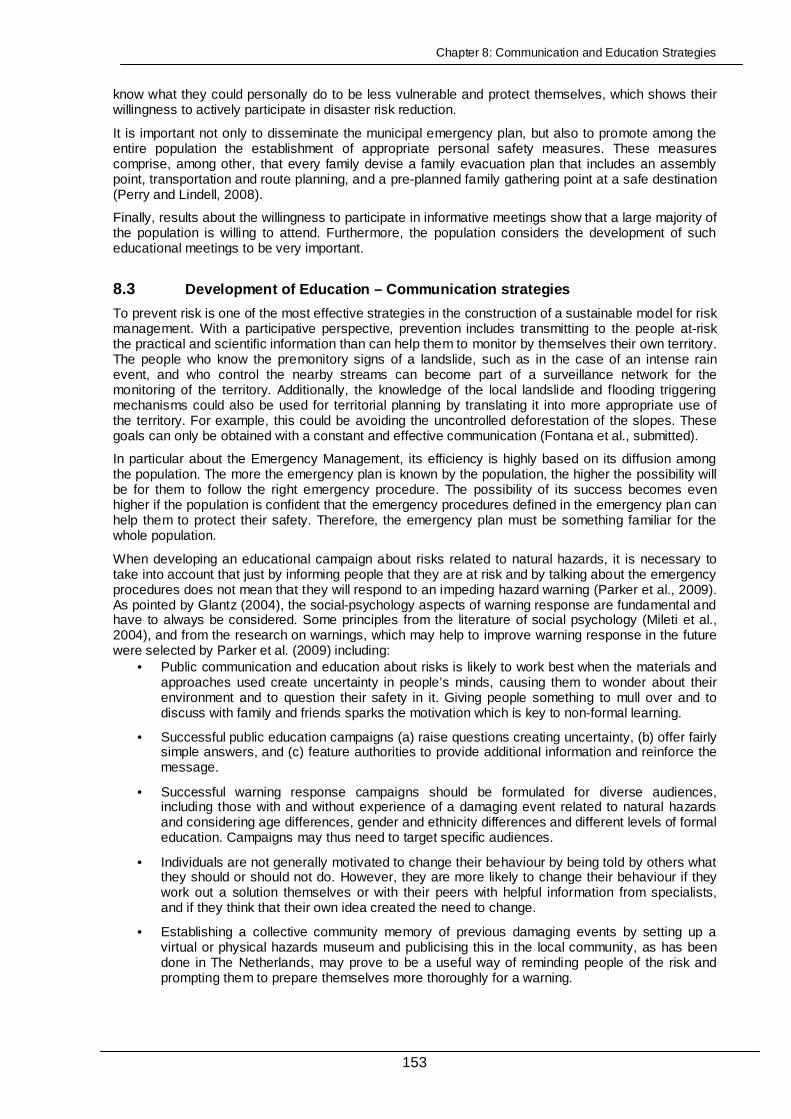
Chapter 8: Communication and Education Strategies
153
know what they could personally do to be less vulnerable and protect themselves, which shows their willingness to actively participate in disaster risk reduction.
It is important not only to disseminate the municipal emergency plan, but also to promote among the entire population the establishment of appropriate personal safety measures. These measures comprise, among other, that every family devise a family evacuation plan that includes an assembly point, transportation and route planning, and a pre-planned family gathering point at a safe destination (Perry and Lindell, 2008).
Finally, results about the willingness to participate in informative meetings show that a large majority of the population is willing to attend. Furthermore, the population considers the development of such educational meetings to be very important.
8.3 Development of Education – Communication strategies
To prevent risk is one of the most effective strategies in the construction of a sustainable model for risk management. With a participative perspective, prevention includes transmitting to the people at-risk the practical and scientific information than can help them to monitor by themselves their own territory. The people who know the premonitory signs of a landslide, such as in the case of an intense rain event, and who control the nearby streams can become part of a surveillance network for the monitoring of the territory. Additionally, the knowledge of the local landslide and flooding triggering mechanisms could also be used for territorial planning by translating it into more appropriate use of the territory. For example, this could be avoiding the uncontrolled deforestation of the slopes. These goals can only be obtained with a constant and effective communication (Fontana et al., submitted).
In particular about the Emergency Management, its efficiency is highly based on its diffusion among the population. The more the emergency plan is known by the population, the higher the possibility will be for them to follow the right emergency procedure. The possibility of its success becomes even higher if the population is confident that the emergency procedures defined in the emergency plan can help them to protect their safety. Therefore, the emergency plan must be something familiar for the whole population.
When developing an educational campaign about risks related to natural hazards, it is necessary to take into account that just by informing people that they are at risk and by talking about the emergency procedures does not mean that they will respond to an impeding hazard warning (Parker et al., 2009). As pointed by Glantz (2004), the social-psychology aspects of warning response are fundamental and have to always be considered. Some principles from the literature of social psychology (Mileti et al., 2004), and from the research on warnings, which may help to improve warning response in the future were selected by Parker et al. (2009) including:
• Public communication and education about risks is likely to work best when the materials and approaches used create uncertainty in people’s minds, causing them to wonder about their environment and to question their safety in it. Giving people something to mull over and to discuss with family and friends sparks the motivation which is key to non-formal learning.
• Successful public education campaigns (a) raise questions creating uncertainty, (b) offer fairly simple answers, and (c) feature authorities to provide additional information and reinforce the message.
• Successful warning response campaigns should be formulated for diverse audiences, including those with and without experience of a damaging event related to natural hazards and considering age differences, gender and ethnicity differences and different levels of formal education. Campaigns may thus need to target specific audiences.
• Individuals are not generally motivated to change their behaviour by being told by others what they should or should not do. However, they are more likely to change their behaviour if they work out a solution themselves or with their peers with helpful information from specialists, and if they think that their own idea created the need to change.
• Establishing a collective community memory of previous damaging events by setting up a virtual or physical hazards museum and publicising this in the local community, as has been done in The Netherlands, may prove to be a useful way of reminding people of the risk and prompting them to prepare themselves more thoroughly for a warning.
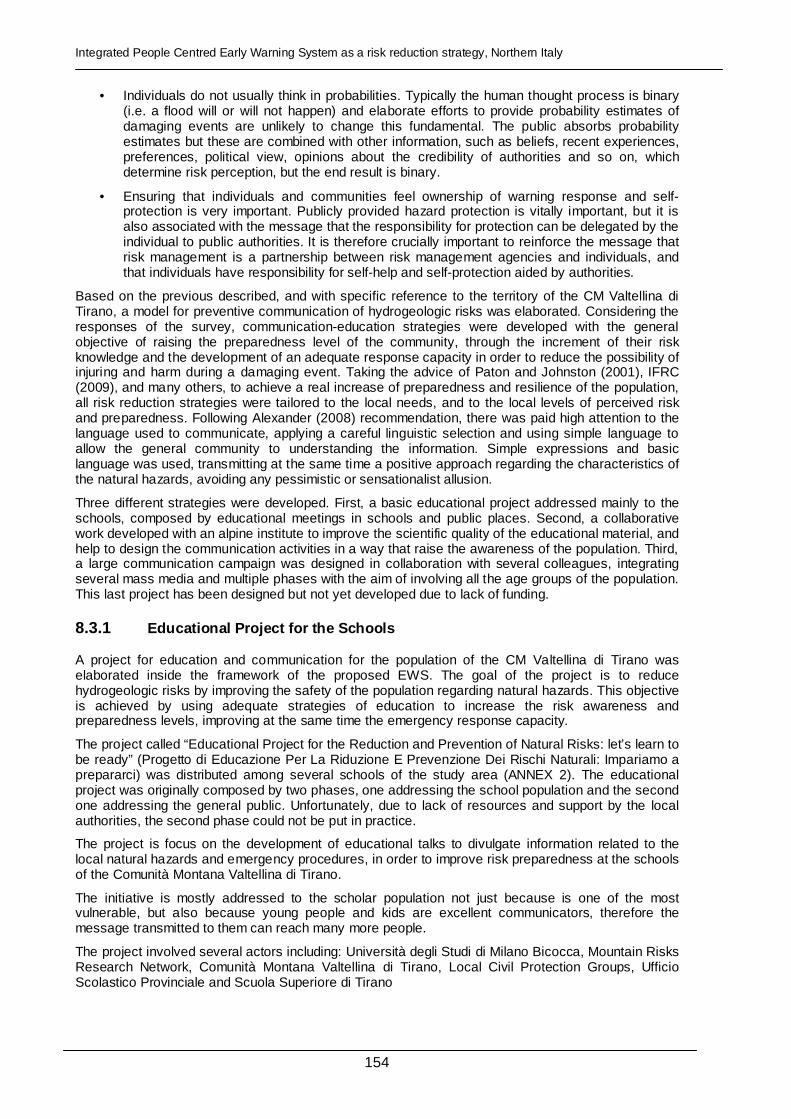
Integrated People Centred Early Warning System as a risk reduction strategy, Northern Italy
154
• Individuals do not usually think in probabilities. Typically the human thought process is binary (i.e. a flood will or will not happen) and elaborate efforts to provide probability estimates of damaging events are unlikely to change this fundamental. The public absorbs probability estimates but these are combined with other information, such as beliefs, recent experiences, preferences, political view, opinions about the credibility of authorities and so on, which determine risk perception, but the end result is binary.
• Ensuring that individuals and communities feel ownership of warning response and self-protection is very important. Publicly provided hazard protection is vitally important, but it is also associated with the message that the responsibility for protection can be delegated by the individual to public authorities. It is therefore crucially important to reinforce the message that risk management is a partnership between risk management agencies and individuals, and that individuals have responsibility for self-help and self-protection aided by authorities.
Based on the previous described, and with specific reference to the territory of the CM Valtellina di Tirano, a model for preventive communication of hydrogeologic risks was elaborated. Considering the responses of the survey, communication-education strategies were developed with the general objective of raising the preparedness level of the community, through the increment of their risk knowledge and the development of an adequate response capacity in order to reduce the possibility of injuring and harm during a damaging event. Taking the advice of Paton and Johnston (2001), IFRC (2009), and many others, to achieve a real increase of preparedness and resilience of the population, all risk reduction strategies were tailored to the local needs, and to the local levels of perceived risk and preparedness. Following Alexander (2008) recommendation, there was paid high attention to the language used to communicate, applying a careful linguistic selection and using simple language to allow the general community to understanding the information. Simple expressions and basic language was used, transmitting at the same time a positive approach regarding the characteristics of the natural hazards, avoiding any pessimistic or sensationalist allusion.
Three different strategies were developed. First, a basic educational project addressed mainly to the schools, composed by educational meetings in schools and public places. Second, a collaborative work developed with an alpine institute to improve the scientific quality of the educational material, and help to design the communication activities in a way that raise the awareness of the population. Third, a large communication campaign was designed in collaboration with several colleagues, integrating several mass media and multiple phases with the aim of involving all the age groups of the population. This last project has been designed but not yet developed due to lack of funding.
8.3.1 Educational Project for the Schools
A project for education and communication for the population of the CM Valtellina di Tirano was elaborated inside the framework of the proposed EWS. The goal of the project is to reduce hydrogeologic risks by improving the safety of the population regarding natural hazards. This objective is achieved by using adequate strategies of education to increase the risk awareness and preparedness levels, improving at the same time the emergency response capacity.
The project called “Educational Project for the Reduction and Prevention of Natural Risks: let’s learn to be ready” (Progetto di Educazione Per La Riduzione E Prevenzione Dei Rischi Naturali: Impariamo a prepararci) was distributed among several schools of the study area (ANNEX 2). The educational project was originally composed by two phases, one addressing the school population and the second one addressing the general public. Unfortunately, due to lack of resources and support by the local authorities, the second phase could not be put in practice.
The project is focus on the development of educational talks to divulgate information related to the local natural hazards and emergency procedures, in order to improve risk preparedness at the schools of the Comunità Montana Valtellina di Tirano.
The initiative is mostly addressed to the scholar population not just because is one of the most vulnerable, but also because young people and kids are excellent communicators, therefore the message transmitted to them can reach many more people.
The project involved several actors including: Università degli Studi di Milano Bicocca, Mountain Risks Research Network, Comunità Montana Valtellina di Tirano, Local Civil Protection Groups, Ufficio Scolastico Provinciale and Scuola Superiore di Tirano
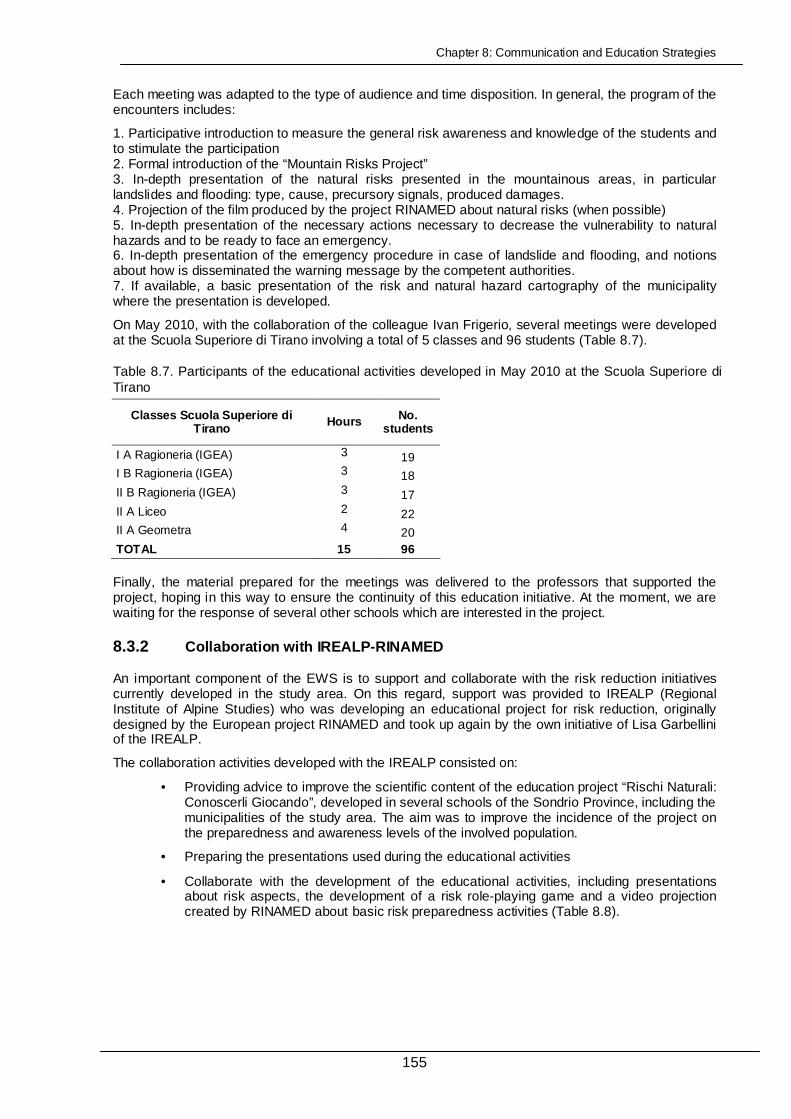
Chapter 8: Communication and Education Strategies
155
Each meeting was adapted to the type of audience and time disposition. In general, the program of the encounters includes:
1. Participative introduction to measure the general risk awareness and knowledge of the students and to stimulate the participation 2. Formal introduction of the “Mountain Risks Project” 3. In-depth presentation of the natural risks presented in the mountainous areas, in particular landslides and flooding: type, cause, precursory signals, produced damages. 4. Projection of the film produced by the project RINAMED about natural risks (when possible) 5. In-depth presentation of the necessary actions necessary to decrease the vulnerability to natural hazards and to be ready to face an emergency. 6. In-depth presentation of the emergency procedure in case of landslide and flooding, and notions about how is disseminated the warning message by the competent authorities. 7. If available, a basic presentation of the risk and natural hazard cartography of the municipality where the presentation is developed.
On May 2010, with the collaboration of the colleague Ivan Frigerio, several meetings were developed at the Scuola Superiore di Tirano involving a total of 5 classes and 96 students (Table 8.7).
Table 8.7. Participants of the educational activities developed in May 2010 at the Scuola Superiore di Tirano
Classes Scuola Superiore di Tirano Hours No.
students
I A Ragioneria (IGEA) 3 19 I B Ragioneria (IGEA) 3 18 II B Ragioneria (IGEA) 3 17 II A Liceo 2 22 II A Geometra 4 20 TOTAL 15 96
Finally, the material prepared for the meetings was delivered to the professors that supported the project, hoping in this way to ensure the continuity of this education initiative. At the moment, we are waiting for the response of several other schools which are interested in the project.
8.3.2 Collaboration with IREALP-RINAMED
An important component of the EWS is to support and collaborate with the risk reduction initiatives currently developed in the study area. On this regard, support was provided to IREALP (Regional Institute of Alpine Studies) who was developing an educational project for risk reduction, originally designed by the European project RINAMED and took up again by the own initiative of Lisa Garbellini of the IREALP.
The collaboration activities developed with the IREALP consisted on:
• Providing advice to improve the scientific content of the education project “Rischi Naturali: Conoscerli Giocando”, developed in several schools of the Sondrio Province, including the municipalities of the study area. The aim was to improve the incidence of the project on the preparedness and awareness levels of the involved population.
• Preparing the presentations used during the educational activities
• Collaborate with the development of the educational activities, including presentations about risk aspects, the development of a risk role-playing game and a video projection created by RINAMED about basic risk preparedness activities (Table 8.8).

Integrated People Centred Early Warning System as a risk reduction strategy, Northern Italy
156
Table 8.8. Participants of the project about risk education developed by the IREALP
Primary School Class No. students
Scuola primaria Melo 3, 4, 5 32
Scuola primaria E. Pali - Sondrio 5 25
Scuola primaria Chiuro 4, 5 40
Scuola primaria Ponte in Valtellina 4A, 4B, 5A, 5B 57
Scuola primaria Castionetto 3, 4 12
Scuola primaria Traona 4, 5 54
Scuola primaria A. Vido – Tirano* 5A, 5B 33
Total Students Primary School 253
Secondary School Class No. students
Scuola Media Teglio* 3 16
Scuola Media Teglio-Sondrio 1A, 1B, 1C 60
Scuola Media Sassi-Sondrio 1D, 1E, 1F 67
Scuola Media Turchi-Sondrio 1, 2 36
Scuola Media Regoledo Cosio 1A, 1B, 1C 55
Scuola Media Delebio 1B, 2C 48
Scuola Media Dubino 1A, 3A, 3B 48
Scuola Media Ponte in Valtellina 1C, 1D 38
Total Students Junior High School 368
TOTAL 620 * Classes from the Comunità Montana Valtellina di Tirano
• Collaboration during the development of the final event of the project. This involved assisting during the role game playing by several students from different classes and during the development of an emergency demonstration from the local group of Civil Protection (Table 8.9)
Table 8.9. Participants of the final event of the project about risk education developed by the IREALP
Primary School Class No. students
Scuola primaria Melo 5 13
Scuola primaria Traona 4 28
Scuola primaria E. Pali – Sondrio 5 25
Scuola primaria Chiuro 4 20
Scuola primaria Ponte in Valtellina 4A, 4B 28
Total Students Primary School 114
Secondary School Class No. students
Scuola Media Sassi-Sondrio 1F 24
Scuola Media Turchi-Sondrio* 1, 2 20
Scuola Media Regoledo Cosio 1A 17
Scuola Media Dubino 1A 15
Scuola Media Ponte in Valtellina 1C 19
Total Students Junior High School 95
TOTAL 209

Chapter 8: Communication and Education Strategies
157
8.3.3 Integrative Communication Campaign (Adapted from Fo ntana et al., submitted)
The third component of the communication/education strategies, designed but still to be developed, is a large communication campaign compose of several elements with the main aim of involving the adult population of the CM Valtellina di Tirano. The campaign was designed in collaboration with Fontana, Rossetti and De Amicis, as part of Fontana’s undergraduate thesis.
The content of the communication campaign was defined by combining the indications of the “Direttiva Regionale per la pianificazione di emergenza degli Enti locali” of Lombardy Region with the results of the survey applied in the CM Valtellina di Tirano. In addition, the operative procedure was inspired in advertising strategies. A widespread campaign to try to reach every family was preferred over great events that, even if have greater visibility, at the same time do not have enough long time impact. Therefore, was selected a horizontal communication strategy, that could be carried out by the local authorities (whom are the natural references in case of emergency), and that, at the same time, could become a normal part of everybody daily life.
The last choice, of focusing on the daily life, has two reasons: first because is not yet possible to define the precise moment in which a catastrophe can take place. Therefore, the idea is not to generate fear in people with sudden announcements of imminent disasters, but to help the citizens to recognize that, on a particular territory, specific risks exist, and that with risk awareness and a correct territorial management the risk can be soundly reduced. Second, a daily familiar communication has greater penetration and can be more effective in influencing people reaction.
The linguistic choice was oriented towards messages that promote the direct citizens participation, avoiding negative messages or prohibitions, that are considered little effective in establishing a dialogue (Barszczynska et al., 2006; Abarquez and Murshed, 2004).
These previous considerations were materialized in the creation of four iconic-text symbols (Figure 8.1):
- First, the symbol of “Know the territory” (Conosci il territorio, in Italian): knowledge of the characteristics of the own territory. If I know that my house could be flooded by the river, then there are more possibilities that I will be ready to move away in time. But using which route and in order to go where?
- The second symbol: “Inform yourself” (Informati, in Italian), invites the citizen to know which are the safe routes and the secure zones.
- The third symbol: “Listen” (Ascolta, in Italian), draws the attention on the fact that, in case of emergency, people will not be abandoned, but that the authorities will inform the necessary actions to be taken. Since the various Municipalities of the CM Valtellina di Tirano could use different methods to disseminate the message, it is important to emphasize the necessity of the attention to the message, rather than to the dissemination modality.
- The last symbol: “Protect yourself” (Proteggiti, in Italian), represents the course of action during any dangerous situation: to protect oneself. In case of hydrogeologic risks, the proposed action is to move away from the exposed zones, which brings back to the first symbol.
Figure 8.1. Iconic-text symbols of the communication campaign (Designed by Fontana and Rossetti)

Integrated People Centred Early Warning System as a risk reduction strategy, Northern Italy
158
The communication campaign is composed of four phases. First, the dispatch, to all 10.000 resident families, of a brochure with the four symbols previously described. Afterwards, an umbrella with the symbols printed, will be sent to all families. Later, a public posting campaign will be developed in every municipality explaining the specific content of each symbol, the communication strategy in case of an emergency, the emergency routes and the safe meeting places in every municipality, and for every possible scenario. Parallel to the previous phases, a website has been designed, and will be possibly hosted in the website of the Comunità Montana authorities, with the aim of assuring the continuity of the education. The website contain the designed iconic symbols which will serve as links to several types of information and files, including the Emergency Plan, scientific results about risks in the study area, emergency procedures, contact details in case of emergency, etc. Thus, this communication path starts with an institutional communication, pass through a common object that is kept by the people, and conclude with a local institutional communication, but remains thanks to the possibility to constantly access the website.
The choice of the umbrella is not casual. Hydrogeologic hazards are mainly triggered by rain. An umbrella is an object of common utilization, independent of gender, age and culture, therefore ideal to reach the greater number of people as possible. Additionally, the umbrella presents a wide surface available for information, assuring that every time that a person takes this umbrella because is raining and opens it, sees again the symbols that remind him/her hydrodrogeologic risks. Using this dynamic, it should be possible to transform a simple daily gesture in an action of reminding preventive behaviour, and to contribute to create a common and shared awareness of the territory and its risks. Unfortunately, the cost of producing and distributing the umbrella is quite high; therefore it might not be possible to include it in the campaign. However, we hope that it does not affect the effectiveness of the campaign and that it will be possible to develop all the other components. At the moment we are looking for funding.
At the end of the third phase, the public posting campaign, several public meetings will be performed in different public places of the study site. The aim of the meetings is not only to inform and educate about the local hazards and emergency plan, but also to stimulate the participation of the community in risk reduction strategies. By promoting the participation in the meetings is expected to receive feedbacks from the population which may collaborate to improve the quality of decisions made in the process of planning the warning system and all risk management.
8.4 Conclusions
The process of design and implementation of communicational-educational strategies about risks related to natural hazards was explained in detail. The use of surveys to measure the informative needs and willingness to participate has proved to be an important tool for communication. The use of survey results can facilitate that communication strategies can be designed and tailored to the local characteristics of the population of the study area.
The general lack of self-protection behaviour from the surveyed population was evident. This backs the importance of developing an educational campaign in order to improve the level of preparedness of the population. Despite the general lack of knowledge, there was a clear desire of the population not only to be informed and increase preparedness, but also to participate more actively in disaster risk reduction efforts.
The results show that the preferred sources of information are local institutions and not the scientific community. This indicates the necessity of working in collaboration with the local institutions to transmit scientific information so this information can be willingly received by the general public.
Regarding the media to receive information, there are two important aspects to highlight. First, even when the preferred media are the mass media such as television, radio and press, due to the lack of funding and time restrictions, it was not possible to involve them in this initiative. However, it is expected that once the results of the research will be transmitted to the local authorities, they will continue the efforts of preparing the community as well as the communication-education campaign, and will involve the local mass media. Second, it is interesting to note that even if they are the preferred media, the level of trust of the information received from the mass media is quite low.
The material designed for the informative meetings was handed over to some schools and environmental institutions of the study area. The results of the questionnaire will be provided to the local government to show them the necessity of developing a large scale education campaign. Additionally, some efforts are currently being done with the local authorities and the Civil Protection, to
Chapter 8: Communication and Education Strategies
159
find funding in order to implement the designed Integrative Communication Campaign. With the previous, it is expected that the efforts initiated with this research to increase preparedness of the population will continue.
8.5 References
Abarquez, I. and Murshed, Z. 2004 Community-based Disaster Risk Management field practitioners’ handbook. ADPC
Ballantyne, M., Paton, D., Johnston, D., Kozuch, M., Daly, M., 2000. Information on volcanic and earthquake hazards: The impact on awareness and preparation. Institute of Geological & Nuclear Sciences Limited, Lower Hutt. Science Report 2000/2.
Barszczynska M, Bogdanska−Warmuz R, Konieczny R, Madej P and Siudak M. 2006. In time for the flood. A methodological guide to local flood warning systems. Institute of Meteorology and Water Management, Poland.
Bird, D.K., Gisladottir, G. and Dominey-Howes, D. 2009. Resident perception of volcanic hazards and evacuation procedures. Nat. Hazards Earth Syst. Sci. 9: 251–266
De Marchi B, Scolobig A, Delli Zotto G, Del Zotto M. 2007. Risk Construction and Social Vulnerability in an Italian Alpine Region, FLOODsite Report No. T11-2006-08. ISIG: Gorizia.
De Marchi. B. 2007. Not just a matter of knowledge. The Katrina debacle. Environmental Hazards 7: 141–149 Department of Civil Protection. 2005. Protezione Civile in Famiglia. 2nd ed. Rome:64 p.
Fontana, M., Rossetti, M., De Amicis, M. and Garcia, C. Submitted. La comunicazione efficace come condizione chiave per lo sviluppo di una protezione civile partecipata. Una proposta per la comunicazione preventiva del rischio idrogeologico elaborata per il territorio della Comunità Montana di Valtellina di Tirano. Protezione Civile Nazionale. Italia
Garcia, C. & Fearnley, C. submitted. Evaluating Critical Links in Early Warning Systems for Natural Hazards. Environmental Hazards. Special Publication Disaster Risk Reduction: Connecting Research and Practice
Glantz MH. 2004. Early warning systems: do’s and don’ts. Report of a Early Warning Systems Workshop. Usuable Science 8, Shanghai
Gregg, C., Houghton, B., Paton, D., Swanson, D. and· Johnston, D. 2004. Community preparedness for lava flows from Mauna Loa and Hualalai volcanoes, Kona, Hawai’i. Bull Volcanol 66: 531–540.
Haynes, K., Barclay, J. and Pidgeon, N. 2008. Whose reality counts? Factors affecting the perception of volcanic risk. Journal of Volcanology and Geothermal Research 172: 259–272
IFRC (International Federation of Red Cross and Red Crescent Societies). 2009. World Disasters Report 2009 – People-centred approach and the ‘last mile” IFRC, Geneva.
King, D. 2004. Understanding the Message: Social and Cultural Constraints to Interpreting Weather Generated Natural Hazards. International Journal of Mass Emergencies and Disasters 22 (1): 57-74.
Lindell, M.K. and Perry, R.W. 2004. Communicating Environmental Risk in Multiethnic Communities. Thousand Oaks: Sage Publications
Mileti D, Nathe S, Gori P, Greene M, Lemersal E. 2004. Public Hazards Communication and Education: The State of the Art, Natural Hazards Informer Issue 2. Natural Hazards Research and Applications Information Center: Boulder, CO.
Mileti, D. and Sorenson, J.H. 1990. Communication of Emergency Public Warnings: A Social Science Perspective and State-of-the -Art Assessment. Oak Ridge. TN: Oak Ridge National Laboratory, U.S. Department of Energy.
Mileti, D.S. 1995. Factors Related to Flood Warning Response. US-Italy Research Workshop on the Hydrometeorology, Impacts and Management of Extreme Floods.
Mileti, D.S. 1999. Disasters by Design: A Reassessment of Natural Hazards in the United States. Washington, DC: Joseph Henry Press.
Nigg, J. M. 1987. "Communication and Behavior: Organizational and Individual Response to Warnings. R. Dynes, Bruna de Marchi, and Pelanda, C. (Eds.), Sociology of Disasters: Contributions of Sociology to Disaster Research. Milan, Italy: Franco Angeli: 103-118.
Parker, D.J., Priest S.J. and Tapsell, S.M. 2009. Understanding and enhancing the public’s behavioural response to flood warning information, Meteorological Applications 16: 103-144
Paton, D., Smith, L., Daly, M. and Johnston, D. 2008. Risk perception and volcanic hazard mitigation: Individual and social perspectives. Journal of Volcanology and Geothermal Research 172. p. 179–188
Paton, D. and Johnston, D. 2001. Disasters and Communities: Vulnerability, resilience and Preparedness. Disaster Prevention and Management. 10: 270-277
Pérez-Lugo, M. 2001. The Mass Media and Disaster Awareness in Puerto Rico: A Case Study of the Floods in Barrio Tortugo. Organization and Environment 14.(1): 55-73
Integrated People Centred Early Warning System as a risk reduction strategy, Northern Italy
160
Perry, R.W. and Lindell, M.K. 2008. Volcanic risk perception and adjustment in a multi-hazard environment. Journal of Volcanology and Geothermal Research 172: 170–178
Solana, M. and Kilburn, C. 2003. Public awareness of landslides hazards: the Barranco de Tirajana, Gran Canaria, Spain. Geomorphology 54: 39-48
UN-ISDR. 2006. “Early warning - from concept to action: the conclusions of the Third International Conference on Early Warning (EWC III)”. 27-29 March 2006. Bonn. 32 p.
Wenger, D.E., Dyke, J.D., Sebok, Thomas, D. and Neff, J.L. 1980. It's a Matter of Myths: An Empirical Examination of Individual Insight into Disaster Response. Collective Behavior: A Source Book. Meredith David Pugh (Ed.), New York: West Publishing Co.: 65-78.
Wildavsky, A. 1979. Speaking the Truth to Power: The Art and Craft of Policy Analysis. Boston: Little Brown.
Chapter 9: Mountain risks and risk governance: challenges and lessons learnt
161
Chapter 9: Mountain Risks and Risk Governance: Challenges and Lessons Learnt *
The objective of this chapter is to give an overview of the whole concept of risk governance and its application in the field of natural risks, shedding some light at each single component including Early Warning Systems, explaining its significance and inherent challenges inside the risk governance framework. The chapter is based on a work in progress elaborated in collaboration with collegues of the Risk Governance working block of the European Project Mountain Risks. In this project, single components, ranging from technical to conceptual and social research results, were primarily investigated separately. The challenge was to connect all those different results developed in two study sites, and to analyse their relationship inside the risk governance framework. Due to the complexity and multi-disciplinarity, this is a contribution to identify the main challenges and help to bridge the existing gaps between natural and social sciences in disaster risk research.
9.1. Introduction
Risk governance is an upcoming concept to deal with hazards and risks threatening humans, societies and their belongings. With a strong focus on participation and communication between stakeholders, risk governance tries to face several challenges as the current limitation of research on natural risks, which is fragmented and isolated (i. e. with natural sciences and engineering disciplines on one hand and societal sciences on the other hand) the importance and difficulty of maintaining trust among all stakeholders, and the complex, socio-political nature of risk call for a amplified approach.
Theoretical discussion of risk governance
‘Risk governance’ aims to enhance the disaster resilience of a society (or a region) and includes “the totality of actors, rules, conventions, processes, and mechanisms concerned with how relevant risk information is collected, analysed and communicated and management decisions are taken” (IRGC, 2005). Risk governance is therefore related to the institutional dimension of resilience, which “is determined by the degree to which the social system is capable of organising itself and the ability to increase its capacity for learning and adaptation, including the capacity to recover from a disaster” (ISDR 2002). This definition points at three elements of risk governance: 1) risk assessment and 2) risk management that have to be embedded in a 3) risk communication process among scientists, politicians and the public (public and private stakeholders).
Aiming at the development of integrative models and concepts that link the different phases of risk governance mentioned before, attention has to be paid to the given differences in characteristics of the several risk types, both on the collective level and the individual perception of risk. There are many factors known to affect an individual’s perception of risk, namely familiarity with a risk, control over the risk or its consequences, proximity in space, proximity in time, scale of the risk or general fear of the unknown (the so called “dread factor”). Apart from these factors, individual risk perception is also shaped by how the community or a certain socio-cultural milieu generally deals with a special type of risk or risky situations. Risk perception enters the risk management equation through differing estimations on, for example, how probable an event may be, and how much money is to be spent on preparedness according to the level of acceptable risk which is a characteristic of each single cultural setting (see in more detail section 9.3.1-III). These factors might contribute in each single case in a different manner to the perception and estimation of risk. In addition, they are strongly interlinked with more collective socio-political factors and form a particular culture of risk. The variation in different cultural (regional, national) contexts is a perspective studied within the cultural risk paradigm. This cultural dimension is addressed by section 9.3.2-I .which is about differences in legal settings, risk cultures and insurance possibilities among Europe.
Risk governance has become increasingly politicised and contentious. The main reasons are controversies concerning risk that are not about suitable scientific methodologies for hazard and risk assessment (Armaş & Avram, 2009). Rather, risk controversies are disputes about who will define risk
* Based on: Kappes, M., Garcia, C., Peters Guarin, G., Angignard, M., Glade, T., Greiving, S., Blahut, J., Frigerio, S., Keiler, M. (in preparation) Mountain Risks and Risk Governance: Challenges and Lessons Learnt
Integrated People Centred Early Warning System as a risk reduction strategy, Northern Italy
162
in view of existing ambiguity. In many cases policy discourse is not about who is correct about assessment of danger, but whose assumptions about political, social and economic conditions, as well as natural or technological forces win in the risk assessment debate. Thus, the hazard as a potentially damaging physical event is real, but risk is socially constructed.
Scientific literacy and public education are important but not the only aspects necessaries to avoid conflicts about risk. Emotional response by stakeholders to issues of risk is truly influenced by distrust in public risk assessment as well as in risk management. Due to this fact, those who manage and communicate risks to the public need to understand the emotional responses towards risk and the way risk is perceived by the at-risk population. This aspect is addressed by section 9.3.1-I about incorporation of lessons learnt from past disasters. It is a matter of the definition of risk how risk policy is carried out. Moreover, defining risk is an expression of power. Slovic (1999) thereby argues that whoever controls the definition of risk controls risk policy. Within the communication strategies in all approaches, trust can be seen as a central term in this respect (Löfstedt, 2005).
Distrust makes institutional settings vulnerable as it lowers the efficiency and effectiveness of management actions. The whole disaster cycle from mitigation, preparedness, response to recovery is embedded in an institutional system. Thus, institutional vulnerability can in principle be understood as the lack of ability to involve all relevant stakeholders and effectively co-ordinate them right from the beginning of the decision-making process. It refers to both organisational and functional form as well as guiding legal and cultural rules. Consequently, a stakeholder-focused process is needed meaning consulting and involving administrative stakeholders as well as the general potentially affected community. In this regard, research on risk governance has to be understood as co-operative research: a form of research process which involves both researchers and non-researchers in close co-operative engagement. This aspect is discussed in more detail by section 9.3.3-I which is particularly about stakeholder involvement, but also considered as a main lesson by the sections 9.3.1-II which in on multi risk assessment and 9.3.2-III on early warning systems and evacuation plans. However, any communication has to be tailor-made to the educational background as well as social and cultural beliefs of individuals and groups. This is considered by section 9.3.3-II on the use of geo of geo-information and role of modern visualization tools for risk communication.
Relevance for mountain risks
The concept of risk governance has been created and adapted in the area of new emerging mostly man-made risks. Nonetheless, it is of particular relevance for mountain risks. Actually the successful management of mountain risks is limited due to the fact that the interactions between individual sectors, disciplines, locations, levels of decision-making and cultures are not known or not considered (IRGC, 2005; Greiving et al., 2006a). Inadequate public available information about risks in terms of societal and natural dimensions, inapprehensible procedural steps as well as insufficient involvement of the public in the risk related decision-making process lead to severe criticism and distrust towards respecting relevant decisions in regard to a specific risk.
Decisions in the area of so called “traditional” hazards like mass movements, taken mainly on the basis of engineering expertise, are normally based on probabilities because they are mainly past-oriented and informed by statistics. However, analyzed data are only available for a specific period – and are thus not representative for longer periods. This principle problem is even enlarged by the observed climate changes related effects on temperature and precipitation, which will certainly lead to new uncertainties, because past events might be not representative anymore. Similarly, changes in the catchments (e.g. deforestation, melting of glaciers, surface sealing through settlement development, etc.) will lead to high uncertainties. Here, the perspective changes from probabilities to just possibilities. With public decision-making not having any precise information at hand, restrictions for private property rights are probably not anymore legally justifiable. Hereby, justification of actions and consensus about thresholds for acceptable risks and response actions becomes more important (see section 9.3.1-III).
Within the global change debate, the field of climate change in general, but particularly as a triggering factor for many natural hazards, is of special importance for Europe with its existing settlement structures, cultural landscapes and infrastructures which have been developed over centuries. Prevention actions, carried out i.e. by spatial planning (discussed more in detail in section 9.3.2-II), are under these circumstances less effective than in countries which are still growing rapidly in terms of population and the built environment. Here, disaster prone areas can be kept free from further development whereas most of these areas are in Europe already built-up. However, this calls for authorities to improve public risk awareness and to look for means to mitigate this problem. Moreover,
Chapter 9: Mountain risks and risk governance: challenges and lessons learnt
163
measures based on mandatory decisions of public administration, as well as measures which are in the responsibility of private owners need to be understood and regarded as suitable by their addresses for their implementability. This is clearly visible when looking at evacuation orders or building protection measures to be taken by private households. Having these facts in mind, the “active involvement”, of the population at risk, propagated e. g. by the European Communities Flood Management Directive (European Communities, 2007), has to be seen as crucial for the success of the Directive’s main objective: the reduction of flood risks. Within the European Community it has also been recognized, that a risk approach has also to be applied to other natural hazards such as coastal hazards or soil erosion and landslide hazards (e.g. Soil Thematic Strategy 2006).
As previously mentioned, the single components of the risk governance framework presented in this chapter have been worked on in two study sites, the CM Valtellina di Tirano, already described in detail, and the Barcelonnette Basin, both briefly described next.
9.2. Study Areas
The Barcelonnette Basin
The Barcelonnette Basin covers an area of approximately 280km² in the Southern French Alps with elevations ranging between 1100m a.s.l. at the bottom and 3000m for the surrounding peaks. The valley is drained by the Ubaye River which is fed by several torrents entering from the steep slopes. It presents a mountain climate with marked inter-annual rainfall variability (733 +/- 412mm between 1928 and 2002), continental influence implying significant daily thermal amplitudes (> 20º) and Mediterranean influence leading to heavy summer rainstorms (Maquaire et al. 2003; Flageollet et al. 1999). After massive deforestation in the 18th century, reforestation started around 1864 (under the responsibility of the RTM - Service de Restauration des Terrains de Montagne) as reaction to increased debris flow activity and the forest cover is rising since that time (Remaître 2006). Due to this geomorphological and climatic setting, in combination with the geology (autochthonous black marls under allochtonous Flysch), the valley is very prone to several types of mass movements including rockfall, debris flows (100 events recorded since 1850), several major mudslides (Poche, La Valette and Super Sauze) and shallow and deep seated landslides (Maquaire et al. 2003; Remaître 2006). Furthermore, especially torrential (461 events recorded since 1850) and river floods but also avalanches pose a considerable threat (Remaître 2006).
The Basin covers eight municipalities of the Community of Communes "Vallée de l'Ubaye" and has a population of about 6500 inhabitants. The main source of income is summer and winter tourism which involves high increases of the population during these periods.
According to the French law, the municipalities at risk, marked out by the prefect of the “Département”, have to elaborate a risk prevention plan (Plan d’Exposition aux Risques Naturels - PER or Plans de Prevention des Risques Previsibles - PPR). It is the case for the municipalities composing the Barcelonnette Basin and all of them have a risk prevention plan. The resulting plans are integrated in the spatial planning process, excluding e.g. zones of high hazard for further constructions.
The Mountain Consortium of municipalities Valtellin a di Tirano (CM Valtellina di Tirano)
The detailed description of CM Valtellina di Tirano is presented in Chapters 3 and 4 of this thesis.
9.3. Elements of Risk Governance
9.3.1. Risk assessment (Melanie Kappes and Carolina Garcia)
According to the IRGC (2005, p. 6) risk governance is “not just about risk management, it starts at the much earlier stage of “risk pre-assessment”, in which the essential aspects of the risk […] are identified early and broadly”. Societies have therefore, the responsibility to identify the risks and factors leading to disasters and decide on this basis about the appropriate interventions to control or manage them. Risk assessment is then a central stage that, more than a purely scientific task, should be seen as a collaborative activity that brings professionals, disaster managers, local authorities and the people living in the exposed areas together to assess the risks (Fischhoff et al., 1983; O’Brien, 2000; UN-ISDR, 2005b; Plapp, 2001).

Integrated People Centred Early Warning System as a risk reduction strategy, Northern Italy
164
According to IRGC (2005), the major task of risk assessment is to identify and explore, preferably in quantitative terms, the types, intensities and likelihood of the undesired consequences related to the occurrence of a threatening event. In addition, these consequences are associated with special concerns that heterogenous individuals, social groups or cultures may attribute to these risks. Furthermore, local communities have different knowledge and perceptions about hazards and risks, so at individual and household level the tolerability and acceptability of risks may vary. Taking into account the previous, the IRGC (2005) framework for risk governance broadened the concept of risk assessment by adding the parallel activity of concern assessment which considers individual, organisational and societal perceptions of and concerns about the consequences of risk. Once these factors are taken into account, further risk management steps as prevention, preparedness, response and recovery can be planned and carried out in order to prevent, reduce or alter the negative consequences of a potentially damaging event by choosing contextualised actions that respond to the local reality.
Risk assessment, according to IRGC (2005), is confronted with three major challenges that can be best described using the terms ‘complexity’, ‘uncertainty’ and ‘ambiguity’. These three challenges are not related to the intrinsic characteristics of hazards or risks themselves but to the state and quality of knowledge available about both hazards and risks. For a successful outcome to the overall risk governance, it is crucial that the implications of these challenges are made transparent at the conclusion of risk assessment and throughout all subsequent phases. Additionally, it is important to avoid the traditional hazard focus approach of risk assessment and to assure that vulnerability of the exposed population is also taken into account as well as the social, economic and environmental context in which hazardous events take place (Chang Seng 2010).
In the framework of the Mountain Risks project, three facets of risk assessment were considered in more detail: i) the identification of the relevant hazards mostly on the basis of collected information on past events and lessons learnt by the population involved; ii) the qualitative and/or quantitative analysis of multi-hazard risk and iii) the evaluation of the acceptability and tolerability risks levels. These three components are examined in detail in the following:
I. Incorporate the lessons learnt from past disaste rs (Carolina Garcia, Marjory Angignard and Jan Blahut)
The lessons learnt from past disasters involve (i) experiences and local knowledge of the population at risk, as well as ii) scientific analysis of information on past events, which combined and incorporated in practical structures serve to reduce the vulnerability of human systems (De Marchi 2007).
(i) Lessons learnt by the population can either emerge from direct experience of hazardous events or from transfer of this knowledge from generation to generation. These lessons learnt may increase the level of knowledge, awareness and preparedness, thus contributing to disaster risk reduction (Cashman and Cronin 2008, Gaillard et al. 2008, UN/ISDR et al. 2008). The local knowledge arising from lessons learnt can be incorporated in disaster management strategies and in consequence can lead to a more cost-effective, sustainable, more realistic and site-specific emergency plan (Thapa et al. 2008, Komino 2008; Barszczynska et al., 2006), contributing in this way to the local risk governance. Another advantage involving local population is that it promotes mutual trust, acceptability, common understanding, and improves the community’s sense of ownership and self-confidence (Dekens 2007). However, this does not mean that all local knowledge, practices, and beliefs are relevant, sustainable or appropriate for risk governance and disaster risk reduction. It is fundamental to study and analyse the existing local knowledge, to elicit the information relevant for decision-making and to assess how to integrate it into local policy in order to facilitate the risk governance process. This step is challenging, first, due to the general belief in the scholar community that scientific knowledge is ‘superior’ to local knowledge, and second, due to the fact that to identify, use, assess, validate, generalize and replicate local knowledge is difficult and time consuming (Dekens 2007). Since local knowledge, as well as the level of risks are both dynamic and change over time, preparedness and response strategies should be continuously adapted to the new conditions, updated and rehearsed on regular basis (Thrupp 1989, United Nations 2006). This is particularly important when a period of 20 to 30 years has passed since the last significant threat or event (Southern 1995), or when previous crisis were successfully managed and their impacts and damages were low. Any of the previous aspects can generate among the authorities and the exposed population an underestimation of the risk and an increment of vulnerability. According to Thapa et al. (2008), in the last decades, there has been a tendency to not pass the local knowledge from one generation to the next anymore, causing that knowledge and perception are more and more restricted

Chapter 9: Mountain risks and risk governance: challenges and lessons learnt
165
to the personal experiences and no longer to the collective memory. For this reason, it is crucial that academic researchers collect, compile and systematize the diverse range of local knowledge before it disappears.
(ii) Regarding scientific research, the collection and analysis of past events is an integral component of hazard analyses and assessments, e.g. for calibration or validation of future risk scenarios. The primary step for the analysis of past events is the composition of integral databases composed by the information available of previous hazardous events. The detailed analysis of the databases gives an indication which areas could be affected in the future, the expected magnitude and intensity of the events, their temporal frequency and the possible impacts on the territory. Databases generally contain geographical, numerical and alphanumerical information at different geographical and temporal scales, in various digital formats, including: vector and raster maps, terrestrial, aerial and satellite imagery, time series, tabular data, texts, documents and images. Information stored in geo-databases can be compiled at different geographical and temporal scales, using a variety of methods and technologies (Couture and Guzzetti 2004). However, the geo-databases need to be well designed, compiled and validated. Moreover, the compilation of this kind of database is very time-consuming and, particularly the collection of historical information requires skills in history, linguistic, etc. Additionally, the uncertainties connected with type of harmful processes regarding their temporal and spatial location increase back in time. When these ambiguities are well handled, the database represents a very valuable basis for hazard/risk analysis for civil protection purposes as well for spatial planning and risk governance.
Finally, the scientific analysis of past events combined with the local knowledge of the population is crucial to predict the characteristics of a future event. This information is essential in the operational risk governance and must be communicated to the general public and other stakeholders.
Case study: Collecting local knowledge and informat ion of part events
i) At CM Valtellina di Tirano, northern Italy, a comprehensive survey among the local population was performed in order to evaluate, among others, the previous experiences of natural hazards, the risk perception of landslides and flooding and the level of preparedness of the population. Results from Garcia (in prep.) showed that most of the population (88.3%) either have experienced floods and/or landslides in the past, or know about the occurrence of past events, especially the big event of 1987. Despite of this, the average level of perceived risk is rather low with a mean = 2.2/5 - based on a Likert Scale (Babbie 2005) of 1 to 5, with 1 being the lowest perceived risk and 5 the highest. In Table 9.1 the relationship between the previous experiences and knowledge of past events versus the perceived levels of risk and preparedness levels is shown. Results indicate that the perceived levels of risk, knowledge and preparedness are generally low. Moreover, previous experience or awareness of the occurrence of past events, have no significant effect on the perceived levels of risk, knowledge and preparedness.
Table 9.1. Cross tabulation with results of Previous Experiences versus perceived levels of risk, knowledge and preparedness of the population (Adapted from Garcia et al., in prep.)
Previous
experience of natural hazards
Perceived Risk
Individual prepared-
ness
Population prepared-
ness
Individual risk
knowledge
Population Risk
knowledge
I. Yes, but no damage suffered
2,2 2,4 2,5 2,5 2,6
II. Yes, and directly affected
2,3 2,5 2,5 2,7 2,9
III. No, but with knowledge of past events
2,2 2,4 2,6 2,5 2,7
IV. No, without knowledge of past events
2,1 2,4 2,3 2,4 2,8
0,0 1,0 2,0 3,0 4,0 5,0
I.Yes
,af
fect
edII.
Yes
, no
affe
cted
III.N
o, w
ithkn
owle
dge
IV.N
o, n
okn
owle
dge
Pre
viou
s E
xper
ienc
e
Population Risk know ledge
Individual r isk know ledge
Population preparedness
Individual preparedness
Perceived Risk
Perceived levels of:
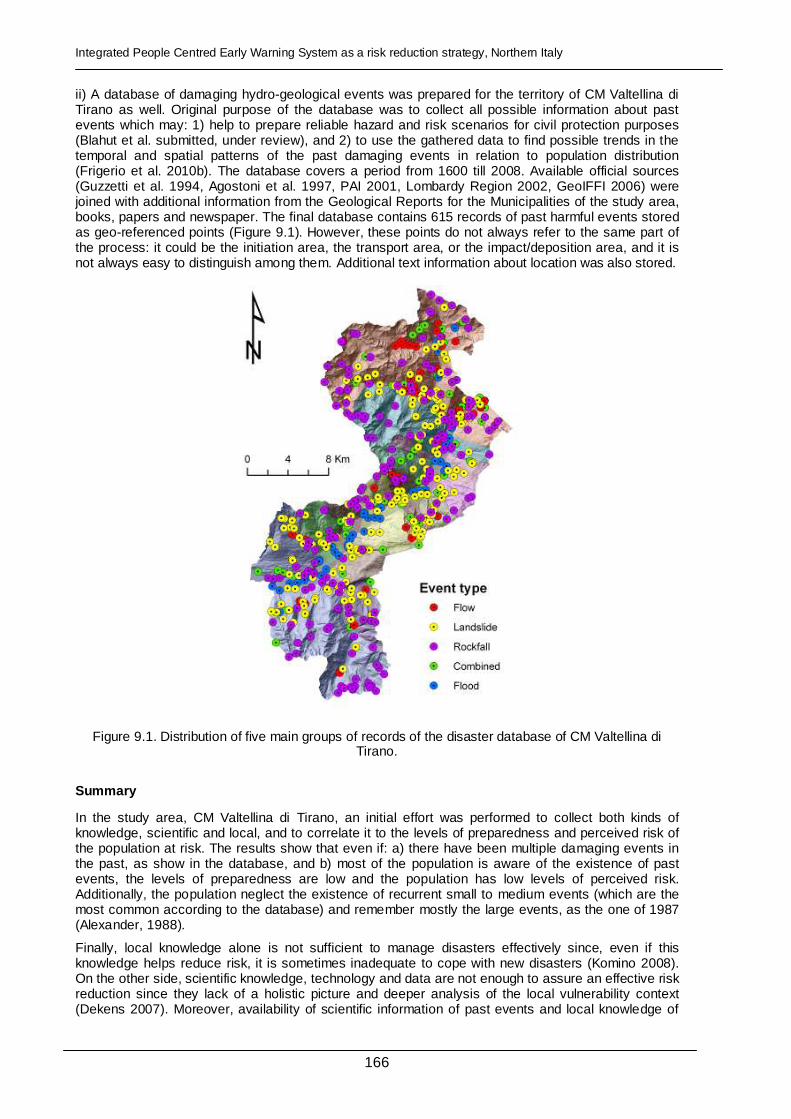
Integrated People Centred Early Warning System as a risk reduction strategy, Northern Italy
166
ii) A database of damaging hydro-geological events was prepared for the territory of CM Valtellina di Tirano as well. Original purpose of the database was to collect all possible information about past events which may: 1) help to prepare reliable hazard and risk scenarios for civil protection purposes (Blahut et al. submitted, under review), and 2) to use the gathered data to find possible trends in the temporal and spatial patterns of the past damaging events in relation to population distribution (Frigerio et al. 2010b). The database covers a period from 1600 till 2008. Available official sources (Guzzetti et al. 1994, Agostoni et al. 1997, PAI 2001, Lombardy Region 2002, GeoIFFI 2006) were joined with additional information from the Geological Reports for the Municipalities of the study area, books, papers and newspaper. The final database contains 615 records of past harmful events stored as geo-referenced points (Figure 9.1). However, these points do not always refer to the same part of the process: it could be the initiation area, the transport area, or the impact/deposition area, and it is not always easy to distinguish among them. Additional text information about location was also stored.
Figure 9.1. Distribution of five main groups of records of the disaster database of CM Valtellina di Tirano.
Summary
In the study area, CM Valtellina di Tirano, an initial effort was performed to collect both kinds of knowledge, scientific and local, and to correlate it to the levels of preparedness and perceived risk of the population at risk. The results show that even if: a) there have been multiple damaging events in the past, as show in the database, and b) most of the population is aware of the existence of past events, the levels of preparedness are low and the population has low levels of perceived risk. Additionally, the population neglect the existence of recurrent small to medium events (which are the most common according to the database) and remember mostly the large events, as the one of 1987 (Alexander, 1988).
Finally, local knowledge alone is not sufficient to manage disasters effectively since, even if this knowledge helps reduce risk, it is sometimes inadequate to cope with new disasters (Komino 2008). On the other side, scientific knowledge, technology and data are not enough to assure an effective risk reduction since they lack of a holistic picture and deeper analysis of the local vulnerability context (Dekens 2007). Moreover, availability of scientific information of past events and local knowledge of

Chapter 9: Mountain risks and risk governance: challenges and lessons learnt
167
previous experiences do not guaranty an effective risk reduction, neither a good governance process. A recent example of this is what happened in New Orleans due to Hurricane Katrina in 2005, when a large disaster occurred despite of all the scientific information and local knowledge available and even with a precise and timing forecasts and warnings (De Marchi, 2007; Ripley, 2008). What is fundamental is the ability to combine them and to put them into practice being this the real reflex of learning from previous experiences. Combining both types of knowledge is crucial to reduce uncertainty, thus proving more precise information for the decision-making, key element of any risk governance process. According to Wanczura (2006), the aim of providing people with information is to broaden their view of hazards and risks, because only those hazards and risks that are known can be mitigated. Therefore, it is fundamental to increase the level of awareness of the population with a participative educational campaign about the natural hazards and risks of the area. This aims to generate an increase of preparedness of the population so they could effectively respond to emergencies and additionally, be active participants in the risk governance process.
The scientific results obtained with surveys, like the one here described, should be communicated to the local authorities as well. This may help authorities to adapt the existent governance framework not only to the physical situation but also to the perception, awareness and knowledge of the population.
II. Multi-hazard risk analysis (Melanie Kappes, Tho mas Glade and Margreth Keiler)
Information on hazards, vulnerabilities and risks is a fundamental aspect of risk governance since it provides the basis for decision-making at the different administrative levels for the respective administrative units (municipalities, departments, the whole country, etc.). Reliance only on lessons learnt and hazard/risk information from past events is, as outlined in the previous section, not enough since inventories are incomplete, hazards and vulnerabilities change over time and risk perception fades. Risk analyses contribute a more comprehensive and scientific-based rating of the natural hazard and vulnerability situation to the risk governance process. Their elaboration has to be fitted to: the needs of the stakeholders and end-users regarding the area to be considered (e.g. administrative units as municipalities, departments or whole nations), the type of scenario to be computed (e.g. events with a re-occurrence period of 100 year), the unit of the output (e.g. monetary values, hazard/risk classes or probabilities), etc. (Kappes et al. 2010). Once risk analyses are spatially oriented, all hazards related to the specific area (in the following called multi-hazard) have to be taken into account (Greiving et al. 2006b) to enable overall risk reduction. The combination several natural hazards, with diverse characteristics, which interact with a multitude of stakeholders with diverging roles, leads to major challenges. In the field of natural sciences, the main problems are (1) the comparability of hazards since they vary in “nature, intensity, return periods, and […] effects they may have on exposed elements” (Carpignano et al. 2009, p. 515). Moreover, (2) the available models (heuristic, statistic, physically based, etc.) depend on hazard type, scale, data typology and resolution (Delmonaco et al. 2006) and make the comparison due to very different results (units of the outcome, quality, uncertainty, resolution, etc.) even more difficult. In the case of (3) vulnerability models, the situation is very similar: for some hazards such as…, a variety of analytical methods to calculate vulnerability exists with approaches that vary widely between hazards; for other hazards, such as…, no methods or only very few are established (Hollenstein 2005). Additionally, (4) prerequisites such as the availability and the quality of data play an important role since on them depend factor such as: the model choice, the information value of the results and the degree of detail of the conducted analysis. However, good data coverage for a variety of hazards is a rare situation. This leads to (5) different uncertainty levels for the various hazards, another important issue that has to be considered. Uncertainty is related to the quality of the input data and to the modelling procedure, but also to unperceived and unknown processes, thus in the “currently best possible” representation of the reality. Furthermore, (6) natural hazards are not independent from each other, but hold a high connectivity and interlinkage regarding a comprehensive geosystem (Kappes et al. 2010). The most prominent example are cascades (also called hazard chains or domino effects), in which one threat triggers at least one other hazard or, in a chain, even further ones, e.g. rock falls and landslides in a mountainous area triggered by an earthquake (Delmonaco et al 2006, Marzocchi et al. 2009). The consideration of these effects is fundamental since chains “expand the scope of affected area and exaggerate the severity of disaster” (Shi et al. 2010, p. 5). The multi-hazard risk analysis problems are amplified by difficulties concerning administrative issues, such as (7) distributed responsibilities and thus separated estimation/modelling of single hazards. This results in hardly any comparability between the outcomes (Marzocchi et al. 2009). For instance, different natural hazards, such as hydrological (floods), meteorological (storms) and geological (mass movements) processes, are in many countries handled by different institutions. This separation leads to rising problems if a proper coordination between the

Integrated People Centred Early Warning System as a risk reduction strategy, Northern Italy
168
organizations concerning the analysis of natural hazards for the consolidation of multi-hazard maps cannot be established. Young (2003), describes a very similar situation in the framework of environmental resources management and called this phenomenon “the problem of interplay”. To overcome this obstacle, an overall analysis scheme is needed which is difficult to establish due to the inherent natural hazards’ differences. However, this is even more difficult to apply when a range of institutions are in charge of single processes. Furthermore, the (8) natural and the administrative system are in most cases, neither sharing the same spatial nor temporal framework conditions. Hazards are not restricted to administrative boundaries (e.g. river floods or earthquakes can involve several administrative regions), but hazard management is; or at least a higher requirement of coordination is necessary between the two administrative units on the two sides of the border. In these cases, hazard analyses can not be limited to the administrative unit, since the cause of a damaging event might lie far away from the area of impact, as in the case of earthquakes where the impact reaches areas at far distances from the epicenter. Some hazards exhibit very long return periods, therefore preventive measures could not show any effect during one or few legislative periods - Young (2002) entitled this phenomenon as “problem of fit”. However, not only the stakeholders involved in the elaboration of the analysis, but also (9) those depending on the outcome, show varying interests. Information needs of emergency managers and civil protection are surely different from those of spatial planners.
An approach to overcome several of the above mentioned difficulties is the development of one single multi-hazard risk modelling platform. This has been done in the USA with HAZUS (Buriks et al. 2004), in New Zealand with RiskScape (Reese et al. 2007) and in Central America with CAPRA (CEPREDENAC et al. 2010). These tools enable the rapid and user-friendly modelling of several natural hazards. Additionally, they assure comparable single-hazard risk outcomes due to a coherent overall analysis scheme.
Case study: Development of a multi-hazards risk ana lysis tool
A multi-hazard risk analysis (MHRA) tool/software, with the initial set of hazard models for debris flows, rock falls, shallow landslides, floods and avalanches was created. Multi-hazard risk analyses are understood by the authors as top-down topic which means that, the general patterns are identified on basis of a small scale analysis, and on this basis the need for more detailed local studies are determined. Therefore, the first step in the development of this tool was the establishment of the general overview modelling. Thus, it consists of simple empirical models based on derivatives of a digital elevation model, data which is better and better available in all regions of the world. Optional input is information on land use/ land cover and geology, also frequently available. The MHRA tool is based on the methodologies from: Horton et al. (2008) for debris flows source identification; Corominas et al. (2003) for rock fall; Montgomery & Dietrich (1994) for shallow landslides; Maggioni (2004) for avalanches; Horton et al. (2008) for the runout of all previously mentioned processes and Geomer (2008) for floods.
The software guides the user through the whole procedure of hazard analysis, model validation with confusion matrices (Beguería 2006), and inclusion of elements at risk. Finally, the multi-hazard risk result is visualized in a web-mapping tool or can be viewed individually in ArcGIS. The visualization in a predefined way shall help to directly show the relevant aspects of this multi-dimensional topic, according to the needs and legislative framework in each specific case, and support the effective communication of the results.
This first step comprised only the development of the tool, concentrating on the scientific and technical challenges of such an approach, including the analysis scheme and the creation of the proper software. In the next step, stakeholders have to be involved to adjust the tool according to their needs, wishes and practicability. This initial step offers the basis for a discussion and adjustment of the tool, since e.g. the opinion on this beta version or proposals for changes can be given much more easily than in a theoretical discussion about something non-existing.
Summary
MHRA are an important component of risk governance since they provide fundamental information for the whole process. However, MHRA show a wide range of challenges for the natural scientist, as well as for the administration in charge of their implementation and the risk management in general. A functional tool to overcome several problems is the creation of a MHRA platform. This platform serves to automating the analysis procedure in order to standardize and simplify the analysis. Nevertheless, the institutional problems in the current administrative and legislative system are not solved by an

Chapter 9: Mountain risks and risk governance: challenges and lessons learnt
169
analysis platform since input data is still produced or stored by various institutions, different organizations are in charge of hazard and risk analysis and management from the different processes. Although one analysis platform used by all involved institutions might facilitate a more coherent MHRA, a close communication is indispensable. Within the risk governance framework communication is the key condition and numerous remaining limitations can be overcome by very intensive and open exchange and clear arrangements. This goes far beyond an exchange between institutions in charge of the analysis and management of the different processes including also arrangements with the users concerning the resulting products (e.g. accuracy needed, kind of maps, reports and advices).
III. Establishing practical thresholds for accepta ble and tolerable risks (Graciela Peters Guarin)
Multi-hazard risk analyses consider only the probabilities and the direct negative consequences of natural events. However, in these assessments is not always made clear if the society or community under threat is able or not to deal with the damages caused by these events. Furthermore, when detailed information is available risk analysis are mostly limited to provide numbers on the potential losses per year or under determined hazard scenarios. Often and particularly at very local level these analysis do not include analysis about the existence or not of strategies in place for lessen or avoid the damages consequences or the capacity that communities or individuals do have to cope with the negative consequences.
In the European Union most of the countries, have a formal approach to risk management based on risk transference. In this setting the financial consequences of particular risks (natural hazards in this case) are shifted from one party to another, for instance when the individual is obliged to transfer the risk of his life or property to an insurance company by enforcement of the country legal regulations,. In these cases the ‘government’ or legal institutions are the ones that determine what levels of risk are acceptable or tolerable for the society and the individuals should comply with these regulations. Risk acceptability and tolerance, therefore greatly depends on the existing social, economic, political, cultural, technical and environmental conditions present in a society at a given moment in time.
In countries where official approaches are not available or where an agreement at ‘society’ level has not been established the responsibility for managing the potential consequences of natural events and absorbing or transferring the risk is laid on the individual or household. In these settings establishing ‘acceptable’ or ‘tolerable’ levels of disaster risk is a complex task as at this level for people do not necessarily share the same perceptions of the significance, consequence and underlying causes of different risks (ISDR 2010).
In natural sciences research, and particularly for phenomena such as mass movements, there are surprisingly few studies that examined household’s response to diverse hazards, their adjustments and economic tolerance to the damage caused by those hazards (CDRSS 2006); this despite the fact that, when examined at worldwide level, risk transference and insurance is the exception and not the rule. There is a need to put more attention on the social and risk management context in which hazardous phenomena take place (Kindell and Hwang 2008). Proximity, previous experiences but moreover household characteristics and the socio-economic context in which they live their daily lives greatly determine how people perceive risk and their willingness to accept it or reduce it. Approaches to risk assessment that take into consideration not just the physical event, its consequences but moreover the social context of risk perception and acceptability in which threatening landslides take place. Such analysis will therefore provide a better understanding of individual, household and societies’ thresholds for consequences manageability and acceptability. Consequently mechanism for risk management (i.e. risk transference) can be tailored to the context in which natural events take place and respond to the needs and realities of threatened people.
Case study
The locality of Tresenda (Teglio Municipality, CM Valtellina di Tirano) was selected as a case study due to its continuous exposure to different mass movements. due to its geological and geomorphologic setting Tresenda presents conditions that favour the occurrence of debris flows. The extreme hazardous setting present in such a small area determine that the inhabitants of this village are one of the most exposed to significant potential losses in the area (Sterlacchini et al. 2010; Blahut, accepted). Soil slips, and debris-flows have already occurred on the steep slopes above Tresenda as result of the collapse of dry-stone terraces or unconsolidated material from unstable/intensely fractured areas (Blahut, accepted). This small village already suffered disastrous landslides several

Integrated People Centred Early Warning System as a risk reduction strategy, Northern Italy
170
times in the past, with major events occurred in 1883 and 2002. On May 23, 1883 two soil-slips occurred on the slope above the village. These slips derived in debris-flows that affected a large portion of the community and left 18 people dead, levelled buildings, damaged properties and blocked the national road (SS 38) .
The current research makes use of an approach that combines community-based tools such as surveys and semi-structure interviews with the results obtained from numerical debris flow modelling and derived synthetic physical vulnerability curves. The analysis is focused on household’s tolerability to (building) damage caused by debris flows and is supported by a spatial analysis in a GIS environment.
Thresholds for the building damage and for the economic value (in Euros) to be invested in reconstruction were defined by means of open interviews. These thresholds are associated with the vulnerability of the household (to building damage) and is used to spatially depict the risk perception of inhabitants in debris flow prone areas, to indicate the scope for economic losses manageability and tolerance levels of the households to potential damage derived from recurrent events and to quantify the hazardous events which may exceed the levels of household risk tolerance.
IV. Summary on risk assessment (Carolina Garcia and Graciela Peters-Guarin)
The differences among scientific knowledge and local knowledge are numerous. While scientific knowledge is of a more global and general nature, people’s knowledge is usually local and contextual. In spite of the differences, both kinds of knowledge are equally important and complement each other. In order to generate an effective risk reduction, it is fundamental to move beyond the disjunction of local versus scientific knowledge and to work towards their integration in the risk governance framework.
The role of scientists is fundamental to accomplish the integration of multiple type of knowledge and its application in disaster risk assessment in the framework of risk governance. Scientific projects about local knowledge could serve to encourage policy-makers to incorporate the local knowledge in the disaster management initiatives. Several scientific tools have been created to study local knowledge and to integrate it later with scientific knowledge. For example, Dekens (2007), developed a framework for data collection and analysis of local knowledge related to disaster preparedness, while Mercer et al. (2009), developed a framework focused on the use of participatory techniques, to integrate both indigenous and scientific knowledge within risk governance and disaster risk reduction frameworks. Local and scientific knowledge need to be elicited, normalized and converted in ‘official formats’ which decision-makers are more familiar with, i.e. by adding geo-references, coordinates, legends, scale (Peters-Guarin et. al., 2010). Results if the integration should be articulated in a language appropriate for a policy debate, providing opportunities for connecting the public with the government (De Marchi, 2003; European Commission 2004).
Once the risk analysis has been performed taking into account the local and scientific knowledge, the most controversial phase of risk assessment follows: to estimate the acceptable and tolerable risk levels (IRGC 2005). These acceptable and tolerable risk levels should be defined based on the lessons learnt from previous experiences, information on past events available, results from multi-hazard, vulnerability and risk analyses, and perceptions and value judgements which also influence risk acceptability (IRGC 2010). An additional understanding of required risk reduction and mitigation measures is also necessary to establish the tolerability and acceptability risk levels,. To define these levels, is fundamental the participation of the population which will have to live with the consequences of the risk management decisions (Renn and Schweizer 2009). This can be accomplished by opening public forums on the internet, by organizing public hearings, meetings and roundtables and/or by conducting citizen panels or juries (Rowe and Frewer, 2000; Renn, 2004). The judgment of tolerability and acceptability levels reaches beyond the risk itself and into the realm of policy-making and societal balancing of risks and benefits (IRGC 2005), factors which eventually defined the following risk management and risk governance.
At this respect, the development of multi-hazard analysis models for risk assessments are a useful tool for decision-making within the framework of risk governance. However, as any other model, they have limitations and the complexity of their elaboration and application is challenging. The output of multi-hazards models depend on the quality of the input data, are bound to reflect modellers’ assumptions and their results can be misinterpreted or misused (IGRC, 2005). In order to increase the effectiveness of the models inside the risk governance process, it is important to assure that end-users and decision-makers have a basic understanding of the models. This will allow them to accurately judge

Chapter 9: Mountain risks and risk governance: challenges and lessons learnt
171
the results of the model and in this way, to avoid a potentially problematic over- or under-reliance on the analysis results. Additionally, it is important to adapt the tool to the specific conditions of the area and to the needs of the decision-makers and other stakeholders. Moreover, stakeholder’s involvement in risk assessment and governance is becoming highly advocated (EU-CEC 2002, OECD 2003, Assmuth et al. 2009). The involvement of stakeholders is required to guarantee that the risk assessment process is inclusive and responsive to those affected by it, to make sure that all values and preferences are communicated to the decision-makers ultimately responsible for deciding how to handle the risk and to maximise the effectiveness and acceptability of those decisions (IRGC 2005, Renn and Schweizer 2009).
Regarding the relationship of multi-hazards with the tolerability and acceptability risk levels, a key concern pointed out by Assmuth et al. (2009), is that even if single risks could be relatively easily assessed and managed, cumulative risks for multiple stressors may be unforeseen and unacceptable. A risk, even when acceptable per se, may exceed limits in combination with others. Assessing these cumulative risks is a major scientific and methodological challenge, but it is also a societal issue, even more because such risks in particular are likely to be distributed unevenly (National Environmental Justice Advisory Council 2004, Assmuth et al. 2009).
According to IRGC (2005), risk assessment is confronted with three major challenges that can be best described using the terms ‘complexity’, ‘uncertainty’ and ‘ambiguity’. These three challenges are not related to the intrinsic characteristics of hazards or risks themselves but to the state and quality of knowledge available about both hazards and risks. For a successful outcome to the overall risk governance, it is crucial that the implications of these challenges are made transparent at the conclusion of risk assessment and throughout all subsequent phases. Additionally, it is important to avoid the traditional hazard focus approach of risk assessment and to assure that vulnerability is also taken into account (Chang Seng 2010). This means that equally important to understanding the physical attributes of the risk, is the detailed knowledge of stakeholders’ concerns and questions – emotions, hopes, fears, apprehensions – about the risk as well as likely social consequences, economic implications and political responses (IRGC 2005, Assmuth et al. 2009).
Finally, as pointed by Assmuth et al. (2009) risk assessment and governance can be integrated, harmonized and innovated if attention is paid to the socio-economic and political contexts, value choices and decision structures. On this regard, methodologically, reflexive, flexible and more transparent approaches to risks assessment are advisable as part of and support for open processes of risk communication, negotiation and governance (Assmuth et al. 2009).
9.3.2. Risk Management
Risk management is the process of dealing with an identified risk. It involves “the design and implementation of the actions and remedies required to avoid, reduce, transfer or retain the risks” (IRGC 2005, p. 13). These actions and measures can be taken at different moments of the disaster cycle.
According to Fleischhauer et al. (2006a) the disaster cycle has four phases: prevention, preparedness, response and recovery. Prevention covers the actions and measures taken before a disaster happens, in order to lower its impact. Preparedness refers to the actions and measures taken shortly before a disaster happens (when the warning is triggered, or when the circumstances indicate the imminence of an event). The response phase encompasses all aid and assistance actions and measures during and right after a disaster. Finally the recovery phase consists in repairing the damages. The lessons learnt after an event are then fed back into the new prevention phase.
In the four phases of risk management, the actions taken can be divided in two categories: structural and non structural. Structural actions imply a physical intervention, either by building or modifying an infrastructure. For instance, building a retaining wall, retrofitting a building to comply to a code, repairing a damaged motorway or building a temporary dam with sandbags to avoid floods are structural measures. Non structural measures have no visible impact on the landscape but contribute in reducing the vulnerability by other means. Improving risk knowledge, raising awareness, preparing crisis management procedures, setting up an early-warning system, adapting land-use to the risk or taking into account the lessons learnt from past disasters are non structural measures.
In the frame of Mountain Risks, a particular interest was paid to non structural measures. This chapter will address in details two of them. A focus will be given on spatial planning and how it can be used in risk prevention. Afterwards, the operation of early warning systems and their role in risk management
Integrated People Centred Early Warning System as a risk reduction strategy, Northern Italy
172
will be explained. Before this, the importance of legislation, risk culture and insurance possibilities for functional risk management will be presented.
I. Relevance of legal aspects, risk cultures and in surance possibilities (Marjory Angignard, Carolina Garcia and Jan Blahut)
There is more than one way to deal with natural hazards. Across the world, several approaches have been developed and applied. Even in comparable risk settings (same hazards, same intensity, same expected range of damages) the option chosen can differ largely. This is due to the existence of different risk cultures. Risk culture is the “collective knowledge” of risk in a given space and time, common to all members of a social group (Glatron, 2003). Risk culture is expressed through an ensemble of factors such as attitudes, believes, values, goals, and practices, shared by an institution, organization or group that influences the way risk is handled in a particular setting. It comprises elements as diverse as the disaster history of the area, its economic situation, its demographical evolution, the insurance possibilities, the legal framework in force and the type of administrative organization.
As expressed in the definition, risk culture is not static in space (it varies from one setting to another) or time (in the same setting it varies through time). The same factors that build risk culture make it evolve. For instance, the lessons learnt after a disaster become part of the risk culture. They influence the perception of risk, and have an impact on the management decisions taken afterwards.
In the Mountain Risks network, a particular attention was paid to two elements linked with risk culture: the legal framework, and the compensation system.
The legal framework and administrative system enforced on a given territory are highly influenced by the existing risk culture, and at the same time, have an important impact on it.. The approach and focus chosen depends on the priorities which are defined through the prism of the local risk culture. The construction of risk culture is a cycle, therefore the approach and focus chosen are then fed back in the constant evolution of risk culture. Different directions can be chosen by authorities concerning their risk related legislation, focusing for instance on prevention, protection, reaction to disasters, or several of these steps. The conception of the repartition of responsibilities between authorities and individuals also influence the choice of focus. Historically, some countries were founded on the monopolisation of powers, resulting in centralised organisations (e.g. France, United Kingdom). On the opposite, other countries applied "negotiated cooperation" between the State and the other levels of authorities (regions), resulting in polycentric organisations (e.g. Germany, Italy). This difference leads to the development of various approaches towards risk management, with a more or less important place of the State (Ernst 2004). Although the centralised organisation tends to be more efficient regarding security matters, regional authorities can have a better understanding of the local context, and laws emanating from this level can be expected to be more adapted to the actual situation, when national laws could be too general and obliterate local specificities. For the same reasons, polycentric organisation is considered as more adapted to preventive actions (Ernst, 2004). The relation between a State and its population also counts in the orientation of a risk-related legal framework. An “almighty state”, in which citizens are used to transfer their responsibilities to the authorities, will be responsible for every aspect from hazard assessment to recovery, whereas in a country where individuals carry responsibility for their own safety the authorities will have fewer duties and leave space for personal action.
Following the same pattern, risk culture is also relevant for explaining the differences how the compensation of losses is organized in a particular country (state-based fund, private system of insurances etc.). The insurance against natural hazards is probably the most adopted way how to transfer economic losses from particular risks. In every country (or even a particular region) this risk transfer can have many different possibilities. The range of possibilities is large. Schwarze et al. differentiate four groups of countries in Europe. In France, Sweden, Spain, there is a state or quasi-state monopoly on insurance against natural disasters. In France for instance, a fund is fed by a levy on insurance primes. In Germany, Italy, United Kingdom, the commercially structured "free market solutions" are coupled with state funded relief. In Austria, Danemark, public disaster funds are financed by tax-payers' money. Other countries such as Belgium, Netherlands or Norway apply a mixed solution of private insurance providers supplemented by public disaster funds. It is also interesting to note that the hazards covered are not the same everywhere. Regional specificities lead to the need to insure people against particular hazards (e.g. landslides in the Alps, subsidence in the Mediterranean area) and to ignore others because they are not present in an area (e.g. avalanches in

Chapter 9: Mountain risks and risk governance: challenges and lessons learnt
173
plains, seismic hazard). Some countries decide to cover only events above a given intensity. In France for instance, damages can be covered by the national CatNat fund (Catastrophe Naturelle: Natural Disaster) only if they result from "the abnormal intensity of a natural hazards, when the usual measures to prevent theses damages could not stop their happening or could not be taken" (Code des Assurances). This definition excludes compensation when mitigation measures failed to be taken or implemented, thus encouraging citizens and local authorities to undertake prevention and protection measures.
Case study: Differences of risk cultures in Alpine communities
The work on CM Valtellina di Tirano and the Barcelonnette Basin helped identifying differences and similarities in risk cultures between those two settings:
First, the legal frameworks are in general different but share some aspects. In both cases the mayor is responsible for safety in his commune. In both countries, France and Italy, important laws were emitted in reaction to major events: the Valtellina Law (Legge Valtellina) emitted in 1990 after the events of 1987 and the Barnier Law (Loi Barnier) emitted in 1995 after the floods of 1992, both good examples of reactive legislations. Nevertheless, the orientation of risk-related policies is different in both countries. In Italy, the legal framework related to natural hazards encompasses national and regional laws while in France laws are only emitted on the national level. Regional authorities can have a better understanding of the local context, and laws emanated from this level can be expected to be more adapted to the actual situation, when national laws could be too general and obliterate local specificities.
Another difference is that the French legal framework is mainly focus on prevention and protection through land use regulation (i.e. risk prevention plans –the PPRs) and mitigation measures (e.g. dykes, landslide drainage, dam). In Italy, the focus lays on alert, reaction and recovery (for instance, the key actor of risk management is the Civil Protection). The different risk cultures are also expressed via different conceptions of the role of insurance regarding natural hazards. In France, the insurance of buildings and goods against natural hazards is compulsory and compensation comes from a fund managed by the State. In Italy, natural events are not generally insured although private insurance is possible but highly expensive. However, in the case of a major event and further declaration of “natural calamity”, the state usually pays some compensation to the impacted people. In some occasions, this situation leads to an overestimation of the consequences of an event in order to receive more compensation from the state.
Summary
When considering a risk setting it is necessary to take its context into account. Therefore it is crucial to consider risk cultures in a risk related decision-making process, as well as in any step of risk management. This is not always the case in reality. Some experts and decision-makers fail to acknowledge that although two risk settings might present similar hazard profiles and comparable physical features (e.g. geology, geomorphology, and hydrology) they are likely to experience different risk cultures. This obviously poses problems regarding the transferability of methods and approaches to different settings. It could be helpful to identify beforehand the differences and similarities between the source setting and the target.
II. Disaster mitigation by spatial planning (Stefan Greiving, Marjory Angignard and Graciela Peters Guarin)
Spatial planning is "the whole comprehensive, co-ordinating spatially oriented planning at all scales (national – local)" (Fleischhauer 2006a, 1). Its base aim is "to prepare and make decisions about land use". Spatial planners have a broad view of a given territory, overarching the different sectional planning authorities in charge of specific aspects (e.g. water, geology, transport). Spatial planning decisions have to be taken considering all relevant elements, in particular all spatially relevant sectional hazards (Fleischhauer 2006a, p. 1). As every hazard has a spatial dimension, only those whose "occurrence is limited to a certain disaster area, which is regularly or irregularly prone to hazards" (Fleischhauer 2006a, p. 2) are spatially relevant (by opposition to the non spatially relevant hazards that can occur anywhere). Therefore natural hazards have to be taken into account in spatial planning. Nevertheless, the relationship is not unilateral: if spatial planning needs to consider natural
Integrated People Centred Early Warning System as a risk reduction strategy, Northern Italy
174
hazards, it is also one of the tools in the risk management box. Indeed, spatial planning can help reduce the impact of natural hazards on a given territory. Traditionally, spatial planning is used as a risk mitigation tool. It can take different forms, classified in four categories by Greiving (2006b): � keeping areas free of development: areas that are prone to hazards, areas that can be used to
reduce the risk (e.g. water retention) or areas required for crisis and emergency management (e.g. gathering points)
� differentiated decisions on land-use: allowing only certain land-use type in hazard prone area (e.g. agriculture but not housing)
� recommendations in legally binding land-use or zoning plans (e.g. compliance to a building code) � influence of hazard intensity and frequency: by attributing a mitigating function to certain spaces
(e.g. protective forests). All those actions can lower the impact of natural disasters on a territory. Nevertheless, they are only effective on the blank canvas of not yet developed areas. It is difficult, in most cases, to apply such plans and regulations on existing settings – the establishment of mitigation measures is a solution in this case including EWS. Recently, a new approach has been developed using spatial planning not only in prevention to natural disasters, but also in the post-disaster time frame. As stated by Olshansky (2010), "the most obvious improvement [following a natural disaster] would be to minimize the chances of a similar disaster […]. This could be by means of building resistant buildings, elevating building above expected flood levels, rearranging land-use within a community, or relocating settlements to safer locations". The short period of time directly following a disaster is traditionally dedicated to repair and reconstruction, but instead of consolidating settings again in the same hazard prone area and repairing damages caused by a natural disaster that is likely to strike again in the same way in the future, another path can be chosen. Affected households can be relocated to a safer place. This is where spatial planners have a role, as they can provide "plan B" solution for alternative settlement adapted to the situation. When repair and reconstruction cost a lot of money, time and effort, relocation and new building could provide an alternative with a good cost/benefits ratio.
Case study: The PPR in the BB
In the Barcelonnette Basin (BB), spatial planning is already used as a preventive tool. Due to the history of severe natural disasters (mainly river or torrent floods and landslides or mud slides, but also earthquakes), the awareness of both the population and the authorities has always been high. Therefore, preventive and protective measures where undertaken early.
In the 1980s, several communes of the basin set up "Risk Exposure Plans" (Plan d'Exposition aux Risques, PER) giving information about the existing risks on their territories and what could be done to reduce them. In Barcelonnette for instance, the PER was edited in 1987, and took into account landslides (in the large definition of the term, encompassing rock falls, debris flows), floods and earthquakes. For each hazard, the plan provided information on the intensity (e.g. for earthquake the estimated intensity of the hundred years return period event is 6.6 on Richter scale) and possible measures (e.g. for earthquake complying to PS89 building code) to be applied in risk areas.
In 1995 a new document was created to replace and improve the PER, the Risk Prevention Plan (Plan de Prévention des Risques, PPR). Although the existing documents were still valid, the evolution of the situation in the basin led to the decision to create PPRs for all the communes.
The French PPR are often cited as an example of efficient use of spatial planning in risk prevention. It is a legally binding regulatory hazard-zoning document that delimits certain hazard zones with restrictions for construction and further development (Fleischhauer 2006c). The PPR contains a presentation of the risk setting (it can be single or multi hazard oriented), maps presenting historical events, existing hazards, stakes, and finally a risk zoning map. The map is divided in three types of zones, red (high risk, no further construction allowed and in some cases expropriation can be considered), blue (medium risk, construction allowed under some restrictions, e.g. compliance to codes) and white (low or no risk, no restriction). This last document is not a risk map per se, as it also includes the current and planned use of parcels. For example, there can be "white zones" prone to hazards (e.g. cultivated areas in flood plains).
Summary
Spatial planning has been used as a risk mitigation tool for long, and although its action is limited to new development it has proved its efficiency as preventive measure. Nowadays the challenge is to

Chapter 9: Mountain risks and risk governance: challenges and lessons learnt
175
adapt to the emergency of post-disaster time, and apply spatial planning as a provider of alternatives in this very short window of opportunity.
III. Early warning systems and evacuation plans as management options (Carolina Garcia)
Within the risk governance framework Early Warning Systems (EWS), spatial planning, education and loss compensation (insurances), constitute the main non-structural countermeasures against threatening events (Irasmos, 2009). While spatial planning is a clearly permanent preventive measure and compensation from insurances is a support during the recovery, EWS are planned and prepared for the phase shortly before and during an event strikes. EWS include not only the warning itself, but are extensive frameworks that integrate different components of risk governance and disaster risk reduction that interact long before the crisis starts with the main purpose of minimizing loss of life and reducing the economic and social impact of a threatening event on vulnerable populations. The four closely interlinked components of EWS include: i. risk knowledge, ii. monitoring and warning, iii. dissemination and communication and iv. response capability (Basher 2006). Due to the multiple components of EWS and the inherent difficulties and problems of their integration, EWS face various challenges. Regarding the decision-making, the uncertainties, which are inherent in the assessments of hazards and risks, and therefore inherent to any predicted process, may lead to wrong decisions made inside any EWS, even in high-developed EWS and with well- prepared personnel. Wrong decisions can either refer to missed alarms (or false negative) when the mitigation action is not taken when it should have been, or false alarms (or false positive) when the mitigation action is taken when it should not have been (Grasso 2007b). For this reason, the levels of uncertainty of the information must always be communicated to the users, together with the early warning, since the lack of clear and honest information can confuse people and undermine their confidence in government (Grasso 2007a). Furthermore, as explained in further sections of this paper, it is fundamental that local governments, local institutions and communities are constantly involved in the entire policy-making process of the risk governance and during the elaboration of the EWS in order to increase the awareness and preparedness levels. This involvement implies to decentralize the decision-making process enhancing local governments and communities responsibilities. While emergency management and response co-ordination may benefit from centralized command, there is an increasing recognition of the need to decentralize DRR, including EWS responsibilities (EWC-II 2003). For EWS to be effective and assure a timely warning they must be integrated into policies for disaster mitigation and risk governance, at the same time, governance priorities must include protecting the public from disasters through the implementation of disaster risk reduction policies which are only completed if EWS and the other non-structural countermeasures are included. On this regard, WMO (2010) and EWC-II (2003) propose some key elements for integrating EWS into disaster risk governance policies including: 1) strong political commitment from the government, supported by DRR plans and clear legislation, that allows to strengthen the DRR legal frameworks; 2) coordination among national services for sharing information and issuance of warnings that take vulnerabilities and exposure of elements into account; 3) development of a communication and dissemination system, with permanent good communication among all stakeholders, that ensures warnings are received at all community levels, through clear protocols and procedures that are regularly tested, evaluated and maintained; 4) emergency preparedness, including education to appropriately use weather-, water- and climate-related information and early warnings; 5) to elaborate of local to national emergency response plans with clear procedures which are regularly updated and practiced through drills and simulation exercises; 6) to establish clear roles and responsibilities for all organizations and stakeholders at different territorial levels in order to improve efficiency, credibility, accountability, trust and cost-effectiveness; 7) feedback mechanisms between national to local governments, national services and the community, to facilitate evaluation and improvement of the warning system; 8) to improve collaboration, by developing institutional networks and participatory strategic plans with multi-disciplinary research and multi-stakeholder participation, sharing information, performing joint research and integrating databases; 9) to secure the availability of resources, both economic and human, and to establish proper priorities to allow their secure allocation. Finally, as pointed by Chang Seng (2010), the most appropriate governance on EWS is to encourage: a multi-hazard approach, enhanced bilateral and multilateral cooperation among all stakeholders, innovative partnerships, capacity building, sharing and exchange of local experiences as well as scientific knowledge.
Integrated People Centred Early Warning System as a risk reduction strategy, Northern Italy
176
Case study: Developing a Integrated people centred Early Warning System
A methodology to integrate early warning systems and emergency plans into a local disaster plan has been elaborated in the CM Valtellina di Tirano. Taking into account the actual state of disaster management and risk reduction initiatives in the study area, it was decided that the methodology that fits best with the present conditions would be a non-structural approach such as an integrated people centred Early Warning System –IEWS (Garcia 2011). The methodology focuses on prevention as a key element for disaster risk reduction and aims not only to increase the level of awareness and preparedness of the community and decrease its vulnerability, but also to strengthen institutional collaboration, in particular at local level, in order to assure sustainability of the efforts in the long term and to strength the risk governance process (Garcia et al. 2010). Several valuable efforts have already been done on risk reduction in the CM Valtellina di Tirano by the local authorities. However, as described in Garcia et al. (2010), there is still a tendency of directing the efforts towards the attention of emergencies instead of prevention. Although all the elements of EWS are present in the study zone, they display multiple shortcomings, are independently developed, have no structure and are poorly linked. As a result, it is possible to say that several components of EWS exist as non-coordinated risk management strategies, but they have to be brought together and connected in order to establish an actual EWS. The methodology proposes several actions to integrate the different strategies into an EWS in order to contribute in the development of an efficient and comprehensive risk management program adapted to the necessities of the local population and of the technical and administrative bodies. The methodology has strong legal, social, technical and scientific components, and presents several phases, including: hazard, vulnerability (both social, physical and economical) and risk assessment; analysis of the legal framework; the application of a comprehensive survey to evaluate the levels of perceived risk, knowledge, awareness, preparedness and information needs of the community; proposal of prevention and monitoring strategies; development of preparedness activities. Considering the answers of the survey and using the scientific products, an educational and communication campaign with participative workshops was designed by an interdisciplinary group to cover the specific information needs of the population at issue. The education strategies are addressed to the local community and practitioner stakeholders, with the aim to increase the awareness and preparedness for future events. During the development of the project several challenges typical for multidisciplinary work with a participatory approach were faced. There were communication problems, time restrictions, difficulties associated to work with local authorities, the need to adapt to the restrictive legal framework, build trust and confidence among stakeholders and general public, among others.
Summary
EWS are based on several elements of risk governance, and together with spatial planning, constitute the operational reflex of the risk governance process. The failure or success of any EWS is dependent on how well-connected all its components are within the risk governance process. Regarding the governance and decision-making on EWS, whereas the emission of the warning is based on technical information and risk monitoring, it is a political decision the one required to act in a threatening situation and give the order for the warning. The political decision to act is not only performed by the authorities and institutions at various levels, but is also a responsibility of the local communities. Therefore, in order to increase the effectiveness of EWS and to strengthen the risk governance process, all stakeholders, including local governments and communities must participate in the entire policy making process, so they are fully aware and prepared to respond (Sagala and Okada 2007, Chang Seng 2010). EWS as systems that integrate several components of risk governance should become a national and local priority for the government. In order to accomplish this, it is important to show the governments the economical benefits of EWS with a cost-benefit analysis of previous successful EWS backed with very strong governance systems such as the ones in Japan and United States of America (EWC III 2008, Chang Seng 2010). As pointed by EWC-II (2003), investing in EWS is neither simple nor inexpensive, but the benefits of doing so, and the costs of failing, are considerable. In order to decrease the amount of people directly affected by a disaster, it is necessary to assure that EWS are adapted to the local risk culture and that are fully integrated into the risk governance process. This means to develop institutional, legislative and policy frameworks at national and local level in order to provide an institutional and legal basis for the implementation and maintenance of effective EWS. The policies developed should help to decentralize disaster management and to encourage community participation. EWS as systems that integrate several components of risk
Chapter 9: Mountain risks and risk governance: challenges and lessons learnt
177
governance should become a national and local priority for the government. In order to accomplish this, it is important to show the governments the economical benefits of EWS with a cost-benefit analysis of previous successful EWS backed with very strong governance systems such as the ones in Japan and United States of America (EWC III 2008, Chang Seng 2010). As pointed by EWC-II (2003), investing in EWS is neither simple nor inexpensive, but the benefits of doing so, and the costs of failing to, are considerable.
9.3.3. Risk communication
A pronounced communication across all stakeholders and components of risk governance is the central aspect and innovation in risk governance procedures. In this context, communication does not only refer to the transmission of analysed risks in a one-way direction from “experts” to further stakeholders or the general public any more but has clearly to be defined as the communication of risk assessment AND risk management activities (Fleischhauer2006). Consequently it encompasses “many forms and purposes of flow of information between the different actors involved in risk governance and [... includes] different modes of interaction, participation and partnership rather than only flows of ‘expert to non-expert’ information” (Walker et al. 2010, p. 26). Resultant, “[i]t enables stakeholders and civil society to understand the risk itself” (IRGC 2005, p. 14) and with this broadened view of hazards and risks change the behaviour and attitude towards them (Wanczura 2006). Risk communication “also allows them to recognise their role in the risk governance process and, through being deliberately two-way, gives them a voice in it” (IRGC 2005, p. 14). With this two-way communication and participation in the decision-making process conflicts can be identified and solved more easily (Wanczura 2006). However, a key requisite for intensive risk communication, as well as a result of suitable risk communication, is trust between stakeholders, especially decision-makers and the possibly affected population. Further important aspects are transparency, clarity, democratic access to knowledge and accountability (Tompkins et al. 2008). Within the Mountain Risks project we focussed on two topics, a general and a very specific one: the communication and involvement of stakeholders and the use of geo-information and the application of visualisation tools for risk communication.
I. Communicate the information and involve all stak eholders in the decision-making process (Carolina Garcia and Marjory Angigna rd)
It is today widely acknowledged that communication is an important not only during a crisis, to assure a timing evacuation, but also before as a preventive tool, and after an event, making use of the sudden raise of attention paid to the topic and thus increase recovery. After decades of one-way information process from authorities to the society, it is finally accepted that one way communication should be avoided, whereas two way communication involving all stakeholders in a participative way is fundamental to achieve an effective risk reduction (European Commission 2004, De Marchi 2003). To improve participation it is fundamental to share the roles and responsibilities (Bollin 2003). For an effective communication it is necessary to establish good rapport and empathy among the different actors since the credibility of a message is deeply dependent of the levels of trust from part of the receiver towards the source (De Marchi 2007), as well on the levels of transparency and accountability in relation to policy decisions (Walker et al. 2010). All stakeholders should be involved in this process, not only decision-makers, scientists and authorities, but also the population and representatives of all relevant bodies or local groups (e.g. private sector, emergency services, tourism professionals, etc.). Participation of the different actors in the risk governance process serve as an improvement in the efficiency and effectiveness of the whole process since allows to directly reflecting people’s preferences in a decision process in order to reach consensual solutions (Gamper and Turcanu 2009). Participation is particularly useful in highly conflicting situations when a high degree of uncertainty is associated to the decision-making. However, there are difficult challenges associated to use participation in the risk governance process, where trust and shared information among all the stakeholders play a fundamental role in the effectiveness of the process, especially in complex situations (European Commission 2004). A fundamental aspect is the levels of trust among the different stakeholders since trust have a direct influence on the reaction of the people towards any risk governance decision making process, i.e. new legislation, emergency procedures, etc. In order to build trust, all stakeholders must be constantly informed about the outcome of the decision making process and to be able to provide feedbacks both during and at the conclusion of the process (European Commission 2004). Keep the public and all

Integrated People Centred Early Warning System as a risk reduction strategy, Northern Italy
178
stakeholders unaware of the state of the decision process and wait to contact them until a specific reaction from them is needed, such as evacuation, could generate terrible repercussions. Several examples around the world show how even with the current technological advances that allow a rapid dissemination of a warning to the vulnerable population, the lack of understanding of the warning and the lack of preparedness, may cause an ineffective reaction and therefore increase the number of victims caused by a hazardous event (Southern 1995, De Marchi 2007, UN 2006; IFRC 2009). There is an agreement on the fact that the dissemination of a warning and the delivering of information to raise awareness do not generate an effective response by themselves except when educational campaigns have been performed to ensure that the warning message is correctly understood and respected (Paton and Johnston 2001; Paton 2008; Becker et al. 2009; IFRC 2009; Leonard et al. 2008). Some authors even agree that if information about hazards is provided without education, this may cause that the population who received the information perceived itself as less vulnerable as before just by the fact of receiving information (Ballantyne et al., 2000). Scientists play a crucial role on the risk communication, not only by proving tools to policy makers and decision making, but also for education. In order to transmit scientific information, it is important that the specialists clearly explain scientific issues to the non specialist using simple language, communicating problems definitions and choices, rather that just numbers and pure scientific results (Walker et all. 2010). This can be beneficial also in terms of clarifying a problem between experts of different fields when working in a multidisciplinary environment (Kontic et al. 2006).To achieve an successful transfer of knowledge the problem is not the lack of availability of educational tools, but the need for broader dissemination and application of these resources and the use of real participatory activities with community involvement (Becker et al. 2009). This participation not only includes the periodic dissemination of clear scientific information about local hazards and levels of risks, but the active participation on the risk reduction activities, with the development of educational awareness raising and preparedness programs, in order not only to increase the reaction capability but also to allow the understanding of the inherent uncertainty of the forecasting process (Garcia and Fearnley, submitted).
Case study: An example of risk communication in the Barcelonette Basin
The Barcelonnette Basin is a particular case study within the Mountain Risk project. Scientists have worked in this area for 15 years, and their relationship with local authorities and practitioners is good.
The risk communication process initiated during this project involved three main groups: stakeholders (local authorities, experts and practitioners), scientists, and the population. It can be represented in four phases.
1) At the beginning of the project, a dialogue was initiated between researchers who already had experience in the region (mainly geomorphologists and hydrologists) and researchers from other disciplines (spatial planning, geography, social sciences). The aim was to understand the ongoing work, and to identify possible collaborations. An outcome of this dialogue was the strong interest of local authorities for cooperation with scientists.
2) Based on this outcome, stakeholders were interviewed, in order to better understand their expectations from the scientific community. They were of two types: a deeper understanding of the processes at work and the resulting risks, and information about the risk perception by the population. This second point has been addressed by a survey conducted in Barcelonnette and three other communes (Faucon, Jausiers and St Pons), about the risk perception and the expectation of the population towards risk management.
3) The results of the survey were collected and analysed by researchers. They gave precious data on what the population expects from the authorities, for instance a large majority wanted more information about natural hazards and risks. When asked which actor should provide this information, they plebiscite scientists and municipality. The eventuality of a public meeting was considered interesting by many citizens. Afterwards, the results were presented and explained to stakeholders (mayors, practitioners). Thus, information circulated from the population to stakeholders via scientists.
4) Finally, responding to the information gained from the survey, a public meeting was organised in Barcelonnette. It aimed at presenting the hazards and risks setting, and explaining what researchers had achieved in the 15 years they already spent working in the region. During this meeting, citizens could directly discuss with researchers and stakeholders.

Chapter 9: Mountain risks and risk governance: challenges and lessons learnt
179
Ideally, the instituted communication process would continue after the project. Although there is no guarantee that this will happen, getting those different groups to talk about risks together is a good start.
Summary
As pointed by IRGC (2010) communication means not just the release of information but the opportunity for meaningful dialogue at each stage of the process: as signals from early warning systems are interpreted, as risk assessments are subject to peer review, as stakeholder and public sentiments about risks are gauged, as judgements about risk acceptability are reached, and as risk management strategies are considered. Risk communication is the main link among all the components and actors involved in the risk governance process. Communication deeply depends on cultural aspects such as power and trust. In many cases, the limited effectiveness of risk communication efforts have been attributed to the lack of trust among the different stakeholders since communication alone is not efficient where trust is missing. What is more, many failures in governance are linked to problems of trust and even if there is no infallible remedy for mistrust, open lines of communication are known to help foster trust among stakeholders (IRGC 2010). A risk culture defined by open lines of communication, combined with confidentiality only when unavoidable, can help sustain trust that has been earned and gradually restore it when it has been lost (IRGC 2010).
Just through a strong risk communication is possible to define the real acceptable and tolerable risk levels of a certain population. Additionally, there is a need for risk managers to improve public understanding by developing concrete risk communication strategies with the right quality and quantity of information for different groups of recipients (Irasmus 2009). However, cases as the one of the tsunami in Indonesia prove that to generate information is not enough. As pointed by Chang Seng (2010), in Indonesia the existing tsunami hazard-risk knowledge was poorly communicated to the communities at risk while it circled mostly among academics and practitioners in the rooms of universities, workshops and conferences. The role of scientists is crucial and therefore is important to change the perception of scientist as mere providers of information into a more active actor during the whole risk governance process.
It is essential to build trust among all stakeholders. A participative risk management process can help not only to build trust, but also to improve the effectiveness of the decision making process. Organizing and structuring a participative process goes beyond the well-meant intention of having the public involved in risk decision-making. However, the mere desire to initiate a two-way communication process and the willingness to listen to public concerns are not sufficient (Hadden 1989, Lynn 1990, Renn and Schweizer 2009). A participative process needs a structure that ensures the integration of technical expertise, regulatory requirements and public values to allow that the decisions on risk reflect effective regulation, efficient use of resources, legitimate means of action and social acceptability (Renn and Schweizer 2009). Finally, even is participation has been proved to help on risk reduction in general, there is a need for depth analyses of the effect of participation on the actual decision making in different cultural, geological and geographical settings.
II. The use of geo-information and role of modern v isualization tools for risk communication (Simone Frigerio and Jan Blahut)
A communication system assumes a crucial significance inside a risk governance context. The reason is the requirement of an instrument able to provide the user an easy-to-use access to the most up-to-date spatial data resources concerning natural hazards. The new challenge is the opportunity to supply this emerging approach to training, education and decision-making issues. The scientific community enlightened in last decades a better awareness of hazards assessment with innovative methodology (Glade et al. 2005, Van Westen et al. 2008), but a severe gap with general end-users needs has to be filled, especially on the methods able to furnish useful information. In the last years, several examples of education and training on natural hazards proposed solutions combining geo-information tools and web techniques, (BE-SAFE-NET, JUNIOR FLOODSITE, RISKCITY). Considering the transfer of knowledge, some platforms offer a solution for communication and interaction with standard databases concerning natural hazards and risks (CIMA, SICI, UNDP Edu-Risk). As common plan they provide a direct visual integrated-interaction (for citizens, stakeholders, technicians and administrators with different level of access). The general lack is highlighted by an unclear “graphical language” to share scientific output, an inhomogeneous semantics, an expensive or excessively complex frameworks and a limited quality in the transfer of knowledge. A clear example is the missing standard criteria to empathize what kind of data the
Integrated People Centred Early Warning System as a risk reduction strategy, Northern Italy
180
decision-makers really need during crisis phase, in terms of layers visualized, rapid data access and simplicity of interpretation (Maceachren et al. 2005, Heil et al. 2010, Maiyo et al. 2010). The meaning of scientific results, the explanation of data and role of people in charge are aims of a global awareness, especially for non-expert users in natural events statement (McEntire et al. 2004, Heil and Reichenbacher 2009). The increased use of the Web as a platform for geospatial applications underscored the need to apply standardized network technologies in processes dealing with spatial data, including information yielded by scientists. Exploiting map dataset via networks has become a critical issue and a Web platform started to be recognized by Geographic Information System (GIS) community as a fundamental new instrument to the delivery of spatial data (Kraak and Brown 2001, Lehto and Sarjakoski 2005). The expected improvement in the research was to tailor geo-information tools to stakeholders and decision-maker’s requirements, using the results of scientific community (e.g. past events, kinematic simulations, monitoring results on triggering factors, social indicators) and considering the type of knowledge required in risk governance (e.g. explanation of metadata, simplification of maps, crossed information). The WebGIS architecture is the easy-to-use Geo Web Service suggested. This type of framework can collect several dataset from heterogeneous sources, scales and resolutions (e.g. modelling output, survey acquisition and experts’ input regarding natural hazard), along with geospatial services that can interact in a loosely coupled environment and be used to create more suitable information for different users (Maiyo et al. 2010). It is based on web interface and graphic interaction and can avoid software installations. Levels of end-user preparedness have been considered (e.g. stakeholders, technicians, students) and different access rights to the geo-information cover the different awareness and the role of people in charge. Additionally, web-supported solutions provide good and fast accessibility, even in remote areas. Using different organizational folders (“web clusters”), the framework can supply a visual correlation between different risk types, both from risk estimated (different scale and detail) and perceived (individual or collective). Special attention has to be paid on the clarity and readability of the maps. Particularly map classification has to be simple but comprehensive. It is generally better to keep minimum number of classes in order to keep the map more understandable for the end-users. As a consequence it is of high importance to show the uncertainty of the maps/results at least in a written or graphical way. A common structure has been proposed for different case studies to get the advantage of a similar and flexible framework to different needs of communication.
Case study : Barcelonn@ and Historic@
Two applications gained transfer of knowledge for both the case studies in which several areas prone to mass movements are present (Crosta et al. 2003, Maquaire et al. 2003, Blahut et al. 2010). They were both developed using the open source framework (Mapserver engine for “geospatial” issue and CartoWeb for the “interface”) and the database was organized in a common database management system. The purpose of them is different for type of information gathered and aims, but common multi-source database architecture is offered. Barcelonn@ is a WebGIS application composed by a simple visual interface with easy-to-use functions for data access. Gathering, sharing, and dynamic interact with data were fixed tasks in this research. The wide collection of assorted dataset related to the local hazards and risks (e.g. landslide controlling factors, susceptibility maps, information on elements at risk, administrative data) and the data comparison was a feasible support to tailor geo-information tools to stakeholders requirements (Frigerio et al. 2010a). The results of scientific community activity in several years of experience (e.g. past events datasets, orthophotographs, cadastral maps, triggering factors) and the knowledge required to the users (e.g. metadata, explanation of layers involved, user-friendly classifications, overlaid information) are merged in the service. Barcelonn@ was developed in Barcelonnette Basin (South French Alps) as pilot area for the framework. Three levels based on scale concept provided 1) a standard geodatabase collected in every municipality, 2) a cluster of information covering the complete region and 3) a local dataset gained with single natural events scenario occurred in the study area. Barcelon@ has a frame on client-side (Fan-Chieh et al. 2007, Salvati et al. 2009) by which some spatial functions (e.g. multi-query, overlaying, exporting, layout, shape design) are offered on browser, independently by any software and technical awareness. Data is collected considering different storage criteria: type of information (e.g. Satellite Images, Geology, Hazard Maps), date of production (1948 till 2004), resolution (e.g. 1.5 m for 1974 raster and 0.5 m in 2004) and producer (e.g. Institut Geographique National). The clusters of data were organized as following: information clipped on administrative boundaries at different scale (e.g. Region dataset, Barcelonnette dataset) and

Chapter 9: Mountain risks and risk governance: challenges and lessons learnt
181
information based on natural event (e.g. La Valette, Bois Noir, Super Sauze). Every single layer was associated with a simple external mask extendable in a new tab, including complete metadata (HTML format), associated documents, reports or pictures (if available). Historic@ is a web framework still in progress of developement for CM Valtellina di Tirano study area. First aim was to share and spatially compare at different scale historical database of natural events and evolution of population. The purpose is a visual support to evaluate risk perception in mountain areas and to compare natural events with population trend. A geo-referenced database, gathering data about landslide and flood events from 1600 to 2008, was the basis of the frame. Moreover registry office and Census surveys suggested trends in population dynamics. The possibility to share information by web services offers a wide collection of dissimilar information and suggests a concrete support in spatial planning for the area involved (Frigerio et al. 2010b). An analysis on historical catalogue supplied different tasks. A spatial distribution analysis provided a comparison between the number and the density of events acquired in 12 municipalities (considering the areas involved), focusing the highest events density spread in all the area. A temporal pattern on yearly and monthly trend highlighted an increasing number of events that happened in last decades and their seasonal distribution, improving both an idea of serious climate change influence and the statistical weight of oldest dataset uncertainty. The population distribution was included in the database and compared with the output of events analysis, to strengthen investigation on risk perception.
Summary
Modern visualisation tools are significant contribution to the dissemination of knowledge about disasters and risk communication. They can serve as an important source of information for both, experts and general public and highlight a new paradigm in the transfer of knowledge, based on simplicity, clearness, flexibility and direct access of information. To address this challenge we proposed an approach for designing natural, comprehensible and multiuser enabled interfaces (Maceachren et al. 2005) accessible by web browser. One of the main advantages of geo-information tools and WebGIS applications is the ability of a near-real-time update of information available through common communication channels (Goodchild 1999). However, there are still some issues that need to be addressed as the lack of homogeneous language (Fabrikant and Buttenfield 2001), and non-user-friendly applications. Information systems used in the field of disaster management are often not as open and comprehensive as needed to integrate and accommodate the complex data sets and the different systems. Information provided by the modern visualisation tools has to be clear and readable, especially to the general public, because a correct shared information produces education and furthermore improves awareness on natural events. A simple web interface proposed with easy-to-use functions is the main goal in risk communication visualization tools and WebGIS usage, preferentially open source and customized application. A key question to improve the quality of the system is how to display simultaneously each of the layers involved, how to classify them (e.g. simplify a floating DEM in a simple 4 classes raster), which symbology kit, color scheme or style adopt, how to manage correctly overlapping property to allow a single data visualization or a “group of layers” patterns. Providing an interface for risk communication requires attention to the users’ need at all stages of design and development, thus a “human-centred” system approach. The frame proposed takes full advantage of the rich information about geographic context inherent in the natural hazards and risk database but the research attempted dialogue capabilities that enhance the competence of the system in communicating about useful and graspable information.
V. Summary on risk communication (Melanie S. Kappes )
Risk communication is, as became obvious in this section, not just one component of risk governance as risk assessment and risk management but the matrix which bonds the single components together. Risk communication means involvement/participation and interaction of individuals, groups, interests, actions and decision. However, especially involvement in risk reduction, taking back of responsibilities (Romang et al. 2009 identified a decreasing individual responsibility) and being aware of risks around one is not the common trend nowadays. Rather common behavioural patterns are the ignorance of risks and to hold especially the government accountable in case of damages and losses. Further problems are apathy, selfishness and deficiencies in knowledge and abilities, however, “these ‘problems’ should not be viewed as reasons to exclude the public from influencing decision-making processes; rather they should be viewed as key elements that must be effectively managed” (Murphy 2009, p. 2009). The participation in the whole RG procedure influences the acceptance of decisions and situations, creates trust, leads to changes of behaviour and preparedness e.g. for emergency situations (right action in case of a warning for example).

Integrated People Centred Early Warning System as a risk reduction strategy, Northern Italy
182
To assure, that these objectives are reached several issues have to be fulfilled: � Stakeholders have to be identified and encouraged to participate in the risk management process
(Wright & Dien 2007). � Trust has to be established because if there is no trust among stakeholders, risk communication
is bound to fail” (Wright & Dien 2007, p. 51). � Transpareny is one very important factor to create trust (Renn & Benighaus 2007). � Risk communication has to be tailored to the needs of each specific stakeholder group and their
level of trust under use of their preferred medium of communication (Wright & Dien 2007). This includes an adaption to the audience / people addressed, their concerns and dominating risk perception and the preferred medium to get information has to be used (Renn & Benighaus 2007). And finally it has to be created that way, that it achieves “the empowerment of the people, i.e. support[…] their competencies to understand risks” (Wiedemann 2007, p. 20).
� To achieve this goal RC has to be adapted to the audience / people addressed, their concerns and dominating risk perception and the preferred medium to get information has to be used (Renn & Benighaus 2007).
Education produces awareness – raises the willingness to participate and the probability to act correctly. Participation means involvement in decision-making and higher acceptance of them. An important point is to find the right moment to start, e.g. after an event when the awareness is very high as well as the interest in the topic (Romang et al. 2009).
9.4. References
Agostoni S, Laffi R, Sciesa E. 1997. Centri abitati instabili della provincia di Sondrio. CNR-GNDCI, Milano, 59 pp
Alexander, D. 1988. Valtellina Landslide and flood emergency, Northern Italy, 1987. Disasters, 12(3): 212-222.
Armaş, J., Avram, E. 2009. Perception of flood risk in Danube Delta, Romania. Natural Hazards, 50(2): 269-287 Assmuth T., Hildén, M. and Benighaus, C. 2009. Integrated risk assessment and risk governance as socio-
political phenomena: A synthetic view of the challenges. Science of The Total Environment 408(18): doi:10.1016/j.scitotenv.2009.11.034
Australian Geomechanics Society. 2000. Landslide risk management: concepts and guidelines. Australian Geomechanics: 49-92.
Babbie E.R. 2005. The Basics of Social Research. Thomson Wadsworth. Belmont, CA Barszczynska M, Bogdanska−Warmuz R, Konieczny R, Madej P and Siudak M. 2006. In time for the flood. A
methodological guide to local flood warning systems. Institute of Meteorology and Water Management, Poland.
Basher, R. (UN/ISDR Platform for the Promotion of Early Warning). 2006. “Global early warning systems for natural hazards: systematic and people-centred”. Philosophical Transactions of the Royal Society, A 364, 2167-2182
Beguería, S. 2006. Validation and evaluation of predictive models in hazard assessment and risk management. Natural Hazards, 37:315–329.
Blahut J, Poretti I, Sterlacchini S, De Amicis M (submitted, under review) Database of Geo-hydrological Disasters for Civil Protection Purposes. Nat Haz.
Blahut, J. 2010. Debris flow hazard and risk analysis at medium and local scale. PhD dissertation. University of Milano – Bicocca. 225 p.
Bollin C. 2003. Community-based disaster risk management: Experience gained in Central America. Deutsche Gesellschaft für Technische Zusammenarbeit (GTZ) (ed.), Eschborn
Buriks, C., Bohn, W., Kennett, M., Scola, L., and Srdanovic, B. 2004. Using HAZUS-MH for risk assessment: how-to guide. Technical Report 433, FEMA.
Carpignano, A., Golia, E., Di Mauro, C., Bouchon, S., and Nordvik, J.-P. 2009. A methodological approach for the definition of multi-risk maps at regional level: first application. J Risk Res, 12:513–534.
CENAT. Glossary - Monte Verità Workshop: Coping with Risks due to Natural Hazards in the 21st Century. Online 27/10/2010. http://www.cenat.ch/index.php?navID=824&userhash=41529&I=e.
CEPREDENAC, ISDR, IDB, and Worldbank. CAPRA Portal (Central American Probabilistic Risk Assessment). Online 12/10/2010.
Chang Seng, D. 2010. The Role of Risk Governance, Multi-Institutional Arrangements and Polycentric Frameworks for a Resilient Tsunami Early Warning System in Indonesia. PhD Dissertation, Bonn University. http://hss.ulb.uni-bonn.de:90/2010/2227/2227.pdf
Committee on Disaster Research in the Social Sciences (CDRSS), 2006. Facing Hazards and Disasters: Understanding Human Dimensions. The National Academies Press. Washington, D.C.
Corominas, J., Copons, R., Vilaplana, J., Altimir, J., and Amigó, J. 2003. Integrated landslide susceptibility analysis and hazard assessment in the Principality of Andorra. Natural Hazards, 30:421–435.

Chapter 9: Mountain risks and risk governance: challenges and lessons learnt
183
Corporacion Osso, La Red de Estudios Sociales en Prevencion de Desastres en America Latina. 2008. DesInventar online 8.1.9-2: sistema de inventario de efectos de desastres. Cali: OSSO/La Red de Estudios Sociales en Prevención de Desastres en América Latina. Online 18/10/2010 http://online.desinventar.org
Couture R, Guzzetti F. 2004. Preface Geo-databases for Natural Hazards and Risk Assessment. In: Natural Hazards and Earth System Sciences 4:183-185
Crosta, G.B., Dal Negro P. & Frattini, P. 2003. Soil slips and debris flows on terraced slopes. Nat. Hazards Earth Syst. Sci. 3: 31-42.
De Marchi B. 2003. Public participation and risk governance. In: Science and Public Policy 30(3): 171–176
De Marchi B. 2007. Not just a matter of knowledge. The Katrina debacle. In: Environmental Hazards 7: 141–149
Dekens J. 2007. Local Knowledge for Disaster Preparedness: A Literature Review. International Centre for Integrated Mountain Development (ICIMOD), Nepal
Delmonaco, G., Margottini, C., and Spizzichino, D. 2006. Report on new methodology for multi-risk assessment and the harmonisation of different natural risk maps. Deliverable 3.1, ARMONIA.
Embleton C. 1984. Geomorphology of Europe. McMillan, London. 465 p.
Ernst I. 2004. La gestion des risques naturels dans les pays de l'Union Européenne: logiques internes à l'intégration. In: Veyret Y, Garry G, Meschinet de Richemond N, Risques naturels et aménagement en Europe, Armand Colin, Paris, pp 236-240
EU-CEC. Commission communication. Towards a reinforced culture of consultation and dialogue — proposal for general principles and minimum standards for consultation of interested parties by the commission. Online 08/09/2010 http://www.thecre.com/eu-oira/pdf/propose.pdf
European Commission. 2004. Towards Inclusive Risk Governance - TRUSTNET 2 Office for Official Publications of the European Communities: Luxembourg
European Communities. 2007. DIRECTIVE 2007/60/EC OF THE EUROPEAN PARLIAMENT AND OF THE COUNCIL of 23 October 2007 on the assessment and management of flood risks. Brussels.
EWC III. 2008. Developing Early Systems: A checklist EWC III -Third International Conference on Early Warning, from concept to action. ISDR, Bonn.
EWC-II 2003. Integrating Early Warning into Relevant Policies. Second International Conference on Early Warning. UN-ISDR, Bonn. Online 08/10/2010 http://www.unisdr.org/ppew/info-resources/docs/ewcii-Policy_brief.pdf
Fan-Chieh Y, Chien-Yuan C, Sheng-Chi L, Yu-Ching L, Shang-Yu W, Kei-Wai C. 2007. Web-based decision support system for slopeland hazard warning. Environ. Monit. Assess. 127: 419–428.
Flageollet, J.-C.; Maquaire, O.; Martin, B. & Weber, D. 1999. Landslides and climatic conditions in the Barcelonnette and Vars basins (Southern French Alps, France) Geomorphology, 30: 65-78.
Fleischhauer M. 2006a. Natural hazards and spatial planning in Europe: an introduction. In: Fleischhauer M, Greiving S, Wanczura S Natural hazards and spatial planning in Europe. Dortmunder Vertrieb für Bau- und Planungsliterartur , Dortmund, pp 9-18
Fleischhauer M. 2006b. Spatial relevance of natural and technological hazards. Natural and technological hazards and risks affecting the spatial development of European regions. Geological Survey of Finland, Special Paper 42: 7–16
Fleischhauer M. 2006c. Spatial planning and the prevention of natural risks in France. In: Fleischhauer M, Greiving S, Wanczura S Natural hazards and spatial planning in Europe. Dortmunder Vertrieb für Bau- und Planungsliterartur , Dortmund, pp 37-53
Frigerio S, Blahut J, Sterlacchini S, Poretti I 2010b Landslides historical dataset and population distribution: Hystoric@, the experience of the Consortium of Mountain Municipalities of Valtellina di Tirano, Italy. In: Malet J-P, Glade T, Casagli N (eds) Mountain Risks – Bringing Science to Society. CERG Publications, Strasbourg, France.
Frigerio S, Skupinski G, Puissant A, Malet J-P, Rose X. 2010a. An open source platform for sharing information and communicating about risks: the Barcelonnette Basin (South French Alps) as pilot study. In: Malet J-P, Glade T, Casagli N (eds) Mountain Risks – Bringing Science to Society. CERG Publications, Strasbourg, France.
Gaillard JC, Wisner B, Benouar D, Cannon T, Creton-Cazanave L, Dekens J, Fordham M, Gilbert C, Hewitt K, Kelman I, Lavell A, Morin J, N'Diaye A, O'Keefe P, Oliver-Smith A, Quesada C, Revet S, Sudmeier-Rieux K, Texier P and Vallette C. 2010. Alternatives pour une reduction durable des risques de catastrophe (Alternatives for sustained disaster risk reduction). In: Human Geography 3 (1): 66-88.
Gamper CD. and Turcanu C. 2009. Can public participation help managing risks from natural hazards?. In: Safety Science 47: 522–528.
Garcia C (in prep.) Use of quantitative surveys for the estimation of response capacity in the designing of a Community Based Early Warning System.
Garcia C, Sterlacchini S, De Amicis M, Pasuto A and Greiving S. 2010. Community Based Early Warning System for mountain risks, northern Italy: identifying challenges and proposing disaster risk reduction strategies. Proceedings Mountain Risks

Integrated People Centred Early Warning System as a risk reduction strategy, Northern Italy
184
GEOIFFI 2006 The Regional Inventory (1:10 000) of Landslides and Hydrogeological Events, Lombardy Region, Italy. Online 10/05/2009 http://www.cartografia.regione.lombardia.it/GeoIFFI
Geomer 2008. FloodArea - ArcGIS extension for calculating flooded areas: user manual. Geomer GmbH and Ingenieurgemeinschaft Ruiz Rodriguez + Zeisler + Blank.
Glade T, Anderson M, Crozier MJ 2005 Landslide hazard and risk. John Wiley and Sons, Chichester, England.
Glatron S. 2003. Culture des risques. In: Moriniaux V (dir) Les risques, Éditions du Temps, Nantes, pp 71-87.
Goodchild MF. 1999. Future directions in geographic information science. Geographic Information Science, 5: 1-8
Graham JD and Rhomberg L. 2006. How Risks are Identified and Assessed,” in: H. Kunreuther and P. Slovic (eds.): Challenges in Risk Assessment and Risk Management, The Annals of the American Academy of Political and Social Science. Sage: Thousand Oaks: 15-24.
Grasso V. 2007. Early Warning Systems: State-of-Art Analysis and Future Directions. Draft report for United Nations Environment Programme (UNEP). Online 24/04/2010 http://na.unep.net/geas/docs/Early_Warning_System_Report.pdf
Grasso VF, Beck JL, Manfredi G. 2007. Automated decision procedure for earthquake early warning. Engineering Structures 29(12): 3455-3463
Greiving S. 2006. What are the real needs of spatial planning for dealing with natural hazards? In: Fleischhauer M, Greiving S, Wanczura S Natural hazards and spatial planning in Europe. Dortmunder Vertrieb für Bau und Planungsliterartur, Dortmund, pp 185-202.
Greiving, S., Fleischhauer, M., Wanczura, S. 2006a. Management of Natural Hazards in Europe: The Role of Spatial Planning in Selected EU Member States. Journal of Environmental Planning and Management, 49(5): 739-757.
Greiving, S., Fleischhauer, M., and Lückenkötter, J. 2006b. A methodology for an integrated risk assessment of spatially relevant hazards. Journal of Environmental Planning and Management, 49(1):1–19.
Guzzetti F, Cardinali M, Reichenbach P. 1994. The AVI Project: A bibliographical and archive inventory of landslides and floods in Italy. In: Env. Management 18:623-633
Heil B and Reichenbacher T. 2009. The use of guidelines to obtain usability for geographic information interfaces, in: International Cartography Conference 2009, Santiago de Chile.
Heil B, Petzold I, Romang H and Hess J. 2010. The Common Information Platform for Natural Hazard in Switzerland. Natural Hazard. Online: http://www.springerlink.com/content/654274l41205h764/fulltext.html
Hollenstein, K. 2005. Reconsidering the risk assessment concept: standardizing the impact description as a building block for vulnerability assessment. Natural Hazards and Earth System Sciences, 5, 301-307.
Horton, P., Jaboyedoff, M., and Bardou, E. 2008. Debris flow susceptibility mapping at a regional scale. In 4th Canadian Conference on Geohazards, Québec, Canada. Université Laval.
Irasmus. 2009. Best practice of integral risk management of snow avalanches, rock avalanches and debris flows in Europe. Deliverable D5.4 Iramus Project. Romang, H. (ed.)
IRGC – International Risk Governance Council. 2005. White paper on risk governance: Towards an integrative approach. Geneva: IRGC.
IRGC 2010. Risk Governance deficits: analysis, illustration and recommendations. Geneva, Switzerland. Kappes, M.; Keiler, M. & Glade, T. 2010. The Relevance of Multi-Hazard Risk Analyses for Risk Reduction in a
Dynamic World, Proceeding of the 2010 Summer Institute for Advanced Study of Disaster and Risk: Disaster, Risk and Climate Change, 129-136.
Kappes, M.; Keiler, M. & Glade, T. (accepted) From single- to multi-hazard risk analyses: a concept addressing emerging challenges, Mountain Risks: Bringing Science to Society.
Kindell, J. and Hwang, C. 2008. Households’ Perceived Personal Risk and Responses in a Multihazard Environment. Risk Analysis, Vol. 28, No. 2, 2008, pp 539 – 556
Komino T. 2008. Indigenous Coping Mechanisms for Disaster Management in Mansehra and Battagram Districts, North West Frontier Province (NWFP), Pakistan . In: Indigenous Knowledge for Disaster Risk Reduction: Good Practices and Lessons Learned from Experiences in the Asia-Pacific Region: 41-45.
Kontic B, Bohanec M, Urbancic T. 2006. An experiment in participative environmental decision making. In: The Environmentalist 26, 5–15.
Kraak MJ and Brown A (2001) Web Cartography, Developments and Prospects. Taylor and Francis, London.
Lave L. 1987. Health and Safety Risk Analyses: Information for Better Decisions. Science, 236: 291-295.
Lavell A. 2000. Desastres durante una década: lecciones y avances conceptuales y prácticos en América Latina (1990-1999): In: Anuario Política y Social de América Latina 3: 1-34.
Lebel L, Anderies JM, Campbell B, Folke C, Hatfield-Dodds S, Hughes TP and Wilson J. 2006. Governance and the Capacity to Manage Resilience in Regional Social-ecological Systems. Ecology and Society, 11(1): 19
Lehto I and Sarjakoski T (2005) Real-time generalization of XML-encoded spatial data for the Web and mobile devices. International Journal of Geographical Information Science 19(8-9): 957-973.
Löfstedt, R. 2005. Risk management in post-trust societies. Houndmills, Basingstoke, Hampshire, New York.

Chapter 9: Mountain risks and risk governance: challenges and lessons learnt
185
Lombardy Region. 2002. Inventario delle frane e dei dissesti idrogeologici della Regione Lombardia. Direzione generale territorio e urbanistica, Struttura rischi idrogeologici, Milan.
Maceachren AM, Cai G, Sharma R, Rauschert I, Brewer I, Bolelli L, Shaparenko B, Fuhrmann S, Wang H (2005) Enabling collaborative geoinformation access and decision-making through a natural, multimodal interface. International Journal of Geographical Information Science 19: 293-317.
Maggioni, M. 2004. Avalanche release areas and their influence on uncertainty in avalanche hazard mapping. PhD thesis, Universität Zürich.
Maiyo L, Kerle N, Köbben B. 2010. Collaborative post-disaster damage mapping via geo web services. In Konecny M et al. (ed) Geographic Information and Cartography for Risk and Crisis Management - Towards better solutions, Lecture Notes in Geoinformation and Cartography, Springer Verlag, Berlin, Heidelberg, pp 221-231.
Maquaire O, Malet J-P, Remaître A, Locat J, Klotz S, Guillon J. 2003. Instability conditions of marly hillslopes: towards landsliding or gullying? The case of the Barcelonnette basin, South East France. Eng Geol 70 (1-2): 109-130.
McEntire DA, Myers A. 2004. Preparing Communities for Disasters: Issues and Processes for Government Readiness. Disaster Prevention Mgt 13(2): 140-152.
Mercer J, Kelman I, Taranis L and Suchet-Pearson S. 2009. Framework for integrating indigenous and scientific knowledge for disaster risk reduction. In: Disasters 34 (1): 214-239 doi:10.1111/j.0361-3666.2009.01126.x
Montgomery, D. and Dietrich, W. 1994. A physically based model for the topographic control on shallow landsliding. Water Resources Research, 30:1153–1171.
National Environmental Justice Advisory Council (2004) Ensuring risk reduction in communities with multiple stressors: environmental justice and cumulative risks/impacts. Online 12/12/2010 http://www.epa.gov/compliance/ej/resources/publications/nejac/nejac-cum-risk-rpt-122104.pdf
OECD. 2003. Risk Assessment. Emerging systemic risks in the 21th century. Paris: 63-113. Olshansky R B. 2010. The challenge of planning for post-disaster recovery. In Fra Paleo U (ed) Building safer
communities. Risk Governance, spatial planning, and responses to natural hazards, IOS Press, Amsterdam, pp 175-181.
Peters-Guarin, G.; McCall, M. K. and Westen van C. (2010) Coping strategies and manageability: how participatory geographical information systems can transform local knowledge into better policies for disaster risk management. Disasters (fc 2010).
Plan d'Exposition aux Risques Naturels de Barcelonnette (1987)
Plapp, T. 2001. Understanding risk perception from natural hazards. In: RISK 21 - Coping with Risks due to Natural Hazards in the 21st Century - Amman, Dannenmann &Vulliet (eds). © 2006 Taylor & Francis Group, London, pp. 101-108.
PAI 2001. Piano stralcio per l’Assetto Idrogeologico (PAI): Interventi sulla rete idrografica e sui versanti. Linee generali di assetto idraulico e idrogeologico , Adda sopralacuale (Valtellina e Valchiavenna). Autorità di bacino del fiume Po: Parma.
Reese, S.; Bell, R. & King, A. 2007. RiskScape: a new tool for comparing risk from natural hazards, Water & Atmosphere, 15, 24-25.
Regione Lombardia, 2008. I Geositi della Provincia di Sondrio. Regione Lombardia and IREALP. 139 p.
Remaître, A. 2006. Morphologie et dynamique des laves torrentielles: applications aux torrents des Terres Noires du bassin de Barcelonnette (Alpes du Sud). Université de Caen/Basse-Normandie.
Renn O. 2004. The Challenge of Integrating Deliberation and Expertise: Participation and Discourse in Risk Management. In: T. L. MacDaniels and M.J. Small (eds.): Risk Analysis and Society: An Interdisciplinary Characterization of the Field (Cambridge University Press: Cambridge: 289-366.
Renn, O. and Schweizer, P.J. 2009. Inclusive Risk Governance: Concepts and Prospects. Environmental Policy and Governance. Special Issue: European Governance of natural resources: participation in a multi-level context 19(3): 174–185. Online 18/10/2010 http://www.riskanduncertainty.net/TG04/Ortwin_Renn_Governance.pdf
Ripley, A. 2008. The Unthinkable: who survives when disaster strikes and why. Crown Publishers: New York.
Rowe G and Frewer L. 2000. Public Participation Methods: An Evaluative Review of the Literature. Science, Technology and Human Values, 25: 3-29.
Sagala S and Okada N. 2007. Managing Early Warning Systems in Tsunami Prone Communities: The Need for Participatory Approach (PRA). Disaster Prevention Institute, Kyoto University, Japan: 195-204.
Salvati P, Calducci V, Bianchi C, Guzzetti F, Tonelli G. 2009. A WebGIS for the dissemination of information on historical landslides and floods in Umbria, Italy. Geoinformatica 13: 305–322.
Sarevitz D, Pielke RA and Byerly R. 2000. Prediction: Science, Decision Making and the Future of Nature. Island Press, Washington.
Integrated People Centred Early Warning System as a risk reduction strategy, Northern Italy
186
Schwarze R., M. Schwindt, H. Weck-Hannemann, P. A. Raschky, F. Zahn and G G. Wagner 2010: Natural Hazard Insurance in Europe – Tailored Responses to Climate Change Needed. Environmental Policy and Governance (accepted; forthcoming 2010)
Slovic, P. 1999. Trust, Emotion, Sex, Politics, and Science: Surveying the Risk-Assessment Battlefield. Risk Analysis, 19 (4).
Soil Thematic Strategy, 2006. Communication from the Commission to the Council, the European Parliament, the European Economic and Social Committee and the Committee of the Regions. Brussels.
Southern RL. 1995. Warnings that failed, warnings that worked and a few heroes : Stories from Bamgladesh and Australia. Stop Disasters: 25, 9-10.
Sterlacchini et al. 2010. A methodological approach for landslide risk assessment and loss estimation. Application to the Village Tresenda, Valtellina di Tirano, Italy. Natural Hazards and Earth System Sciences (under review).
Thapa M., Raj Luintel Y, Gauchan B and Amatya K. 2008. Indigenous Knowledge on Disaster Mitigation: Towards Creating Complementarity between Communities’ and Scientists’ Knowledge. In: Indigenous Knowledge for Disaster Risk Reduction: Good Practices and Lessons Learned from Experiences in the Asia-Pacific Region: 30-33.
Thrupp LA. 1989. Legitimizing Local Knowledge: From Displacement to Empowerment for Third World People. In Agriculture and Human Values, 6(3): 13-24
Tompkins E., Lemos M. & Boyd E. (2008) A less disastrous disaster: managing response to climate-driven hazards in the Cayman Islands and NE Brazil. Global Environmental Change, 18, 736-745
United Nations-International Strategy for Disaster Reduction (UN-ISDR) & Kyoto University and European Union (2008) Indigenous Knowledge for Disaster Risk Reduction: Good Practices and Lessons Learned from Experiences in the Asia-Pacific Region. UN/ISDR: Bangkok
United Nations-International Strategy for Disaster Reduction (UN-ISDR) (2009). Terminology on Disaster Risk Reduction. Online 20/10/2010 http://www.unisdr.org/eng/terminology/terminology-2009-eng.html
United Nations-International Strategy for Disaster Reduction (UN-ISDR) (2005a) Hyogo Framework for Action 2005-1015: Building the Resilience of Nations and Communities to Disasters, Tech. Report, World Conference on Disaster Reduction.
United Nations-International Strategy for Disaster Reduction (UN-ISDR) (2005b). United Nations. Bureau for Crisis Prevention and Recovery. Reducing Disaster Risk: A Challenge for Development. Online 20/10/2010 http://www.undp.org/bcpr/disred/rdr.htm
van Westen CJ, Castellanos EA, Sekhar L. 2008 Spatial data for landslide susceptibility, hazards and vulnerability assessment: an overview. Eng Geol 102(3-4): 112-131.
Walker G, Whittle R, Medd W and Watson N. 2010. Risk Governance and Natural Hazards. CapHaz-Net Consortium. Online 18/10/2010 http://caphaz-net.org/outcomes-results/CapHaz-Net_WP2_Risk-Governance.pdf
Wanczura, S. 2006. Assessment of the spatial planning approaches to natural hazards in selected EU member States. In: Fleischhauer, M., Greiving, S. & Wanczura, S. (eds.). Natural hazards and spatial planning in Europe. Dortmund: Dortmunder Vertrieb für Bau- und Planungsliteratur.
Wenzel E. 1997. Environment, development and health: ideological metaphors of posttraditional societies? Health Educ Res 12(4):403–18
WMO 2010. A Framework for Disaster Risk Management Derived from HFA. World Meteorological Organization (WMO). Disaster Risk Reduction (DRR) Programme Geneva. Online 02/11/2010 http://www.wmo.int/pages/prog/drr/DrmFramework_en.htm Accessed 12 September 2010
Young, O. R. 2002. The institutional dimension of environmental change: fit, interplay, and scale MIT Press.
Young, O. R. 2003. Environmental Governance: the role of institutions in causing and confronting environmental problems, International Environmental Agreements: Politics, Law and Economics, 3, 377-393.

Chapter 10: Conclusions
187
Chapter 10: Conclusions
10.1 General observations
Significant efforts have been made in Italy to enhance civil protection which has led to important improvements of the current risk management situation. Furthermore, the scientific understanding of risk factors has increased remarkably in the last decades. Unfortunately, the divide between scientific research and risk management is still strong, especially concerning the involvement of the population at risk. In addition, the key role of volunteers in the Civil Protection System in Italy is a positive example for many countries and has been proven effective for the management of several emergencies. However, the fact that the volunteers are seen as the representatives of the population leads to most preparedness activities involving only volunteers, while the preparedness of the general population is neglected. Particularly in the studied region, even though there have been some emergency exercises with the volunteers of the Civil Protection, the emergency plans and procedures have never been communicated to the population and no drills involving the population at risk have ever been performed despite this being mandatory by law. This shows that to some extent, there is a strong disconnect between what is established by law and what is effectively carried out. Thus, to achieve an effective risk reduction it is fundamental to improve the networking and communication among the different stakeholders, of which the local populations are a major actor.
Results indicate that in the study zone, several valuable risk reduction efforts have been made in the past, including the development of a comprehensive emergency plan. However the tendency is still to direct efforts towards emergency response rather than prevention. All the EWS (Early Warning System) components are present, but they display several shortcomings, are individually developed, have little structure and are poorly linked. This lack of integration of the components renders these EWS efforts ineffective. To alleviate this, several actions are proposed to integrate the different risk management strategies into an IEWS (Integrated community based Early Warning System) with a multidisciplinary approach.
The situation in the study area, including the lack of an EWS and the current existence of a detailed emergency plan, generated a change in the original focus of this research. The initial goal of developing a methodology for applying Early Warning Systems to the emergency plan was redefined. Instead, the main goals became to design a methodology to implement IEWS as a key risk reduction strategy, and secondly, to integrate the designed IEWS and the emergency plans inside a comprehensive risk management plan.
Due to the lack of guidelines for the development of this methodology, the first steps were to apply some of the elements that were considered to be important parts of the final methodology to prove their relevance. These elements included primarily to locate, contact and generate bonds with local key stakeholders and to analyze the current state of each EWS component. Only then was it possible to continue with the further steps that involved the application of a survey and the implementation of a communication campaign.
The proposed methodology results from combining traditional technical EWS, Community Based EWS and different risk management methodologies. These originate from international organizations working directly in the field and interacting closely with communities, as well as from deeply thought-out theoretical structures from academic and scientific institutions from the natural and social sciences. The methodology includes an initial assessment phase followed by an implementation phase. The constant monitoring and evaluation of all the components, together with the continuous feedback from all stakeholders gives flexibility to the methodology. This flexibility allows an adaptation to unexpected conditions in any point of the implementation. One of the main elements of the methodology is the analysis of the current state of the system. This analysis is performed using information from natural and social sciences and combining multiple methods such as bibliographical research, direct observation, GIS (Geographical Information Systems) and survey applications.
The survey results show that in the study area, the population feels that the current warning system will provide them with sufficient time to escape personal harm, regardless of the dimension or characteristics of a future event. This corresponds to low levels of perceived risk and a transfer of responsibility to the authorities, who are expected to manage the emergency without any involvement of the population. However, respondents are aware of their lack of preparedness and show a strong interest not only in increasing their level of knowledge and preparedness, but also in participating more actively in the

Integrated People Centred Early Warning System as a risk reduction strategy, Northern Italy
188
disaster risk reduction efforts. Nonetheless, the population does not neglect the importance of the local government and emergency personnel in risk management and risk reduction, and is willing to collaborate with them to mitigate the risk to which they are exposed. People expressed willingness to participate in communication and education campaigns and emergency exercises, and to improve their reaction capacity by learning how to be better prepared to react in case of a future event. The previous indicates that more resources should be devoted to risk communication. However providing information is not enough, it is necessary to make sure that people understand the given information and the implications of undertaking or not a specific action. This issue was initially addressed with the development and partial implementation of educational campaigns specifically addressing the local risks. The topics of the campaigns included emergency procedures and other topics selected by the local population. The results of the survey and some material prepared for the educational meetings were handed out to school teachers and will be provided to the local authorities and emergency personnel, with the aspiration that they continue the educational efforts to increase the preparedness of the population.
10.2 General remarks and recommendations
Early warning systems are not simple, linear mechanisms limited to the emission of a timely warning. They are composed of multiple sub-systems linked in a flexible way to enable interaction and adaptation to the local conditions and needs of the population which ensures acceptance and sustainability. Developing an effective EWS, more than creating new standardised systems, requires that efforts be focused on connecting the already existing individualistic disaster risk reduction initiatives within a flexible multi-sectorial, interdisciplinary and participatory approach. Additionally, any EWS should be locally adapted and have a multi hazard approach, linking all the existing hazard-based systems.
In the last years, there has been a change of approach on how to deal with risk. The importance of public participation has been acknowledged by important governmental bodies, such as the European Union. In fact, most recent documents of the European Union related to risk issues call insistently for public participation. This is in contrast to the past, when populations were regarded as passive subjects whose interests and needs were taken care of by experts and public agencies alone. This reflects the recognition that all stakeholders in risk management and risk governance should be involved in increasing the effectiveness of risk reduction strategies. However, it is difficult to put this new concept into practice and make public participation a real and effective strategy. Participatory activities are very costly, mostly in terms of time and dedication, and labour-intense: they require a shift of mentality, major changes in professional and institutional practices, and the design and implementation of new instruments and procedures. Once participation has started, a major challenge is to assure the sustainability of the efforts. For this reason, the author emphasizes the necessity of creating a stable IEWS committee with representatives of all stakeholders. This committee ensures the continuity of the IEWS regardless of the duration of political periods and scientific projects’ implementations, factors that traditionally have a strong influence in the sustainability of risk reduction initiatives. Considering the local knowledge and involving those directly at-risk in the risk management and risk governance allows for: a guarantee that the decision-making is inclusive and responsive to those affected by it; an increase in the levels of trust among stakeholders and community ownership; assurance that the particular needs of the local community will be addressed; an increase in the sustainability of any implemented decision; and an increase in the probability that the population will react appropriately and effectively during an emergency by respecting the emergency procedure and reducing the risk to lives and infrastructure.
The participation of all stakeholders in every phase of the EWS is required for the effectiveness of the system, but it is not the only important factor. The sustainability and the successful implementation of any EWS will also depend on the formulation and execution of sound public policy and good governance.
Methodologies developed by the natural scientific community and methodologies used by social scientist and non-academic organizations for risk management usually fail in recognizing the importance of either community participation and local knowledge, or academic information and identification of uncertainties. To improve the efficiency of risk reduction initiatives it is fundamental to bridge the existing gaps between natural sciences, social sciences and non-academic organizations by combining them with an inter-disciplinary applied research approach.
Local governments can make use of quantitative and qualitative vulnerability indicators to improve the risk assessments allowing them to make coordinated risk reduction decisions and actions. Additionally, displaying georeferenced survey-derived indicators for capacity reaction and vulnerability, such as community's risk perception and preparedness, can improve the risk communication processes among

Chapter 10: Conclusions
189
authorities, scientists and local communities. This could enhance the decision-making processes and help to prioritize risk reduction actions.
The use of questionnaires to measure the informative needs and willingness to participate in communication campaigns has proven to be an useful tool which permits the design of strategies tailored to the local characteristics of the population. Questionnaires can also be used to quantitatively gauge the population’s perceived risk, trust on authorities, awareness, knowledge and preparedness in relation to natural hazards. Once the obtained information is properly analysed, the results can be used as predictors of the reactions and general capacity response of the population to a future event. Thus, surveys allow examination of a community's own unique circumstances, in order to test and adapt the best practices and solutions for a community’s needs, establishing an adequate set of priorities. However, when possible, people should be involved not only in the emergency phase and mitigation, but from the beginning of the risk assessment, so that local communities may assess their own vulnerability and create their own solutions with regard to natural hazards.
The scientific community and government authorities tend to assume that the general population is not interested in participating in disaster risk reduction, and that by paying high taxes to the state, people transfer the responsibility of risk reduction to the authorities especially in developed countries. However, as previously stated, it was found that most people of the general population want to be involved in disaster mitigation and to assume their own responsibility for risk reduction.
Early Warning Systems became a “fashion term” after the Indian Ocean tsunami of 2004, when the Secretary-General of the United Nations stated that the development of integrated EWS for all natural hazards and all communities is a key action for disaster reduction. However, the definition of EWS is still not universal but varies according to scientific and technical disciplines, political convenience, school of thought, etc. Regardless of name or definition, the efforts of all stakeholders should be combined and point together towards enhancing reaction capacity, so that the individuals exposed to a hazard may take timely action to avoid or reduce their risk and prepare for effective response to deal with adverse events.
EWS are highly complex and demand a lot of dedication of multiple stakeholders. To develop an EWS requires the constant participation of many committed people, strong support of the government and often a significant economic investment. This thesis presents some results derived from the process of designing and partially implementing an IEWS. However more work is necessary to complete the implementation of a sustainable IEWS at the study area CM Valtellina di Tirano. One of the first actions should be the dissemination of the recently updated emergency plan among the entire population.
An effective EWS can only be achieved once stakeholders understand that they are all part of the EWS. However, EWS alone are not enough, they must be combined with other equally important risk reduction measures, such as spatial planning, education and loss compensation. Governments, scientists and local communities have to step up to the challenge to work together and link all efforts to achieve an effective disaster risk reduction.

Integrated People Centred Early Warning System as a risk reduction strategy, Northern Italy
190
Acknowledgements
191
Acknowledgements
Many people have contributed to the achievement of this research and helped me to conduct it far from my home country. It is not possible to name them all in this short page, yet I hope they know about my deepest gratitude for their support along these years. I would like to thank my official tutor Mattia who support me during the research, dealing with the administration problems and providing help with the GIS analysis. My second tutor Simone who made important contributions to this work. To my co tutors Alessandro Pasuto, Marcel Hurlimann and specially Stefan Greiving, for his invaluable help during my internship in Dortmund. Special thanks to all the researchers of the Mountain Risks Project, in particular the coordinators Jean-Philippe Malet and Olivier Macquarie and to all the your researchers, specially Mel for her friendship and constant support, Marj for a great company particularly in Dortmund, Graciela for sharing with me her experience on the PhD struggle and for great days doing fieldwork, to Jacopo, Jan, Byron, Dominika, Simone, Anke, Ulrich, Alex, Alessio, Olga, Julien, Ping, Sami and Sueng Won. Thank you all for a great time everywhere we went. My special gratitude goes to all the friendly and helpful people of Valtellina that collaborate with me on this research, including those that participated on the survey, the people of the vineyards, the school teachers and many others that provided invaluable assistance. All of them were always willing to help and since the beginning were always kind, even when I was struggling to communicate with my poor Italian. Many thanks to all my office colleagues and friends from the DISAT and UNIMIB in general, Ari and Ila for constant help with translations and contacting people, Ivan for sharing the emotion of teaching, also to Simo and Corrado. Thanks to Paula, Francesca, Sara and Claudia for sharing the sweet and sour moments of doing a PhD and to Michele for his help in the design of the communication campaign. Sincere gratitude goes to Professor Ruggero Spada for opening the doors of the school and of the community of Tirano and for his invaluable help during the whole process. My gratitude is extended to Lisa Garbellini from IREALP for her inspiring initiative to recover and develop a beautiful project of education. I thank also to Giovanni di Trapani who provided support to elaborate the research in the Comunità Montana Valtellina di Tirano. In Colombia, my special gratitude to Francoise, Alejo, Humberto, Gloria and Michel, for introducing me into research. You all are a source of inspiration and encouragement. I also thank Chris Gregg and Silvia Zoboli for their help with the design of the questionnaires and Tullio Ricci for his friendship, his help with the distribution strategy and specially for taking me to experience my first volcanic eruption. To Carina Fearnley for her collaboration and for the enthusiastic discussions about EWS. I would also like to thank Karen Sudmeier for her feedbacks and to Mauro Soldati for his important suggestions as external advisor. My special thanks to all the people of the CERG at the University of Geneva for intensify my passion for natural hazards and for allowing me to meet amazing people. Many thanks also to Jacqui, Isa, Mike, Gustavo, Bill, Adriana, Michel, Jorge and family, Rudi and Luke. People who shared with me magic moments in Colombia, Ecuador and USA, I will never forget those experiences. This thesis would not be possible without the financial support of Marie Curie Foundation that allowed me to carry on this research and to participate in numerous international congress and workshops. Professor Angelo Cavallin for his kind support during the whole process and especially for finding the necessary funding that allowed me to finish this thesis. I also thank the personnel of the University Milano Bicocca,
Integrated People Centred Early Warning System as a risk reduction strategy, Northern Italy
192
in particular Prof. Vighi, Ernestina, Enza and Marika for their assistance with the multiple administration issues. I also would like to thank other friends who have been essential in this process: Ilona, Buitro and Rosella, your unconditional friendship and constant support kept me going. Also Lauren, my favourite volcanic girl, for your help and specially for sharing laughs and stories giving me a refreshing energy that help me in the last track of the race, and Deanne, my wify, for proof reading some of my manuscripts and for sharing with me so many amazing moments. In Milan, for their friendship and solidarity many thanks to my fratelloni and housemates from Casa Cesarini Sforza: Pol, Nico, and also Pico. You helped me to know this amazing country and thanks to you this has been a beautiful journey. Thanks also to Elena, Riccardo and to my first “Italian family”: Caro and Roci. Roelant, thank you for being you, for your company, generosity and permanent support. Finally I thank my beloved family, Mum, Dad, Andres, Adri, Brujo, Sasha and my dear uncles, aunties, and cousins, for supporting me from the distance and sharing with me the hard and the good times. This thesis would never be done without all your love, generosity and constant encouragement.

Author’s Resume
193
Author’s Resume
Carolina Garcia is a Geologic Engineer from the National University of Colombia, Medellin and holds a Master degree in Earth Sciences from EAFIT University, Medellin. She has been working in several Natural Hazard research institutes since 2001 in both Colombia and Italy. Additionally, she has worked as an emergency rescue volunteer with a first aid group providing her with some basic experience in humanitarian work. Her focus is to integrate natural and social sciences to generate research products useful for both local stakeholders and people at risk in the base that only by participative, interdisciplinary and integrative preparation activities it is possible to achieve a real disaster risk reduction.
Her research interests are:
• People Centred Early Warning Systems
• Emergency Plans
• Risk Management
• Risk Communication
• Risk Perception
• Disaster Risk Reduction
Email: [email protected]

Integrated People Centred Early Warning System as a risk reduction strategy, Northern Italy
194

Scientific activities performed
195
Scientific activities performed during the PhD study
Peer reviewed papers and proceedings Kappes, M., Garcia, C., Peters Guarin, G., Angignard, M., Glade, T., Greiving, S., Blahut, J., Frigerio, S. and Keiler, M. (in preparation). Mountain Risks and Risk Governance: Challenges and Lessons Learnt. Book compilation Mountain Risks Project.
Garcia, C. (in preparation). Use of quantitative surveys for the estimation of response capacity in the designing of a Community Based Early Warning System.
Garcia, C. (in preparation) Development of a universal methodology for implementing integrated Early Warning Systems in the risk management context.
Garcia, C. (in preparation). Social survey and GIS mapping tools: integrating people’s perception, preparedness and trust for Vulnerability assessment.
Garcia, C. , Fontana, M., De Amicis, M. (submitted). Applicazione di un Sistema di Allarme Precoce Basato sulla Comunita’ nella Comunità Montana di Valtellina di Tirano. Short paper proposal. Italian Civil Protection.
Fontana, M., Rossetti, M., De Amicis, M. and Garcia, C . (submitted). La comunicazione efficace come condizione chiave per lo sviluppo di una protezione civile partecipata. Una proposta per la comunicazione preventiva del rischio idrogeologico, elaborata per il territorio della Comunità Montana di Valtellina di Tirano. Italian Civil Protection.
Garcia C., Sterlacchini S., De Amicis M., Pasuto A. and Greiving S. 2010. Community Based Early Warning System for mountain risks, northern Italy: identifying challenges and proposing strategies. Proceedings: International Conference “Mountain Risks: bringing science to society”: 291-299
Garcia, C. and Fearnley, C. submitted. Evaluating Critical Links in Early Warning Systems for Natural Hazards. In: Environmental Hazards. Special Publication Disaster Risk Reduction: Connecting Research and Practice
Garcia, C. ; Bowman, L.; Wilmshurst, J.; Ruin, I.; Escobar-Wolf, R.; Bajo, J.; Cordoba, G. submitted. Reflections from the Participative Workshop: Knowledge Sharing and Collaboration in Volcanic Risk Mitigation at Galeras Volcano, Colombia. INSULA International Journal of Island Affairs.
Abstracts (posters and conference presentations)
Garcia C ., Sterlacchini S., De Amicis M., Pasuto A. and Greiving S. 2010. Community Based Early Warning System for mountain risks, northern Italy: identifying challenges and proposing strategies. Proceedings: International Conference “Mountain Risks: bringing science to society”: 291-299. PRESENTATION
Peters-Guarin, G. and Garcia. C. 2010. Community Based Early Warning System for mountain risks, northern Italy: identifying challenges and proposing strategies. International Conference “Mountain Risks: bringing science to society”. PRESENTATION
Integrated People Centred Early Warning System as a risk reduction strategy, Northern Italy
196
Peters-Guarin, G., Garcia. C. and Frigerio, S. 2010. Social survey and GIS mapping tools: integrating people’s perception, preparedness and trust for Vulnerability assessment. In: Spatial assessment and analysis of vulnerability. GI_Forum Salzburg – Austria. 6-9 July. PRESENTATION
Garcia, C., De Amicis, M. and Sterlacchini, S. 2010. Integrated Community Based Early Warning Systems for Mountain Risks. International Disaster and Risk Conference Davos IDRC. Global Risk Forum GRF “From Thoughts to Action”, Davos – Switzerland. 30 May – 3 June. POSTER
Garcia, C., Sterlacchini, S., De Amicis, M., Fontana, M., Trozzi, A. and Frigerio, I. 2010. Experiences on the development of a Community Based Early Warning System for mountain risks in northern Italy. In: Geophysical Research Abstracts, Vol. 12, EGU2010-10818, 2010, EGU (European Geosciences Union) General Assembly 2010. PRESENTATION
Garcia, C ., Blahut, J., Quan Luna, B., Poretti, I., Camera, C., De Amicis, M., Sterlacchini, S. 2010. Interdisciplinary approach for disaster risk reduction in Valtellina Valley, northern Italy. In: Geophysical Research Abstracts, Vol. 12, EGU2010-15423, 2010, EGU (European Geosciences Union) General Assembly 2010. POSTER
Peters-Guarin, G., Garcia. C. and Frigerio, S. 2010. Social dataset analysis and mapping tools for Risk Perception: resilience, people preparation and communication tools. In: Geophysical Research Abstracts, Vol. 12, EGU2010-10878, 2010, EGU (European Geosciences Union) General Assembly 2010. POSTER
Bowman, L.; Garcia, C. ; Wilmshurst, J.; Ruin, I.; Escobar-Wolf, R.; Bajo, J.; Cordoba, G. 2009. Experiences from the Participative Workshop: Knowledge Sharing and Collaboration in Volcanic Risk Mitigation at Galeras Volcano, Colombia. First World Conference Volcanoes, Landscapes and Cultures. Catania – Italy. 11-14 November 2009. PRESENTATION
Garcia, C., Bowman, L., Wilmshurst, J. Ruin, I., Escobar, R. and Bajo, J. 2009. Integrative efforts for disaster risk reduction: experiences from the workshop for Knowledge Sharing and Collaboration in Volcanic Risk Mitigation at Galeras Volcano, Colombia. In: Abstracts “Disaster Risk Reduction for Natural Hazards: Putting Research into Practice”. UCL London. 4-6 November. p. 47. PRESENTATION
Garcia, C. 2009. Use of comprehensive social surveys as key elements of effective and Integrated Community Based Early Warning Systems. In: Abstracts “Disaster Risk Reduction for Natural Hazards: Putting Research into Practice”. UCL London. 4-6 November. p. 52. POSTER
Garcia, C., et al. 2009. Integrated Early Warning Systems: A Multidisciplinary Responsibility for Risk Reduction In: Abtsracts GeoItalia 2009, Rimini, 9-11 September. PRESENTATION
Garcia, C. Sterlacchini, S., Pasuto, A. and De Amicis, M. 2009. Gestion de Riesgos: aplicación de Sistemas de Alerta temprana en Planes de Emergencia (Risk Management: framework for the application of early warning systems to emergency plans). Workshop “Knowledge Sharing and Collaboration in Volcano Risk Mitigation at Galeras Volcano, Colombia” Pasto – Colombia. 6-11 July. POSTER
Garcia, C. Sterlacchini, S., Pasuto, A. and De Amicis, M. 2009. Risk management: application of early warning systems to emergency plans. In: Geophysical Research Abstracts, Vol. 11, EGU2009-10359, 2009, EGU (European Geosciences Union) General Assembly 2009. PRESENTATION
Participation in congresses
2010 International Conference “Mountain Risks: bringing science to society”, Florence, Italy. 24-26 November
2010 GIT (Geology and Information Technology) 2010, Grotaminarda – Italy, 14-16 June
2010 International Disaster and Risk Conference Davos IDRC. Global Risk Forum GRF “From Thoughts to Action”, Davos – Switzerland. 30 May – 3 June.
2010 EGU (European Geosciences Union) General Assembly 2010. Vienna – Austria. 02-07 May
2009 “Convegno di Varenna: Protezione Civile: dalla conoscenza del territorio alla gestione dell’emergenza”. 12-16 October

Scientific activities performed
197
2009 GeoItalia 2009, Rimini – Italy, 6-11 September
2009 GIT (Geology and Information Technology) 2009, Cagli – Italy, 14-19 June 2009 Sixth Meeting of the Expert Working Group on Measuring Vulnerability:
Vulnerability, Resilience and Adaptation, Concepts and Assessment Challenges. Institute for Environment and Human Security (UNU-EHS), Bonn - Germany, 28-30 April
2009 EGU (European Geosciences Union) General Assembly 2009. Vienna – Austria. 19 – 24 April
2009 Conference “Landslide Processes: from Geomorphologic Mapping to Dynamic Modeling”. Strasbourg, France. 6-7 February
2008 “Convegno di Varenna: Protezione Civile: dalla previsione al superamento dell’emergenza. Confronto e sinergie per affrontare le sfide del futuro”. 7-10 October
Participation in courses and workshops
2010 Course “Risk Management: prevention, mitigation and preparedness to disasters”. Sevilla, Spain, 21-22 November
2010 Mountain Risk Intensive Course “Mountain Disaster Risk Management”. Barcelonnette, France, 19 to 25.June
2010 Workshop "Reducing Risks and Managing Disaster the Integrated Approach". Global Risk Forum GRF “From Thoughts to Action”, Davos – Switzerland. 28 -29 May
2010 Training “Course Community Participation in Emergency Response”. The Center for International Humanitarian Cooperation (CIHC). Barcelona, Spain, 18 - 25 April
2009 Workshop “Scienze della Terra e scuola secondaria superiore: dal laboratorio al territorio per incuriosire, coinvolgere, ispirare”, GeoItalia 2009, Rimini – Italy, 7th September
2009 Workshop “Knowledge Sharing and Collaboration in Volcano Risk Mitigation at Galeras Volcano, Colombia” Pasto – Colombia. 6-11 July
2009 Mountain Risks Course: “Multi-technique landslide investigation for hazard assessment” Les Diablerets – Switzerland, 21 – 28 June
2009 Intensive course SPSS (Statistical Package for the Social Sciences). Technical University of Dortmund - Germany
2008 Mountain Risks Topic Workshop IV ‘Landslide risk management’, Barcelona, Spain. 5-6 September
2008 Mountain Risks Intensive Course ‘Quantitative landslide risk assessment and risk management’, Barcelona, Spain. 1-4 September
University lectures and participation in seminars
2010 Class: “Gestione di Emergenza” - Università Milano Bicocca – May 2010. “Risk Management: integration of Community Based Early Warning Systems into Emergency Plans” and “Possible consequences of a volcanic crisis in southern Italy”
2010 Seminar University of Buffalo at SUNY, USA, January 2010 2010 Seminar Michigan Technological University, USA, January 2010
School lessons
2010 Development of several lessons to improve risk preparedness in the Scuola Superiore di Tirano. Development of the “Educational Project for the Reduction and Prevention of Natural Risks at the schools of the Comunita Montana Valtellina di Tirano”

Integrated People Centred Early Warning System as a risk reduction strategy, Northern Italy
198
Annexes
199
ANNEXES

Integrated People Centred Early Warning System as a risk reduction strategy, Northern Italy
200
ANNEX 1. Questionnaires
A1a. Questionnaire for general public (Italian)
A1b. Questionnaire for general public (English)
A1c. Questionnaire for practitioner stakeholders (Italian)
A1d. Questionnaire for practitioner stakeholders (English)

Annexes
201
A1a. Questionnaire for general public (Italian) Informazioni Generali per la compilazione del quest ionario
Risponda cortesemente ad ognuna delle seguenti domande nella maniera più completa e sincera possibile. Ricordi che tutte le risposte saranno completamente CONFIDENZIALI E ANONIME. Scriva con chiarezza e, dove necessario, ponga una X sulla casella prescelta. Utilizzi una pena di qualsiasi colore eccetto nero. La ringraziamo anticipatamente per il tempo che vorrà concederci e per la sua partecipazione all’indagine.
Definizioni Basilari
Per processi naturali pericolosi si intendono i fenomeni naturali che possono verificarsi in un territorio con conseguenze negative sull’ambiente o sulla comunità che vi risiede. Esempi sono alluvioni, frane, terremoti, incendi, valanghe, ecc. Per movimenti di massa si intendono movimenti di materiale di origine naturale (roccia, terreno, neve, ghiaccio) lungo i pendii. Essi comprendono frane, crolli di roccia, valanghe, colate di detrito, ecc.
Per fini statistici, specifichi: Data
Comune di residenza Frazione CAP
1. Sesso : M F
2. Età anni
3. Di che cosa si occupa (campo di lavoro)? A. Agricoltura B. Industria C. Studente D. Disoccupato E. Casalinga/o
F. Servizi, specifichi la sua occupazione
G. Pensionato, specifichi la sua occupazione precedente
H. Altro, specifichi
4. Qual è il suo livello più alto di istruzione? A. Scuola primaria B. Media Inferiore
C. Media Superiore, indirizzo di studi D. Laurea
E. Altro, specifichi
5. Quante persone vivono in casa sua, compreso lei? Totale Anziani(>65anni) Adulti (18-65 anni) Giovani e bambini (<18 anni)
6. Da quanto tempo risiede nel Comune/Frazione che ha indicato sopra? Anni
7. Da quante generazioni vi risiede la sua famiglia (inclusa la sua)?
8. La casa dove abita attualmente è: A. Di sua proprietà B. In affitto C. Altro, specifichi
9. Quale è il suo livello di preoccupazione pensand o alla possibilità che si verifichino processi naturali pericolosi nel Comune/Frazione in cui risi ede? Utilizzi la scala da 1 = Nullo a 5 = Molto Alt o 1. Nullo 2. Basso 3. Medio 4. Alto 5. Molto Alto
10. Lei o la sua famiglia avete mai avuto esperienz a diretta di un evento naturale disastroso? A. Si, ma non ho subito alcun danno
B. Si, e mi ha provocato dei danni
C. No, ma so che eventi di questo tipo sono avvenuti in passato nel Comune/Frazione in cui risiedo
D. No, e non ho mai saputo di eventi avvenuti in passato nel Comune/Frazione in cui risiedo
se Si, descriva brevemente che cosa, quando, dove avvenne e se ci furono vittime, feriti o danni
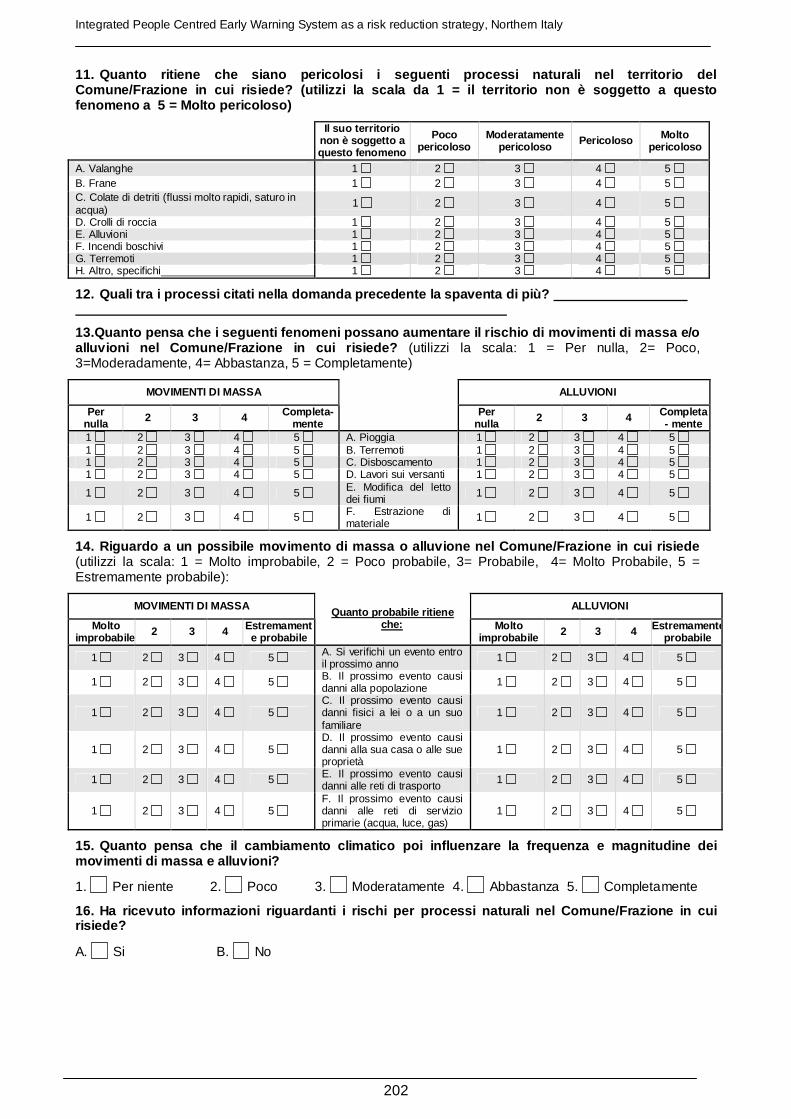
Integrated People Centred Early Warning System as a risk reduction strategy, Northern Italy
202
11. Quanto ritiene che siano pericolosi i seguenti processi naturali nel territorio del Comune/Frazione in cui risiede? (utilizzi la scala da 1 = il territorio non è soggetto a questo fenomeno a 5 = Molto pericoloso)
Il suo territorio non è soggetto a questo fenomeno
Poco pericoloso
Moderatamente pericoloso Pericoloso Molto
pericoloso
A. Valanghe 1 2 3 4 5 B. Frane 1 2 3 4 5 C. Colate di detriti (flussi molto rapidi, saturo in acqua)
1 2 3 4 5
D. Crolli di roccia 1 2 3 4 5 E. Alluvioni 1 2 3 4 5 F. Incendi boschivi 1 2 3 4 5 G. Terremoti 1 2 3 4 5 H. Altro, specifichi 1 2 3 4 5
12. Quali tra i processi citati nella domanda prece dente la spaventa di più?
13. Quanto pensa che i seguenti fenomeni possano au mentare il rischio di movimenti di massa e/o alluvioni nel Comune/Frazione in cui risiede? (utilizzi la scala: 1 = Per nulla, 2= Poco, 3=Moderadamente, 4= Abbastanza, 5 = Completamente)
MOVIMENTI DI MASSA ALLUVIONI
Per nulla 2 3 4 Completa-
mente
Per
nulla 2 3 4 Completa- mente
1 2 3 4 5 A. Pioggia 1 2 3 4 5 1 2 3 4 5 B. Terremoti 1 2 3 4 5 1 2 3 4 5 C. Disboscamento 1 2 3 4 5 1 2 3 4 5 D. Lavori sui versanti 1 2 3 4 5
1 2 3 4 5 E. Modifica del letto dei fiumi
1 2 3 4 5
1 2 3 4 5 F. Estrazione di materiale
1 2 3 4 5
14. Riguardo a un possibile movimento di massa o al luvione nel Comune/Frazione in cui risiede (utilizzi la scala: 1 = Molto improbabile, 2 = Poco probabile, 3= Probabile, 4= Molto Probabile, 5 = Estremamente probabile):
MOVIMENTI DI MASSA ALLUVIONI
Molto improbabile 2 3 4 Estremament
e probabile
Quanto probabile ritiene che: Molto
improbabile 2 3 4 Estremamente probabile
1 2 3 4 5 A. Si verifichi un evento entro il prossimo anno
1 2 3 4 5
1 2 3 4 5 B. Il prossimo evento causi danni alla popolazione
1 2 3 4 5
1 2 3 4 5 C. Il prossimo evento causi danni fisici a lei o a un suo familiare
1 2 3 4 5
1 2 3 4 5 D. Il prossimo evento causi danni alla sua casa o alle sue proprietà
1 2 3 4 5
1 2 3 4 5 E. Il prossimo evento causi danni alle reti di trasporto
1 2 3 4 5
1 2 3 4 5 F. Il prossimo evento causi danni alle reti di servizio primarie (acqua, luce, gas)
1 2 3 4 5
15. Quanto pensa che il cambiamento climatico poi i nfluenzare la frequenza e magnitudine dei movimenti di massa e alluvioni?
1. Per niente 2. Poco 3. Moderatamente 4. Abbastanza 5. Completamente
16. Ha ricevuto informazioni riguardanti i rischi p er processi naturali nel Comune/Frazione in cui risiede?
A. Si B. No

Annexes
203
17. Se ha ricevuto informazioni riguardanti i risc hi per processi naturali, specifichi :
a. Quando ha ricevuto l’informazione?
b. Ha cercato lei le informazioni? A. Si B. No
c. Da chi ha ricevuto l’informazione riguardanti i rischi per processi naturali nel Comune/Frazione in cui risiede?
A. Radio B. Giornali C. Relazioni tecniche/scientifiche D. Internet E. Televisione F. Rapporti ufficiali G. Incontri informativi H. Opuscoli o volantini educativi I. Cartelloni permanenti sulla strada J. Familiari K. Vicini di casa o amici L. Nella Scuola M. Altro, specifichi
18. Come valuta la qualità delle informazioni che h a ricevuto riguardo ai rischi per processi naturali nel Comune/Frazione in cui risiede? (utilizzi la scala da 1 = Inesistenti a 5 = Ottime)
1. Inesistenti 2. Scarse 3. Accettabili 4. Buone 5. Ottime
19. Vorrebbe ricevere altre informazioni sullo stes so tema?
A. Si B. No
20. Sarebbe disposto a chiederle o a fare una ricer ca personalmente de informazioni riguardo ai rischi per processi naturali ( es. partecipando ad una riunione pubblica, informan dosi su Internet, consultando documenti tecnici e/o scientifici, ecc .)?
A. Si B. No
21. Lei pensa di poter adottare qualcuna misure att e a prevenire o a ridurre le conseguenze negative di un movimento di massa o un evento alluvioni?
A. Si B. No, se si, descriva quello che può fare
22. Attraverso quale fonte vorrebbe ricevere inform azioni riguardo al rischio per processi naturali ne l Comune/Frazione in cui risiede:
A. Radio B. Giornal C. Relazioni tecniche/scientifiche D. Internet E. Televisione F. Rapporti ufficiali G. Incontri informativi H. Opuscoli o volantini educativi I. Cartelloni permanenti sulla strada
J. Altro, specifichi
23. Chi pensa dovrebbe fornire informazioni in meri to al rischio per processi naturali nel Comune/Frazione in cui risiede?
A. Le autorità locali (Comune) B. La Comunità Montana C. Le autorità provinciali (Provincia)
D. Le autorità regionali (Regione) E. Le autorità nazionali (Stato) F. La Comunità Scientifica
G. I Mass media H. La Protezione Civile locale
I. Altro, specifichi
24. Sono state intraprese misure strutturali di mit igazione del rischio per processi naturali (opere – dighe, muri di sostegno, opere di drenaggio, ecc. – per diminuire il danno potenziale e la pericolosità dei processi naturali) nel Comune/Frazione in cui risiede?
A. Si B. No C. Non lo so, se Si, specifichi di che opera si tratta e quando è stata realizzata
25. Conosce il Piano di Emergenza nel Comune/Frazione in cui risiede?
A. Si B. No se Si specifichi quando e come ne è venuto a conoscenza
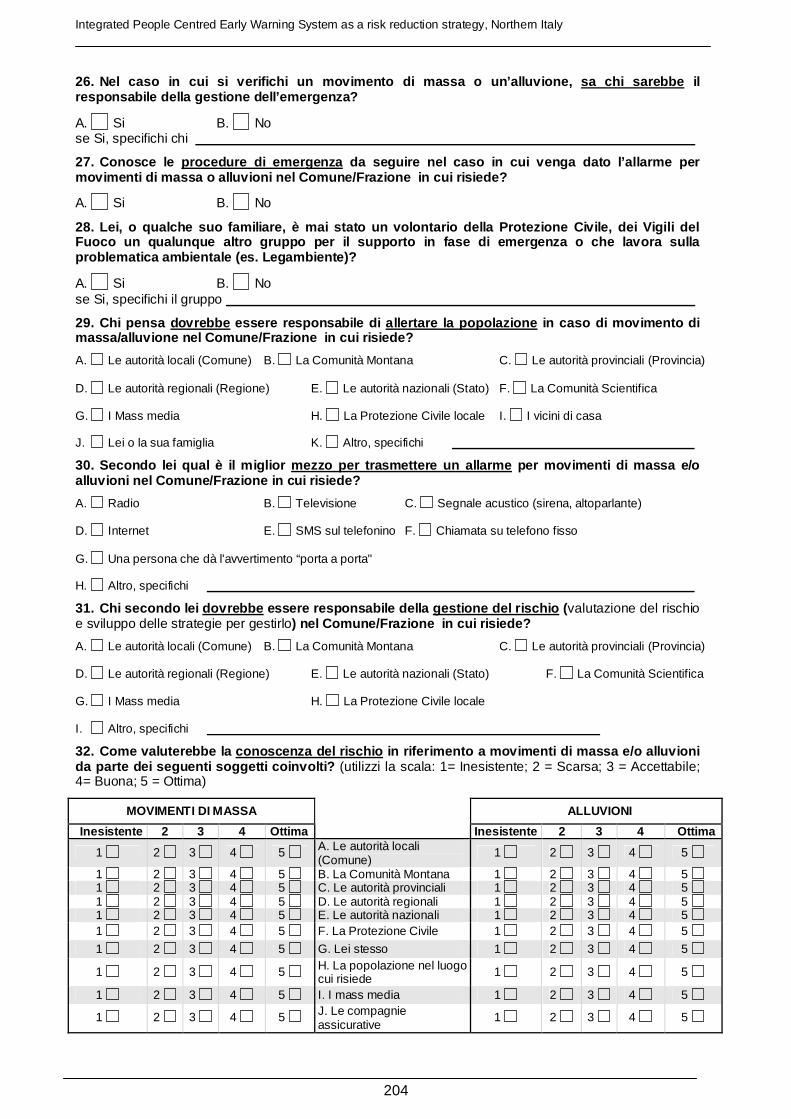
Integrated People Centred Early Warning System as a risk reduction strategy, Northern Italy
204
26. Nel caso in cui si verifichi un movimento di ma ssa o un’alluvione, sa chi sarebbe il responsabile della gestione dell’emergenza?
A. Si B. No se Si, specifichi chi
27. Conosce le procedure di emergenza da seguire nel caso in cui venga dato l’allarme pe r movimenti di massa o alluvioni nel Comune/Frazione in cui risiede?
A. Si B. No
28. Lei, o qualche suo familiare, è mai stato un vo lontario della Protezione Civile, dei Vigili del Fuoco un qualunque altro gruppo per il supporto in fase di emergenza o che lavora sulla problematica ambientale (es. Legambiente)?
A. Si B. No se Si, specifichi il gruppo
29. Chi pensa dovrebbe essere responsabile di allertare la popolazione in caso di movimento di massa/alluvione nel Comune/Frazione in cui risiede ?
A. Le autorità locali (Comune) B. La Comunità Montana C. Le autorità provinciali (Provincia) D. Le autorità regionali (Regione) E. Le autorità nazionali (Stato) F. La Comunità Scientifica G. I Mass media H. La Protezione Civile locale I. I vicini di casa J. Lei o la sua famiglia K. Altro, specifichi
30. Secondo lei qual è il miglior mezzo per trasmet tere un allarme per movimenti di massa e/o alluvioni nel Comune/Frazione in cui risiede?
A. Radio B. Televisione C. Segnale acustico (sirena, altoparlante) D. Internet E. SMS sul telefonino F. Chiamata su telefono fisso G. Una persona che dà l'avvertimento “porta a porta" H. Altro, specifichi
31. Chi secondo lei dovrebbe essere responsabile della gestione del rischio (valutazione del rischio e sviluppo delle strategie per gestirlo) nel Comune/Frazione in cui risiede?
A. Le autorità locali (Comune) B. La Comunità Montana C. Le autorità provinciali (Provincia) D. Le autorità regionali (Regione) E. Le autorità nazionali (Stato) F. La Comunità Scientifica G. I Mass media H. La Protezione Civile locale I. Altro, specifichi
32. Come valuterebbe la conoscenza del rischio in riferimento a movimenti di massa e/o alluvioni da parte dei seguenti soggetti coinvolti? (utilizzi la scala: 1= Inesistente; 2 = Scarsa; 3 = Accettabile; 4= Buona; 5 = Ottima)
MOVIMENTI DI MASSA ALLUVIONI
Inesistente 2 3 4 Ottima
Inesistente 2 3 4 Ottima
1 2 3 4 5 A. Le autorità locali (Comune)
1 2 3 4 5
1 2 3 4 5 B. La Comunità Montana 1 2 3 4 5 1 2 3 4 5 C. Le autorità provinciali 1 2 3 4 5 1 2 3 4 5 D. Le autorità regionali 1 2 3 4 5 1 2 3 4 5 E. Le autorità nazionali 1 2 3 4 5 1 2 3 4 5 F. La Protezione Civile 1 2 3 4 5
1 2 3 4 5 G. Lei stesso 1 2 3 4 5
1 2 3 4 5 H. La popolazione nel luogo in cui risiede
1 2 3 4 5
1 2 3 4 5 I. I mass media 1 2 3 4 5
1 2 3 4 5 J. Le compagnie assicurative
1 2 3 4 5
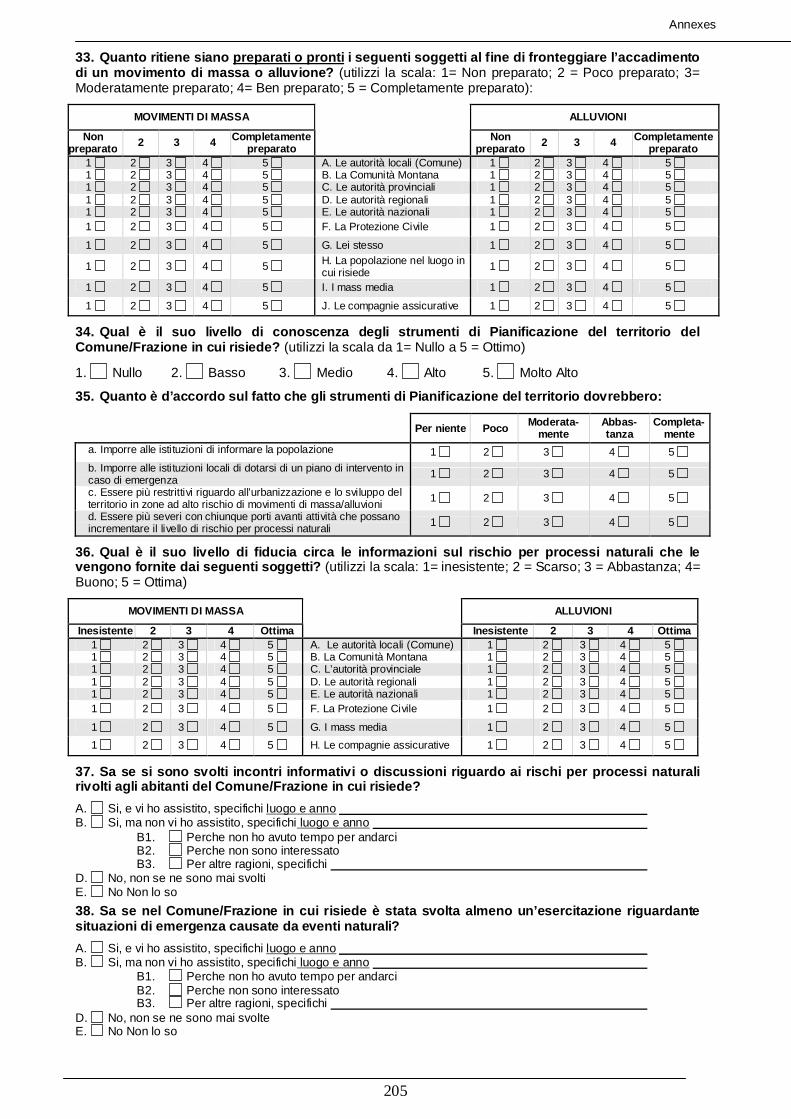
Annexes
205
33. Quanto ritiene siano preparati o pronti i seguenti soggetti al fine di fronteggiare l’acca dimento di un movimento di massa o alluvione? (utilizzi la scala: 1= Non preparato; 2 = Poco preparato; 3= Moderatamente preparato; 4= Ben preparato; 5 = Completamente preparato):
MOVIMENTI DI MASSA ALLUVIONI
Non preparato 2 3 4 Completamente
preparato
Non
preparato 2 3 4 Completamente preparato
1 2 3 4 5 A. Le autorità locali (Comune) 1 2 3 4 5 1 2 3 4 5 B. La Comunità Montana 1 2 3 4 5 1 2 3 4 5 C. Le autorità provinciali 1 2 3 4 5 1 2 3 4 5 D. Le autorità regionali 1 2 3 4 5 1 2 3 4 5 E. Le autorità nazionali 1 2 3 4 5 1 2 3 4 5 F. La Protezione Civile 1 2 3 4 5
1 2 3 4 5 G. Lei stesso 1 2 3 4 5
1 2 3 4 5 H. La popolazione nel luogo in cui risiede
1 2 3 4 5
1 2 3 4 5 I. I mass media 1 2 3 4 5
1 2 3 4 5 J. Le compagnie assicurative 1 2 3 4 5
34. Qual è il suo livello di conoscenza degli strum enti di Pianificazione del territorio del Comune/Frazione in cui risiede? (utilizzi la scala da 1= Nullo a 5 = Ottimo)
1. Nullo 2. Basso 3. Medio 4. Alto 5. Molto Alto
35. Quanto è d’accordo sul fatto che gli strumenti di Pianificazione del territorio dovrebbero:
Per niente Poco Moderata- mente
Abbas-tanza
Completa- mente
a. Imporre alle istituzioni di informare la popolazione 1 2 3 4 5
b. Imporre alle istituzioni locali di dotarsi di un piano di intervento in caso di emergenza
1 2 3 4 5
c. Essere più restrittivi riguardo all’urbanizzazione e lo sviluppo del territorio in zone ad alto rischio di movimenti di massa/alluvioni
1 2 3 4 5
d. Essere più severi con chiunque porti avanti attività che possano incrementare il livello di rischio per processi naturali
1 2 3 4 5
36. Qual è il suo livello di fiducia circa le infor mazioni sul rischio per processi naturali che le vengono fornite dai seguenti soggetti? (utilizzi la scala: 1= inesistente; 2 = Scarso; 3 = Abbastanza; 4= Buono; 5 = Ottima)
MOVIMENTI DI MASSA ALLUVIONI
Inesistente 2 3 4 Ottima
Inesistente 2 3 4 Ottima 1 2 3 4 5 A. Le autorità locali (Comune) 1 2 3 4 5 1 2 3 4 5 B. La Comunità Montana 1 2 3 4 5 1 2 3 4 5 C. L’autorità provinciale 1 2 3 4 5 1 2 3 4 5 D. Le autorità regionali 1 2 3 4 5 1 2 3 4 5 E. Le autorità nazionali 1 2 3 4 5 1 2 3 4 5 F. La Protezione Civile 1 2 3 4 5
1 2 3 4 5 G. I mass media 1 2 3 4 5
1 2 3 4 5 H. Le compagnie assicurative 1 2 3 4 5
37. Sa se si sono svolti incontri informativi o dis cussioni riguardo ai rischi per processi naturali rivolti agli abitanti del Comune/Frazione in cui ri siede?
A. Si, e vi ho assistito, specifichi luogo e anno B. Si, ma non vi ho assistito, specifichi luogo e anno B1. Perche non ho avuto tempo per andarci B2. Perche non sono interessato B3. Per altre ragioni, specifichi D. No, non se ne sono mai svolti E. No Non lo so
38. Sa se nel Comune/Frazione in cui risiede è stat a svolta almeno un’esercitazione riguardante situazioni di emergenza causate da eventi naturali?
A. Si, e vi ho assistito, specifichi luogo e anno B. Si, ma non vi ho assistito, specifichi luogo e anno B1. Perche non ho avuto tempo per andarci B2. Perche non sono interessato B3. Per altre ragioni, specifichi D. No, non se ne sono mai svolte E. No Non lo so

Integrated People Centred Early Warning System as a risk reduction strategy, Northern Italy
206
39. Quanto ritiene sia importante ricevere informaz ioni riguardanti i seguenti argomenti, in riferimento ad eventi naturali pericolosi?
Non importante
Poco importante Importante Molto
importante Essenziale
A. La zonazione di rischio del Comune/Frazione in cui risiede 1 2 3 4 5
B. Le caratteristiche del fenomeno (come si sviluppa, perché si origina, ecc.) 1 2 3 4 5
C. La storia dei dissesti del territorio 1 2 3 4 5 D. Che cosa fanno le autorità per minimizzare il rischio 1 2 3 4 5
E. Le possibili conseguenze di un evento futuro su edifici e infrastrutture 1 2 3 4 5
F. Le possibili conseguenze di un evento futuro sull’ambiente 1 2 3 4 5
G. La legislazione per la pianificazione territoriale 1 2 3 4 5
H. Le procedure di emergenza in caso di evento (come ci si deve comportare, quali azioni devono essere compiute, chi ne è il responsabile, ecc.)
1 2 3 4 5
I. Quali comportamenti lei dovrebbe adottare per essere meno vulnerabile/esposto agli eventi naturali
1 2 3 4 5
J. Chi dovrebbe contattare in caso di emergenza 1 2 3 4 5
K. Risultati della ricerca tecnico/scientifica (che cosa è stato fatto, chi se ne occupa nel suo territorio, …)
1 2 3 4 5
L. Altro, specifichi 1 2 3 4 5
40. Ora che ha finito, potrebbe indicare il suo liv ello di preoccupazione nei confronti delle condizioni di rischio per processi naturali nel Com une/Frazione in cui risiede?
1. Nullo 2. Basso 3. Medio 4. Alto 5. Molto Alto
41. Se fosse organizzato un incontro pubblico infor mativo sugli eventi naturali pericolosi che possono verificarsi nel Comune/Frazione in cui risi ede, le piacerebbe partecipare?
A. Si B. No
42. Quanto ritiene importante che un incontro di qu esto tipo sia tenuto nel Comune/Frazione in cui risiede?
1. Non importante 2. Poco importante 3. Importante 4. Molto importante 5. Essenziale
Grazie per la partecipazione! C’è qualcosa d’altro che vorrebbe aggiungere? Per ulteriori chiarimenti o per maggiori informazioni potete contattare: Dott. Simone Sterlacchini o Dott.ssa Carolina Garcia Tel. 0264482854 (Università degli Studi di Milano - Bicocca) E-mail: [email protected]

Annexes
207
A1b. Questionnaire for general public (Italian) Information for Participants
Please answer the following questions completely as possible, remember all the answers will be confidential and anonymous.
Write clearly and where necessary mark an X in the selected answer.
The results of this survey will help us to develop a risk management plan which takes into account the real necessities of the community and the stakeholders. Your participation is voluntary and all replies will be completely confidential.
If you have any questions about the project please contact Simone Sterlacchini at the University of Milano Bicocca (Tel: 0264482854) or Giovanni Di Trapani (Tel 0342708516) at Communità Montana Valtellina di Tirano.
To know more about the Mountain Risks Project check: http://www.unicaen.fr/mountainrisks Basic Definitions
Natural hazard is a natural phenomenon that can have negative effects on environment or human societies. Such as floods, landslides, earthquakes, fire, snow avalanches, rock fall, etc. Mass movements are down slope movements of earth materials such as rock, soil, snow, ice (they include landslides, rock falls, snow avalanches, etc)
For statistical analysis please specify: Date Municipality Locality ZIP code
1. Gender : Male Female
2. Age years
3. What is you Occupation field?
A. Agriculture B. Industry C. Student D. Unemployed E. Housewife/househusband F. Services, please specify G. Retired, please specify previous occupation H. Other, please specify
4. What is the Highest level of education you have completed?
A. Primary school B. High school C. College D. Technical degree E. Master’s degree F. PhD G. Other, specify
5. How many people live/stay in your home, includin g yourself? Total Elderly (>65 years) C. Adults (18-65 years) D. Children and young (<18 years)
6. How long have you been living in (or been visiti ng) this community? years
7. How many generations have your family lived/stay ed in this community (including yours) ?
8. The house where you are living in the present is :
Owned Rented Other, please specify
9. How concern do you feel when you think about natural hazards in your community? use a scale from 1 = Not at all, to 5 = Completely
1. Not at all 2. A little 3. Moderately 4. A lot 5. Completely
10. Have you or your family ever experienced the ef fects of a natural hazards?
A. Yes, but I didn’t suffer any damage or injury B. Yes and I was directly affected by it C. No, but I know there had been some before in this particular municipality D. No, and I haven’t heard about any in this particular municipality if Yes, please specify briefly WHICH HAZARD WHEN, WHERE AND WHAT happen and if there were any injured or damages

Integrated People Centred Early Warning System as a risk reduction strategy, Northern Italy
208
11. Rate how dangerous do you think the following h azards are for your municipality . Use a scale from 1 = Without consequence to 5 = Very dangerous
Without consequence
Lightly dangerous Dangerous Highly
Dangerous Extremely dangerous
a. Snow avalanches 1 2 3 4 5 b. Landslides (downward movement of a mass of rock, earth or debris)
1 2 3 4 5
c. Debris flow (fast moving mass of unconsolidated, saturated debris) 1 2 3 4 5
d. Rock falls 1 2 3 4 5 e. Floods 1 2 3 4 5 f. Forest fires 1 2 3 4 5 g. Earthquakes 1 2 3 4 5 h. Other, specify 1 2 3 4 5
12. Which of the previous hazards scare you the mos t?
13. How likely do you think the following processes can increase the risk of mass movements or flooding in your municipality ? Use the scale: 1 = Not likely, 2= Very unlikely, 3= Likely, 4= Very likely, 5 = Extremely likely
MASS MOVEMENTS FLOODING
Not likely 2 3 4 Extremely
likely
Not likely 2 3 4 Extremely
likely 1 2 3 4 5 A. Rain 1 2 3 4 5 1 2 3 4 5 B. Earthquakes 1 2 3 4 5 1 2 3 4 5 C. Deforestation 1 2 3 4 5
1 2 3 4 5 D. Slope cutting 1 2 3 4 5
1 2 3 4 5 E. Modification of the river bed
1 2 3 4 5
1 2 3 4 5 F. Material extraction 1 2 3 4 5
14. Regarding a possible mass movement or flooding, please answer: Use the scale: 1 = Not likely, 2= Very unlikely, 3= Likely, 4= Very likely, 5 = Extremely likely
MASS MOVEMENT FLOODING
Not likely 2 3 4 Extremely
likely
How likely do you think: Not
likely 2 3 4 Extremely likely
1 2 3 4 5 A. there will be a mass movement/flooding on this community in the next year?
1 2 3 4 5
1 2 3 4 5
B. this community will be adversely affected by the next mass movement/flooding?
1 2 3 4 5
1 2 3 4 5 C. you (or your family) will be injured by the next mass movement/flooding?
1 2 3 4 5
1 2 3 4 5
D. you will suffer damage to your home or property by the next mass movement/flooding?
1 2 3 4 5
1 2 3 4 5 E. transport networks will suffer damage by the next mass movement/flooding?
1 2 3 4 5
1 2 3 4 5 F. critical lifelines (water, electricity...) will suffer damage?
1 2 3 4 5
15. How do you think climate change influence the f requency and magnitude of hazards?
1. Not at all 2. A little 3. Moderately 4. A lot 5. Completely
16. Have you ever received information about natura l hazards in your municipality ?
A. Yes B. No

Annexes
209
17. If you have received information about natural hazards, please specify
a. did you look for the information? A. Yes B. No
b. when did you receive the information:
c. how did you get the information:
A. On the radio B. In the press C. Scientific experts/technical reports D. On internet E. Television F. Official reports G. Informative Meetings H. Flyers, Educational Brochures I. Permanent street posters J. Family members K. Neighbours or friends L. In the School L. Other, please specify
18. How would you describe the quality of the infor mation you have about natural hazards?
Nonexistent Poor Acceptable Good Really good 1 2 3 4 5
19. Would you like to receive new information about natural hazards?
A. Yes B. No
20. Would you look for new information about natura l hazards? (for instance attend a public meeting, look for a specific website, consult public or scie ntific documents, ...)
A. Yes B. No
21. Do you think you could take personal measures t o reduce the consequences of a possible mass movement or flooding?
A. Yes B. No, if Yes, please describe what could you do
22. How would you like to receive the information a bout natural hazards?
A. On the radio B. In the press C. Scientific experts/technical reports D. On internet E. Television F. Official reports G. Informative Meetings H. Flyers, Educational Brochures I. Permanent street posters J. Other, please specify
23. Who do you think should provide information abo ut natural hazards?
A. Local/municipal Authorities B. Mountain Community C. Regional Authorities D. National Authorities E. Scientist F. Media (jornalist) G. Civil Protection H. Other, please specify
24. Is there any physical mitigation/protection measure s (structures -retaining walls, drainage control, rock nets, dikes, etc- to reduce the damag es or adverse consequences of a natural hazards) in your community?
A. Yes B. No C. Don’t know, if Yes, please specify the measure and when was it build
25. Do you know the emergency plan for your municip ality?
A. Yes B. No , if Yes please specify how did you know about it

Integrated People Centred Early Warning System as a risk reduction strategy, Northern Italy
210
26. If a mass movement or flooding occurs and cause s damages in your municipality, do you know who is responsible for managing the emergency?
A. Yes B. No, if Yes, please specify who is it
27. Do you know the emergency procedures in case of an emergency caused by mass movement or flooding?
A. Yes B. No
28. Have you, or someone in your family, ever been a volunteer of the Civil Protection, Fire Brigade, or any other emergency support group or environment al group?
A. Yes B. No , if Yes please specify which group
29. Who do you think should be responsible for issuing a mass movement/flooding w arning ?
A. Local/municipal Authorities B. Mountain Community
C. Regional Authorities D. National Authorities
E. Scientific community F. Mass media
E. Civil Protection F. Neighbours
G. Yourself or your family H. Other, please specify
30. According to you which is the best media to iss ue a mass movement or flooding warning to your municipality?
A. Radio B. Television
C. Acoustic signal such as siren, loudspeaker D. Internet
E. SMS to the cell phone F. Land phone calling
G. A person giving the warning “door to door” H. Other, please specify
31. Who do you think should be responsible for the emergency management for your municipality ?
A. Local/municipal Authorities B. Mountain Community
C. Regional Authorities D. National Authorities
E. Scientific community F. Mass media
E. Civil Protection F. Neighbours
G. Yourself or your family
H. Other, please specify
32. How do you think is the knowledge of the different entities regarding mass movement and flooding risk? use the scale: 1 = Not existent, 2= Poor, 3= acceptable, 4= good, 5 = Really good
MOVIMENTI DI MASSA ALLUVIONI
Non existent
2 3 4 Really good
Non
existent 2 3 4 Really
good
1 2 3 4 5 a. Local/municipal authorities
1 2 3 4 5
1 2 3 4 5 b. Mountain Community
1 2 3 4 5
1 2 3 4 5 c. Regional authorities 1 2 3 4 5 1 2 3 4 5 d. National authorities 1 2 3 4 5 1 2 3 4 5 e. Civil Protection 1 2 3 4 5 1 2 3 4 5 f. Media (journalist) 1 2 3 4 5
1 2 3 4 5 g. You or your family 1 2 3 4 5
1 2 3 4 5 h. Insurance companies
1 2 3 4 5
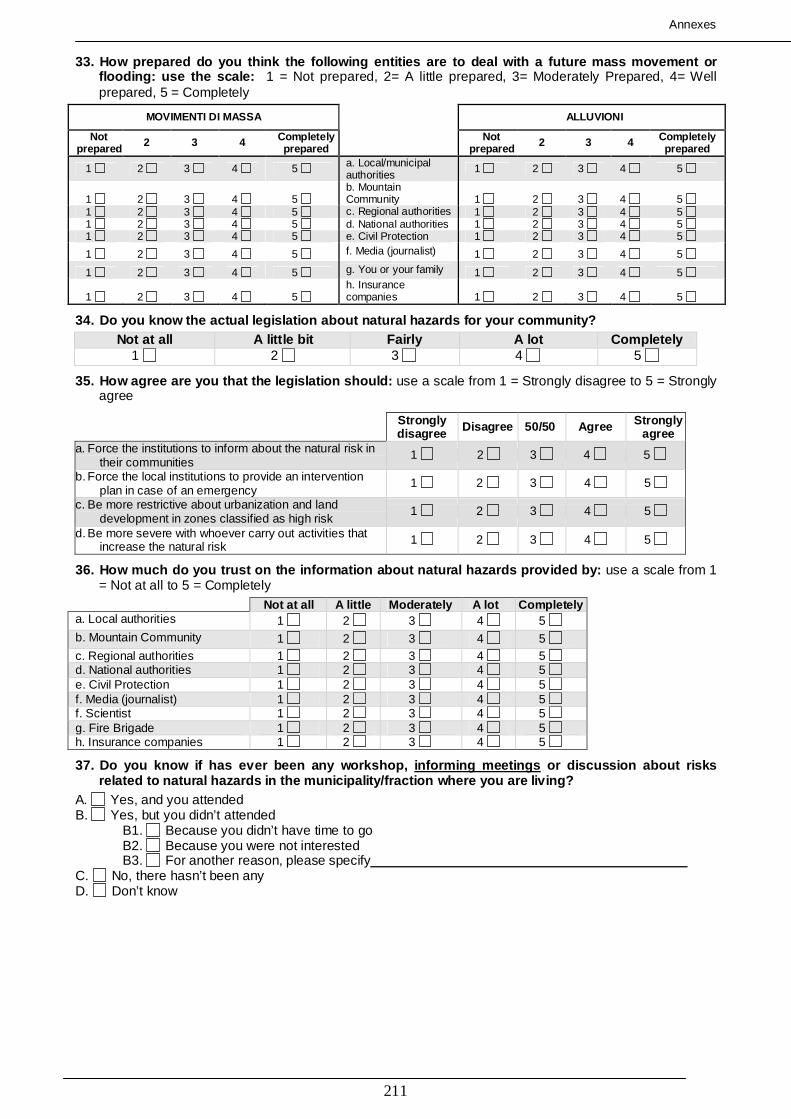
Annexes
211
33. How prepared do you think the following entitie s are to deal with a future mass movement or flooding: use the scale: 1 = Not prepared, 2= A little prepared, 3= Moderately Prepared, 4= Well prepared, 5 = Completely
MOVIMENTI DI MASSA ALLUVIONI
Not prepared 2 3 4 Completely
prepared
Not
prepared 2 3 4 Completely prepared
1 2 3 4 5 a. Local/municipal authorities
1 2 3 4 5
1 2 3 4 5 b. Mountain Community 1 2 3 4 5
1 2 3 4 5 c. Regional authorities 1 2 3 4 5 1 2 3 4 5 d. National authorities 1 2 3 4 5 1 2 3 4 5 e. Civil Protection 1 2 3 4 5
1 2 3 4 5 f. Media (journalist) 1 2 3 4 5
1 2 3 4 5 g. You or your family 1 2 3 4 5
1 2 3 4 5 h. Insurance companies 1 2 3 4 5
34. Do you know the actual legislation about natura l hazards for your community? Not at all A little bit Fairly A lot Completely
1 2 3 4 5
35. How agree are you that the legislation should: use a scale from 1 = Strongly disagree to 5 = Strongly agree
Strongly disagree Disagree 50/50 Agree Strongly
agree a. Force the institutions to inform about the natural risk in
their communities 1 2 3 4 5
b. Force the local institutions to provide an intervention plan in case of an emergency
1 2 3 4 5
c. Be more restrictive about urbanization and land development in zones classified as high risk
1 2 3 4 5
d. Be more severe with whoever carry out activities that increase the natural risk
1 2 3 4 5
36. How much do you trust on the information about natural hazards provided by: use a scale from 1 = Not at all to 5 = Completely
Not at all A little Moderately A lot Completely a. Local authorities 1 2 3 4 5 b. Mountain Community 1 2 3 4 5 c. Regional authorities 1 2 3 4 5 d. National authorities 1 2 3 4 5 e. Civil Protection 1 2 3 4 5 f. Media (journalist) 1 2 3 4 5 f. Scientist 1 2 3 4 5 g. Fire Brigade 1 2 3 4 5 h. Insurance companies 1 2 3 4 5
37. Do you know if has ever been any workshop, info rming meetings or discussion about risks related to natural hazards in the municipality/frac tion where you are living?
A. Yes, and you attended B. Yes, but you didn’t attended B1. Because you didn’t have time to go B2. Because you were not interested B3. For another reason, please specify C. No, there hasn’t been any D. Don’t know
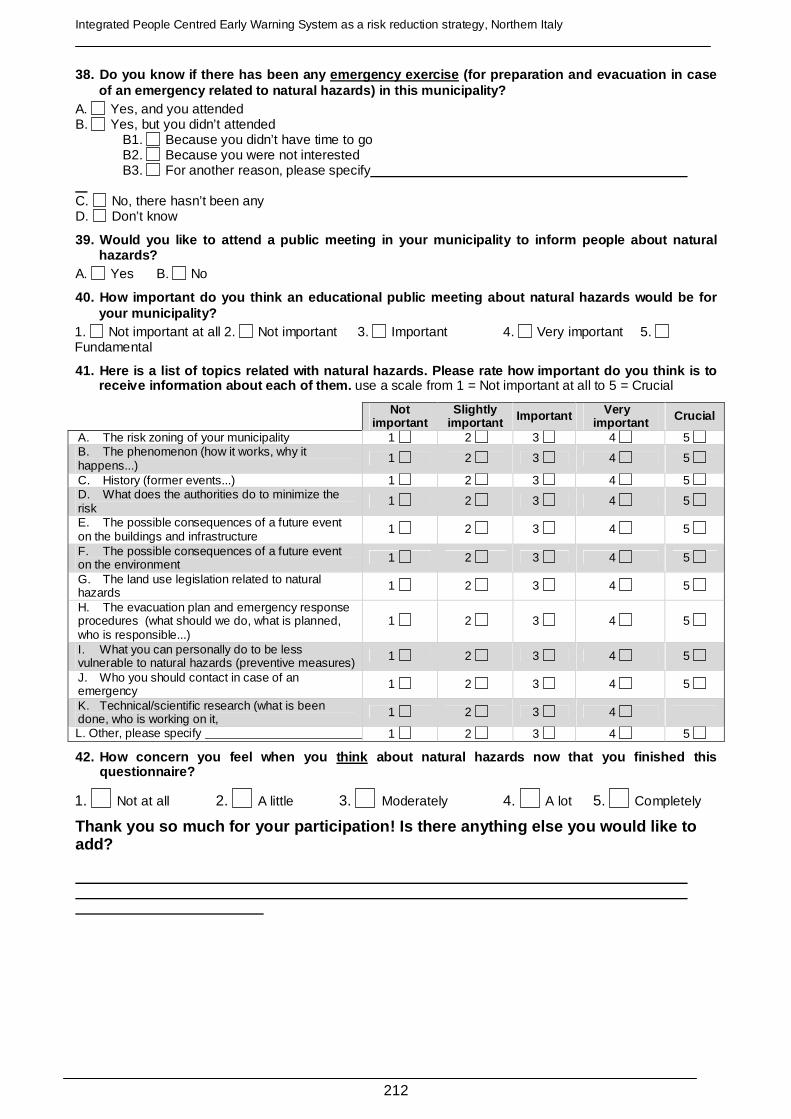
Integrated People Centred Early Warning System as a risk reduction strategy, Northern Italy
212
38. Do you know if there has been any emergency exe rcise (for preparation and evacuation in case of an emergency related to natural hazards) in this municipality?
A. Yes, and you attended B. Yes, but you didn’t attended B1. Because you didn’t have time to go B2. Because you were not interested B3. For another reason, please specify C. No, there hasn’t been any D. Don’t know
39. Would you like to attend a public meeting in yo ur municipality to inform people about natural hazards?
A. Yes B. No
40. How important do you think an educational publi c meeting about natural hazards would be for your municipality?
1. Not important at all 2. Not important 3. Important 4. Very important 5. Fundamental
41. Here is a list of topics related with natural h azards. Please rate how important do you think is t o receive information about each of them. use a scale from 1 = Not important at all to 5 = Crucial
Not important
Slightly important Important Very
important Crucial
A. The risk zoning of your municipality 1 2 3 4 5 B. The phenomenon (how it works, why it happens...)
1 2 3 4 5
C. History (former events...) 1 2 3 4 5 D. What does the authorities do to minimize the risk
1 2 3 4 5
E. The possible consequences of a future event on the buildings and infrastructure
1 2 3 4 5
F. The possible consequences of a future event on the environment
1 2 3 4 5
G. The land use legislation related to natural hazards
1 2 3 4 5
H. The evacuation plan and emergency response procedures (what should we do, what is planned, who is responsible...)
1 2 3 4 5
I. What you can personally do to be less vulnerable to natural hazards (preventive measures)
1 2 3 4 5
J. Who you should contact in case of an emergency
1 2 3 4 5
K. Technical/scientific research (what is been done, who is working on it,
1 2 3 4
L. Other, please specify 1 2 3 4 5
42. How concern you feel when you think about natural hazards now that you finished this questionnaire?
1. Not at all 2. A little 3. Moderately 4. A lot 5. Completely
Thank you so much for your participation! Is there anything else you would like to add?

Annexes
213
A1c. Questionnaire for practitioners stakeholders ( Italian) Informazioni Generali per la compilazione del quest ionario
Buongiorno, permetteteci di presentarci:
Siamo una rete europea di ricerca denominata “Mountain Risks”. Uno dei nostri obbiettivi consiste nello sviluppo di un efficace programma di gestione dei rischi che considera le reali situazioni e necessità della comunità e delle istituzioni che lavorano nel campo della gestione dei rischi al fine di contribuire a migliorare la preparazione e la sicurezza della popolazione nei confronti di eventi naturali pericolosi.
Per conseguire questo risultato è nostra convinzione che sia fondamentale impostare un lavoro interdisciplinare che coinvolga tutte quelle persone il cui lavoro ha a che fare direttamente o indirettamente con i rischi naturali. Per questa ragione vorremmo farle alcune domande poiché LA SUA OPINIONE È FONDAMENTALE. Apprezzeremo molto se le risposte che Lei ci fornirà rispecchino fedelmente il suo punto di vista personale e la sua propria esperienza. Tutte le risposte saranno COMPLETAMENTE CONFIDENZIALI.
Per favore compili il questionario nel modo più completo e sincero possibile e lo riporti nel luogo dove Le è stato consegnato o lo invii via Fax al numero: 0264482895.
Scriva con chiarezza e, dove necessario, ponga una X sulla casella prescelta. Utilizzi una pena di qualsiasi colore eccetto nero. Questo questionario coinvolge diversi campi, quindi se pensa che non possiede elementi sufficienti per rispondere ad alcune domande le lasci in bianco.
La ringraziamo anticipatamente per la partecipazione, sappiamo che il suo tempo è prezioso e per questo motivo apprezziamo profondamente il suo aiuto.
Per ulteriori chiarimenti contattare Carolina Garcia o Simone Sterlacchini dell'Università degli Studio di Milano - Bicocca (Tel: 0264482854).
Definizioni Basilari Per processi naturali pericolosi si intendono i fenomeni naturali che possono verificarsi in un territorio con conseguenze negative sull’ambiente o sulla comunità che vi risiede. Esempi sono alluvioni, frane, terremoti, incendi, valanghe, ecc.
Per movimenti di massa si intendono movimenti di materiale di origine naturale (roccia, terreno, neve, ghiaccio) lungo i pendii. Essi comprendono frane, crolli di roccia, valanghe, colate di detrito, ecc.
Comune di residenza PROV. CAP Data Ente per cui lavora (o per il quale è volontario) PROV. CAP Ufficio Da quanto tempo lavora nell’Ente? anni Da quanto tempo ricopre la posizione attuale? Anni
Sesso : M F Età anni
1. Qual è il suo ruolo principale nel campo del ris chio legato a processi naturali pericolosi? A. Decisore(Decision-maker) B. Volontario per la situazione di emergenza (PC, Vigili del Fuoco,ecc.) C. Consulente D. Ricercatore, specifichi il tema E. Tecnico F. Non lavora nel campo dei rischi naturali G. Volontario gruppo ambientalista (Legambiente, ecc.) H. Altro, specifichi
2. In che ambito territoriale opera? A. Internazionale, specifichi B. Nazionale, specifichi C. Regionale, specifichi D. Provinciale, specifichi E. Comunità Montana, specifichi F. Comune, specifichi G. Altro, specifichi
3. Lei o la sua famiglia avete mai avuto esperienza diretta di un evento naturale pericoloso? A. Si B. No se Si, descriva brevemente che cosa, quando, dove avvenne e se ci furono vittime, feriti o danni
4. Si sono mai verificati eventi naturali pericolos i che hanno causato danni (a persone, edifici, stra de, ecc.) sul territorio di cui si occupa per lavoro? A. Sì, e ho lavorato su uno o più di essi B. Sì, ma non ho mai lavorato su nessuno di essi C. No, non se ne sono mai verificati D. Non ne sono a conoscenza se Si, descriva brevemente che cosa, quando, dove avvenne e se ci furono vittime, feriti o danni
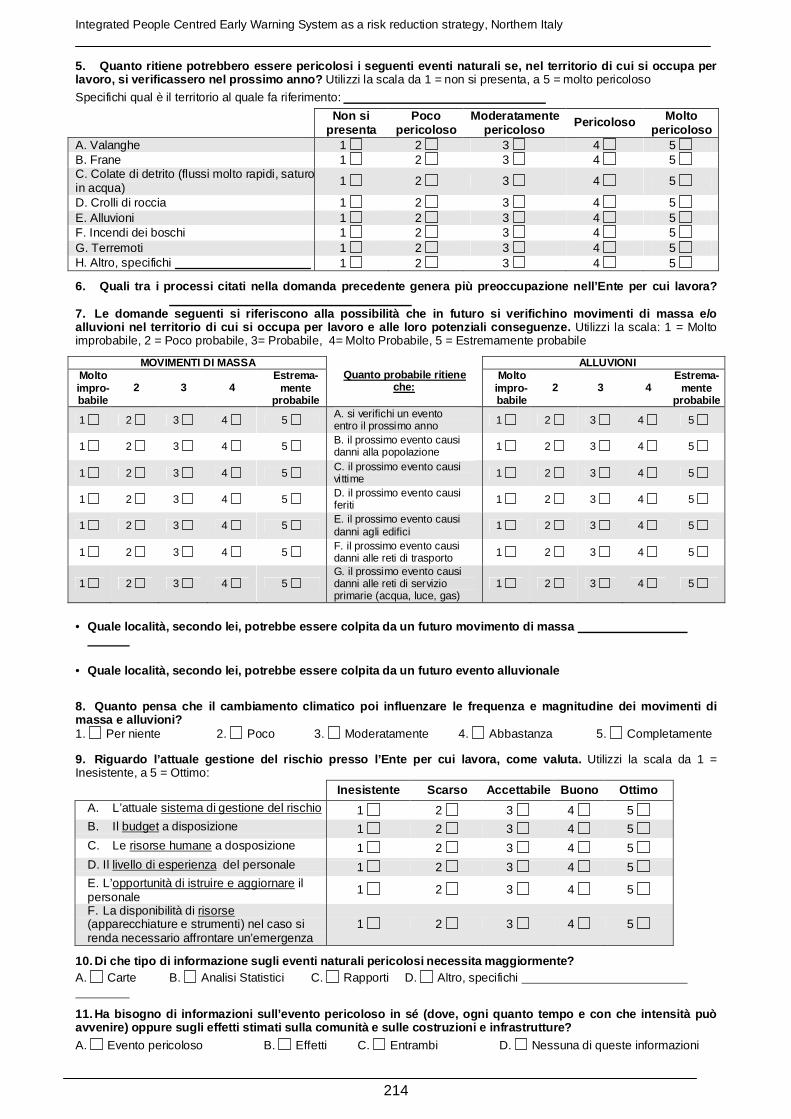
Integrated People Centred Early Warning System as a risk reduction strategy, Northern Italy
214
5. Quanto ritiene potrebbero essere pericolosi i se guenti eventi naturali se, nel territorio di cui si occupa per lavoro, si verificassero nel prossimo anno? Utilizzi la scala da 1 = non si presenta, a 5 = molto pericoloso Specifichi qual è il territorio al quale fa riferimento:
Non si presenta
Poco pericoloso
Moderatamente pericoloso
Pericoloso Molto pericoloso
A. Valanghe 1 2 3 4 5 B. Frane 1 2 3 4 5 C. Colate di detrito (flussi molto rapidi, saturo in acqua)
1 2 3 4 5
D. Crolli di roccia 1 2 3 4 5 E. Alluvioni 1 2 3 4 5 F. Incendi dei boschi 1 2 3 4 5 G. Terremoti 1 2 3 4 5 H. Altro, specifichi 1 2 3 4 5
6. Quali tra i processi citati nella domanda preced ente genera più preoccupazione nell’Ente per cui la vora? 7. Le domande seguenti si riferiscono alla possibil ità che in futuro si verifichino movimenti di massa e/o alluvioni nel territorio di cui si occupa per lavor o e alle loro potenziali conseguenze. Utilizzi la scala: 1 = Molto improbabile, 2 = Poco probabile, 3= Probabile, 4= Molto Probabile, 5 = Estremamente probabile
MOVIMENTI DI MASSA ALLUVIONI Molto impro- babile
2 3 4 Estrema-
mente probabile
Quanto probabile ritiene che:
Molto impro- babile
2 3 4 Estrema-
mente probabile
1 2 3 4 5 A. si verifichi un evento entro il prossimo anno 1 2 3 4 5
1 2 3 4 5 B. il prossimo evento causi danni alla popolazione 1 2 3 4 5
1 2 3 4 5 C. il prossimo evento causi vittime 1 2 3 4 5
1 2 3 4 5 D. il prossimo evento causi feriti 1 2 3 4 5
1 2 3 4 5 E. il prossimo evento causi danni agli edifici
1 2 3 4 5
1 2 3 4 5 F. il prossimo evento causi danni alle reti di trasporto 1 2 3 4 5
1 2 3 4 5 G. il prossimo evento causi danni alle reti di servizio primarie (acqua, luce, gas)
1 2 3 4 5
• Quale località, secondo lei, potrebbe essere colpit a da un futuro movimento di massa
• Quale località, secondo lei, potrebbe essere colpit a da un futuro evento alluvionale
8. Quanto pensa che il cambiamento climatico poi in fluenzare le frequenza e magnitudine dei movimenti di massa e alluvioni? 1. Per niente 2. Poco 3. Moderatamente 4. Abbastanza 5. Completamente
9. Riguardo l’attuale gestione del rischio presso l ’Ente per cui lavora, come valuta. Utilizzi la scala da 1 = Inesistente, a 5 = Ottimo: Inesistente Scarso Accettabile Buono Ottimo
A. L’attuale sistema di gestione del rischio 1 2 3 4 5 B. Il budget a disposizione 1 2 3 4 5 C. Le risorse humane a dosposizione 1 2 3 4 5 D. Il livello di esperienza del personale 1 2 3 4 5 E. L’opportunità di istruire e aggiornare il personale
1 2 3 4 5
F. La disponibilità di risorse (apparecchiature e strumenti) nel caso si renda necessario affrontare un’emergenza
1 2 3 4 5
10. Di che tipo di informazione sugli eventi natura li pericolosi necessita maggiormente? A. Carte B. Analisi Statistici C. Rapporti D. Altro, specifichi
11. Ha bisogno di informazioni sull’evento pericolo so in sé (dove, ogni quanto tempo e con che intensi tà può avvenire) oppure sugli effetti stimati sulla comuni tà e sulle costruzioni e infrastrutture? A. Evento pericoloso B. Effetti C. Entrambi D. Nessuna di queste informazioni

Annexes
215
12. Ha bisogno di sapere se l’impatto degli effetti dell’evento pericoloso sarà elevato, medio o basso (livelli; informazioni qualitative), o ha bisogno di dati rif eriti all'intensità dell’evento o alla stima delle perdite (numeri; informazioni quantitative)? A. Livelli B. Numeri C. Entrambi D. Altro, specifichi
13. Ha bisogno di informazione aggiuntive sulla vul nerabilità ( suscettibilità di comunità, edifici e infrastruttur e all’impatto di eventi naturali pericolosi )? A. Si B. NoC. Altro, specifichi
14. Se ha bisogno o vorrebbe disporre di altri dati riguardo a eventi naturali pericolosi, specifichi e descriva brevemente le sue precise necessità
15. Lei è coinvolto nelle attività relazionate al p rocesso decisionale riguardo a eventi naturali peri colosi? A. Si B. No , se Si, descriva brevemente il suo ruolo nel processo decisionale
16. Chi altro secondo lei pensi dovrebbe essere coi nvolto nel processo decisionale?
17. L’Ente per cui lavora tiene in considerazione l ’opinione della popolazione presente sul territorio nel processo decisionale riguardo a eventi naturali pericolosi?
A. Si B. No C. Non lo so
18. Come valuterebbe la conoscenza del rischio in riferimento a movimenti di massa e/o alluvioni da parte dei differenti soggetti coinvolti? (utilizzi la scala: 1= Inesistente; 2 = Scarsa; 3 = Accettabile; 4= Buona; 5 = Ottima)
MOVIMENTI DI MASSA ALLUVIONI
Inesistente 2 3 4 Ottima
Inesistente 2 3 4 Ottima
1 2 3 4 5 A. Le autorità locali (Comune)
1 2 3 4 5
1 2 3 4 5 B. La Comunità Montana 1 2 3 4 5
1 2 3 4 5 C. Le autorità provinciali (Provincia)
1 2 3 4 5
1 2 3 4 5 D. Le autorità regionali (Regione) 1 2 3 4 5
1 2 3 4 5 E. Le autorità nazionali 1 2 3 4 5
1 2 3 4 5 F. La Protezione Civile 1 2 3 4 5
1 2 3 4 5 G. L’Ente per cui lavora 1 2 3 4 5
1 2 3 4 5 H. Lei stesso 1 2 3 4 5
1 2 3 4 5 I. La popolazione 1 2 3 4 5
1 2 3 4 5 J. I mass media 1 2 3 4 5
1 2 3 4 5 K. Le compagnie assicurative 1 2 3 4 5
19. Secondo lei, quanto sono importanti i seguenti aspetti ai fini della riduzione dei ris chi naturali (utilizzi la scala da 1= Non importante a 5 = Cruciale):
Non importante
Poco importante Importante Molto
importante Essenziale/
cruciale
A. Budget per la gestione del rischio presso il suo ente 1 2 3 4 5 B. Personale che lavora nell’analisi e la gestione del rischio presso l’Ente in cui lavora
1 2 3 4 5
C. Una legislazione chiara e adeguata 1 2 3 4 5
D. Cooperazione tra i diversi enti 1 2 3 4 5
E. Dialogo e interazioni con la comunità scientifica 1 2 3 4 5
F. Istruzione e aggiornamento del personale presso l’Ente in cui lavora
1 2 3 4 5
G. Interazione costante con la comunità 1 2 3 4 5 H. Preparazione della comunità nell’affrontare un possibile evento
1 2 3 4 5
I. I prodotti della comunità scientifica in materia di analisi e gestione del rischio
1 2 3 4 5
J. Risorse (apparecchiature e strumenti), specifichi di che tipo
1 2 3 4 5
K. Altro, specifichi 1 2 3 4 5

Integrated People Centred Early Warning System as a risk reduction strategy, Northern Italy
216
20. In riferimento alla popolazione esposta al risc hio del territorio di cui si occupa per lavoro, com e valuta il livello di (utilizzi la scala da 1= Inesistente a 5 =Ottimo):
Inesistente Scarso Accettabile Buono Ottimo A. Partecipazione al processo decisionale 1 2 3 4 5
B. Richiesta di informazioni 1 2 3 4 5 C. Interesse sui suoi risultati concernenti la gestione e la riduzione del rischio
1 2 3 4 5
D. Consapevolezza del rischio (comprensione della loro situazione corrente per quanto riguarda i rischi naturali)
1 2 3 4 5
E. Conoscenza riguardo il processo decisionale 1 2 3 4 5
G. Preparazione per un'emergenza futura 1 2 3 4 5
21. In riferimento alla comunità scientifica, come valuta il livello di (utilizzi la scala da 1= Inesistente a 5 = Ottimo):
Inesistente Scarso Accettabile Buona Ottimo A. Partecipazione al processo decisionale 1 2 3 4 5 B. Cooperazione con il suo Ente 1 2 3 4 5 C. Qualità dei prodotti scientifici 1 2 3 4 5 D. Fornitura di informazioni 1 2 3 4 5
22. Quanto ritiene siano preparate i seguenti soggetti riguardo a un futuro movimento di massa o alluvione nel territorio di cui si occupa per lavoro? (utilizzi la scala: 1= Non preparata; 2 = Poco preparata; 3= Moderatamente preparata; 4= Ben preparata; 5 = Completamente preparata):
MOVIMENTI DI MASSA ALLUVIONI
Non preparato 2 3 4
Completa- mente
preparato
Non
preparato 2 3 4 Completa-
mente preparato
1 2 3 4 5 A. Le autorità locali (Comune)
1 2 3 4 5
1 2 3 4 5 B. La Comunità Montana
1 2 3 4 5
1 2 3 4 5 C. Le autorità provinciali
1 2 3 4 5
1 2 3 4 5 D. Le autorità regionali 1 2 3 4 5
1 2 3 4 5 E. Le autorità nazionali 1 2 3 4 5
1 2 3 4 5 F. La Protezione Civile 1 2 3 4 5
1 2 3 4 5 G. L’Ente per cui lavora 1 2 3 4 5
1 2 3 4 5 J. Lei stesso 1 2 3 4 5
1 2 3 4 5 K. La popolazione 1 2 3 4 5
1 2 3 4 5 L. I mass media 1 2 3 4 5
1 2 3 4 5 M. Le compagnie assicurative
1 2 3 4 5
23. In riferimento alla posizione che occupa, lei h a responsabilità legali in materia di processi naturali potenzialmente pericolosi?
A. Si B. No , se Si, descriva brevemente
24. Quanto ritiene siano efficaci i seguenti strume nti nel territorio di cui si occupa per lavoro (utilizzi la scala da 1= Inesistente a 5 =Ottima)?
Inesistente Scarso Accettabile Buono Ottimo A. Strumento di pianificazione Comunale 1 2 3 4 5 B. Strumento di pianificazione a livello di Comunità Montana
1 2 3 4 5
C. Strumento di pianificazione Provinciale 1 2 3 4 5 D. Strumento di pianificazione Regionale 1 2 3 4 5 E. La legislazione in materia di gestione del rischio a livello Provinciale
1 2 3 4 5
F. La legislazione in materia di gestione del rischio a livello Regionale
1 2 3 4 5
G. La legislazione in materia di gestione del rischio a livello Nazionale
1 2 3 4 5
25. In aree in cui risultano costruzioni che non ri spettano la normativa territoriale vigente , nel caso sussistano condizioni di elevato rischio, devono essere intrap rese azioni particolari per ridurre la pericolosità dell’evento e la vulnerabilità degli elementi a ris chio?
A. Si B. No , se Si, quali azioni

Annexes
217
26. Quale ritiene essere la relazione tra un’approp riata pianificazione territoriale e la vulnerabilit à da rischi naturali (possibili conseguenze avverse) ?
A. La pianificazione del territorio diminuisce la vulnerabilità B. La pianificazione del territorio aumenta la vulnerabilità C. Non ha alcuna influenza H. Altro, specifichi
27. Come valuta nel loro insieme le attuali misure di mitigazione del rischio (impianti – dighe, muri di sostegno, opere di drenaggio, ecc. – per diminuire gli impatt i negativi degli eventi) nel territorio di cui si occupa per lavoro?
Inesistenti Scarse Accettabili Buone Ottime A. Per movimenti di massa 1 2 3 4 5 B. Per alluvioni 1 2 3 4 5
28. La mitigazione del rischio è considerata nella pianificazione territoriale nel territorio di cui s i occupa per lavoro?
A. Si B. No C. Non lo so
29. Il suo Ente è stato coinvolto in progetti di mi tigazione dei rischi naturali? A. Si B. No , se Si, specifichi in che modo e quando
30. Cosa consiglierebbe per migliorare le attuali s trategie di mitigazione dei rischi naturali nel ter ritorio di cui si occupa per lavoro?
31. Come valuta nel loro insieme l’attuale sistema di monitoraggio del rischio nel territorio di cui s i occupa per lavoro?
Inesistente Scarso Accettabile Buono Ottimo A. Per movimenti di massa 1 2 3 4 5 B. Per alluvioni 1 2 3 4 5
32. Esiste un sistema di allarme precoce ( un sistema per allertare la popolazione prima che l’evento si verifichi basato su un qualche indicatore ) per il rischio naturale nel territorio di cui si occupa per lavoro?
A. Si B. No C. Non lo so
33. Secondo lei qual è il miglior mezzo per trasmet tere un allarme per movimenti di massa e/o alluvion i alla popolazione?
A. Radio B. Segnale acustico (sirena, altoparlante) C. Televisione D. Internet E SMS sul telefonino F. Una persona che dà l'avvertimento “porta a porta” G. Chiamata su telefono fisso H. Altro, specifichi
34. È a conoscenza del piano d'emergenza per i peri coli naturali del territorio di cui si occupa per l avoro? A. Si B. No C. Non esiste alcun piano d’emergenza
35. L’Ente per cui lavora ha un ruolo specifico nel caso di un’emergenza dov uta a movimenti di massa o alluvioni?
A. Si B. No C. Non lo so, se Si, lo descriva
36. Lei ha un ruolo specifico nel caso di un’emergenza dov uta a movimenti di massa o alluvioni? A. Si B. No C. Non lo so, se Si, lo descriva
37. Presso l’Ente per cui lavora, si tengono eserci tazioni interne per il personale riguardanti situazioni di emergenza causate da eventi naturali?
A. Si B. No C. Non lo so, se Si, quanto spesso
38. L’Ente per cui lavora è mai stato coinvolto in esercitazioni riguardanti situazioni di emergenza causate da eventi naturali per la popolazione che risiede nel territorio di cui si occupa per lavoro?
A. Si B. No C. Non lo so, se Si, descriva quando, quanto spesso e per che tipologia di evento
39. Pensa che dovrebbero essere fatte esercitazioni riguardanti il rischio naturale per la popolazione che risiede nel territorio di cui si occupa per lavoro?
A. Si B. No C. Non lo so, se Si, specifichi quanto spesso
40. Ha qualche suggerimento o commento per migliora re l’attuale piano di emergenza e/o il sistema di monitoraggio e allarme nella sua giurisdizione?
41. L’Ente per cui lavora è mai stato coinvolto in una campagna di informazione o educazione sui risch i naturali?
A. Si B. No C. Non lo so, se Si, la descriva
42. Pensa che dovrebbero essere fatte campagne di i nformazione o educazione sui rischi naturali per la popolazione che risiede nel territorio di cui si oc cupa per lavoro?
A. Si B. No, se Si, specifichi quanto spesso
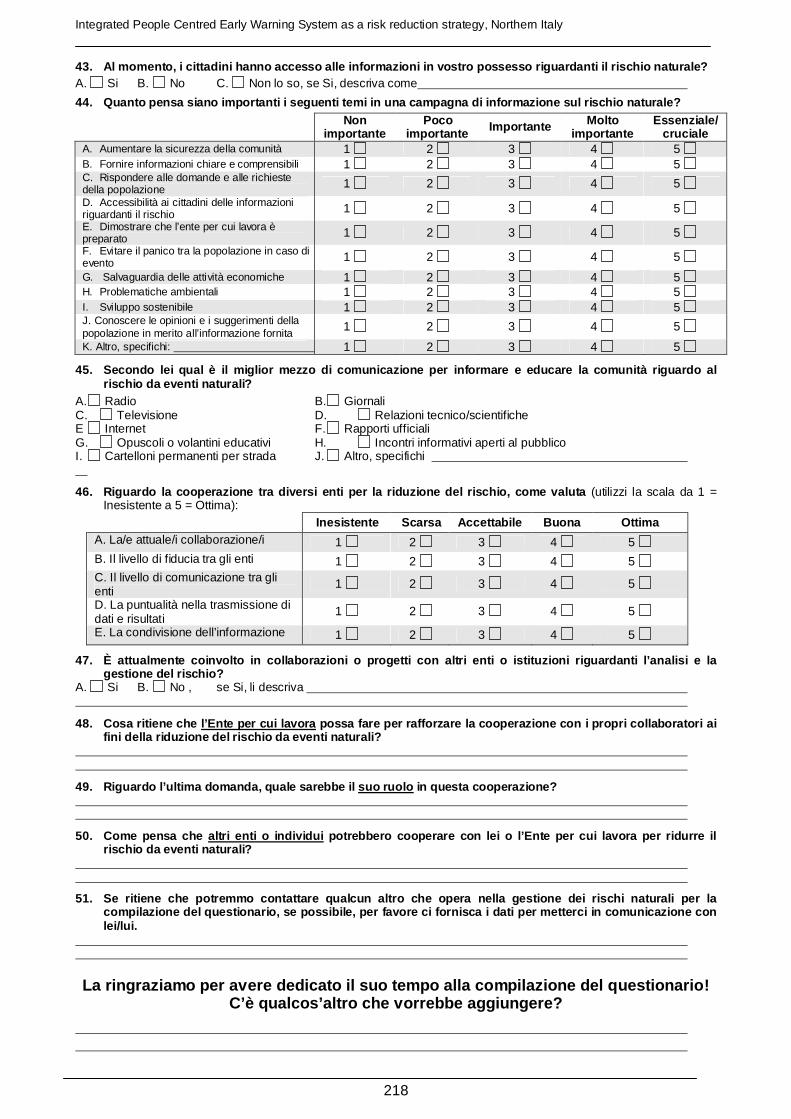
Integrated People Centred Early Warning System as a risk reduction strategy, Northern Italy
218
43. Al momento, i cittadini hanno accesso alle info rmazioni in vostro possesso riguardanti il rischio naturale? A. Si B. No C. Non lo so, se Si, descriva come
44. Quanto pensa siano importanti i seguenti temi i n una campagna di informazione sul rischio naturale ? Non
importante Poco
importante Importante Molto importante
Essenziale/ cruciale
A. Aumentare la sicurezza della comunità 1 2 3 4 5 B. Fornire informazioni chiare e comprensibili 1 2 3 4 5 C. Rispondere alle domande e alle richieste della popolazione 1 2 3 4 5
D. Accessibilità ai cittadini delle informazioni riguardanti il rischio 1 2 3 4 5
E. Dimostrare che l’ente per cui lavora è preparato 1 2 3 4 5
F. Evitare il panico tra la popolazione in caso di evento 1 2 3 4 5
G. Salvaguardia delle attività economiche 1 2 3 4 5 H. Problematiche ambientali 1 2 3 4 5 I. Sviluppo sostenibile 1 2 3 4 5 J. Conoscere le opinioni e i suggerimenti della popolazione in merito all’informazione fornita
1 2 3 4 5
K. Altro, specifichi: 1 2 3 4 5
45. Secondo lei qual è il miglior mezzo di comunica zione per informare e educare la comunità riguardo al rischio da eventi naturali?
A. Radio B. Giornali C. Televisione D. Relazioni tecnico/scientifiche E Internet F. Rapporti ufficiali G. Opuscoli o volantini educativi H. Incontri informativi aperti al pubblico I. Cartelloni permanenti per strada J. Altro, specifichi
46. Riguardo la cooperazione tra diversi enti per l a riduzione del rischio, come valuta (utilizzi la scala da 1 = Inesistente a 5 = Ottima):
Inesistente Scarsa Accettabile Buona Ottima A. La/e attuale/i collaborazione/i 1 2 3 4 5 B. Il livello di fiducia tra gli enti 1 2 3 4 5 C. Il livello di comunicazione tra gli enti
1 2 3 4 5
D. La puntualità nella trasmissione di dati e risultati
1 2 3 4 5
E. La condivisione dell’informazione 1 2 3 4 5
47. È attualmente coinvolto in collaborazioni o pro getti con altri enti o istituzioni riguardanti l’an alisi e la gestione del rischio?
A. Si B. No , se Si, li descriva
48. Cosa ritiene che l’Ente per cui lavora possa fare per rafforzare la cooperazione con i pr opri collaboratori ai fini della riduzione del rischio da eventi naturali ?
49. Riguardo l’ultima domanda, quale sarebbe il suo ruolo in questa cooperazione?
50. Come pensa che altri enti o individui potrebbero cooperare con lei o l’Ente per cui lavo ra per ridurre il rischio da eventi naturali?
51. Se ritiene che potremmo contattare qualcun altr o che opera nella gestione dei rischi naturali per la compilazione del questionario, se possibile, per fa vore ci fornisca i dati per metterci in comunicazio ne con lei/lui.
La ringraziamo per avere dedicato il suo tempo alla compilazione del questionario! C’è qualcos’altro che vorrebbe aggiungere?

Annexes
219
A1d. Questionnaire for practitioners stakeholders ( English) Information for Participants
We are part of an European Marie Curie Research Network called Mountain Risks. One of our objectives it’s develop an effective risk management plan adapted to the real situation and needs of the community and the institutions involved in risk management in order to improve preparation and security of the population towards natural hazards.
To reach this goal, we are convinced that it’s fundamental perform an interdisciplinary work that involves all the people working directly or indirectly in natural hazards. For the previous reason we would like to ask you some questions since YOUR OPINION IS FUNDAMENTAL. We will appreciate that the answers you provide would be from a personal point of view, based on your own experience. Your answers will be COMPLETELY CONFIDENTIAL. To fill the questionnaire in WORD please click the square of the selected option and write on the underlined gray zones and send it via email to [email protected]; [email protected]. If you prefer, you can print it and send it once completed by Fax: 0264482895. This questionnaire includes several fields, therefore if you think you have no elements to respond a question or part of it, please leave it unanswered.
Thank you in advance for your participation, we really appreciate your help. If you have any questions please contact Carolina Garcia or Simone Sterlacchini at the University Milano-Bicocca (Tel: +39-0264482854).
Basic Definitions Natural hazard is a natural phenomenon that can have negative effects on environment or human societies. Such as floods, landslides, earthquakes, fire, snow avalanches, rock fall, etc.
Mass movement down slope movement of earth materials -such as rock, soil, snow, ice- under the influence of gravity. Includes landslides, rock falls, debris flow, etc.
Location of residence Date
Institution Office
Time working in the institution years Time working in the actual position years
1. Please indicate which is your main role regardin g risk related to natural hazards: A. Policy maker B. Emergency volunteer (Civil Protection, Firefighter, ecc.) C. Consultant D. Researcher, specify speciality field E. Technician F. I have no role related to natural risks G. Other, please specify
2. Please indicate the territorial ambit of your wo rk on risks related to natural hazards: A. International, specify B. National, specify C. Regional, specify D. Provincial, specify E. Mountain Community, specify F. Community, specify G. Other, specify
3. Have you or your family ever experienced the eff ects of any natural hazard? A. Yes B. No if Yes, please describe it briefly WHAT, WHEN AND WHERE was it, and if there were any injured or damages
4. Has there been any natural hazard that has cause d damages (on roads, houses, etc) or affect the peo ple in any territory where you focus your work?
Please specify the zone: A. Yes and I have worked on one/several events B. Yes, but I haven’t worked on any event C. No, there hasn’t been any event D. I don’t know if Yes, please describe it briefly WHAT, WHEN AND WHERE was it, and if there were any injured or damages
5. How dangerous do you think the following natural hazards could be in the coming year in the territo ry where you focus your actual work? Use a scale from 1 = Without consequence, to 5 = Very dangerous
Please specify the location: Not present Lightly
dangerous Dangerous Highly Dangerous
Extremely dangerous
A. Snow avalanches 1 2 3 4 5 B. Landslides 1 2 3 4 5 C. Debris flow (fast flow saturated with water) 1 2 3 4 5 D. Rock falls 1 2 3 4 5 E. Floods 1 2 3 4 5 F. Forest Fire 1 2 3 4 5 G. Earthquakes 1 2 3 4 5 H. Other, please specify 1 2 3 4 5

Integrated People Centred Early Warning System as a risk reduction strategy, Northern Italy
220
6. Which of the previous hazards concern to your or ganization the most?
7. The following questions ask about a future mass movements and/or flooding and their consequences in the territory where you focus your actual work. Use the scale: 1 = Not likely, 2= Very unlikely, 3= Likel y, 4= Very likely, 5 = Extremely likely
MASS MOVEMENT FLOODING
Not likely
2 3 4 Extremely likely
How likely do you think: Not
likely 2 3 4 Extremely
likely
1 2 3 4 5 A. there will be a mass movement/flooding on in the next year
1 2 3 4 5
1 2 3 4 5 B. the population will be adversely affected by the next mass movement/flooding
1 2 3 4 5
1 2 3 4 5 C. someone will be injured by the next mass movement/flooding
1 2 3 4 5
1 2 3 4 5 D. someone will die by the next mass movement/flooding
1 2 3 4 5
1 2 3 4 5 E. some buildings will be affected by the next mass movement/flooding
1 2 3 4 5
1 2 3 4 5 F. transport networks will suffer damage by the next mass movement/flooding
1 2 3 4 5
1 2 3 4 5 G. critical lifelines (water, electricity...) will suffer damage
1 2 3 4 5
Please specify the location of the possible future mass movement that most concerns you
Please specify the location of the possible future flooding that most concerns you
8. How do you think climate change influence the fr equency and magnitude of hazards? 1. Not at all 2. A little 3. Moderately 4. A lot 5. Completely
9. In your institution , how would you rate the present situation of? use a scale from 1 = Nonexistent, to 5 = Really good
Nonexistent Poor Acceptable Good Really good
A. The risk management system 1 2 3 4 5 B. The budget (available funds) for risk management
1 2 3 4 5
C. The resources in personnel 1 2 3 4 5 D.The level of expertise of the personnel 1 2 3 4 5 E. The opportunities of training and knowledge updating of personnel at your institution
1 2 3 4 5
F.The availability of equipment necessary to attend an emergency
1 2 3 4 5
10. What type of information on natural hazards do you need the most? A. Maps B. Statistics Analyses C. Reports D. Others, please specify 11. Do you need information about the hazard itself (where, how often and how intensive they will proba bly
occur) or do you need information on the estimated effect s on buildings, infrastructure and humans? A. Hazards B. Effects C. Both D. None
12. Do you need information if the hazard/effects will be high, middle or low (classes; qualitative i nformation), or do you need data on the intensity of the proces s or estimated amount of losses (numbers; quantitat ive information)?
A. Classes B. Numbers C. Both D. Others, please specify
13. Do you need additionally information on the vul nerability ( susceptibility of a community, buildings or infrastructure to the impact of hazard s)?
A. Yes B. No C. Others, please specify
14. If you need further data than the previous item s, please specify and describe shortly your exact n eeds 15. Do you participate in the activities related to decision making process related to natural hazards ? A. Yes B. No , if Yes please describe briefly your role on the process
16. Who do you think should ideally be involved in the decision making related to natural hazards? 17. Does your institution take into account general public’s opinion on the decision making process re lated to
natural hazards? A. Yes B. No C. Don’t know

Annexes
221
18. How would you rate the mass movement and floodi ng risk knowledge of the different entities described in the table bellow? Use the scale: 1 = Not existent, 2= Poor, 3= acceptable, 4= good, 5 = Really good
MASS MOVEMENT FLOODING
Non existent
2 3 4 Really good
Non
existent 2 3 4 Really
good
1 2 3 4 5 A. Local/municipal authorities
1 2 3 4 5
1 2 3 4 5 B. Mountain Community 1 2 3 4 5
1 2 3 4 5 C. Provincial authorities 1 2 3 4 5
1 2 3 4 5 D. Regional authorities 1 2 3 4 5
1 2 3 4 5 E. National authorities 1 2 3 4 5
1 2 3 4 5 F. Civil Protection 1 2 3 4 5
1 2 3 4 5 G. Your institution 1 2 3 4 5
1 2 3 4 5 H. Yourself 1 2 3 4 5
1 2 3 4 5 I. The population 1 2 3 4 5
1 2 3 4 5 J. Media (journalist) 1 2 3 4 5
1 2 3 4 5 K. Insurance companies 1 2 3 4 5
19. In your opinion, how important are the following points in reducing the risk from natural hazard: use a scale from 1 = Not important, to 5 = Crucial
Not important Slightly
important Important Very important Crucial
A. Budget for risk management at your institution 1 2 3 4 5
B. Availability of personnel at your institution 1 2 3 4 5
C. Clear and adequate legislation 1 2 3 4 5
D. Cooperation among institutions 1 2 3 4 5
E. Dialogue and interactions with scientific community 1 2 3 4 5
F. Training and knowledge updating of personnel at your institution
1 2 3 4 5
G. Constant communication with the community 1 2 3 4 5
H. Preparation of the community to affront a possible emergency
1 2 3 4 5
I. The products made by the scientific community related to natural hazards and risks
1 2 3 4 5
J. Equipment to attend an emergency, specify
1 2 3 4 5
K. Other, please specify 1 2 3 4 5
20. Regarding the population or community of the territory where you focus your actual work, how would you rate its: use the scale: 1 = Not existent, 2= Poor, 3= acceptable, 4= good, 5 = Really good
Nonexistent Poor Acceptable Good Really good
A. Participation in the decision making process 1 2 3 4 5 B. Request of Information 1 2 3 4 5 C. Interest on your results concerning risk
management and risk reduction 1 2 3 4 5
D. Risk awareness (understanding of their current risk situation regarding natural hazards)
1 2 3 4 5
E. Knowledge about the decision making process
1 2 3 4 5
F. Preparation for a future emergency 1 2 3 4 5
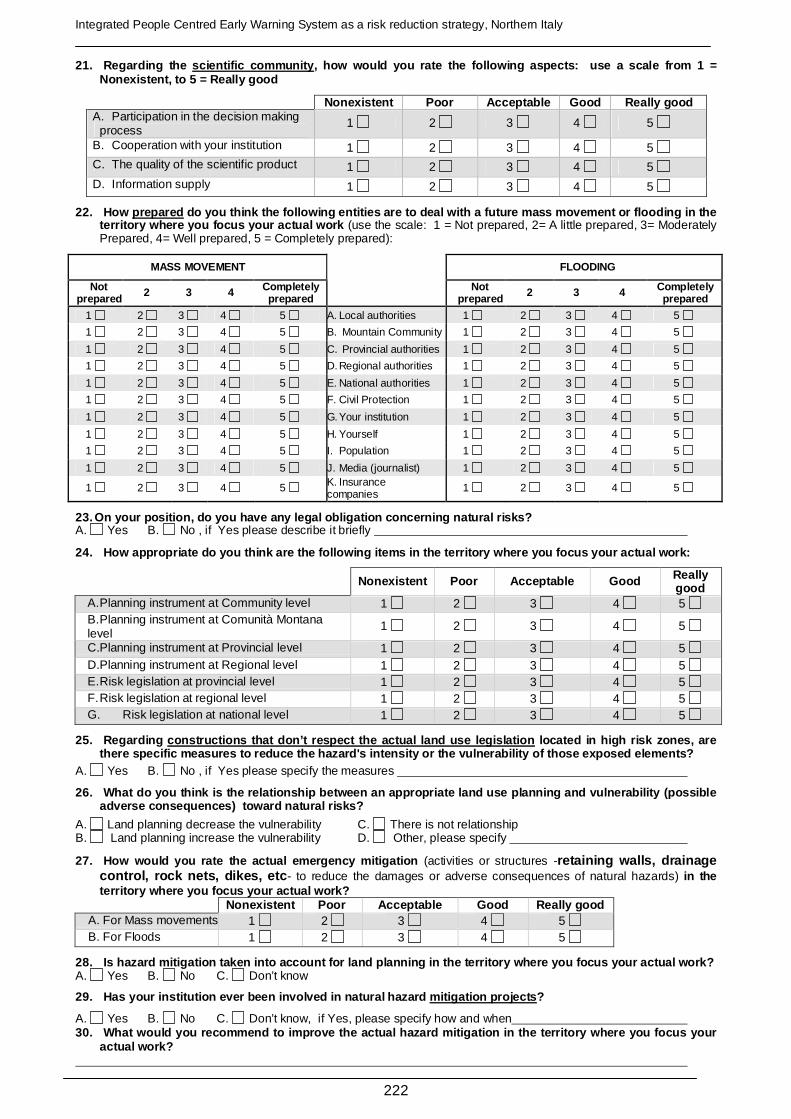
Integrated People Centred Early Warning System as a risk reduction strategy, Northern Italy
222
21. Regarding the scientific community , how would you rate the following aspects: use a scale from 1 = Nonexistent, to 5 = Really good
Nonexistent Poor Acceptable Good Really good A. Participation in the decision making
process 1 2 3 4 5
B. Cooperation with your institution 1 2 3 4 5 C. The quality of the scientific product 1 2 3 4 5 D. Information supply 1 2 3 4 5
22. How prepared do you think the following entities are to deal wi th a future mass movement or flooding in the territory where you focus your actual work (use the scale: 1 = Not prepared, 2= A little prepared, 3= Moderately Prepared, 4= Well prepared, 5 = Completely prepared):
MASS MOVEMENT FLOODING
Not prepared 2 3 4 Completely
prepared
Not
prepared 2 3 4 Completely prepared
1 2 3 4 5 A. Local authorities 1 2 3 4 5
1 2 3 4 5 B. Mountain Community 1 2 3 4 5
1 2 3 4 5 C. Provincial authorities 1 2 3 4 5
1 2 3 4 5 D. Regional authorities 1 2 3 4 5
1 2 3 4 5 E. National authorities 1 2 3 4 5
1 2 3 4 5 F. Civil Protection 1 2 3 4 5
1 2 3 4 5 G. Your institution 1 2 3 4 5
1 2 3 4 5 H. Yourself 1 2 3 4 5
1 2 3 4 5 I. Population 1 2 3 4 5
1 2 3 4 5 J. Media (journalist) 1 2 3 4 5
1 2 3 4 5 K. Insurance companies
1 2 3 4 5
23. On your position, do you have any legal obligat ion concerning natural risks? A. Yes B. No , if Yes please describe it briefly
24. How appropriate do you think are the following items in the territory where you focus your actual work:
Nonexistent Poor Acceptable Good Really good
A. Planning instrument at Community level 1 2 3 4 5 B. Planning instrument at Comunità Montana level
1 2 3 4 5
C.Planning instrument at Provincial level 1 2 3 4 5 D.Planning instrument at Regional level 1 2 3 4 5 E. Risk legislation at provincial level 1 2 3 4 5 F. Risk legislation at regional level 1 2 3 4 5 G. Risk legislation at national level 1 2 3 4 5
25. Regarding constructions that don’t respect the actual land use legislation located in high risk zones, are there specific measures to reduce the hazard's inte nsity or the vulnerability of those exposed element s?
A. Yes B. No , if Yes please specify the measures
26. What do you think is the relationship between a n appropriate land use planning and vulnerability (possible adverse consequences) toward natural risks?
A. Land planning decrease the vulnerability C. There is not relationship B. Land planning increase the vulnerability D. Other, please specify
27. How would you rate the actual emergency mitigat ion (activities or structures -retaining walls, drainage control, rock nets, dikes, etc - to reduce the damages or adverse consequences of natural hazards) in the territory where you focus your actual work?
Nonexistent Poor Acceptable Good Really good A. For Mass movements 1 2 3 4 5 B. For Floods 1 2 3 4 5
28. Is hazard mitigation taken into account for lan d planning in the territory where you focus your ac tual work? A. Yes B. No C. Don’t know
29. Has your institution ever been involved in natu ral hazard mitigation projects ?
A. Yes B. No C. Don’t know, if Yes, please specify how and when 30. What would you recommend to improve the actual hazard mitigation in the territory where you focus your
actual work?
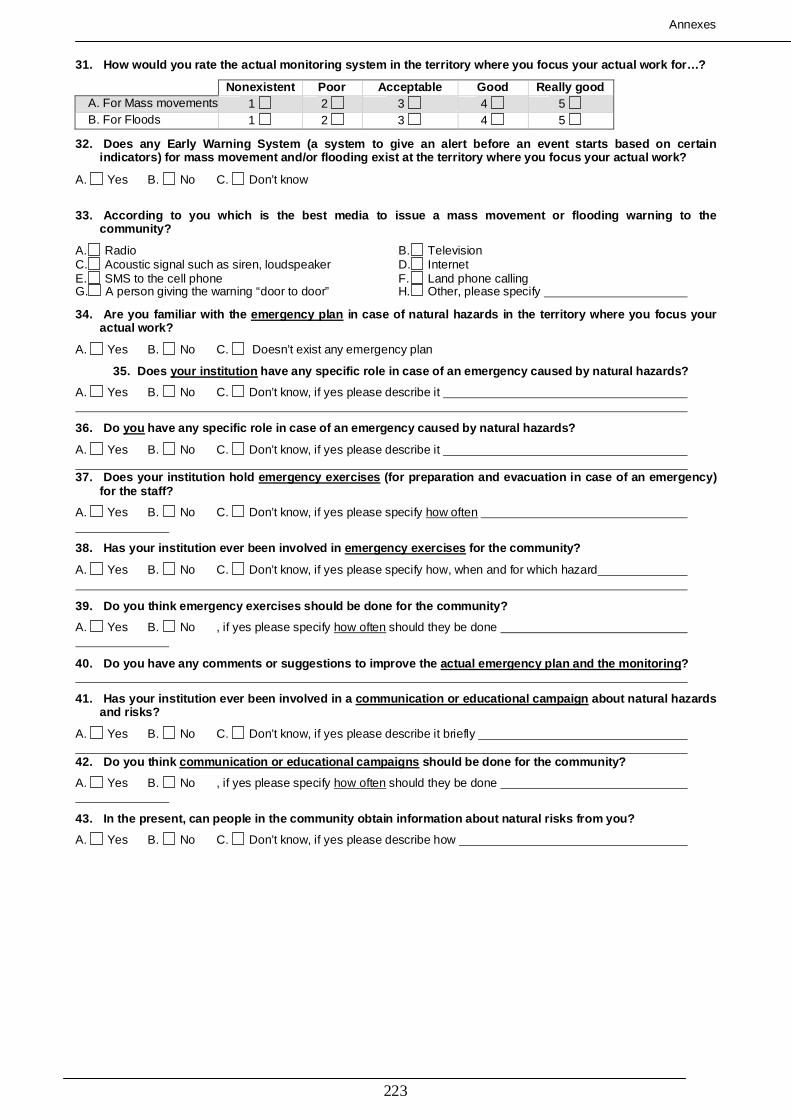
Annexes
223
31. How would you rate the actual monitoring system in the territory where you focus your actual work for…?
Nonexistent Poor Acceptable Good Really good A. For Mass movements 1 2 3 4 5 B. For Floods 1 2 3 4 5
32. Does any Early Warning System ( a system to give an alert before an event starts ba sed on certain indicators ) for mass movement and/or flooding exist at the te rritory where you focus your actual work?
A. Yes B. No C. Don’t know
33. According to you which is the best media to iss ue a mass movement or flooding warning to the community?
A. Radio B. Television C. Acoustic signal such as siren, loudspeaker D. Internet E. SMS to the cell phone F. Land phone calling G. A person giving the warning “door to door” H. Other, please specify
34. Are you familiar with the emergency plan in case of natural hazards in the territory where you focus your actual work?
A. Yes B. No C. Doesn’t exist any emergency plan
35. Does your institution have any specific role in case of an emergency cau sed by natural hazards?
A. Yes B. No C. Don’t know, if yes please describe it
36. Do you have any specific role in case of an emergency cau sed by natural hazards?
A. Yes B. No C. Don’t know, if yes please describe it 37. Does your institution hold emergency exercises (for preparation and evacuation in case of an emerge ncy )
for the staff?
A. Yes B. No C. Don’t know, if yes please specify how often
38. Has your institution ever been involved in emer gency exercises for the community?
A. Yes B. No C. Don’t know, if yes please specify how, when and for which hazard
39. Do you think emergency exercises should be done for the community?
A. Yes B. No , if yes please specify how often should they be done
40. Do you have any comments or suggestions to impr ove the actual emergency plan and the monitoring ?
41. Has your institution ever been involved in a co mmunication or educational campaign about natural hazards and risks?
A. Yes B. No C. Don’t know, if yes please describe it briefly 42. Do you think communication or educational campa igns should be done for the community?
A. Yes B. No , if yes please specify how often should they be done
43. In the present, can people in the community obt ain information about natural risks from you?
A. Yes B. No C. Don’t know, if yes please describe how
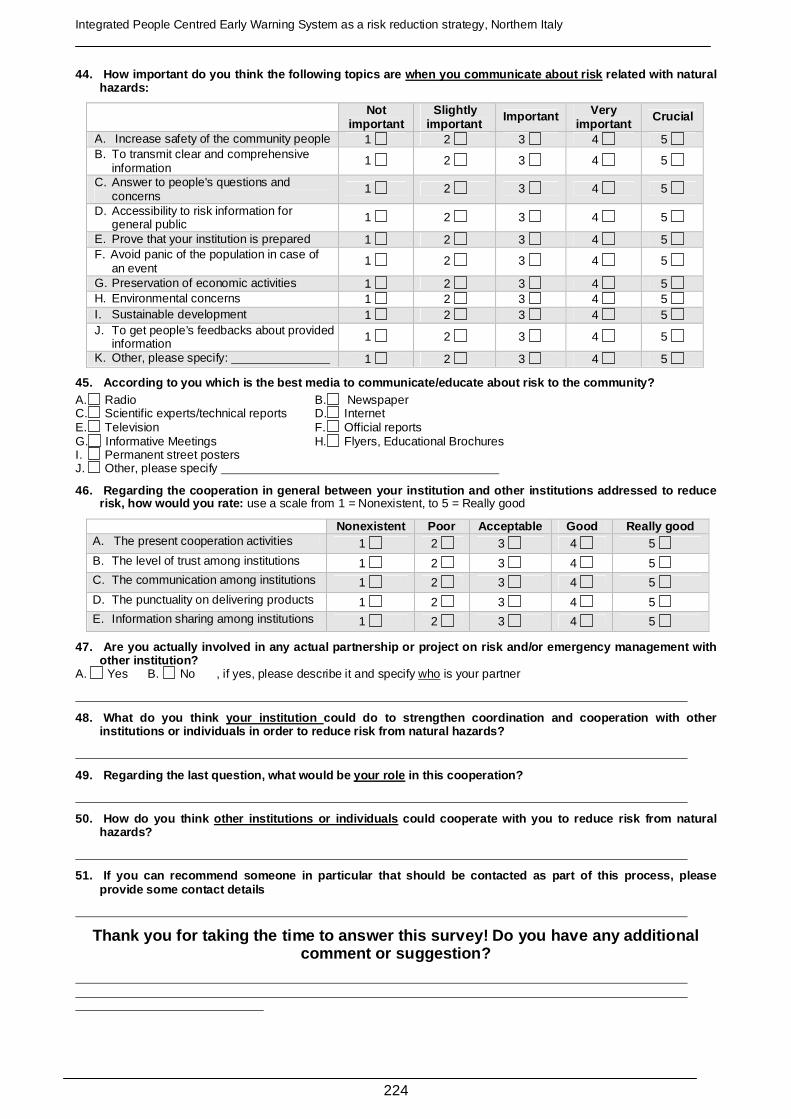
Integrated People Centred Early Warning System as a risk reduction strategy, Northern Italy
224
44. How important do you think the following topics are when you communicate about risk related with natural hazards:
Not important
Slightly important
Important Very important
Crucial
A. Increase safety of the community people 1 2 3 4 5 B. To transmit clear and comprehensive
information 1 2 3 4 5
C. Answer to people's questions and concerns
1 2 3 4 5
D. Accessibility to risk information for general public
1 2 3 4 5
E. Prove that your institution is prepared 1 2 3 4 5 F. Avoid panic of the population in case of
an event 1 2 3 4 5
G. Preservation of economic activities 1 2 3 4 5 H. Environmental concerns 1 2 3 4 5 I. Sustainable development 1 2 3 4 5 J. To get people’s feedbacks about provided
information 1 2 3 4 5
K. Other, please specify: 1 2 3 4 5
45. According to you which is the best media to com municate/educate about risk to the community? A. Radio B. Newspaper C. Scientific experts/technical reports D. Internet E. Television F. Official reports G. Informative Meetings H. Flyers, Educational Brochures I. Permanent street posters J. Other, please specify
46. Regarding the cooperation in general between yo ur institution and other institutions addressed to reduce risk, how would you rate: use a scale from 1 = Nonexistent, to 5 = Really good
Nonexistent Poor Acceptable Good Really good A. The present cooperation activities 1 2 3 4 5 B. The level of trust among institutions 1 2 3 4 5 C. The communication among institutions 1 2 3 4 5 D. The punctuality on delivering products 1 2 3 4 5 E. Information sharing among institutions 1 2 3 4 5
47. Are you actually involved in any actual partner ship or project on risk and/or emergency management with other institution?
A. Yes B. No , if yes, please describe it and specify who is your partner
48. What do you think your institution could do to strengthen coordination and cooperation with other institutions or individuals in order to reduce risk from natural hazards?
49. Regarding the last question, what would be your role in this cooperation?
50. How do you think other institutions or individu als could cooperate with you to reduce risk from natur al hazards?
51. If you can recommend someone in particular that should be contacted as part of this process, pleas e provide some contact details
Thank you for taking the time to answer this survey ! Do you have any additional comment or suggestion?
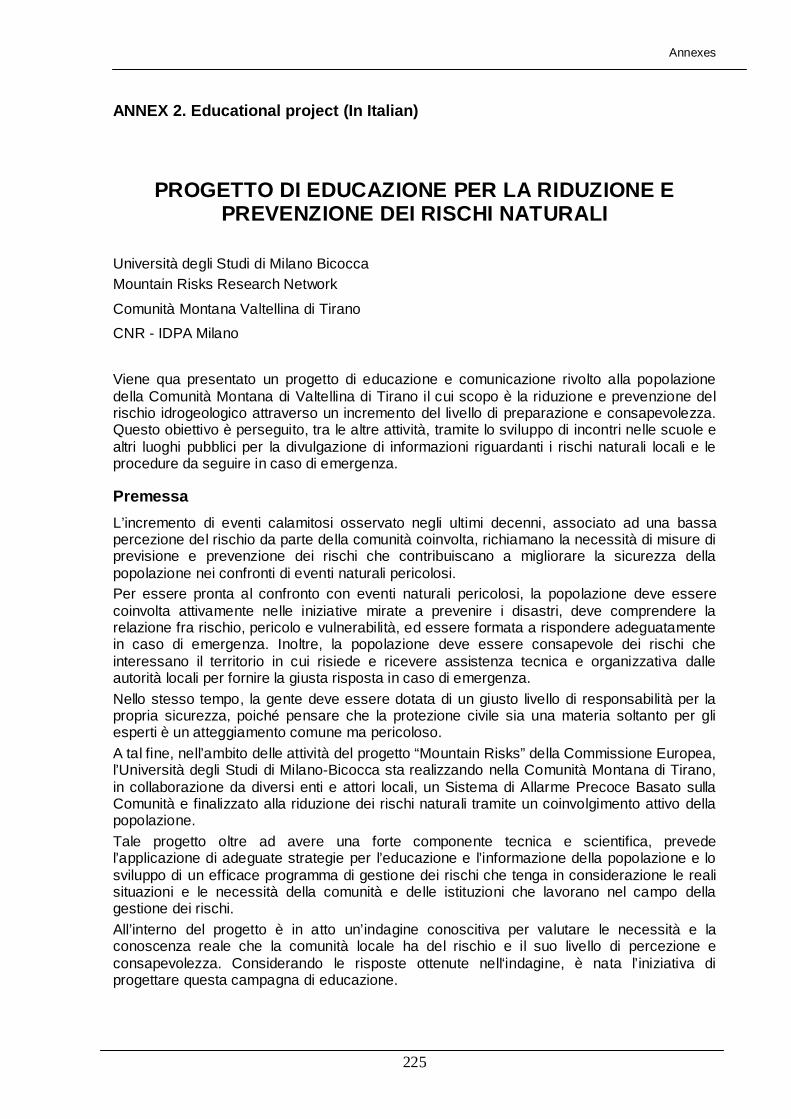
Annexes
225
ANNEX 2. Educational project (In Italian)
PROGETTO DI EDUCAZIONE PER LA RIDUZIONE E PREVENZIONE DEI RISCHI NATURALI
Università degli Studi di Milano Bicocca Mountain Risks Research Network
Comunità Montana Valtellina di Tirano
CNR - IDPA Milano
Viene qua presentato un progetto di educazione e comunicazione rivolto alla popolazione della Comunità Montana di Valtellina di Tirano il cui scopo è la riduzione e prevenzione del rischio idrogeologico attraverso un incremento del livello di preparazione e consapevolezza. Questo obiettivo è perseguito, tra le altre attività, tramite lo sviluppo di incontri nelle scuole e altri luoghi pubblici per la divulgazione di informazioni riguardanti i rischi naturali locali e le procedure da seguire in caso di emergenza.
Premessa
L’incremento di eventi calamitosi osservato negli ultimi decenni, associato ad una bassa percezione del rischio da parte della comunità coinvolta, richiamano la necessità di misure di previsione e prevenzione dei rischi che contribuiscano a migliorare la sicurezza della popolazione nei confronti di eventi naturali pericolosi. Per essere pronta al confronto con eventi naturali pericolosi, la popolazione deve essere coinvolta attivamente nelle iniziative mirate a prevenire i disastri, deve comprendere la relazione fra rischio, pericolo e vulnerabilità, ed essere formata a rispondere adeguatamente in caso di emergenza. Inoltre, la popolazione deve essere consapevole dei rischi che interessano il territorio in cui risiede e ricevere assistenza tecnica e organizzativa dalle autorità locali per fornire la giusta risposta in caso di emergenza. Nello stesso tempo, la gente deve essere dotata di un giusto livello di responsabilità per la propria sicurezza, poiché pensare che la protezione civile sia una materia soltanto per gli esperti è un atteggiamento comune ma pericoloso. A tal fine, nell’ambito delle attività del progetto “Mountain Risks” della Commissione Europea, l’Università degli Studi di Milano-Bicocca sta realizzando nella Comunità Montana di Tirano, in collaborazione da diversi enti e attori locali, un Sistema di Allarme Precoce Basato sulla Comunità e finalizzato alla riduzione dei rischi naturali tramite un coinvolgimento attivo della popolazione. Tale progetto oltre ad avere una forte componente tecnica e scientifica, prevede l’applicazione di adeguate strategie per l’educazione e l’informazione della popolazione e lo sviluppo di un efficace programma di gestione dei rischi che tenga in considerazione le reali situazioni e le necessità della comunità e delle istituzioni che lavorano nel campo della gestione dei rischi. All’interno del progetto è in atto un’indagine conoscitiva per valutare le necessità e la conoscenza reale che la comunità locale ha del rischio e il suo livello di percezione e consapevolezza. Considerando le risposte ottenute nell‘indagine, è nata l’iniziativa di progettare questa campagna di educazione.
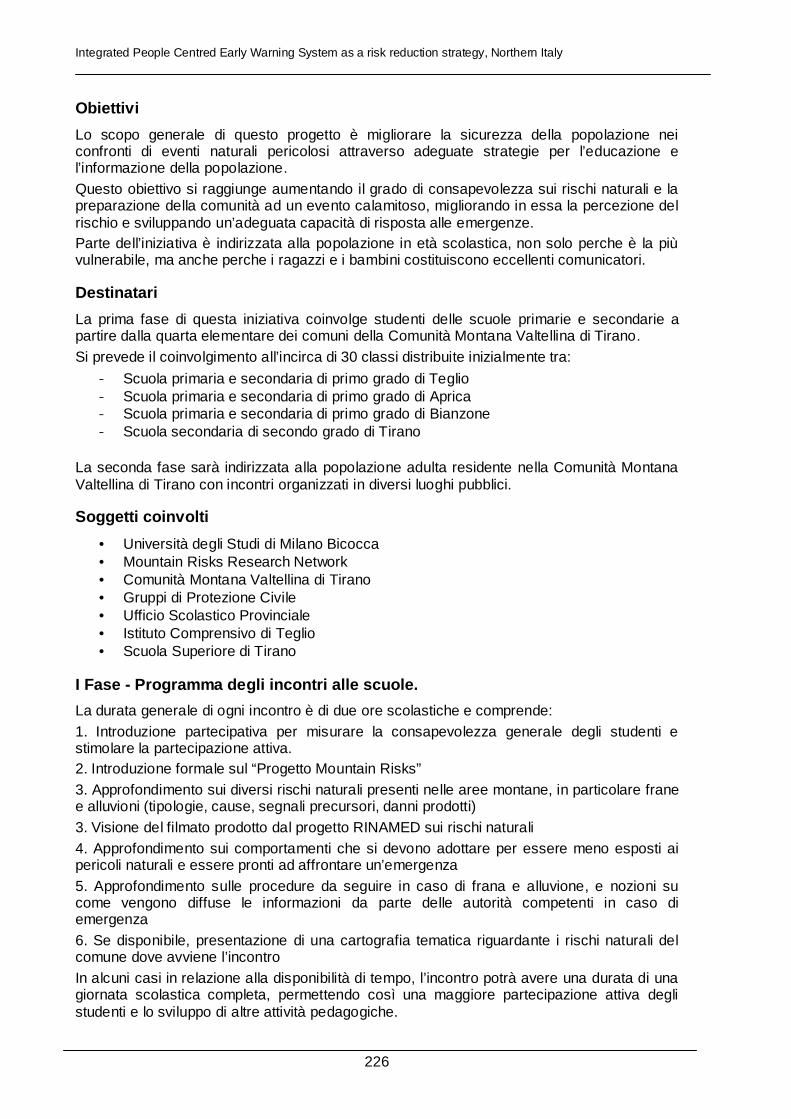
Integrated People Centred Early Warning System as a risk reduction strategy, Northern Italy
226
Obiettivi
Lo scopo generale di questo progetto è migliorare la sicurezza della popolazione nei confronti di eventi naturali pericolosi attraverso adeguate strategie per l’educazione e l’informazione della popolazione. Questo obiettivo si raggiunge aumentando il grado di consapevolezza sui rischi naturali e la preparazione della comunità ad un evento calamitoso, migliorando in essa la percezione del rischio e sviluppando un’adeguata capacità di risposta alle emergenze. Parte dell’iniziativa è indirizzata alla popolazione in età scolastica, non solo perche è la più vulnerabile, ma anche perche i ragazzi e i bambini costituiscono eccellenti comunicatori.
Destinatari
La prima fase di questa iniziativa coinvolge studenti delle scuole primarie e secondarie a partire dalla quarta elementare dei comuni della Comunità Montana Valtellina di Tirano. Si prevede il coinvolgimento all’incirca di 30 classi distribuite inizialmente tra:
- Scuola primaria e secondaria di primo grado di Teglio - Scuola primaria e secondaria di primo grado di Aprica - Scuola primaria e secondaria di primo grado di Bianzone - Scuola secondaria di secondo grado di Tirano
La seconda fase sarà indirizzata alla popolazione adulta residente nella Comunità Montana Valtellina di Tirano con incontri organizzati in diversi luoghi pubblici.
Soggetti coinvolti
• Università degli Studi di Milano Bicocca • Mountain Risks Research Network • Comunità Montana Valtellina di Tirano • Gruppi di Protezione Civile • Ufficio Scolastico Provinciale • Istituto Comprensivo di Teglio • Scuola Superiore di Tirano
I Fase - Programma degli incontri alle scuole.
La durata generale di ogni incontro è di due ore scolastiche e comprende: 1. Introduzione partecipativa per misurare la consapevolezza generale degli studenti e stimolare la partecipazione attiva. 2. Introduzione formale sul “Progetto Mountain Risks” 3. Approfondimento sui diversi rischi naturali presenti nelle aree montane, in particolare frane e alluvioni (tipologie, cause, segnali precursori, danni prodotti) 3. Visione del filmato prodotto dal progetto RINAMED sui rischi naturali 4. Approfondimento sui comportamenti che si devono adottare per essere meno esposti ai pericoli naturali e essere pronti ad affrontare un’emergenza 5. Approfondimento sulle procedure da seguire in caso di frana e alluvione, e nozioni su come vengono diffuse le informazioni da parte delle autorità competenti in caso di emergenza 6. Se disponibile, presentazione di una cartografia tematica riguardante i rischi naturali del comune dove avviene l’incontro In alcuni casi in relazione alla disponibilità di tempo, l’incontro potrà avere una durata di una giornata scolastica completa, permettendo così una maggiore partecipazione attiva degli studenti e lo sviluppo di altre attività pedagogiche.
Annexes
227
II Fase - Programma degli incontri indirizzati alla popolazione adulta.
Il programma intende sviluppare e organizzare, congiuntamente con altri enti operanti nella Comunità Montana Valtellina di Tirano, diversi incontri con la popolazione adulta. In particolare, nel comune di Teglio si intende organizzare un incontro in collaborazione con l’Istituto Comprensivo di Teglio. L’incontro sarà indirizzato a tutta la municipalità, ma particolarmente ai genitori e familiari degli studenti dell’Istituto. Il titolo preliminare è “Riduzione dei rischi naturali: un compito di tutti”. La durata generale dell’incontro sarà di due ore e comprende: - Approfondimento sui diversi rischi naturali presenti nelle aree montane, in particolare frane e alluvioni, ricordando eventi storici che hanno colpito la comunità. - Presentazione della cartografia tematica riguardante i rischi naturali del comune di Teglio sviluppata nell’ambito del progetto Mountain Risks - Approfondimento sui comportamenti che si devono adottare per essere meno esposti ai pericoli naturali e essere pronti ad affrontare un’emergenza. Si farà enfasi sui comportamenti e misure atte a prevenire o a ridurre le conseguenze negative di un movimento di massa o un evento alluvioni che possono essere adottate per ogni cittadino. - Approfondimento sulle procedure da seguire in caso di frana e alluvione, e nozioni su come vengono diffuse le informazioni da parte delle autorità competenti in caso di emergenza Per ulteriori chiarimenti o per maggiori informazioni, contattare: Dott.ssa Carolina Garcia Tel. 0264482854 ; Cel. 366 3213738 Università degli Studi di Milano-Bicocca E-mail: [email protected]

Integrated People Centred Early Warning System as a risk reduction strategy, Northern Italy
228
ANNEX 3. Italian Laws related to Risk Management
Main Laws about Civil Protection in Italy
• L. 225/92 • D.M. 28/05/93 • D.Lgs. 112/98 • L. 265/99 • D.Lgs. 267/2000 • L. 401/2001 • L.R. 16/2004
Main laws about Hydrogeologic Risk
• L. 267/98 • D.P.C.M. 24 maggio 2001 • L.R. 12/2005 • D.G.R. VIII/1566 del 22.12.2005 - Criteri ed per la definizione della componente geologica,
idrogeologica e sismica del Piano di Governo del Territorio
Main laws about Dams
• Circ. Min.LL.PP. 19 aprile 1995, n. us/482 • L.R. 8/98 • D.G.R. VII/3699 del 05.03.2001 • L.R. 26/2003
Main laws about Seismic Risk
• O.P.C.M. n. 3274 del 20 marzo 2003 • D.G.R. VII/14964 del 7 novembre 2003 • O.P.C.M. n. 3519 del 28 aprile 2006
Main laws about Forest Fire Risk
• L. 353/2000 • D.G.R. VII/15534 del 12.12.2003 - Piano Regionale Antincendio Boschivo
Main laws about Industrial Risk
• D.Lgs. 334/99 “Seveso II” • L.R. 19/2001 • D.G.R. 15496 del 05.12.2003 - Direttiva Regionale Grandi Rischi – Linee guida per la gestione di
emergenze chimico-industriali” • D.G.R. VII/19794 del 10 dicembre 2004 • D.P.C.M. 25 febbraio 2005 - Linee guida per la pianificazione dell’emergenza esterna degli
stabilimenti industriali a rischio d’incidente rilevante • D.Lgs. 238/2005 “Seveso III” • Linee guida per l’informazione alla popolazione sul rischio industriale – in attesa di approvazione
Main laws about Warning and intervention procedures
• D.G.R. VII/11670 del 20.12.2002 - Direttiva Temporali - per la prevenzione dei rischi indotti da fenomeni meteorologici estremi sul territorio regionale
• Direttiva del Presidente del Consiglio dei Ministri 27 febbraio 2004 “Indirizzi operativi per la gestione dl sistema di allertamento nazionale e regionale per il rischio idrogeologico ed idraulico ai fini di protezione civile”
• D.G.R. VII/20663 del 11 febbraio 2005 - Modello di riferimento per maxi-emergenze di protezione civile in area aeroportuale - Piano di emergenza subregionale sperimentale d’area Malpensa
• D.G.R. VII/21205 del 24.03.2005 - Direttiva regionale per l’allertamento per rischio idrogeologico ed idraulico e la gestione delle emergenze regionali
Annexes
229
• "Circolare sui prodotti informativi emessi dal Centro Funzionale della Regione Lombardia finalizzati all'allertamento del sistema regionale di protezione civile" – 2005
• Direttiva del Presidente del Consiglio dei Ministri del 6 aprile 2006, G.U. n. 87 del 13 aprile 2006 • Direttiva del Capo del Dipartimento della Protezione Civile del 2 maggio 2006 – Indicazioni per il
coordinamento delle iniziative e delle misure finalizzate a disciplinare gli interventi di soccorso e di assistenza alla popolazione in occasione di incidenti stradali, ferroviari ed aerei in mare, di esplosioni e crolli di strutture e di incidenti con presenza di sostanze pericolose
• Decree del Ministro delle Comunicazioni del 27 aprile 2006 - G.U. n. 191 del 18 agosto 2006 – Istituzione numero unico per le emergenze “112”
Main laws about Emergency Zone
• Direttiva del Presidente del Consiglio dei Ministri – G.U. n. 44 del 23 febbraio 2005 - Linee Guida per l’individuazione delle aree di ricovero per strutture prefabbricate di protezione civile
• Decree del Capo del Dipartimento n. 1243 del 24 marzo 2005 Extended Italian Legislation about Civil Protection
� Law 996, 1970 (G.U. 16 December 1970, n. 317): stablish the creation of the Civil Protection as the entity in chargue of the emergency management. Regulations for the provision of relief and assistance to groups of people affected by disaster.
� Law 64 1974. Anti seismic construction law � Law 10 Agosto 1976, n. 557 (G.U. 14.08.1976 n. 214) � Law 26 Febbraio 1977, n. 45 (G.U. 01.03.1977. 057) � D.P.R. 6 Febbraio 1981, n. 66 (G.U. 16 Marzo 1981, n. 74, s.o.). Decree of the President of
the Italian Republic (D.P.R.) 66/1981. The local responsibilities are given to the prefect and local authorities, promoting the “self-protection” based on the education of the civil protection.
� Law 12 Agosto 1982, n. 547 (G.U. 28/09/2000, n. 227) � Decree Law 12 Novembre 1982, n. 829 (G.U. 15.11.1982 n. 314) � Law 23 dicembre 1982, n. 938 (G.U. 14 Maggio 1983 n. 131) � Law 10 Maggio 1983, n. 180 (G.U. 29.12.1982 n. 356) � DPCM 14 Settembre 1984 � Ministero per il Coordinamento della protezione civile - Ordine di servizio n. 1, 3 Ottobre 1984 � DPCM 16 Ottobre 1984 � DM 25 GIUGNO 1985 (G.U. 18 Luglio 1985, n. 168) � Law 6 Marzo 1987, n. 64 (G.U. 07.03.1987 n. 055) � Circolare n. 1/DPC/87 � DPR 17 Maggio 1988, n. 175 (G.U. 1 Giugno 1988, n. 127) � Law 11 Febbraio 1989, n. 75 (G.U. 04.03.1989 n. 053 suppl.ord) � Ordinanza 3 Marzo 1989, n. 1675 � Ordinanza n. 1675/FPC 30 Marzo 1989 � Ordinanza n. 1676/FPC 30 Marzo 1989 (G.U. n. 81 del 7 Aprile 1989) � Law 18 Maggio 1989, n. 183 (G.U. 25 Maggio 1989, n. 120) � D.P.C.M. 13 febbraio 1990, n. 112. “Regolamento concernente istituzione ed organizzazione
del Dipartimento della Protezione civile nell'ambito della Presidenza del Consiglio dei Ministri” � Law 7 Agosto 1990, n. 241 (G.U. 18 Agosto 1990, n. 192) � Law 11 Agosto 1991, n. 266 (G.U. 22 Agosto 1991, n. 1). Law quadro sul volontariato � DM 14 Febbraio 1992 (G.U. 22 Febbraio 1992, n. 44) � Law 24 Febbraio 1992, n. 225 (G.U. 17 Marzo 1992, n. 64, suppl. ord.). Law 225, 1992.
Institution of National Civil Protection Service (after Valtellina; Augustus Method, 1996). Define the activities of the Civil Protection including for the first time not only the emergency management but also the prevention, forecasting and recovering. This Law defines the Mayor as the mayor authority at municipal level.
� Circolare del 25.02.1992, n. 3 � DM 26 Agosto 1992 Mistero dell' Industria del Commercio e dell'Artigianato � DECREE 16 Novembre 1992 � DPR 16 Dicembre 1992, n. 495, art. 373 (G.U. 18 Agosto 1992, n. 303, s.o.) � DPR 30 Gennaio 1993, n. 51 (G.U. 5 Marzo 1993, n. 53) � DPCM 26 Luglio 1993 (G.U. 21 Agosto 1993, n. 196)

Integrated People Centred Early Warning System as a risk reduction strategy, Northern Italy
230
� Law 10 Novembre 1993, n. 456 (G.U. 16.11.1993 n. 269 ) � Circolare n. 1/DPC/S.G.C./94Circolare n. 2/DPC/S.G.C./94 � Decree del Presidente della Repubblica, 21 Settembre 1994, n. 613. “Regolamento recante
norme concernenti la partecipazione delle associazioni di volontariato nelle attività di protezione civile”
� Decree Ministro Trasporti e Navigazione 15 Aprile 1994 (G.U. 30 Maggio 1994, n. 124, serie generale)
� D.M. 24 Marzo 1994, n. 379 � Ministro del Lavoro e della Previdenza Sociale (G.U. n. 140 del 17 Febbraio 1994) � Circolare 16 Novembre 1994 n. 01768 � U.L. - Presidenza del Consiglio dei Ministri (G.U. n. 276 del 25 Novembre 1994) � Circolare INPS n. 314 del 29 Novembre 1994 � DM 25 Maggio 1995 (G.U. 10 Giugno 1995, n. 134) � DM 7 Luglio 1995Law 8 Agosto 1995, n. 339 (G.U. 17 Agosto 1995, n. 191) � Circolare 22 Agosto 1995 � DGPCSACircolare 13 Dicembre 1995 n. � DSTN/2/22806 (G.U. 7 marzo 1996, n. 56 s.g.) � Law 26 Febbraio 1996, n. 74 (G.U. 27.02.1996 n. 048) � Circolare 12 Giugno 1996 � Law 25 Settembre 1996, n. 496 (G.U. 25.09.1996 n. 225) � Law 4 Marzo 1997, n. 61 � Law 15 Marzo 1997, n. 59(G.U. 17 marzo 1997, n. 63, s.o.) � Law 16 Luglio 1997, N. 228 (G.U. 19.07.1997 n. 167) � Law 31 Luglio 1997, n. 249 � Circolare 5 agosto 1997, n. 3973 � Ministero del Tesoro – DECREE 8 Ottobre 1997 � Provvedimento 28 Nov 1997 (G.U. 29 novembre 1997) � D.Lgs. 4 dicembre 1997, n. 460 (G.U. 2 gennaio 1998, n. 1, s.o.) � Law 27 Dicembre 1997, n.449 art. 17 (G.U. 30 Dicembre 1997, n. 255, s.o.) � Decree ministeriale 10.03.1998 D.Lgs. 31 Marzo 1998 , n. 112 (G.U. 21 aprile 1998, n. 92,
s.o.) � Decree of Law 118/1998. The Civil Protection is subdivided on EELL which represent the
population. The operative structure based on volunteerism is officially implemented. � Legislative Decree 112, 1998 (Bassanini Law No 59). The municipalities acquired the whole
competence of the Civil Protection, the Regions the use of the volunteers and the Province the elaboration of the Emergency Plans.
� DPR 18 Maggio 1998, n. 429 � Circolare n. 124 del 12.05.1998 � Circolare n. 127 del 19.05.1998 � Circolare n. 168 del 20.06.1998 � Law 13 Luglio 1999, n. 226 (G.U. 14.07.1999 n. 163) � D.Lgs. 30 Luglio 1999, n. 300 (G.U. 30 agosto 1999, n. 203, s.o.) � D.Lgs. 17 Agosto 1999, n. 334 (G.U. 28 settembre 1999, n. 228) � D.Lgs. Legislative Decree 18 Agosto 2000, n. 267 (G.U. 28 settembre 2000, n. 227). “Testo
Unico delle leggi sull’ordinamento degli Enti Locali”. � Law 21 novembre 2000, n. 353 (G.U. 30 novembre 2000, n. 280) � Law 11 Dicembre 2000, n. 365 (G.U. 11 dicembre 2000, n. 288) � Ordinanza del 7 Febbraio 2001, n. 3180 � DPR 8 Febbraio 2001, n. 194 (G.U. 25 maggio 2001, n. 120). Decree of the President of the
Italian Republic 194, 2001. “Regolamento recante nuova disciplina della partecipazione delle organizzazioni di volontariato alle attività di Protezione Civile”.
� Law 6 Marzo 2001, n. 64 (G.U. 22 marzo 2001, n. 68) � DM 9 Maggio 2001(G.U. 16 giugno 2001, n. 138) � DPR 17 Maggio 2001, n. 287 (G.U. 17 luglio 2001, n. 164) � Circolare Prot. M/3110 del 18/07/2001 � Decree Law 07 Settembre 2001,n. 343 (G.U. 10 settembre 2001, n. 210) � Law 9 Novembre 2001, n. 401 (G.U. 10 novembre 2001, n. 262). “Conversione in Law, con
modificazioni, del D.L. 7 settembre 2001, n. 343, recante disposizioni urgenti per assicurare il coordinamento operativo delle strutture preposte alle attività di protezione civile”
� D.P.C.M. 12 Dicembre 2001. Decree of the President of the Italian Cabinet 12/12/2001. Organization of Civil Protection Department.
Annexes
231
� DPCM 20 Dicembre 2001(G.U. 26 febbraio 2002, n. 48) � Decree 8 Febbraio 2002 DPCM 2 Marzo 2002 (G.U. 19 marzo 2002, n. 66) � DPCM 12 Aprile 2002 /DPC (G.U. 18 aprile 2002, n. 91) � DPCM 3 maggio 2002 (G.U. 8 maggio 2002, 106) � DPCM 23 Luglio 2002 � DPCM 24 luglio 2002 (G.U. 11 ottobre 2002, n. 239). Decree of the President of the Italian
Cabinet 24/07/2002. Tranfer to the regions of the pertiferic offices of the Dipartment of Technical Services – Hydrographic Service
� Circolare n. 5114 � DPC 30 Settembre 2002 (G.U. 8 ottobre 2002, n. 236). � DPCM 11 ottobre 2002 (G.U. 11 novembre 2002, s.g. n. 264) � DPCM 4 novembre 2002 � Ordinanza del Presidente del Consiglio dei Ministri 27 dicembre 2002 n. 3260 (G.U. del 3
gennaio 2003, n.2) � Ordinanza 21.02.2003, n. 3265 � Provvedimento del Garante per la protezione dei dati personali 12 marzo 2003 � Ordinanza 20 marzo 2003, n. 3274 (G.U. 8 maggio 2003, n. 105) � Ordinanza DPCM 8 marzo 2003 n.3275 (G.U. 29 marzo 2003, n. 74) � Decree 30 giugno 2003 n. 196 (G.U. 29 luglio 2003, n. 174 s.o. n. 123) � Dlgs 1 agosto 2003 n. 259 (G.U. 15 settembre 2003 n. 214 s.o. n. 150) � Decree Ministeriale 18 luglio 2003, n. 266 (G.U. del 19 settembre 2003 n. 218 ) � Comunicato della Presidenza del Consiglio dei Ministri 8 settembre 2003 (G.U. 22 settembre
2003 n. 220) � Law 6 novembre 2003, n. 300 (G.U. 10 novembre 2003 n. 261) � Direttiva del Presidente del Consiglio dei Ministri 27 febbraio 2004 (G.U. 11 marzo 2004-n. 59
del Suppl. Ordinario n.39) � Direttiva del P.C.M. del 27 febbraio 2004. Indirizzi operativi per la gestione organizzativa e
funzionale del sistema di allertamento nazionale e regionale per il rischio idrogeologico ed idraulico ai fini di protezione civile.
� Law 28 maggio 2004, n. 139 (G.U. n. 125 del 29 maggio 2004) � Comunicato della Presidenza del Consiglio Dei Ministri Dipartimento Della Protezione Civile
26 maggio 2004 (G.U. n. 129 del 4-6-2004 ) � Provvedimento del Garante dei dati personali: decisione del 7 luglio 2004 � Direttiva del Presidente del Consiglio dei Ministri 13 giugno 2006.
Extended Lombardian Legislation about Civil Protect ion
� L.R. 14 agosto 1973, n. 34 (B.U. 16 agosto 1973, n. 33) � L.R. 13 luglio 1984, n. 36 (B.U. 16 luglio 1984, n. 28, 2° suppl. ord.) � L.R. 21 giugno 1988, n. 33 (B.U. 24 giugno 1988, n. 25, 1° suppl. ord.) � L.R. 10 maggio 1990, n. 50 (B.U. 15 maggio 1990, n. 20, 1° suppl. ord.) � L.R. 12 maggio 1990, n. 54 (B.U. 17 maggio 1990, n. 20, 2° suppl. ord.) (repealled).
Organizzazione ed interventi di competenza regionale in materia di Protezione Civile � L.R. 24 luglio 1993, n. 22 (B.U. 29 luglio 1993, n. 30, 1° suppl. ord.). Regional Law 24 July
1993, N. 22. Regional law about the volunteerism � L.R. 5 agosto 1996, n. 18 (B.U. 10 agosto 1996, n. 32, 1° suppl. ord.) � L.R. 16 settembre 1996, n. 28 (B.U. 21 settembre 1996, n. 38, 3° suppl. ord.) � DGR 28 febbraio 1997, n. 6/25596 (B.U. 10 marzo 1997, n. 11, serie ord. p. 590). Istituzione
elenco dei gruppi comunali e intercomunali di protezione civile � DGR 6 maggio 1997, n. 6/28255 (B.U. 6 giugno 1997 n. 23, suppl. sr. p.10) � DGR 16 maggio 1997, n. 6/28645 (B.U. 6 giugno 1997 n. 23, suppl. sr. p.10) � L.R. 24 novembre 1997, n. 41 (B.U. 25 novembre 1997, n. 48, 1° suppl. ord.) � DGR 20 marzo 1998, n. 6/35199 � DGR 12 giugno 1998, n. 6/36805 (B.U. 18 settembre 1998, n. 37, 3° suppl. straord.) � DGR 3 luglio 1998, n. /37187 (B.U. n. serie ord.). Adozione stemma "Protezione Civile -
Regione Lombardia" � DGR 2 ottobre 1998 n. 6/38725 (B.U. n. 41 s.s.) � Law 22 gennaio 1999, n. 2. “Misure per la programmazione regionale, la razionalizzazione
della spesa e a favore dello sviluppo regionale e nterventi istituzionali e programmatici con rilievo finanziario”

Integrated People Centred Early Warning System as a risk reduction strategy, Northern Italy
232
� DGR 2 luglio 1999, n. 6/44003 (B.U. 9 agosto 1999, n. 32, serie ord. pg.1588). "Integrazione alla delibera n. 6/25596 del 28 febbraio 1997", "Istituzione elenco gruppi comunali di protezione civile"
� Circolare R. 2 agosto 1999 n. 45 (B.U. 9 agosto 1999, n. 32, serie ord. pg.1589). Lettera circolare di accompagnamento alla delibera 4403 del 2 luglio 1999 "Integrazione alla delibera n. 6/25596 del 28 febbraio 1997, Istituzione elenco gruppi comunali di protezione civile"
� DGR 5 agosto 1999, n. 6/44922 (B.U. n. 34 suppl. ord.). "Contributi agli Enti locali finalizzati alla elaborazione del Piano di emergenza coomunale ed intercomunale. Individuazione dei criteri ed approvazione del bando di concorso per la formazione delle graduatorie"
� L.R. 12 agosto 1999, n. 15 (B.U. 17 agosto 1999, n. 33, 1° suppl. ord.) � L.R. 14 agosto 1999, n. 16 (B.U. 19 agosto 1999 2° suppl. ord.) � DGR 28 ottobre 1999, n. /46001 (B.U. n. 32, serie ord. pg. 1588). "Approvazione della
Direttiva regionale per la pianificazione di emergenza degli Enti Locali in attuazione dell'art. 3 L.R. 54/90 e dell'art. 108, comma 1, lett. a), punto 3 e lett. c), punto 3, del D.lgs. 112/98" (attuazione attività di progetto PRS 5.3.3. "SINERGIE" - WP3)
� Delibera G.R. 26 novembre 1999 n. 46704. "Approvazione della graduatoria relativa al bando di concorso per l'assegnazione di contributi agli Enti locali finalizzati alla elaborazione del Piano di Emergenza Comunale ed Intercomunale ai sensi della d.g.r. n. 44922 del 23 agosto 1999"
� DGR 29 dicembre 1999, n. 47579. “ Linee guida sui criteri per l'individuazione e la costituzione dei Centri Polifunzionali di Emergenza in attuazione dell'art. 21, comma 1,2,3 L.R. 54/90 e successive modifiche”
� L.R. 5 gennaio 2000, n. 1 (B.U. 10 gennaio 2000, n. 2, 1° suppl. ord.) (repealled) � DGR 28 gennaio 2000, n. 47924. “Individuazione delle figure idonee alla funzione di
Coordinatore di Emergenza in caso di calamità. Attuazione L.R. 54/90, art. 29 e successive modifiche ed integrazioni”
� DGR 2 febbraio 2000 n 48726. Affidamento di incarico all'IREF (Istituto Regionale di Formazione) per la realizzazione di seminari formativi sulla Protezione Civile volto ai Sindaci dei comuni della Lombardia
� DDG 29 giugno 2000, n. 16644 � D.G.R. 7 luglio 2000 n. 312. "Approvazione della graduatoria relativa al bando di concorso per
l'assegnazione di contributi agli Enti locali finalizzati alla elaborazione del Piano di Emergenza Comunale ed Intercomunale ai sensi della d.g.r. n. 44922 del 23 agosto 1999"
� DDG 26523 del 27 ottobre 2000. Individuazione dei colori e delle caratteristiche tecniche delle divise e degli automezzi appartenenti alle organizzazioni di volontariato di protezione civile in Regione Lombardia - Modifiche al Decree del Direttore Generale Opere Pubbliche Politiche per la Casa e Protezione Civile n.16644 del 29 giugno 2000
� Decree Direzione Generale 27 febbraio 2001 n. 4369. "Approvazione delle procedure per la dichiarazione dello stato di crisi regionale e atti connessi alle emergenze di protezione civile di livello regionale" in attuazione della Law regionale 5 gennaio 2000, n.1 "Riordino del sistema delle autonomie locali in Lombardia"
� Law regionale 3 aprile 2001, n. 6. Modifiche alla legislazione per l'attuazione degli indirizzi contenuti nel documento di programmazione economico-finanziaria regionale. Collegato ordinamentale 2001
� DGR 4 maggio 2001 n. 4494. Individuazione dei criteri per l'assegnazione di contributi alle Associazioni di Volontariato di Protezione civile della Lombardia e approvazione del bando di concorso per la formazione della graduatoria
� L.R. 11 maggio 2001, n. 11 (B.U. 15 maggio 2001 1° suppl. ord.) � DDG 3 maggio 2001, n. 10200 (B.U. n. 22 suppl. ord.) � DGR 18 maggio 2001 n. 4679. "Approvazione del Manuale di Qualità del Volontariato di
Protezione Civile e del bando di concorso per l'assegnazione di contributi alle Assiciazioni di Volontariato finalizzati alla certificazione di Qualità ISO 9000"
� DGR 18 maggio 2001, n. 7/6912(B.U. 10 dicembre 2001, n.50 suppl. ord.). � DGR 16 novembre 2001, n. 7/6911 (B.U. 25 novembre 1997, n. 48, 1° suppl. ord.) � Regolamento regionale 8 giugno 2001, n. 3 (B.U. 12 giugno 2001, n. 24, 1° suppl. ord.) � DGR 25 gennaio 2002, n. 7/7858 (B.U. n. 7 suppl. ord.). "Trasferimento alle Province della
tenuta delle sezioni provinciali dell'Albo Regionale del Volontariato di Protezione Civile delle organizzazioni di volontariato operanti nell'ambito del territorio provinciale per la Protezione Civile." (Attuazione art. 4 comma 46 e art. 3 comma 1, l.r. 1/2000).
� L.R. 22 luglio 2002, n. 15 (B.U. 26 luglio 2002 1° suppl. ord.)

Annexes
233
� Circolare 30 settembre 2002, n. 5114. Presidenza del Consiglio dei Ministri Dipartimento della Protezione Civile: Ripartizione delle competenze amministrative in materia di protezione civile. (GU n. 236 del 8-10-2002)
� DGR 20 dicembre 2002, n. 11670 DGR 21 febbraio 2003 n. 7/12200 (B.U. 11 marzo 2003 1° suppl. straord.)
� D.G.R. 21/02/2003 N.12200. Law about the planning of the local institutions. “Direttiva sulla pianificazione Enti Locali”
� L.R. 14 aprile 2003, n. 4 (B.U. 18 aprile 2003, n. 4 1° suppl. ord.) � DGR 14 luglio 2003, n. 7/13669 (B.U. n. 31 suppl. ord.) � DGR 7 novembre 2003, n. 7/14964 (B.U. n. 48 suppl. ord.) � DDG 2 ottobre 2003, n. 16238 (B.U. n. 43 serie ord. pg. 4078) � DGR 5 dicembre 2003, n. 7/15496 (B.U. n. 52 suppl. ord.) � DGR 23 dicembre 2003, n. 7/15803 (B.U. n. 2 s.s.) “Direttiva Regionale sulle procedure
postemergenza” � Regional Law 16 may 2004. Testo unico delle disposizioni regionali in materia di Protezione
Civile. Valid for local or regional events. It gives emphasis to the role of the local authorities and it recognize the importance of the volunteers. Establish that the municipalities are the first operative authorities, the Province coordinates the volunteers while the Region coordinates the emergency as the Administrative Center also in charge of the forecasting and warning.
� L.R. 22 maggio 2004, n. 16 (B.U. 24 maggio 2004, 1° s.o. al n. 22) � DGR 24 marzo 2005, n.7/21205DGR 22 dicembre 2005, n.8/1566 � DGR 16 maggio 2007, n.8/4732, D.g.r. VIII/8753 2008. � Determinazioni in merito alla gestione organizzativa e funzionale del sistema di allerta per i
rischi naturali ai fini di protezione civile.

Integrated People Centred Early Warning System as a risk reduction strategy, Northern Italy
234
ANNEX 4. Acronyms
ADPC (Asian Disaster Preparedness Center) CBDRM (Community Based Disaster Risk Management) CB-EWS (Community Based Early Warning System) CVA (Capacity and Vulnerability Analysis) or VCA (Vulnerability and Capacity Analysis) DKKV (German Committee for Disaster Reduction) EWS (Early Warning System) GTZ (Deutsche Gesellschaft für Technische Zusammenarbeit - German Technical Cooperation) IDNDR International Decade for Natural Disaster Reduction IEWS (Integrated Early Warning System) IFRC (International Federation of Red Cross and Red Crescent Societies) IFRC (International Federation of Red Cross and Red Crescent Societies) ISDR International Strategy for Disaster Reduction OAS (Organization of American States). PAR (Pressure and Release) PPEW (Platform for the Promotion of Early Warning) VCA (Vulnerability Capacity Assessment)

Annexes
235
ANNEX 5. Responses on the final additional comment of the questionnaire to the public
Original answers in Italian English Translation
Grazie per il questionario. Mi ha aiutato molto a conoscere quello che potrei fare ed affrontare in un futuro anche prossimo
Thank you for the questionnaire. It helped me a lot to know what could I do and face in a close future
Anche se le mie conoscenze sull'argomento sono scarse desidererei davvero essere informato su questi rischi
Even if my knowledge of the topic is limited, I would really like to be informed about these risks
Mi illumino d'immenso nel leggere questo questionario It was really enlightening to read this questionnaire
sperando che non si verifichiro questi fenomeni a Grosio! Let's hope that these phenomenon won’t occur in Grosio
Personalmente spero non arrivino nè frane nè alluvioni perchè non vorrei restare secco lì xò se proprio devono succedere, meglio sapere come comportarsi!!!
Personally I hope that neither landslides or floods arrive because I would not like to be killed, but if it should really happen it is better to know how to behave (what to do)
Grazie, questo questionario mi ha fatto riflettere molto sui rischio Thank you for this questionnaire, it made me think a lot about risk
Si, bisognerebbe fare degli incontri a scuola Yes, it would be (meglio it is) necessary to develop meetings at school
Bisognerebbe organizzare incontri a scuola It would be (meglio: it is) necessary to organize meetings at school
Non so cosa voi dire Zonazione. Inoltre sarebbe bello fare incontri a scuola per informare gli studenti
I don’t know the meaning of ‘zoning’... It would be good to develop meetings at school to inform the students
Bisognerebbe parlarne a scuola in quanto credo sia essenziale che anche i ragazzi della nostra età conoscano il loro territorio
It would be necessary to talk about this at school since I think it is essential that also people of our age know their territory
Secondo me bisognerebbe fare degli incontri su questi argomenti nelle scuole per aumentare le conoscenze del proprio territorio
I think it would be necessary to organize meetings about this topic in schools to increase the knowledge about their own territory
Bisognerebbe fare degli incontri a scuola! It would be necessary to organize meetings at the school
Complimenti, trovo interesante ed utile il questionnario Congratulations, I think that the questionnaire is interesting and useful
forse è meglio che il comune di Tirano prenda con maggior serietà la sicurezza del propi cittadini
It is better that the municipality of Tirano assume more seriously the security of their own citizens (io metterei: pays more attention to it’s citizens safety)
cosa devo fare in caso di terremoto e frane? What should I do in case of earthquake and landslides
Viva i terrazzamenti Long life to the terraces
Essere più informati su quello che potrebbe accadere e in che modo e le sue conseguenze
To Be better informed about what could happen and how and its consequences
anche facendo questo test la situazione non cambierebbe Even if we do this test the situation would not change
è stato molto molto molto, molto interessante It has been really really really interesting
bella storia Nice topic
Buon lavoro Good work
che questo questionario serva a qualche cosa e non vada a finire nella carta straccia come purtroppo in Italia succede
[Hope that] this questionnaire will be useful for something and that it does not finish in the bin as unfortunately happens in Italy
è un questionario molto interessante ma penso che gli eventi naturali succedono senza date o momenti precisi e l'uomo dovrebbe rispettare l'ambiente prima e non dopo che i disastri sono avvenuti. Grazie a voi
it is a really interesting questionnaire but I think that natural events happen without date or precise moments and men should respect the environment before and not after that the disaster has happened. Thank you
più soldi ai comuni per migliorare il territorio More money to the municipality to improve the territory
positive le iniziative d'informazione, ma se lo stato non dispone e soprattutto attua fondi e opere pubbliche mirate, temo che nè le parole nè le carte scritte fermino le frane o l'impeto dei fiume …. È sempre la popolazione coi volontari che si rimbocca le maniche!!
The information initiatives are positive, but if the Government does not arrange and, above all, provide money and public works, I am afraid that neither words or written letters would stop landslides or the impetus of the river.... It is always the population with the volunteers that “roll up their sleeves”
il 1987 ha lasciato molta paura. Questo (2008/09) anno di cosi tanta neve, ha dato tante preocupazione x le slavine _x i terremoti non e divanno pensero (penso sia: i terremoti non ci
The [event of] 1987 have left a lot of fear. This year [2008/2009] with so much snow has worried us for the avalanches, but the
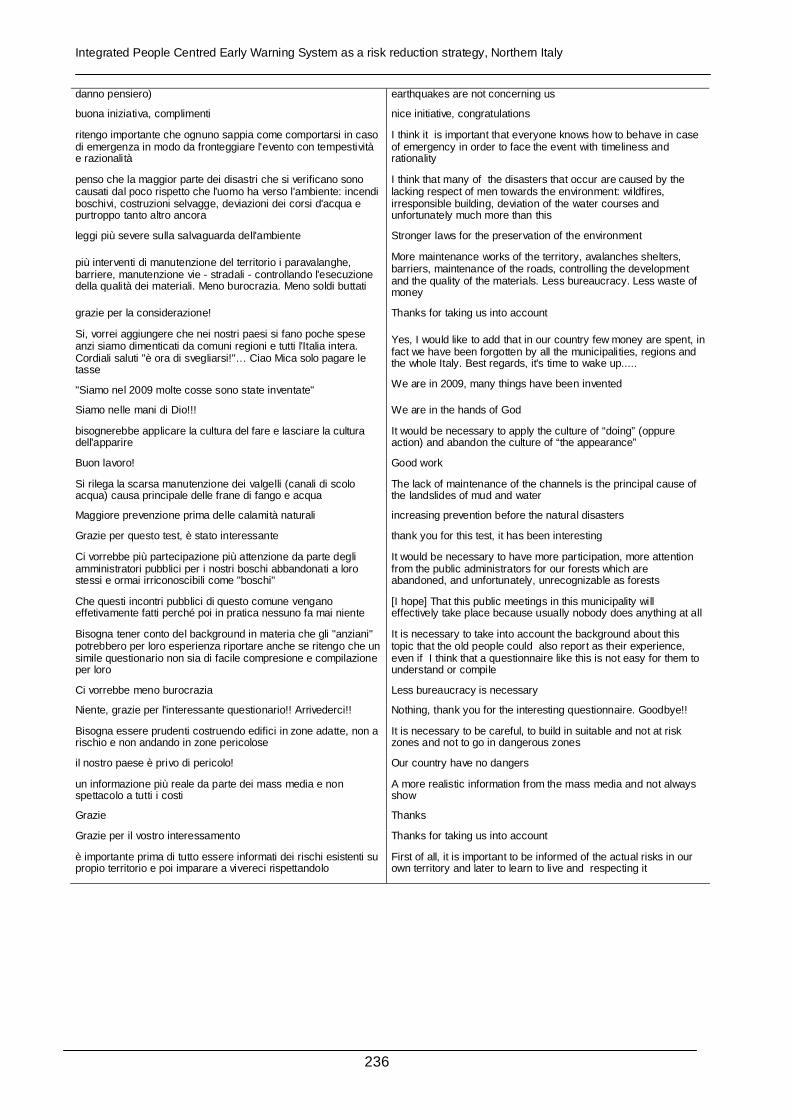
Integrated People Centred Early Warning System as a risk reduction strategy, Northern Italy
236
danno pensiero) earthquakes are not concerning us
buona iniziativa, complimenti nice initiative, congratulations
ritengo importante che ognuno sappia come comportarsi in caso di emergenza in modo da fronteggiare l'evento con tempestività e razionalità
I think it is important that everyone knows how to behave in case of emergency in order to face the event with timeliness and rationality
penso che la maggior parte dei disastri che si verificano sono causati dal poco rispetto che l'uomo ha verso l'ambiente: incendi boschivi, costruzioni selvagge, deviazioni dei corsi d'acqua e purtroppo tanto altro ancora
I think that many of the disasters that occur are caused by the lacking respect of men towards the environment: wildfires, irresponsible building, deviation of the water courses and unfortunately much more than this
leggi più severe sulla salvaguarda dell'ambiente Stronger laws for the preservation of the environment
più interventi di manutenzione del territorio i paravalanghe, barriere, manutenzione vie - stradali - controllando l'esecuzione della qualità dei materiali. Meno burocrazia. Meno soldi buttati
More maintenance works of the territory, avalanches shelters, barriers, maintenance of the roads, controlling the development and the quality of the materials. Less bureaucracy. Less waste of money
grazie per la considerazione! Thanks for taking us into account
Si, vorrei aggiungere che nei nostri paesi si fano poche spese anzi siamo dimenticati da comuni regioni e tutti l'Italia intera. Cordiali saluti "è ora di svegliarsi!"… Ciao Mica solo pagare le tasse
"Siamo nel 2009 molte cosse sono state inventate"
Yes, I would like to add that in our country few money are spent, in fact we have been forgotten by all the municipalities, regions and the whole Italy. Best regards, it's time to wake up.....
We are in 2009, many things have been invented
Siamo nelle mani di Dio!!! We are in the hands of God
bisognerebbe applicare la cultura del fare e lasciare la cultura dell'apparire
It would be necessary to apply the culture of “doing” (oppure action) and abandon the culture of “the appearance”
Buon lavoro! Good work
Si rilega la scarsa manutenzione dei valgelli (canali di scolo acqua) causa principale delle frane di fango e acqua
The lack of maintenance of the channels is the principal cause of the landslides of mud and water
Maggiore prevenzione prima delle calamità naturali increasing prevention before the natural disasters
Grazie per questo test, è stato interessante thank you for this test, it has been interesting
Ci vorrebbe più partecipazione più attenzione da parte degli amministratori pubblici per i nostri boschi abbandonati a loro stessi e ormai irriconoscibili come "boschi"
It would be necessary to have more participation, more attention from the public administrators for our forests which are abandoned, and unfortunately, unrecognizable as forests
Che questi incontri pubblici di questo comune vengano effetivamente fatti perché poi in pratica nessuno fa mai niente
[I hope] That this public meetings in this municipality will effectively take place because usually nobody does anything at all
Bisogna tener conto del background in materia che gli "anziani" potrebbero per loro esperienza riportare anche se ritengo che un simile questionario non sia di facile compresione e compilazione per loro
It is necessary to take into account the background about this topic that the old people could also report as their experience, even if I think that a questionnaire like this is not easy for them to understand or compile
Ci vorrebbe meno burocrazia Less bureaucracy is necessary
Niente, grazie per l'interessante questionario!! Arrivederci!! Nothing, thank you for the interesting questionnaire. Goodbye!!
Bisogna essere prudenti costruendo edifici in zone adatte, non a rischio e non andando in zone pericolose
It is necessary to be careful, to build in suitable and not at risk zones and not to go in dangerous zones
il nostro paese è privo di pericolo! Our country have no dangers
un informazione più reale da parte dei mass media e non spettacolo a tutti i costi
A more realistic information from the mass media and not always show
Grazie Thanks
Grazie per il vostro interessamento Thanks for taking us into account
è importante prima di tutto essere informati dei rischi esistenti su propio territorio e poi imparare a vivereci rispettandolo
First of all, it is important to be informed of the actual risks in our own territory and later to learn to live and respecting it


