Mountain Pine Beetle Data Presented by Anina Hundsdörfer.
33
Mountain Pine Beetle Data Presented by Anina Hundsdörf
-
date post
22-Dec-2015 -
Category
Documents
-
view
218 -
download
0
Transcript of Mountain Pine Beetle Data Presented by Anina Hundsdörfer.

Mountain Pine Beetle Data
Presented by Anina Hundsdörfer
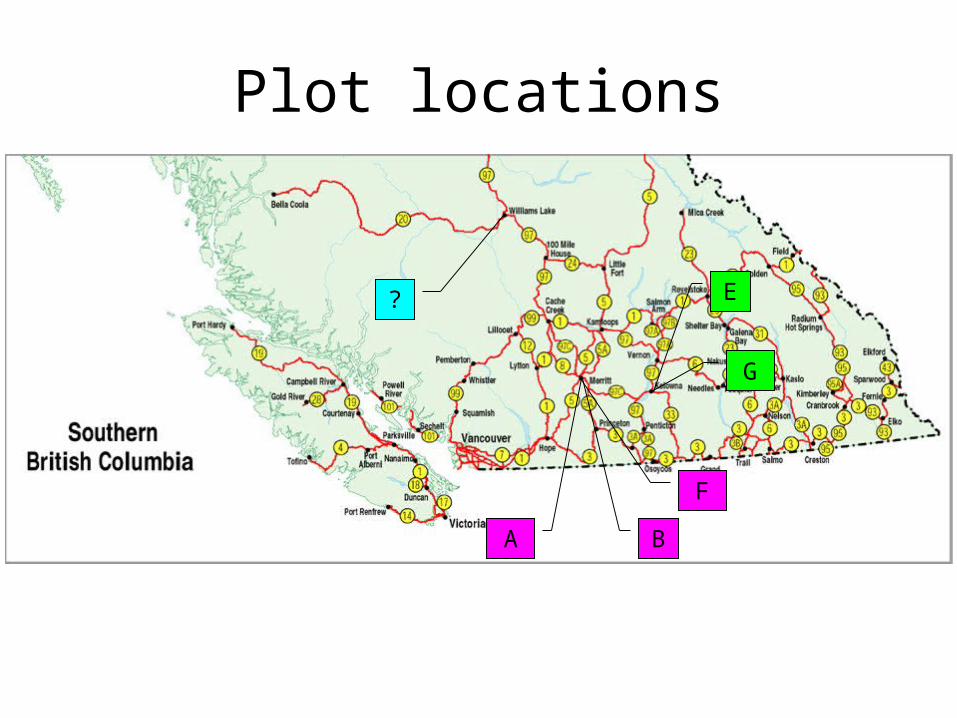
B
F
A
E
G
?
Plot locations

Methodology
Total station
Shoots a laser beam to prism located next to tree
x, y, z coordinatesof each tree
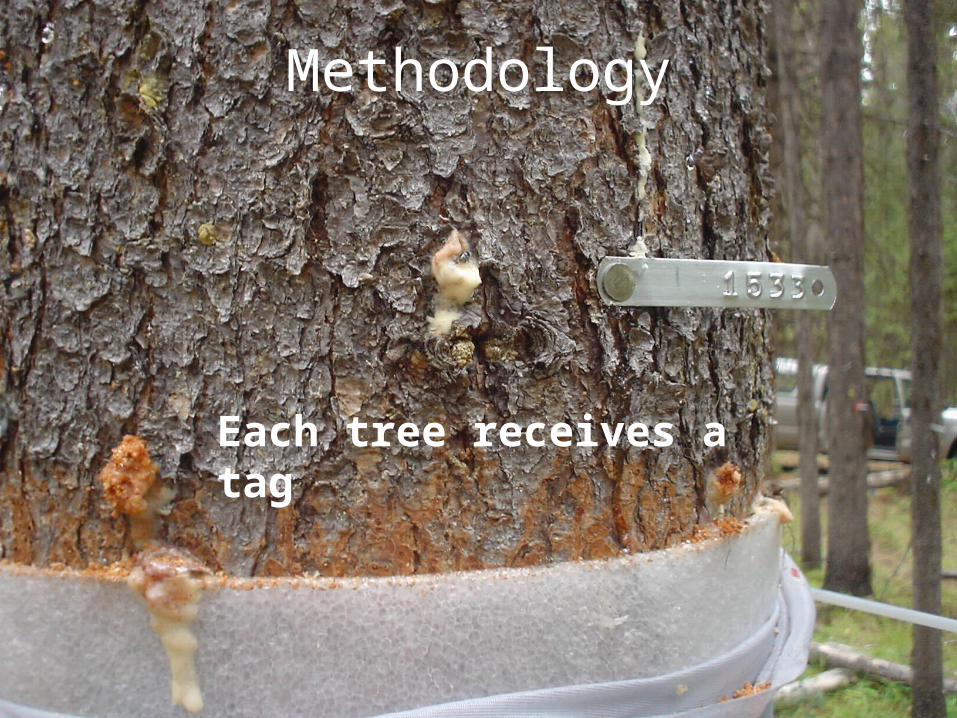
Methodology
Each tree receives a tag
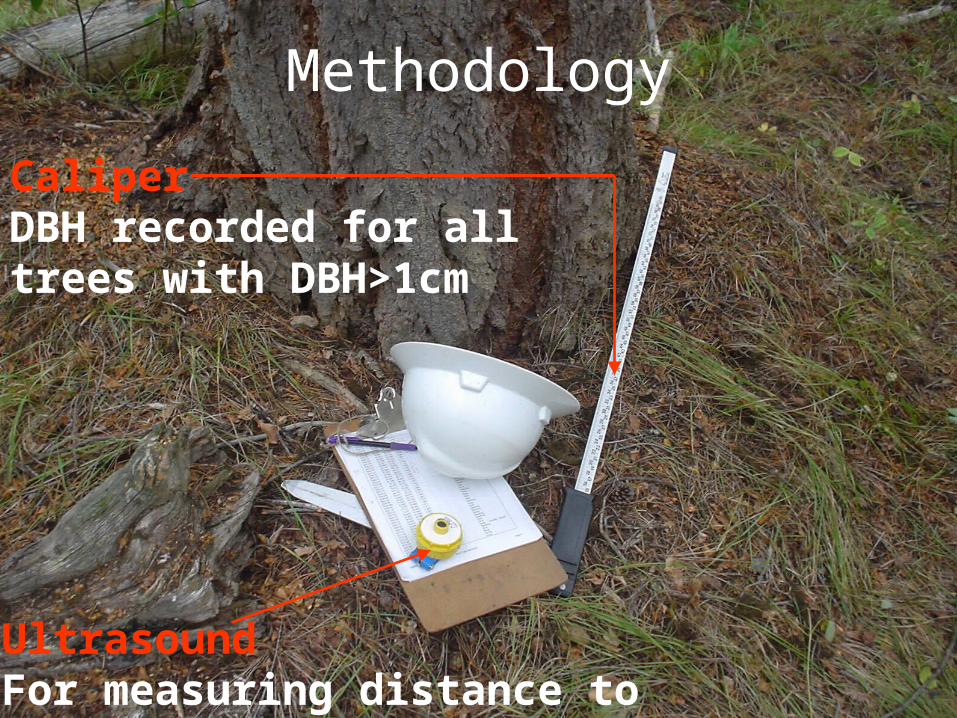
Methodology
Caliper DBH recorded for all trees with DBH>1cm
Ultrasound For measuring distance to hypsometer
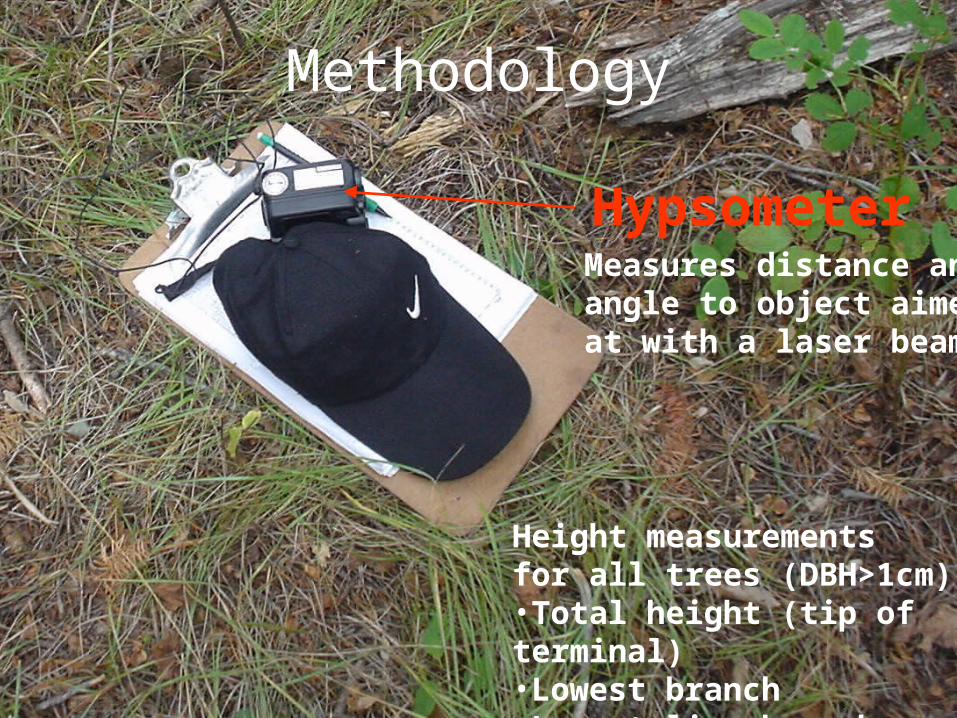
Methodology
Hypsometer
Height measurements for all trees (DBH>1cm)•Total height (tip of terminal)•Lowest branch•Lowest live branch
Measures distance and angle to object aimed at with a laser beam

Data formatTag Tsp Y X Z DBH HT BHT1 BHT2 Status AttYR Bsp AttSt Season
1 DF 0.621 0.893 -0.023 0 0 0 0 Seedling 0 none none 0
1 DF 93.48 91.194 0.2 0 0 0 0 Seedling 0 none none 0
2 DF 0.035 1.253 0.024 0 0 0 0 Seedling 0 none none 0
2 DF 92.979 90.595 0.233 0 0 0 0 Seedling 0 none none 0
3 DF 1.939 4.622 0.081 64.9 17.2 11.7 1.4 Alive 0 none none 0
3 DF 91.933 91.511 0.4 0 0 0 0 Seedling 0 none none 0
4 LP 1.777 3.649 0.065 4.3 4 0 0 Snag 0 none none 0
4 LP 91.357 91.977 0.444 6.8 0 0 0 Log 0 none none 0
5 LP 1.538 3.735 0.024 9.1 0 0 0 Log 0 none none 0
5 LP 91.532 93.357 0.57 4.3 5.4 2.2 1.3 Alive 0 none none 0
6 DF 2.749 3.372 -0.023 3.2 3.5 2.1 1.4 Alive 0 none none 0
6 LP 91.021 94.986 0.778 4.4 0 0 0 Snag 0 none none 0
415 LP 4.764 29.573 -2.176 22.6 23.1 18.5 16.7 Alive 2003 ILAT S 1.5
415 LP 4.764 29.573 -2.176 22.6 23.1 18.5 16.7 Alive 2004 MPB S 1
415 LP 4.764 29.573 -2.176 22.6 23.1 18.5 16.7 Alive 2004 TLIN none 3
415 LP 4.764 29.573 -2.176 22.6 23.1 18.5 16.7 Alive 2003 IMEX S 3.5
415 LP 4.764 29.573 -2.176 22.6 23.1 18.5 16.7 Alive 2004 IMEX S 1
415 LP 4.764 29.573 -2.176 22.6 23.1 18.5 16.7 Alive 2004 ILAT S 4
415 DF 95.282 58.309 -2.353 2.9 3.9 2.3 1.4 Alive 0 none none 0
416 LP 4.532 29.37 -2.129 21.2 26.3 20.8 10.5 Alive 2004 MPB M 3

VariablesStatus• Alive: Live tree with DBH > 1.0 cm.• Seedling: Live tree from germinants to sapling with a DBH<1.0 cm.• Snag: Standing dead tree with an intact terminal• Log: Recent year fallen tree that may or may not lying on the ground• Stump: Dead tree with a broken terminal, regardless of height
Species• DF: Douglas fir (Pseudotsuga sp.) • FIR: Amabilis fir (Abies amabilis Dougl. ex J. Forbes )• HM: hemlock (Tsuga sp.)• LP: lodgepole pine (Pinus contorta)• TA: trembling aspen (Populus tremuloides)• WS: white spruce (Picea glauca (Moench) Voss)• WWP: western white pine (Pinus monticola)
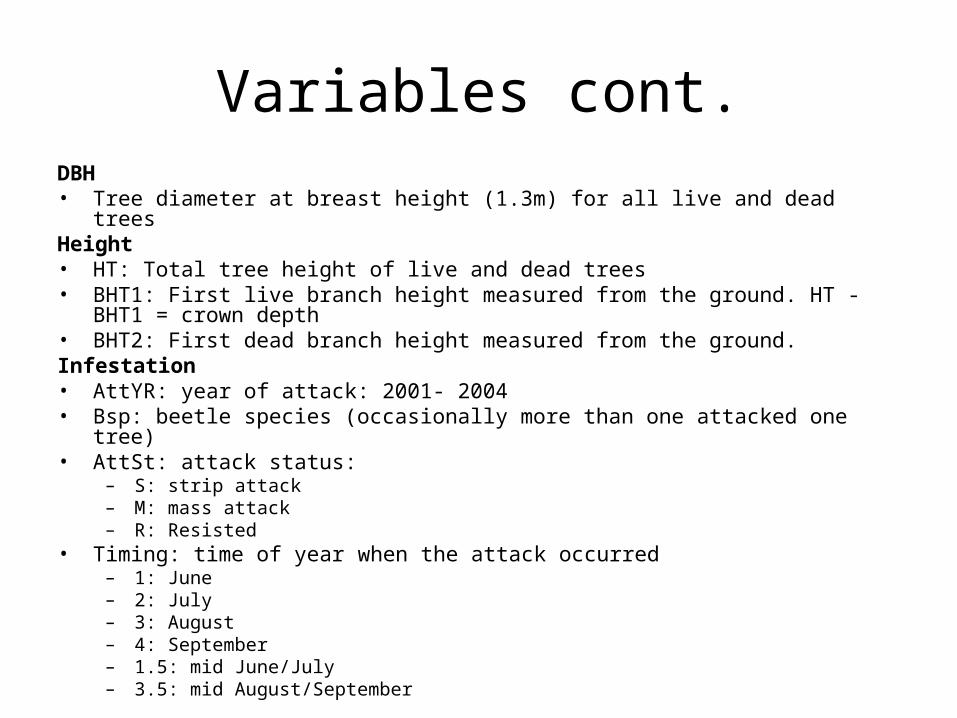
Variables cont.DBH• Tree diameter at breast height (1.3m) for all live and dead treesHeight• HT: Total tree height of live and dead trees• BHT1: First live branch height measured from the ground. HT - BHT1 = crown depth• BHT2: First dead branch height measured from the ground. Infestation• AttYR: year of attack: 2001- 2004• Bsp: beetle species (occasionally more than one attacked one tree)• AttSt: attack status:
– S: strip attack– M: mass attack– R: Resisted
• Timing: time of year when the attack occurred– 1: June– 2: July– 3: August– 4: September– 1.5: mid June/July– 3.5: mid August/September

Notes column
Notes• Dead top: Trees with a dead terminal, either the needles
had completely fallen off or died recently.• Declining: Trees with poor health and expected to die in
the coming years• Dying: Trees that were dying.• Dying top: Trees with a terminal that was dying.• Flat top: Trees had a flat crown due to the death of the
terminal some years ago.• Leaning: Trees that were tilted, whose height could not
be accurately measured.

Plot characteristics
Plots Area Boundary [m] to correct for edge effects
Elevation difference [m]
Tree density [trees/ m2]
X left X right Y upper Y lower
A plot 15 625 m2 ( 1.56 ha)
(125m x 125m)
1.295 2.282 1.795 2.074 14.44 0.263
B plot 10 000 m2 (1 ha)
(100m x 100m)
2.67 2.5 2.64 1.57 7.37 0.398
E plot 10 000 m2 (1 ha)
(100m x 100m)
1.356 1.859 1.598 1.272 6.85 0.263
F plot 15 625 m2 ( 1.56 ha)
(125m x 125m)
0.624 0.885 1.481 1.864 12.35 0.462
G plot 22 500 m2 ( 2.25 ha)
(150m x 150m)
1.694 1.106 1.463 1.003 5.64 0.270
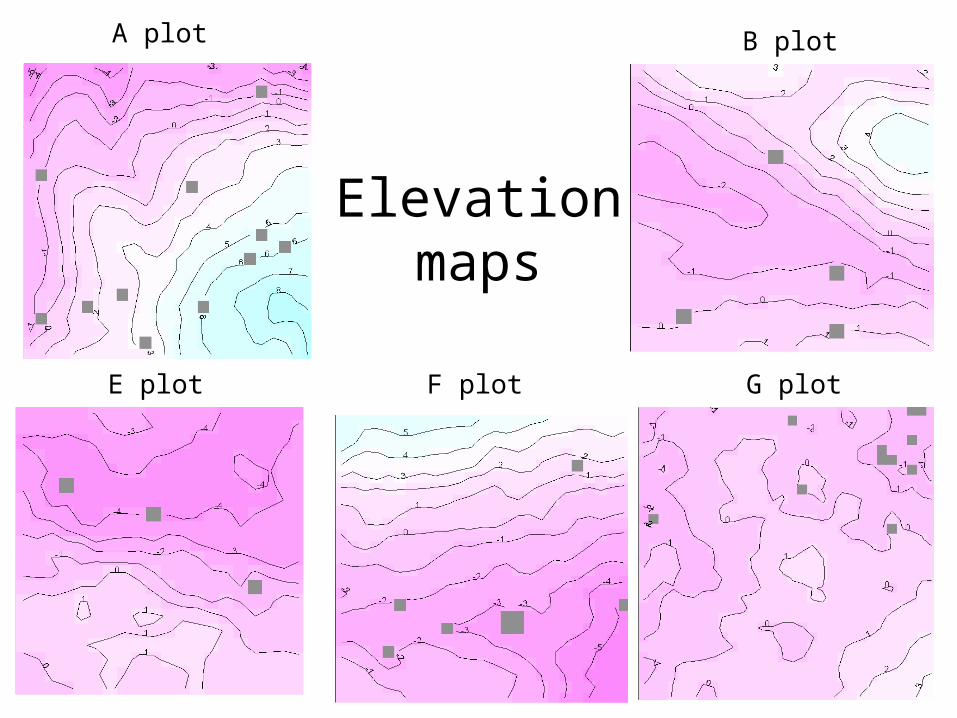
Elevation maps
A plot B plot
E plot F plot G plot
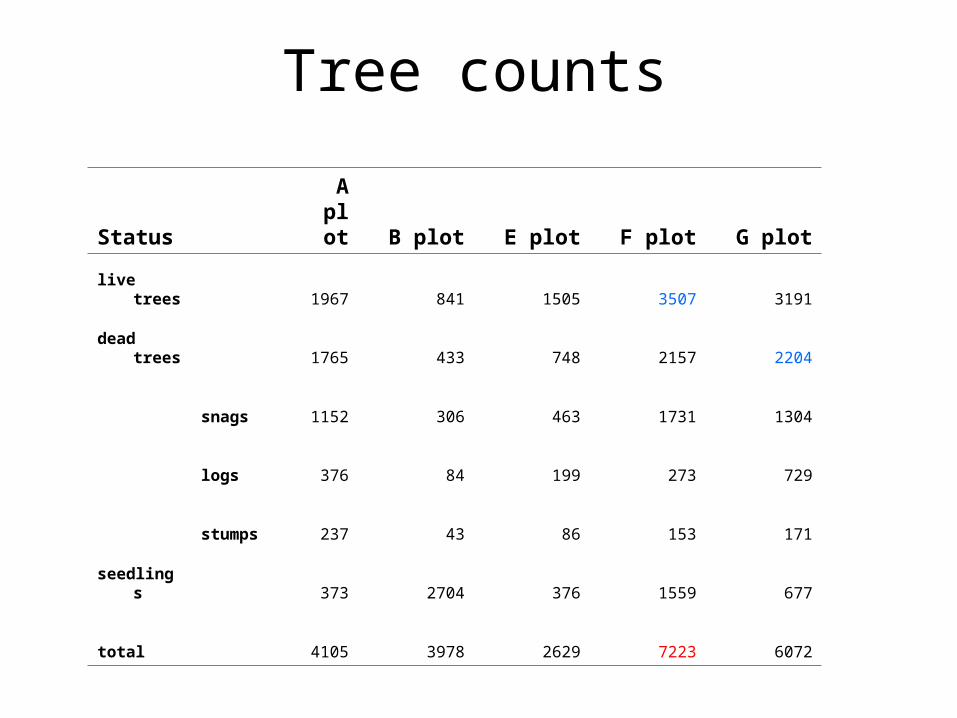
Tree counts
Status A plot B plot E plot F plot G plot
live trees 1967 841 1505 3507 3191
dead trees 1765 433 748 2157 2204
snags 1152 306 463 1731 1304
logs 376 84 199 273 729
stumps 237 43 86 153 171
seedlings 373 2704 376 1559 677
total 4105 3978 2629 7223 6072

Species: A plot
Species abundance
1 Logepole Pine 3506
2 Douglas fir 540
3 Trembling aspen 44
4 White spruce 10
5 Amabilis fir 4
6 Hemlock 1
A plot species distribution

Spatial Association of Species: A Plot
Interaction P-value
LP x DF 0.435 0.510
LP x TA 0.652 0.420
LP x WS 0.011 0.915
DF x TA 0.066 0.798
DF x WS 0.323 0.570
TA x WS 3.038 0.081
2obs
HM DF TA WS FIRLP
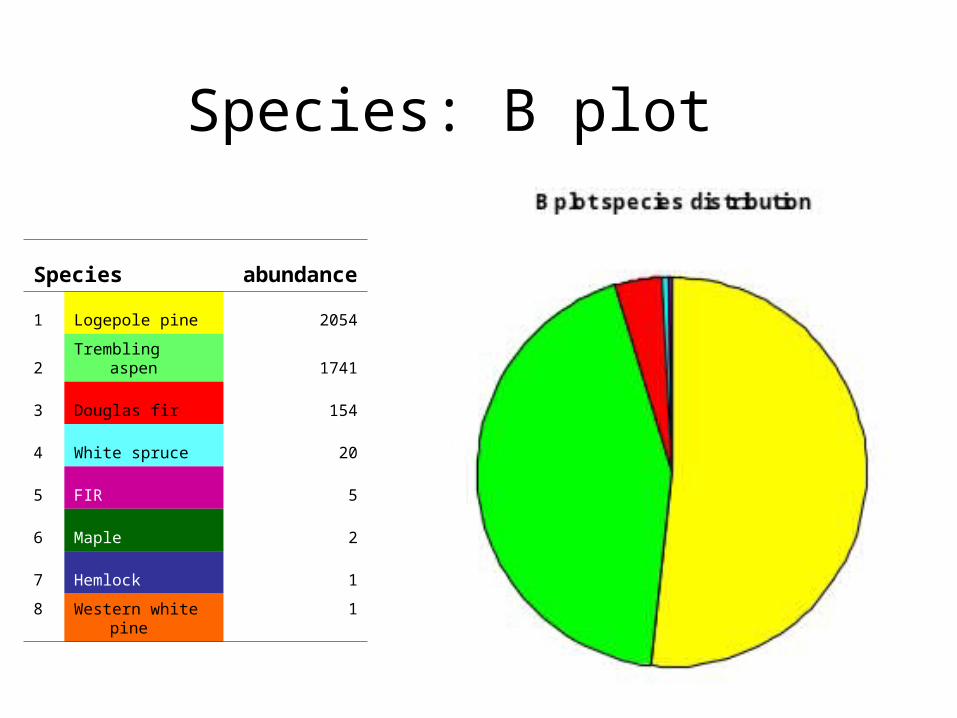
Species: B plot
Species abundance
1 Logepole pine 2054
2 Trembling aspen 1741
3 Douglas fir 154
4 White spruce 20
5 FIR 5
6 Maple 2
7 Hemlock 1
8Western white pine
1

Interaction P-value
LP x DF 0.167 0.682
LP x TA 0.028 0.868
LP x WS 0.016 0.898
DF x TA 4.919 0.027
DF x WS 1.255 0.263
TA x WS 0.411 0.521
2obs
Spatial Association of Species: B Plot
HM DF TA WS FIR Maple HM WWP LP

Spatial Association of Species: E plot
Species abundance
1 Lodgepole pine 1775
2 White spruce 764
3 Douglas fir 90
E plot species distribution
Interaction P value
LP x DF 2.427 0.119
LP x WS 6.231 0.013
DF x WS 0.435 0.509
2obs
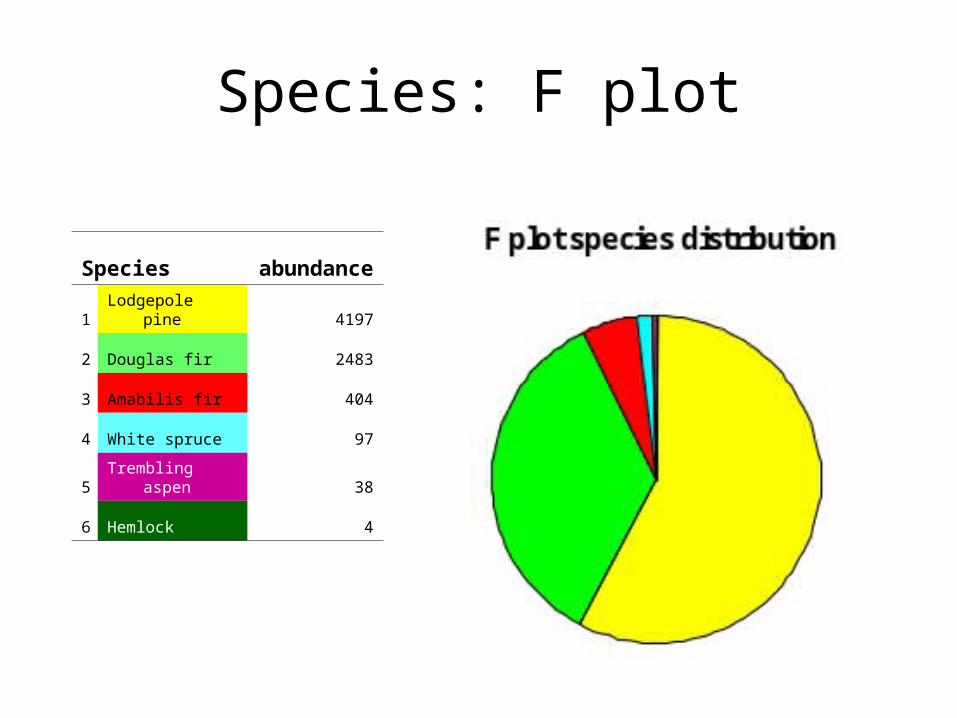
Species: F plot
Species abundance
1 Lodgepole pine 4197
2 Douglas fir 2483
3 Amabilis fir 404
4 White spruce 97
5 Trembling aspen 38
6 Hemlock 4

Interaction P-value
LP x DF 51.986 0.000
LP x TA 0.000 0.993
LP x WS 1.867 0.172
LP x FIR 0.000 0.993
DF x TA 2.238 0.135
DF x WS 0.739 0.390
DF x FIR 2.238 0.135
TA x WS 7.842 0.005
TA x FIR 619.504 0.000
WS x FIR 619.504 0.000
HM DF AS WS FIR HMLP
2obs
Spatial Association of Species: F Plot

Species’ spatial association: G plot
Species abundance
1 Lodgepole pine 4772
2 White spruce 684
3 Douglas fir 616
Interaction P- value
LP x DF 3.247 0.072
WS x LP 5.716 0.017
DF x WS 0.002 0.963
2obs
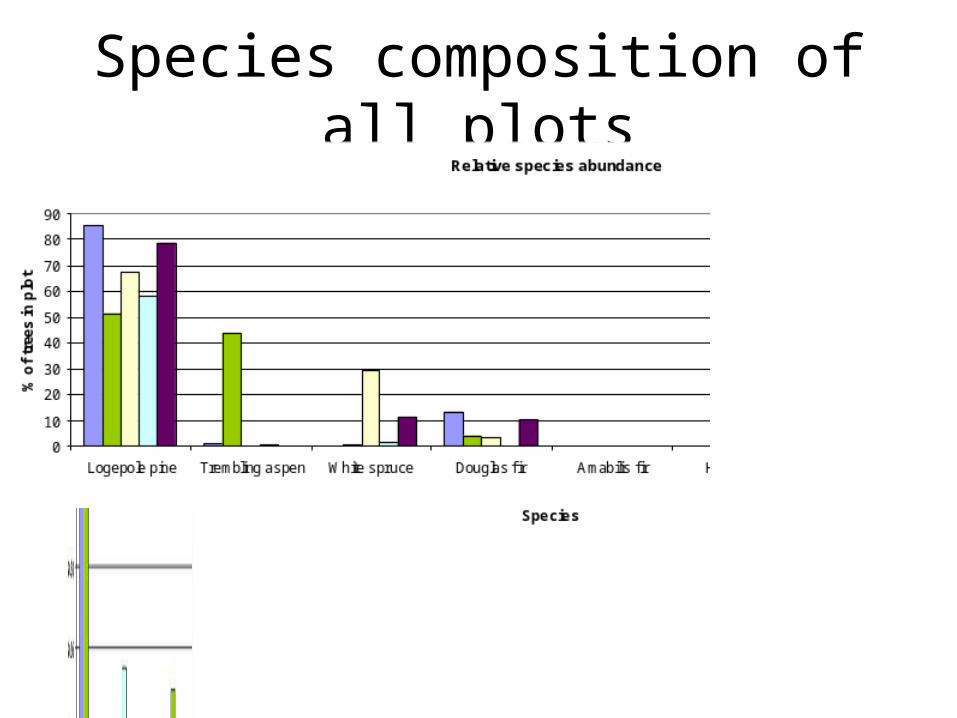
Species composition of all plots

Infestation
Tree counts
Year A plot B plot E plot F plot G plot
2001 3 4 6 1 0
2002 6 11 12 1 1
2003 13 46 60 4 11
2004 5 7 11 12 9
total 27 72 89 18 21
Proportion of LP(DBH>8cm) infested 0.95% 5.69% 5.41% 0.61% 0.41%
Surrounding stand Endemic Incipient Outbreak Endemic Endemic
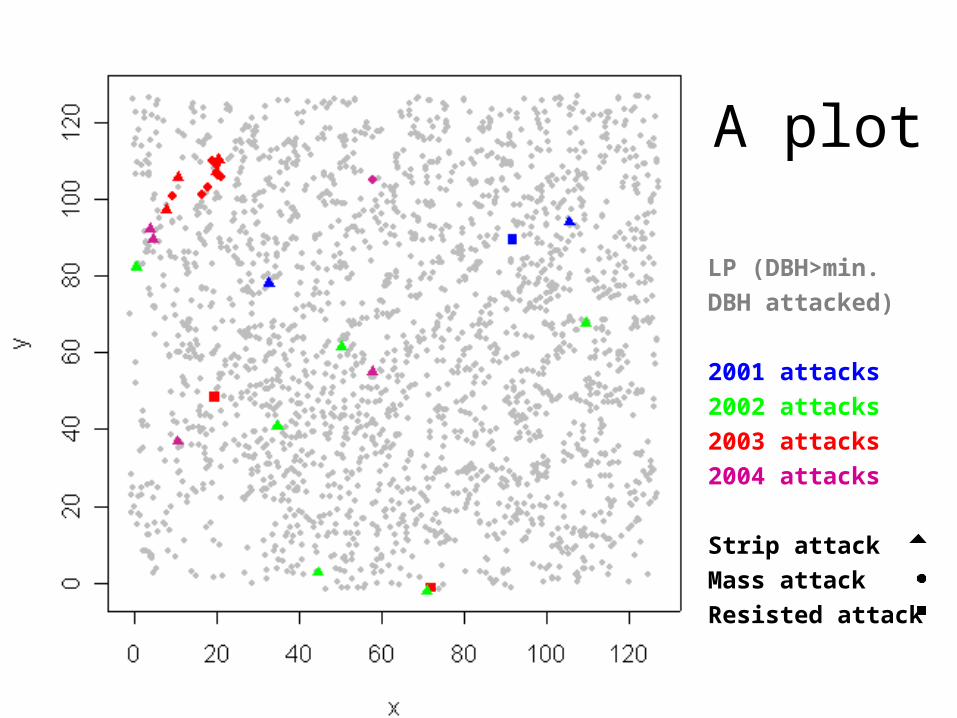
A plot
LP (DBH>min.
DBH attacked)
2001 attacks
2002 attacks
2003 attacks
2004 attacks
Strip attack
Mass attack
Resisted attack

B plot
LP (DBH>min.
DBH attacked)
2001 attacks
2002 attacks
2003 attacks
2004 attacks
Strip attack
Mass attack
Resisted attack

E plot
LP (DBH>min.
DBH attacked)
2001 attacks
2002 attacks
2003 attacks
2004 attacks
Strip attack
Mass attack
Resisted attack
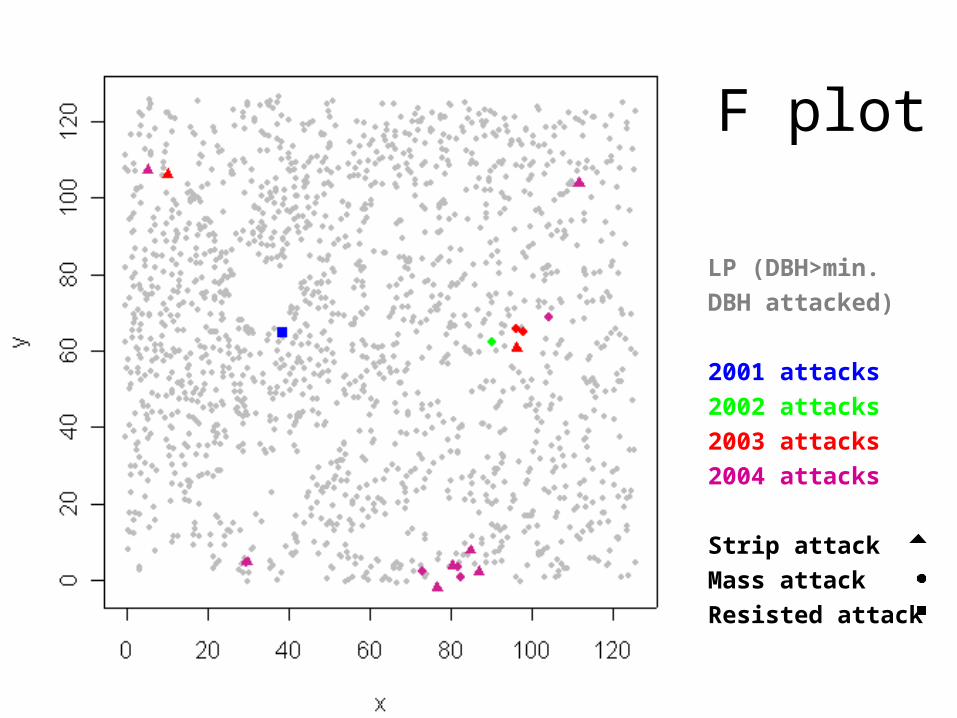
F plot
LP (DBH>min.
DBH attacked)
2001 attacks
2002 attacks
2003 attacks
2004 attacks
Strip attack
Mass attack
Resisted attack

G plot
LP (DBH>min.
DBH attacked)
2002 attacks
2003 attacks
2004 attacks
Strip attack
Mass attack
Resisted attack

Tree vigour: A plotHeight [m]
live trees dead trees infested trees
mean 18.81 12.14 23.42
st. dev. 6.30 4.75 3.69
min 1.50 1.20 17.50
1st quantile 17.20 8.30 20.40
median 20.60 12.20 24.65
3rd quantile 22.8 15.70 25.83
max 34.10 25.50 28.50
DBH [cm]
live trees dead trees Infested trees
mean 17.75 8.97 23.54
st. dev. 7.41 3.98 5.42
min 0.90 0.70 10.80
1st quantile 13.40 6.20 20.00
median 18.40 8.40 24.30
3rd quantile 22.60 11.23 27.10
max 83.00 32.40 34.70
Crown depth [m]
live trees dead trees infested trees
mean 7.50 8.35 8.97
st. dev. 3.56 2.54 3.27
min 0.40 5.50 2.80
1st quantile 5.00 6.93 7.65
median 7.10 8.20 9.45
3rd quantile 9.60 9.63 10.70
max 28.60 11.50 14.50
A Plot Height Distribution
0
1
2
3
4
5
6
7
8
9
10
0<HT ≤5 5<HT ≤10 10<HT ≤15 15<HT ≤20 20<HT ≤25 25<HT ≤30 30<HT ≤35
Height classes [m]
nu
mb
er o
f tr
ees
infested
LP alive (x100)

Tree vigour: B plotHeight [m]
live trees dead trees infested trees
mean 18.33 11.80 24.33
st. dev. 18.57 5.86 3.11
min 1.50 1.50 17.70
1st quantile 13.75 7.20 22.50
median 21.40 12.10 25.00
3rd quantile 24.78 16.20 26.15
max 30.50 26.50 31.40
DBH [cm]
live trees dead trees Infested trees
mean 18.82 11.44 27.67
st. dev. 9.51 6.17 5.27
min 1.00 0.30 15.10
1st quantile 12.90 7.60 23.70
median 21.20 11.20 26.80
3rd quantile 25.90 15.60 31.70
max 41.40 34.40 39.30
Crown depth [m]
live trees dead treesinfested
trees
mean 8.10 1.03 9.93
st. dev. 4.27 0.32 3.44
min 0.30 0.50 1.80
1st quantile 4.80 0.80 7.55
median 8.30 1.00 9.80
3rd quantile 11.00 1.30 12.25
max 21.80 1.50 18.60
B Plot DBH Distribution
0.0
5.0
10.0
15.0
20.0
25.0
0>DBH≤ 5 5>DBH≤ 10 10>DBH≤ 15 15>DBH≤ 20 20>DBH≤ 25 25>DBH≤ 30 30>DBH≤ 35 35>DBH≤ 40 40>DBH≤ 45
DBH class [m]
nu
mb
er o
f tr
ees
live LP (x10)
Infested

Tree vigour: E plotDBH [cm]
live trees dead trees Infested trees
mean 17.60 14.36 24.21
st. dev. 8.37 6.59 3.32
min 1.60 1.30 6.20
1st quantile 9.50 8.8 23.25
median 21.00 15.20 24.55
3rd quantile 24.60 19.70 25.93
max 30.10 27.60 30.90
DBH [cm]
live trees dead trees Infested trees
mean 15.97 11.47 24.29
st. dev. 7.82 5.36 4.82
min 0.70 0.70 8.20
1st quantile 9.70 7.80 21.73
median 16.50 11.20 24.20
3rd quantile 21.80 14.30 26.75
max 36.90 41.00 35.50
Crown depth [m]
live trees dead treesinfested
trees
mean 7.66 6.05 9.13
st. dev. 4.15 4.25 3.03
min 0.20 1.10 3.00
1st quantile 4.50 2.53 6.80
median 7.30 6.10 8.85
3rd quantile 10.40 9.23 11.10
max 21.70 11.40 16.60
E Plot Crown Depth Distribution
0
10
20
30
40
50
60
70
80
90
100
0<CD ≤5 5<CD ≤10 10<CD≤15 15<CD ≤20 20<CD ≤25
Crown depth class [m]
nu
mb
er o
f tr
ees
infested
LP alive (x5)
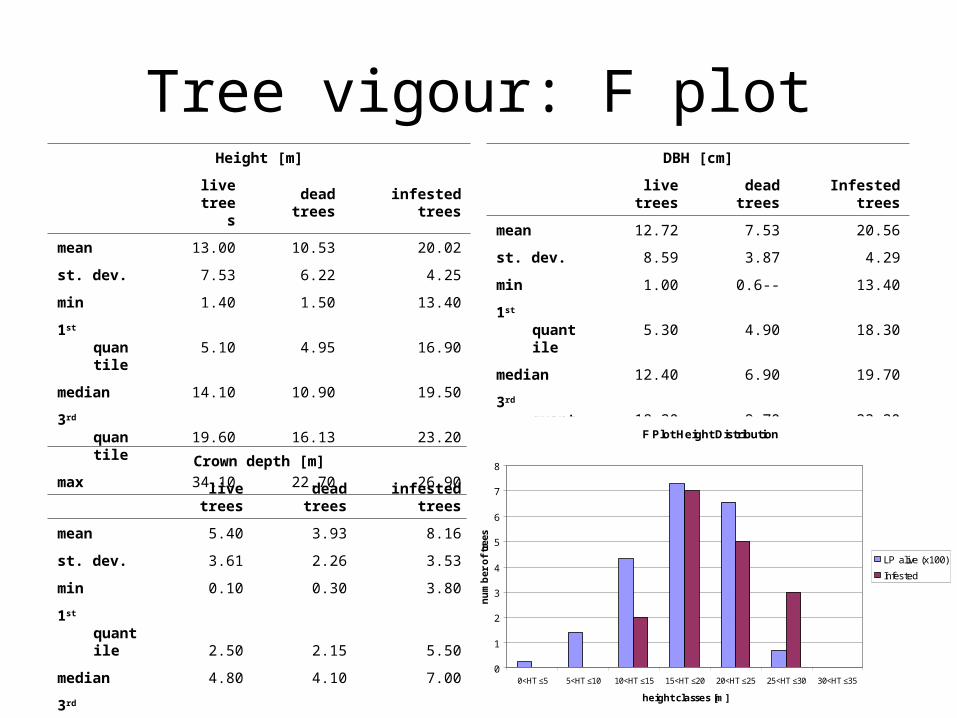
Tree vigour: F plotHeight [m]
live trees dead trees infested trees
mean 13.00 10.53 20.02
st. dev. 7.53 6.22 4.25
min 1.40 1.50 13.40
1st quantile 5.10 4.95 16.90
median 14.10 10.90 19.50
3rd quantile 19.60 16.13 23.20
max 34.10 22.70 26.90
DBH [cm]
live trees dead trees Infested trees
mean 12.72 7.53 20.56
st. dev. 8.59 3.87 4.29
min 1.00 0.6-- 13.40
1st quantile 5.30 4.90 18.30
median 12.40 6.90 19.70
3rd quantile 18.20 9.70 23.20
max 82.50 49.00 30.50
Crown depth [m]
live trees dead treesinfested
trees
mean 5.40 3.93 8.16
st. dev. 3.61 2.26 3.53
min 0.10 0.30 3.80
1st quantile 2.50 2.15 5.50
median 4.80 4.10 7.00
3rd quantile 7.58 4.80 11.30
max 25.10 9.50 16.80
F Plot Height Distribution
0
1
2
3
4
5
6
7
8
0<HT ≤5 5<HT ≤10 10<HT ≤15 15<HT ≤20 20<HT ≤25 25<HT ≤30 30<HT ≤35
height classes [m]
nu
mb
er o
f tr
ees
LP alive (x100)
Infested

Tree vigour: G plotHeight [m]
live trees dead trees infested trees
mean 20.88 17.46 24.92
st. dev. 7.65 5.52 3.85
min 1.60 1.50 11.30
1st quantile 20.00 14.70 24.55
median 23.90 18.80 25.95
3rd quantile 25.80 21.60 26.55
max 30.60 28.70 28.80
DBH [cm]
live trees dead trees Infested trees
mean 18.22 12.27 23.97
st. dev. 7.31 4.26 4.22
min 0.60 0.60 12.30
1st quantile 14.60 9.60 22.30
median 19.25 11.90 25.25
3rd quantile 23.30 14.50 26.83
max 40.50 37.50 28.80
G Plot DBH Distribution
0
2
4
6
8
10
12
5>DBH≤ 10 10>DBH≤ 15 15>DBH≤ 20 20>DBH≤ 25 25>DBH≤ 30 30>DBH≤ 35 35>DBH≤ 40
DBH classes [m]
nu
mb
er o
f tr
ees
LP alive (x100)
Infested
Crown depth [m]
live trees dead treesinfested
trees
mean 7.06 6.34 7.34
st. dev. 3.31 2.81 2.55
min 0.30 0.80 3.30
1st quantile 4.80 5.30 6.53
median 6.70 6.60 6.95
3rd quantile 8.90 8.30 8.03
max 25.80 11.80 13.00