MOUNT GIBSON IRON LIMITED
84
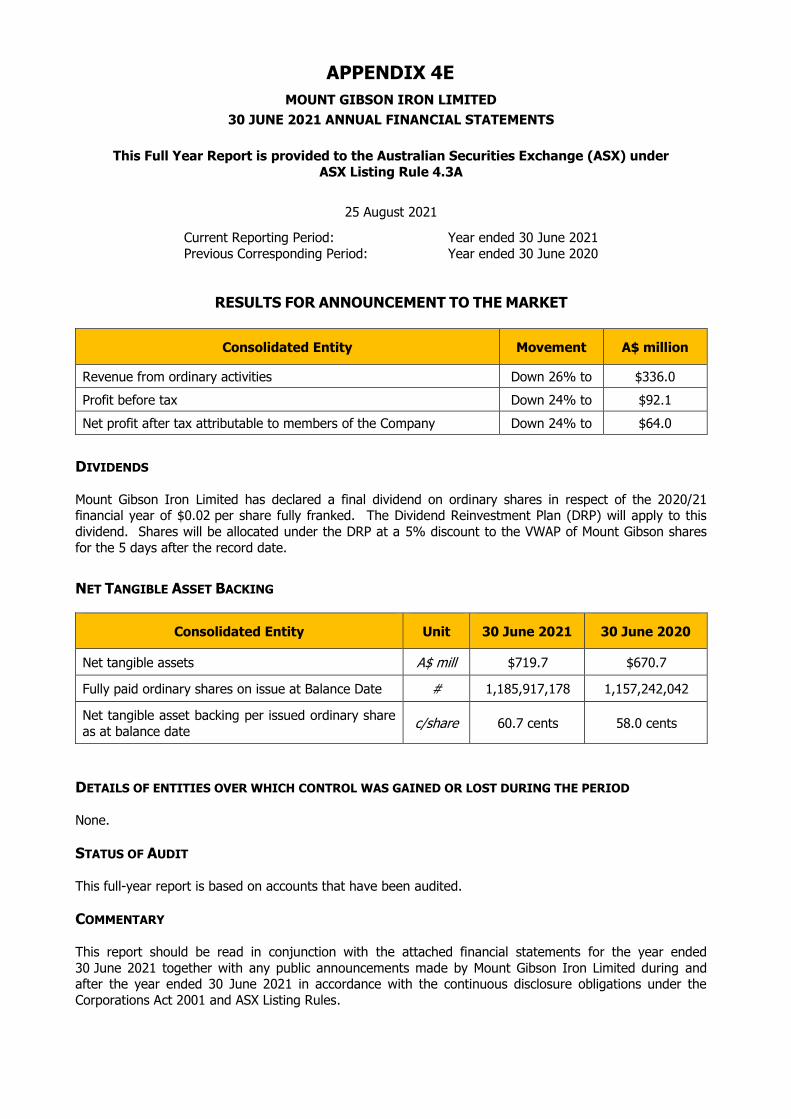
APPENDIX 4E MOUNT GIBSON IRON LIMITED 30 JUNE 2021 ANNUAL FINANCIAL STATEMENTS This Full Year Report is provided to the Australian Securities Exchange (ASX) under ASX Listing Rule 4.3A 25 August 2021 Current Reporting Period: Year ended 30 June 2021 Previous Corresponding Period: Year ended 30 June 2020 RESULTS FOR ANNOUNCEMENT TO THE MARKET Consolidated Entity Movement A$ million Revenue from ordinary activities Down 26% to $336.0 Profit before tax Down 24% to $92.1 Net profit after tax attributable to members of the Company Down 24% to $64.0 DIVIDENDS Mount Gibson Iron Limited has declared a final dividend on ordinary shares in respect of the 2020/21 financial year of $0.02 per share fully franked. The Dividend Reinvestment Plan (DRP) will apply to this dividend. Shares will be allocated under the DRP at a 5% discount to the VWAP of Mount Gibson shares for the 5 days after the record date. NET TANGIBLE ASSET BACKING Consolidated Entity Unit 30 June 2021 30 June 2020 Net tangible assets A$ mill $719.7 $670.7 Fully paid ordinary shares on issue at Balance Date # 1,185,917,178 1,157,242,042 Net tangible asset backing per issued ordinary share as at balance date c/share 60.7 cents 58.0 cents DETAILS OF ENTITIES OVER WHICH CONTROL WAS GAINED OR LOST DURING THE PERIOD None. STATUS OF AUDIT This full-year report is based on accounts that have been audited. COMMENTARY This report should be read in conjunction with the attached financial statements for the year ended 30 June 2021 together with any public announcements made by Mount Gibson Iron Limited during and after the year ended 30 June 2021 in accordance with the continuous disclosure obligations under the Corporations Act 2001 and ASX Listing Rules.
Transcript of MOUNT GIBSON IRON LIMITED
APPENDIX 4E
MOUNT GIBSON IRON LIMITED
30 JUNE 2021 ANNUAL FINANCIAL STATEMENTS
This Full Year Report is provided to the Australian Securities Exchange (ASX) under
ASX Listing Rule 4.3A
25 August 2021
Current Reporting Period: Year ended 30 June 2021
Previous Corresponding Period: Year ended 30 June 2020
RESULTS FOR ANNOUNCEMENT TO THE MARKET
Consolidated Entity Movement A$ million
Revenue from ordinary activities Down 26% to $336.0
Profit before tax Down 24% to $92.1
Net profit after tax attributable to members of the Company Down 24% to $64.0
DIVIDENDS
Mount Gibson Iron Limited has declared a final dividend on ordinary shares in respect of the 2020/21 financial year of $0.02 per share fully franked. The Dividend Reinvestment Plan (DRP) will apply to this
dividend. Shares will be allocated under the DRP at a 5% discount to the VWAP of Mount Gibson shares
for the 5 days after the record date.
NET TANGIBLE ASSET BACKING
Consolidated Entity Unit 30 June 2021 30 June 2020
Net tangible assets A$ mill $719.7 $670.7
Fully paid ordinary shares on issue at Balance Date # 1,185,917,178 1,157,242,042
Net tangible asset backing per issued ordinary share
as at balance date c/share 60.7 cents 58.0 cents
DETAILS OF ENTITIES OVER WHICH CONTROL WAS GAINED OR LOST DURING THE PERIOD None.
STATUS OF AUDIT
This full-year report is based on accounts that have been audited.
COMMENTARY This report should be read in conjunction with the attached financial statements for the year ended
30 June 2021 together with any public announcements made by Mount Gibson Iron Limited during and after the year ended 30 June 2021 in accordance with the continuous disclosure obligations under the
Corporations Act 2001 and ASX Listing Rules.

MOUNT GIBSON IRON LIMITED
AND CONTROLLED ENTITIES
ABN 87 008 670 817
ANNUAL FINANCIAL REPORT
FOR THE YEAR ENDED
30 JUNE 2021

Mount Gibson Iron Limited – 30 June 2021 Financial Report Page 1
Financial Report For the year ended 30 June 2021
Directors’ Report............................................................................................................................................................... 2
Auditor’s Independence Declaration to the Directors of Mount Gibson Iron Limited ..................................................... 21
Consolidated Income Statement .................................................................................................................................... 22
Consolidated Statement of Comprehensive Income ....................................................................................................... 23
Consolidated Balance Sheet............................................................................................................................................ 24
Consolidated Cash Flow Statement ................................................................................................................................ 25
Consolidated Statement of Changes in Equity ................................................................................................................ 26
Notes to the Consolidated Financial Report.................................................................................................................... 27 1. Introduction ........................................................................................................................................................................ 27 2. Other Significant Accounting Policies ................................................................................................................................. 28 3. Revenue and Other Income................................................................................................................................................ 29 4. Expenses ........................................................................................................................................................................... 31 5. Taxation ............................................................................................................................................................................. 33 6. Cash and Cash Equivalents ............................................................................................................................................... 37 7. Term Deposits and Subordinated Notes ............................................................................................................................. 38 8. Financial Assets Held for Trading ....................................................................................................................................... 38 9. Trade and Other Receivables ............................................................................................................................................. 38 10. Inventories ......................................................................................................................................................................... 39 11. Derivative Financial Assets................................................................................................................................................. 40 12. Interests in Subsidiaries ..................................................................................................................................................... 40 13. Property, Plant and Equipment ........................................................................................................................................... 42 14. Right-of-use Assets ............................................................................................................................................................ 44 15. Deferred Acquisition, Exploration and Evaluation Costs ..................................................................................................... 44 16. Mine Properties .................................................................................................................................................................. 45 17. Impairment of Non-Current Assets ..................................................................................................................................... 47 18. Trade and Other Payables ................................................................................................................................................. 48 19. Interest-Bearing Loans and Borrowings .............................................................................................................................. 48 20. Derivative Financial Liabilities ............................................................................................................................................. 49 21. Provisions .......................................................................................................................................................................... 50 22. Issued Capital .................................................................................................................................................................... 52 23. Reserves ............................................................................................................................................................................ 53 24. Accumulated Losses .......................................................................................................................................................... 54 25. Expenditure Commitments ................................................................................................................................................. 54 26. Share-Based Payment Plans .............................................................................................................................................. 55 27. Earnings Per Share ............................................................................................................................................................ 57 28. Dividends Paid and Proposed ............................................................................................................................................ 58 29. Contingent Liabilities .......................................................................................................................................................... 58 30. Key Management Personnel .............................................................................................................................................. 58 31. Related Party Transactions ................................................................................................................................................ 59 32. Auditor’s Remuneration ...................................................................................................................................................... 59 33. Segment Information .......................................................................................................................................................... 60 34. Events After the Balance Sheet Date ................................................................................................................................. 63 35. Financial Instruments ......................................................................................................................................................... 63 36. Parent Entity Information .................................................................................................................................................... 71 37. New and Amended Accounting Standards and Interpretations ........................................................................................... 73
Directors’ Declaration ..................................................................................................................................................... 76
Independent Audit Report .............................................................................................................................................. 77

Mount Gibson Iron Limited – 30 June 2021 Financial Report Page 2
Directors’ Report Your Directors submit their report for the year ended 30 June 2021 for Mount Gibson Iron Limited (Company or Mount Gibson) and the consolidated group incorporating the entities that it controlled during the financial year (Group).
DIRECTORS
The names and details of the Company’s Directors in office during the financial period and until the date of this report are set out below. Directors were in office for the entire period unless otherwise stated.
Names, Qualifications, Experience and Special Responsibilities
Lee Seng Hui LLB (Hons) Chairman, Non-Executive Director
Mr Lee was appointed as a Non-Executive Director on 29 January 2010, Non-Executive Deputy Chairman on 14 December 2012, and Chairman on 18 February 2014. Mr Lee graduated with Honours from the University of Sydney Law School. Mr Lee is the Chief Executive and an Executive Director of Allied Group Limited which is listed on the Hong Kong Stock Exchange. He is also the Chairman and a Non-Executive Director of Tian An China Investments Company Limited, and a Non-Executive Director of APAC Resources Limited, one of Mount Gibson’s substantial shareholders. Mr Lee was previously the Chairman and a Non-Executive Director of Asiasec Properties Limited. Mr Lee has not served as a director of any other ASX or Hong Kong listed companies during the past three years. Alan Jones CA Independent Non-Executive Director
Mr Jones was appointed as an Independent Non-Executive Director on 28 July 2006 and is the current Chairman of the Nomination, Remuneration and Governance Committee. Mr Jones is a Chartered Accountant with extensive senior management and board experience in listed and unlisted Australian public companies, particularly in the construction, engineering, finance and investment industries. Mr Jones has been involved in the successful merger and acquisition of a number of public companies in Australia and internationally. He is a Non-Executive Director of Mulpha Australia Ltd, Sun Hung Kai & Co Ltd (Hong Kong), Allied Group Ltd (Hong Kong), Allied Properties (H.K.) Limited and Air Change International Limited. Ding Rucai Non-Executive Director
Mr Ding was appointed to the Board on 12 December 2019. Mr Ding is the Chairman and executive director of Hong Kong listed Shougang Fushan Resources Group Limited (“Shougang Fushan”). Shougang Fushan is Mount Gibson’s second largest shareholder with a 13.8% shareholding. Shougang Fushan also holds a 17.6% share interest in APAC Resources Limited, Mount Gibson’s largest shareholder with a 36.3% shareholding. Mr. Ding is also a director of Shougang Holding (Hong Kong) Limited, a company wholly owned by Shougang Group Co., Ltd (“Shougang Group”). A senior engineer with a doctoral degree in ferrous metallurgy from the University of Science and Technology Beijing, Mr Ding has more than 30 years’ experience in the steel and coal resources industry, having held a variety of senior management and executive roles since joining the Shougang Group in 1989. Russell Barwick Dip.Min.Eng., FAICD, FAusIMM Independent Non-Executive Director
Mr Barwick was appointed as an Independent Non-Executive Director on 16 November 2011 and is Chairman of the Operational Risk and Sustainability Committee. Mr Barwick is a mining engineer with 45 years of technical, operational, managerial and corporate experience in international mining companies covering various commodities. He has worked for Bougainville Copper Limited (CRA), Pancontinental Mining Ltd (Jabiluka Uranium) and CSR Limited (coal). He has spent 16 years with Placer Dome Asia Pacific in key development, operational and corporate roles in numerous countries culminating in his appointment as Managing Director of Placer Niugini Ltd. He then served as Managing Director of Newcrest Mining Limited (2000 to 2001). For the four years to the end of 2006, Mr Barwick was the Chief Operating Officer of Wheaton River Minerals Ltd and Goldcorp Inc., based in Vancouver, Canada. He was subsequently the Chief Executive Officer of Canada-based Gammon Gold Inc. before returning to Australia in 2008. His extensive geographic and corporate mining experience ranges from: Latin America, North America, Europe, Africa and Asia Pacific. He is currently the Chairman of ASX-listed Red Metal Ltd, a non-executive director of ASX-listed Regis Resources Ltd and of ASX-listed Lithium Power International and its unlisted associate Minera Salar Blanco S.A. (Chile). Simon Bird B.Acc.Science (Hons) CA, FCPA, FAICD Lead Independent Non-Executive Director
Mr Bird was appointed as an Independent Non-Executive Director on 23 February 2012. Mr Bird is the Lead Independent Director and Chairman of the Audit and Financial Risk Management Committee. Mr Bird has over 30 years of international corporate experience, including holding the positions of General Manager Finance at Stockland Limited, Chief Financial Officer of GrainCorp Limited, and Chief Financial Officer of Wizard Mortgage Corporation. He was also Chief Executive Officer of ASX-listed King Island Scheelite Limited, a former Managing Director of ASX-listed Sovereign Gold Limited, a former Chairman of ASX-listed Rawson Resources Limited and ASX-listed Tubi Group and a former Director of CPA Australia Limited. Mr Bird is a Director of ASX-listed Pacific American Holdings Limited.
Mount Gibson Iron Limited – 30 June 2021 Financial Report Page 3
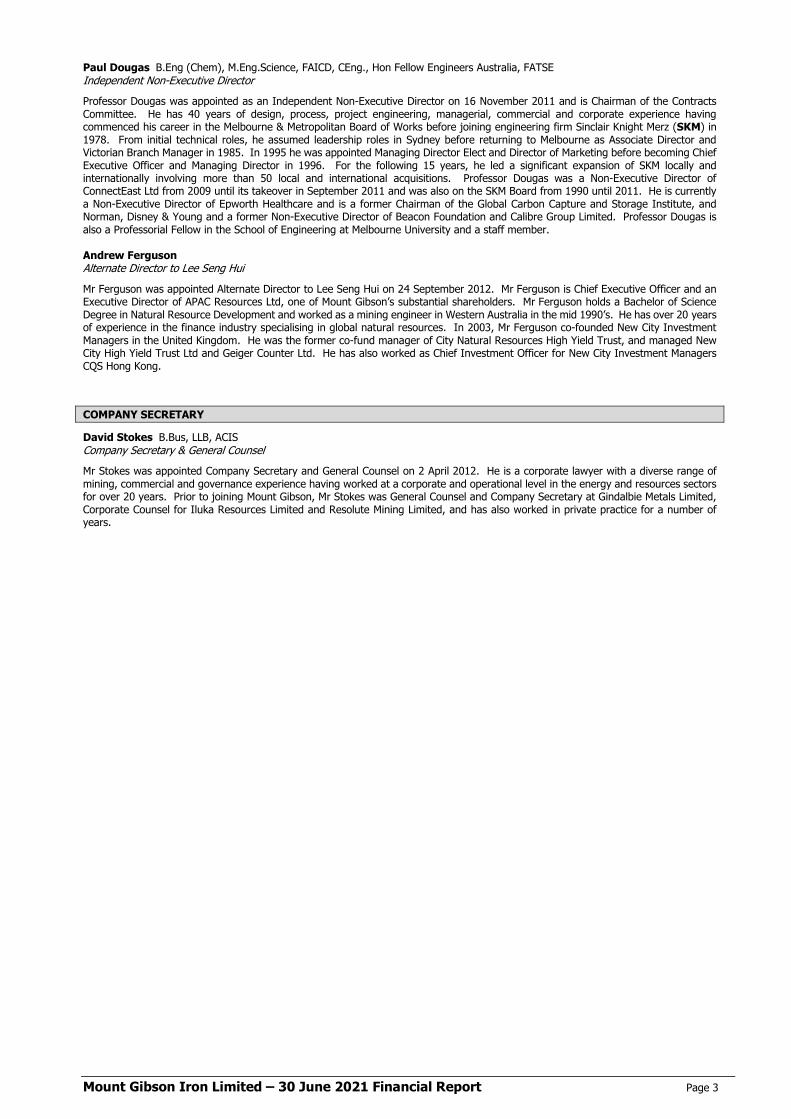
Paul Dougas B.Eng (Chem), M.Eng.Science, FAICD, CEng., Hon Fellow Engineers Australia, FATSE Independent Non-Executive Director
Professor Dougas was appointed as an Independent Non-Executive Director on 16 November 2011 and is Chairman of the Contracts Committee. He has 40 years of design, process, project engineering, managerial, commercial and corporate experience having commenced his career in the Melbourne & Metropolitan Board of Works before joining engineering firm Sinclair Knight Merz (SKM) in 1978. From initial technical roles, he assumed leadership roles in Sydney before returning to Melbourne as Associate Director and Victorian Branch Manager in 1985. In 1995 he was appointed Managing Director Elect and Director of Marketing before becoming Chief Executive Officer and Managing Director in 1996. For the following 15 years, he led a significant expansion of SKM locally and internationally involving more than 50 local and international acquisitions. Professor Dougas was a Non-Executive Director of ConnectEast Ltd from 2009 until its takeover in September 2011 and was also on the SKM Board from 1990 until 2011. He is currently a Non-Executive Director of Epworth Healthcare and is a former Chairman of the Global Carbon Capture and Storage Institute, and Norman, Disney & Young and a former Non-Executive Director of Beacon Foundation and Calibre Group Limited. Professor Dougas is also a Professorial Fellow in the School of Engineering at Melbourne University and a staff member. Andrew Ferguson Alternate Director to Lee Seng Hui
Mr Ferguson was appointed Alternate Director to Lee Seng Hui on 24 September 2012. Mr Ferguson is Chief Executive Officer and an Executive Director of APAC Resources Ltd, one of Mount Gibson’s substantial shareholders. Mr Ferguson holds a Bachelor of Science Degree in Natural Resource Development and worked as a mining engineer in Western Australia in the mid 1990’s. He has over 20 years of experience in the finance industry specialising in global natural resources. In 2003, Mr Ferguson co-founded New City Investment Managers in the United Kingdom. He was the former co-fund manager of City Natural Resources High Yield Trust, and managed New City High Yield Trust Ltd and Geiger Counter Ltd. He has also worked as Chief Investment Officer for New City Investment Managers CQS Hong Kong.
COMPANY SECRETARY
David Stokes B.Bus, LLB, ACIS Company Secretary & General Counsel
Mr Stokes was appointed Company Secretary and General Counsel on 2 April 2012. He is a corporate lawyer with a diverse range of mining, commercial and governance experience having worked at a corporate and operational level in the energy and resources sectors for over 20 years. Prior to joining Mount Gibson, Mr Stokes was General Counsel and Company Secretary at Gindalbie Metals Limited, Corporate Counsel for Iluka Resources Limited and Resolute Mining Limited, and has also worked in private practice for a number of years.
Mount Gibson Iron Limited – 30 June 2021 Financial Report Page 4
CORPORATE INFORMATION
Corporate Structure
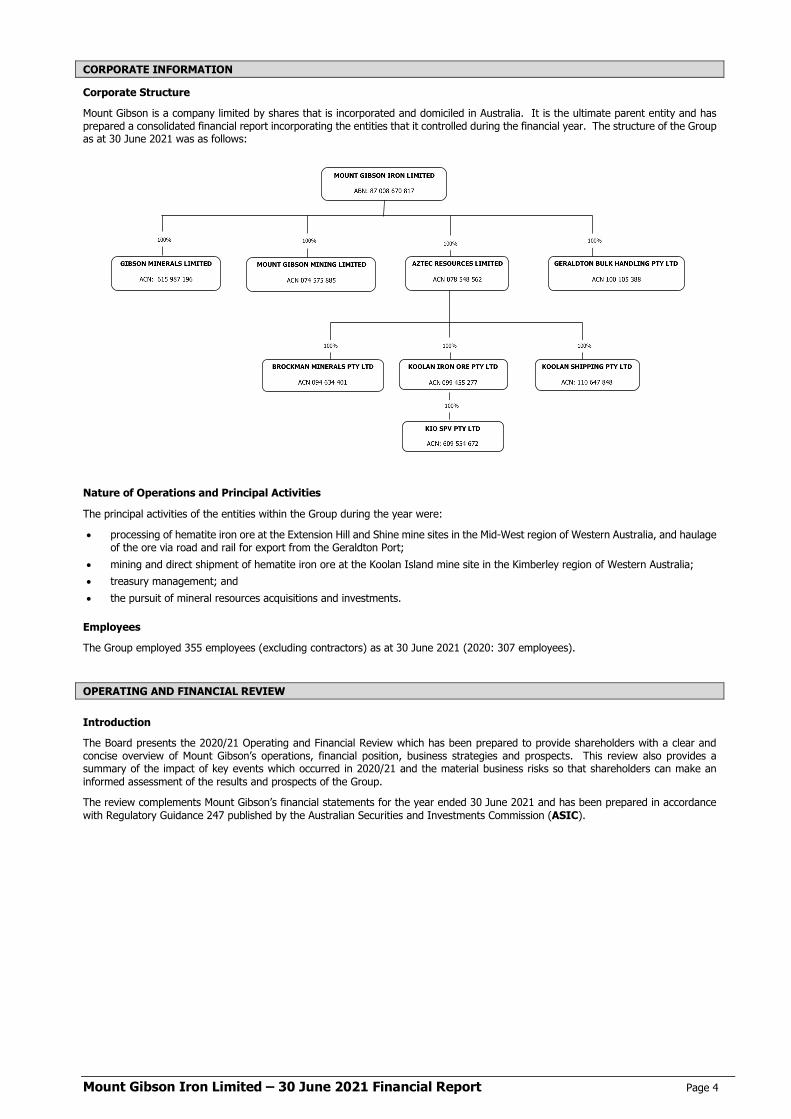
Mount Gibson is a company limited by shares that is incorporated and domiciled in Australia. It is the ultimate parent entity and has prepared a consolidated financial report incorporating the entities that it controlled during the financial year. The structure of the Group as at 30 June 2021 was as follows:
Nature of Operations and Principal Activities
The principal activities of the entities within the Group during the year were:
• processing of hematite iron ore at the Extension Hill and Shine mine sites in the Mid-West region of Western Australia, and haulage of the ore via road and rail for export from the Geraldton Port;
• mining and direct shipment of hematite iron ore at the Koolan Island mine site in the Kimberley region of Western Australia; • treasury management; and • the pursuit of mineral resources acquisitions and investments.
Employees
The Group employed 355 employees (excluding contractors) as at 30 June 2021 (2020: 307 employees).
OPERATING AND FINANCIAL REVIEW
Introduction
The Board presents the 2020/21 Operating and Financial Review which has been prepared to provide shareholders with a clear and concise overview of Mount Gibson’s operations, financial position, business strategies and prospects. This review also provides a summary of the impact of key events which occurred in 2020/21 and the material business risks so that shareholders can make an informed assessment of the results and prospects of the Group.
The review complements Mount Gibson’s financial statements for the year ended 30 June 2021 and has been prepared in accordance with Regulatory Guidance 247 published by the Australian Securities and Investments Commission (ASIC).

Mount Gibson Iron Limited – 30 June 2021 Financial Report Page 5
Overview of the 2020/21 Financial Year
The Company delivered a steady financial performance for the year ended 30 June 2021, with elevated iron ore prices partly offsetting disruption associated with adverse weather events and geotechnical challenges at Koolan Island in the Kimberley and changing travel and operating restrictions necessitated by the Coronavirus (COVID-19) global pandemic. The financial focus in the year was the Company’s substantial capital investment program to enable growing sales and cashflows in future years. At Koolan Island, the focus was progressing the bulk waste stripping program and cutback of Main Pit while commencing remedial upper footwall support works and a major crushing circuit upgrade, all of which are intended to facilitate increased ore production, sales and cashflow from the second half of financial year 2021/22 onwards. In the Mid-West, the focus in the first half of the year was on completing the successful sale of recoverable low-grade material from the Extension Hill deposit and progressing the site to closure. In the second half, the focus was to substantially complete development of the Shine Iron Ore Project to commence ore sales in the September quarter of 2021. The Company also continued to carefully manage the Group’s treasury reserves. The Group recorded a net profit before tax of $92,133,000 and a net profit after tax of $64,006,000.
The Company’s performance was assisted by continued strong iron ore prices over the year. At the beginning of the financial year, the Platts Index for delivery of 62% Fe iron ore fines to northern China was approximately US$101 per dry metric tonne (dmt), reflecting the continued impacts of supply disruption in Brazil and rapid demand growth in China as it recovered from the COVID-19 pandemic. The price progressively rose over the remainder of the year, peaking at US$233/dmt in May 2021, ending the year at US$218/dmt to average US$154/dmt for the twelve month period. The price of 65% Fe grade ore averaged US$174/dmt for the year, reflecting an average grade-adjusted premium to the Platts 62% Fe Index of approximately 8%, while ores grading 58% Fe averaged US$128/dmt, reflecting an average discount of approximately 11%.
Higher prices were negatively offset by a significantly stronger Australia dollar, which averaged A$1.00/US$0.747 over the year (from US$0.66 the prior year) reflecting Australia’s economic recovery from the early stages of the global pandemic.
Group ore sales for the year totalled 3.0 million wet metric tonnes (Mwmt) consistent with guidance. Sales revenue totalled $327,698,000 including shipping freight services and provisional pricing adjustments, and $309,623,000 on a Free on Board (FOB) basis (excluding shipping freight services), before $2,029,000 of realised gains from foreign exchange hedging and commodity collar option contracts.
Mount Gibson achieved an average realised price for all products sold in the year (including realised foreign exchange hedging and commodity forward contract net gains) of $103/wmt Free on Board (FOB), net of shipping freight, compared with $84/wmt FOB in 2019/20. This reflected the sale of high grade ore from Koolan Island and lower grade material from the Mid-West in the first half of the financial year, followed by the reduced volumes and grades from Koolan Island in the second half of the financial year as the waste stripping program progressed and access to high grade ore from Main Pit remained restricted. Sales from Koolan Island realised an average price of US$104/dmt FOB for the year. All sales from the Mid-West comprised stockpiled low-grade material from Extension Hill, which was sold on a fixed price basis and realised an average price of US$30/dmt FOB for fines and US$43/dmt FOB for lump.
The total cost of sales for the year was $214,830,000 including royalties and shipping freight costs. On an FOB basis, excluding shipping freight, the total cost of sales was $196,755,000 which equated to $65/wmt sold, compared with $60/wmt sold in the prior financial year. This increase primarily reflected higher costs at Koolan Island due to elevated waste stripping requirements and additional costs associated with disruption from wet weather, restricted mining access to high grade ore in Main Pit and the impact of COVID-19 restrictions on operating efficiencies and labour availability.
Total cash reserves, comprising cash and cash equivalents, term deposits and subordinated notes, financial assets held for trading and derivative financial assets, decreased by $59,059,000 over the year to a total of $364,723,000 as at 30 June 2021.
COVID-19 Business Response
From early March 2020, the COVID-19 global pandemic necessitated significant and evolving responses by industry and government to slow the transmission rate of the virus, including restrictions on the movement of people into and within Australia, and strict social distancing requirements. These measures particularly impacted availability of labour from interstate, necessitating a freeze on interstate recruitment. While normal fly-in-fly-out (FIFO) rosters and travel within WA resumed from mid 2020, Mount Gibson continues to maintain a range of general site and travel protocols to reduce the risk of virus transmission and stands ready to respond promptly in the event of any reinstatement of government restrictions. This readiness was demonstrated in the March and June quarters during which the Western Australian Government initiated three brief lockdowns in the Perth and Peel metropolitan region of the State following reported cases of community transmission. This included the reinstatement of certain regional travel restrictions, mandatory mask-wearing requirements and site social distancing protocols. These restrictions, in particular the interstate border and quarantine restrictions applying to FIFO personnel, reduced the availability of skilled personnel and resulted in some disruption to Mount Gibson’s operating activities.
Mount Gibson personnel have responded positively to changing circumstances throughout the pandemic and no instances of COVID-19 were reported at any Mount Gibson workplaces during the reporting period.
Operating Results for the Financial Year
The summarised operating results for the Group for the year ended 30 June 2021 are tabulated below:
Year ended: 30 June 2021 30 June 2020 30 June 2019 30 June 2018 30 June 2017
Net profit before tax $’000 92,133 120,717 70,462 99,129 24,841
Taxation (expense)/benefit $’000 (28,127) (36,519) 62,907 - 1,481
Net profit after tax $’000 64,006 84,198 133,369 99,129 26,322
Earnings per share cents/share 5.46 7.35 11.98 9.08 2.41
Mount Gibson Iron Limited – 30 June 2021 Financial Report Page 6
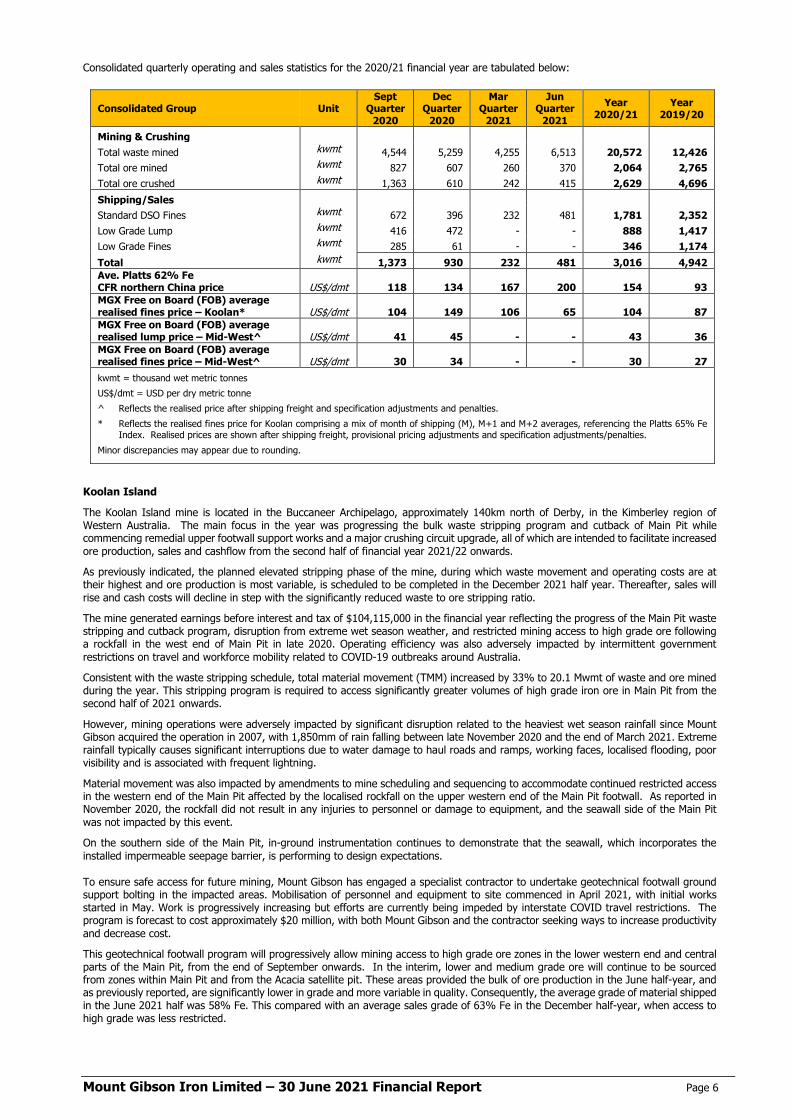
Consolidated quarterly operating and sales statistics for the 2020/21 financial year are tabulated below:
Consolidated Group Unit Sept
Quarter 2020
Dec Quarter
2020
Mar Quarter
2021
Jun Quarter
2021 Year
2020/21 Year
2019/20
Mining & Crushing Total waste mined kwmt 4,544 5,259 4,255 6,513 20,572 12,426 Total ore mined kwmt 827 607 260 370 2,064 2,765 Total ore crushed kwmt 1,363 610 242 415 2,629 4,696 Shipping/Sales Standard DSO Fines kwmt 672 396 232 481 1,781 2,352 Low Grade Lump kwmt 416 472 - - 888 1,417 Low Grade Fines kwmt 285 61 - - 346 1,174 Total kwmt 1,373 930 232 481 3,016 4,942 Ave. Platts 62% Fe CFR northern China price US$/dmt 118 134 167 200 154 93 MGX Free on Board (FOB) average realised fines price – Koolan* US$/dmt 104 149 106 65 104 87 MGX Free on Board (FOB) average realised lump price – Mid-West^ US$/dmt 41 45 - - 43 36 MGX Free on Board (FOB) average realised fines price – Mid-West^ US$/dmt 30 34 - - 30 27 kwmt = thousand wet metric tonnes US$/dmt = USD per dry metric tonne ^ Reflects the realised price after shipping freight and specification adjustments and penalties. * Reflects the realised fines price for Koolan comprising a mix of month of shipping (M), M+1 and M+2 averages, referencing the Platts 65% Fe
Index. Realised prices are shown after shipping freight, provisional pricing adjustments and specification adjustments/penalties. Minor discrepancies may appear due to rounding.
Koolan Island
The Koolan Island mine is located in the Buccaneer Archipelago, approximately 140km north of Derby, in the Kimberley region of Western Australia. The main focus in the year was progressing the bulk waste stripping program and cutback of Main Pit while commencing remedial upper footwall support works and a major crushing circuit upgrade, all of which are intended to facilitate increased ore production, sales and cashflow from the second half of financial year 2021/22 onwards.
As previously indicated, the planned elevated stripping phase of the mine, during which waste movement and operating costs are at their highest and ore production is most variable, is scheduled to be completed in the December 2021 half year. Thereafter, sales will rise and cash costs will decline in step with the significantly reduced waste to ore stripping ratio.
The mine generated earnings before interest and tax of $104,115,000 in the financial year reflecting the progress of the Main Pit waste stripping and cutback program, disruption from extreme wet season weather, and restricted mining access to high grade ore following a rockfall in the west end of Main Pit in late 2020. Operating efficiency was also adversely impacted by intermittent government restrictions on travel and workforce mobility related to COVID-19 outbreaks around Australia.
Consistent with the waste stripping schedule, total material movement (TMM) increased by 33% to 20.1 Mwmt of waste and ore mined during the year. This stripping program is required to access significantly greater volumes of high grade iron ore in Main Pit from the second half of 2021 onwards.
However, mining operations were adversely impacted by significant disruption related to the heaviest wet season rainfall since Mount Gibson acquired the operation in 2007, with 1,850mm of rain falling between late November 2020 and the end of March 2021. Extreme rainfall typically causes significant interruptions due to water damage to haul roads and ramps, working faces, localised flooding, poor visibility and is associated with frequent lightning.
Material movement was also impacted by amendments to mine scheduling and sequencing to accommodate continued restricted access in the western end of the Main Pit affected by the localised rockfall on the upper western end of the Main Pit footwall. As reported in November 2020, the rockfall did not result in any injuries to personnel or damage to equipment, and the seawall side of the Main Pit was not impacted by this event.
On the southern side of the Main Pit, in-ground instrumentation continues to demonstrate that the seawall, which incorporates the installed impermeable seepage barrier, is performing to design expectations.
To ensure safe access for future mining, Mount Gibson has engaged a specialist contractor to undertake geotechnical footwall ground support bolting in the impacted areas. Mobilisation of personnel and equipment to site commenced in April 2021, with initial works started in May. Work is progressively increasing but efforts are currently being impeded by interstate COVID travel restrictions. The program is forecast to cost approximately $20 million, with both Mount Gibson and the contractor seeking ways to increase productivity and decrease cost.
This geotechnical footwall program will progressively allow mining access to high grade ore zones in the lower western end and central parts of the Main Pit, from the end of September onwards. In the interim, lower and medium grade ore will continue to be sourced from zones within Main Pit and from the Acacia satellite pit. These areas provided the bulk of ore production in the June half-year, and as previously reported, are significantly lower in grade and more variable in quality. Consequently, the average grade of material shipped in the June 2021 half was 58% Fe. This compared with an average sales grade of 63% Fe in the December half-year, when access to high grade was less restricted.
Mount Gibson Iron Limited – 30 June 2021 Financial Report Page 7
Ore production totalled 1.4 Mwmt in the year, while sales totalled 1.8 Mwmt consistent with guidance. The majority of the final shipment for the year was loaded at year end and is included in the annual sales. The average grade of ore shipped for the year was 61% Fe.
As previously indicated, production and sales will be limited to blended lower and medium grade material until the upper footwall geotechnical works have progressed to facilitate the safe mining of high grade iron ore in the western end of the Main Pit. This mining is scheduled for the December quarter.
In addition to the Company’s significant investment in waste stripping, which totalled $138,233,000 in the year, and the ongoing footwall support program, Mount Gibson is also part-way through a major upgrade of the mine’s processing plant. The first stage of the upgrade commenced in March and was completed in May, with the second final stage on track for completion in the December quarter. The existing crushing plant is being maintained to handle the forecast near-term volumes. The total capital investment for the project is estimated at $20-25 million, of which $11,430,000 was invested to the end of the financial year. The upgrade will ensure the crushing circuit is capable of processing the significantly increased high grade ore throughput scheduled to occur from later this year onwards.
Reflective of the above factors, the average cash cost of sales was $70/wmt FOB for the year. Cash costs are stated before the capitalised waste investment and $22,363,000 invested in various capital improvement projects, including the processing plant upgrade, upper footwall ground support program and completion of the site’s new jet-suitable airstrip. Direct FIFO flights from Perth utilising Fokker 100 jet aircraft commenced in October 2020.
The planned elevated stripping phase of the mine, during which overburden movement and operating costs are at their highest and ore production is at its lowest, is scheduled to be substantially completed over the second half of calendar 2021. Thereafter, sales are anticipated to rise and cash costs to decline in step with the significantly reduced waste to ore stripping ratio.
Exploration and Resource Development
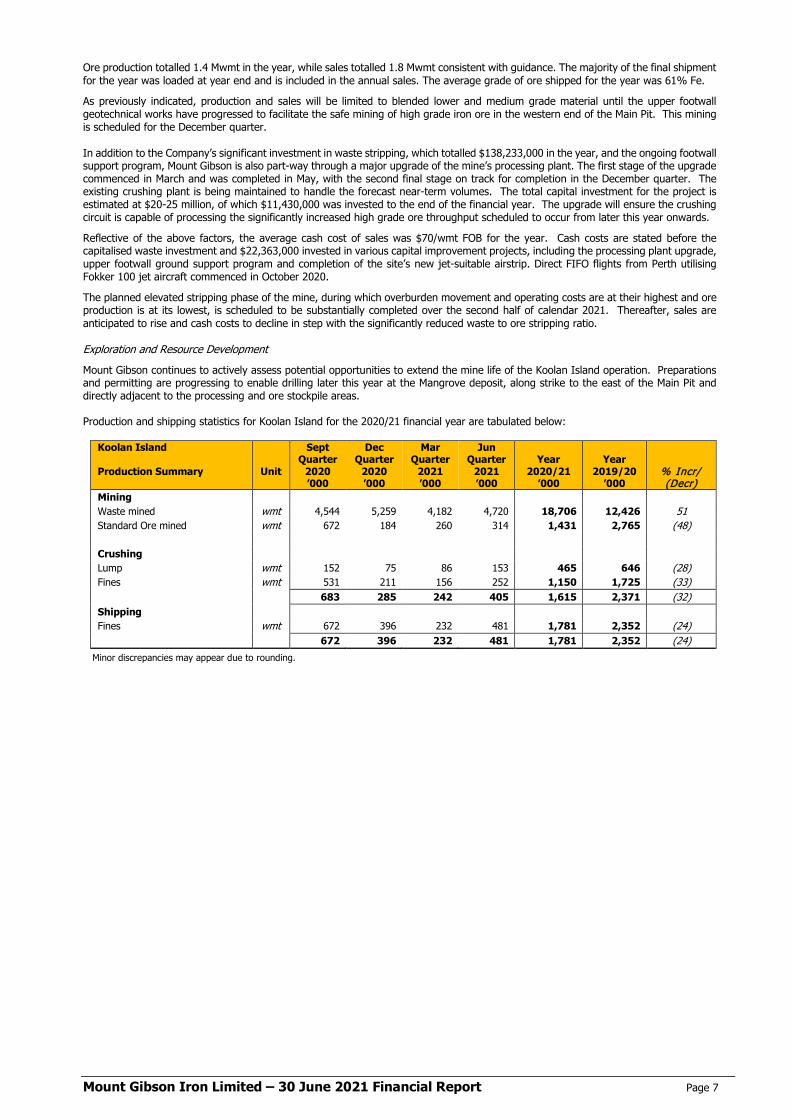
Mount Gibson continues to actively assess potential opportunities to extend the mine life of the Koolan Island operation. Preparations and permitting are progressing to enable drilling later this year at the Mangrove deposit, along strike to the east of the Main Pit and directly adjacent to the processing and ore stockpile areas. Production and shipping statistics for Koolan Island for the 2020/21 financial year are tabulated below:
Koolan Island Production Summary
Unit
Sept Quarter
2020 ’000
Dec Quarter
2020 ’000
Mar Quarter
2021 ’000
Jun Quarter
2021 ’000
Year
2020/21 ’000
Year
2019/20 ’000
% Incr/ (Decr)
Mining Waste mined wmt 4,544 5,259 4,182 4,720 18,706 12,426 51 Standard Ore mined wmt 672 184 260 314 1,431 2,765 (48) Crushing Lump wmt 152 75 86 153 465 646 (28) Fines wmt 531 211 156 252 1,150 1,725 (33) 683 285 242 405 1,615 2,371 (32) Shipping Fines wmt 672 396 232 481 1,781 2,352 (24) 672 396 232 481 1,781 2,352 (24)
Minor discrepancies may appear due to rounding.
Mount Gibson Iron Limited – 30 June 2021 Financial Report Page 8
Mid-West Operations - Extension Hill/Shine
The Mid-West operations comprise the recently closed Extension Hill mine, the Shine mine and the Company’s bulk storage and export facilities at the port of Geraldton.
The Mid-West operations generated earnings before interest and tax of $19,542,000 for the financial year.
Extension Hill
The low-grade sales program from Extension Hill was successfully completed in late December 2020 and rehabilitation of the Extension Hill site is now well advanced in line with the mine closure plan, while redeployment of site personnel and equipment to the Shine mine has been undertaken where appropriate.
Sales totaling 1.2 Mwmt for the financial year were at the upper end of guidance and comprised 0.3 Mwmt of low-grade fines and 0.9 Mwmt of low-grade lump material taken from the last remaining stockpiles at the site, and also from recoverable low-grade detrital gravels adjacent to the Extension Hill pit.
The Extension Hill operation generated earnings before interest and tax of $20,907,000 in the year. Cashflow for the year totalled $10 million, excluding proceeds from the rail credit refund.
The average cash cost of sales during the first half while shipments were occurring was $40/wmt FOB, at the lower end of guidance, compared with $41/wmt FOB in the 2019/20 financial year.
Mount Gibson commenced the low-grade (51-54% Fe) sales program from Extension Hill in June 2019 with an initial sales target of approximately 1 Mwmt. Following that time, stronger iron ore prices supported extensions to the program which resulted in total sales of approximately 4.1 Mwmt for operating cashflows of over $30 million.
The accounting provision for rehabilitation of the Extension Hill mine site was $9,797,000 million at 30 June 2020 and, reflecting the activities completed to date, has reduced to $5,733,000 as at 30 June 2021.
Infrastructure remaining on site includes the crushing plant and accommodation camp. Expressions of interest have been received from various parties regarding the site and the remaining assets, which could offset future rehabilitation costs.
Shine
The Shine mine is located approximately 85km north of the now-closed Extension Hill mine. Shine has an initial Ore Reserve1 of 2.8Mt grading 59.4% Fe in the proposed “Stage 1” pit. Annual production is forecast at approximately 1.5 Mwmt over an initial two-year period. Should market conditions remain supportive, there is potential to extend the life of the Shine operation for a further two years by proceeding with a “Stage 2” pit, based on Measured and Indicated Mineral Resources within the modelled pit shells. The Shine project has total Measured, Indicated and Inferred Hematite Resources1 of 10.8Mt grading 58.2% Fe.
Clearing of the Shine open pit footprint was completed in February followed by the commencement of blasting and mining of overburden in late March 2021. First ore was mined and stockpiled in early April. Total material movement amounted to 1.9 Mwmt since the commencement of mining, including approximately 55,000 wmt of sales-grade ore.
Site construction activities are largely complete, including installation and commissioning of the administration and workshop facilities and the commissioning of electrical and water supplies. Approximately 10,000 wmt of crushed lump ore was stockpiled at year end following start-up and commissioning of the crushing plant in late June.
Mount Gibson is self-performing mining activities at the Shine Project consistent with its current and prior operations in the Mid-West and Kimberley regions. Crushing and stockpiling is being undertaken by a specialist crushing services provider.
Ore is initially being road hauled from Shine approximately 300km to Mount Gibson’s ore storage and loadout facilities at Geraldton Port. Mount Gibson is seeking to recommission its existing Ruvidini rail siding at the town of Mullewa which will facilitate a reduced road haul distance from Shine and a rail journey for the remaining 100km to Geraldton Port. Mount Gibson established the Ruvidini siding for its nearby Tallering Peak mine which closed in 2014 after ten years of operation, with access for Shine material requiring some road and rail crossing modifications.
Current trucking activities will progressively increase over coming months as drivers and trucks become available in a tight market for trucking contractors.
Mount Gibson is targeting its first shipment from Geraldton Port in August, following the buildup of stocks.
Capital development and pre-production expenditure at Shine during the 2020/21 financial year totaled $28,859,000, consistent with guidance.
Mount Gibson anticipates cost pressures during the initial trucking-only phase, notably while haulage volumes rise towards the targeted 1.5Mtpa rate.
Now that production is underway, and as a condition of the original purchase of Shine in 2013, Mount Gibson is obliged to make a number of vendor payments totalling $4.5 million within the next 6-12 months. The first of these, payable upon the initial shipment, is a deferred purchase payment of $3 million. In addition, Mount Gibson is obligated to pay a price participation royalty of A$0.20/dmt of ore sold for every A$1/dmt the 62% Fe index price trades above the equivalent of A$115/dmt CFR. The $3 million deferred purchase payment is offset against this royalty.
1 Refer ASX release dated 9 October 2020, and Competent Person attributions at the end of this report.
Mount Gibson Iron Limited – 30 June 2021 Financial Report Page 9
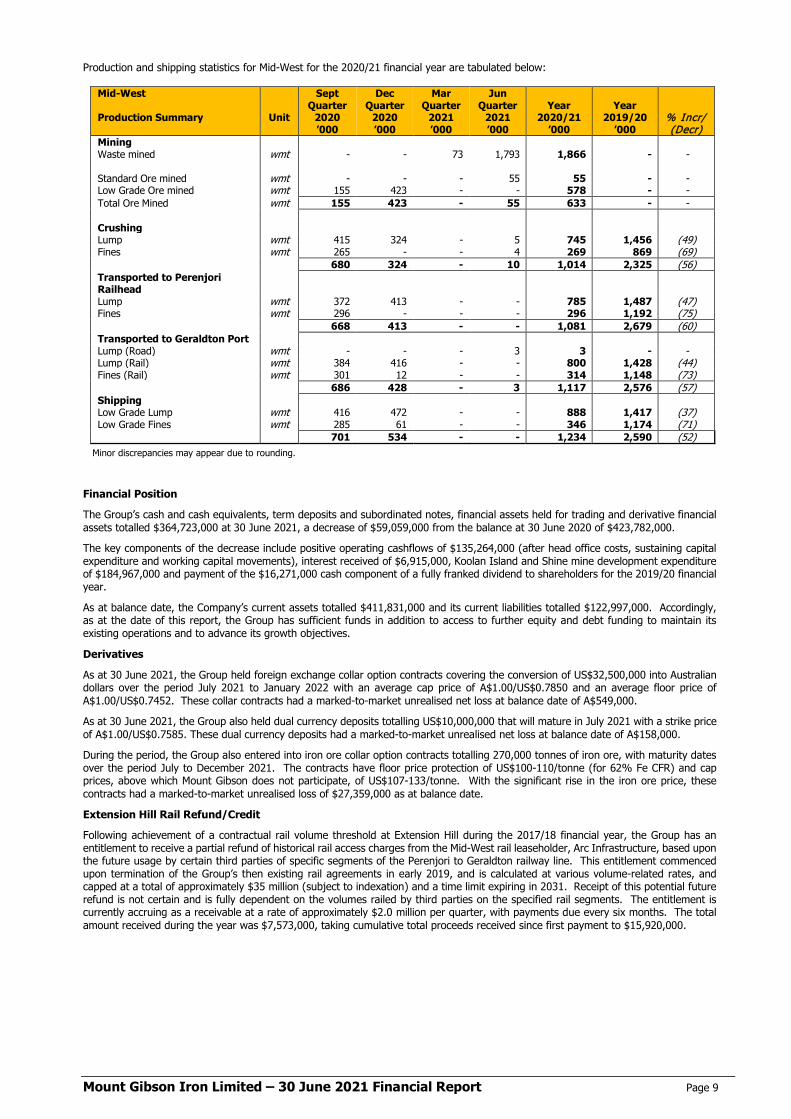
Production and shipping statistics for Mid-West for the 2020/21 financial year are tabulated below:
Mid-West Production Summary
Unit
Sept Quarter
2020 ’000
Dec Quarter
2020 ’000
Mar Quarter
2021 ’000
Jun Quarter
2021 ’000
Year
2020/21 ’000
Year
2019/20 ’000
% Incr/ (Decr)
Mining Waste mined wmt - - 73 1,793 1,866 - - Standard Ore mined wmt - - - 55 55 - - Low Grade Ore mined wmt 155 423 - - 578 - - Total Ore Mined wmt 155 423 - 55 633 - - Crushing Lump wmt 415 324 - 5 745 1,456 (49) Fines wmt 265 - - 4 269 869 (69) 680 324 - 10 1,014 2,325 (56) Transported to Perenjori Railhead
Lump wmt 372 413 - - 785 1,487 (47) Fines wmt 296 - - - 296 1,192 (75) 668 413 - - 1,081 2,679 (60) Transported to Geraldton Port Lump (Road) wmt - - - 3 3 - - Lump (Rail) wmt 384 416 - - 800 1,428 (44) Fines (Rail) wmt 301 12 - - 314 1,148 (73) 686 428 - 3 1,117 2,576 (57) Shipping Low Grade Lump wmt 416 472 - - 888 1,417 (37) Low Grade Fines wmt 285 61 - - 346 1,174 (71) 701 534 - - 1,234 2,590 (52)
Minor discrepancies may appear due to rounding.
Financial Position
The Group’s cash and cash equivalents, term deposits and subordinated notes, financial assets held for trading and derivative financial assets totalled $364,723,000 at 30 June 2021, a decrease of $59,059,000 from the balance at 30 June 2020 of $423,782,000.
The key components of the decrease include positive operating cashflows of $135,264,000 (after head office costs, sustaining capital expenditure and working capital movements), interest received of $6,915,000, Koolan Island and Shine mine development expenditure of $184,967,000 and payment of the $16,271,000 cash component of a fully franked dividend to shareholders for the 2019/20 financial year.
As at balance date, the Company’s current assets totalled $411,831,000 and its current liabilities totalled $122,997,000. Accordingly, as at the date of this report, the Group has sufficient funds in addition to access to further equity and debt funding to maintain its existing operations and to advance its growth objectives.
Derivatives
As at 30 June 2021, the Group held foreign exchange collar option contracts covering the conversion of US$32,500,000 into Australian dollars over the period July 2021 to January 2022 with an average cap price of A$1.00/US$0.7850 and an average floor price of A$1.00/US$0.7452. These collar contracts had a marked-to-market unrealised net loss at balance date of A$549,000.
As at 30 June 2021, the Group also held dual currency deposits totalling US$10,000,000 that will mature in July 2021 with a strike price of A$1.00/US$0.7585. These dual currency deposits had a marked-to-market unrealised net loss at balance date of A$158,000.
During the period, the Group also entered into iron ore collar option contracts totalling 270,000 tonnes of iron ore, with maturity dates over the period July to December 2021. The contracts have floor price protection of US$100-110/tonne (for 62% Fe CFR) and cap prices, above which Mount Gibson does not participate, of US$107-133/tonne. With the significant rise in the iron ore price, these contracts had a marked-to-market unrealised loss of $27,359,000 as at balance date.
Extension Hill Rail Refund/Credit
Following achievement of a contractual rail volume threshold at Extension Hill during the 2017/18 financial year, the Group has an entitlement to receive a partial refund of historical rail access charges from the Mid-West rail leaseholder, Arc Infrastructure, based upon the future usage by certain third parties of specific segments of the Perenjori to Geraldton railway line. This entitlement commenced upon termination of the Group’s then existing rail agreements in early 2019, and is calculated at various volume-related rates, and capped at a total of approximately $35 million (subject to indexation) and a time limit expiring in 2031. Receipt of this potential future refund is not certain and is fully dependent on the volumes railed by third parties on the specified rail segments. The entitlement is currently accruing as a receivable at a rate of approximately $2.0 million per quarter, with payments due every six months. The total amount received during the year was $7,573,000, taking cumulative total proceeds received since first payment to $15,920,000.
Mount Gibson Iron Limited – 30 June 2021 Financial Report Page 10
Likely Developments and Expected Results
Mount Gibson’s overall objective is to maintain and grow long-term profitability through the discovery, development, operation and acquisition of mineral resources. As an established producer and seller of hematite iron ore, Mount Gibson’s strategy is to grow its profile as a successful and profitable supplier of raw materials.
Key influences on the success of Mount Gibson are not only iron ore prices and foreign exchange rates but also operational performance, consistency in government policy, the continued attainment of regulatory approvals, the ability to delineate new mineral resources and ore reserves, and the continued control of operating and capital costs.
The Board’s corporate objective is to grow the Company’s cash reserves and continue to pursue an appropriate balance between the retention and utilisation of cash reserves for value-accretive investments. The Board has determined the following key business objectives for the 2021/22 financial year:
• Koolan Island – complete the processing plant upgrade and the Main Pit elevated stripping and footwall support programs to regain access to high grade ore as scheduled, in order to maximise sales and cashflow over the remainder of the mine life as ore shipments increase and the waste/ore stripping ratio and costs decline.
• Shine - complete commissioning and ramp-up production and sales in accordance with the development and production schedule.
• Extension Hill – complete final rehabilitation of the mine site.
• Cost reductions - continue to drive for sustainable cost improvements across all business units.
• Treasury returns – maintain an appropriate yield on the Group’s cash and investment reserves while preserving capital for future deployment.
• Growth projects - continue the search for acquisition opportunities in the resources sector.
Group Sales Guidance and Cash Costs Guidance
As indicated, the focus for the 2021/22 financial year at Koolan Island is to complete the planned open pit waste stripping phase, the upper footwall support program and the crusher upgrade in order to resume high grade ore production and enable significantly increased ore shipment levels from the end of 2021 onwards. At the Shine operation, the objective is to successfully ramp up production and sales and advance the waste stripping program.
On a Group basis over the full year, Mount Gibson is targeting total iron ore sales of 3.0-3.2 Mwmt.
Koolan Island is expected to contribute iron ore sales of 2.0-2.2 Mwmt in the year, with site cash operating costs expected to average $75-80/wmt FOB before royalties, advanced waste stripping investment of approximately $100 million and Koolan capital projects of approximately $25 million. Sales volumes, ore quality and cashflow will be heavily weighted to the second half of the financial year, when ore is scheduled to come primarily from the high-grade orebody in Main Pit.
The Shine operation in the Mid-West is expected to contribute iron ore sales of approximately 1.0 Mwmt at an average site cash operating cost of $75-80/wmt FOB once shipments have ramped up, before advanced waste stripping (approximately $20 million) and government and vendor royalties.
DIVIDENDS
During the year, a final dividend of $0.03 per share fully franked ($34,807,000) in respect of the 2019/20 financial year was distributed by way of $16,271,000 in cash and the issue of 25,688,736 new shares under the Company’s Dividend Reinvestment Plan.
The Company has declared a final dividend on ordinary shares in respect of the 2020/21 financial year of $0.02 per share fully franked, payable either in cash or in shares to eligible shareholders as part of the Company’s Dividend Reinvestment Plan. The total amount of the dividend is $23,760,000. The dividend has not been provided for in the 30 June 2021 financial statements.
SIGNIFICANT EVENTS AFTER BALANCE DATE
Other than the final dividend declared by the Company as noted above, as at the date of this report there are no significant events after balance date of the Company or of the Group that require adjustment of or disclosure in this report.
INDEMNIFICATION AND INSURANCE OF DIRECTORS, OFFICERS AND AUDITORS
The Company has, during current or previous financial periods, entered into deeds of access and indemnity with its Directors. These deeds provide access to documentation and indemnification against liability for loss suffered, as a result of any act or omission, to the extent permitted by the Corporations Act 2001, from conduct of the Group’s business.
During the financial year, the Company paid a premium in respect of a contract insuring the Directors of the Company, the Company Secretary and all Executive Officers of the Company and of any related body corporate against a liability incurred as such a Director, Company Secretary or Executive Officer to the extent permitted by the Corporations Act 2001.
The Directors have not included details of the nature of the liabilities covered or the amount of the premium paid in respect of the directors’ and officers’ liability and legal expenses’ insurance contracts, as such disclosure is prohibited under the terms of the contracts.
The Company has agreed to indemnify its auditors, EY, to the fullest extent possible as part of the terms of its audit engagement agreement against claims by third parties arising from the audit (for an unspecified amount). No payment has been made to indemnify EY during or since the financial year.
The Company has not otherwise, during or since the end of the financial year, except to the extent permitted by law, indemnified or agreed to indemnify an officer or auditor of the Company or any related body corporate against a liability incurred as such an officer or auditor.

Mount Gibson Iron Limited – 30 June 2021 Financial Report Page 11
SHARE OPTIONS, PERFORMANCE RIGHTS AND RESTRICTED SHARES
There were no options exercised or forfeited during the financial year or prior to the date of this Report. There are no options over ordinary shares in the Company on issue as at balance date and as at the date of this Report. There were no Performance Rights vested and exercised during the year. There are no Performance Rights on issue as at balance date and as at the date of this Report.
On 1 July 2020, the Company issued 2,986,400 restricted shares (including 440,500 shares reallotted) as part of its Executive Loan Share Plan. There were 6,175,428 restricted shares on issue at balance date and, following an issue made after balance date, there are 8,238,528 restricted shares on issue under the Executive Loan Share Plan as at the date of this report.
Refer to the Remuneration Report for further details of shares outstanding.
DIRECTORS’ INTERESTS IN THE SHARES, OPTIONS AND PERFORMANCE RIGHTS OF THE COMPANY
As at the date of this report, the interests of the Directors in the Shares and Options of the Company were:
Ordinary Shares Options over Shares Performance Rights over Shares
SH Lee(i) - - - A Jones 300,000 - - R Barwick - - - S Bird 49,933 - - P Dougas 774,765 - - R Ding - - - A Ferguson (Alternate for Mr Lee) - - -
(i) For the purposes of Corporations Act Regulation 2M.3.03(1)-Item 18, Mr Lee does not have a disclosable shareholding. However, we note that for purposes of ASX Listing Rule 3.19A.2, Mr Lee has previously declared an indirect “relevant interest” in 431,819,861 ordinary shares in the Company through his association with Allied Group Limited, a substantial shareholder of the Company – refer ASX announcement dated 2 November 2020.
DIRECTORS’ MEETINGS
The number of meetings of Directors (including meetings of Committees of Directors) held during the year and the number of meetings attended by each Director were as follows:
Directors’ Meetings
Audit and Risk Management Committee Meetings
Nomination, Remuneration
and Governance Committee
Operational Risk and
Sustainability Committee
Contracts Committee
Number of Meetings Held 6 4 4 4 -* SH Lee 6 4 4 - - A Jones 6 4 4 - - R Barwick 5 - 3 3 - S Bird 6 4 - 4 - P Dougas 6 - - 4 - R Ding 5 - - - - A Ferguson (Alt. for Mr Lee) 1 - - - -
* Committee members did not formally meet during the financial year but reviewed and approved a number of offtake agreements during the period.
ENVIRONMENTAL REGULATION AND PERFORMANCE
The Group has developed Environmental Management Plans for its various operating and development sites. The Environmental Management Plans have been approved where applicable by various Western Australian Government agencies including the Department of Mines, Industry Regulation and Safety (DMIRS), the Department of Water & Environmental Regulation (DWER), the Department of Biodiversity Conservation and Attractions and the Department of Health. In addition, plans associated with specific species have been approved by the Federal Department of Agriculture, Water and Environment (DAWE).
DWER has granted approval and licensing of works to allow construction and operation of facilities on “prescribed” premises and DMIRS has granted approval for Mining Proposals at each of the mines.
The Group holds various environmental licences and authorities, issued under both State and Federal laws, to regulate its mining and exploration activities in Australia. Along with Regulations, these licences include conditions in relation to specifying limits on emissions into the environment, rehabilitation of areas disturbed during the course of mining and exploration activities, consumption of water, tenement conditions associated with exploration and mining, and the storage of hazardous substances. The Group examines its performance through detailed monitoring and reports against these approval conditions regularly to government. No notices of non-compliance, letters of warning nor any other materially adverse findings was tabled by any regulatory authority in relation to the Group’s operations.
The Group continues to report under the National Greenhouse and Energy Reporting (NGER) Act 2009. Diesel consumption is the Group’s single largest source of greenhouse gas emissions as its combusted in vehicles and power generators.

Mount Gibson Iron Limited – 30 June 2021 Financial Report Page 12
PROCEEDINGS ON BEHALF OF THE COMPANY
There are no proceedings on behalf of the Company under section 237 of the Corporations Act 2001 in the financial year or at the date of this report.
ROUNDING
Amounts in this report and the accompanying financial report have been rounded to the nearest thousand dollars ($’000) unless otherwise stated under the option available to the Company under ASIC Corporations (Rounding in Financial/Directors’ Report) Instrument 2016/191. The Company is an entity to which the instrument applies.
CURRENCY
Amounts in this report and the accompanying financial report are presented in Australian dollars unless otherwise stated.
CORPORATE GOVERNANCE
The Company’s Corporate Governance Statement is contained in the Additional ASX Information section of the Annual Report.
AUDITOR’S INDEPENDENCE DECLARATION
In accordance with section 307C of the Corporations Act 2001, the Directors received the attached Independence Declaration from the auditor of the Company on page 21 which forms part of this Report.
AUDIT PARTNER ROTATION
On 13 November 2018, the Board granted approval pursuant to section 324DAC of the Corporations Act 2001 (Cth), for Mr Gavin Buckingham of EY to play a significant role in the audit of the Company for an additional two financial years through to and including the financial year ending 30 June 2021.
The Board considered the matters set out in section 324DAB(3) of the Act and is satisfied that the approval: [i] is consistent with maintaining the quality of the audit provided to the Company; and [ii] would not give rise to a conflict of interest situation.
Reasons supporting this decision include: o the benefits associated with the continued retention of knowledge regarding key audit matters; o the Board being satisfied with the quality of EY and Mr Buckingham’s work as auditor; and o the Company’s ongoing governance processes to ensure the independence of the auditor is maintained.
NON-AUDIT SERVICES
The Directors are satisfied that the provision of non-audit services (where provided) is compatible with the general standard of independence for auditors imposed by the Corporations Act 2001. There were no non-audit services provided by EY during the financial year ended 30 June 2021.
Mount Gibson Iron Limited – 30 June 2021 Financial Report Page 13
REMUNERATION REPORT (AUDITED)
Introduction
This Remuneration Report outlines the remuneration arrangements in place for Directors and Key Management Personnel of the Group in accordance with the requirements of the Corporations Act 2001 and its Regulations.
For the purposes of this report Key Management Personnel of the Group are defined as those persons having authority and responsibility for planning, directing and controlling the major activities of the Group, directly or indirectly, including any directors of the Company.
The Company received a "first strike" against its 2020 Remuneration Report at the Annual General Meeting of shareholders on 11 November 2020 with a vote of slightly more than 25% voting against the 2020 Remuneration Report. If there is a "second strike" at the 2021 Annual General Meeting, then shareholders will be able to vote on a "spill resolution" requiring shareholders to consider whether all of the existing Directors should be required to stand for re-election within 90 days, and if so, a further meeting convened for that purpose.
The Company has considered the comments raised by certain proxy advisors and shareholder representatives in respect of the 2020 Remuneration Report, particularly in respect of Short Term Incentive (STI) and Long Term Incentive (LTI) awards.
One of the key observations was the lack of fixed performance criteria in assessing the awards. Historically Mount Gibson has had periods where it had very rigid performance and assessment criteria that have been overridden by the Board in times of deteriorating economic and pricing conditions. On balance, the Board believes that it is better to retain discretion over the awards of STIs and LTIs to give flexibility in times of market volatility and changing circumstances. The current discretionary approach is supported by the Board and considered appropriate for the Company particularly given the relatively short remaining mine life of 5 years for Mount Gibson's key mining project. However, based on the feedback it has received, the Board agrees that it would be helpful for investors if the 2021 Remuneration Report had greater explanation and transparency of the factors influencing the Board's discretion when making STI and LTI awards. To that end a table has been included below detailing the relevant metrics considered in the STI award. The same metrics are considered in the LTI award but with less weight as the LTI award opportunity is modest by comparison to peers and also acts primarily as a retention mechanism. An additional table has also been included showing the variation in grants of LTI interests over the last 5 years and shares that have been forfeited or yet to vest.
In addition, the Board acknowledges comments that the retention aspect of the LTI award could be enhanced by extending the timing for vesting of the LTI awards. Accordingly, going forward, vesting has been restricted for a further 12 months (i.e. for a minimum of two years) before the LTI shares may be dealt with by the relevant employee. This has been included in the LTI awards for the 2021/2022 financial year as further explained in the LTI section below.
With respect to the LTI structure, the Board received comments from a proxy group that it would be preferable that the loans supporting the award of the LTI shares were recourse (full liability) rather than non-recourse loans (liability to value of shares). A recourse loan structure effectively acts as a margin loan rather than a performance reward. The Board considers that from a risk/reward perspective, non-recourse loans are to be preferred given the scheme is intended to act as an incentive to drive Executive performance rather than create the risk of a substantial financial burden for the executive. In a declining market scenario, the overhang of this type of financial burden is not consistent with good governance as it gives rise to potential conflicts of interests in terms of future decision making and acceptable levels of risk. The Board does not support that particular proposal.
Nomination, Remuneration and Governance Committee (NRGC)
The NRGC comprises two independent Non-Executive Directors, being Messrs Jones (Chairman) and Barwick, and one non-independent Non-Executive Director, being Mr Lee, the Chairman of the Board.
The NRGC is responsible for determining and reviewing remuneration arrangements for the Board and Key Management Personnel.
The NRGC assesses the appropriateness of the nature and amount of remuneration of Key Management Personnel on a periodic basis by reference to relevant employment market conditions with the overall objective of ensuring maximum stakeholder benefit from the retention of a high quality, high performing Board and executive team.
Remuneration Policy
The Remuneration Policy of the Group has been put in place to ensure that:
remuneration policies and systems support the Company’s wider objectives and strategies;
Directors’ and senior executives’ remuneration is aligned to the long-term interests of shareholders within an appropriate control framework; and
there is a clear relationship between the executives’ performance and remuneration.
Remuneration Structure
In accordance with best practice corporate governance, the structure of Non-Executive Director and senior executive management remuneration is separate.
Non-Executive Director Remuneration
Objective
The Board seeks to set aggregate remuneration at a level which provides the Company with the ability to attract and retain Directors of the highest calibre, whilst incurring a cost which is acceptable to shareholders.
Structure
The Constitution and the ASX Listing Rules specify that the aggregate remuneration of Non-Executive Directors shall be determined from time to time by a general meeting of shareholders. An amount not exceeding the amount determined is then divided between the Non-Executive Directors as agreed. The latest determination was at the Annual General Meeting held on 16 November 2011 when
Mount Gibson Iron Limited – 30 June 2021 Financial Report Page 14
Shareholders approved an aggregate remuneration of $1,250,000 per year. Total Non-Executive Director fees of $526,125 were paid in the 2020/21 financial year.
Each Non-Executive Director receives a fee for being a Director of the Company.
Non-Executive Directors should be adequately remunerated for their time and effort and the risks involved. Non-Executive Directors are remunerated to recognise the responsibilities, accountabilities and associated risks of Directors.
Each Non-Executive Director’s performance and remuneration is reviewed on an annual basis by the Chairman and NRGC.
Non-Executive Directors’ fixed remuneration comprises the following elements:
cash remuneration; and
superannuation contributions made by the Company.
Board operating costs do not form part of Non-Executive Directors’ remuneration.
Senior Executives’ Remuneration
Objective
The Company aims to reward senior executives with a level and mix of remuneration commensurate with their position and responsibilities within the Company and so as to:
reward senior executives for Company and individual performance contributing towards key Company objectives;
align the interests of senior executives with those of shareholders;
link reward with the strategic goals and performance of the Company;
be appropriately structured given the presently limited remaining mine life of the Company’s key operating assets; and
ensure total remuneration is competitive by market standards.
Use of Remuneration Consultants
The NRGC from time to time seeks advice from independent remuneration consultants regarding senior executives’ remuneration structures and levels. Such consultants are engaged by, and report directly to, the NRGC, and are required to confirm in writing their independence from the Group’s senior and other executives. No remuneration consultants were appointed for this purpose during the 2020/21 financial year.
Fixed Remuneration
The components of the senior executives’ fixed remuneration are determined individually and may include:
cash remuneration;
superannuation;
accommodation and travel benefits;
motor vehicle, parking and other benefits; and
reimbursement of entertainment, home office and telephone expenses.
The senior executives’ remuneration is reviewed on an annual basis by the Chief Executive Officer, whose remuneration is reviewed annually by the NRGC.
In determining the remuneration package, the NRGC reviews the individual’s remuneration with the use of market data for positions with comparable companies. Where appropriate, the package is adjusted so as to keep pace with market trends and ensure continued remuneration competitiveness. In conducting a comparative analysis, the Company’s expected performance for the year is considered in the context of the Company’s capacity to fund remuneration budgets. The Company seeks to position the overall fixed remuneration for senior management at around the 50th percentile level when compared to its peers for equivalent positions.
Variable Remuneration
Short-term Incentives (STI)
Senior executives may receive variable remuneration in the form of STI of up to 50% of their annual salary package. STI payments are based on the Board’s assessment of the executive’s performance towards achieving key Company objectives over the relevant period.
On an annual basis, the performance of each senior executive is reviewed immediately prior to or just after the reporting date. The NRGC then determines the amount of STI to be allocated to each executive with approval from the Board. The total potential STI available for award is ultimately at the Board’s discretion. Payments are made in cash after the reporting date. Where an executive resigns during or after the relevant financial year, it remains at the discretion of the Board as to whether any of the STI is payable for the relevant financial year. However, STI's are generally not paid upon resignation of an executive unless there are exceptional circumstances.
The focus for the 2020/21 financial year was on the Company's operational safety performance and on achieving the annual budget outcomes related to sales and costs. These parameters were chosen as they reflected the Company’s and senior executives’ key objectives for the year.
The Board assessed the Company’s and senior executives’ performances based on the actual results achieved to the end of May 2021 and forecasts for the month of June 2021. The Board also exercised its discretion taking into account the individual efforts of senior executives over the period.
Mount Gibson Iron Limited – 30 June 2021 Financial Report Page 15
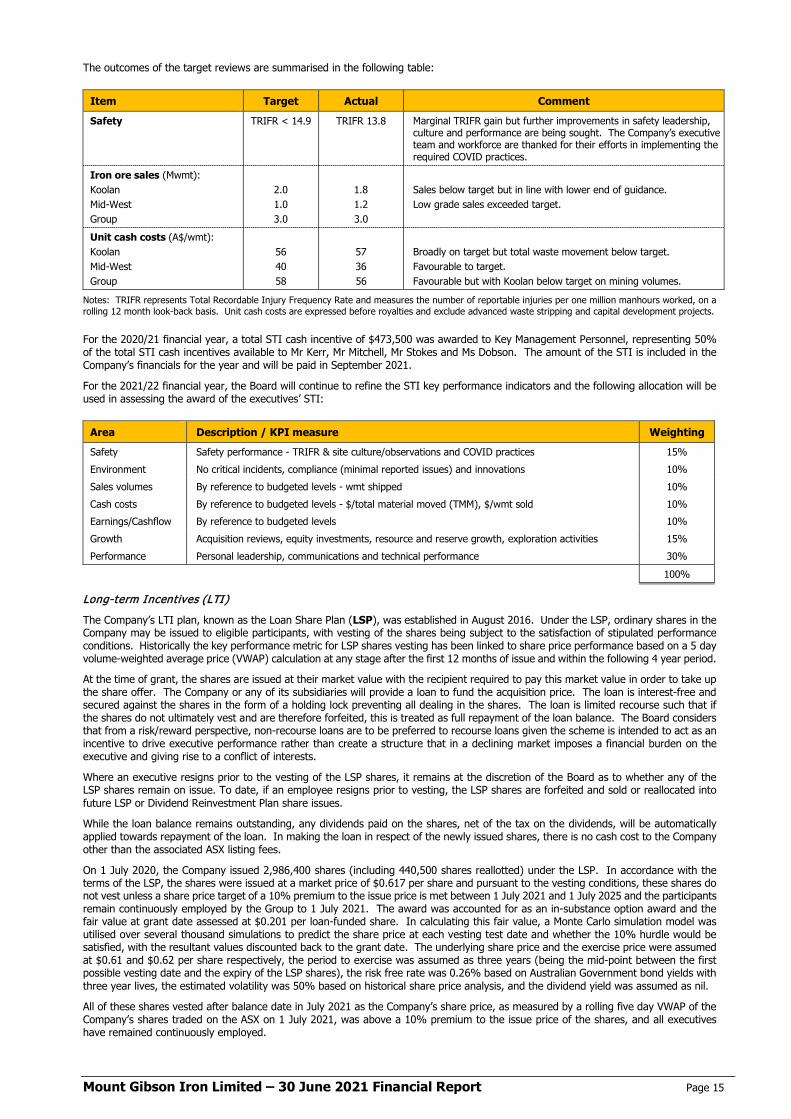
The outcomes of the target reviews are summarised in the following table:
Item Target Actual Comment
Safety TRIFR < 14.9 TRIFR 13.8 Marginal TRIFR gain but further improvements in safety leadership, culture and performance are being sought. The Company’s executive team and workforce are thanked for their efforts in implementing the required COVID practices.
Iron ore sales (Mwmt): Koolan Mid-West Group
2.0 1.0 3.0
1.8 1.2 3.0
Sales below target but in line with lower end of guidance. Low grade sales exceeded target.
Unit cash costs (A$/wmt): Koolan Mid-West Group
56 40 58
57 36 56
Broadly on target but total waste movement below target. Favourable to target. Favourable but with Koolan below target on mining volumes.
Notes: TRIFR represents Total Recordable Injury Frequency Rate and measures the number of reportable injuries per one million manhours worked, on a rolling 12 month look-back basis. Unit cash costs are expressed before royalties and exclude advanced waste stripping and capital development projects.
For the 2020/21 financial year, a total STI cash incentive of $473,500 was awarded to Key Management Personnel, representing 50% of the total STI cash incentives available to Mr Kerr, Mr Mitchell, Mr Stokes and Ms Dobson. The amount of the STI is included in the Company’s financials for the year and will be paid in September 2021.
For the 2021/22 financial year, the Board will continue to refine the STI key performance indicators and the following allocation will be used in assessing the award of the executives’ STI:
Area Description / KPI measure Weighting
Safety Safety performance - TRIFR & site culture/observations and COVID practices 15% Environment No critical incidents, compliance (minimal reported issues) and innovations 10% Sales volumes By reference to budgeted levels - wmt shipped 10% Cash costs By reference to budgeted levels - $/total material moved (TMM), $/wmt sold 10% Earnings/Cashflow By reference to budgeted levels 10% Growth Acquisition reviews, equity investments, resource and reserve growth, exploration activities 15% Performance Personal leadership, communications and technical performance 30% 100%
Long-term Incentives (LTI)
The Company’s LTI plan, known as the Loan Share Plan (LSP), was established in August 2016. Under the LSP, ordinary shares in the Company may be issued to eligible participants, with vesting of the shares being subject to the satisfaction of stipulated performance conditions. Historically the key performance metric for LSP shares vesting has been linked to share price performance based on a 5 day volume-weighted average price (VWAP) calculation at any stage after the first 12 months of issue and within the following 4 year period.
At the time of grant, the shares are issued at their market value with the recipient required to pay this market value in order to take up the share offer. The Company or any of its subsidiaries will provide a loan to fund the acquisition price. The loan is interest-free and secured against the shares in the form of a holding lock preventing all dealing in the shares. The loan is limited recourse such that if the shares do not ultimately vest and are therefore forfeited, this is treated as full repayment of the loan balance. The Board considers that from a risk/reward perspective, non-recourse loans are to be preferred to recourse loans given the scheme is intended to act as an incentive to drive executive performance rather than create a structure that in a declining market imposes a financial burden on the executive and giving rise to a conflict of interests.
Where an executive resigns prior to the vesting of the LSP shares, it remains at the discretion of the Board as to whether any of the LSP shares remain on issue. To date, if an employee resigns prior to vesting, the LSP shares are forfeited and sold or reallocated into future LSP or Dividend Reinvestment Plan share issues.
While the loan balance remains outstanding, any dividends paid on the shares, net of the tax on the dividends, will be automatically applied towards repayment of the loan. In making the loan in respect of the newly issued shares, there is no cash cost to the Company other than the associated ASX listing fees.
On 1 July 2020, the Company issued 2,986,400 shares (including 440,500 shares reallotted) under the LSP. In accordance with the terms of the LSP, the shares were issued at a market price of $0.617 per share and pursuant to the vesting conditions, these shares do not vest unless a share price target of a 10% premium to the issue price is met between 1 July 2021 and 1 July 2025 and the participants remain continuously employed by the Group to 1 July 2021. The award was accounted for as an in-substance option award and the fair value at grant date assessed at $0.201 per loan-funded share. In calculating this fair value, a Monte Carlo simulation model was utilised over several thousand simulations to predict the share price at each vesting test date and whether the 10% hurdle would be satisfied, with the resultant values discounted back to the grant date. The underlying share price and the exercise price were assumed at $0.61 and $0.62 per share respectively, the period to exercise was assumed as three years (being the mid-point between the first possible vesting date and the expiry of the LSP shares), the risk free rate was 0.26% based on Australian Government bond yields with three year lives, the estimated volatility was 50% based on historical share price analysis, and the dividend yield was assumed as nil.
All of these shares vested after balance date in July 2021 as the Company’s share price, as measured by a rolling five day VWAP of the Company’s shares traded on the ASX on 1 July 2021, was above a 10% premium to the issue price of the shares, and all executives have remained continuously employed.
Mount Gibson Iron Limited – 30 June 2021 Financial Report Page 16
The Company has a policy restricting executives from entering into arrangements to protect the value of unvested LTI entitlements under equity-based remuneration plans.
As noted earlier, the Board has modified the terms of the LSP shares issued such that LSP awards issued for the 2021/22 financial year have an increased two year vesting period during which the relevant executive must remain continuously employed by the Group. Any dividends accruing during this period will be used, net of tax on the dividend, to pay down the LSP loan. In addition, the Board will take into account the executive team's performance against the STI performance metrics, in conjunction with the overall retention objectives of the LTI scheme, in determining the appropriate number of LSP shares to award for future periods.
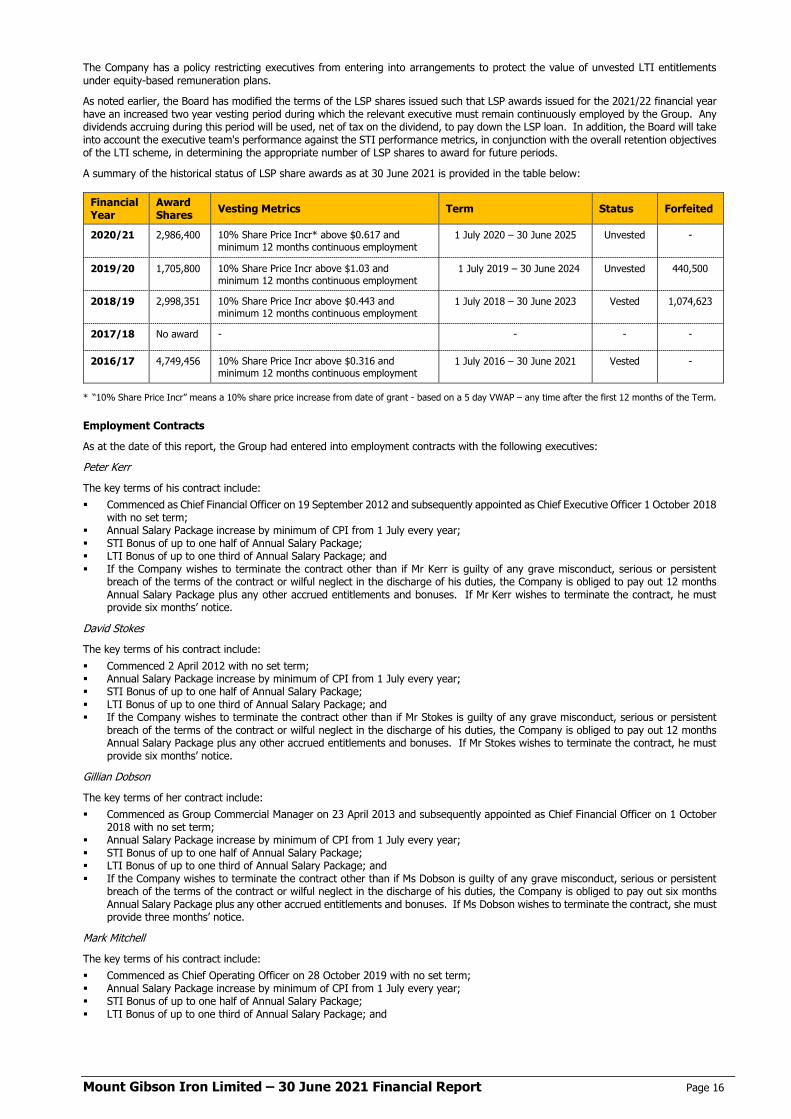
A summary of the historical status of LSP share awards as at 30 June 2021 is provided in the table below:
Financial Year
Award Shares Vesting Metrics Term Status Forfeited
2020/21 2,986,400 10% Share Price Incr* above $0.617 and minimum 12 months continuous employment
1 July 2020 – 30 June 2025 Unvested -
2019/20 1,705,800 10% Share Price Incr above $1.03 and minimum 12 months continuous employment
1 July 2019 – 30 June 2024 Unvested 440,500
2018/19 2,998,351 10% Share Price Incr above $0.443 and minimum 12 months continuous employment
1 July 2018 – 30 June 2023 Vested 1,074,623
2017/18 No award - - - -
2016/17 4,749,456 10% Share Price Incr above $0.316 and minimum 12 months continuous employment
1 July 2016 – 30 June 2021 Vested -
* “10% Share Price Incr” means a 10% share price increase from date of grant - based on a 5 day VWAP – any time after the first 12 months of the Term.
Employment Contracts
As at the date of this report, the Group had entered into employment contracts with the following executives:
Peter Kerr
The key terms of his contract include: Commenced as Chief Financial Officer on 19 September 2012 and subsequently appointed as Chief Executive Officer 1 October 2018
with no set term; Annual Salary Package increase by minimum of CPI from 1 July every year; STI Bonus of up to one half of Annual Salary Package; LTI Bonus of up to one third of Annual Salary Package; and If the Company wishes to terminate the contract other than if Mr Kerr is guilty of any grave misconduct, serious or persistent
breach of the terms of the contract or wilful neglect in the discharge of his duties, the Company is obliged to pay out 12 months Annual Salary Package plus any other accrued entitlements and bonuses. If Mr Kerr wishes to terminate the contract, he must provide six months’ notice.
David Stokes
The key terms of his contract include: Commenced 2 April 2012 with no set term; Annual Salary Package increase by minimum of CPI from 1 July every year; STI Bonus of up to one half of Annual Salary Package; LTI Bonus of up to one third of Annual Salary Package; and If the Company wishes to terminate the contract other than if Mr Stokes is guilty of any grave misconduct, serious or persistent
breach of the terms of the contract or wilful neglect in the discharge of his duties, the Company is obliged to pay out 12 months Annual Salary Package plus any other accrued entitlements and bonuses. If Mr Stokes wishes to terminate the contract, he must provide six months’ notice.
Gillian Dobson
The key terms of her contract include: Commenced as Group Commercial Manager on 23 April 2013 and subsequently appointed as Chief Financial Officer on 1 October
2018 with no set term; Annual Salary Package increase by minimum of CPI from 1 July every year; STI Bonus of up to one half of Annual Salary Package; LTI Bonus of up to one third of Annual Salary Package; and If the Company wishes to terminate the contract other than if Ms Dobson is guilty of any grave misconduct, serious or persistent
breach of the terms of the contract or wilful neglect in the discharge of his duties, the Company is obliged to pay out six months Annual Salary Package plus any other accrued entitlements and bonuses. If Ms Dobson wishes to terminate the contract, she must provide three months’ notice.
Mark Mitchell
The key terms of his contract include: Commenced as Chief Operating Officer on 28 October 2019 with no set term; Annual Salary Package increase by minimum of CPI from 1 July every year; STI Bonus of up to one half of Annual Salary Package; LTI Bonus of up to one third of Annual Salary Package; and

Mount Gibson Iron Limited – 30 June 2021 Financial Report Page 17
If the Company wishes to terminate the contract other than if Mr Mitchell is guilty of any grave misconduct, serious or persistent breach of the terms of the contract or wilful neglect in the discharge of his duties, the Company is obliged to pay out six months Annual Salary Package plus any other accrued entitlements and bonuses. If Mr Mitchell wishes to terminate the contract, he must provide three months’ notice.
Details of directors and key management personnel disclosed in this report
[i] Directors
SH Lee Chairman A Jones Non-Executive Director R Barwick Non-Executive Director S Bird Lead Non-Executive Director P Dougas Non-Executive Director R Ding Non-Executive Director A Ferguson Alternate Director to Mr Lee [ii] Key Management Personnel P Kerr Chief Executive Officer D Stokes Company Secretary and General Counsel G Dobson Chief Financial Officer M Mitchell Chief Operating Officer Remuneration of Key Management Personnel for the year ended 30 June 2021
Short Term Post
Employment Long Term Share Based
Payment
Salary & Fees
Non Monetary(a)
Cash Incentives
(b)
Accrued Annual
Leave(c) Super-
annuation
Long Service Leave(d)
Loan Share Plan(e) Total
% Perform-
ance Related(f)
30 June 2021 $ $ $ $ $ $ $ $
Directors SH Lee 100,114 - - - 9,511 - - 109,625 - A Jones 96,343 - - - 9,157 - - 105,500 - R Barwick 96,343 - - - 9,157 - - 105,500 - S Bird 103,192 - - - 9,808 - - 113,000 - P Dougas 92,500 - - - - - - 92,500 - R Ding - - - - - - - - - A Ferguson (Alt) - - - - - - - - - Sub-total 488,492 - - - 37,633 - - 526,125 Other KMP P Kerr 635,000 16,910 165,000 20,807 25,000 18,236 202,950 1,083,903 34 D Stokes 336,855 11,409 92,200 6,460 32,001 7,217 120,419 606,561 35 G Dobson 365,000 11,305 97,500 - 27,443 10,257 121,766 633,271 35 M Mitchell 453,512 18,989 118,800 1,664 21,635 577 155,132 770,309 36 Sub-total 1,790,367 58,613 473,500 28,931 106,079 36,287 600,267 3,094,044 Totals 2,278,859 58,613 473,500 28,931 143,712 36,287 600,267 3,620,169
(a) Non-Monetary items include the value (where applicable) of benefits such as group life insurance cover that are available to all employees of Mount Gibson and car parking, and are inclusive of Fringe Benefits Tax where applicable.
(b) Cash incentives represent the cash value of the executives’ short-term incentive awards for the 2020/21 year. Refer to “Short-term Incentives” section above. (c) Annual leave has been separately categorised and is measured on an accrual basis and reflects the movement in the accrual over the twelve-month period. Any reduction in
accrued leave reflects more leave taken or cashed out than that which accrued in the period. (d) Represents the accrual for long service leave over the twelve-month period. (e) The fair values of the awards under the Loan Share Plan (restricted shares) were calculated as at the grant date and represent the accounting expense incurred by the Company
for the stated financial period, reflecting the terms of the particular restricted shares. The amount included as remuneration is not related to or indicative of the benefit (if any) that individual executives may in fact receive (refer the Long-term Incentives (LTI) section of this report).
(f) Performance related remuneration reflects the proportion of the total remuneration relating to cash incentives (STI) and share based payments (LTI).
Options
There were no options granted to Directors or Executives during the year ended 30 June 2021 and there were no options outstanding as at 30 June 2021. There were no shares issued on the exercise of options during the year ended 30 June 2021 (2020: nil).
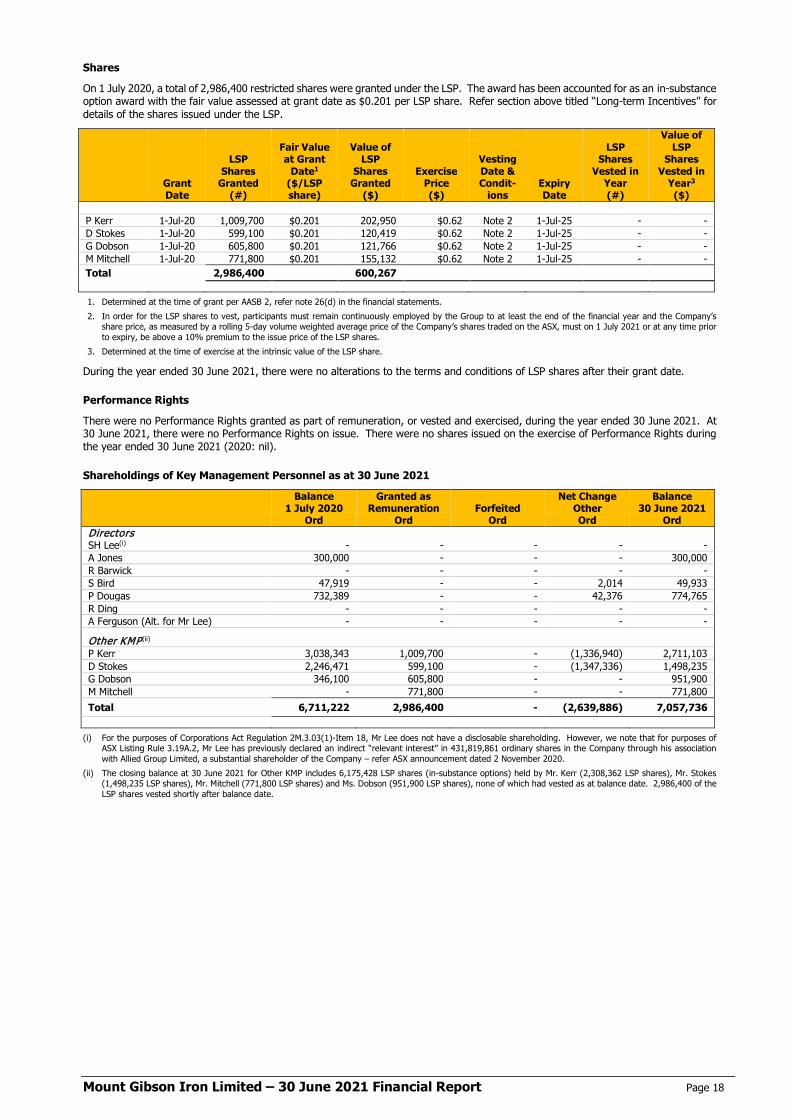
Mount Gibson Iron Limited – 30 June 2021 Financial Report Page 18
Shares
On 1 July 2020, a total of 2,986,400 restricted shares were granted under the LSP. The award has been accounted for as an in-substance option award with the fair value assessed at grant date as $0.201 per LSP share. Refer section above titled “Long-term Incentives” for details of the shares issued under the LSP.
Grant Date
LSP Shares
Granted (#)
Fair Value at Grant
Date1 ($/LSP share)
Value of LSP
Shares Granted
($)
Exercise Price ($)
Vesting Date & Condit-
ions Expiry Date
LSP Shares
Vested in Year (#)
Value of LSP
Shares Vested in
Year3 ($)
P Kerr 1-Jul-20 1,009,700 $0.201 202,950 $0.62 Note 2 1-Jul-25 - - D Stokes 1-Jul-20 599,100 $0.201 120,419 $0.62 Note 2 1-Jul-25 - - G Dobson 1-Jul-20 605,800 $0.201 121,766 $0.62 Note 2 1-Jul-25 - - M Mitchell 1-Jul-20 771,800 $0.201 155,132 $0.62 Note 2 1-Jul-25 - - Total 2,986,400 600,267 1. Determined at the time of grant per AASB 2, refer note 26(d) in the financial statements. 2. In order for the LSP shares to vest, participants must remain continuously employed by the Group to at least the end of the financial year and the Company’s
share price, as measured by a rolling 5-day volume weighted average price of the Company’s shares traded on the ASX, must on 1 July 2021 or at any time prior to expiry, be above a 10% premium to the issue price of the LSP shares.
3. Determined at the time of exercise at the intrinsic value of the LSP share.
During the year ended 30 June 2021, there were no alterations to the terms and conditions of LSP shares after their grant date.
Performance Rights
There were no Performance Rights granted as part of remuneration, or vested and exercised, during the year ended 30 June 2021. At 30 June 2021, there were no Performance Rights on issue. There were no shares issued on the exercise of Performance Rights during the year ended 30 June 2021 (2020: nil).
Shareholdings of Key Management Personnel as at 30 June 2021
Balance
1 July 2020 Granted as
Remuneration Forfeited Net Change
Other Balance
30 June 2021 Ord Ord Ord Ord Ord Directors SH Lee(i) - - - - - A Jones 300,000 - - - 300,000 R Barwick - - - - - S Bird 47,919 - - 2,014 49,933 P Dougas 732,389 - - 42,376 774,765 R Ding - - - - - A Ferguson (Alt. for Mr Lee) - - - - - Other KMP(ii) P Kerr 3,038,343 1,009,700 - (1,336,940) 2,711,103 D Stokes 2,246,471 599,100 - (1,347,336) 1,498,235 G Dobson 346,100 605,800 - - 951,900 M Mitchell - 771,800 - - 771,800 Total 6,711,222 2,986,400 - (2,639,886) 7,057,736
(i) For the purposes of Corporations Act Regulation 2M.3.03(1)-Item 18, Mr Lee does not have a disclosable shareholding. However, we note that for purposes of ASX Listing Rule 3.19A.2, Mr Lee has previously declared an indirect “relevant interest” in 431,819,861 ordinary shares in the Company through his association with Allied Group Limited, a substantial shareholder of the Company – refer ASX announcement dated 2 November 2020.
(ii) The closing balance at 30 June 2021 for Other KMP includes 6,175,428 LSP shares (in-substance options) held by Mr. Kerr (2,308,362 LSP shares), Mr. Stokes (1,498,235 LSP shares), Mr. Mitchell (771,800 LSP shares) and Ms. Dobson (951,900 LSP shares), none of which had vested as at balance date. 2,986,400 of the LSP shares vested shortly after balance date.

Mount Gibson Iron Limited – 30 June 2021 Financial Report Page 19
Remuneration of Key Management Personnel for the year ended 30 June 2020
Short Term Post
Employment Long Term
Share Based
Payment
Salary & Fees
Non Monetary
(a)
Cash Incentives
(b)
Accrued Annual
Leave(c) Super-
annuation
Long Service Leave(d)
Loan Share Plan(e)
Termination Payment Total
% Perform-
ance Related(f)
30 June 2020 $ $ $ $ $ $ $ $ $
Directors SH Lee 95,548 - - - 9,077 - - - 104,625 - A Jones 92,694 - - - 8,806 - - - 101,500 - R Barwick 92,694 - - - 8,806 - - - 101,500 - S Bird 99,543 - - - 9,457 - - - 109,000 - P Dougas 88,500 - - - - - - - 88,500 - R Ding - - - - - - - - - - Li Shaofeng - - - - - - - - - - A Ferguson (Alt) - - - - - - - - - - Sub-total 468,979 - - - 36,146 - - - 505,125 Other KMP P Kerr 583,870 16,719 152,200 - 25,000 13,098 200,761 - 991,648 36 D Stokes 329,927 13,023 90,300 6,327 31,343 7,848 119,120 - 597,888 35 G Dobson 340,321 11,982 91,300 - 25,000 28,530 120,443 - 617,576 34 M Mitchell 289,854 2,176 116,300 16,845 27,536 143 - - 452,854 26 S de Kruijff 176,926 12,940 - - 16,808 - - 50,188 256,862 - Sub-total 1,720,898 56,840 450,100 23,172 125,687 49,619 440,324 50,188 2,916,828 Totals 2,189,877 56,840 450,100 23,172 161,833 49,619 440,324 50,188 3,421,953
(a) Non-Monetary items include the value (where applicable) of benefits such as group life insurance cover that are available to all employees of Mount Gibson and car parking, and are inclusive of Fringe Benefits Tax where applicable.
(b) Cash incentives represent the cash value of the executives’ short-term incentive awards for the 2019/20 year. Refer to “Short-term Incentives” section above. (c) Annual leave has been separately categorised and is measured on an accrual basis and reflects the movement in the accrual over the twelve-month period. Any reduction in accrued
leave reflects more leave taken or cashed out than that which accrued in the period. (d) Represents the accrual for long service leave over the twelve-month period. (e) The fair values of the awards under the Loan Share Plan (restricted shares), which are inclusive of an assumed dividend yield, were calculated as at the grant date and represent
the accounting expense incurred by the Company for the stated financial period, reflecting the terms of the particular restricted shares. The amount included as remuneration is not related to or indicative of the benefit (if any) that individual executives may in fact receive (refer the Long-term Incentives (LTI) section of this report).
(f) Performance related remuneration reflects the proportion of the total remuneration relating to cash incentives (STI) and share based payments (LTI).
Other Transactions and Balances with Key Management Personnel
There were no other transactions and balances with key management personnel during the years ended 30 June 2021 and 30 June 2020.
Company Performance
The table below shows the performance of the Group over the last 5 years:
30 June 2021 30 June 2020 30 June 2019 30 June 2018 30 June 2017
Net profit after tax $’000 64,006 84,198 133,369 99,129 26,322 Earnings per share $/ share 0.0546 0.0735 0.1198 0.0908 0.0241 Closing share price $ 0.95 0.61 1.02 0.43 0.33
End of remuneration report.
Signed in accordance with a resolution of the Directors. LEE SENG HUI Chairman Date: 24 August 2021
David.Stokes
Lee Seng Hui

Mount Gibson Iron Limited – 30 June 2021 Financial Report Page 20
Competent Person Statements Mineral Resources: The information in this report relating to Mineral Resources is based on information compiled by Ms Elizabeth Haren, a Competent Person who is a member and Chartered Professional of the Australasian Institute of Mining and Metallurgy and member of the Australian Institute of Geoscientists. Ms Haren was previously a full-time employee of, and is a consultant to, Mount Gibson Iron Limited, and has sufficient experience that is relevant to the style of mineralisation and type of deposit under consideration and to the activity being undertaken to qualify as a Competent Person as defined in the 2012 Edition of the ‘Australasian Code for Reporting of Exploration Results, Mineral Resources and Ore Reserves’. Ms Haren consents to the inclusion in this report of the matters based on her information in the form and context in which it appears. Ore Reserves The information in this report relating to Ore Reserves is based on information compiled by Mr Brett Morey, a member of the Australasian Institute of Mining and Metallurgy. Mr Morey is a full-time employee of Mount Gibson Iron Limited and has sufficient experience that is relevant to the style of mineralisation and type of deposit under consideration and to the activity being undertaken to qualify as a Competent Person as defined in the 2012 Edition of the ‘Australasian Code for Reporting of Exploration Results, Mineral Resources and Ore Reserves’. Mr Morey consents to the inclusion in the report of the matters based on his information in the form and context in which it appears.
A member firm of Ernst & Young Global Limited Liability limited by a scheme approved under Professional Standards Legislation
GB:AJ:MGI:009
Ernst & Young 11 Mounts Bay Road Perth WA 6000, Australia GPO Box M939 Perth WA 6843
Tel: +61 8 9429 2222 Fax: +61 8 9429 2436 ey.com/au
Auditor’s independence declaration to the directors of Mount Gibson Iron Limited
As lead auditor for the audit of Mount Gibson Iron Limited for the financial year ended 30 June 2021,
I declare to the best of my knowledge and belief, there have been:
a. No contraventions of the auditor independence requirements of the Corporations Act 2001 in
relation to the audit; and
b. No contraventions of any applicable code of professional conduct in relation to the audit.
This declaration is in respect of Mount Gibson Iron Limited and the entities it controlled during the financial year. Ernst & Young Gavin Buckingham Partner 24 August 2021

Mount Gibson Iron Limited – 30 June 2021 Financial Report Page 22
Consolidated Income Statement For the year ended 30 June 2021
2021 2020 Notes $’000 $’000
Revenue 3[a] 329,727 445,165
Interest revenue 3[b] 6,290 7,132
TOTAL REVENUE 336,017 452,297
Cost of sales 4[a] (214,830) (328,998)
GROSS PROFIT 121,187 123,299
Other income 3[c] 14,604 17,738
Net foreign exchange loss 4[c] (6,467) (2,195)
Net unrealised marked-to-market loss 4[d] (21,871) (3,192)
Administration and other expenses 4[e] (14,480) (13,431)
PROFIT BEFORE TAX AND FINANCE COSTS 92,973 122,219
Finance costs 4[b] (840) (1,502)
PROFIT BEFORE TAX 92,133 120,717
Tax expense 5 (28,127) (36,519)
PROFIT AFTER TAX ATTRIBUTABLE TO MEMBERS OF THE COMPANY 64,006 84,198
Earnings per share (cents per share) • basic earnings per share 27 5.46 7.35 • diluted earnings per share 27 5.45 7.34

Mount Gibson Iron Limited – 30 June 2021 Financial Report Page 23
Consolidated Statement of Comprehensive Income For the year ended 30 June 2021
2021 2020 $’000 $’000
PROFIT FOR THE PERIOD AFTER TAX 64,006 84,198
OTHER COMPREHENSIVE INCOME/(LOSS)
Items that may be subsequently reclassified to profit or loss
Change in fair value of cash flow hedges 400 (400)
Reclassification adjustments for loss on cash flow hedges transferred to the Income Statement (800) 800
Change in fair value of debt instruments classified as financial assets designated at fair value through other comprehensive income 504 (525)
Deferred income tax (31) (220)
OTHER COMPREHENSIVE INCOME/(LOSS) FOR THE YEAR, NET OF TAX 73 (345)
TOTAL COMPREHENSIVE INCOME FOR THE YEAR 64,079 83,853
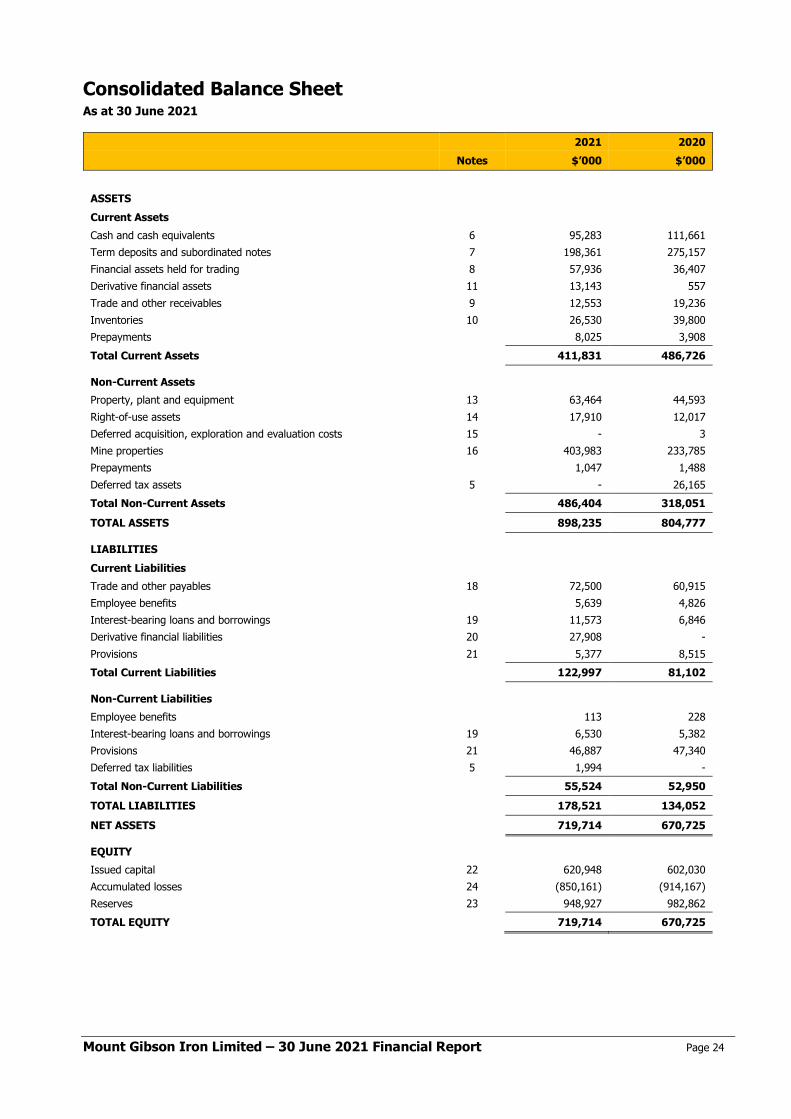
Mount Gibson Iron Limited – 30 June 2021 Financial Report Page 24
Consolidated Balance Sheet As at 30 June 2021
2021 2020 Notes $’000 $’000
ASSETS
Current Assets
Cash and cash equivalents 6 95,283 111,661 Term deposits and subordinated notes 7 198,361 275,157 Financial assets held for trading 8 57,936 36,407 Derivative financial assets 11 13,143 557 Trade and other receivables 9 12,553 19,236 Inventories 10 26,530 39,800 Prepayments 8,025 3,908 Total Current Assets 411,831 486,726 Non-Current Assets Property, plant and equipment 13 63,464 44,593 Right-of-use assets 14 17,910 12,017 Deferred acquisition, exploration and evaluation costs 15 - 3 Mine properties 16 403,983 233,785 Prepayments 1,047 1,488 Deferred tax assets 5 - 26,165 Total Non-Current Assets 486,404 318,051
TOTAL ASSETS 898,235 804,777 LIABILITIES Current Liabilities Trade and other payables 18 72,500 60,915 Employee benefits 5,639 4,826 Interest-bearing loans and borrowings 19 11,573 6,846 Derivative financial liabilities 20 27,908 - Provisions 21 5,377 8,515 Total Current Liabilities 122,997 81,102 Non-Current Liabilities Employee benefits 113 228 Interest-bearing loans and borrowings 19 6,530 5,382 Provisions 21 46,887 47,340 Deferred tax liabilities 5 1,994 - Total Non-Current Liabilities 55,524 52,950
TOTAL LIABILITIES 178,521 134,052
NET ASSETS 719,714 670,725 EQUITY Issued capital 22 620,948 602,030 Accumulated losses 24 (850,161) (914,167) Reserves 23 948,927 982,862 TOTAL EQUITY 719,714 670,725
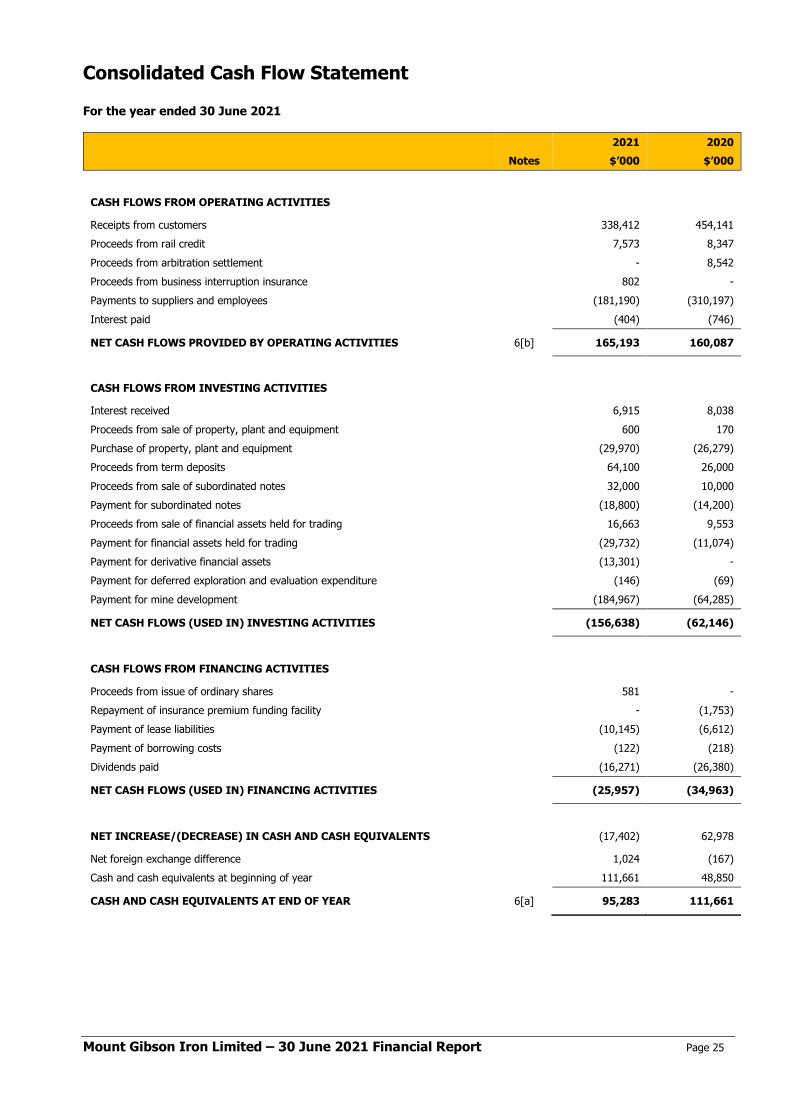
Mount Gibson Iron Limited – 30 June 2021 Financial Report Page 25
Consolidated Cash Flow Statement For the year ended 30 June 2021
2021 2020 Notes $’000 $’000
CASH FLOWS FROM OPERATING ACTIVITIES
Receipts from customers 338,412 454,141 Proceeds from rail credit 7,573 8,347 Proceeds from arbitration settlement - 8,542 Proceeds from business interruption insurance 802 - Payments to suppliers and employees (181,190) (310,197) Interest paid (404) (746)
NET CASH FLOWS PROVIDED BY OPERATING ACTIVITIES 6[b] 165,193 160,087
CASH FLOWS FROM INVESTING ACTIVITIES
Interest received 6,915 8,038 Proceeds from sale of property, plant and equipment 600 170 Purchase of property, plant and equipment (29,970) (26,279) Proceeds from term deposits 64,100 26,000 Proceeds from sale of subordinated notes 32,000 10,000 Payment for subordinated notes (18,800) (14,200) Proceeds from sale of financial assets held for trading 16,663 9,553 Payment for financial assets held for trading (29,732) (11,074) Payment for derivative financial assets (13,301) - Payment for deferred exploration and evaluation expenditure (146) (69) Payment for mine development (184,967) (64,285)
NET CASH FLOWS (USED IN) INVESTING ACTIVITIES (156,638) (62,146)
CASH FLOWS FROM FINANCING ACTIVITIES
Proceeds from issue of ordinary shares 581 - Repayment of insurance premium funding facility - (1,753) Payment of lease liabilities (10,145) (6,612) Payment of borrowing costs (122) (218) Dividends paid (16,271) (26,380)
NET CASH FLOWS (USED IN) FINANCING ACTIVITIES (25,957) (34,963)
NET INCREASE/(DECREASE) IN CASH AND CASH EQUIVALENTS (17,402) 62,978
Net foreign exchange difference 1,024 (167) Cash and cash equivalents at beginning of year 111,661 48,850
CASH AND CASH EQUIVALENTS AT END OF YEAR 6[a] 95,283 111,661
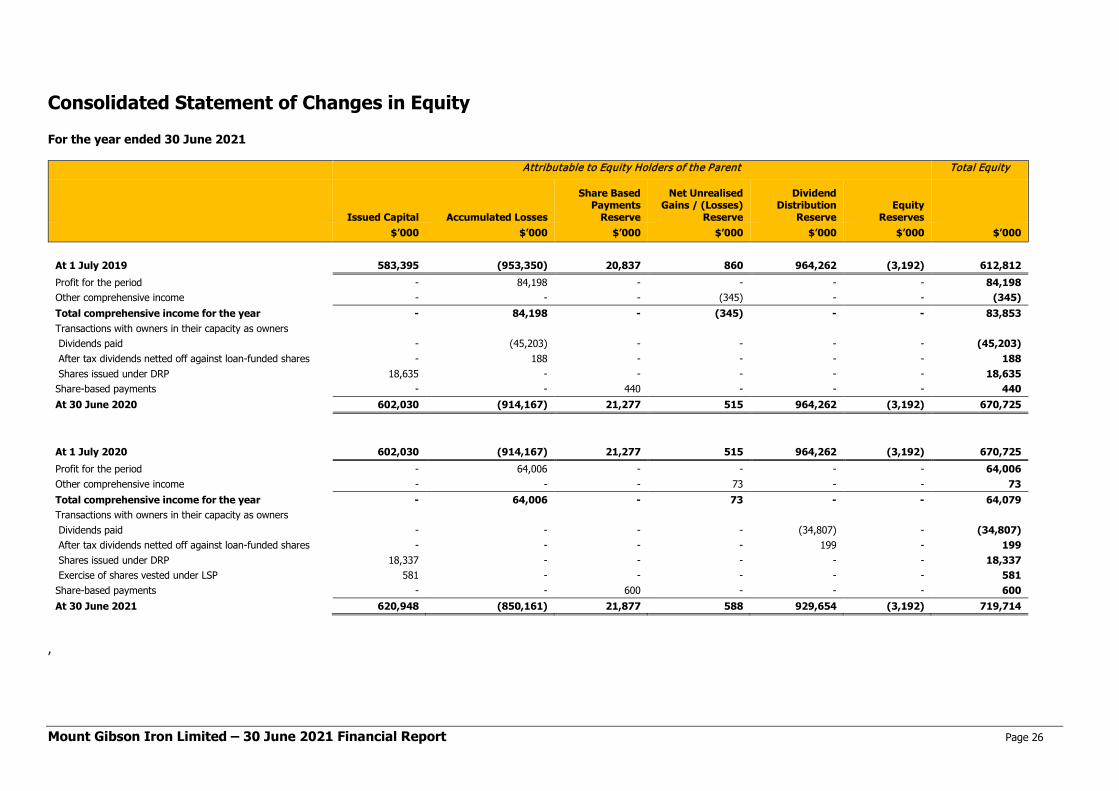
Mount Gibson Iron Limited – 30 June 2021 Financial Report Page 26
Consolidated Statement of Changes in Equity For the year ended 30 June 2021
Attributable to Equity Holders of the Parent Total Equity
Issued Capital Accumulated Losses
Share Based Payments
Reserve
Net Unrealised Gains / (Losses)
Reserve
Dividend Distribution
Reserve Equity
Reserves $’000 $’000 $’000 $’000 $’000 $’000 $’000 At 1 July 2019 583,395 (953,350) 20,837 860 964,262 (3,192) 612,812 Profit for the period - 84,198 - - - - 84,198 Other comprehensive income - - - (345) - - (345) Total comprehensive income for the year - 84,198 - (345) - - 83,853 Transactions with owners in their capacity as owners Dividends paid - (45,203) - - - - (45,203) After tax dividends netted off against loan-funded shares - 188 - - - - 188 Shares issued under DRP 18,635 - - - - - 18,635 Share-based payments - - 440 - - - 440 At 30 June 2020 602,030 (914,167) 21,277 515 964,262 (3,192) 670,725
At 1 July 2020 602,030 (914,167) 21,277 515 964,262 (3,192) 670,725 Profit for the period - 64,006 - - - - 64,006 Other comprehensive income - - - 73 - - 73 Total comprehensive income for the year - 64,006 - 73 - - 64,079 Transactions with owners in their capacity as owners Dividends paid - - - - (34,807) - (34,807) After tax dividends netted off against loan-funded shares - - - - 199 - 199 Shares issued under DRP 18,337 - - - - - 18,337 Exercise of shares vested under LSP 581 - - - - - 581 Share-based payments - - 600 - - - 600 At 30 June 2021 620,948 (850,161) 21,877 588 929,654 (3,192) 719,714
,
Mount Gibson Iron Limited – 30 June 2021 Financial Report Page 27
Notes to the Consolidated Financial Report For the year ended 30 June 2021
(a) Corporate information The consolidated financial statements of the Group, comprising the Company and the entities that it controlled during the year ended 30 June 2021, were authorised for issue in accordance with a resolution of the Directors on 24 August 2021. The Company is a company limited by shares incorporated in Australia whose shares are publicly traded on the Australian Securities Exchange. The nature of operations and principal activities of the Group are the mining and export of hematite iron ore from the Mid-West region of Western Australia and Koolan Island in the Kimberley region of Western Australia, treasury management and the pursuit of mineral resources acquisitions and investments. The address of the registered office is Level 1, 2 Kings Park Road, West Perth, Western Australia, 6005, Australia.
(b) Basis of preparation The financial report is a general-purpose financial report, which has been prepared in accordance with the requirements of the Corporations Act 2001, applicable Australian Accounting Standards and other authoritative pronouncements of the Australian Accounting Standards Board. The financial report complies with Australian Accounting Standards as issued by the Australian Accounting Standards Board and International Financial Reporting Standards (IFRS) as issued by the International Accounting Standards Board. The financial report has been prepared on a historical cost basis, except for derivative financial instruments and certain financial assets that have been measured at fair value. The Group has adopted all Accounting Standards and Interpretations mandatory to annual periods beginning on or before 1 July 2020. Adoption of these standards and interpretations did not have a material effect on the financial position or performance of the Group at the date of initial application. The accounting policies adopted are consistent with those followed in the preparation of the Group’s annual consolidated financial statements for the year ended 30 June 2020, except for the adoption of new standards and interpretations as of 1 July 2020. The financial report is presented in Australian dollars and all values are rounded to the nearest thousand dollars ($’000) unless otherwise stated, under the option available to the Company under Australian Securities and Investment Commission (ASIC) (Rounding in Financial/Directors’ Report) Instrument 2016/191. The Company is an entity to which the instrument applies. For the purposes of preparing the consolidated financial statements, the Company is a for-profit entity.
(c) Basis of consolidation The consolidated financial statements comprise the financial statements of the Company and its controlled entities. The financial statements of controlled entities are prepared for the same reporting period as the Company, using consistent accounting policies. Adjustments are made to bring into line any dissimilar accounting policies that may exist. All intercompany balances and transactions, including unrealised profits arising from intra-group transactions, have been eliminated in full. Unrealised losses are eliminated unless costs cannot be recovered. Control is achieved when the Group is exposed, or has rights, to variable returns from its involvement with the investee and has the ability to affect those returns through its power over the investee. Controlled entities are consolidated from the date on which control is transferred to the Group and cease to be consolidated from the date on which control is transferred out of the Group. Where there is loss of control of a controlled entity, the consolidated financial statements include the results for the part of the reporting period during which the Company has control.
1. Introduction
Notes to the Consolidated Financial Report (continued)
Mount Gibson Iron Limited – 30 June 2021 Financial Report Page 28
(a) Foreign currency The functional currency of the Company and its controlled entities is Australian dollars (A$). Transactions in foreign currencies are initially recorded in the functional currency at the exchange rates ruling at the date of the transaction. Monetary assets and liabilities denominated in foreign currencies are retranslated at the rate of exchange ruling at the balance sheet date. All such exchange differences are taken to the income statement in the consolidated financial report.
(b) Other taxes Revenues, expenses and assets are recognised net of the amount of Goods and Services Tax (GST) except: • where the GST incurred on a purchase of goods and services is not recoverable from the taxation authority, in which case the
GST is recognised as part of the cost of acquisition of the asset or as part of the expense item as applicable; and • receivables and payables are stated with the amount of GST included. The net amount of GST recoverable from, or payable to, the taxation authority is included as part of receivables or payables in the balance sheet. Cash flows are included in the Cash Flow Statement on a gross basis and the GST component of cash flows arising from investing and financing activities, which is recoverable from, or payable to, the taxation authority are classified as operating cash flows. Commitments and contingencies are disclosed net of the amount of GST recoverable from, or payable to, the taxation authority.
(c) Other accounting policies Other significant accounting policies that summarise the measurement basis used and are relevant to an understanding of the financial statements are provided throughout the notes to the financial statements.
(d) Key accounting judgements, estimates and assumptions In the process of applying the Group’s accounting policies, management has made a number of judgements and applied estimates of future events. Significant judgements and estimates which are material to the financial statements are provided throughout the notes to the financial statements. Other significant accounting judgements, estimates and assumptions not provided in the notes to the financial statements are as follows: Determination of mineral resources and ore reserves The Group estimates its mineral resources and ore reserves in accordance with the Australasian Code for Reporting of Exploration Results, Mineral Resources and Ore Reserves 2012 (the “JORC Code”). The information on mineral resources and ore reserves was prepared by or under the supervision of Competent Persons as defined in the JORC Code. The amounts presented are based on the mineral resources and ore reserves determined under the JORC Code. There are numerous uncertainties inherent in estimating mineral resources and ore reserves and assumptions that are valid at the time of estimation which (or and) may change significantly when new information becomes available. Changes in the forecast prices of commodities, exchange rates, production costs or recovery rates may change the economic status of reserves and may, ultimately, result in the ore reserves being restated. Such changes in the ore reserves could impact depreciation and amortisation rates, asset carrying values, deferred stripping costs and provisions for decommissioning and restoration.
2. Other Significant Accounting Policies
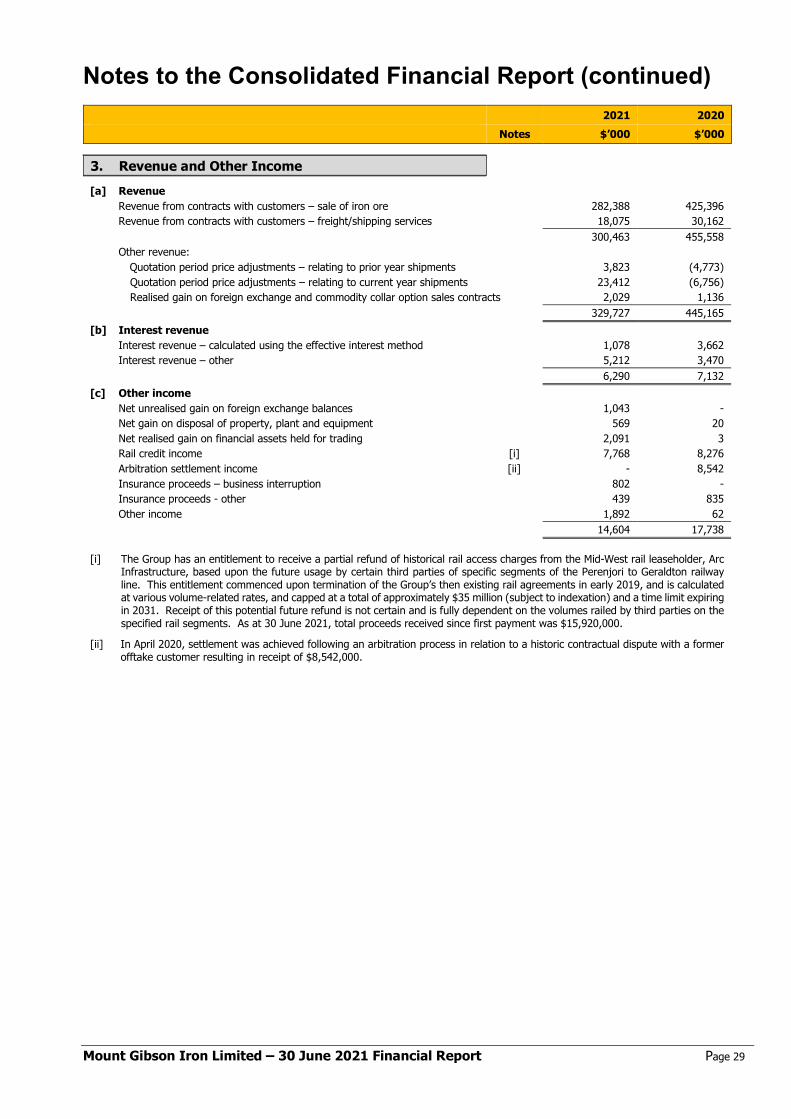
Notes to the Consolidated Financial Report (continued)
Mount Gibson Iron Limited – 30 June 2021 Financial Report Page 29
2021 2020 Notes $’000 $’000
[a] Revenue
Revenue from contracts with customers – sale of iron ore 282,388 425,396 Revenue from contracts with customers – freight/shipping services 18,075 30,162 300,463 455,558 Other revenue:
Quotation period price adjustments – relating to prior year shipments 3,823 (4,773) Quotation period price adjustments – relating to current year shipments 23,412 (6,756) Realised gain on foreign exchange and commodity collar option sales contracts 2,029 1,136
329,727 445,165 [b] Interest revenue
Interest revenue – calculated using the effective interest method 1,078 3,662 Interest revenue – other 5,212 3,470 6,290 7,132
[c] Other income Net unrealised gain on foreign exchange balances 1,043 - Net gain on disposal of property, plant and equipment 569 20 Net realised gain on financial assets held for trading 2,091 3 Rail credit income [i] 7,768 8,276 Arbitration settlement income [ii] - 8,542 Insurance proceeds – business interruption 802 - Insurance proceeds - other 439 835 Other income 1,892 62 14,604 17,738
[i] The Group has an entitlement to receive a partial refund of historical rail access charges from the Mid-West rail leaseholder, Arc Infrastructure, based upon the future usage by certain third parties of specific segments of the Perenjori to Geraldton railway line. This entitlement commenced upon termination of the Group’s then existing rail agreements in early 2019, and is calculated at various volume-related rates, and capped at a total of approximately $35 million (subject to indexation) and a time limit expiring in 2031. Receipt of this potential future refund is not certain and is fully dependent on the volumes railed by third parties on the specified rail segments. As at 30 June 2021, total proceeds received since first payment was $15,920,000.
[ii] In April 2020, settlement was achieved following an arbitration process in relation to a historic contractual dispute with a former offtake customer resulting in receipt of $8,542,000.
3. Revenue and Other Income
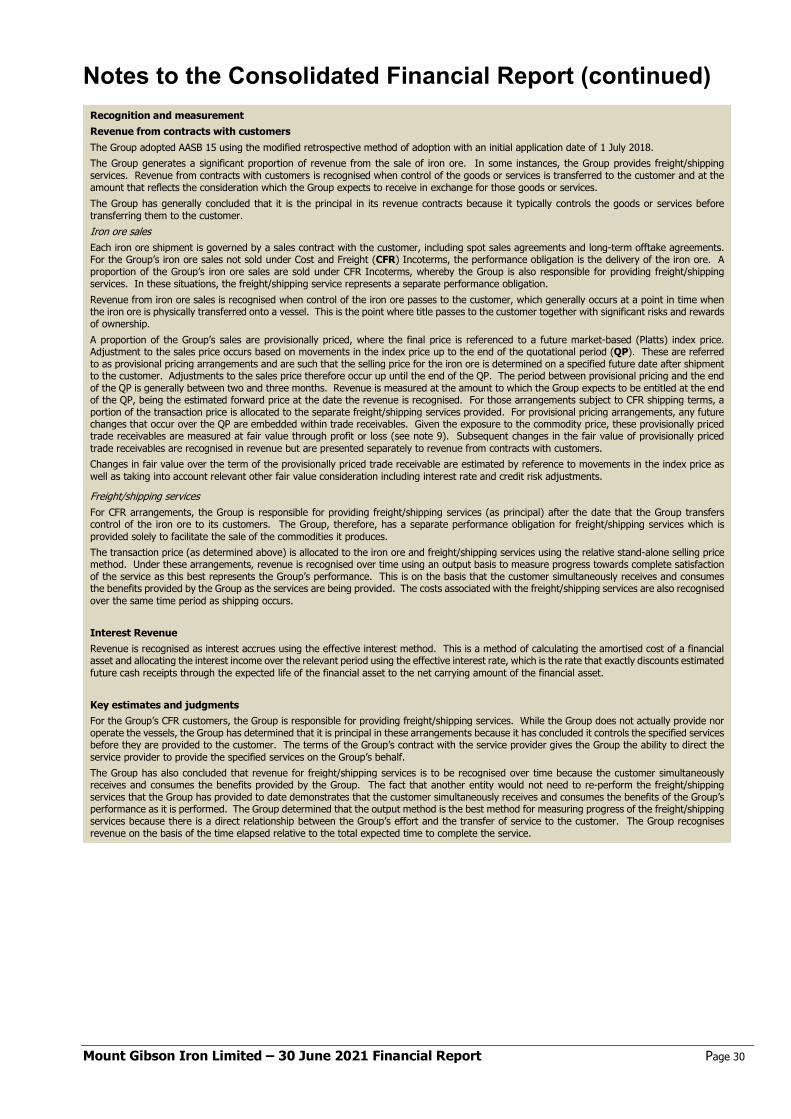
Notes to the Consolidated Financial Report (continued)
Mount Gibson Iron Limited – 30 June 2021 Financial Report Page 30
Recognition and measurement Revenue from contracts with customers The Group adopted AASB 15 using the modified retrospective method of adoption with an initial application date of 1 July 2018. The Group generates a significant proportion of revenue from the sale of iron ore. In some instances, the Group provides freight/shipping services. Revenue from contracts with customers is recognised when control of the goods or services is transferred to the customer and at the amount that reflects the consideration which the Group expects to receive in exchange for those goods or services. The Group has generally concluded that it is the principal in its revenue contracts because it typically controls the goods or services before transferring them to the customer. Iron ore sales Each iron ore shipment is governed by a sales contract with the customer, including spot sales agreements and long-term offtake agreements. For the Group’s iron ore sales not sold under Cost and Freight (CFR) Incoterms, the performance obligation is the delivery of the iron ore. A proportion of the Group’s iron ore sales are sold under CFR Incoterms, whereby the Group is also responsible for providing freight/shipping services. In these situations, the freight/shipping service represents a separate performance obligation. Revenue from iron ore sales is recognised when control of the iron ore passes to the customer, which generally occurs at a point in time when the iron ore is physically transferred onto a vessel. This is the point where title passes to the customer together with significant risks and rewards of ownership. A proportion of the Group’s sales are provisionally priced, where the final price is referenced to a future market-based (Platts) index price. Adjustment to the sales price occurs based on movements in the index price up to the end of the quotational period (QP). These are referred to as provisional pricing arrangements and are such that the selling price for the iron ore is determined on a specified future date after shipment to the customer. Adjustments to the sales price therefore occur up until the end of the QP. The period between provisional pricing and the end of the QP is generally between two and three months. Revenue is measured at the amount to which the Group expects to be entitled at the end of the QP, being the estimated forward price at the date the revenue is recognised. For those arrangements subject to CFR shipping terms, a portion of the transaction price is allocated to the separate freight/shipping services provided. For provisional pricing arrangements, any future changes that occur over the QP are embedded within trade receivables. Given the exposure to the commodity price, these provisionally priced trade receivables are measured at fair value through profit or loss (see note 9). Subsequent changes in the fair value of provisionally priced trade receivables are recognised in revenue but are presented separately to revenue from contracts with customers. Changes in fair value over the term of the provisionally priced trade receivable are estimated by reference to movements in the index price as well as taking into account relevant other fair value consideration including interest rate and credit risk adjustments.
Freight/shipping services For CFR arrangements, the Group is responsible for providing freight/shipping services (as principal) after the date that the Group transfers control of the iron ore to its customers. The Group, therefore, has a separate performance obligation for freight/shipping services which is provided solely to facilitate the sale of the commodities it produces. The transaction price (as determined above) is allocated to the iron ore and freight/shipping services using the relative stand-alone selling price method. Under these arrangements, revenue is recognised over time using an output basis to measure progress towards complete satisfaction of the service as this best represents the Group’s performance. This is on the basis that the customer simultaneously receives and consumes the benefits provided by the Group as the services are being provided. The costs associated with the freight/shipping services are also recognised over the same time period as shipping occurs. Interest Revenue Revenue is recognised as interest accrues using the effective interest method. This is a method of calculating the amortised cost of a financial asset and allocating the interest income over the relevant period using the effective interest rate, which is the rate that exactly discounts estimated future cash receipts through the expected life of the financial asset to the net carrying amount of the financial asset. Key estimates and judgments For the Group’s CFR customers, the Group is responsible for providing freight/shipping services. While the Group does not actually provide nor operate the vessels, the Group has determined that it is principal in these arrangements because it has concluded it controls the specified services before they are provided to the customer. The terms of the Group’s contract with the service provider gives the Group the ability to direct the service provider to provide the specified services on the Group’s behalf. The Group has also concluded that revenue for freight/shipping services is to be recognised over time because the customer simultaneously receives and consumes the benefits provided by the Group. The fact that another entity would not need to re-perform the freight/shipping services that the Group has provided to date demonstrates that the customer simultaneously receives and consumes the benefits of the Group’s performance as it is performed. The Group determined that the output method is the best method for measuring progress of the freight/shipping services because there is a direct relationship between the Group’s effort and the transfer of service to the customer. The Group recognises revenue on the basis of the time elapsed relative to the total expected time to complete the service.

Notes to the Consolidated Financial Report (continued)
Mount Gibson Iron Limited – 30 June 2021 Financial Report Page 31
2021 2020 Notes $’000 $’000
[a] Cost of sales
Mining and site administration costs 207,432 172,892 Depreciation of property, plant and equipment – mining and site administration 10,023 5,321 Depreciation of right-of-use assets – mining and site administration 8,868 5,908 Capitalised deferred stripping costs 16 (148,630) (44,564) Amortisation of capitalised deferred stripping costs 16 11,074 12,150 Amortisation of mine properties 16 11,591 19,073 Pre-production expenditure capitalised (4,538) - Crushing costs 18,099 21,754 Depreciation of property, plant and equipment – crushing 1,300 1,125 Depreciation of right-of-use assets – crushing 620 330 Transport costs 26,298 59,194 Port costs 10,594 20,987 Depreciation of property, plant and equipment – port 94 26 Depreciation of right-of-use assets - port 139 - Royalties 27,142 35,416 Net ore inventory movement 14,383 (10,123) (Reversal of)/write down to net realisable value on ore inventories 10[i] 4,062 (570) Rehabilitation revised estimate adjustments 21 (1,796) (83) Cost of sales – Free on Board (FOB) basis 196,755 298,836 Shipping freight 18,075 30,162 Cost of sales – Cost and Freight (CFR) basis 214,830 328,998
[b] Finance costs Finance charges on banking facilities 202 464 Finance charges on lease liabilities 377 514 579 978 Non-cash interest accretion on rehabilitation provision 21 261 524 840 1,502
[c] Net foreign exchange loss Net realised loss on foreign exchange transactions 6,467 2,028 Net unrealised loss on foreign exchange balances - 167 6,467 2,195
[d] Net unrealised marked-to-market loss Unrealised marked-to-market (gain)/loss on foreign exchange derivatives 863 (123) Unrealised marked-to-market loss on commodity collar option derivatives 27,359 - Unrealised marked-to-market (gain)/loss on financial assets held for trading (6,351) 3,315 21,871 3,192
[e] Administration and other expenses include: Depreciation of property, plant and equipment 142 124 Depreciation of right-of-use assets 538 585 Share-based payments expense 26(a) 600 440 Koolan Island seawall insurance claim and related site work expenses 943 1,224 Insurance premiums (net of refunds) 1,589 1,091 Business development expenses 35 6 Reversal of expected credit loss on debtors - (28) Reversal of write down to net realisable value on consumables inventories (680) (962) Exploration expenses 15 146 69
[f] Cost of sales and Administration and other expenses above include: Salaries, wages expense and other employee benefits 59,767 52,238 Lease expense – short-term 7,615 9,474 Lease expense – low value assets 248 212 Lease expense – variable 1,365 1,533
4. Expenses

Notes to the Consolidated Financial Report (continued)
Mount Gibson Iron Limited – 30 June 2021 Financial Report Page 32
Recognition and measurement Employee benefits expense Wages, salaries, sick leave and other employee benefits Liabilities for wages and salaries, including non-monetary benefits and other employee benefits expected to be settled within 12 months of the reporting date are recognised in other payables in respect of employees' services up to the reporting date. They are measured at the amounts expected to be paid when the liabilities are settled. Liabilities for sick leave are recognised when the leave is taken and are measured at the rates paid or payable. Redundancy Provision is made for redundancy payments where positions have been identified as excess to requirements, the Group has communicated a detailed and formal plan and a reliable estimate of the amount payable can be determined. Refer to note 21 for further details on redundancy (restructure) provision. Annual leave and long service leave The Group expects its annual leave benefits to be settled wholly within 12 months of each reporting date. The obligation is measured at the amount expected to be paid when the liabilities are settled. The liability for long service leave is recognised in the provision for employee benefits and measured as the present value of future payments to be made in respect of services provided by employees up to the reporting date. Consideration is given to future wage and salary levels, experience of employee departures and periods of service. Future payments are discounted using market yields at the reporting date on high quality corporate bonds with terms to maturity and currencies that match, as closely as possible, the estimated future cash outflows. Share-Based Payment Plans The policy relating to share-based payments is set out in note 26. Superannuation Contributions made by the Group to employee superannuation funds, which are defined contribution plans, are charged as an expense when incurred. Borrowing costs Borrowing costs are recognised as an expense when incurred except for borrowing costs that are directly attributable to the acquisition, construction or production of a qualifying asset which are capitalised as part of the cost of that asset. Short-term leases and leases of low-value assets The Group applies the short-term lease recognition exemption to its short-term leases of plant, machinery and equipment (leases that have a lease term of 12 months or less from the commencement date and do not contain a purchase option). It also applies the lease of low-value assets recognition exemption to leases of plant and equipment that are considered of low value. Lease payments on short-term lease and leases of low-value assets are recognised as an expense on a straight-line basis over the lease term. Depreciation and amortisation Refer to notes 13 and 16 for details on depreciation and amortisation. Impairment Impairment expenses are recognised to the extent that the carrying amounts of assets exceed their recoverable amounts. Refer to note 17 for further details on impairment.
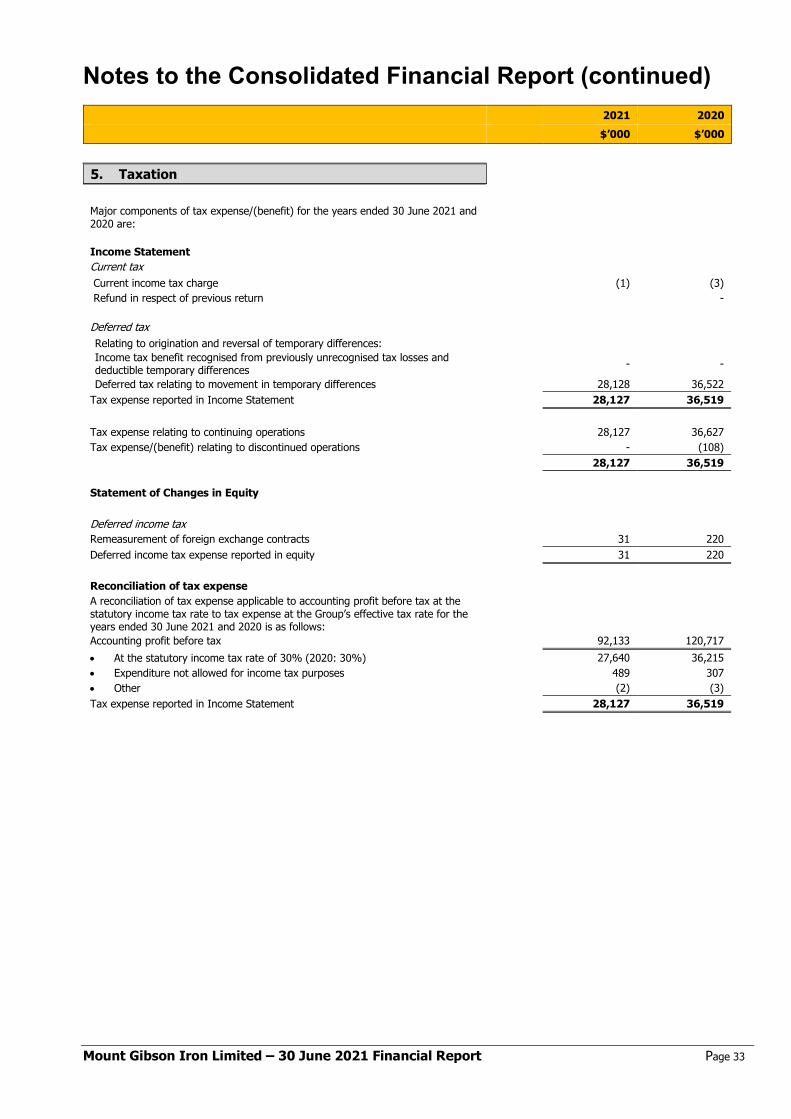
Notes to the Consolidated Financial Report (continued)
Mount Gibson Iron Limited – 30 June 2021 Financial Report Page 33
2021 2020 $’000 $’000
Major components of tax expense/(benefit) for the years ended 30 June 2021 and 2020 are:
Income Statement Current tax Current income tax charge (1) (3) Refund in respect of previous return - Deferred tax Relating to origination and reversal of temporary differences: Income tax benefit recognised from previously unrecognised tax losses and deductible temporary differences - -
Deferred tax relating to movement in temporary differences 28,128 36,522 Tax expense reported in Income Statement 28,127 36,519 Tax expense relating to continuing operations 28,127 36,627 Tax expense/(benefit) relating to discontinued operations - (108) 28,127 36,519 Statement of Changes in Equity Deferred income tax Remeasurement of foreign exchange contracts 31 220 Deferred income tax expense reported in equity 31 220 Reconciliation of tax expense A reconciliation of tax expense applicable to accounting profit before tax at the statutory income tax rate to tax expense at the Group’s effective tax rate for the years ended 30 June 2021 and 2020 is as follows:
Accounting profit before tax 92,133 120,717 • At the statutory income tax rate of 30% (2020: 30%) 27,640 36,215 • Expenditure not allowed for income tax purposes 489 307 • Other (2) (3) Tax expense reported in Income Statement 28,127 36,519
5. Taxation
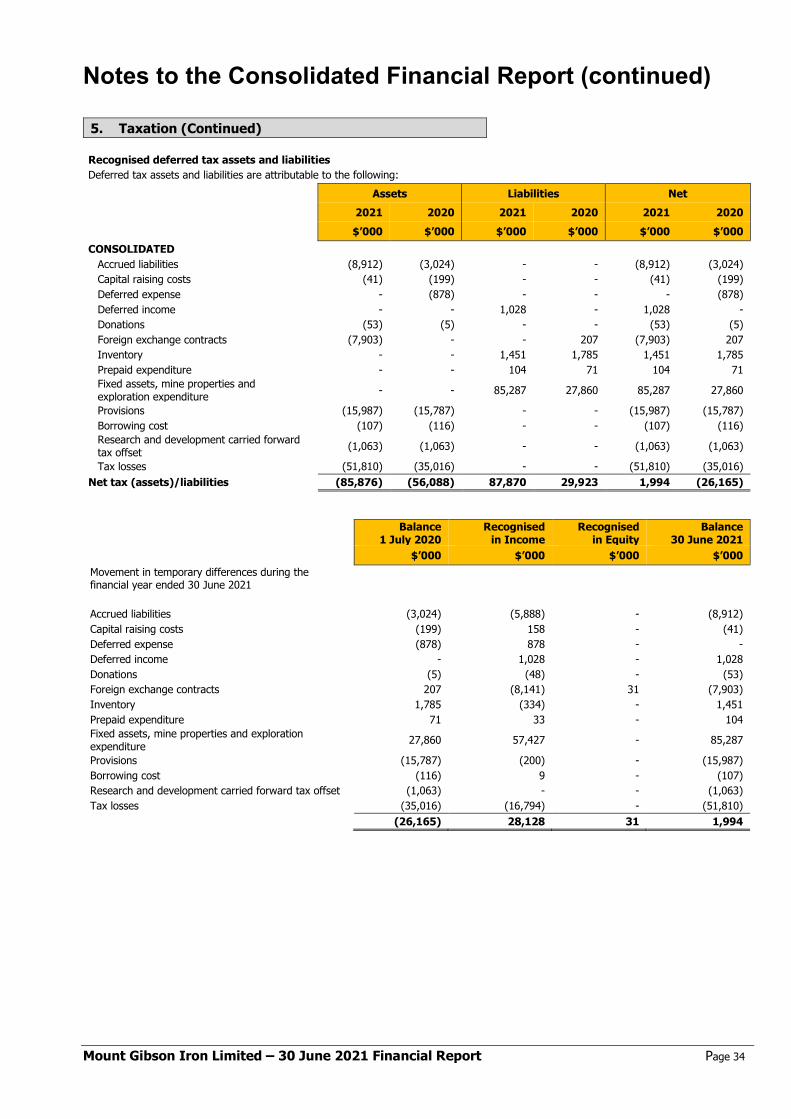
Notes to the Consolidated Financial Report (continued)
Mount Gibson Iron Limited – 30 June 2021 Financial Report Page 34
5. Taxation (Continued) Recognised deferred tax assets and liabilities Deferred tax assets and liabilities are attributable to the following: Assets Liabilities Net 2021 2020 2021 2020 2021 2020 $’000 $’000 $’000 $’000 $’000 $’000 CONSOLIDATED
Accrued liabilities (8,912) (3,024) - - (8,912) (3,024) Capital raising costs (41) (199) - - (41) (199) Deferred expense - (878) - - - (878) Deferred income - - 1,028 - 1,028 - Donations (53) (5) - - (53) (5) Foreign exchange contracts (7,903) - - 207 (7,903) 207 Inventory - - 1,451 1,785 1,451 1,785 Prepaid expenditure - - 104 71 104 71 Fixed assets, mine properties and exploration expenditure - - 85,287 27,860 85,287 27,860
Provisions (15,987) (15,787) - - (15,987) (15,787) Borrowing cost (107) (116) - - (107) (116) Research and development carried forward tax offset (1,063) (1,063) - - (1,063) (1,063)
Tax losses (51,810) (35,016) - - (51,810) (35,016) Net tax (assets)/liabilities (85,876) (56,088) 87,870 29,923 1,994 (26,165)
Balance 1 July 2020
Recognised in Income
Recognised in Equity
Balance 30 June 2021
$’000 $’000 $’000 $’000 Movement in temporary differences during the financial year ended 30 June 2021
Accrued liabilities (3,024) (5,888) - (8,912) Capital raising costs (199) 158 - (41) Deferred expense (878) 878 - - Deferred income - 1,028 - 1,028 Donations (5) (48) - (53) Foreign exchange contracts 207 (8,141) 31 (7,903) Inventory 1,785 (334) - 1,451 Prepaid expenditure 71 33 - 104 Fixed assets, mine properties and exploration expenditure 27,860 57,427 - 85,287
Provisions (15,787) (200) - (15,987) Borrowing cost (116) 9 - (107) Research and development carried forward tax offset (1,063) - - (1,063) Tax losses (35,016) (16,794) - (51,810) (26,165) 28,128 31 1,994
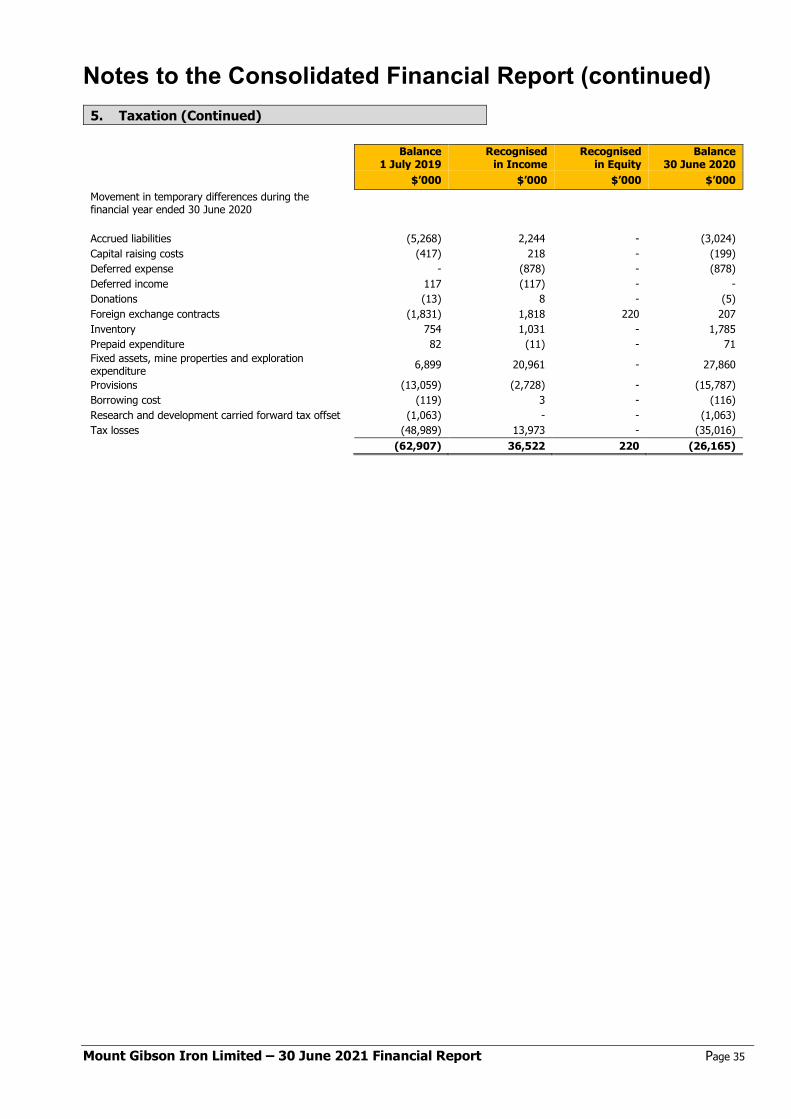
Notes to the Consolidated Financial Report (continued)
Mount Gibson Iron Limited – 30 June 2021 Financial Report Page 35
5. Taxation (Continued)
Balance 1 July 2019
Recognised in Income
Recognised in Equity
Balance 30 June 2020
$’000 $’000 $’000 $’000 Movement in temporary differences during the financial year ended 30 June 2020
Accrued liabilities (5,268) 2,244 - (3,024) Capital raising costs (417) 218 - (199) Deferred expense - (878) - (878) Deferred income 117 (117) - - Donations (13) 8 - (5) Foreign exchange contracts (1,831) 1,818 220 207 Inventory 754 1,031 - 1,785 Prepaid expenditure 82 (11) - 71 Fixed assets, mine properties and exploration expenditure 6,899 20,961 - 27,860
Provisions (13,059) (2,728) - (15,787) Borrowing cost (119) 3 - (116) Research and development carried forward tax offset (1,063) - - (1,063) Tax losses (48,989) 13,973 - (35,016) (62,907) 36,522 220 (26,165)
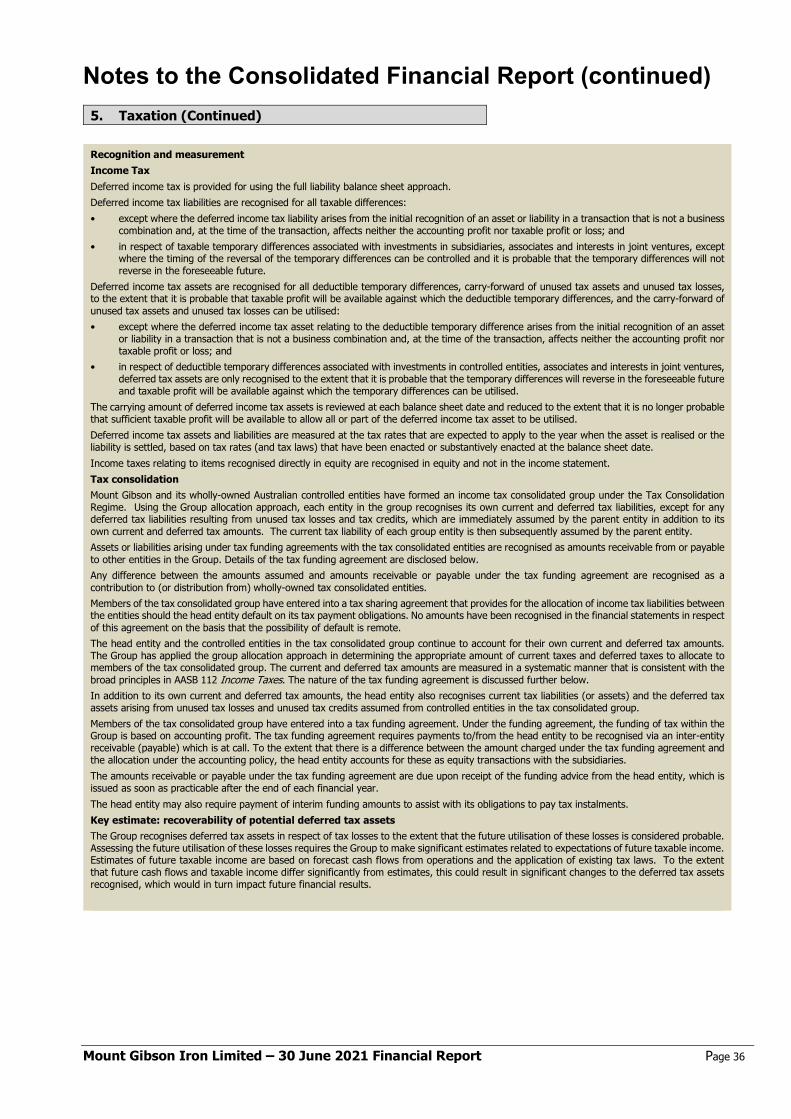
Notes to the Consolidated Financial Report (continued)
Mount Gibson Iron Limited – 30 June 2021 Financial Report Page 36
5. Taxation (Continued)
Recognition and measurement Income Tax Deferred income tax is provided for using the full liability balance sheet approach. Deferred income tax liabilities are recognised for all taxable differences: • except where the deferred income tax liability arises from the initial recognition of an asset or liability in a transaction that is not a business
combination and, at the time of the transaction, affects neither the accounting profit nor taxable profit or loss; and • in respect of taxable temporary differences associated with investments in subsidiaries, associates and interests in joint ventures, except
where the timing of the reversal of the temporary differences can be controlled and it is probable that the temporary differences will not reverse in the foreseeable future.
Deferred income tax assets are recognised for all deductible temporary differences, carry-forward of unused tax assets and unused tax losses, to the extent that it is probable that taxable profit will be available against which the deductible temporary differences, and the carry-forward of unused tax assets and unused tax losses can be utilised: • except where the deferred income tax asset relating to the deductible temporary difference arises from the initial recognition of an asset
or liability in a transaction that is not a business combination and, at the time of the transaction, affects neither the accounting profit nor taxable profit or loss; and
• in respect of deductible temporary differences associated with investments in controlled entities, associates and interests in joint ventures, deferred tax assets are only recognised to the extent that it is probable that the temporary differences will reverse in the foreseeable future and taxable profit will be available against which the temporary differences can be utilised.
The carrying amount of deferred income tax assets is reviewed at each balance sheet date and reduced to the extent that it is no longer probable that sufficient taxable profit will be available to allow all or part of the deferred income tax asset to be utilised. Deferred income tax assets and liabilities are measured at the tax rates that are expected to apply to the year when the asset is realised or the liability is settled, based on tax rates (and tax laws) that have been enacted or substantively enacted at the balance sheet date. Income taxes relating to items recognised directly in equity are recognised in equity and not in the income statement. Tax consolidation Mount Gibson and its wholly-owned Australian controlled entities have formed an income tax consolidated group under the Tax Consolidation Regime. Using the Group allocation approach, each entity in the group recognises its own current and deferred tax liabilities, except for any deferred tax liabilities resulting from unused tax losses and tax credits, which are immediately assumed by the parent entity in addition to its own current and deferred tax amounts. The current tax liability of each group entity is then subsequently assumed by the parent entity. Assets or liabilities arising under tax funding agreements with the tax consolidated entities are recognised as amounts receivable from or payable to other entities in the Group. Details of the tax funding agreement are disclosed below. Any difference between the amounts assumed and amounts receivable or payable under the tax funding agreement are recognised as a contribution to (or distribution from) wholly-owned tax consolidated entities. Members of the tax consolidated group have entered into a tax sharing agreement that provides for the allocation of income tax liabilities between the entities should the head entity default on its tax payment obligations. No amounts have been recognised in the financial statements in respect of this agreement on the basis that the possibility of default is remote. The head entity and the controlled entities in the tax consolidated group continue to account for their own current and deferred tax amounts. The Group has applied the group allocation approach in determining the appropriate amount of current taxes and deferred taxes to allocate to members of the tax consolidated group. The current and deferred tax amounts are measured in a systematic manner that is consistent with the broad principles in AASB 112 Income Taxes. The nature of the tax funding agreement is discussed further below. In addition to its own current and deferred tax amounts, the head entity also recognises current tax liabilities (or assets) and the deferred tax assets arising from unused tax losses and unused tax credits assumed from controlled entities in the tax consolidated group. Members of the tax consolidated group have entered into a tax funding agreement. Under the funding agreement, the funding of tax within the Group is based on accounting profit. The tax funding agreement requires payments to/from the head entity to be recognised via an inter-entity receivable (payable) which is at call. To the extent that there is a difference between the amount charged under the tax funding agreement and the allocation under the accounting policy, the head entity accounts for these as equity transactions with the subsidiaries. The amounts receivable or payable under the tax funding agreement are due upon receipt of the funding advice from the head entity, which is issued as soon as practicable after the end of each financial year. The head entity may also require payment of interim funding amounts to assist with its obligations to pay tax instalments. Key estimate: recoverability of potential deferred tax assets The Group recognises deferred tax assets in respect of tax losses to the extent that the future utilisation of these losses is considered probable. Assessing the future utilisation of these losses requires the Group to make significant estimates related to expectations of future taxable income. Estimates of future taxable income are based on forecast cash flows from operations and the application of existing tax laws. To the extent that future cash flows and taxable income differ significantly from estimates, this could result in significant changes to the deferred tax assets recognised, which would in turn impact future financial results.

Notes to the Consolidated Financial Report (continued)
Mount Gibson Iron Limited – 30 June 2021 Financial Report Page 37
2021 2020 $’000 $’000
[a] Reconciliation of cash For the purposes of the Cash Flow Statement, cash and cash equivalents comprise the following at 30 June: Cash at bank and on hand 95,283 111,661
95,283 111,661
Cash at bank earns interest at floating daily bank deposit rates. Short-term deposits are made for varying periods of between one day and three months depending on the immediate cash requirements of the Group and earn interest at short-term deposit rates.
Recognition and measurement Cash and short-term deposits in the balance sheet comprise cash at bank and on hand and short-term deposits with an original maturity period of three months or less. For the purposes of the Cash Flow Statement, cash and cash equivalents consist of cash and cash equivalents as defined above, net of outstanding bank overdrafts, if any.
[b] Reconciliation of the net profit after tax to the net cash flows from operations Net profit after tax 64,006 84,198 Adjustments to reconcile profit after tax to net cash flows:
Depreciation of property, plant and equipment 11,559 6,596 Depreciation of right-of-use assets 10,165 6,823 Amortisation of capitalised deferred stripping costs 11,074 12,150 Amortisation of other mine properties 11,591 19,073 Net (gain) on disposal of property, plant and equipment (569) (20) Interest revenue (6,290) (7,132) Exploration expenses written off 146 69 Share based payments 600 440 Borrowing costs 122 218 Interest accretion on rehabilitation provision 261 524 Net ore inventory movement 14,383 (10,123) Rehabilitation provision revised estimate adjustment (1,796) (83) Reversal of expected credit loss on debtors - (28) Reversal of write down to net realisable value on consumables inventories (680) (962) (Reversal of)/write down to net realisable value on ore inventories 4,062 (570) Unrealised (gain)/loss on foreign exchange balances (1,043) 167 Unrealised marked-to-market (gain)/loss on foreign exchange derivatives 863 (123) Unrealised marked-to-market (gain)/loss on commodity collar option derivatives 27,359 (6,039) Unrealised marked-to-market (gain)/loss on financial assets held for trading (6,351) 3,315 Realised (gain) on sale of financial assets held for trading (2,091) (3)
Changes in assets and liabilities: Decrease in trade and other receivables 7,822 14,519 (Increase) in inventory (4,493) (3,856) (Increase)/decrease in prepayments (3,678) 733 Decrease in deferred tax assets 26,165 36,522 Increase in trade and other payables 2,288 3,290 Increase in employee benefits 698 1,275 (Decrease) in provision for restructure (521) (5) (Decrease) in other provisions (2,421) (881) Increase in deferred tax liabilities 1,962 -
Net Cash Flow from Operating Activities 165,193 160,087
[c] Non-cash financing activities There were $16,936,000 of non-cash financing activities relating to leases of right-of-use assets during the year ended 30 June 2021.
6. Cash and Cash Equivalents
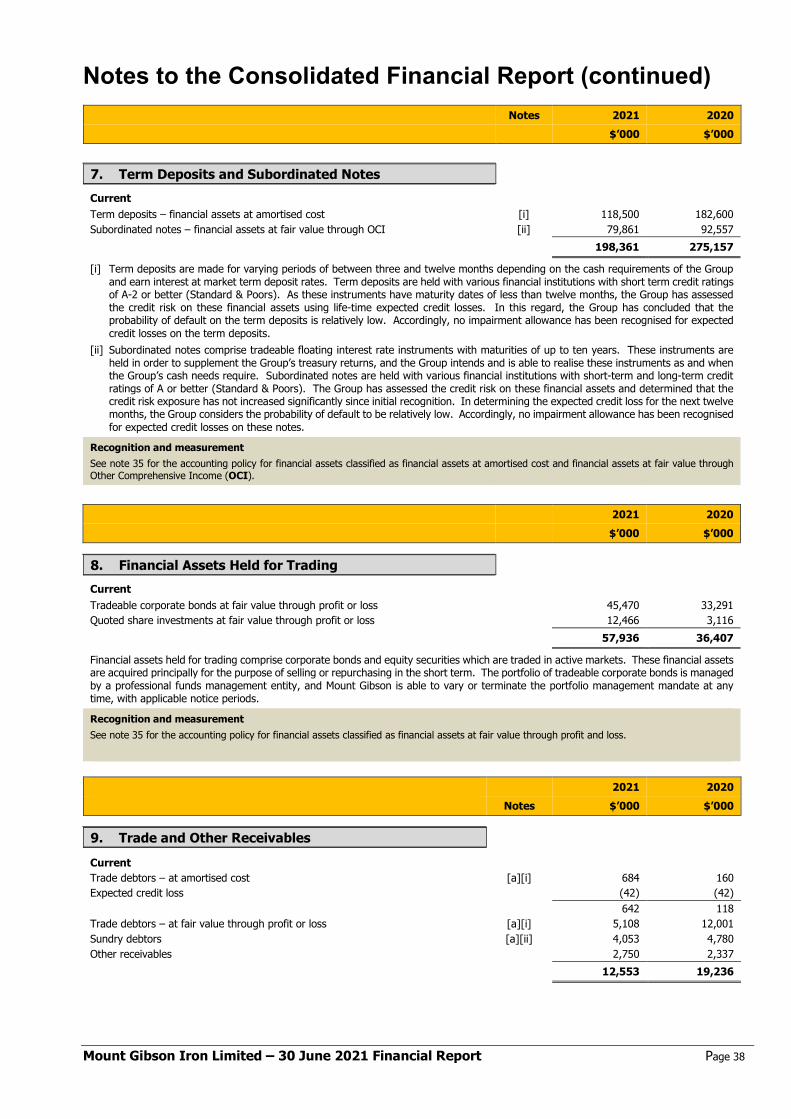
Notes to the Consolidated Financial Report (continued)
Mount Gibson Iron Limited – 30 June 2021 Financial Report Page 38
Notes 2021 2020 $’000 $’000
Current Term deposits – financial assets at amortised cost [i] 118,500 182,600 Subordinated notes – financial assets at fair value through OCI [ii] 79,861 92,557 198,361 275,157
[i] Term deposits are made for varying periods of between three and twelve months depending on the cash requirements of the Group and earn interest at market term deposit rates. Term deposits are held with various financial institutions with short term credit ratings of A-2 or better (Standard & Poors). As these instruments have maturity dates of less than twelve months, the Group has assessed the credit risk on these financial assets using life-time expected credit losses. In this regard, the Group has concluded that the probability of default on the term deposits is relatively low. Accordingly, no impairment allowance has been recognised for expected credit losses on the term deposits.
[ii] Subordinated notes comprise tradeable floating interest rate instruments with maturities of up to ten years. These instruments are held in order to supplement the Group’s treasury returns, and the Group intends and is able to realise these instruments as and when the Group’s cash needs require. Subordinated notes are held with various financial institutions with short-term and long-term credit ratings of A or better (Standard & Poors). The Group has assessed the credit risk on these financial assets and determined that the credit risk exposure has not increased significantly since initial recognition. In determining the expected credit loss for the next twelve months, the Group considers the probability of default to be relatively low. Accordingly, no impairment allowance has been recognised for expected credit losses on these notes.
Recognition and measurement See note 35 for the accounting policy for financial assets classified as financial assets at amortised cost and financial assets at fair value through Other Comprehensive Income (OCI).
2021 2020 $’000 $’000
Current Tradeable corporate bonds at fair value through profit or loss 45,470 33,291 Quoted share investments at fair value through profit or loss 12,466 3,116 57,936 36,407
Financial assets held for trading comprise corporate bonds and equity securities which are traded in active markets. These financial assets are acquired principally for the purpose of selling or repurchasing in the short term. The portfolio of tradeable corporate bonds is managed by a professional funds management entity, and Mount Gibson is able to vary or terminate the portfolio management mandate at any time, with applicable notice periods.
Recognition and measurement See note 35 for the accounting policy for financial assets classified as financial assets at fair value through profit and loss.
2021 2020 Notes $’000 $’000
Current Trade debtors – at amortised cost [a][i] 684 160 Expected credit loss (42) (42) 642 118 Trade debtors – at fair value through profit or loss [a][i] 5,108 12,001 Sundry debtors [a][ii] 4,053 4,780 Other receivables 2,750 2,337 12,553 19,236
7. Term Deposits and Subordinated Notes
8. Financial Assets Held for Trading
9. Trade and Other Receivables

Notes to the Consolidated Financial Report (continued)
Mount Gibson Iron Limited – 30 June 2021 Financial Report Page 39
[a] Terms and conditions Terms and conditions relating to the above financial instruments: [i] Generally, on presentation of ship loading documents and the provisional invoice, the customer settles 95% of the provisional sales
invoice value within 10 days and the remaining 5% is settled within 30 days of presentation of the final invoice. The vast majority of sales are invoiced and received in US dollars (US$). The balance of other trade debtors is invoiced and received in Australian dollars (A$).
[ii] Sundry debtors are non-interest bearing and have repayment terms between 30 and 90 days. There is an insignificant probability of default as sundry debtors are short term, have no history of default and customers have passed the Group’s internal credit assessment.
Recognition and measurement See note 35 for the accounting policy for financial assets.
2021 2020 Notes $’000 $’000
Consumables – at cost 25,100 20,748 Write down to net realisable value (NRV) (3,655) (4,478) 21,445 16,270 Ore – at cost 9,147 23,530 Write down to NRV (4,062) - At lower of cost and NRV 5,085 23,530 Total inventories 26,530 39,800
[i] At 30 June 2021, the Group assessed the carrying values of ore inventories stockpiled at Mid-West and Koolan Island mine sites. Assumptions used in the assessment include prevailing and anticipated iron ore prices and exchange rates, ore specifications, estimated costs to make the ore inventories available for sale, and associated sales and shipping freight costs.
Based on these assumptions, the following (write down) / reversals of write down on ore inventories were recorded during the financial period:
2021 2020 $’000 $’000 Extension Hill - 570 Koolan Island (4,062) - Total (write down) / reversal of write down to NRV (4,062) 570
Recognition and measurement Inventories are carried at the lower of cost and net realisable value. For iron ore, cost comprises direct material, labour and expenditure in getting such inventories to their existing location and condition, based on weighted average costs incurred during the period in which such inventories were produced. Net realisable value is the estimated selling price in the ordinary course of business, less estimated costs of completion and the estimated costs necessary to make the sale. Consumables relating to plant and equipment are recognised as inventory. Consumable stocks are carried at cost less accumulated impairment. Key estimate Consumables are written down to net realisable value if considered damaged or, have become wholly or partially obsolete. A new assessment is made of the write down in each subsequent period.
10. Inventories

Notes to the Consolidated Financial Report (continued)
Mount Gibson Iron Limited – 30 June 2021 Financial Report Page 40
2021 2020 Notes $’000 $’000
Current Foreign currency option contracts 35[b][i] - 557 Dual currency deposits 35[b][ii] 13,143 - 13,143 557 During the year, the Group invested in dual currency deposits (DCD) derivative contracts where investments in USD were made with the purpose of earning interest at a higher rate than the money market rate and potentially have the USD converted to AUD if the spot rate is equal to or lower than the strike rate at expiry time. At 30 June 2021, the Group held US$10,000,000 in DCD with an expiry date of 6 July 2021 and a marked-to-market unrealised loss of $158,000 recognised in the profit or loss. Refer note 35 for further details on derivative financial instruments.
Name Country of Incorporation
Percentage of Equity Interest Held by the Group
2021 2020 % %
Mount Gibson Mining Limited Australia 100 100 Geraldton Bulk Handling Pty Ltd Australia 100 100 Gibson Minerals Ltd Australia 100 100 Aztec Resources Limited Australia 100 100 • Koolan Shipping Pty Ltd Australia 100 100 • Brockman Minerals Pty Ltd Australia 100 100 • Koolan Iron Ore Pty Ltd Australia 100 100
• KIO SPV Pty Ltd Australia 100 100
Entities subject to Class Order relief
Pursuant to ASIC Instrument 2016/785, relief has been granted to Mount Gibson Mining Limited, Aztec Resources Limited and Koolan Iron Ore Pty Ltd from the Corporations Act 2001 requirements for the preparation, audit and lodgement of financial reports. As a condition of the Class Order, Mount Gibson Iron Limited, Mount Gibson Mining Limited, Aztec Resources Limited and Koolan Iron Ore Pty Ltd (Closed Group) entered into a Deed of Cross Guarantee on 1 May 2008. The effect of this deed is that Mount Gibson Iron Limited has guaranteed to pay any deficiency in the event of winding up of these controlled entities or if they do not meet their obligations under the terms of overdrafts, loans, leases or other liabilities subject to the guarantee. The controlled entities have also given a similar guarantee in the event that Mount Gibson Iron Limited is wound up or if it does not meet its obligations under the terms of overdrafts, loans, leases or other liabilities subject to the guarantee.
The Consolidated Income Statement and Balance Sheet of the Closed Group are set out below:
Consolidated Income Statement of the Closed Group 2021 2020 $’000 $’000
Revenue 329,727 445,165 Interest revenue 6,290 7,132 TOTAL REVENUE 336,017 452,297 Cost of sales (207,360) (318,492) GROSS PROFIT 128,657 133,805 Other income 10,788 17,738 Impairment write-backs/(loss) of non-current other receivables 2,085 (9,267) Administration and other expenses (49,465) (16,097) PROFIT BEFORE TAX AND FINANCE COSTS 92,065 126,179 Finance costs (829) (1,502) PROFIT BEFORE TAX 91,236 124,677 Tax expense (27,230) (40,479) PROFIT AFTER TAX ATTRIBUTABLE TO MEMBERS OF THE COMPANY 64,006 84,198
11. Derivative Financial Assets
12. Interests in Subsidiaries
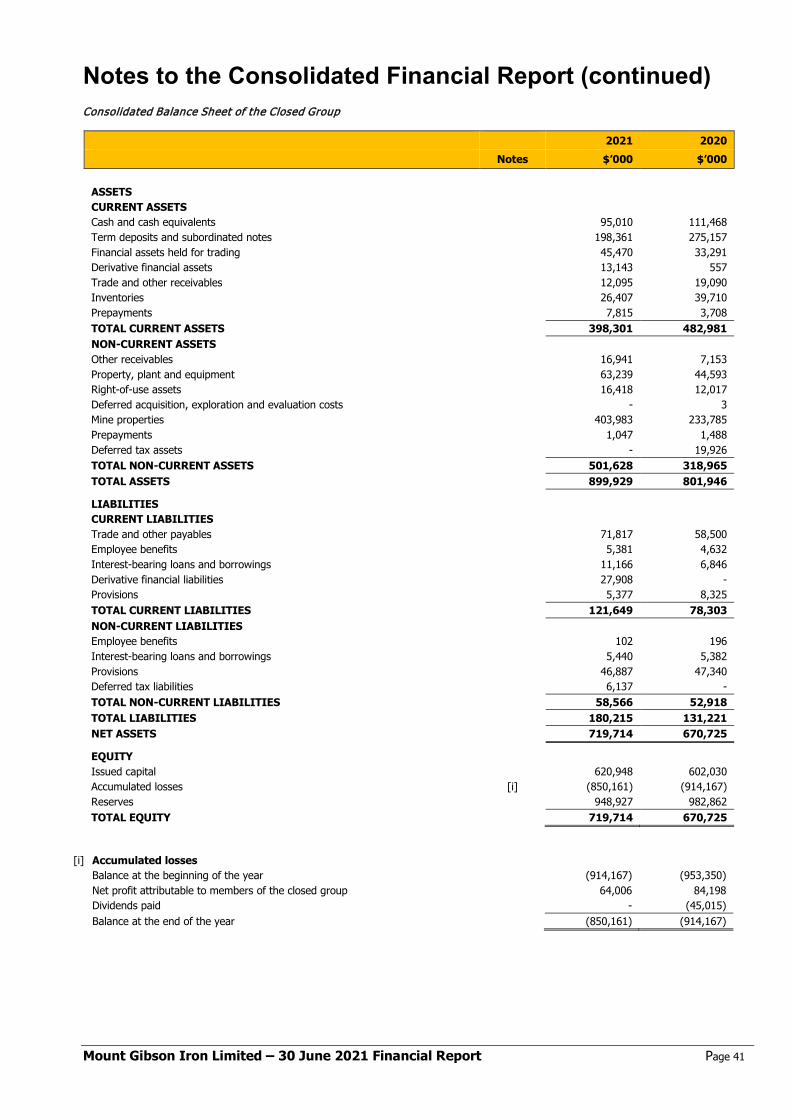
Notes to the Consolidated Financial Report (continued)
Mount Gibson Iron Limited – 30 June 2021 Financial Report Page 41
Consolidated Balance Sheet of the Closed Group
2021 2020 Notes $’000 $’000
ASSETS CURRENT ASSETS Cash and cash equivalents 95,010 111,468 Term deposits and subordinated notes 198,361 275,157 Financial assets held for trading 45,470 33,291 Derivative financial assets 13,143 557 Trade and other receivables 12,095 19,090 Inventories 26,407 39,710 Prepayments 7,815 3,708 TOTAL CURRENT ASSETS 398,301 482,981 NON-CURRENT ASSETS Other receivables 16,941 7,153 Property, plant and equipment 63,239 44,593 Right-of-use assets 16,418 12,017 Deferred acquisition, exploration and evaluation costs - 3 Mine properties 403,983 233,785 Prepayments 1,047 1,488 Deferred tax assets - 19,926 TOTAL NON-CURRENT ASSETS 501,628 318,965 TOTAL ASSETS 899,929 801,946 LIABILITIES CURRENT LIABILITIES Trade and other payables 71,817 58,500 Employee benefits 5,381 4,632 Interest-bearing loans and borrowings 11,166 6,846 Derivative financial liabilities 27,908 - Provisions 5,377 8,325 TOTAL CURRENT LIABILITIES 121,649 78,303 NON-CURRENT LIABILITIES Employee benefits 102 196 Interest-bearing loans and borrowings 5,440 5,382 Provisions 46,887 47,340 Deferred tax liabilities 6,137 - TOTAL NON-CURRENT LIABILITIES 58,566 52,918 TOTAL LIABILITIES 180,215 131,221 NET ASSETS 719,714 670,725 EQUITY Issued capital 620,948 602,030 Accumulated losses [i] (850,161) (914,167) Reserves 948,927 982,862 TOTAL EQUITY 719,714 670,725
[i] Accumulated losses Balance at the beginning of the year (914,167) (953,350) Net profit attributable to members of the closed group 64,006 84,198 Dividends paid - (45,015) Balance at the end of the year (850,161) (914,167)

Notes to the Consolidated Financial Report (continued)
Mount Gibson Iron Limited – 30 June 2021 Financial Report Page 42
Land Plant and Equipment Buildings Capital Works in Progress Total 2021 2020 2021 2020 2021 2020 2021 2020 2021 2020
$’000 $’000 $’000 $’000 $’000 $’000 $’000 $’000 $’000 $’000 Gross carrying amount at cost 649 649 334,180 325,117 159,518 144,462 13,706 12,992 508,053 483,220 Accumulated depreciation and impairment (549) (549) (300,989) (297,625) (143,051) (140,453) - - (444,589) (438,627) Net carrying amount 100 100 33,191 27,492 16,467 4,009 13,706 12,992 63,464 44,593 Reconciliation Carrying amount at the beginning of the year 100 100 27,492 17,889 4,009 1,522 12,992 2,206 44,593 21,717 Additions - - 14,668 14,772 2,544 2,678 13,248 12,978 30,460 30,428 Transfers - - 23 1,069 12,511 316 (12,534) (1,385) - - Disposals - - (30) (149) - - - - (30) (149) Depreciation expense - - (8,962) (6,089) (2,597) (507) - - (11,559) (6,596) Transferred to road resealing provision - - - - - - - (807) - (807) Carrying amount at the end of the year 100 100 33,191 27,492 16,467 4,009 13,706 12,992 63,464 44,593 Assets pledged as security 100 100 33,191 27,492 16,467 4,009 13,706 12,992 63,464 44,593 Refer note 19 for details of security arrangements.
13. Property, Plant and Equipment
Notes to the Consolidated Financial Report (continued)
Mount Gibson Iron Limited – 30 June 2021 Financial Report Page 43
13. Property, Plant and Equipment (Continued)
Recognition and measurement Plant and equipment is stated at cost less accumulated depreciation and any impairment in value. Depreciation and amortisation The cost of owned property, plant and equipment directly engaged in mining operations is depreciated over its expected economic life on a units-of-production method, with due regard given to the life of the related area of interest. Leased plant and equipment directly engaged in mining operations is written down to its residual value over the lesser of the lease term and its useful life. Other assets which are depreciated or amortised on a basis other than the units-of-production method typically are depreciated on a straight-line basis over the estimated useful life of the asset as follows:
Buildings 5 - 20 years Motor vehicles 4 - 5 years Office equipment 3 - 5 years Leasehold improvements Shorter of lease term and useful life of 5 – 10 years
Impairment The carrying values of plant and equipment are reviewed for impairment when events or changes in circumstances indicate the carrying value may not be recoverable. For an asset that does not generate largely independent cash inflows, the recoverable amount is determined for the cash-generating unit to which the asset belongs. Individual assets in the cash-generating units are not written down below their recoverable amount. Refer note 17 for further details on impairment. Derecognition An item of property, plant and equipment is derecognised upon disposal or when no future economic benefits are expected to arise from the continued use of the asset. Any gain or loss arising on derecognition of the asset (calculated as the difference between the net disposal proceeds and the carrying amount of the item) is included in the income statement in the period the item is derecognised. Key judgement, estimates and assumptions Units of production method of depreciation and amortisation The Group applies the units of production method of depreciation and amortisation of its mine assets based on ore tonnes mined. These calculations require the use of estimates and assumptions. Significant judgement is required in assessing the available ore reserves, mineral resources and the production capacity of the operations to be depreciated under this method. Factors that are considered in determining ore reserves, mineral resources and production capacity include the Group’s history of converting mineral resources to ore reserves and the relevant timeframes, the complexity of metallurgy, markets and future developments. The Group uses economically recoverable mineral resources (comprising proven and probable ore reserves) to depreciate assets on a units of production basis. However, where a mineral property has been acquired and an amount has been attributed to the fair value of mineral resources not yet designated as ore reserves, the additional mineral resources may be taken into account. When these factors change or become known in the future, such differences will impact pre-tax profit and carrying values of assets. Impairment of property, plant and equipment The carrying value of property, plant and equipment is reviewed for impairment if there is any indication that the carrying amount may not be recoverable. Where a review for impairment is conducted, the recoverable amount is assessed by reference to either the ‘value-in-use’ (being the net present value of expected future cash flows of the relevant cash generating unit) or ‘fair value less cost of disposal’. In determining value-in-use, future cash flow forecasts for each cash generating unit (i.e. each mine) are prepared utilising management’s latest estimates of mine life, mineral resource and ore reserve recovery, operating and development costs, royalties and taxation, and other relevant cash inflows and outflows. Cash flow scenarios for a range of commodity prices and foreign exchange rates are assessed using internal and external market forecasts, and the present value of the forecast cash flows is determined utilising a discount rate based on industry weighted average cost of capital. The Group’s cash flows are most sensitive to movements in iron ore prices, the discount rate and key operating costs. Variations to the expected future cash flows, and the timing thereof, could result in significant changes to any impairment assessment or losses recognised, if any, which could in turn impact future financial results. Refer note 17 for further details on impairment.

Notes to the Consolidated Financial Report (continued)
Mount Gibson Iron Limited – 30 June 2021 Financial Report Page 44
Leased Property Leased Plant and
Equipment Total
2021 2020 2021 2020 2021 2020 $’000 $’000 $’000 $’000 $’000 $’000 Gross carrying amount at cost 4,897 1,755 29,124 17,085 34,021 18,840 Accumulated depreciation and impairment (531) (585) (15,580) (6,238) (16,111) (6,823) Net carrying amount 4,366 1,170 13,544 10,847 17,910 12,017 Reconciliation Carrying amount at the beginning of the year 1,170 - 10,847 - 12,017 - Recognised at 1 July 2019 on adoption of AASB 16 - 1,755 - 17,085 - 18,840 Additions 4,897 - 12,039 - 16,936 - Disposals (878) - - - (878) - Depreciation (823) (585) (9,342) (6,238) (10,165) (6,823) Carrying amount at the end of the year 4,366 1,170 13,544 10,847 17,910 12,017
Recognition and measurement The Group adopted AASB 16 using the modified retrospective method of adoption with an initial application date of 1 July 2019. The group recognises right-of-use assets at the commencement date of the lease (ie. the date the underlying asset is available for use). Right-of-use assets are measured at cost, less any accumulated depreciation and impairment losses, and adjusted for any remeasurement of lease liabilities. The cost of right-of-use assets includes the amount of lease liabilities recognised, initial direct costs incurred, and lease payments made at or before the commencement date less any lease incentives received. Unless the Group is reasonably certain to obtain ownership of the lease asset at the end of the lease term, the recognised right-of-use assets are depreciated on a straight-line basis over the shorter of its estimated useful life and the lease term. Right-of-use assets are subject to impairment.
2021 2020 Notes $’000 $’000
Deferred acquisition, exploration and evaluation – at cost - 18,106 Allowance for impairment - (18,103) - 3 Reconciliation Carrying amount at beginning of the year 3 - Additions 4,703 72 Exploration expenditure written off (146) (69) Transferred to mine properties (4,560) - Carrying amount at the end of the year - 3 Recognition and measurement Acquisition costs Exploration and evaluation costs arising from acquisitions are carried forward where exploration and evaluation activities have not, at balance date, reached a stage to allow a reasonable assessment regarding the existence of economically recoverable reserves. Exploration and evaluation costs Costs arising from exploration and evaluation activities are capitalised if activities in the area of interest have not yet reached a stage which permits a reasonable assessment of the existence or otherwise of economically recoverable reserves or sale. To the extent that it is determined in the future that this capitalised expenditure should be written off, this will reduce profits and net assets in the period in which this determination is made. A regular review is undertaken of each area of interest to determine the appropriateness of continuing to carry forward costs in relation to that area of interest. Where uncertainty exists as to the future viability of certain areas, the value of the area of interest is written off to the income statement or provided against.
14. Right-of-use Assets
15. Deferred Acquisition, Exploration and Evaluation Costs
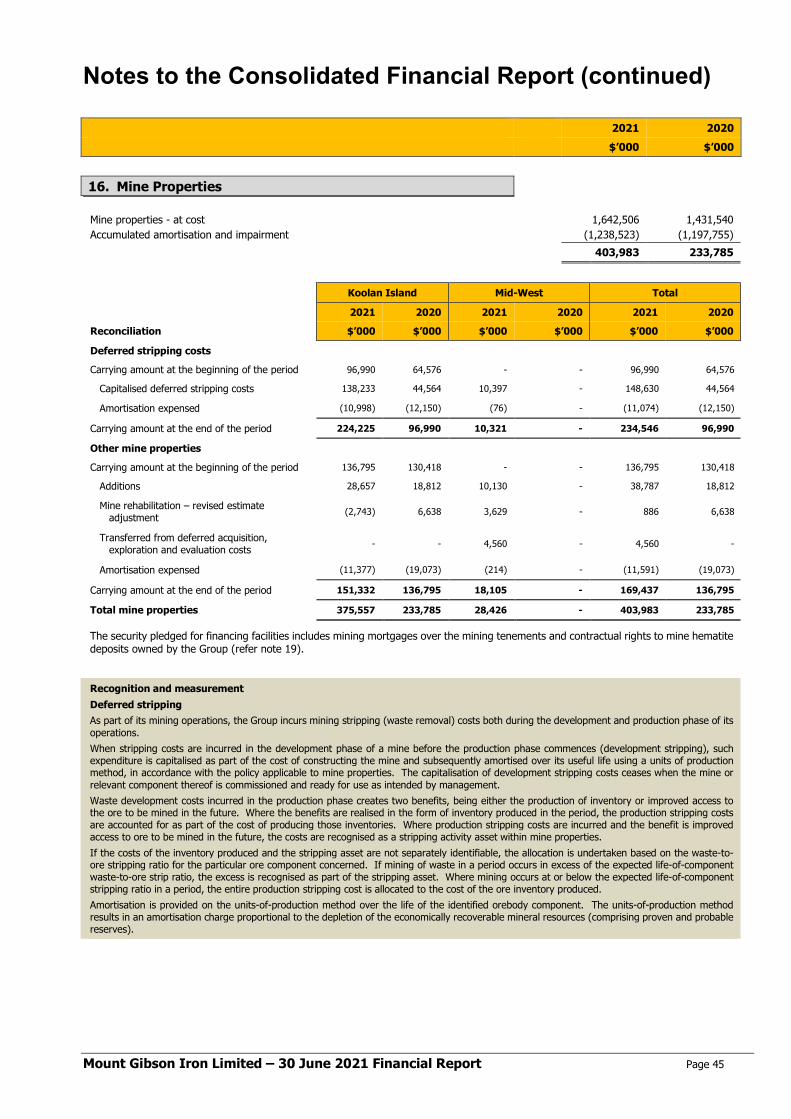
Notes to the Consolidated Financial Report (continued)
Mount Gibson Iron Limited – 30 June 2021 Financial Report Page 45
2021 2020 $’000 $’000
Mine properties - at cost 1,642,506 1,431,540 Accumulated amortisation and impairment (1,238,523) (1,197,755) 403,983 233,785
Koolan Island Mid-West Total
2021 2020 2021 2020 2021 2020
Reconciliation $’000 $’000 $’000 $’000 $’000 $’000
Deferred stripping costs
Carrying amount at the beginning of the period 96,990 64,576 - - 96,990 64,576
Capitalised deferred stripping costs 138,233 44,564 10,397 - 148,630 44,564
Amortisation expensed (10,998) (12,150) (76) - (11,074) (12,150)
Carrying amount at the end of the period 224,225 96,990 10,321 - 234,546 96,990
Other mine properties
Carrying amount at the beginning of the period 136,795 130,418 - - 136,795 130,418
Additions 28,657 18,812 10,130 - 38,787 18,812
Mine rehabilitation – revised estimate adjustment (2,743) 6,638 3,629 - 886 6,638
Transferred from deferred acquisition, exploration and evaluation costs - - 4,560 - 4,560 -
Amortisation expensed (11,377) (19,073) (214) - (11,591) (19,073)
Carrying amount at the end of the period 151,332 136,795 18,105 - 169,437 136,795
Total mine properties 375,557 233,785 28,426 - 403,983 233,785
The security pledged for financing facilities includes mining mortgages over the mining tenements and contractual rights to mine hematite deposits owned by the Group (refer note 19).
Recognition and measurement Deferred stripping As part of its mining operations, the Group incurs mining stripping (waste removal) costs both during the development and production phase of its operations. When stripping costs are incurred in the development phase of a mine before the production phase commences (development stripping), such expenditure is capitalised as part of the cost of constructing the mine and subsequently amortised over its useful life using a units of production method, in accordance with the policy applicable to mine properties. The capitalisation of development stripping costs ceases when the mine or relevant component thereof is commissioned and ready for use as intended by management. Waste development costs incurred in the production phase creates two benefits, being either the production of inventory or improved access to the ore to be mined in the future. Where the benefits are realised in the form of inventory produced in the period, the production stripping costs are accounted for as part of the cost of producing those inventories. Where production stripping costs are incurred and the benefit is improved access to ore to be mined in the future, the costs are recognised as a stripping activity asset within mine properties. If the costs of the inventory produced and the stripping asset are not separately identifiable, the allocation is undertaken based on the waste-to-ore stripping ratio for the particular ore component concerned. If mining of waste in a period occurs in excess of the expected life-of-component waste-to-ore strip ratio, the excess is recognised as part of the stripping asset. Where mining occurs at or below the expected life-of-component stripping ratio in a period, the entire production stripping cost is allocated to the cost of the ore inventory produced. Amortisation is provided on the units-of-production method over the life of the identified orebody component. The units-of-production method results in an amortisation charge proportional to the depletion of the economically recoverable mineral resources (comprising proven and probable reserves).
16. Mine Properties
Notes to the Consolidated Financial Report (continued)
Mount Gibson Iron Limited – 30 June 2021 Financial Report Page 46
16. Mine Properties (Continued)
Other mine properties Other mine properties represent the accumulation of all acquisition, exploration, evaluation and development expenditure incurred by or on behalf of the Group in relation to areas of interest in which the mining of mineral resources has commenced. When further development expenditure is incurred in respect of a mine property after the commencement of production, such expenditure is carried forward as part of the cost of that mine property only when substantial future economic benefits are established, otherwise such expenditure is classified as part of the cost of production. Amortisation is provided on the units-of-production method over the life of the mine, with separate calculations being made for each mineral resource. The units-of-production method results in an amortisation charge proportional to the depletion of the economically recoverable mineral resources (comprising proven and probable reserves). A regular review is undertaken of each area of interest to determine the appropriateness of continuing to carry forward costs in relation to that area of interest. Impairment expenses are recognised to the extent that the carrying amount of the mine properties asset exceeds its estimated recoverable amount. Refer to note 17 for further details on impairment. Key judgement and estimate Determining the beginning of production Judgement is required to determine when capitalisation of development costs ceases and amortisation of mine assets commences upon the start of commercial production. This is based on the specific circumstances of the project, and considers when the specific asset is substantially complete and becomes ‘available for use’ as intended by management which includes consideration of the following factors: • completion of reasonable testing of the mine plant and equipment; • mineral recoveries, availability and throughput levels at or near expected levels; • the ability to produce iron ore in saleable form (where more than an insignificant amount is produced); and • the achievement of continuous production. Stripping activity assets Judgment is required to identify a suitable production measure to be used to allocate production stripping costs between inventory and any stripping activity asset(s) for each orebody component. The Group considers that the ratios of the expected volume of waste to be stripped for an expected volume of ore to be mined for a specific component of orebody, to be the most suitable production measure. In identifying and defining the orebody components, judgment is required to determine the expected volumes of waste to be stripped and ore to be mined in each of these components. These assessments are based on the information available in the mine plan which will vary between mines for various reasons, including, the geological characteristics of the orebody, the geographical location and/or financial considerations. Stripping ratio Significant judgment is required in determining the waste capitalisation ratio for each component of the mine. Factors that are considered include: • any proposed changes in the design of the mine; • estimates of the quantities of ore reserves and mineral resources for which there is a high degree of confidence of economic extraction; • identifiable components of the orebody; • future production levels; • impacts of regulatory obligations and taxation legislation; and • future cash cost of production Impairment of capitalised mine development expenditure The future recoverability of capitalised mine development expenditure is dependent on a number of factors, including the level of mineral resources and ore reserves, future technological changes which could impact the cost of mining, future legal changes (including changes to environmental restoration obligations) and changes to commodity prices and exchange rates. The Group regularly reviews the carrying values of its mine development assets in the context of internal and external consensus forecasts for commodity prices and foreign exchange rates, with the application of appropriate discount rates for the assets concerned. To the extent that capitalised mine development expenditure is determined not to be recoverable in the future, this will reduce profits and net assets in the period in which this determination is made. Capitalised mine development expenditure is assessed for recoverability along with property, plant and equipment as described below. Refer note 17 for further details on impairment.
Notes to the Consolidated Financial Report (continued)
Mount Gibson Iron Limited – 30 June 2021 Financial Report Page 47
The Group reviews the carrying value of the assets of each Cash Generating Unit (CGU) at each balance date for indicators of potential impairment or reversal thereof. Where such indicators exist, the Company utilises the approaches under applicable accounting pronouncements for assessment of any impairment expenses or reversals.
The Group performed an impairment reversal trigger assessment of the Shine CGU at 30 June 2021 as this CGU had previously been impaired in prior periods. Impairment reversal triggers were identified for the Shine CGU at 30 June 2021.
Accordingly, the Group assessed the recoverable amount of the Shine CGU as at 30 June 2021 using the Fair Value Less Costs of Disposal (FVLCD) approach. The FVLCD is assessed as the present value of the future cash flows expected to be derived from the operation less disposal costs (level 3 in the fair value hierarchy), utilising the following key assumptions for the CGU:
• Cashflow forecasts were made based on historical performance from similar Mid-West operations, budgets and anticipated revenues and estimated operating and capital costs over the life of the mine;
• Discount rate of 10.0% (nominal, after tax); • Iron ore price forecasts for the 62% Fe benchmark fines CFR prices (northern China), expressed in real 2021 terms, of US$135/dmt in
2021/22 (falling over the following two years to US$82/dmt), at an exchange rate of A$1.00/US$0.783 in 2021/22 (rising to US$0.80 thereafter) with sensitivities undertaken for a broad range of these inputs; and
• Revenue and cost inflation estimates of 2.0% per year.
The Group’s assessment of the Shine asset has concluded that no impairment reversal is required as at 30 June 2021.
The cashflow estimates for Shine are most sensitive to changes in iron ore prices and the A$/US$ exchange rate. It is estimated that changes in these key assumptions would impact the recoverable amount of the CGU as at 30 June 2021 as follows:
• An increase in the benchmark 62% Fe CFR fines iron ore price by 10% would increase the CGU’s recoverable amount by approximately $18.7 million; and
• A reduction in the A$/US$ exchange rate by 10% would increase the CGU’s recoverable amount by approximately $17.3 million.
As at 30 June 2021, there were no indicators of impairment or impairment reversal present in relation to the Koolan Island CGU. No impairment expenses or impairment reversals thereof have been recognised during the period (2020: nil) for either of the Company’s CGUs.
Recognition and measurement Recoverable amount of assets At each reporting date, the Group assesses whether there is any indication that an asset may be impaired. Where an indicator of impairment exists, the Group makes a formal estimate of recoverable amount. Where the carrying amount of an asset exceeds its recoverable amount, the asset is considered impaired and is written down to its recoverable amount. Recoverable amount is the greater of fair value less costs to sell and value-in-use. Recoverable amount is determined for an individual asset, unless the asset’s value-in-use cannot be estimated to be close to its fair value less cost to sell and it does not generate cash inflows that are largely independent of those from other assets or groups of assets, in which case the recoverable amount is determined for the cash-generating unit to which the asset belongs. In assessing value-in-use, the estimated future cash flows are discounted to their present value using a pre-tax discount rate that reflects current market assessments of the time value of money and the risks specific to the asset. In allocating an impairment loss, the carrying amount of an individual asset is not taken below its individual recoverable amount. An assessment is also made at each reporting date as to whether there is any indication that a previously recognised impairment loss may no longer exist or may have decreased. If such indication exists, the recoverable amount is estimated. A previously recognised impairment loss is reversed only where there has been a change in the estimates used to determine the asset’s recoverable amount since the last impairment loss was recognised. If that is the case the carrying amount of the asset is increased to its recoverable amount. That increased amount cannot exceed the carrying amount that would have been determined, net of depreciation and amortisation, had no impairment loss been recognised for the asset in prior years. Such reversal is recognised in profit or loss unless the asset is carried at revalued amount, in which case the reversal is treated as a revaluation increase. After such a reversal, the depreciation or amortisation charges are adjusted in future periods to allocate the asset’s revised carrying amount, less any residual value, on a systematic basis over its remaining useful life.
17. Impairment of Non-Current Assets

Notes to the Consolidated Financial Report (continued)
Mount Gibson Iron Limited – 30 June 2021 Financial Report Page 48
2021 2020 Notes $’000 $’000
Current Trade creditors [i] 30,705 25,523 Accruals and other payables [i] 41,795 35,392 72,500 60,915 [i] Current trade creditors and other payables are non-interest bearing and are normally settled on 30 day terms. Recognition and measurement All financial liabilities are recognised initially as fair value and, in the case of payables, net of directly attributable transaction costs. Trade payables, accruals and other payables are carried at amortised costs and represent liabilities for goods and services provided to the Group prior to the end of the financial year that are unpaid and arise when the Group becomes obliged to make future payments in respect of the purchase of these goods and services.
2021 2020 Notes $’000 $’000
Current Lease liabilities [i],[a] 11,573 6,846 11,573 6,846
Non-Current Lease liabilities [i],[a] 6,530 5,382 6,530 5,382 [i] Lease liabilities Minimum lease payments for right-of-use assets:
• Not later than one year 11,811 7,142 • Later than one year but not later than five years 6,653 5,457
Total minimum lease payments 18,464 12,599 Future finance charges (361) (371) 18,103 12,228 The following off-balance sheet financing facility had been negotiated and was available at the reporting date:
Performance bonding facility [b] Used at reporting date 7,495 6,587 Unused at reporting date 12,505 13,413 20,000 20,000 Terms and conditions relating to the above financing facilities: [a] Lease facility
The Group has lease liabilities for right-of-use assets which are repayable monthly with final instalments due in June 2025. Interest is applied at a weighted average incremental borrowing rate of 2.52%.
[b] Performance bonding facility In May 2011, the Company entered into a Facility Agreement comprising a Corporate Loan Facility and a Performance Bonding Facility. The undrawn Corporate Loan facility was cancelled in April 2013. The Performance Bonding Facility was reduced in size from $55,000,000 to $20,000,000 in June 2017 and in June 2021, extended to 30 June 2024. As at balance date, bonds and guarantees totalling $7,495,000 were drawn under the Performance Bonding Facility. The security pledge for the Performance Bonding Facility is a fixed and floating charge over all the assets and undertakings of Mount Gibson Iron Limited, Mount Gibson Mining Limited, Geraldton Bulk Handling Pty Ltd, Koolan Iron Ore Pty Ltd and Aztec Resources Limited, together with mining mortgages over the mining tenements owned by Mount Gibson Mining Limited and Koolan Iron Ore Pty Ltd and the contractual rights of Mount Gibson Mining Limited to mine hematite iron ore at Extension Hill.
18. Trade and Other Payables
19. Interest-Bearing Loans and Borrowings
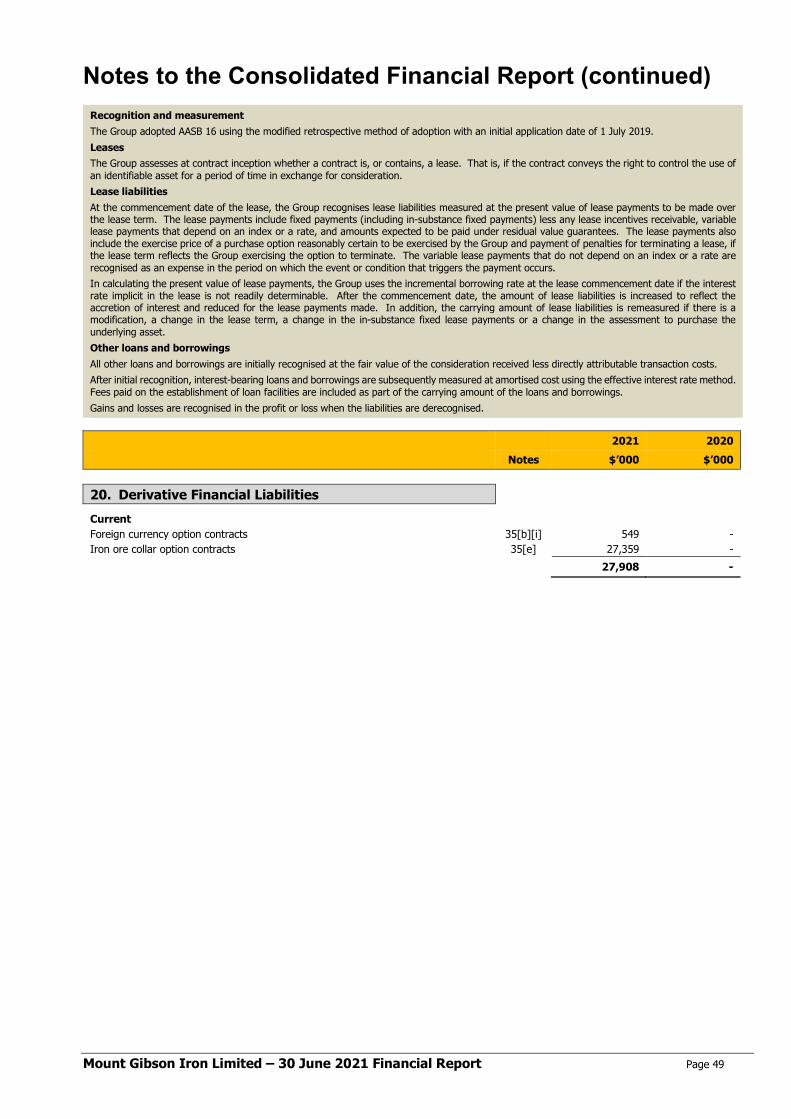
Notes to the Consolidated Financial Report (continued)
Mount Gibson Iron Limited – 30 June 2021 Financial Report Page 49
Recognition and measurement The Group adopted AASB 16 using the modified retrospective method of adoption with an initial application date of 1 July 2019. Leases The Group assesses at contract inception whether a contract is, or contains, a lease. That is, if the contract conveys the right to control the use of an identifiable asset for a period of time in exchange for consideration. Lease liabilities At the commencement date of the lease, the Group recognises lease liabilities measured at the present value of lease payments to be made over the lease term. The lease payments include fixed payments (including in-substance fixed payments) less any lease incentives receivable, variable lease payments that depend on an index or a rate, and amounts expected to be paid under residual value guarantees. The lease payments also include the exercise price of a purchase option reasonably certain to be exercised by the Group and payment of penalties for terminating a lease, if the lease term reflects the Group exercising the option to terminate. The variable lease payments that do not depend on an index or a rate are recognised as an expense in the period on which the event or condition that triggers the payment occurs. In calculating the present value of lease payments, the Group uses the incremental borrowing rate at the lease commencement date if the interest rate implicit in the lease is not readily determinable. After the commencement date, the amount of lease liabilities is increased to reflect the accretion of interest and reduced for the lease payments made. In addition, the carrying amount of lease liabilities is remeasured if there is a modification, a change in the lease term, a change in the in-substance fixed lease payments or a change in the assessment to purchase the underlying asset. Other loans and borrowings All other loans and borrowings are initially recognised at the fair value of the consideration received less directly attributable transaction costs. After initial recognition, interest-bearing loans and borrowings are subsequently measured at amortised cost using the effective interest rate method. Fees paid on the establishment of loan facilities are included as part of the carrying amount of the loans and borrowings. Gains and losses are recognised in the profit or loss when the liabilities are derecognised.
2021 2020 Notes $’000 $’000 20. Derivative Financial Liabilities
Current Foreign currency option contracts 35[b][i] 549 - Iron ore collar option contracts 35[e] 27,359 - 27,908 -

Notes to the Consolidated Financial Report (continued)
Mount Gibson Iron Limited – 30 June 2021 Financial Report Page 50
Road Resealing Restructure Decommissioning
Rehabilitation Total 2021 2020 2021 2020 2021 2020 2021 2020
$’000 $’000 $’000 $’000 $’000 $’000 $’000 $’000
Current 488 500 - 521 4,889 7,494 5,377 8,515
Non-Current - - - - 46,887 47,340 46,887 47,340
488 500 - 521 51,776 54,834 52,264 55,855
Reconciliation
Carrying amount at the beginning of the year 500 1,200 521 526 54,834 47,936 55,855 49,662
Provision for period - 500 - 40 - - - 540
Reversal of amounts unutilised - - (521) - - - (521) -
Amounts utilised during the period (12) (1,200) - (45) (2,409) (181) (2,421) (1,426)
Interest accretion on rehabilitation provision - expensed - - - - 261 524 261 524
Revised estimate adjustment – profit or loss - - - - (1,796) (83) (1,796) (83)
Revised estimate adjustment – mine properties asset - - - - 886 6,638 886 6,638
Carrying amount at the end of the year 488 500 - 521 51,776 54,834 52,264 55,855 Road resealing This provision relates to the forecast cost of roadworks associated with the completion of mining activities at Extension Hill mine site. Decommissioning rehabilitation This provision represents the present value of decommissioning and rehabilitation costs for the Tallering Peak, Extension Hill, Shine and Koolan Island sites. The cost estimates forming the basis of the provisions (except Tallering Peak site) were prepared as at the end of the financial year by independent consultants specialising in mine closure planning and mine rehabilitation cost estimates. The timing of decommissioning and rehabilitation expenditure is dependent on the life of the mines and on the timing of the rehabilitation requirements, which may vary in the future. Based on current estimates, the bulk of expenditure on decommissioning rehabilitation is expected to occur at Extension Hill within the next 1-2 years, at Shine 2 years from balance date and at Koolan Island between 4-5 years from balance date.
21. Provisions
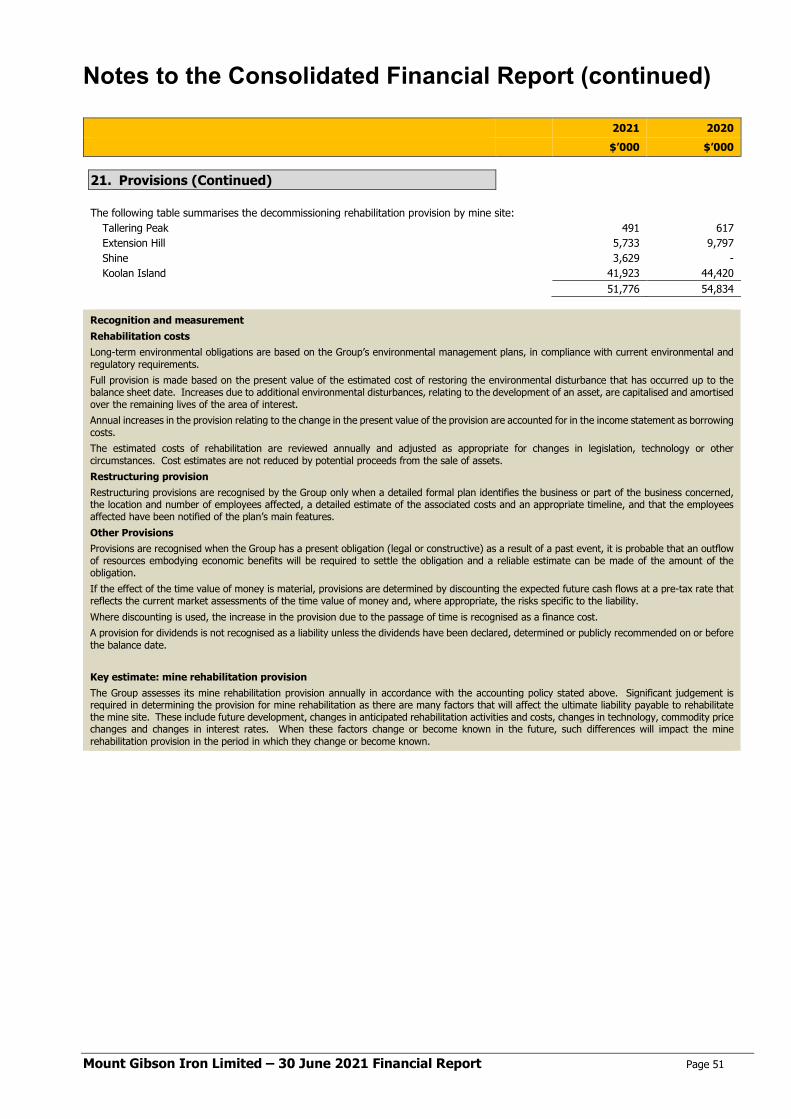
Notes to the Consolidated Financial Report (continued)
Mount Gibson Iron Limited – 30 June 2021 Financial Report Page 51
2021 2020 $’000 $’000 21. Provisions (Continued)
The following table summarises the decommissioning rehabilitation provision by mine site:
Tallering Peak 491 617 Extension Hill 5,733 9,797 Shine 3,629 - Koolan Island 41,923 44,420
51,776 54,834
Recognition and measurement Rehabilitation costs Long-term environmental obligations are based on the Group’s environmental management plans, in compliance with current environmental and regulatory requirements. Full provision is made based on the present value of the estimated cost of restoring the environmental disturbance that has occurred up to the balance sheet date. Increases due to additional environmental disturbances, relating to the development of an asset, are capitalised and amortised over the remaining lives of the area of interest. Annual increases in the provision relating to the change in the present value of the provision are accounted for in the income statement as borrowing costs. The estimated costs of rehabilitation are reviewed annually and adjusted as appropriate for changes in legislation, technology or other circumstances. Cost estimates are not reduced by potential proceeds from the sale of assets. Restructuring provision Restructuring provisions are recognised by the Group only when a detailed formal plan identifies the business or part of the business concerned, the location and number of employees affected, a detailed estimate of the associated costs and an appropriate timeline, and that the employees affected have been notified of the plan’s main features. Other Provisions Provisions are recognised when the Group has a present obligation (legal or constructive) as a result of a past event, it is probable that an outflow of resources embodying economic benefits will be required to settle the obligation and a reliable estimate can be made of the amount of the obligation. If the effect of the time value of money is material, provisions are determined by discounting the expected future cash flows at a pre-tax rate that reflects the current market assessments of the time value of money and, where appropriate, the risks specific to the liability. Where discounting is used, the increase in the provision due to the passage of time is recognised as a finance cost. A provision for dividends is not recognised as a liability unless the dividends have been declared, determined or publicly recommended on or before the balance date. Key estimate: mine rehabilitation provision The Group assesses its mine rehabilitation provision annually in accordance with the accounting policy stated above. Significant judgement is required in determining the provision for mine rehabilitation as there are many factors that will affect the ultimate liability payable to rehabilitate the mine site. These include future development, changes in anticipated rehabilitation activities and costs, changes in technology, commodity price changes and changes in interest rates. When these factors change or become known in the future, such differences will impact the mine rehabilitation provision in the period in which they change or become known.
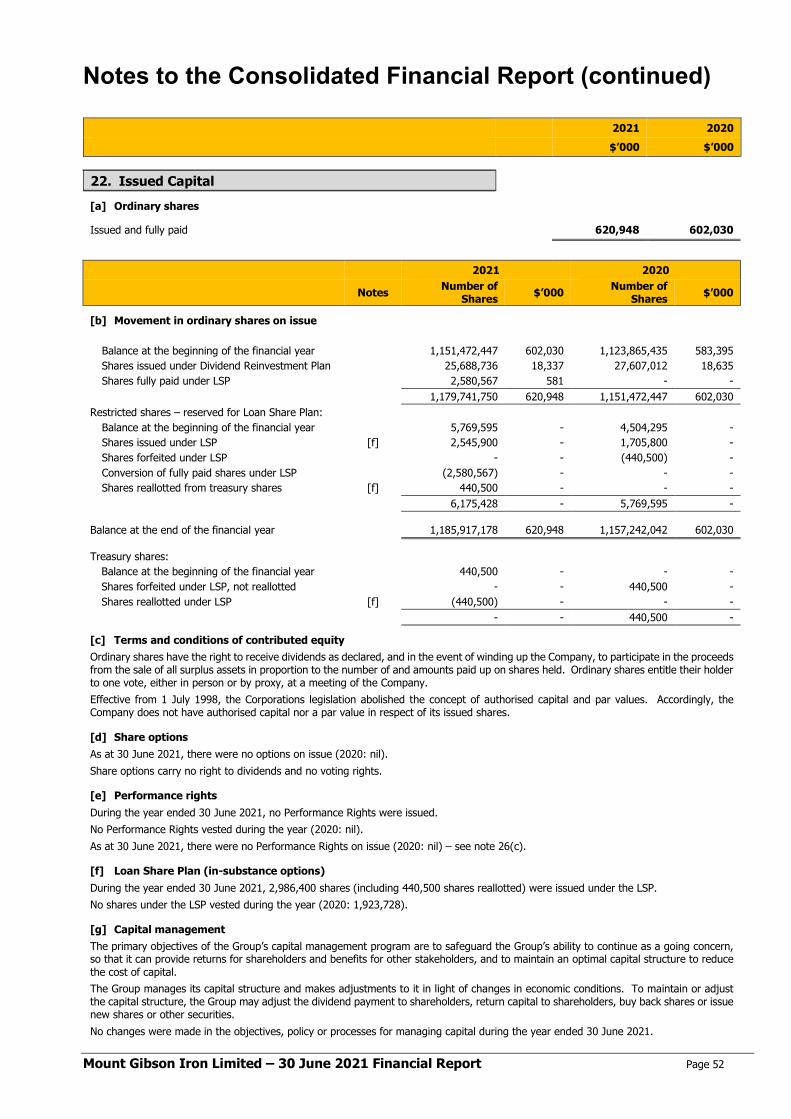
Notes to the Consolidated Financial Report (continued)
Mount Gibson Iron Limited – 30 June 2021 Financial Report Page 52
2021 2020 $’000 $’000
[a] Ordinary shares
Issued and fully paid 620,948 602,030
2021 2020
Notes Number of Shares $’000 Number of
Shares $’000
[b] Movement in ordinary shares on issue
Balance at the beginning of the financial year 1,151,472,447 602,030 1,123,865,435 583,395 Shares issued under Dividend Reinvestment Plan 25,688,736 18,337 27,607,012 18,635 Shares fully paid under LSP 2,580,567 581 - -
1,179,741,750 620,948 1,151,472,447 602,030 Restricted shares – reserved for Loan Share Plan:
Balance at the beginning of the financial year 5,769,595 - 4,504,295 - Shares issued under LSP [f] 2,545,900 - 1,705,800 - Shares forfeited under LSP - - (440,500) - Conversion of fully paid shares under LSP (2,580,567) - - - Shares reallotted from treasury shares [f] 440,500 - - -
6,175,428 - 5,769,595 - Balance at the end of the financial year 1,185,917,178 620,948 1,157,242,042 602,030 Treasury shares:
Balance at the beginning of the financial year 440,500 - - - Shares forfeited under LSP, not reallotted - - 440,500 - Shares reallotted under LSP [f] (440,500) - - -
- - 440,500 -
[c] Terms and conditions of contributed equity Ordinary shares have the right to receive dividends as declared, and in the event of winding up the Company, to participate in the proceeds from the sale of all surplus assets in proportion to the number of and amounts paid up on shares held. Ordinary shares entitle their holder to one vote, either in person or by proxy, at a meeting of the Company. Effective from 1 July 1998, the Corporations legislation abolished the concept of authorised capital and par values. Accordingly, the Company does not have authorised capital nor a par value in respect of its issued shares.
[d] Share options As at 30 June 2021, there were no options on issue (2020: nil). Share options carry no right to dividends and no voting rights.
[e] Performance rights During the year ended 30 June 2021, no Performance Rights were issued. No Performance Rights vested during the year (2020: nil). As at 30 June 2021, there were no Performance Rights on issue (2020: nil) – see note 26(c).
[f] Loan Share Plan (in-substance options) During the year ended 30 June 2021, 2,986,400 shares (including 440,500 shares reallotted) were issued under the LSP. No shares under the LSP vested during the year (2020: 1,923,728).
[g] Capital management The primary objectives of the Group’s capital management program are to safeguard the Group’s ability to continue as a going concern, so that it can provide returns for shareholders and benefits for other stakeholders, and to maintain an optimal capital structure to reduce the cost of capital. The Group manages its capital structure and makes adjustments to it in light of changes in economic conditions. To maintain or adjust the capital structure, the Group may adjust the dividend payment to shareholders, return capital to shareholders, buy back shares or issue new shares or other securities. No changes were made in the objectives, policy or processes for managing capital during the year ended 30 June 2021.
22. Issued Capital
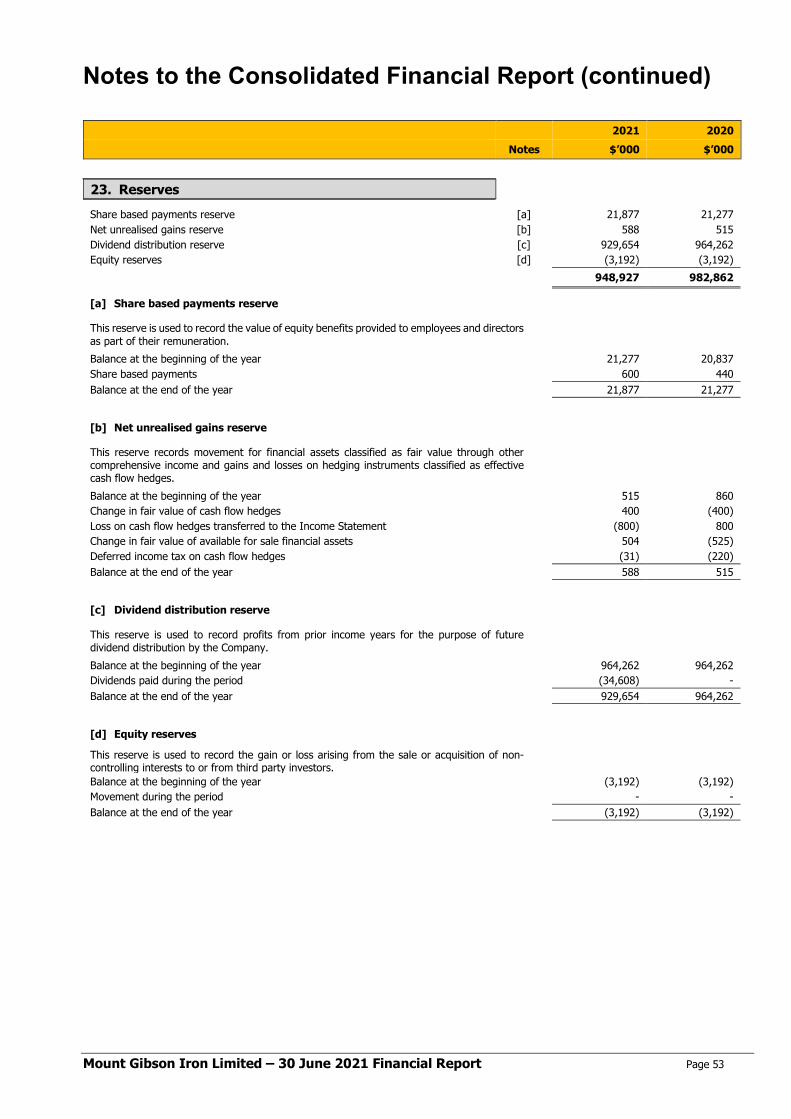
Notes to the Consolidated Financial Report (continued)
Mount Gibson Iron Limited – 30 June 2021 Financial Report Page 53
2021 2020 Notes $’000 $’000
Share based payments reserve [a] 21,877 21,277 Net unrealised gains reserve [b] 588 515 Dividend distribution reserve [c] 929,654 964,262 Equity reserves [d] (3,192) (3,192) 948,927 982,862
[a] Share based payments reserve
This reserve is used to record the value of equity benefits provided to employees and directors as part of their remuneration. Balance at the beginning of the year 21,277 20,837 Share based payments 600 440 Balance at the end of the year 21,877 21,277
[b] Net unrealised gains reserve
This reserve records movement for financial assets classified as fair value through other comprehensive income and gains and losses on hedging instruments classified as effective cash flow hedges. Balance at the beginning of the year 515 860 Change in fair value of cash flow hedges 400 (400) Loss on cash flow hedges transferred to the Income Statement (800) 800 Change in fair value of available for sale financial assets 504 (525) Deferred income tax on cash flow hedges (31) (220) Balance at the end of the year 588 515
[c] Dividend distribution reserve
This reserve is used to record profits from prior income years for the purpose of future dividend distribution by the Company. Balance at the beginning of the year 964,262 964,262 Dividends paid during the period (34,608) - Balance at the end of the year 929,654 964,262
[d] Equity reserves
This reserve is used to record the gain or loss arising from the sale or acquisition of non-controlling interests to or from third party investors. Balance at the beginning of the year (3,192) (3,192) Movement during the period - - Balance at the end of the year (3,192) (3,192)
23. Reserves
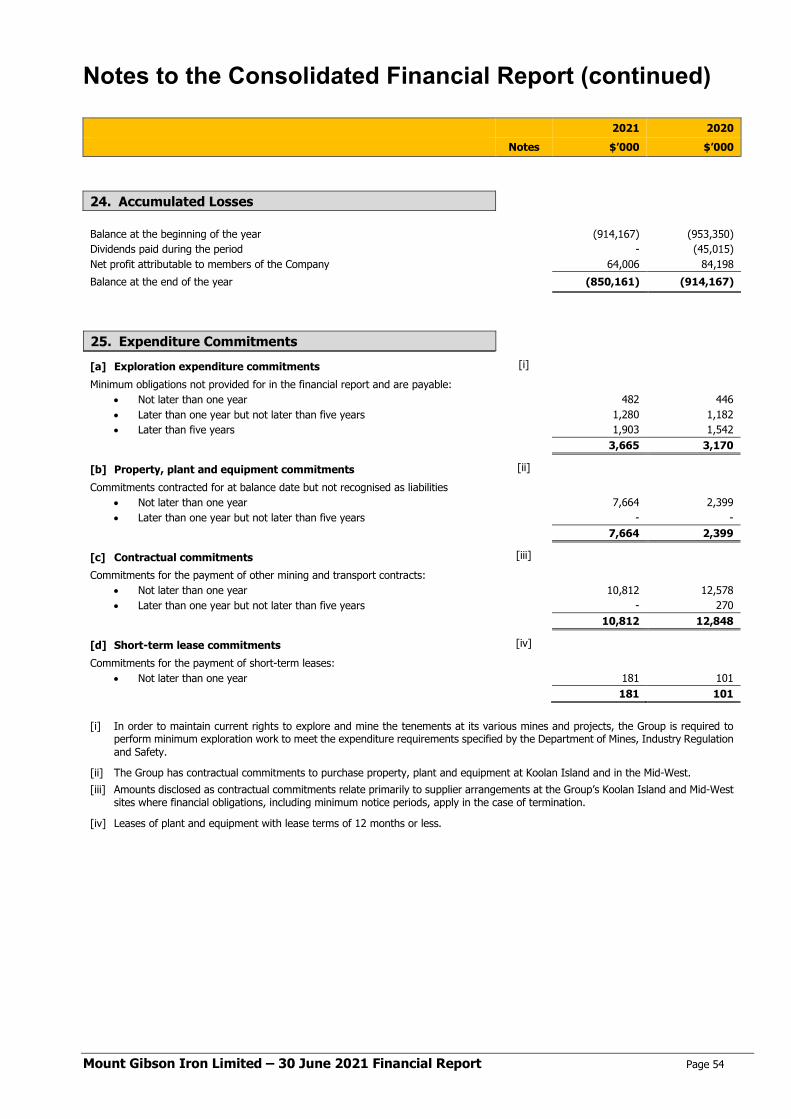
Notes to the Consolidated Financial Report (continued)
Mount Gibson Iron Limited – 30 June 2021 Financial Report Page 54
2021 2020 Notes $’000 $’000
24. Accumulated Losses Balance at the beginning of the year (914,167) (953,350) Dividends paid during the period - (45,015) Net profit attributable to members of the Company 64,006 84,198 Balance at the end of the year (850,161) (914,167)
[a] Exploration expenditure commitments [i]
Minimum obligations not provided for in the financial report and are payable: • Not later than one year 482 446 • Later than one year but not later than five years 1,280 1,182 • Later than five years 1,903 1,542
3,665 3,170
[b] Property, plant and equipment commitments [ii]
Commitments contracted for at balance date but not recognised as liabilities • Not later than one year 7,664 2,399 • Later than one year but not later than five years - -
7,664 2,399
[c] Contractual commitments [iii]
Commitments for the payment of other mining and transport contracts: • Not later than one year 10,812 12,578 • Later than one year but not later than five years - 270
10,812 12,848
[d] Short-term lease commitments [iv]
Commitments for the payment of short-term leases: • Not later than one year 181 101
181 101
[i] In order to maintain current rights to explore and mine the tenements at its various mines and projects, the Group is required to perform minimum exploration work to meet the expenditure requirements specified by the Department of Mines, Industry Regulation and Safety.
[ii] The Group has contractual commitments to purchase property, plant and equipment at Koolan Island and in the Mid-West. [iii] Amounts disclosed as contractual commitments relate primarily to supplier arrangements at the Group’s Koolan Island and Mid-West
sites where financial obligations, including minimum notice periods, apply in the case of termination.
[iv] Leases of plant and equipment with lease terms of 12 months or less.
25. Expenditure Commitments
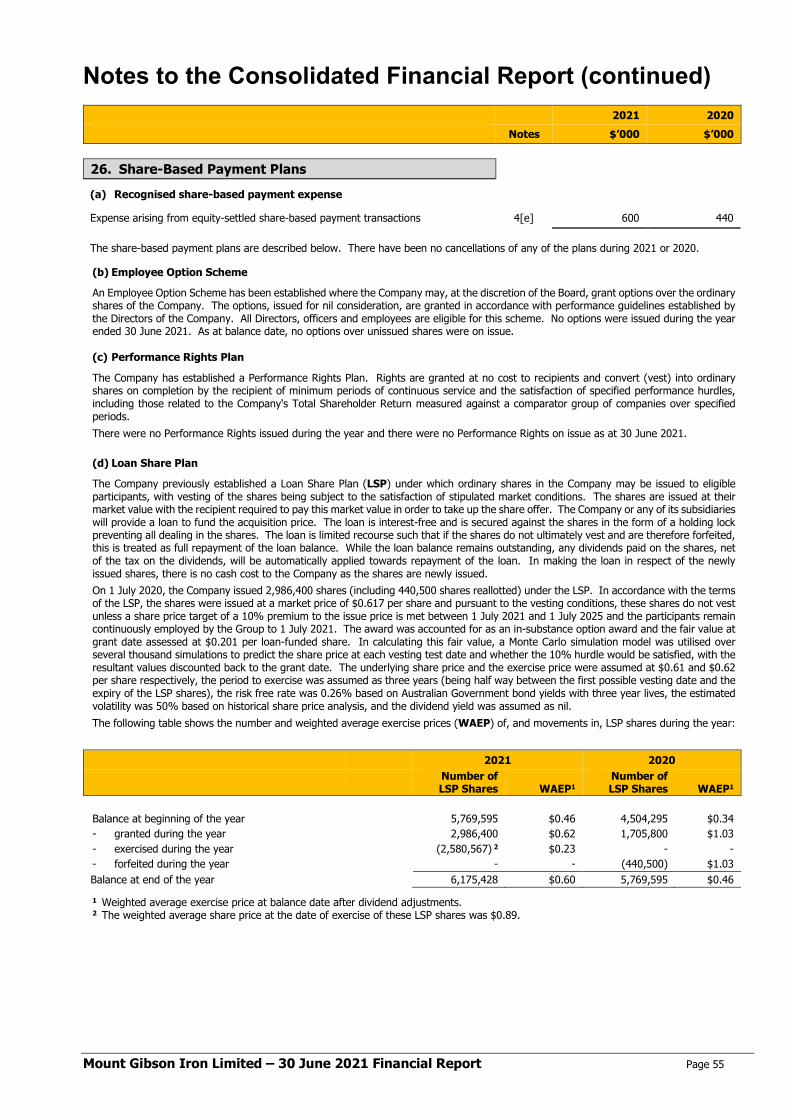
Notes to the Consolidated Financial Report (continued)
Mount Gibson Iron Limited – 30 June 2021 Financial Report Page 55
2021 2020 Notes $’000 $’000
(a) Recognised share-based payment expense
Expense arising from equity-settled share-based payment transactions 4[e] 600 440 The share-based payment plans are described below. There have been no cancellations of any of the plans during 2021 or 2020.
(b) Employee Option Scheme
An Employee Option Scheme has been established where the Company may, at the discretion of the Board, grant options over the ordinary shares of the Company. The options, issued for nil consideration, are granted in accordance with performance guidelines established by the Directors of the Company. All Directors, officers and employees are eligible for this scheme. No options were issued during the year ended 30 June 2021. As at balance date, no options over unissued shares were on issue.
(c) Performance Rights Plan
The Company has established a Performance Rights Plan. Rights are granted at no cost to recipients and convert (vest) into ordinary shares on completion by the recipient of minimum periods of continuous service and the satisfaction of specified performance hurdles, including those related to the Company's Total Shareholder Return measured against a comparator group of companies over specified periods. There were no Performance Rights issued during the year and there were no Performance Rights on issue as at 30 June 2021.
(d) Loan Share Plan
The Company previously established a Loan Share Plan (LSP) under which ordinary shares in the Company may be issued to eligible participants, with vesting of the shares being subject to the satisfaction of stipulated market conditions. The shares are issued at their market value with the recipient required to pay this market value in order to take up the share offer. The Company or any of its subsidiaries will provide a loan to fund the acquisition price. The loan is interest-free and is secured against the shares in the form of a holding lock preventing all dealing in the shares. The loan is limited recourse such that if the shares do not ultimately vest and are therefore forfeited, this is treated as full repayment of the loan balance. While the loan balance remains outstanding, any dividends paid on the shares, net of the tax on the dividends, will be automatically applied towards repayment of the loan. In making the loan in respect of the newly issued shares, there is no cash cost to the Company as the shares are newly issued. On 1 July 2020, the Company issued 2,986,400 shares (including 440,500 shares reallotted) under the LSP. In accordance with the terms of the LSP, the shares were issued at a market price of $0.617 per share and pursuant to the vesting conditions, these shares do not vest unless a share price target of a 10% premium to the issue price is met between 1 July 2021 and 1 July 2025 and the participants remain continuously employed by the Group to 1 July 2021. The award was accounted for as an in-substance option award and the fair value at grant date assessed at $0.201 per loan-funded share. In calculating this fair value, a Monte Carlo simulation model was utilised over several thousand simulations to predict the share price at each vesting test date and whether the 10% hurdle would be satisfied, with the resultant values discounted back to the grant date. The underlying share price and the exercise price were assumed at $0.61 and $0.62 per share respectively, the period to exercise was assumed as three years (being half way between the first possible vesting date and the expiry of the LSP shares), the risk free rate was 0.26% based on Australian Government bond yields with three year lives, the estimated volatility was 50% based on historical share price analysis, and the dividend yield was assumed as nil. The following table shows the number and weighted average exercise prices (WAEP) of, and movements in, LSP shares during the year:
2021 2020
Number of LSP Shares WAEP1
Number of LSP Shares WAEP1
Balance at beginning of the year 5,769,595 $0.46 4,504,295 $0.34 - granted during the year 2,986,400 $0.62 1,705,800 $1.03 - exercised during the year (2,580,567) 2 $0.23 - - - forfeited during the year - - (440,500) $1.03 Balance at end of the year 6,175,428 $0.60 5,769,595 $0.46 1 Weighted average exercise price at balance date after dividend adjustments. 2 The weighted average share price at the date of exercise of these LSP shares was $0.89.
26. Share-Based Payment Plans
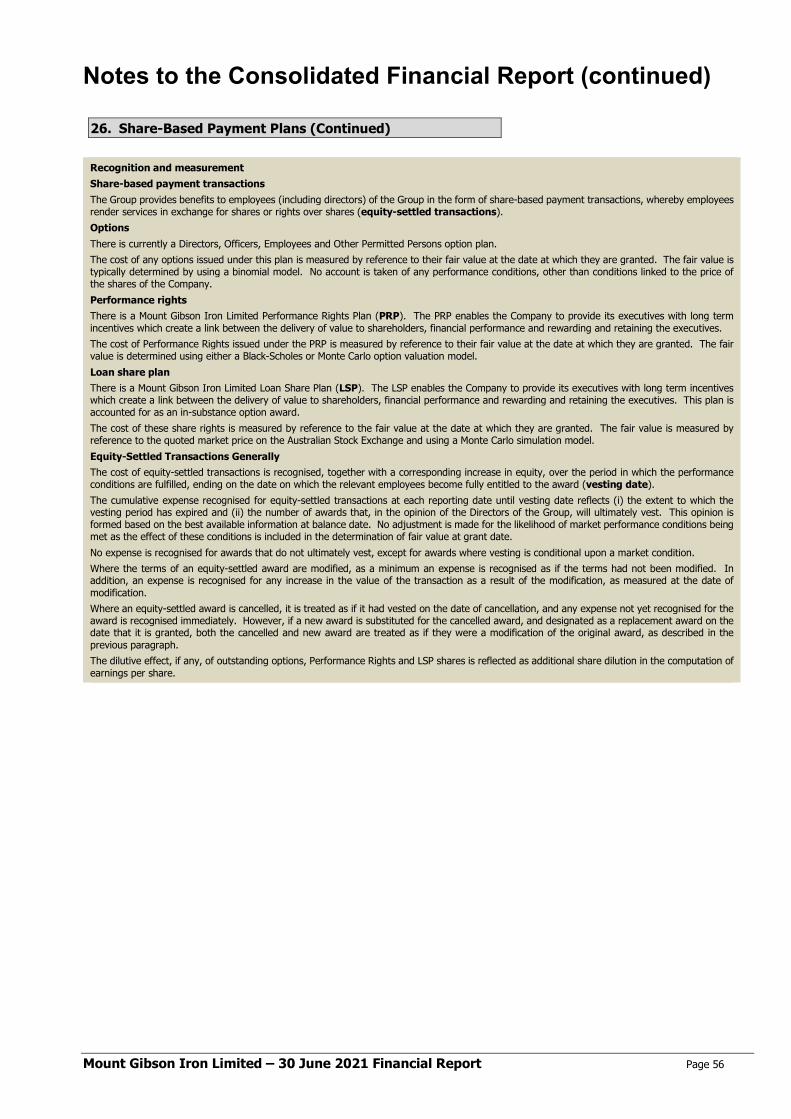
Notes to the Consolidated Financial Report (continued)
Mount Gibson Iron Limited – 30 June 2021 Financial Report Page 56
26. Share-Based Payment Plans (Continued)
Recognition and measurement Share-based payment transactions The Group provides benefits to employees (including directors) of the Group in the form of share-based payment transactions, whereby employees render services in exchange for shares or rights over shares (equity-settled transactions). Options There is currently a Directors, Officers, Employees and Other Permitted Persons option plan. The cost of any options issued under this plan is measured by reference to their fair value at the date at which they are granted. The fair value is typically determined by using a binomial model. No account is taken of any performance conditions, other than conditions linked to the price of the shares of the Company. Performance rights There is a Mount Gibson Iron Limited Performance Rights Plan (PRP). The PRP enables the Company to provide its executives with long term incentives which create a link between the delivery of value to shareholders, financial performance and rewarding and retaining the executives. The cost of Performance Rights issued under the PRP is measured by reference to their fair value at the date at which they are granted. The fair value is determined using either a Black-Scholes or Monte Carlo option valuation model. Loan share plan There is a Mount Gibson Iron Limited Loan Share Plan (LSP). The LSP enables the Company to provide its executives with long term incentives which create a link between the delivery of value to shareholders, financial performance and rewarding and retaining the executives. This plan is accounted for as an in-substance option award. The cost of these share rights is measured by reference to the fair value at the date at which they are granted. The fair value is measured by reference to the quoted market price on the Australian Stock Exchange and using a Monte Carlo simulation model. Equity-Settled Transactions Generally The cost of equity-settled transactions is recognised, together with a corresponding increase in equity, over the period in which the performance conditions are fulfilled, ending on the date on which the relevant employees become fully entitled to the award (vesting date). The cumulative expense recognised for equity-settled transactions at each reporting date until vesting date reflects (i) the extent to which the vesting period has expired and (ii) the number of awards that, in the opinion of the Directors of the Group, will ultimately vest. This opinion is formed based on the best available information at balance date. No adjustment is made for the likelihood of market performance conditions being met as the effect of these conditions is included in the determination of fair value at grant date. No expense is recognised for awards that do not ultimately vest, except for awards where vesting is conditional upon a market condition. Where the terms of an equity-settled award are modified, as a minimum an expense is recognised as if the terms had not been modified. In addition, an expense is recognised for any increase in the value of the transaction as a result of the modification, as measured at the date of modification. Where an equity-settled award is cancelled, it is treated as if it had vested on the date of cancellation, and any expense not yet recognised for the award is recognised immediately. However, if a new award is substituted for the cancelled award, and designated as a replacement award on the date that it is granted, both the cancelled and new award are treated as if they were a modification of the original award, as described in the previous paragraph. The dilutive effect, if any, of outstanding options, Performance Rights and LSP shares is reflected as additional share dilution in the computation of earnings per share.
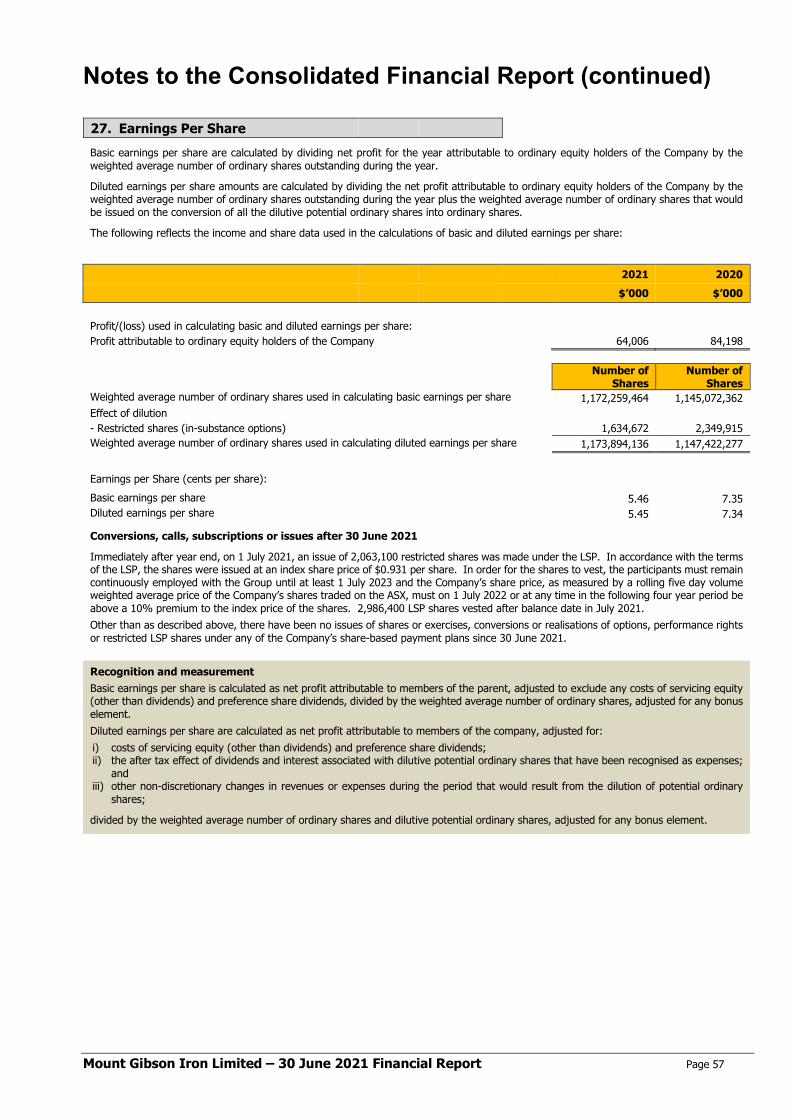
Notes to the Consolidated Financial Report (continued)
Mount Gibson Iron Limited – 30 June 2021 Financial Report Page 57
Basic earnings per share are calculated by dividing net profit for the year attributable to ordinary equity holders of the Company by the weighted average number of ordinary shares outstanding during the year.
Diluted earnings per share amounts are calculated by dividing the net profit attributable to ordinary equity holders of the Company by the weighted average number of ordinary shares outstanding during the year plus the weighted average number of ordinary shares that would be issued on the conversion of all the dilutive potential ordinary shares into ordinary shares.
The following reflects the income and share data used in the calculations of basic and diluted earnings per share:
2021 2020 $’000 $’000 Profit/(loss) used in calculating basic and diluted earnings per share: Profit attributable to ordinary equity holders of the Company 64,006 84,198
Number of
Shares Number of
Shares Weighted average number of ordinary shares used in calculating basic earnings per share 1,172,259,464 1,145,072,362 Effect of dilution - Restricted shares (in-substance options) 1,634,672 2,349,915 Weighted average number of ordinary shares used in calculating diluted earnings per share 1,173,894,136 1,147,422,277 Earnings per Share (cents per share): Basic earnings per share 5.46 7.35 Diluted earnings per share 5.45 7.34
Conversions, calls, subscriptions or issues after 30 June 2021
Immediately after year end, on 1 July 2021, an issue of 2,063,100 restricted shares was made under the LSP. In accordance with the terms of the LSP, the shares were issued at an index share price of $0.931 per share. In order for the shares to vest, the participants must remain continuously employed with the Group until at least 1 July 2023 and the Company’s share price, as measured by a rolling five day volume weighted average price of the Company’s shares traded on the ASX, must on 1 July 2022 or at any time in the following four year period be above a 10% premium to the index price of the shares. 2,986,400 LSP shares vested after balance date in July 2021. Other than as described above, there have been no issues of shares or exercises, conversions or realisations of options, performance rights or restricted LSP shares under any of the Company’s share-based payment plans since 30 June 2021. Recognition and measurement Basic earnings per share is calculated as net profit attributable to members of the parent, adjusted to exclude any costs of servicing equity (other than dividends) and preference share dividends, divided by the weighted average number of ordinary shares, adjusted for any bonus element. Diluted earnings per share are calculated as net profit attributable to members of the company, adjusted for: i) costs of servicing equity (other than dividends) and preference share dividends; ii) the after tax effect of dividends and interest associated with dilutive potential ordinary shares that have been recognised as expenses;
and iii) other non-discretionary changes in revenues or expenses during the period that would result from the dilution of potential ordinary
shares;
divided by the weighted average number of ordinary shares and dilutive potential ordinary shares, adjusted for any bonus element.
27. Earnings Per Share
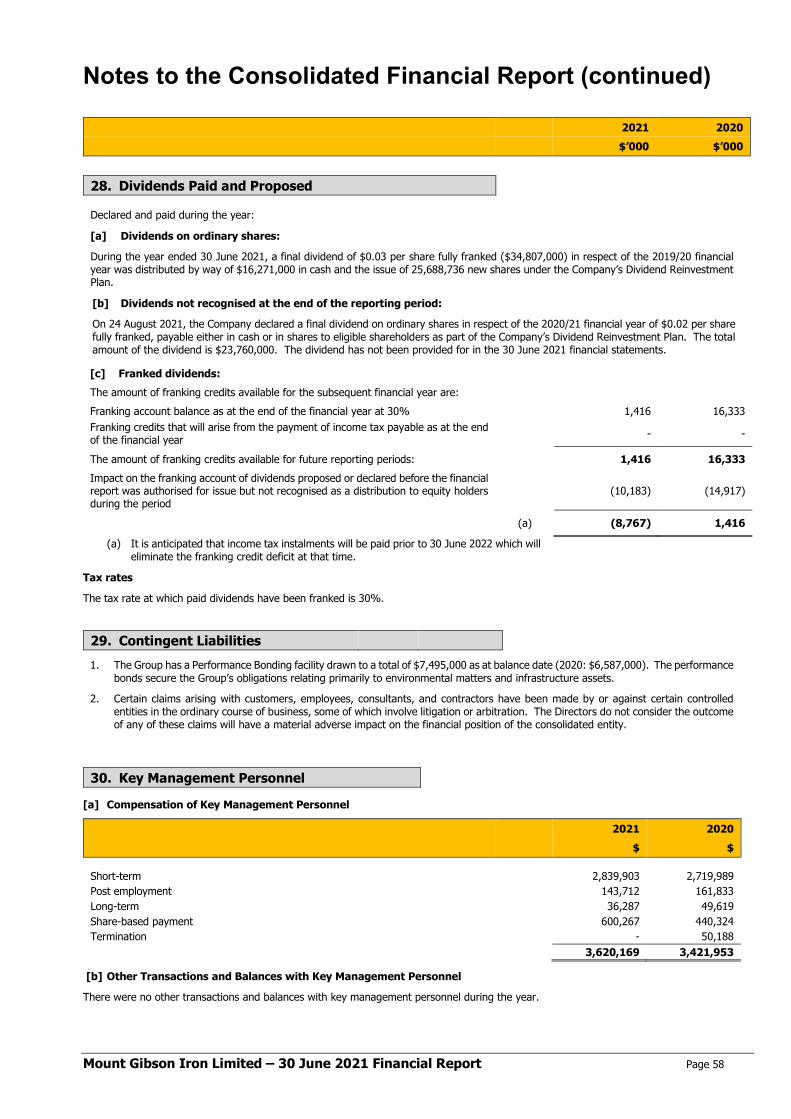
Notes to the Consolidated Financial Report (continued)
Mount Gibson Iron Limited – 30 June 2021 Financial Report Page 58
[b] Dividends not recognised at the end of the reporting period:
On 24 August 2021, the Company declared a final dividend on ordinary shares in respect of the 2020/21 financial year of $0.02 per share fully franked, payable either in cash or in shares to eligible shareholders as part of the Company’s Dividend Reinvestment Plan. The total amount of the dividend is $23,760,000. The dividend has not been provided for in the 30 June 2021 financial statements.
[c] Franked dividends: The amount of franking credits available for the subsequent financial year are: Franking account balance as at the end of the financial year at 30% 1,416 16,333 Franking credits that will arise from the payment of income tax payable as at the end of the financial year - -
The amount of franking credits available for future reporting periods: 1,416 16,333 Impact on the franking account of dividends proposed or declared before the financial report was authorised for issue but not recognised as a distribution to equity holders during the period
(10,183) (14,917)
(a) (8,767) 1,416
(a) It is anticipated that income tax instalments will be paid prior to 30 June 2022 which will eliminate the franking credit deficit at that time.
Tax rates
The tax rate at which paid dividends have been franked is 30%.
1. The Group has a Performance Bonding facility drawn to a total of $7,495,000 as at balance date (2020: $6,587,000). The performance bonds secure the Group’s obligations relating primarily to environmental matters and infrastructure assets.
2. Certain claims arising with customers, employees, consultants, and contractors have been made by or against certain controlled entities in the ordinary course of business, some of which involve litigation or arbitration. The Directors do not consider the outcome of any of these claims will have a material adverse impact on the financial position of the consolidated entity.
[a] Compensation of Key Management Personnel
2021 2020 $ $ Short-term 2,839,903 2,719,989 Post employment 143,712 161,833 Long-term 36,287 49,619 Share-based payment 600,267 440,324 Termination - 50,188 3,620,169 3,421,953
[b] Other Transactions and Balances with Key Management Personnel
There were no other transactions and balances with key management personnel during the year.
2021 2020 $’000 $’000
28. Dividends Paid and Proposed Declared and paid during the year:
[a] Dividends on ordinary shares:
During the year ended 30 June 2021, a final dividend of $0.03 per share fully franked ($34,807,000) in respect of the 2019/20 financial year was distributed by way of $16,271,000 in cash and the issue of 25,688,736 new shares under the Company’s Dividend Reinvestment Plan.
29. Contingent Liabilities
30. Key Management Personnel
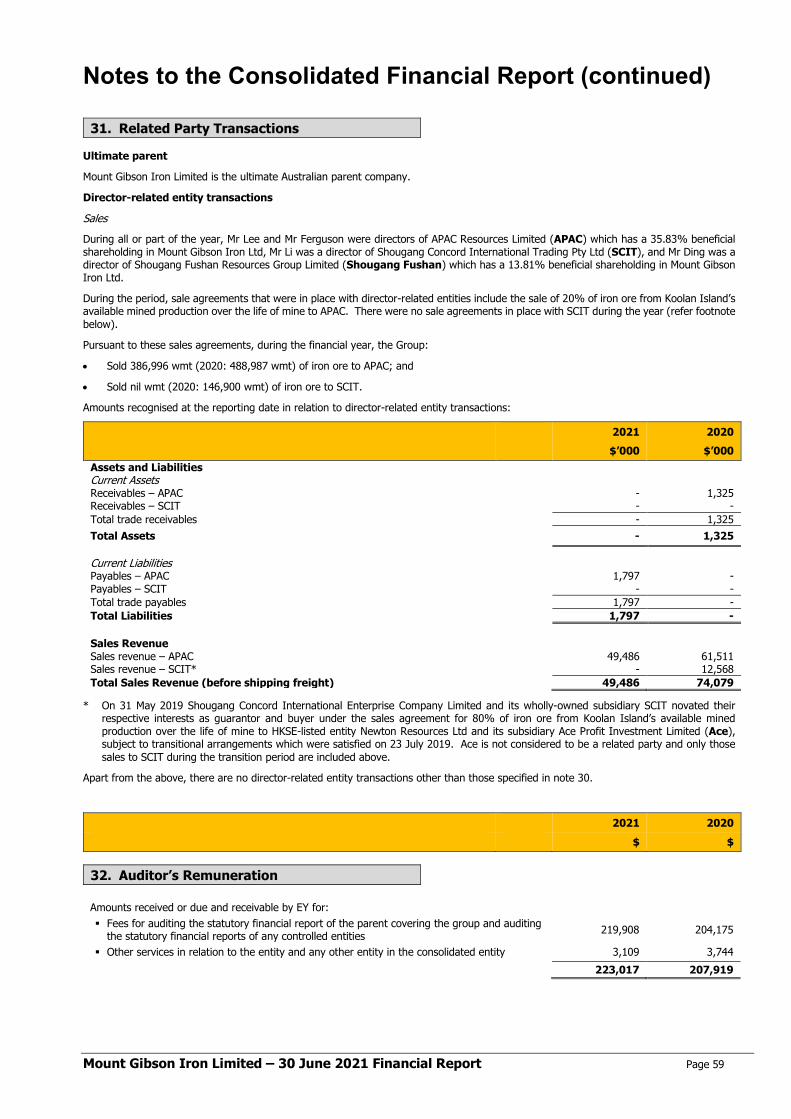
Notes to the Consolidated Financial Report (continued)
Mount Gibson Iron Limited – 30 June 2021 Financial Report Page 59
Ultimate parent
Mount Gibson Iron Limited is the ultimate Australian parent company.
Director-related entity transactions
Sales
During all or part of the year, Mr Lee and Mr Ferguson were directors of APAC Resources Limited (APAC) which has a 35.83% beneficial shareholding in Mount Gibson Iron Ltd, Mr Li was a director of Shougang Concord International Trading Pty Ltd (SCIT), and Mr Ding was a director of Shougang Fushan Resources Group Limited (Shougang Fushan) which has a 13.81% beneficial shareholding in Mount Gibson Iron Ltd.
During the period, sale agreements that were in place with director-related entities include the sale of 20% of iron ore from Koolan Island’s available mined production over the life of mine to APAC. There were no sale agreements in place with SCIT during the year (refer footnote below).
Pursuant to these sales agreements, during the financial year, the Group:
• Sold 386,996 wmt (2020: 488,987 wmt) of iron ore to APAC; and
• Sold nil wmt (2020: 146,900 wmt) of iron ore to SCIT.
Amounts recognised at the reporting date in relation to director-related entity transactions:
2021 2020 $’000 $’000 Assets and Liabilities Current Assets Receivables – APAC - 1,325 Receivables – SCIT - - Total trade receivables - 1,325 Total Assets - 1,325 Current Liabilities Payables – APAC 1,797 - Payables – SCIT - - Total trade payables 1,797 - Total Liabilities 1,797 - Sales Revenue Sales revenue – APAC 49,486 61,511 Sales revenue – SCIT* - 12,568 Total Sales Revenue (before shipping freight) 49,486 74,079
* On 31 May 2019 Shougang Concord International Enterprise Company Limited and its wholly-owned subsidiary SCIT novated their respective interests as guarantor and buyer under the sales agreement for 80% of iron ore from Koolan Island’s available mined production over the life of mine to HKSE-listed entity Newton Resources Ltd and its subsidiary Ace Profit Investment Limited (Ace), subject to transitional arrangements which were satisfied on 23 July 2019. Ace is not considered to be a related party and only those sales to SCIT during the transition period are included above.
Apart from the above, there are no director-related entity transactions other than those specified in note 30.
2021 2020 $ $
Amounts received or due and receivable by EY for: Fees for auditing the statutory financial report of the parent covering the group and auditing
the statutory financial reports of any controlled entities 219,908 204,175
Other services in relation to the entity and any other entity in the consolidated entity 3,109 3,744 223,017 207,919
31. Related Party Transactions
32. Auditor’s Remuneration
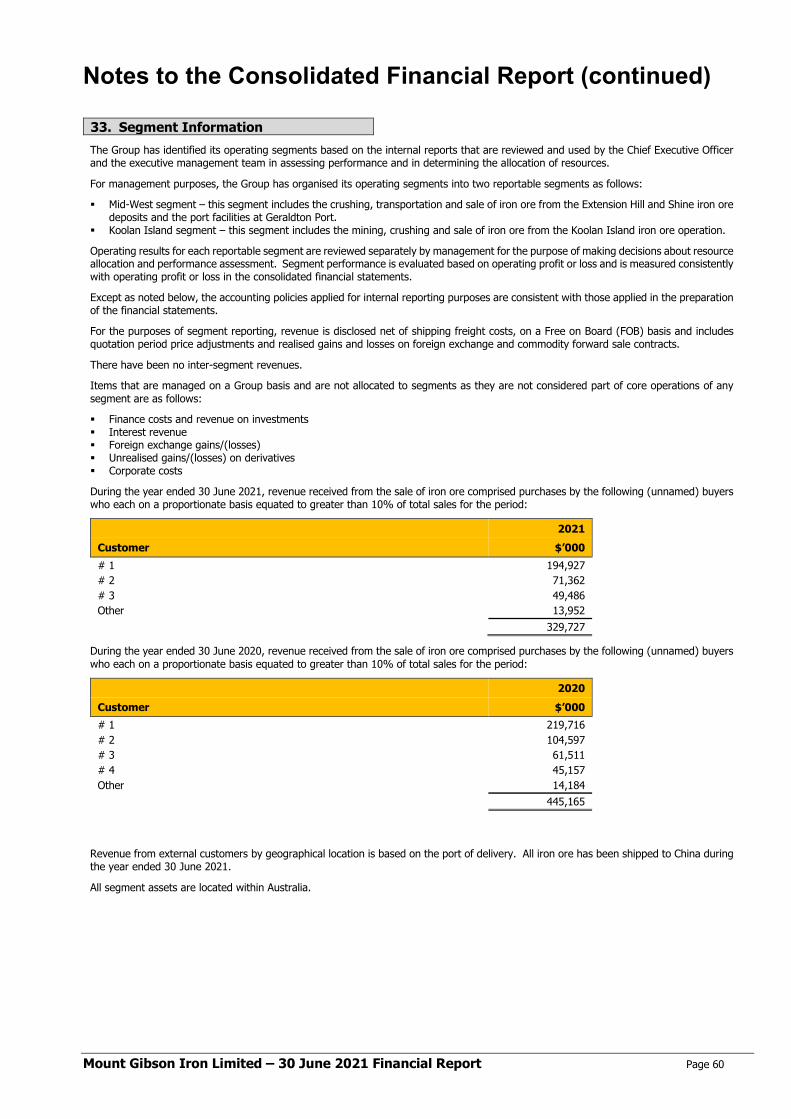
Notes to the Consolidated Financial Report (continued)
Mount Gibson Iron Limited – 30 June 2021 Financial Report Page 60
The Group has identified its operating segments based on the internal reports that are reviewed and used by the Chief Executive Officer and the executive management team in assessing performance and in determining the allocation of resources.
For management purposes, the Group has organised its operating segments into two reportable segments as follows:
Mid-West segment – this segment includes the crushing, transportation and sale of iron ore from the Extension Hill and Shine iron ore deposits and the port facilities at Geraldton Port.
Koolan Island segment – this segment includes the mining, crushing and sale of iron ore from the Koolan Island iron ore operation.
Operating results for each reportable segment are reviewed separately by management for the purpose of making decisions about resource allocation and performance assessment. Segment performance is evaluated based on operating profit or loss and is measured consistently with operating profit or loss in the consolidated financial statements.
Except as noted below, the accounting policies applied for internal reporting purposes are consistent with those applied in the preparation of the financial statements.
For the purposes of segment reporting, revenue is disclosed net of shipping freight costs, on a Free on Board (FOB) basis and includes quotation period price adjustments and realised gains and losses on foreign exchange and commodity forward sale contracts.
There have been no inter-segment revenues.
Items that are managed on a Group basis and are not allocated to segments as they are not considered part of core operations of any segment are as follows:
Finance costs and revenue on investments Interest revenue Foreign exchange gains/(losses) Unrealised gains/(losses) on derivatives Corporate costs
During the year ended 30 June 2021, revenue received from the sale of iron ore comprised purchases by the following (unnamed) buyers who each on a proportionate basis equated to greater than 10% of total sales for the period:
2021 Customer $’000 # 1 194,927 # 2 71,362 # 3 49,486 Other 13,952 329,727
During the year ended 30 June 2020, revenue received from the sale of iron ore comprised purchases by the following (unnamed) buyers who each on a proportionate basis equated to greater than 10% of total sales for the period:
2020 Customer $’000 # 1 219,716 # 2 104,597 # 3 61,511 # 4 45,157 Other 14,184 445,165
Revenue from external customers by geographical location is based on the port of delivery. All iron ore has been shipped to China during the year ended 30 June 2021.
All segment assets are located within Australia.
33. Segment Information
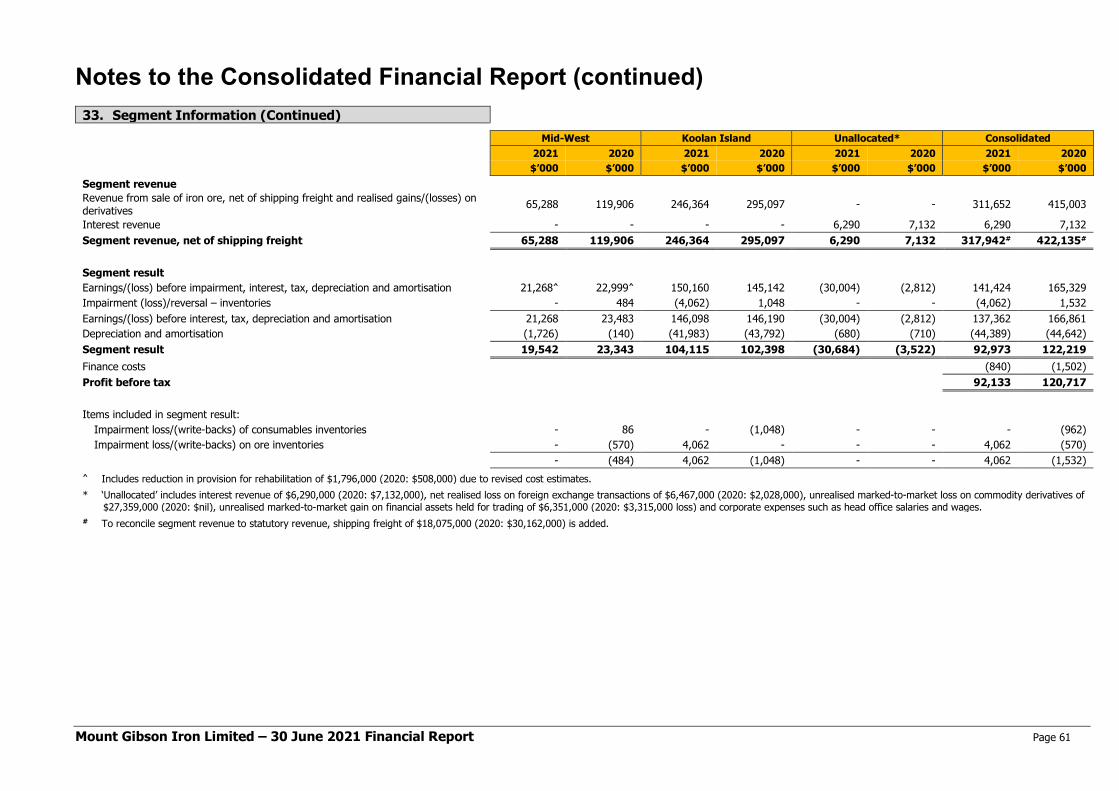
Notes to the Consolidated Financial Report (continued)
Mount Gibson Iron Limited – 30 June 2021 Financial Report Page 61
33. Segment Information (Continued) Mid-West Koolan Island Unallocated* Consolidated 2021 2020 2021 2020 2021 2020 2021 2020 $’000 $’000 $’000 $’000 $’000 $’000 $’000 $’000 Segment revenue Revenue from sale of iron ore, net of shipping freight and realised gains/(losses) on derivatives 65,288 119,906 246,364 295,097 - - 311,652 415,003
Interest revenue - - - - 6,290 7,132 6,290 7,132 Segment revenue, net of shipping freight 65,288 119,906 246,364 295,097 6,290 7,132 317,942# 422,135# Segment result Earnings/(loss) before impairment, interest, tax, depreciation and amortisation 21,268^ 22,999^ 150,160 145,142 (30,004) (2,812) 141,424 165,329 Impairment (loss)/reversal – inventories - 484 (4,062) 1,048 - - (4,062) 1,532 Earnings/(loss) before interest, tax, depreciation and amortisation 21,268 23,483 146,098 146,190 (30,004) (2,812) 137,362 166,861 Depreciation and amortisation (1,726) (140) (41,983) (43,792) (680) (710) (44,389) (44,642) Segment result 19,542 23,343 104,115 102,398 (30,684) (3,522) 92,973 122,219 Finance costs (840) (1,502) Profit before tax 92,133 120,717 Items included in segment result:
Impairment loss/(write-backs) of consumables inventories - 86 - (1,048) - - - (962) Impairment loss/(write-backs) on ore inventories - (570) 4,062 - - - 4,062 (570)
- (484) 4,062 (1,048) - - 4,062 (1,532) ^ Includes reduction in provision for rehabilitation of $1,796,000 (2020: $508,000) due to revised cost estimates. * ‘Unallocated’ includes interest revenue of $6,290,000 (2020: $7,132,000), net realised loss on foreign exchange transactions of $6,467,000 (2020: $2,028,000), unrealised marked-to-market loss on commodity derivatives of
$27,359,000 (2020: $nil), unrealised marked-to-market gain on financial assets held for trading of $6,351,000 (2020: $3,315,000 loss) and corporate expenses such as head office salaries and wages. # To reconcile segment revenue to statutory revenue, shipping freight of $18,075,000 (2020: $30,162,000) is added.

Notes to the Consolidated Financial Report (continued)
Mount Gibson Iron Limited – 30 June 2021 Financial Report Page 62
33. Segment Information (Continued) Mid-West Koolan Island Unallocated* Consolidated 2021 2020 2021 2020 2021 2020 2021 2020 $’000 $’000 $’000 $’000 $’000 $’000 $’000 $’000 Segment assets Current financial assets 9,258 16,952 29,354 58,533 338,664 367,533 377,276 443,018 Other current assets 8,307 4,776 24,235 37,666 2,013 1,266 34,555 43,708 Property, plant and equipment 3,862 187 59,048 44,177 554 229 63,464 44,593 Right-of-use assets 10,858 - 5,084 10,847 1,968 1,170 17,910 12,017 Mine properties 28,426 - 375,557 233,785 - - 403,983 233,785 Other non-current assets - - 1,047 1,488 - 3 1,047 1,491 Deferred tax assets - - - - - 26,165 - 26,165 Total assets 60,711 21,915 494,325 386,496 343,199 396,366 898,235 804,777 Segment liabilities Financial liabilities 29,447 18,025 56,513 51,736 32,551 3,382 118,511 73,143 Other liabilities 10,526 11,222 45,459 47,831 2,031 1,856 58,016 60,909 Deferred tax liabilities - - - - 1,994 - 1,994 - Total liabilities 39,973 29,247 101,972 99,567 36,576 5,238 178,521 134,052 Net assets/(liabilities) 20,738 (7,332) 392,353 286,929 306,623 391,128 719,714 670,725 * ‘Unallocated’ current financial assets include cash and cash equivalents of $68,732,000 (2020: $54,333,000), term deposits of $118,500,000 (2020: $182,600,000), subordinated notes of $79,861,000 (2020: $92,557,000),
financial assets held for trading of $57,936,000 (2020: $36,407,000), trade debtors and other receivables of $492,000 (2020: $1,079,000) and derivatives of $13,143,000 (2020: $557,000). ‘Unallocated’ financial liabilities include trade and other payables of $2,646,000 (2020: $2,176,000), interest-bearing loans and borrowings of $1,997,000 (2020: $1,206,000) and derivatives of $27,908,000 (2020: $nil).

Notes to the Consolidated Financial Report (continued)
Mount Gibson Iron Limited – 30 June 2021 Financial Report Page 63
On 24 August 2021, the Company declared a final dividend on ordinary shares in respect of the 2020/21 financial year of $0.02 per share fully franked, payable either in cash or in shares to eligible shareholders as part of the Company’s Dividend Reinvestment Plan. The total amount of the dividend is $23,760,000. The dividend has not been provided for in the 30 June 2021 financial statements.
Apart from the above, as at the date of this report there are no significant events after balance date of the Company or of the Group that require adjustment of or disclosure in this report.
[a] Financial risk management objectives
The Group’s principal financial instruments, other than derivatives, comprise bank, cash and short-term deposits, financial assets held for trading, trade and other receivables, trade and other payables, and lease liabilities.
The main purpose of these financial instruments is to manage short term cash flows for the Group’s operations.
The Group has various other financial instruments such as trade receivables and trade creditors, which arise directly from its operations.
The Group also enters into derivatives transactions, principally forward currency contracts, and from time to time also enters into foreign currency collar options and iron ore swaps. The purpose is to manage the currency and commodity price risks arising from the Group’s operations.
The main risks arising from the Group’s financial instruments are foreign currency risk, interest rate risk, credit risk, commodity price risk and liquidity risk. The Board reviews and agrees management’s recommended policies for managing each of these risks, as summarised below and in accordance with the Company’s Financial Risk Management Policy.
[b] Foreign currency risk
The Group is exposed to the risk of adverse movement in the A$ compared to the US$ as its iron ore sales receipts are predominantly denominated in US$. The Group has used derivative financial instruments to manage specifically identified foreign currency exposures by hedging a proportion of forecast US$ sales transactions in accordance with its risk management policy. The primary objective of using derivative financial instruments is to reduce the volatility of earnings and cashflows attributable to changes in the A$/US$ exchange rate and to protect against adverse movements in this rate.
The Group recognises derivative financial instruments at fair value at the date the derivative contract is entered into. The Group applies hedge accounting to forward foreign currency contracts and collar option contracts that meet the criteria of cash flow hedges.
At 30 June 2021, the notional amount of the foreign exchange hedge book totalling US$32,500,000 is made up exclusively of collar option contracts with maturity dates in the 7 months ended 27 January 2022 and with an average cap price of A$1.00/US$0.7850 and an average floor price of A$1.00/US$0.7452.
As at 30 June 2021, the marked-to-market unrealised loss on the total outstanding US dollar foreign exchange hedge book of US$32,500,000 was $549,000. This was recognised in the profit or loss as balance date.
At 30 June 2021, the Group held dual currency deposits totalling US$10,000,000 with an expiry of 6 July 2021. The marked-to-market unrealised loss of $158,000 on the dual currency deposits was recognised in the profit or loss at balance date.
It is the Group’s policy to negotiate the terms of the hedge derivatives to match the terms of the hedged item to maximise hedge effectiveness.
The Group uses the following derivative instruments to manage foreign currency risk from time to time as business needs and conditions dictate:
Instrument Type of Hedging Objective
Forward exchange contracts Cash flow hedge To hedge sales receipts against cash flow volatility arising from the fluctuation of the A$/US$ exchange rate.
Collar options Cash flow hedge To hedge sales receipts against cash flow volatility arising from the fluctuation of the A$/US$ exchange rate by limiting exposure to exchange rates within a certain range of acceptable rates.
34. Events After the Balance Sheet Date
35. Financial Instruments

Notes to the Consolidated Financial Report (continued)
Mount Gibson Iron Limited – 30 June 2021 Financial Report Page 64
35. Financial Instruments (Continued) [i] Foreign exchange contracts – cash flow hedges
At balance date, the following foreign exchange contracts designed as a hedge of anticipated future receipts that will be denominated in US$ were outstanding:
2021 2020
Average Contract
Rate
Contract Amount
US$
Contract Amount
A$
Fair Value
A$
Average Contract
Rate
Contract Amount
US$
Contract Amount
A$
Fair Value
A$ A$/US$ $’000 $’000 $’000 A$/US$ $’000 $’000 $’000
Collar Option Contracts Within one year: 2,500 3,185 (26) 3,000 4,348 50 - call strike price 0.7850 0.6900 - put strike price 0.7470 0.6358 Within one year: 15,000 19,108 (234) 2,000 3,053 157 - call strike price 0.7850 0.6550 - put strike price 0.7453 0.5950 Within one year: 15,000 19,108 (289) 6,000 8,955 350 - call strike price 0.7850 0.6700 - put strike price 0.7449 0.6033 Total 32,500 41,401 (549) 11,000 16,356 557
At balance date, the following foreign exchange contracts were recognised on the balance sheet and income statement: 2021 2020 Notes $’000 $’000 Current assets 11 - 557 Current liabilities 20 549 - Total collar option contracts 549 557
[ii] Dual currency deposits
At balance date, the following dual currency deposit contracts were outstanding: 2021 2020
Strike
Rate
Contract Amount
US$
Contract Amount
A$
Fair Value
A$
Carrying Amount
A$ Strike
Rate
Contract Amount
US$
Contract Amount
A$
Fair Value
Carrying Amount
A$ A$/US$ $’000 $’000 $’000 $’000 A$/US
$ $’000 $’000 $’000 $’000
Within one year: 0.7585 10,000 13,301 (158) 13,143 - - - - - Total 10,000 13,301 (158) 13,143 - - - -
[iii] Foreign currency sensitivity
The following table details the effect on profit and other comprehensive income after tax of a 10% change in the A$ against the US$ from the spot rates at 30 June 2021 and 30 June 2020.
Sensitivity to a 10% change in A$ against US$ at balance date
Net Profit Other Comprehensive Income 2021 2020 2021 2020 $’000 $’000 $’000 $’000
10% appreciation in the A$ spot rate with all other variables held constant (5,226) (4,178) 1,530 1,302 10% depreciation in the A$ spot rate with all other variables held constant 6,387 5,107 (3,201) (172)
The sensitivity analysis of the Group’s exposure to the foreign currency risk at balance date has been determined based on the change in value due to foreign exchange movement based on exposures at balance sheet date. A positive number indicates an increase in profit and other comprehensive income.
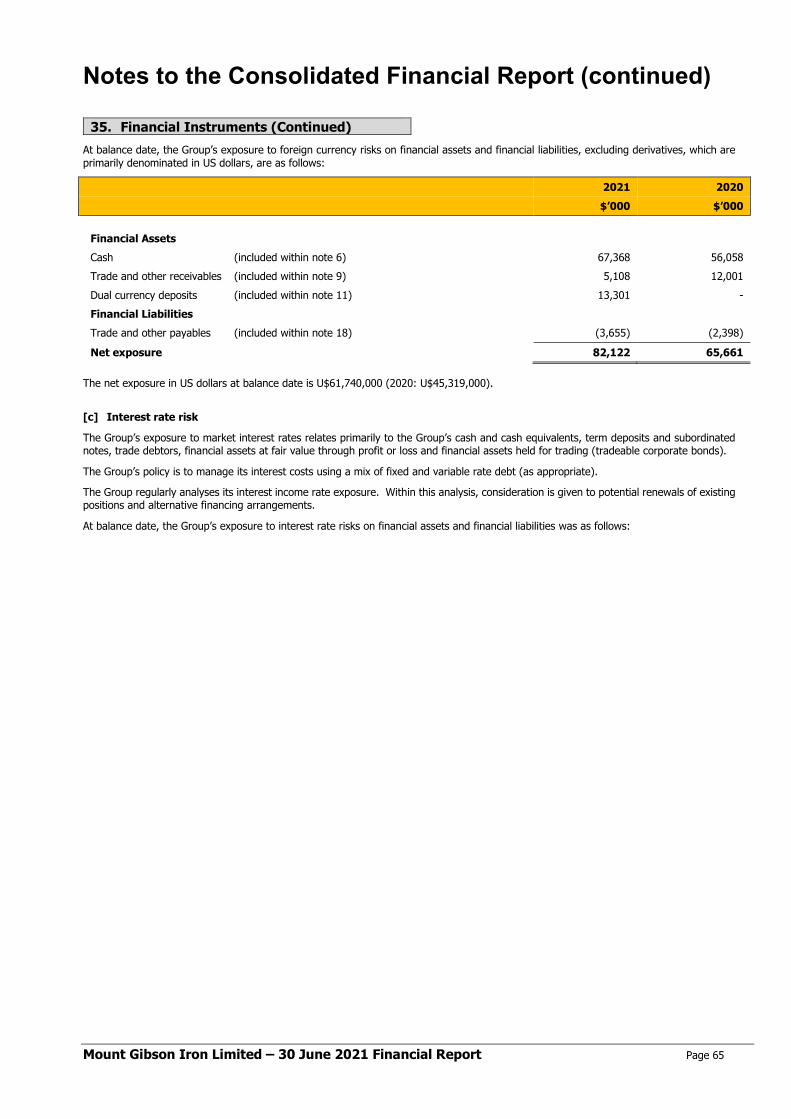
Notes to the Consolidated Financial Report (continued)
Mount Gibson Iron Limited – 30 June 2021 Financial Report Page 65
35. Financial Instruments (Continued)
At balance date, the Group’s exposure to foreign currency risks on financial assets and financial liabilities, excluding derivatives, which are primarily denominated in US dollars, are as follows:
2021 2020 $’000 $’000 Financial Assets Cash (included within note 6) 67,368 56,058 Trade and other receivables (included within note 9) 5,108 12,001 Dual currency deposits (included within note 11) 13,301 - Financial Liabilities Trade and other payables (included within note 18) (3,655) (2,398)
Net exposure 82,122 65,661
The net exposure in US dollars at balance date is U$61,740,000 (2020: U$45,319,000).
[c] Interest rate risk
The Group’s exposure to market interest rates relates primarily to the Group’s cash and cash equivalents, term deposits and subordinated notes, trade debtors, financial assets at fair value through profit or loss and financial assets held for trading (tradeable corporate bonds).
The Group’s policy is to manage its interest costs using a mix of fixed and variable rate debt (as appropriate).
The Group regularly analyses its interest income rate exposure. Within this analysis, consideration is given to potential renewals of existing positions and alternative financing arrangements.
At balance date, the Group’s exposure to interest rate risks on financial assets and financial liabilities was as follows:
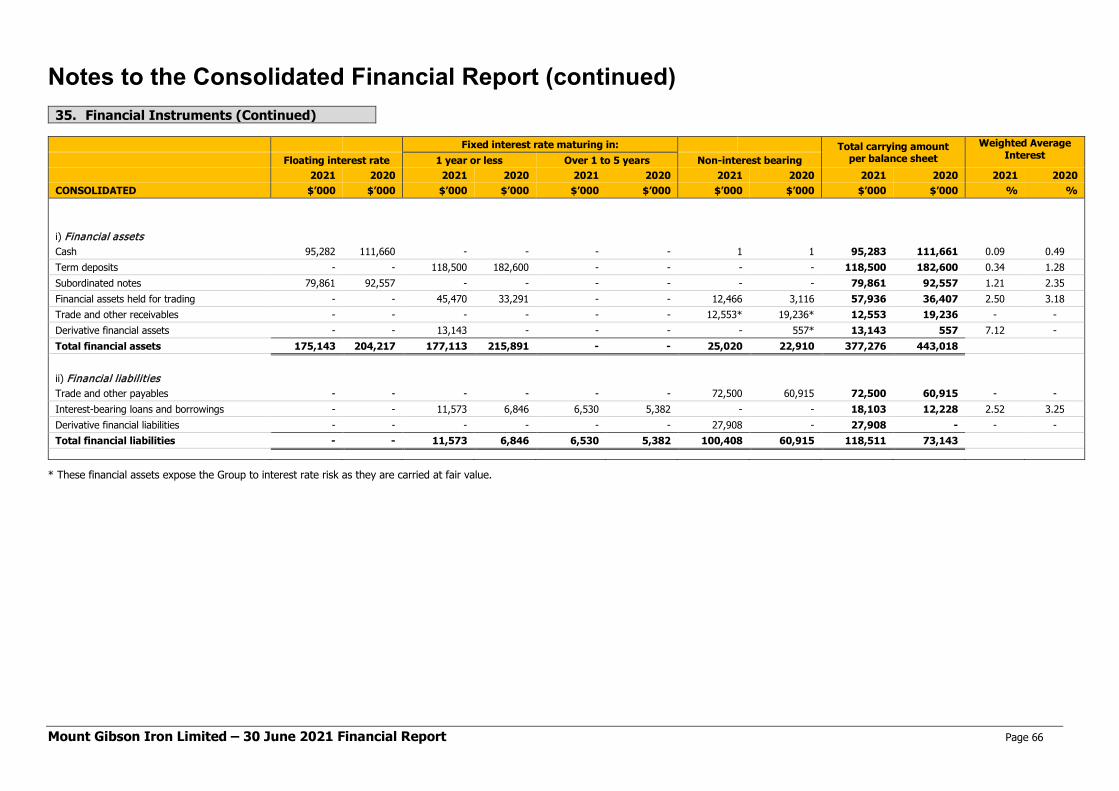
Notes to the Consolidated Financial Report (continued)
Mount Gibson Iron Limited – 30 June 2021 Financial Report Page 66
35. Financial Instruments (Continued)
Fixed interest rate maturing in: Total carrying amount per balance sheet
Weighted Average Interest Floating interest rate 1 year or less Over 1 to 5 years Non-interest bearing
2021 2020 2021 2020 2021 2020 2021 2020 2021 2020 2021 2020 CONSOLIDATED $’000 $’000 $’000 $’000 $’000 $’000 $’000 $’000 $’000 $’000 % %
i) Financial assets Cash 95,282 111,660 - - - - 1 1 95,283 111,661 0.09 0.49 Term deposits - - 118,500 182,600 - - - - 118,500 182,600 0.34 1.28 Subordinated notes 79,861 92,557 - - - - - - 79,861 92,557 1.21 2.35 Financial assets held for trading - - 45,470 33,291 - - 12,466 3,116 57,936 36,407 2.50 3.18 Trade and other receivables - - - - - - 12,553* 19,236* 12,553 19,236 - - Derivative financial assets - - 13,143 - - - - 557* 13,143 557 7.12 - Total financial assets 175,143 204,217 177,113 215,891 - - 25,020 22,910 377,276 443,018 ii) Financial liabilities Trade and other payables - - - - - - 72,500 60,915 72,500 60,915 - - Interest-bearing loans and borrowings - - 11,573 6,846 6,530 5,382 - - 18,103 12,228 2.52 3.25 Derivative financial liabilities - - - - - - 27,908 - 27,908 - - - Total financial liabilities - - 11,573 6,846 6,530 5,382 100,408 60,915 118,511 73,143
* These financial assets expose the Group to interest rate risk as they are carried at fair value.

Notes to the Consolidated Financial Report (continued)
Mount Gibson Iron Limited – 30 June 2021 Financial Report Page 67
35. Financial Instruments (Continued)
[i] Interest rate sensitivity
The following table details the effect on profit and other comprehensive income after tax of a 0.25% change in interest rates, in absolute terms.
Sensitivity of a 0.25% change in interest rates
Net Profit Other Comprehensive Income 2021 2020 2021 2020 $’000 $’000 $’000 $’000
• 0.25% increase in interest rate with all
other variables held constant 462 614 - -
• 0.25% decrease in interest rate with all other variables held constant (462) (614) - -
The sensitivity analysis of the Group’s exposure to Australian variable interest rates at balance date has been determined based on exposures at balance sheet date. A positive number indicates an increase in profit and equity.
[d] Credit risk
The Group’s maximum exposures to credit risk at balance date in relation to each class of recognised financial assets, other than derivatives, is the carrying amount of those assets as indicated in the balance sheet.
In relation to derivative financial instruments, whether recognised or unrecognised, credit risk arises from the potential failure of counterparties to meet their obligations under the contract or arrangement. The Group’s maximum credit risk exposure in relation to forward exchange and collar exchange contracts is the full amount of the foreign currency it will be required to pay or purchase when settling the forward or collar exchange contract, should the counterparty not pay the currency it is committed to deliver to the Group.
The majority of the Group’s customers are located in China. The Group minimises concentrations of credit risk in relation to trade receivables by undertaking transactions with a number of customers and by the use of advance payments and letters of credit which effectively protect at least 95% of the estimated receivable amount at the time of sale.
Credit risk from balances with banks and financial institutions is managed in accordance with a Board-approved policy. Investments of surplus funds are made only with approved counterparties with an acceptable Standard & Poor’s credit rating and within credit limits assigned to each counterparty. Counterparty credit limits are reviewed by the Board on an ongoing basis, and may be updated throughout the year. The limits are set to minimise the concentration of risks and therefore mitigate financial loss through potential counterparty failure. No material exposure is presently considered to exist by virtue of the possible non-performance of the counterparties to financial instruments.
There are no significant concentrations of credit risk within the Group.
[e] Commodity price risk
The Group’s operations are exposed to commodity price risk as the Group sells iron ore to its customers. The majority of the Group’s sales revenue is derived under long term sales contracts. The pricing mechanism in these contracts reflects a market based clearing index. The pricing mechanism adopts the Platts Iron Ore Index Price (Platts Index) which is published daily for iron ore “fines” with Fe content ranging from 52% to 65% and is quoted on a US$ per dry metric tonne “Cost and Freight” North China basis. “Lump” iron ore typically receives a premium to the published Platts Index “fines” price.
During the period, the Group entered into collar option contracts totalling 270,000 dry metric tonnes (“dmt”) of iron ore, with maturity dates spread over the period July 2021 to December 2021. The contracts have floor price protection for Mount Gibson of US$100-110/dmt (62% Fe CFR) and cap prices, above which Mount Gibson does not participate, of US$107-133/dmt.
At balance date, these contracts remained outstanding with a fair value loss of $27,359,000 (2020: $nil). The fair value of the collar contracts has been recognised in the balance sheet as derivative financial liabilities and the marked-to-market unrealised loss has been recognised in the profit or loss at balance date.
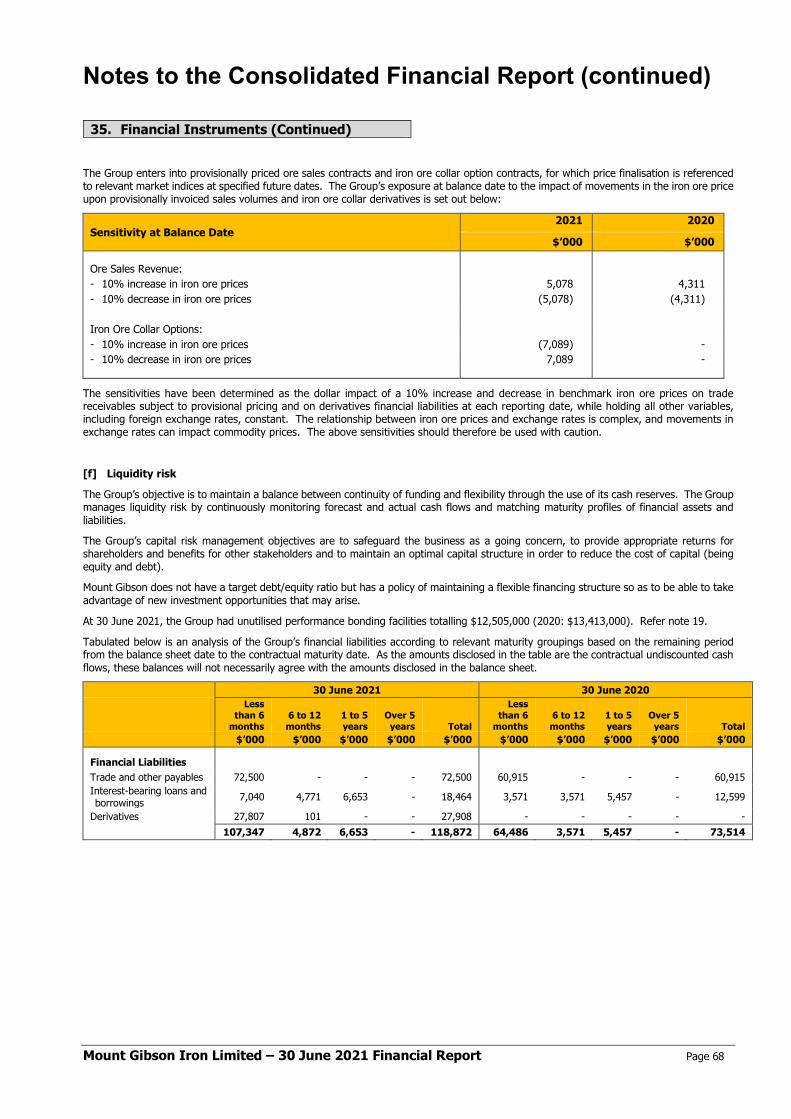
Notes to the Consolidated Financial Report (continued)
Mount Gibson Iron Limited – 30 June 2021 Financial Report Page 68
35. Financial Instruments (Continued)
The Group enters into provisionally priced ore sales contracts and iron ore collar option contracts, for which price finalisation is referenced to relevant market indices at specified future dates. The Group’s exposure at balance date to the impact of movements in the iron ore price upon provisionally invoiced sales volumes and iron ore collar derivatives is set out below:
Sensitivity at Balance Date 2021
2020
$’000 $’000
Ore Sales Revenue: - 10% increase in iron ore prices 5,078 4,311 - 10% decrease in iron ore prices (5,078) (4,311) Iron Ore Collar Options: - 10% increase in iron ore prices (7,089) - - 10% decrease in iron ore prices 7,089 -
The sensitivities have been determined as the dollar impact of a 10% increase and decrease in benchmark iron ore prices on trade receivables subject to provisional pricing and on derivatives financial liabilities at each reporting date, while holding all other variables, including foreign exchange rates, constant. The relationship between iron ore prices and exchange rates is complex, and movements in exchange rates can impact commodity prices. The above sensitivities should therefore be used with caution.
[f] Liquidity risk
The Group’s objective is to maintain a balance between continuity of funding and flexibility through the use of its cash reserves. The Group manages liquidity risk by continuously monitoring forecast and actual cash flows and matching maturity profiles of financial assets and liabilities.
The Group’s capital risk management objectives are to safeguard the business as a going concern, to provide appropriate returns for shareholders and benefits for other stakeholders and to maintain an optimal capital structure in order to reduce the cost of capital (being equity and debt).
Mount Gibson does not have a target debt/equity ratio but has a policy of maintaining a flexible financing structure so as to be able to take advantage of new investment opportunities that may arise.
At 30 June 2021, the Group had unutilised performance bonding facilities totalling $12,505,000 (2020: $13,413,000). Refer note 19.
Tabulated below is an analysis of the Group’s financial liabilities according to relevant maturity groupings based on the remaining period from the balance sheet date to the contractual maturity date. As the amounts disclosed in the table are the contractual undiscounted cash flows, these balances will not necessarily agree with the amounts disclosed in the balance sheet.
30 June 2021 30 June 2020
Less than 6
months 6 to 12 months
1 to 5 years
Over 5 years Total
Less than 6
months 6 to 12 months
1 to 5 years
Over 5 years Total
$’000 $’000 $’000 $’000 $’000 $’000 $’000 $’000 $’000 $’000 Financial Liabilities Trade and other payables 72,500 - - - 72,500 60,915 - - - 60,915 Interest-bearing loans and borrowings 7,040 4,771 6,653 - 18,464 3,571 3,571 5,457 - 12,599
Derivatives 27,807 101 - - 27,908 - - - - - 107,347 4,872 6,653 - 118,872 64,486 3,571 5,457 - 73,514
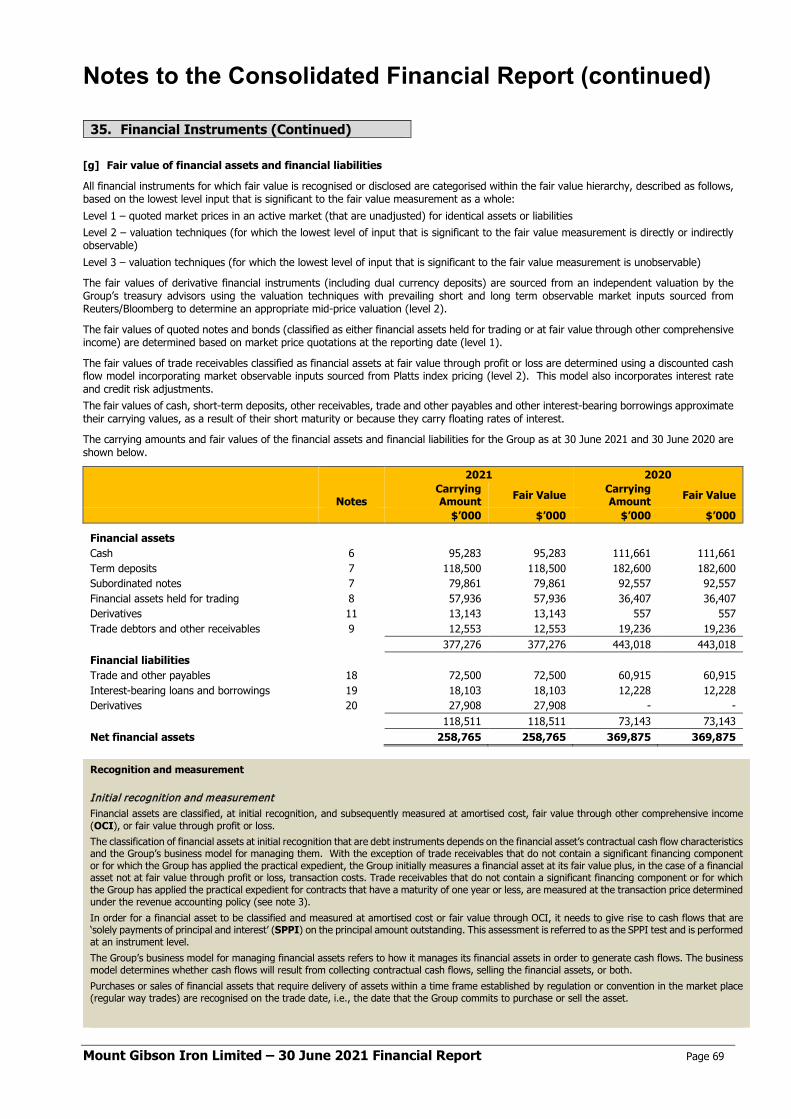
Notes to the Consolidated Financial Report (continued)
Mount Gibson Iron Limited – 30 June 2021 Financial Report Page 69
35. Financial Instruments (Continued)
[g] Fair value of financial assets and financial liabilities
All financial instruments for which fair value is recognised or disclosed are categorised within the fair value hierarchy, described as follows, based on the lowest level input that is significant to the fair value measurement as a whole: Level 1 – quoted market prices in an active market (that are unadjusted) for identical assets or liabilities Level 2 – valuation techniques (for which the lowest level of input that is significant to the fair value measurement is directly or indirectly observable) Level 3 – valuation techniques (for which the lowest level of input that is significant to the fair value measurement is unobservable)
The fair values of derivative financial instruments (including dual currency deposits) are sourced from an independent valuation by the Group’s treasury advisors using the valuation techniques with prevailing short and long term observable market inputs sourced from Reuters/Bloomberg to determine an appropriate mid-price valuation (level 2).
The fair values of quoted notes and bonds (classified as either financial assets held for trading or at fair value through other comprehensive income) are determined based on market price quotations at the reporting date (level 1).
The fair values of trade receivables classified as financial assets at fair value through profit or loss are determined using a discounted cash flow model incorporating market observable inputs sourced from Platts index pricing (level 2). This model also incorporates interest rate and credit risk adjustments. The fair values of cash, short-term deposits, other receivables, trade and other payables and other interest-bearing borrowings approximate their carrying values, as a result of their short maturity or because they carry floating rates of interest.
The carrying amounts and fair values of the financial assets and financial liabilities for the Group as at 30 June 2021 and 30 June 2020 are shown below.
2021 2020
Notes Carrying Amount Fair Value Carrying
Amount Fair Value
$’000 $’000 $’000 $’000 Financial assets Cash 6 95,283 95,283 111,661 111,661 Term deposits 7 118,500 118,500 182,600 182,600 Subordinated notes 7 79,861 79,861 92,557 92,557 Financial assets held for trading 8 57,936 57,936 36,407 36,407 Derivatives 11 13,143 13,143 557 557 Trade debtors and other receivables 9 12,553 12,553 19,236 19,236 377,276 377,276 443,018 443,018 Financial liabilities Trade and other payables 18 72,500 72,500 60,915 60,915 Interest-bearing loans and borrowings 19 18,103 18,103 12,228 12,228 Derivatives 20 27,908 27,908 - - 118,511 118,511 73,143 73,143 Net financial assets 258,765 258,765 369,875 369,875
Recognition and measurement
Initial recognition and measurement Financial assets are classified, at initial recognition, and subsequently measured at amortised cost, fair value through other comprehensive income (OCI), or fair value through profit or loss. The classification of financial assets at initial recognition that are debt instruments depends on the financial asset’s contractual cash flow characteristics and the Group’s business model for managing them. With the exception of trade receivables that do not contain a significant financing component or for which the Group has applied the practical expedient, the Group initially measures a financial asset at its fair value plus, in the case of a financial asset not at fair value through profit or loss, transaction costs. Trade receivables that do not contain a significant financing component or for which the Group has applied the practical expedient for contracts that have a maturity of one year or less, are measured at the transaction price determined under the revenue accounting policy (see note 3). In order for a financial asset to be classified and measured at amortised cost or fair value through OCI, it needs to give rise to cash flows that are ‘solely payments of principal and interest’ (SPPI) on the principal amount outstanding. This assessment is referred to as the SPPI test and is performed at an instrument level. The Group’s business model for managing financial assets refers to how it manages its financial assets in order to generate cash flows. The business model determines whether cash flows will result from collecting contractual cash flows, selling the financial assets, or both. Purchases or sales of financial assets that require delivery of assets within a time frame established by regulation or convention in the market place (regular way trades) are recognised on the trade date, i.e., the date that the Group commits to purchase or sell the asset.
Notes to the Consolidated Financial Report (continued)
Mount Gibson Iron Limited – 30 June 2021 Financial Report Page 70
Subsequent measurement For purposes of subsequent measurement, financial assets are classified in four categories: • Financial assets at amortised cost (debt instruments) • Financial assets at fair value through OCI with recycling of cumulative gains and losses (debt instruments) • Financial assets designated at fair value through OCI with no recycling of cumulative gains and losses upon derecognition (equity instruments) • Financial assets at fair value through profit or loss
Financial assets at amortised cost (debt instruments) The Group measures financial assets at amortised cost if both of the following conditions are met: • The financial asset is held within a business model with the objective to hold financial assets in order to collect contractual cash flows; and • The contractual terms of the financial asset give rise on specified dates to cash flows that are solely payments of principal and interest on the
principal amount outstanding Financial assets at amortised cost are subsequently measured using the effective interest rate (EIR) method and are subject to impairment. Interest received is recognised as part of finance income in the statement of profit or loss and other comprehensive income. Gains and losses are recognised in profit or loss when the asset is derecognised, modified or impaired. The Group’s financial assets at amortised cost include term deposits, trade receivables (not subject to provisional pricing) and other receivables (see notes 7 and 9).
Financial assets at fair value through profit or loss Financial assets at fair value through profit or loss include financial assets held for trading (see note 8), financial assets designated upon initial recognition at fair value through profit or loss or financial assets mandatorily required to be measured at fair value, i.e., where they fail the SPPI test. Financial assets are classified as held for trading if they are acquired for the purpose of selling or repurchasing in the near term. Derivatives, including separated embedded derivatives, are also classified as held for trading unless they are designated as effective hedging instruments. Financial assets with cash flows that do not pass the SPPI test are required to be classified and measured at fair value through profit or loss, irrespective of the business model. Financial assets at fair value through profit or loss are carried in the statement of financial position at fair value with net changes in fair value recognised in profit or loss. As the Group applies the SPPI test to determine the classification of financial assets, the requirements relating to the separation of embedded derivatives is no longer needed for financial assets. An embedded derivative will often make a financial asset fail the SPPI test thereby requiring the instrument to be measured at fair value through profit or loss in its entirety. This is applicable to the Group’s trade receivables subject to provisional pricing (see note 9). These receivables relate to sales contracts where the selling price is determined after delivery to the customer, based on an index price at the end of the relevant quotational period stipulated in the contract. This exposure to the market-based index price causes such trade receivables to fail the SPPI test. As a result, these receivables are measured at fair value through profit or loss from the date of recognition of the corresponding sale, with subsequent movements being recognised in other revenue (see note 3).
Financial assets at fair value through OCI The Group measures debt instruments at fair value though OCI if both of the following conditions are met: - • The financial asset is held with a business model with both the objective of both holding to collect contractual cash flows and selling; and • The contractual terms meet the SPPI test. For debt instruments at fair value through OCI, interest income and impairment losses are recognised in profit and loss and computed in the same manner as for financial assets carried at amortised cost. The remaining fair value changes are recognised in OCI. Upon derecognition, the cumulative fair value change recognised in OCI is recycled to profit and loss. The Group’s debt instruments at fair value through OCI includes the subordinated notes (see note 7).
Impairment of financial assets The Group recognises an allowance for expected credit losses (ECLs) for all debt instruments not held at fair value through profit or loss. ECLs are based on the difference between the contractual cash flows due in accordance with the contract and all the cash flows that the Group expects to receive, discounted at an approximation of the original EIR. ECLs are recognised in two stages. For credit exposures for which there has not been a significant increase in credit risk since initial recognition, ECLs are provided for credit losses that result from default events that are possible within the next 12-months (12-month ECL). For those credit exposures for which there has been a significant increase in credit risk since initial recognition, a loss allowance is required for credit losses expected over the remaining life of the exposure, irrespective of the timing of the default (lifetime ECL). For trade receivables (not subject to provisional pricing) and other receivables due in less than 12 months, the Group applies the simplified approach in calculating ECLs. Therefore, the Group does not track changes in credit risk, but instead, recognises a loss allowance based on the financial asset’s lifetime ECL at each reporting date. The Group has established a provision matrix for trade receivables that is based on its historical credit loss experience, adjusted for forward-looking factors specific to the debtors and the economic environment. For any other financial assets carried at amortised cost (which are due in more than 12 months), the ECL is based on the 12-month ECL when there has not been a significant increase in credit risk since origination. The 12-month ECL is the proportion of lifetime ECLs that results from default events on a financial instrument that are possible within 12 months after the reporting date. When there has been a significant increase in credit risk since origination, the allowance will be based on the lifetime ECL. When determining whether the credit risk of a financial asset has increased significantly since initial recognition and when estimating ECLs, the Group considers reasonable and supportable information that is relevant and available without undue cost or effort. This includes both quantitative and qualitative information and analysis, based on the Group’s historical experience and informed credit assessment including forward-looking information. The Group considers a financial asset in default when contractual payments are 90 days past due. However, in certain cases, the Group may also consider a financial asset to be in default when internal or external information indicates that the Group is unlikely to receive the outstanding contractual amounts in full before taking into account any credit enhancements held by the Group. A financial asset is written off when there is no reasonable expectation of recovering the contractual cash flows and usually occurs when past due for more than one year and not subject to enforcement activity.

Notes to the Consolidated Financial Report (continued)
Mount Gibson Iron Limited – 30 June 2021 Financial Report Page 71
Derivative financial instruments and hedging Derivative financial instruments are initially recognised at fair value on the date the derivative contract is entered into and are subsequently remeasured to fair value. Any gains and losses arising from changes in the fair value of derivatives, except those that qualify as cash flow hedges, are taken directly to net profit or loss for the year. For the purpose of hedge accounting, hedges are classified as either fair value hedges when they hedge the exposure to changes in the fair value of a recognised asset or liability, or cash flow hedges where they hedge exposure to variability in cash flows that is either attributable to a particular risk associated with a recognised asset or liability or a forecasted transaction. All hedges are currently classified as cash flow hedges. In relation to cash flow hedges to hedge firm commitments which meet the conditions for hedge accounting, the portion of the gain or loss on the hedging instrument that is determined to be an effective hedge is recognised directly in equity and the ineffective portion is recognised in the income statement. When the hedged firm commitment results in the recognition of an asset or a liability, then, at the time the asset or liability is recognised, the associated gains or losses that had previously been recognised in equity are included in the initial measurement of the acquisition cost or other carrying amount of the asset or liability. For all other cash flow hedges, the gains or losses that are recognised in equity are transferred to the income statement in the same year in which the hedged firm commitment affects the net profit and loss, for example when the future sale actually occurs.
Effectiveness is tested at inception of each hedge and monthly thereafter until the hedge expires. The cumulative dollar offset method is applied in the measurement of effectiveness. The cumulative approach involves comparing the cumulative change (to date from inception of the hedge) in the hedging instrument’s fair values to the cumulative change in the hedged item’s (or USD cash flow) attributable to the risk being hedged.
Effectiveness of the forward exchange contracts is monitored by comparing the forward net present value of the underlying cash flows to the forward net present value of the fair value associated with the hedging instrument. Prospective and retrospective testing is undertaken by the Group’s treasury advisors. At each balance date, the Group measures ineffectiveness using the ratio offset method. For foreign currency cash flow hedges if the risk is over hedged, the ineffective portion is taken immediately to other income or expense in the income statement. Hedge accounting is discontinued when the hedging instrument expires or is sold, terminated or exercised, or no longer qualifies for hedge accounting. At that point in time, any cumulative gain or loss on the hedging instrument recognised in equity is kept in equity until the forecasted transaction occurs. If a hedged transaction is no longer expected to occur, the net cumulative gain or loss recognised in equity is transferred to the income statement.
2021 2020 $’000 $’000
[a] Information relating to Mount Gibson Iron Limited:
Current assets 3,900 11,926 Total assets 1,254,459 1,158,381 Current liabilities 289 230 Total liabilities 534,745 487,656 Issued capital 620,948 602,030 Issued capital – restricted shares under Loan Share Plan 4,328 3,067 Accumulated losses (286,938) (349,955) Dividend distribution reserve 359,499 394,306 Share based payments reserve 21,877 21,277
Total Shareholder’s Equity 719,714 670,725
Net profit after tax of the parent entity 63,017 82,724
Total comprehensive profit of the parent entity 63,017 82,724
36. Parent Entity Information

Notes to the Consolidated Financial Report (continued)
Mount Gibson Iron Limited – 30 June 2021 Financial Report Page 72
[b] Details of any guarantees entered into by the parent entity
There are cross guarantees given by Mount Gibson Iron Limited in relation to the debts of its subsidiaries as described in note 12 and note 19.
The parent entity has further provided bank guarantees in respect of obligations to various authorities. Refer to note 19.
[c] Details of any contingent liabilities of the parent entity
The parent entity had contingent liabilities as at reporting date as set out in note 29. For information about guarantees given by the parent entity, refer [b] above.
[d] Details of any contractual commitments by the parent entity for the acquisition of property, plant and equipment
There are no contractual commitments by the parent entity for the acquisition of property, plant and equipment as at reporting date.
[e] Tax Consolidation
The Company and its 100%-owned entities have formed a tax consolidated group. Members of the Group entered into a tax sharing arrangement in order to allocate income tax expense to the wholly-owned controlled entities. The agreement provides for the allocation of income tax liabilities between the entities should the head entity default on its tax payment obligations. At balance date, the possibility of default is remote. The head entity of the tax consolidated group is Mount Gibson Iron Limited.
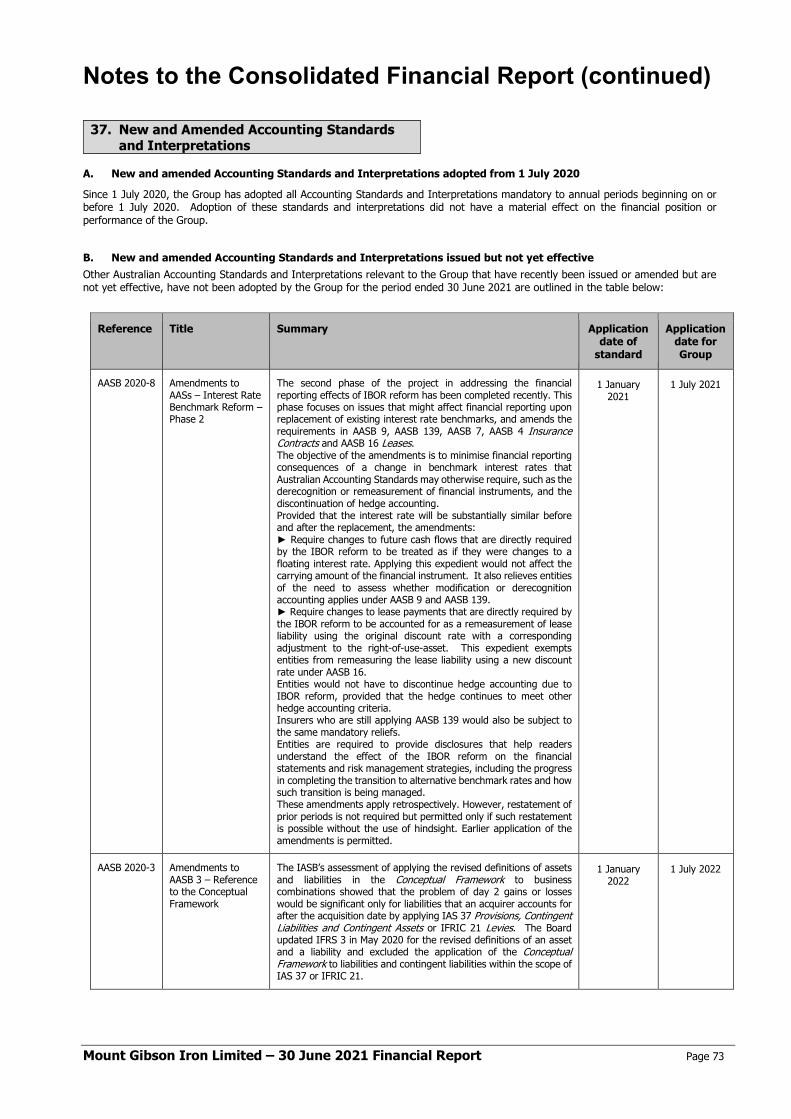
Notes to the Consolidated Financial Report (continued)
Mount Gibson Iron Limited – 30 June 2021 Financial Report Page 73
A. New and amended Accounting Standards and Interpretations adopted from 1 July 2020
Since 1 July 2020, the Group has adopted all Accounting Standards and Interpretations mandatory to annual periods beginning on or before 1 July 2020. Adoption of these standards and interpretations did not have a material effect on the financial position or performance of the Group.
B. New and amended Accounting Standards and Interpretations issued but not yet effective Other Australian Accounting Standards and Interpretations relevant to the Group that have recently been issued or amended but are not yet effective, have not been adopted by the Group for the period ended 30 June 2021 are outlined in the table below:
Reference Title Summary Application date of
standard
Application date for Group
AASB 2020-8 Amendments to AASs – Interest Rate Benchmark Reform – Phase 2
The second phase of the project in addressing the financial reporting effects of IBOR reform has been completed recently. This phase focuses on issues that might affect financial reporting upon replacement of existing interest rate benchmarks, and amends the requirements in AASB 9, AASB 139, AASB 7, AASB 4 Insurance Contracts and AASB 16 Leases. The objective of the amendments is to minimise financial reporting consequences of a change in benchmark interest rates that Australian Accounting Standards may otherwise require, such as the derecognition or remeasurement of financial instruments, and the discontinuation of hedge accounting. Provided that the interest rate will be substantially similar before and after the replacement, the amendments: ► Require changes to future cash flows that are directly required by the IBOR reform to be treated as if they were changes to a floating interest rate. Applying this expedient would not affect the carrying amount of the financial instrument. It also relieves entities of the need to assess whether modification or derecognition accounting applies under AASB 9 and AASB 139. ► Require changes to lease payments that are directly required by the IBOR reform to be accounted for as a remeasurement of lease liability using the original discount rate with a corresponding adjustment to the right-of-use-asset. This expedient exempts entities from remeasuring the lease liability using a new discount rate under AASB 16. Entities would not have to discontinue hedge accounting due to IBOR reform, provided that the hedge continues to meet other hedge accounting criteria. Insurers who are still applying AASB 139 would also be subject to the same mandatory reliefs. Entities are required to provide disclosures that help readers understand the effect of the IBOR reform on the financial statements and risk management strategies, including the progress in completing the transition to alternative benchmark rates and how such transition is being managed. These amendments apply retrospectively. However, restatement of prior periods is not required but permitted only if such restatement is possible without the use of hindsight. Earlier application of the amendments is permitted.
1 January 2021
1 July 2021
AASB 2020-3 Amendments to AASB 3 – Reference to the Conceptual Framework
The IASB’s assessment of applying the revised definitions of assets and liabilities in the Conceptual Framework to business combinations showed that the problem of day 2 gains or losses would be significant only for liabilities that an acquirer accounts for after the acquisition date by applying IAS 37 Provisions, Contingent Liabilities and Contingent Assets or IFRIC 21 Levies. The Board updated IFRS 3 in May 2020 for the revised definitions of an asset and a liability and excluded the application of the Conceptual Framework to liabilities and contingent liabilities within the scope of IAS 37 or IFRIC 21.
1 January 2022
1 July 2022
37. New and Amended Accounting Standards and Interpretations

Notes to the Consolidated Financial Report (continued)
Mount Gibson Iron Limited – 30 June 2021 Financial Report Page 74
Reference Title Summary Application date of
standard
Application date for Group
AASB 2020-3 Amendments to AASB 137 Onerous Contracts – Cost of Fulfilling a Contract
AASB 137 defines an onerous contract as a contract in which the unavoidable costs of meeting the obligations under the contract exceed the economic benefits expected to be received under it. Unavoidable cost is the lower of the cost of fulfilling the contract and any compensation or penalties arising from failure to fulfil it. AASB 137 does not specify which costs to include in determining the cost of fulfilling a contract. Consequently, AASB 137 was amended to clarify that when assessing whether a contract is onerous, the cost of fulfilling the contract comprises all costs that relate directly to the contract, which includes both the: ► Incremental costs of fulfilling that contract (e.g., materials and labour); and ► An allocation of other costs that relate directly to fulfilling contracts (e.g., depreciation of property, plant and equipment) An entity shall apply these amendments to contracts for which it has not yet fulfilled all its obligations at the beginning of the annual reporting period in which it first applies the amendments (the date of initial application). Comparative information is not restated. Instead, the cumulative effect of initially applying the amendments is recognised as an adjustment to the opening balance of retained earnings or other component of equity, as appropriate, at the date of initial application. Earlier application is permitted.
1 January 2022
1 July 2022
AASB 2020-3 Amendments to AASB 116 Property, Plant and Equipment - Proceeds before Intended Use
Under AASB 116 Property, Plant and Equipment, net proceeds from selling items produced while constructing an item of property, plant and equipment are deducted from the cost of the asset. The IASB’s research indicated practical diversity in interpreting this requirement. As a result, AASB 116 was amended to prohibit an entity from deducting from the cost of an item of property, plant and equipment, the proceeds from selling items produced before that asset is available for use. An entity is also required to measure production costs of the sold items by applying AASB 112 Inventories. Proceeds from selling any such items, and the cost of those items, are recognised in profit or loss in accordance with applicable standards. These amendments are applied retrospectively, but only to items of property, plant and equipment that are ‘ready to use’ on or after the beginning of the earliest period presented in the financial statements in which the entity first applies the amendments — ‘ready to use’ meaning the asset is in the location and condition necessary to be capable of operating in the manner intended by management. Earlier application is permitted.
1 January 2022
1 July 2022
AASB 2020-3 Amendments to AASB 9 Financial Instruments – Fees in the ’10 per cent’ Test for Derecognition of Financial Liabilities (Part of Annual Improvements 2018-2020 Cycle)
Under AASB 9, an existing financial liability that has been modified or exchanged is considered extinguished when the contractual terms of the new liability are substantially different, measured by the “10 per cent” test. That is, when the present value of the cash flows under the new terms, including any fees paid or received, is at least 10 per cent different from the present value of the remaining cash flows of the original financial liability. The amendment to AASB 9 clarifies that fees included in the 10 per cent test are limited to fees paid or received between the borrower and the lender, including amounts paid or received by them on the other’s behalf. When assessing the significance of any difference between the new and old contractual terms, only the changes in contractual cash flows between the lender and borrower are relevant. Consequently, fees incurred on the modification or exchange of a financial liability paid to third parties are excluded from the 10 per cent test. These amendments are applied prospectively. Earlier application is permitted.
1 January 2022
1 July 2022
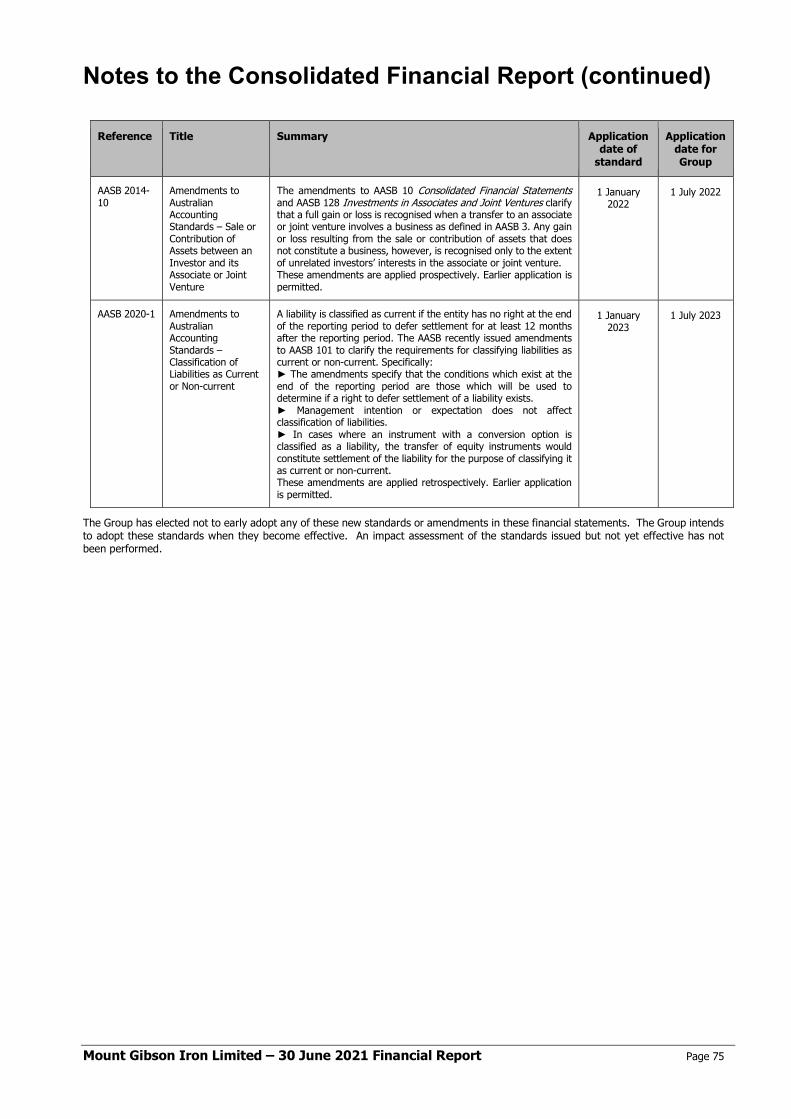
Notes to the Consolidated Financial Report (continued)
Mount Gibson Iron Limited – 30 June 2021 Financial Report Page 75
Reference Title Summary Application date of
standard
Application date for Group
AASB 2014-10
Amendments to Australian Accounting Standards – Sale or Contribution of Assets between an Investor and its Associate or Joint Venture
The amendments to AASB 10 Consolidated Financial Statements and AASB 128 Investments in Associates and Joint Ventures clarify that a full gain or loss is recognised when a transfer to an associate or joint venture involves a business as defined in AASB 3. Any gain or loss resulting from the sale or contribution of assets that does not constitute a business, however, is recognised only to the extent of unrelated investors’ interests in the associate or joint venture. These amendments are applied prospectively. Earlier application is permitted.
1 January 2022
1 July 2022
AASB 2020-1 Amendments to Australian Accounting Standards – Classification of Liabilities as Current or Non-current
A liability is classified as current if the entity has no right at the end of the reporting period to defer settlement for at least 12 months after the reporting period. The AASB recently issued amendments to AASB 101 to clarify the requirements for classifying liabilities as current or non-current. Specifically: ► The amendments specify that the conditions which exist at the end of the reporting period are those which will be used to determine if a right to defer settlement of a liability exists. ► Management intention or expectation does not affect classification of liabilities. ► In cases where an instrument with a conversion option is classified as a liability, the transfer of equity instruments would constitute settlement of the liability for the purpose of classifying it as current or non-current. These amendments are applied retrospectively. Earlier application is permitted.
1 January 2023
1 July 2023
The Group has elected not to early adopt any of these new standards or amendments in these financial statements. The Group intends to adopt these standards when they become effective. An impact assessment of the standards issued but not yet effective has not been performed.
Mount Gibson Iron Limited – 30 June 2021 Financial Report Page 76
Directors’ Declaration In accordance with a resolution of the directors of Mount Gibson Iron Limited, I state that:
1. In the opinion of the Directors:
a. the financial statements, notes and the additional disclosures included in the Directors Report designated as audited of the Group are in accordance with the Corporations Act 2001, including:
i) giving a true and fair view of the financial position of the Group as at 30 June 2021 and of its performance for the year ended on that date; and
ii) complying with Accounting Standards and the Corporations Regulations 2001; and
b. the financial statements and notes also comply with International Reporting Standards as disclosed in note 1; and
c. there are reasonable grounds to believe that the Group will be able to pay its debts as and when they become due and payable.
2. This declaration has been made after receiving the declarations required to be made to the Directors in accordance with section 295A of the Corporations Act 2001 for the financial year ended 30 June 2021.
Signed in accordance with a resolution of the directors.
LEE SENG HUI Chairman
Date: 24 August 2021
David.Stokes
Lee Seng Hui
A member firm of Ernst & Young Global Limited Liability limited by a scheme approved under Professional Standards Legislation
GB:AJ:MGI:008
Ernst & Young 11 Mounts Bay Road Perth WA 6000, Australia GPO Box M939 Perth WA 6843
Tel: +61 8 9429 2222 Fax: +61 8 9429 2436 ey.com/au
Independent auditor’s report to the members of Mount Gibson Iron Limited
Report on the audit of the financial report
Opinion
We have audited the financial report of Mount Gibson Iron Limited (the Company) and its subsidiaries (collectively
the Group), which comprises the consolidated balance sheet as at 30 June 2021, the consolidated income
statement, the consolidated statement of comprehensive income, the consolidated statement of changes in
equity and the consolidated cash flow statement for the year then ended, notes to the financial statements,
including a summary of significant accounting policies, and the directors' declaration.
In our opinion, the accompanying financial report of the Group is in accordance with the Corporations Act 2001,
including:
a. giving a true and fair view of the consolidated financial position of the Group as at 30 June 2021 and of its
consolidated financial performance for the year ended on that date; and
b. complying with Australian Accounting Standards and the Corporations Regulations 2001.
Basis for opinion
We conducted our audit in accordance with Australian Auditing Standards. Our responsibilities under those
standards are further described in the Auditor’s Responsibilities for the Audit of the Financial Report section of
our report. We are independent of the Group in accordance with the auditor independence requirements of the
Corporations Act 2001 and the ethical requirements of the Accounting Professional and Ethical Standards
Board’s APES 110 Code of Ethics for Professional Accountants (including Independence Standards) (the Code)
that are relevant to our audit of the financial report in Australia. We have also fulfilled our other ethical
responsibilities in accordance with the Code.
We believe that the audit evidence we have obtained is sufficient and appropriate to provide a basis for our
opinion.
Key audit matters
Key audit matters are those matters that, in our professional judgment, were of most significance in our audit of
the financial report of the current year. These matters were addressed in the context of our audit of the financial
report as a whole, and in forming our opinion thereon, but we do not provide a separate opinion on these matters.
For the matters below, our description of how our audit addressed each matter is provided in that context.
We have fulfilled the responsibilities described in the Auditor’s Responsibilities for the Audit of the Financial
Report section of our report, including in relation to these matters. Accordingly, our audit included the
performance of procedures designed to respond to our assessment of the risks of material misstatement of the
financial report. The results of our audit procedures, including the procedures performed to address the matters
below, provide the basis for our audit opinion on the accompanying financial report.
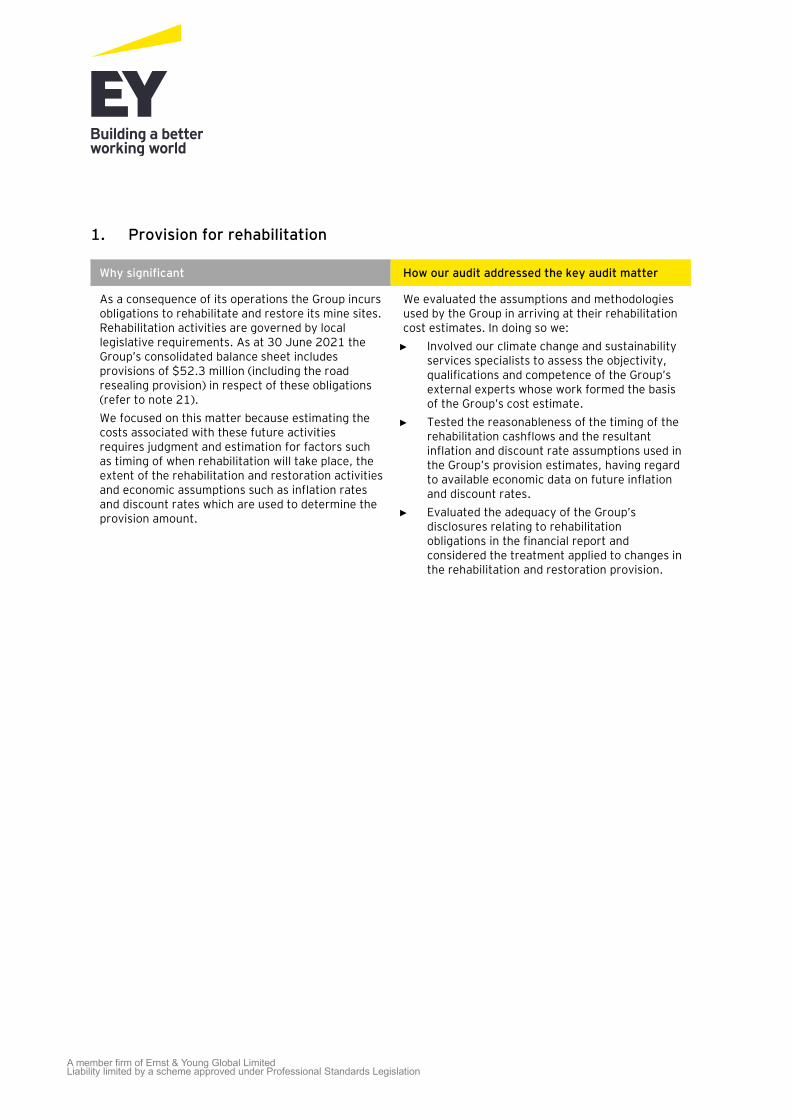
A member firm of Ernst & Young Global Limited Liability limited by a scheme approved under Professional Standards Legislation
1. Provision for rehabilitation
Why significant How our audit addressed the key audit matter
As a consequence of its operations the Group incurs obligations to rehabilitate and restore its mine sites. Rehabilitation activities are governed by local legislative requirements. As at 30 June 2021 the Group’s consolidated balance sheet includes provisions of $52.3 million (including the road resealing provision) in respect of these obligations (refer to note 21).
We focused on this matter because estimating the costs associated with these future activities requires judgment and estimation for factors such as timing of when rehabilitation will take place, the extent of the rehabilitation and restoration activities and economic assumptions such as inflation rates and discount rates which are used to determine the provision amount.
We evaluated the assumptions and methodologies used by the Group in arriving at their rehabilitation cost estimates. In doing so we:
► Involved our climate change and sustainability services specialists to assess the objectivity, qualifications and competence of the Group’s external experts whose work formed the basis of the Group’s cost estimate.
► Tested the reasonableness of the timing of the rehabilitation cashflows and the resultant inflation and discount rate assumptions used in the Group’s provision estimates, having regard to available economic data on future inflation and discount rates.
► Evaluated the adequacy of the Group’s disclosures relating to rehabilitation obligations in the financial report and considered the treatment applied to changes in the rehabilitation and restoration provision.
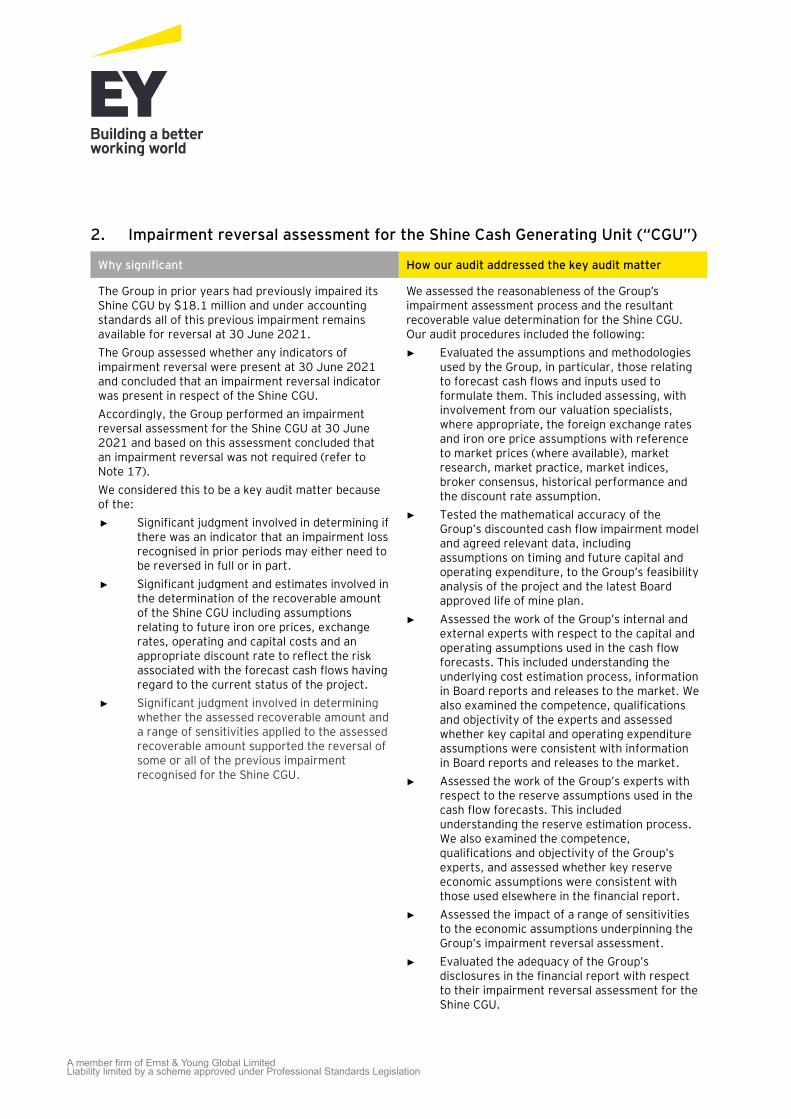
A member firm of Ernst & Young Global Limited Liability limited by a scheme approved under Professional Standards Legislation
2. Impairment reversal assessment for the Shine Cash Generating Unit (“CGU”)
Why significant How our audit addressed the key audit matter
The Group in prior years had previously impaired its Shine CGU by $18.1 million and under accounting standards all of this previous impairment remains available for reversal at 30 June 2021.
The Group assessed whether any indicators of impairment reversal were present at 30 June 2021 and concluded that an impairment reversal indicator was present in respect of the Shine CGU.
Accordingly, the Group performed an impairment reversal assessment for the Shine CGU at 30 June 2021 and based on this assessment concluded that an impairment reversal was not required (refer to Note 17).
We considered this to be a key audit matter because of the:
► Significant judgment involved in determining if there was an indicator that an impairment loss recognised in prior periods may either need to be reversed in full or in part.
► Significant judgment and estimates involved in the determination of the recoverable amount of the Shine CGU including assumptions relating to future iron ore prices, exchange rates, operating and capital costs and an appropriate discount rate to reflect the risk associated with the forecast cash flows having regard to the current status of the project.
► Significant judgment involved in determining whether the assessed recoverable amount and a range of sensitivities applied to the assessed recoverable amount supported the reversal of some or all of the previous impairment recognised for the Shine CGU.
We assessed the reasonableness of the Group’s impairment assessment process and the resultant recoverable value determination for the Shine CGU. Our audit procedures included the following:
► Evaluated the assumptions and methodologies used by the Group, in particular, those relating to forecast cash flows and inputs used to formulate them. This included assessing, with involvement from our valuation specialists, where appropriate, the foreign exchange rates and iron ore price assumptions with reference to market prices (where available), market research, market practice, market indices, broker consensus, historical performance and the discount rate assumption.
► Tested the mathematical accuracy of the Group’s discounted cash flow impairment model and agreed relevant data, including assumptions on timing and future capital and operating expenditure, to the Group’s feasibility analysis of the project and the latest Board approved life of mine plan.
► Assessed the work of the Group’s internal and external experts with respect to the capital and operating assumptions used in the cash flow forecasts. This included understanding the underlying cost estimation process, information in Board reports and releases to the market. We also examined the competence, qualifications and objectivity of the experts and assessed whether key capital and operating expenditure assumptions were consistent with information in Board reports and releases to the market.
► Assessed the work of the Group’s experts with respect to the reserve assumptions used in the cash flow forecasts. This included understanding the reserve estimation process. We also examined the competence, qualifications and objectivity of the Group’s experts, and assessed whether key reserve economic assumptions were consistent with those used elsewhere in the financial report.
► Assessed the impact of a range of sensitivities to the economic assumptions underpinning the Group’s impairment reversal assessment.
► Evaluated the adequacy of the Group’s disclosures in the financial report with respect to their impairment reversal assessment for the Shine CGU.
A member firm of Ernst & Young Global Limited Liability limited by a scheme approved under Professional Standards Legislation
Information other than the financial statements and auditor’s report
The directors are responsible for the other information. The other information comprises the information
included in the Company’s 2021 Annual Report other than the financial report and our auditor’s report thereon.
We obtained the Directors’ Report that is to be included in the Annual Report, prior to the date of this auditor’s
report, and we expect to obtain the remaining sections of the Annual Report after the date of this auditor’s
report.
Our opinion on the financial report does not cover the other information and we do not and will not express any
form of assurance conclusion thereon, with the exception of the Remuneration Report and our related assurance
opinion.
In connection with our audit of the financial report, our responsibility is to read the other information and, in
doing so, consider whether the other information is materially inconsistent with the financial report or our
knowledge obtained in the audit or otherwise appears to be materially misstated.
If, based on the work we have performed on the other information obtained prior to the date of this auditor’s
report, we conclude that there is a material misstatement of this other information, we are required to report that
fact. We have nothing to report in this regard.
Responsibilities of the directors for the financial report
The directors of the Company are responsible for the preparation of the financial report that gives a true and fair
view in accordance with Australian Accounting Standards and the Corporations Act 2001 and for such internal
control as the directors determine is necessary to enable the preparation of the financial report that gives a true
and fair view and is free from material misstatement, whether due to fraud or error.
In preparing the financial report, the directors are responsible for assessing the Group’s ability to continue as a
going concern, disclosing, as applicable, matters relating to going concern and using the going concern basis of
accounting unless the directors either intend to liquidate the Group or to cease operations, or have no realistic
alternative but to do so.
Auditor’s responsibilities for the audit of the financial report
Our objectives are to obtain reasonable assurance about whether the financial report as a whole is free from
material misstatement, whether due to fraud or error, and to issue an auditor’s report that includes our opinion.
Reasonable assurance is a high level of assurance, but is not a guarantee that an audit conducted in accordance
with the Australian Auditing Standards will always detect a material misstatement when it exists. Misstatements
can arise from fraud or error and are considered material if, individually or in the aggregate, they could
reasonably be expected to influence the economic decisions of users taken on the basis of this financial report.

A member firm of Ernst & Young Global Limited Liability limited by a scheme approved under Professional Standards Legislation
As part of an audit in accordance with the Australian Auditing Standards, we exercise professional judgment and
maintain professional scepticism throughout the audit. We also:
► Identify and assess the risks of material misstatement of the financial report, whether due to fraud or
error, design and perform audit procedures responsive to those risks, and obtain audit evidence that is
sufficient and appropriate to provide a basis for our opinion. The risk of not detecting a material
misstatement resulting from fraud is higher than for one resulting from error, as fraud may involve
collusion, forgery, intentional omissions, misrepresentations, or the override of internal control.
► Obtain an understanding of internal control relevant to the audit in order to design audit procedures that
are appropriate in the circumstances, but not for the purpose of expressing an opinion on the
effectiveness of the Group’s internal control.
► Evaluate the appropriateness of accounting policies used and the reasonableness of accounting estimates
and related disclosures made by the directors.
► Conclude on the appropriateness of the directors’ use of the going concern basis of accounting and, based
on the audit evidence obtained, whether a material uncertainty exists related to events or conditions that
may cast significant doubt on the Group’s ability to continue as a going concern. If we conclude that a
material uncertainty exists, we are required to draw attention in our auditor’s report to the related
disclosures in the financial report or, if such disclosures are inadequate, to modify our opinion. Our
conclusions are based on the audit evidence obtained up to the date of our auditor’s report. However,
future events or conditions may cause the Group to cease to continue as a going concern.
► Evaluate the overall presentation, structure and content of the financial report, including the disclosures,
and whether the financial report represents the underlying transactions and events in a manner that
achieves fair presentation.
► Obtain sufficient appropriate audit evidence regarding the financial information of the entities or business
activities within the Group to express an opinion on the financial report. We are responsible for the
direction, supervision and performance of the Group audit. We remain solely responsible for our audit
opinion.
We communicate with the directors regarding, among other matters, the planned scope and timing of the audit
and significant audit findings, including any significant deficiencies in internal control that we identify during our
audit.
We also provide the directors with a statement that we have complied with relevant ethical requirements
regarding independence, and to communicate with them all relationships and other matters that may reasonably
be thought to bear on our independence, and where applicable, actions taken to eliminate threats or safeguards
applied.
From the matters communicated to the directors, we determine those matters that were of most significance in
the audit of the financial report of the current year and are therefore the key audit matters. We describe these
matters in our auditor’s report unless law or regulation precludes public disclosure about the matter or when, in
extremely rare circumstances, we determine that a matter should not be communicated in our report because the
adverse consequences of doing so would reasonably be expected to outweigh the public interest benefits of such
communication.
A member firm of Ernst & Young Global Limited Liability limited by a scheme approved under Professional Standards Legislation
Report on the audit of the remuneration report
Opinion on the remuneration report
We have audited the Remuneration Report included in the directors' report for the year ended 30 June 2021.
In our opinion, the Remuneration Report of Mount Gibson Iron Limited for the year ended 30 June 2021,
complies with section 300A of the Corporations Act 2001.
Responsibilities
The directors of the Company are responsible for the preparation and presentation of the Remuneration Report in
accordance with section 300A of the Corporations Act 2001. Our responsibility is to express an opinion on the
Remuneration Report, based on our audit conducted in accordance with Australian Auditing Standards.
Ernst & Young Gavin Buckingham Partner Perth 24 August 2021