MOUNT GIBSON IRON LIMITED · MGI has strength to weather storms and agility to pounce Iron ore...
27
1 Strength and flexibility for volatile times Investor Presentation 27 August 2012 MOUNT GIBSON IRON LIMITED
Transcript of MOUNT GIBSON IRON LIMITED · MGI has strength to weather storms and agility to pounce Iron ore...

1
Strength and flexibility for volatile times Investor Presentation
27 August 2012
MOUNT GIBSON IRON LIMITED

2
This Document is Confidential and may not be reproduced, redistributed or passed on, directly or
indirectly, to any other person, or published, in whole or in part, for any purpose without prior written
approval from Mount Gibson Iron Limited.
This Document is not a Prospectus nor an Offer to Subscribe for Shares.
Mount Gibson Iron Limited and its subsidiaries (“MGI”) makes no representations or warranty (express or
implied) as to the accuracy, reliability or completeness of this document. MGI and its respective directors,
employees, agents and consultants shall have no liability (including liability to any person by reason of
negligence or negligent misstatement) for any statements, opinions, information or matters (expressed or
implied) arising out of, or contained in or derived from, or for any omissions from this document, except
liability under statute that cannot be excluded.
This document contains reference to certain forecasts, projections, intentions, expectations and plans of
MGI, which may or may not be achieved. They are based on certain assumptions which may not be met or
on which views may differ.
The performance and operations of MGI may be influenced by a number of factors, uncertainties and
contingencies many of which are outside the control of MGI and its directors.
No representation or warranty (expressed or implied) is made by MGI or any of its respective directors,
officers, employees, advisers or agents that any forecasts, projections, intentions, expectations or plans
set out in this document will be achieved, either totally or partially, or that any particular rate of return
will be achieved.
Investments in shares in MGI is considered highly speculative.
Disclaimer

3
Company Overview
Established multi-operation exporter of quality Australian hematite ores to China
Financial strength …….….. Strong balance sheet/earnings provide flexibility and security in challenging conditions
Leadership renewal …... Strengthened Board and Management
Quality assets …………………. Established DSO operations with existing infrastructure
Disciplined strategy ….. Leverage off existing assets and balance sheet to grow the business
Four key areas driving future corporate value

4
Company overview
• APAC Resources ~26%
• Shougang Fushan ~15%
• Institutional investors ~34%
Western Australia’s fifth largest iron ore exporter by volume
Financials (year ended 30 June) 2007 2008 2009 2010 2011 2012
Shareholders
• Issued capital 1085.7 million shares, 2 million options ($1.10/share, maturing Oct’12)
• Index S&P/ASX 200
• Market cap1 A$1,030 million
• Cash @ 30 June 2012 A$293 million
• Bank borrowings2 nil
• Finance facilities A$50m undrawn facility, A$65m environmental bonds facility,
A$47m equipment leases 3
• Sales volume MWMT 2.5 5.5 5.4 6.5 5.2 5.2
• Sales A$ m 163 433 425 536 672 648
• NPAT A$ m 484 113 43 132 239 172.5
• EPS cps 7.4 14.1 4.6 12.3 22.1 15.9
• DPS cps 0.0 0.0 0.0 0.0 4.0 4.0
Notes:
1 Share price of $0.95 as at 22 August 2012
2 At 30 June 2012
3 At 30 June 2012, environmental bond facility was drawn to $57.7m
4 Includes $19 million NPAT on sale of magnetite project

Financial Results Discussion
Financial results for the
Year ended 30 June 2012
5

6
2012 Full year results overview
• Sales revenue $648.5 million (down 3.5% on FY2011) on similar tonnes sold, but 3% lower realised price
• Net profit after tax $172.5 million
• Diluted EPS of 15.9 cents
• Operating cash flows $56.2 million
• Cash balance of $293 million
• Final dividend of 2.0 cents per share fully franked
• Full year dividend distribution maintained at 4.0 cents, fully franked
• Deferred Tax Asset of $2.9 million for MRRT
• No material MRRT impact expected over life of current assets
Strong underlying business provides a sound platform for future growth.

7
Summary 2012 financial results
12 months 12 months %
ended ended change
30-Jun-11 30-Jun-12 pcp
Tonnes mined and crushed wmt (mill) 5.38 6.94 29.0%
Tonnes sold wmt (mill) 5.24 5.21 -0.5%
Sales revenue $ mill 672.1 648.5 -3.5%
Interest income $ mill 21.1 20.3 -4.8%
Cost of goods sold $ mill -325.1 -373.4 14.9%
Impairment – low grade ore $ mill - -25.1 n/a
Gross profit $ mill 368.1 270.3 -26.6%
Admin and other expenses $ mill -20.4 -23.5 15.1%
Other income / expense $ mill 0.1 0.1 0.0%
FX derivatives mark-to-market gain $ mill 8.1 - n/a
Operating profit before interest & tax $ mill 355.9 246.9 -30.7%
Finance costs $ mill -13.0 -7.3 43.8%
Net profit before tax $ mill 342.9 239.6 -30.1%
Tax (expense) $ mill -103.4 -67.1 30.1%
Net profit after tax $ mill 239.5 172.5 -28.0%

Operating Cashflow
8
222.4 -22.1
-34.1
-84.0
-26.0
56.2
-
50.0
100.0
150.0
200.0
250.0
30 June 2011 Revenue - Price &Volume
Tax Inventory investment Operating cost 30 June 2012
A$
mill
ion
s
Operating cashflow variance FY2011 vs FY2012

Cash balance changes
9
387.0
56.2 19.8 -84.9
-18.3 -61.9
-5.1 292.7
-
50.0
100.0
150.0
200.0
250.0
300.0
350.0
400.0
450.0
500.0
2011 Cash Operating activities Interest received Property, plant andequipment
Lease liabilities Dividends paid Other 2012 Cash
A$
mill
ion
s
Cash balance movement Year ended 30 June 2012

10
Key financial indicators
12 months 12 months %
Ended Ended change
30-Jun-11 30-Jun-12 pcp
Realised selling price A$ / wmt 128.4 124.5 -3.0%
Cost of goods sold (excluding impairment) A$ / wmt -62.1 -71.7 15.5%
Margin A$ / wmt 66.3 52.8 -20.4%
EPS cps 22.1 15.9 -28.1%
Operating cash flow per share cps 20.5 5.2 -74.6
Dividend per share (annual) cps 4.0 4.0 0.0%

11
Robust financial position - profitability
• Solid profit result- 2nd
highest NPAT on record
• Strong margins
maintained in a year of
operational challenges
and legacy issues
• Completion of growth
investments
• Maintaining capacity to
generate profits at
current iron ore prices
425.5
536.3
672.1 648.5
61.7
188.3
342.9
239.6
42.6
132.4
239.5
172.5
0.0
100.0
200.0
300.0
400.0
500.0
600.0
700.0
800.0
30-Jun-09 30-Jun-10 30-Jun-11 30-Jun-12
Profit and Loss (A$m) Revenue NPBT NPAT
78.8 82.7
128.4 124.5
54.4 55.1 62.1
71.7
24.4 27.5
66.3
52.8
0.0
20.0
40.0
60.0
80.0
100.0
120.0
140.0
160.0
30-Jun-09 30-Jun-10 30-Jun-11 30-Jun-12
Realised price and margin (A$ / WMT sold) Realised price
COGS
Operating margin
Strength and flexibility for
volatile times

12
Cash & cashflow
• FY2012 cashflow reflects:
– cash tax payments commenced
– build up of inventory
• export constraints in the Mid
West due to infrastructure
upgrades
• rescheduled shipments (June
to July)
• Platform for growth established
– strong cash reserves $293 million
– ungeared – no bank borrowings
– low near-term capex
– capacity to generate cash at
current iron ore prices
– capacity to fund growth options
99.5
169.1
222.4
56.2
0.0
50.0
100.0
150.0
200.0
250.0
30-Jun-09 30-Jun-10 30-Jun-11 30-Jun-12
Operating Cash Flow ($m)
222.2
347.4
387.0
292.7
60.6
213.6
341.9
245.7
0.0
50.0
100.0
150.0
200.0
250.0
300.0
350.0
400.0
450.0
500.0
30-Jun-09 30-Jun-10 30-Jun-11 30-Jun-12
Cash and deposits ($m)
Cash and deposits Net cash and depositsStrength and flexibility to
capitalise on market
opportunities

Strength meets opportunity
Strength and flexibility to capitalise on market opportunities
13
MGI has strength to weather
storms and agility to pounce
Iron ore prices at +2 year lows
and volatility ongoing
Mining and exploration asset
values have retracted sharply
Capacity to generate
profits and cash in current
market conditions
Ungeared - no bank
borrowings
$293m cash reserves
Low capex
Growing FY2013
production/sales
Expanded export capacity
Supportive major
shareholders
S&P Chimaera Australian Mining
Index* vs S&P ASX-200 Index
Chimaera
ASX Mining
ASX-200
%
* Index comprises 62 largest ASX listed miners & explorers up
to $10b market cap, & excluding global diversified miners
Opportunities have
become cheaper
-----------------
-----

Business Overview
14

15
Leadership renewal
Board – 3 new independent directors with mining, construction and M&A experience
appointed since November 2011.
Management – Renewal of senior executive team now complete
• Geoffrey Hill – Chairman*
• Russell Barwick*
• Paul Dougas*
• Simon Bird*
• Alan Jones*
• Li Shaofeng
• Chen Zhouping
• Lee Seng Hui
* denotes Independent Non-Executive Director
• Jim Beyer CEO
• David Stokes Company Secretary/General Counsel
• Peter Kerr CFO, commencing September 2012
• Andrew Thomson COO, commencing September 2012
• Dedicated managers appointed to key areas of Human Resources, External Relations, Health
& Safety.
Management capability has been significantly strengthened
Majority of independent directors
Enhanced corporate governance mechanisms
implemented
FIRB confirmation that Mount Gibson Board
structure is consistent with ASX corporate
governance guidelines on independence.
16
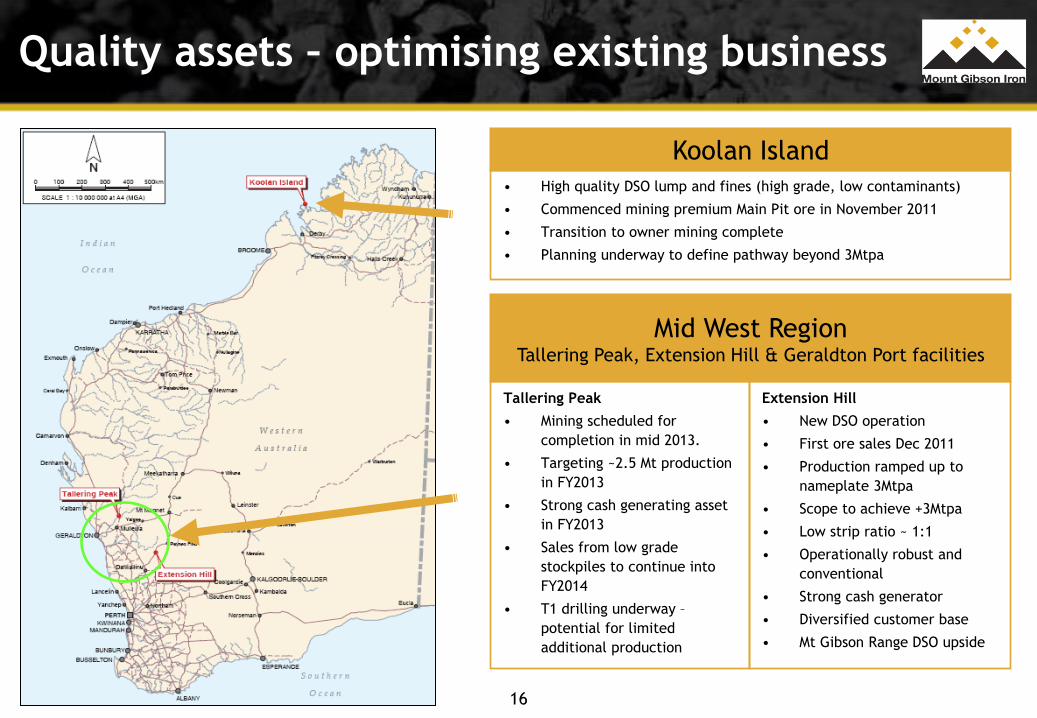
Quality assets – optimising existing business
Koolan Island
Mid West Region Tallering Peak, Extension Hill & Geraldton Port facilities
• High quality DSO lump and fines (high grade, low contaminants)
• Commenced mining premium Main Pit ore in November 2011
• Transition to owner mining complete
• Planning underway to define pathway beyond 3Mtpa
Tallering Peak
• Mining scheduled for
completion in mid 2013.
• Targeting ~2.5 Mt production
in FY2013
• Strong cash generating asset
in FY2013
• Sales from low grade
stockpiles to continue into
FY2014
• T1 drilling underway –
potential for limited
additional production
Extension Hill
• New DSO operation
• First ore sales Dec 2011
• Production ramped up to
nameplate 3Mtpa
• Scope to achieve +3Mtpa
• Low strip ratio ~ 1:1
• Operationally robust and
conventional
• Strong cash generator
• Diversified customer base
• Mt Gibson Range DSO upside

Quality assets - Koolan Island
17
• Mount Gibson’s flagship
asset
• Premium products
• Simple logistics – no rail,
standalone shiploading
facilities
• Current production rate
~3Mtpa
• Detailed planning underway
to define pathway beyond
3Mtpa
• Transition to owner mining
complete
• Main Pit now primary ore
source
• Strip ratio of 4.3:1 (average
to end of life)

18
Quality assets – Mid West

19
Quality assets – Geraldton Port
• Infrastructure access a
strategic asset - key barrier to
entry for new producers
• MGI nominal Mid West export
capacity doubled to 6Mtpa
• MGI port facility upgrades
completed May 2012
• 240,000t MGI Berth 5 shed
commissioned April 2012
• Total MGI port storage capacity
trebled to 360,000t in Sheds 4
and 5 (6 Panamax shipments)
• 50 year leases (Berth 4 from
2002, Berth 5 from 2008) -
valuable long term assets
• Rail unloader commissioning
and ramp-up commenced mid-
May 2012
• Nominal rail unloader capacity
3,000tph
A strategic asset, essential to get product to market
MGI
Berth 5
Shed
MGI
Berth
4
Shed
Rail Unloader

20
Quality assets – Extension Hill
• First ore sales December
2011
• Diversified customer
base (Glencore, Rizhao
Steel)
• Simple, low cost
operation, life of mine
strip ratio ~1:1
• Strong cash generator
• Significant stockpiles
built up during port/rail
works
• Nameplate capacity of
3Mtpa
• Potential to exceed
3Mtpa
• DSO potential in Mt
Gibson Range
4

21
Quality assets – Tallering Peak
• Mining scheduled for completion in mid 2013
• Targeting ~2.5Mt production in FY2013
• Strip ratio of 2.6:1 (average over remaining life)
• Shipping from low-grade stockpiles to continue into FY2014
• Encouraging early drilling results from T1 area

Mid West potential
• Regional prospectivity –
substantial identified iron ore
resources, exploration upside
• +200 leaseholders within
Mount Gibson operational
sphere of influence
• Resources stranded without
access to port/rail
• Oakajee port schedule
uncertain
• Geraldton only port currently
able to export iron ore
• Limited surplus capacity for
non-existing producers
• Mount Gibson 6 Mtpa export
capacity at Geraldton
• Difficult funding environment
for explorers/aspiring
producers
22
Source: Oakajee Port & Rail presentation March 2011

23
Strategy – positioning for growth
Optimising existing business, getting set for M&A and exploration-driven growth
PRIORITIES
• Bed down new executive team
• Cost control and elimination of waste/inefficiencies
• Complete optimisation of existing assets to maximise cash generation
• Reinvigorate exploration strategy and expand footprint, particularly to
capitalise on strategic export capacity in Mid West
• Evaluate opportunities in carbon steel materials in Australia and overseas
— Target assets that:
o complement existing business
o extend production profile (>15 years) and lower cost
o produce quality sought-after products
o are at pre-feasibility or feasibility stage
o can be funded and developed from internal strong cash flows

24
Summary
Established DSO products
Growing FY2013 production profile
Clean & strong balance sheet
Provides flexibility and buffer
against market volatility
Disciplined business strategy
Strong and profitable operating business
Reinvestment of capital for growth
— organic (exploration, development)
— M&A
Or dividend distributions
Mount Gibson has…
First mover status & access to
existing infrastructure
Strengthening operational
performance
Focused growth plan
Protected the business in
adverse market environment

Thank You
25
For more information contact: John Phaceas
Manager External Relations
Phone: +618 9426 7500
Email: [email protected]
Web: www.mtgibsoniron.com.au

Addendum: Resources/reserves
26
An updated resources and reserves
statement will be released in September
2012.
27
Attributions
The information in this report relating to Mineral Resources is based on information compiled by Rolf Forster, who is a
member of the Australasian Institute of Mining and Metallurgy. Rolf Forster is a consultant to Mount Gibson Mining Limited,
and has sufficient experience relevant to the styles of mineralisation and type of deposit under consideration and to the
activity he is undertaking, to qualify as a Competent Person as defined in the December 2004 Edition of the “Australasian
Code for Reporting of Exploration Results, Mineral Resources and Ore Reserves”. Rolf Forster has consented to the inclusion
of the matters in this report based on his information in the form and context in which it appears.
The information in this report relating to Mining Reserves is based on information compiled by Rolf Forster and Weifeng Li,
who are both members of the Australasian Institute of Mining and Metallurgy. Rolf Forster and Weifeng Li are consultants to
Mount Gibson Mining Limited, and have sufficient experience relevant to the styles of mineralisation and type of deposit
under consideration and to the activity which they are undertaking, to each qualify as a Competent Person as defined in the
December 2004 Edition of the “Australasian Code for Reporting of Exploration Results, Mineral Resources and Ore Reserves”.
Rolf Forster and Weifeng Li have consented to the inclusion of the matters in this report based on their information in the
form and context in which it appears.